JP7380654B2 - Evaluation device, evaluation system, evaluation method and its program - Google Patents
Evaluation device, evaluation system, evaluation method and its programDownload PDFInfo
- Publication number
- JP7380654B2 JP7380654B2JP2021117063AJP2021117063AJP7380654B2JP 7380654 B2JP7380654 B2JP 7380654B2JP 2021117063 AJP2021117063 AJP 2021117063AJP 2021117063 AJP2021117063 AJP 2021117063AJP 7380654 B2JP7380654 B2JP 7380654B2
- Authority
- JP
- Japan
- Prior art keywords
- measurement
- database
- evaluation
- storage device
- type
- Prior art date
- Legal status (The legal status is an assumption and is not a legal conclusion. Google has not performed a legal analysis and makes no representation as to the accuracy of the status listed.)
- Active
Links
- 238000011156evaluationMethods0.000titleclaimsdescription136
- 238000005259measurementMethods0.000claimsdescription241
- 238000003860storageMethods0.000claimsdescription175
- 230000006866deteriorationEffects0.000claimsdescription103
- 238000000034methodMethods0.000claimsdescription86
- 238000006243chemical reactionMethods0.000claimsdescription61
- 238000012545processingMethods0.000claimsdescription57
- 230000005611electricityEffects0.000claimsdescription51
- 238000010801machine learningMethods0.000claimsdescription45
- 238000007637random forest analysisMethods0.000claimsdescription27
- 230000005612types of electricityEffects0.000claimsdescription23
- 238000013450outlier detectionMethods0.000claimsdescription15
- 238000010586diagramMethods0.000description29
- 230000002159abnormal effectEffects0.000description23
- 230000008569processEffects0.000description22
- HBBGRARXTFLTSG-UHFFFAOYSA-NLithium ionChemical compound[Li+]HBBGRARXTFLTSG-UHFFFAOYSA-N0.000description19
- 229910001416lithium ionInorganic materials0.000description19
- 238000003745diagnosisMethods0.000description17
- 238000002847impedance measurementMethods0.000description11
- 238000007600chargingMethods0.000description9
- 239000002131composite materialSubstances0.000description9
- 230000008859changeEffects0.000description8
- 238000010276constructionMethods0.000description8
- 238000001514detection methodMethods0.000description8
- 238000013528artificial neural networkMethods0.000description6
- WHXSMMKQMYFTQS-UHFFFAOYSA-NLithiumChemical compound[Li]WHXSMMKQMYFTQS-UHFFFAOYSA-N0.000description5
- 150000002500ionsChemical class0.000description5
- 229910052744lithiumInorganic materials0.000description5
- 230000004044responseEffects0.000description5
- 238000002790cross-validationMethods0.000description4
- 238000012417linear regressionMethods0.000description4
- BQCADISMDOOEFD-UHFFFAOYSA-NSilverChemical compound[Ag]BQCADISMDOOEFD-UHFFFAOYSA-N0.000description3
- 239000003575carbonaceous materialSubstances0.000description3
- 230000015556catabolic processEffects0.000description3
- 238000006731degradation reactionMethods0.000description3
- 238000009826distributionMethods0.000description3
- 230000000694effectsEffects0.000description3
- 229910003480inorganic solidInorganic materials0.000description3
- 239000007773negative electrode materialSubstances0.000description3
- -1nickel metal hydrideChemical class0.000description3
- 239000007774positive electrode materialSubstances0.000description3
- 239000007784solid electrolyteSubstances0.000description3
- 238000012706support-vector machineMethods0.000description3
- 238000012546transferMethods0.000description3
- 230000006399behaviorEffects0.000description2
- 230000005540biological transmissionEffects0.000description2
- OJIJEKBXJYRIBZ-UHFFFAOYSA-Ncadmium nickelChemical compound[Ni].[Cd]OJIJEKBXJYRIBZ-UHFFFAOYSA-N0.000description2
- 239000003990capacitorSubstances0.000description2
- 150000004649carbonic acid derivativesChemical class0.000description2
- 238000004891communicationMethods0.000description2
- 229920001940conductive polymerPolymers0.000description2
- 238000010281constant-current constant-voltage chargingMethods0.000description2
- 230000007423decreaseEffects0.000description2
- 239000008151electrolyte solutionSubstances0.000description2
- 238000004146energy storageMethods0.000description2
- 238000002474experimental methodMethods0.000description2
- 239000011572manganeseSubstances0.000description2
- 229910052987metal hydrideInorganic materials0.000description2
- 239000000203mixtureSubstances0.000description2
- PXHVJJICTQNCMI-UHFFFAOYSA-NnickelSubstances[Ni]PXHVJJICTQNCMI-UHFFFAOYSA-N0.000description2
- 238000007639printingMethods0.000description2
- 150000003839saltsChemical class0.000description2
- 238000012549trainingMethods0.000description2
- 229910052723transition metalInorganic materials0.000description2
- ZZXUZKXVROWEIF-UHFFFAOYSA-N1,2-butylene carbonateChemical compoundCCC1COC(=O)O1ZZXUZKXVROWEIF-UHFFFAOYSA-N0.000description1
- VAYTZRYEBVHVLE-UHFFFAOYSA-N1,3-dioxol-2-oneChemical compoundO=C1OC=CO1VAYTZRYEBVHVLE-UHFFFAOYSA-N0.000description1
- SJMSHBHQMICGBL-UHFFFAOYSA-N2,2-dimethylpentan-3-yl hydrogen carbonateChemical compoundCCC(C(C)(C)C)OC(O)=OSJMSHBHQMICGBL-UHFFFAOYSA-N0.000description1
- OYOKPDLAMOMTEE-UHFFFAOYSA-N4-chloro-1,3-dioxolan-2-oneChemical compoundClC1COC(=O)O1OYOKPDLAMOMTEE-UHFFFAOYSA-N0.000description1
- 229920000049Carbon (fiber)Polymers0.000description1
- 229910018871CoO 2Inorganic materials0.000description1
- OIFBSDVPJOWBCH-UHFFFAOYSA-NDiethyl carbonateChemical compoundCCOC(=O)OCCOIFBSDVPJOWBCH-UHFFFAOYSA-N0.000description1
- KMTRUDSVKNLOMY-UHFFFAOYSA-NEthylene carbonateChemical compoundO=C1OCCO1KMTRUDSVKNLOMY-UHFFFAOYSA-N0.000description1
- 229910000733Li alloyInorganic materials0.000description1
- 229910013063LiBF 4Inorganic materials0.000description1
- 229910013870LiPF 6Inorganic materials0.000description1
- UCKMPCXJQFINFW-UHFFFAOYSA-NSulphideChemical compound[S-2]UCKMPCXJQFINFW-UHFFFAOYSA-N0.000description1
- KLARSDUHONHPRF-UHFFFAOYSA-N[Li].[Mn]Chemical compound[Li].[Mn]KLARSDUHONHPRF-UHFFFAOYSA-N0.000description1
- SOXUFMZTHZXOGC-UHFFFAOYSA-N[Li].[Mn].[Co].[Ni]Chemical compound[Li].[Mn].[Co].[Ni]SOXUFMZTHZXOGC-UHFFFAOYSA-N0.000description1
- 239000002253acidSubstances0.000description1
- 229910052783alkali metalInorganic materials0.000description1
- 229910001413alkali metal ionInorganic materials0.000description1
- 229910021383artificial graphiteInorganic materials0.000description1
- 239000011230binding agentSubstances0.000description1
- 238000004422calculation algorithmMethods0.000description1
- 239000004917carbon fiberSubstances0.000description1
- 150000005678chain carbonatesChemical class0.000description1
- 238000007635classification algorithmMethods0.000description1
- CKFRRHLHAJZIIN-UHFFFAOYSA-Ncobalt lithiumChemical compound[Li].[Co]CKFRRHLHAJZIIN-UHFFFAOYSA-N0.000description1
- 239000000571cokeSubstances0.000description1
- 238000010277constant-current chargingMethods0.000description1
- 150000005676cyclic carbonatesChemical class0.000description1
- 230000001351cycling effectEffects0.000description1
- 230000007547defectEffects0.000description1
- 230000002950deficientEffects0.000description1
- 238000009831deintercalationMethods0.000description1
- IEJIGPNLZYLLBP-UHFFFAOYSA-Ndimethyl carbonateChemical compoundCOC(=O)OCIEJIGPNLZYLLBP-UHFFFAOYSA-N0.000description1
- 150000004862dioxolanesChemical class0.000description1
- VUPKGFBOKBGHFZ-UHFFFAOYSA-Ndipropyl carbonateChemical compoundCCCOC(=O)OCCCVUPKGFBOKBGHFZ-UHFFFAOYSA-N0.000description1
- 238000007599dischargingMethods0.000description1
- 150000002148estersChemical class0.000description1
- 150000002170ethersChemical class0.000description1
- JBTWLSYIZRCDFO-UHFFFAOYSA-Nethyl methyl carbonateChemical compoundCCOC(=O)OCJBTWLSYIZRCDFO-UHFFFAOYSA-N0.000description1
- 150000002240furansChemical class0.000description1
- ROCSCYHXUBXLGH-UHFFFAOYSA-Nhexan-3-yl hydrogen carbonateChemical compoundCCCC(CC)OC(O)=OROCSCYHXUBXLGH-UHFFFAOYSA-N0.000description1
- 229910052739hydrogenInorganic materials0.000description1
- 239000001257hydrogenSubstances0.000description1
- 150000002484inorganic compoundsChemical class0.000description1
- 229910010272inorganic materialInorganic materials0.000description1
- 238000009830intercalationMethods0.000description1
- 239000004973liquid crystal related substanceSubstances0.000description1
- 239000001989lithium alloySubstances0.000description1
- RSNHXDVSISOZOB-UHFFFAOYSA-Nlithium nickelChemical compound[Li].[Ni]RSNHXDVSISOZOB-UHFFFAOYSA-N0.000description1
- 229910003002lithium saltInorganic materials0.000description1
- 159000000002lithium saltsChemical class0.000description1
- SWAIALBIBWIKKQ-UHFFFAOYSA-Nlithium titaniumChemical compound[Li].[Ti]SWAIALBIBWIKKQ-UHFFFAOYSA-N0.000description1
- DMEJJWCBIYKVSB-UHFFFAOYSA-Nlithium vanadiumChemical compound[Li].[V]DMEJJWCBIYKVSB-UHFFFAOYSA-N0.000description1
- 230000007774longtermEffects0.000description1
- 238000004519manufacturing processMethods0.000description1
- 239000000463materialSubstances0.000description1
- 229910021382natural graphiteInorganic materials0.000description1
- 229910052759nickelInorganic materials0.000description1
- 150000002825nitrilesChemical class0.000description1
- 229920000620organic polymerPolymers0.000description1
- 239000005518polymer electrolyteSubstances0.000description1
- 239000000843powderSubstances0.000description1
- RUOJZAUFBMNUDX-UHFFFAOYSA-Npropylene carbonateChemical compoundCC1COC(=O)O1RUOJZAUFBMNUDX-UHFFFAOYSA-N0.000description1
- 239000002296pyrolytic carbonSubstances0.000description1
- 238000004064recyclingMethods0.000description1
- 238000000611regression analysisMethods0.000description1
- 238000011160researchMethods0.000description1
- 230000035945sensitivityEffects0.000description1
- 229910052708sodiumInorganic materials0.000description1
- 239000011734sodiumSubstances0.000description1
- 239000007787solidSubstances0.000description1
- 239000002904solventSubstances0.000description1
- HXJUTPCZVOIRIF-UHFFFAOYSA-NsulfolaneChemical classO=S1(=O)CCCC1HXJUTPCZVOIRIF-UHFFFAOYSA-N0.000description1
- 238000012360testing methodMethods0.000description1
- 150000003606tin compoundsChemical class0.000description1
Images


Classifications
- G—PHYSICS
- G01—MEASURING; TESTING
- G01R—MEASURING ELECTRIC VARIABLES; MEASURING MAGNETIC VARIABLES
- G01R31/00—Arrangements for testing electric properties; Arrangements for locating electric faults; Arrangements for electrical testing characterised by what is being tested not provided for elsewhere
- G01R31/36—Arrangements for testing, measuring or monitoring the electrical condition of accumulators or electric batteries, e.g. capacity or state of charge [SoC]
- G01R31/392—Determining battery ageing or deterioration, e.g. state of health
- G—PHYSICS
- G01—MEASURING; TESTING
- G01R—MEASURING ELECTRIC VARIABLES; MEASURING MAGNETIC VARIABLES
- G01R31/00—Arrangements for testing electric properties; Arrangements for locating electric faults; Arrangements for electrical testing characterised by what is being tested not provided for elsewhere
- G01R31/36—Arrangements for testing, measuring or monitoring the electrical condition of accumulators or electric batteries, e.g. capacity or state of charge [SoC]
- G01R31/367—Software therefor, e.g. for battery testing using modelling or look-up tables
- G—PHYSICS
- G01—MEASURING; TESTING
- G01R—MEASURING ELECTRIC VARIABLES; MEASURING MAGNETIC VARIABLES
- G01R31/00—Arrangements for testing electric properties; Arrangements for locating electric faults; Arrangements for electrical testing characterised by what is being tested not provided for elsewhere
- G01R31/36—Arrangements for testing, measuring or monitoring the electrical condition of accumulators or electric batteries, e.g. capacity or state of charge [SoC]
- G01R31/382—Arrangements for monitoring battery or accumulator variables, e.g. SoC
- G01R31/3842—Arrangements for monitoring battery or accumulator variables, e.g. SoC combining voltage and current measurements
- G—PHYSICS
- G01—MEASURING; TESTING
- G01R—MEASURING ELECTRIC VARIABLES; MEASURING MAGNETIC VARIABLES
- G01R31/00—Arrangements for testing electric properties; Arrangements for locating electric faults; Arrangements for electrical testing characterised by what is being tested not provided for elsewhere
- G01R31/36—Arrangements for testing, measuring or monitoring the electrical condition of accumulators or electric batteries, e.g. capacity or state of charge [SoC]
- G01R31/385—Arrangements for measuring battery or accumulator variables
- G01R31/387—Determining ampere-hour charge capacity or SoC
- G—PHYSICS
- G01—MEASURING; TESTING
- G01R—MEASURING ELECTRIC VARIABLES; MEASURING MAGNETIC VARIABLES
- G01R31/00—Arrangements for testing electric properties; Arrangements for locating electric faults; Arrangements for electrical testing characterised by what is being tested not provided for elsewhere
- G01R31/36—Arrangements for testing, measuring or monitoring the electrical condition of accumulators or electric batteries, e.g. capacity or state of charge [SoC]
- G01R31/389—Measuring internal impedance, internal conductance or related variables
- H—ELECTRICITY
- H01—ELECTRIC ELEMENTS
- H01M—PROCESSES OR MEANS, e.g. BATTERIES, FOR THE DIRECT CONVERSION OF CHEMICAL ENERGY INTO ELECTRICAL ENERGY
- H01M10/00—Secondary cells; Manufacture thereof
- H01M10/42—Methods or arrangements for servicing or maintenance of secondary cells or secondary half-cells
- H01M10/48—Accumulators combined with arrangements for measuring, testing or indicating the condition of cells, e.g. the level or density of the electrolyte
- Y—GENERAL TAGGING OF NEW TECHNOLOGICAL DEVELOPMENTS; GENERAL TAGGING OF CROSS-SECTIONAL TECHNOLOGIES SPANNING OVER SEVERAL SECTIONS OF THE IPC; TECHNICAL SUBJECTS COVERED BY FORMER USPC CROSS-REFERENCE ART COLLECTIONS [XRACs] AND DIGESTS
- Y02—TECHNOLOGIES OR APPLICATIONS FOR MITIGATION OR ADAPTATION AGAINST CLIMATE CHANGE
- Y02E—REDUCTION OF GREENHOUSE GAS [GHG] EMISSIONS, RELATED TO ENERGY GENERATION, TRANSMISSION OR DISTRIBUTION
- Y02E60/00—Enabling technologies; Technologies with a potential or indirect contribution to GHG emissions mitigation
- Y02E60/10—Energy storage using batteries
Landscapes
- Physics & Mathematics (AREA)
- General Physics & Mathematics (AREA)
- Engineering & Computer Science (AREA)
- Manufacturing & Machinery (AREA)
- Chemical & Material Sciences (AREA)
- Chemical Kinetics & Catalysis (AREA)
- Electrochemistry (AREA)
- General Chemical & Material Sciences (AREA)
- Tests Of Electric Status Of Batteries (AREA)
- Secondary Cells (AREA)
Description
Translated fromJapanese本明細書では評価装置、評価システム、評価方法及びそのプログラムを開示する。 This specification discloses an evaluation device, an evaluation system, an evaluation method, and a program thereof.
従来、蓄電デバイスの評価方法としては、例えば、交流インピーダンス法とパターン分類アルゴリズムを用いた機械学習によるリチウムイオン二次電池の劣化診断方法が提案されている(例えば、特許文献1参照)。この評価方法では、リチウムイオン電池等の劣化判定を高速に行うことができるとしている。また、蓄電デバイスの容量劣化の推定方法としては、交流インピーダンスの測定結果で重回帰分析による容量劣化診断を行う方法が提案されている(例えば、特許文献2参照)。また、蓄電デバイスの評価方法としては、リチウムイオン電池、ニッケル・カドミウム電池およびニッケル水素電池の種別を検出し、それぞれの充電制御方式の充電時間、例えば、リチウムイオン電池は定電流充電(CC)時間で容量劣化を推定するものが提案されている(例えば、特許文献3参照)。また、蓄電デバイスの評価方法としては、電圧と電流の測定値から等価回路により解析し、その値を基に鉛電池、ニッケル水素電池、リチウムイオン電池、ニッケル・カドミウム電池のいずれかであることを特定するものが提案されている(例えば、特許文献4参照)。この方法では、手法はニューラルネットワーク、サポートベクターマシンを推奨している。 Conventionally, as a method for evaluating power storage devices, a method for diagnosing deterioration of lithium ion secondary batteries using machine learning using an AC impedance method and a pattern classification algorithm has been proposed (for example, see Patent Document 1). This evaluation method is said to be able to quickly determine the deterioration of lithium ion batteries and the like. Furthermore, as a method for estimating capacity deterioration of an electricity storage device, a method has been proposed in which capacity deterioration is diagnosed by multiple regression analysis using AC impedance measurement results (see, for example, Patent Document 2). In addition, as an evaluation method for power storage devices, the type of lithium-ion battery, nickel-cadmium battery, and nickel-hydrogen battery is detected, and the charging time of each charging control method is determined.For example, for lithium-ion batteries, the constant current charging (CC) time is determined. A method for estimating capacity deterioration has been proposed (for example, see Patent Document 3). In addition, the evaluation method for electricity storage devices is to analyze the measured values of voltage and current using an equivalent circuit, and based on those values, determine whether it is a lead battery, nickel metal hydride battery, lithium ion battery, or nickel cadmium battery. A method for specifying the information has been proposed (see, for example, Patent Document 4). In this method, the techniques recommended are neural networks and support vector machines.
また、蓄電デバイスの評価方法としては、電池サイクリング機器を使用して訓練データセット(電圧、電流、温度、内部抵抗など)を収集し、機械学習により電池セル動作特性を予測するものが提案されている(例えば、特許文献5参照)。また、蓄電デバイスの評価方法としては、定電流(CC)充電を行い、Vcに達したら定電圧(CV)充電に切り替え、その時点から時間tだけ経過した充電電流値Itを用いて容量を推定する方法が提案されている(例えば、特許文献6参照)。また、蓄電デバイスの評価方法としては、放電時の磁場を測定して容量劣化を評価する方法が提案されている(例えば、特許文献7参照)。また、蓄電デバイスの評価方法としては、ひずみゲージにより体積変化を感知し、容量劣化がない領域でも電池の膨張による劣化を推定できるものが提案されている(例えば、特許文献8参照)。また、蓄電デバイスの評価方法としては、正負のパルス電流を印加し、正負それぞれの電圧値の関係から抵抗劣化を推定するものが提案されている(例えば、特許文献9参照)。また、蓄電デバイスの評価方法としては、温度、電流、電圧から内部抵抗と残容量(State Of Charge:SOC)を算出し、それらにより劣化評価を行うものが提案されている(例えば、特許文献10参照)。 In addition, as a method for evaluating energy storage devices, a method has been proposed that uses battery cycling equipment to collect training data sets (voltage, current, temperature, internal resistance, etc.) and uses machine learning to predict battery cell operating characteristics. (For example, see Patent Document 5). In addition, as a method for evaluating electricity storage devices, constant current (CC) charging is performed, and when Vc is reached, switching to constant voltage (CV) charging is performed, and the capacity is estimated using the charging current value It after a time t has elapsed from that point. A method has been proposed (for example, see Patent Document 6). Furthermore, as a method for evaluating power storage devices, a method has been proposed in which capacity deterioration is evaluated by measuring the magnetic field during discharge (see, for example, Patent Document 7). Furthermore, as a method for evaluating power storage devices, a method has been proposed in which volume changes are sensed using a strain gauge and deterioration due to expansion of the battery can be estimated even in a region where there is no capacity deterioration (see, for example, Patent Document 8). Furthermore, as a method for evaluating power storage devices, a method has been proposed in which positive and negative pulse currents are applied and resistance deterioration is estimated from the relationship between positive and negative voltage values (for example, see Patent Document 9). Furthermore, as an evaluation method for power storage devices, a method has been proposed in which internal resistance and remaining capacity (State of Charge: SOC) are calculated from temperature, current, and voltage, and deterioration is evaluated based on these (for example,
しかしながら、上述の特許文献1、2では、交流インピーダンス法と機械学習の組み合わせで電池の劣化診断を行っているが、参照するデータベースが十分なデータ量を有しなければ予測精度が上がらず、十分な参照データベースを用意する必要があった。また、特許文献3~8においても、参照するデータベースのデータ量が十分でないと予測精度が上がらないため、十分な参照データベースを用意する必要があった。特に、複数の種別の電池の劣化診断を行う場合、電池種の同定およびその劣化診断を行うために、十分な各電池種の参照データベースを用意する必要があった。 However, in the above-mentioned Patent Documents 1 and 2, battery deterioration diagnosis is performed using a combination of AC impedance method and machine learning, but if the reference database does not have a sufficient amount of data, the prediction accuracy will not improve and the It was necessary to prepare a reference database. Further, in Patent Documents 3 to 8 as well, it was necessary to prepare a sufficient reference database because prediction accuracy cannot be improved unless the amount of data in the reference database is sufficient. In particular, when diagnosing the deterioration of a plurality of types of batteries, it is necessary to prepare a sufficient reference database for each battery type in order to identify the battery type and diagnose its deterioration.
本開示は、このような課題に鑑みなされたものであり、より効率よく、精度をより向上して蓄電デバイスを評価することができる新規な評価装置、評価システム、評価方法及びそのプログラムを提供することを主目的とする。 The present disclosure has been made in view of such issues, and provides a novel evaluation device, evaluation system, evaluation method, and program therefor that can evaluate power storage devices more efficiently and with improved accuracy. The main purpose is to
上述した目的を達成するために鋭意研究したところ、本発明者らは、データ点数の少ない種別のデータベースに対して、種別の異なるデータベースを機械学習を用いて転用するものとすれば、データ測定などをより低減するなど効率をより高め、且つ精度をより向上して蓄電デバイスを評価することができることを見いだし、本明細書で開示する発明を完成するに至った。 After intensive research to achieve the above-mentioned purpose, the present inventors found that if a database of a different type is to be repurposed using machine learning for a database of a type with a small number of data points, data measurement etc. The present inventors have discovered that it is possible to evaluate electricity storage devices by further increasing efficiency, such as by further reducing , and by further improving accuracy, and have completed the invention disclosed in this specification.
即ち、本明細書で開示する評価装置は、
複数の種別を含む蓄電デバイスの評価を実行する評価装置であって、
第1種別の蓄電デバイスの測定因子をデータとして含む第1データベースと、前記第1種別とは異なる第2種別の蓄電デバイスの測定因子をデータとして含む第2データベースと、蓄電デバイスの測定因子を用い機械学習によりデータを変換する変換モデルと、を有し、前記変換モデルを用いて前記第1データベースのデータを前記第2データベースのデータへ変換して前記第2データベースのデータ点数を増加した変換後データベースを取得し、該変換後データベースを用いて前記第2種別の蓄電デバイスに関する評価を実行する制御部、を備えたものである。That is, the evaluation device disclosed in this specification,
An evaluation device that performs evaluation of power storage devices including multiple types,
A first database containing measurement factors of a first type of electricity storage device as data, a second database containing measurement factors of a second type of electricity storage device different from the first type as data, and a measurement factor of the electricity storage device. a conversion model that converts data by machine learning, and after conversion, the data of the first database is converted to the data of the second database using the conversion model, and the number of data points of the second database is increased. A control unit that acquires a database and executes an evaluation regarding the second type of power storage device using the converted database.
本明細書で開示する評価システムは、
蓄電デバイスの測定因子の測定結果を得る測定装置と、
上述した評価装置と、を備え、
前記制御部は、前記測定装置から前記蓄電デバイスの測定結果を取得するものである。The evaluation system disclosed herein is
A measuring device that obtains a measurement result of a measurement factor of an electricity storage device;
comprising the above-mentioned evaluation device,
The control unit acquires a measurement result of the electricity storage device from the measurement device.
本明細書で開示する評価方法は、
複数の種別を含む蓄電デバイスの評価を実行する評価方法であって、
第1種別の蓄電デバイスの測定因子をデータとして含む第1データベースと、前記第1種別とは異なる第2種別の蓄電デバイスの測定因子をデータとして含む第2データベースと、蓄電デバイスの測定因子を用い機械学習によりデータを変換する変換モデルと、を有し、前記変換モデルを用いて前記第1データベースのデータを前記第2データベースのデータへ変換して前記第2データベースのデータ点数を増加した変換後データベースを取得する変換ステップと、
前記変換後データベースを用いて前記第2種別の蓄電デバイスに関する評価を実行する評価ステップと、
を含むものである。The evaluation method disclosed herein is
An evaluation method for evaluating power storage devices including multiple types, the method comprising:
A first database containing measurement factors of a first type of electricity storage device as data, a second database containing measurement factors of a second type of electricity storage device different from the first type as data, and a measurement factor of the electricity storage device. a conversion model that converts data by machine learning, and after conversion, the data of the first database is converted to the data of the second database using the conversion model, and the number of data points of the second database is increased. a conversion step to obtain a database;
an evaluation step of performing an evaluation regarding the second type of electricity storage device using the converted database;
This includes:
本明細書で開示するプログラムは、上述した評価方法の各ステップを1又は複数のコンピュータに実現させるものである。このプログラムはコンピュータが読み取り可能な記録媒体(例えばハードディスク、ROM、FD、CD、DVDなど)に記録されていてもよいし、伝送媒体(インターネットやLANなどの通信網)を介してあるコンピュータから別のコンピュータへ配信されてもよいし、その他どのような形で授受されてもよい。 The program disclosed in this specification causes one or more computers to implement each step of the evaluation method described above. This program may be recorded on a computer-readable recording medium (for example, a hard disk, ROM, FD, CD, DVD, etc.), or may be transmitted from a computer to a computer via a transmission medium (communication network such as the Internet or LAN). The information may be distributed to other computers, or may be sent and received in any other format.
本開示の評価装置、評価システム、評価方法及びそのプログラムでは、より効率よく、精度をより向上して蓄電デバイスを評価することができる。本開示がこのような効果を奏する理由は、以下のように推察される。例えば、蓄電デバイスの性能を精度よく推定するためには、蓄電デバイスの測定データなど、測定因子を充実させることが求められる。本開示では、既に準備してあるデータベースを、データ点数が不十分なデータベースに機械学習を用いて転用することにより、データベースを拡充するものとする。このため、充実したデータベースを用意することなく、蓄電デバイスの劣化診断のための異常値検出や、種別の判定、更に、蓄電江波イスの容量や抵抗の推定などを精度よく実行可能になる。その結果、例えば、蓄電デバイスの劣化診断なども高精度化できる。したがって、本開示では、より効率よく、精度をより向上して蓄電デバイスを評価することができる。ここで、「種別」には、例えば、鉛蓄電池や、ニッケル水素電池、リチウムイオン二次電池など、蓄電デバイス自体の種別に加え、同一の蓄電デバイス種別での製品種別も含むものとする。また、「製品種別」には、同一の蓄電デバイス種別(例えば、リチウムイオン二次電池)において、異なる種別(A社のブランドa及びブランドbや、A社製品及びB社製品など)を含むものとする。 With the evaluation device, evaluation system, evaluation method, and program thereof according to the present disclosure, power storage devices can be evaluated more efficiently and with improved accuracy. The reason why the present disclosure has such effects is inferred as follows. For example, in order to accurately estimate the performance of a power storage device, it is necessary to enrich measurement factors such as measurement data of the power storage device. In the present disclosure, the database is expanded by using machine learning to repurpose an already prepared database into a database with an insufficient number of data points. Therefore, it becomes possible to accurately detect abnormal values for diagnosing deterioration of power storage devices, determine types, and estimate the capacity and resistance of power storage Eba chairs without preparing an extensive database. As a result, for example, deterioration diagnosis of power storage devices can be performed with high precision. Therefore, in the present disclosure, it is possible to evaluate an electricity storage device more efficiently and with improved accuracy. Here, the "type" includes, for example, the type of the power storage device itself, such as a lead-acid battery, a nickel-metal hydride battery, a lithium ion secondary battery, and the like, as well as product types of the same power storage device type. In addition, "product type" shall include different types (such as brand a and brand b of company A, products of company A and products of company B, etc.) within the same electricity storage device type (for example, lithium ion secondary battery). .
(評価装置)
本明細書で開示する評価装置の実施形態を図面を参照しながら以下に説明する。図1は、評価システム10の一例を示す概略説明図である。評価システム10は、例えば、使用済みの蓄電デバイス13を回収する回収施設などに備えられており、蓄電デバイス13の劣化度などの特性を評価するシステムである。この評価システム10は、回収した蓄電デバイス13の劣化度を推定して、リユース可能かリサイクルすべきかについての判定を行う。リユース可能な蓄電デバイス13は、再調整されて出荷され、リサイクルすべき蓄電デバイス13はリサイクルされる。この評価システム10は、測定装置15と、評価装置20とを備えている。評価システム10は、LANやインターネットなどを含むネットワーク12を介して測定装置15と評価装置20との間で情報をやりとりする。(Evaluation device)
Embodiments of the evaluation device disclosed in this specification will be described below with reference to the drawings. FIG. 1 is a schematic explanatory diagram showing an example of an
蓄電デバイス13は、例えば、ハイブリッドキャパシタ、疑似電気二重層キャパシタ、リチウムやナトリウムのアルカリ金属二次電池、アルカリ金属イオン電池、空気電池などが挙げられる。このうち、蓄電デバイス13としては、リチウム二次電池、特にリチウムイオン二次電池が好ましい。ここでは、蓄電デバイス13がリチウムイオン二次電池であるものとして主として説明する。蓄電デバイス13は、例えば、正極と、負極と、正極及び負極の間に介在しキャリアイオンを伝導するイオン伝導媒体と、を備えるものとしてもよい。正極は、正極活物質として、遷移金属元素を含む硫化物や、リチウムと遷移金属元素とを含む酸化物などを含むものとしてもよい。正極活物質は、例えば、基本組成式をLi(1-x)MnO2(0<x<1など、以下同じ)やLi(1-x)Mn2O4などとするリチウムマンガン複合酸化物、基本組成式をLi(1-x)CoO2などとするリチウムコバルト複合酸化物、基本組成式をLi(1-x)NiO2などとするリチウムニッケル複合酸化物、基本組成式をLi(1-x)NiaCobMncO2(a+b+c=1)などとするリチウムニッケルコバルトマンガン複合酸化物などを用いることができる。なお、「基本組成式」とは、他の元素を含んでもよい趣旨である。負極は、負極活物質として炭素材料やリチウムを含む複合酸化物などを含むものとしてもよい。負極活物質は、例えば、リチウム、リチウム合金、スズ化合物などの無機化合物、リチウムイオンを吸蔵放出可能な炭素材料、複数の元素を含む複合酸化物、導電性ポリマーなどが挙げられる。炭素材料としては、例えば、コークス類、ガラス状炭素類、グラファイト類、難黒鉛化性炭素類、熱分解炭素類、炭素繊維などが挙げられる。このうち、人造黒鉛、天然黒鉛などのグラファイト類が好ましい。複合酸化物としては、例えば、リチウムチタン複合酸化物やリチウムバナジウム複合酸化物などが挙げられる。イオン伝導媒体は、例えば、支持塩を溶解した電解液とすることができる。支持塩としては、例えば、LiPF6やLiBF4、などのリチウム塩が挙げられる。電解液の溶媒は、例えば、カーボネート類、エステル類、エーテル類、ニトリル類、フラン類、スルホラン類及びジオキソラン類などが挙げられ、これらを単独又は混合して用いることができる。具体的には、カーボネート類としてエチレンカーボネートやプロピレンカーボネート、ビニレンカーボネート、ブチレンカーボネート、クロロエチレンカーボネートなどの環状カーボネート類や、ジメチルカーボネート、エチルメチルカーボネート、ジエチルカーボネート、エチル-n-ブチルカーボネート、メチル-t-ブチルカーボネート、ジ-i-プロピルカーボネート、t-ブチル-i-プロピルカーボネートなどの鎖状カーボネート類等が挙げられる。また、イオン伝導媒体は、固体のイオン伝導性ポリマーや、無機固体電解質あるいは有機ポリマー電解質と無機固体電解質の混合材料、若しくは有機バインダーによって結着された無機固体粉末などを利用することができる。固体電解質やこの蓄電デバイス13は、正極と負極との間にセパレータを配置してもよい。Examples of the
測定装置15は、蓄電デバイス13の測定因子の測定結果を得る装置である。測定因子は、蓄電デバイスの特性に関するものとすることができ、例えば、交流インピーダンスの実部Z’や虚部Z”、その測定温度T、開放電圧V、時間t経過後の充電電流値It、放電時の磁場、セルの体積変化、正負のパルス電流を印加したときの電圧値、内部抵抗と残容量SOCなどが挙げられる。この測定装置15は、測定因子として、交流インピーダンスを直接又は間接的に測定し、測定温度Tでのインピーダンスの実部Z’と虚部Z”とを求める装置とする。また、測定装置15は、蓄電デバイス13の開放電圧V(V)を測定可能とする。この測定装置15は、処理対象14としての蓄電デバイス13を測定温度Tに調節して収容する恒温槽16と、処理対象14に電気的に接続し交流電流を印加する交流インピーダンスアナライザ17とを備える。また、測定装置15は、交流インピーダンスを直接求めるものとしてもよいが、例えば、電流ステップ法や電圧ステップ法、電流パルス法などによって交流インピーダンスを間接的に求めるものとしてもよい。電流ステップ法では、所定の電流(例えば、0.1Cなど)、所定時間(例えば0.01sなど)、印加したときの電圧の振る舞いを測定し、このときの電流と電圧を用いて、ラプラス変換により所定の周波数(例えば、100Hz)における実部Z’や虚部Z”を求めることができる。測定装置15はネットワーク12を介して測定結果を評価装置20へ出力する。 The measuring
評価装置20は、劣化度が既知である蓄電デバイスを測定した結果から得られた特性推定モデル34を利用し、劣化度が不明の処理対象14を測定した結果からこの処理対象14の劣化度を推定する劣化度推定処理を行う装置である。また、評価装置20は、種別が既知である蓄電デバイスを測定した結果から得られた種別推定モデル33を利用し、種別が不明の処理対象14を測定した結果からこの処理対象14の種別を推定する種別推定処理を行う装置である。また、評価装置20は、上記推定処理を行う際に用いられるデータベースにおいて、測定因子のデータ点数が少ないデータベースに対し、データ点数の多いデータベースのデータを変換モデルを用いて機械学習によって増加させる処理を行う。ここで、「種別」には、正極活物質や負極活物質の違いなど蓄電デバイス自体のカテゴリが相違する種別のほか、同一カテゴリ(例えば「リチウムイオン二次電池」など)における製造会社や型番の違いなどを含む製品種別も含まれる。また、評価装置20は、処理対象14の測定結果を用い、所定の外れ値検出手法を用いてこの測定結果が外れ値であるときには、その旨出力する外れ値出力処理を実行する。なお、評価装置20は、劣化推定処理、種別推定処理及び外れ値出力処理において、同じ測定因子を用いてもよいし、それぞれ異なる測定因子を用いてもよいが、同じ測定因子を用いることが効率よく好ましい。評価装置20は、制御部21と、記憶部22と、入力装置18と、表示装置19と、を備える。入力装置18は、各種入力を行うマウスやキーボードなどを含む。表示装置19は、画面を表示するものであり、例えば液晶ディスプレイである。 The
制御部21は、CPUを中心とするマイクロプロセッサとして構成されており、装置全体を制御する。また、制御部21には、機能ブロックとして、測定装置15から測定結果を取得する取得部と、取得した測定結果と種別推定モデル33とから蓄電デバイス13の種別を推定する種別推定部と、測定結果から許容範囲31を用いて外れ値を検出する検出部と、測定結果と特性推定モデル34とから容量及び/又は抵抗を導出して劣化度を推定する劣化推定部と、推定した劣化度から処理対象14である蓄電デバイス13のリユースの可否を判定する判定部と、を有する。この機能ブロックは、制御部21が外れ値検出プログラム35、種別推定プログラム36及び劣化判定プログラム37を実行することによって実現される。 The
記憶部22は、例えば、HDDなど、大容量の記憶装置として構成されており第1データベース23や、第2データベース28、変換後データベース29、機械学習プログラム30、許容範囲31、変換モデル32、種別推定モデル33、特性推定モデル34、外れ値検出プログラム35、種別推定プログラム36、劣化判定プログラム37などが記憶されている。第1データベース23は、特定の製品種別である第1種別の劣化度が既知である蓄電デバイス13の測定結果である測定因子をデータとして含む。この第1データベース23は、種別推定モデル33や特性推定モデル34を構築するために用いられるものとしてもよい。この第1データベース23には、測定結果としてインピーダンス24、開放電圧25、測定温度26、劣化度27などが含まれる。インピーダンス24には、実部Z’や虚部Z”が含まれる。劣化度27は、蓄電デバイス13が劣化した度合いを示すものであり、例えば、容量や抵抗などの値を用いて導出することができる。劣化度27は、例えば、初期の最大放電容量を100%とした場合において、連続又は断続的に使用されたあと、劣化により低減した最大放電容量の割合として定義することができる。あるいは、劣化度27は、例えば、初期の抵抗を100%とした場合において、連続又は断続的に使用されたあと、劣化により増加した抵抗の割合として定義することができる。 The
第2データベース28は、例えば、第1データベース23の第1種別とは異なる第2種別の蓄電デバイス13における測定結果の測定因子をデータとして含む。この第2データベース28は、例えば、新規製品種別など、第1データベース23に比してデータ点数が少ないデータ点を含むものとしてもよい。また、第2データベース28は、後述する変換処理により変換後データベースに更新される。変換後データベースは、第2データベース28と同じ製品種別の蓄電デバイス13に対応付けられ、第1データベース23を用いて機械学習によってデータ点数を増加して作成されたものである。ここで、第1データベース23は、第2データベース28よりも多いデータ点数を有するものとしてもよい。第1データベース23は、該当する種別の蓄電デバイス13がより以前からあり、所定の期間を経て蓄積されてより多いデータ点数を含むものとしてもよい。例えば、第1データベース23は、第2データベース28に対して5倍以上、より好ましくは10倍以上、更に好ましくは50倍以上、あるいは100倍以上のデータ点数を含むものとしてもよい。データを拡充するのに用いられる第1データベース23は、データ点数がより多いことが好ましく、例えば、1000点以上、3000点以上、5000点以上、あるいは10000点以上などが好ましい。一方、データが拡充される第2データベース28は、データ点数がより少ないことが測定に要する手間及び時間の観点からは好ましく、例えば、1000点以下、500点以下、300点以下、あるいは100点以下などが好ましい。なお、記憶部22には、第1データベース23と第2データベース28とが記憶されているものとしたが、第3種別の蓄電デバイス13の第3データベースや、第4種別の蓄電デバイス13の第4データベースなど、その他のデータベースを記憶するものとしてもよい。なお、ここでは第1データベース23や第2データベース28を「データベース」と総称する。 The
機械学習プログラム30は、制御部21により実行され、第1データベース23や第2データベース28から機械学習を利用して変換モデル32や種別推定モデル33、特性推定モデル34を構築するプログラムである。例えば、機械学習には、統計分析ソフトRやPython(登録商標)、SQL、Excel(登録商標)などを用いることができ、手法として、線形回帰、カーネルリッジ、サポートベクター、XGBoost、ニューラルネットワーク(nnet)及びランダムフォレスト(RF)のうち1以上を用いることができる。機械学習の手法としては、ランダムフォレストが、評価値の精度がより高く、好ましい。 The
許容範囲31は、例えば、蓄電デバイスの測定因子を用い所定の外れ値検出手法に基づいて構築された閾値である。測定因子としては、第1データベース23や第2データベース28のインピーダンス24の実部Z’とその測定温度T、この蓄電デバイス13の開放電圧Vなどが挙げられ、更にインピーダンス24の虚部Z”などを含んでもよい。外れ値検出手法としては、例えば、LOF(Local outlier factor)や、ホテリング理論、K近傍法、1クラスサポートベクターマシーンなどが挙げられ、このうち、LOFが好ましい。 The
変換モデル32は、蓄電デバイス13の測定因子を用い機械学習によりデータを変換するものであり、データ点数の少ないデータベースを他のデータベースのデータで拡充する変換処理を行うモデルである。変換モデル32は、第1データベース23や第2データベース28などのインピーダンス24の実部Z’に少なくとも基づいて構築されているものとしてもよい。また、変換モデル32は、インピーダンス24と、その測定温度T、この蓄電デバイス13の開放電圧Vとに少なくとも基づいて構築されている。この変換モデル32は、更に、インピーダンスの虚部Z”に基づいて構築されることがより好ましい。特に、変換モデル32は、インピーダンス24の実部Z’と虚部Z”と、インピーダンス24の測定温度Tと、蓄電デバイス13の開放電圧Vとに基づいて構築されていることが最も好ましい。 The
種別推定モデル33は、蓄電デバイス13の種別を推定するモデルである。この種別推定モデル33は、既知の蓄電デバイス13の種別における第1データベース23のインピーダンス24の実部Z’とその測定温度T、この蓄電デバイス13の開放電圧Vとに少なくとも基づいて構築されているものとしてもよい。この種別推定モデル33は、更に、インピーダンスの虚部Z”に基づいて構築されることがより好ましい。特に、種別推定モデル33は、インピーダンス24の実部Z’と虚部Z”と、インピーダンス24の測定温度Tと、蓄電デバイス13の開放電圧Vとに基づいて構築されていることが最も好ましい。
特性推定モデル34は、蓄電デバイス13の種別ごとに構築され、この蓄電デバイス13の特性(例えば、容量や抵抗)を導出し、得られた特性から劣化度を導出する推定モデルである。特性推定モデル34は、第1データベース23のインピーダンス24の実部Z’とその測定温度T、この蓄電デバイス13の開放電圧Vとに少なくとも基づいて構築されているものとしてもよい。この特性推定モデル34は、更に、劣化度が既知である蓄電デバイス13のインピーダンスの虚部Z”に基づいて構築されることがより好ましい。特に、特性推定モデル34は、インピーダンス24の実部Z’と虚部Z”と、インピーダンス24の測定温度Tと、蓄電デバイス13の開放電圧Vとに基づいて構築されていることが最も好ましい。 The
この変換モデル32や種別推定モデル33、特性推定モデル34は、10-2Hz以上104Hz未満の範囲のインピーダンスに基づいて構築されることが好ましく、10-1Hz以上103Hz以下の範囲のインピーダンスに基づいて構築されることがより好ましい。また、測定温度Tは、例えば、-30℃以上としてもよいし、-20℃以上としてもよいし、-10℃以上としてもよい。また、測定温度Tは、例えば、60℃以下としてもよいし、50℃以下としてもよいし、40℃以下としてもよい。この測定温度Tは、-20℃以上50℃以下の範囲が好ましい。インピーダンスの測定温度Tは、蓄電デバイス13の使用環境などに基づいて適宜設定すればよい。The
外れ値検出プログラム35は、制御部21によって実行され、測定装置15で得られた測定因子の測定結果のうち、許容範囲31を用いて外れ値を検出するプログラムである。この外れ値検出プログラム35は、例えば、測定装置15から取得した少なくとも、処理対象である蓄電デバイス13のインピーダンスの実部Z’と、その測定温度Tと、開放電圧Vとを用いて、外れ値検出手法により評価値を導出するものとしてもよい。外れ値検出プログラム35は、更に、インピーダンスの虚部Z”をも取得し、評価値を導出してもよい。また、外れ値検出プログラム35は、10-2Hz以上104Hz未満の範囲、より好ましくは、10-1Hz以上103Hz未満の範囲の処理対象14のインピーダンスを取得するものとしてもよい。外れ値検出プログラム35は、例えば、評価値を導出するインピーダンスの測定点が10以下の範囲としてもよい。このインピーダンスの測定点は、3点以上がより好ましく、4点以上であることがより好ましい。また、この測定点は、8点以下であることがより好ましく、6点以下としてもよい。この測定点は、3点以上10以下の範囲では、外れ値の検出精度をより高めることができ好ましい。また、外れ値検出プログラム35は、下端範囲として10-2Hz以上100Hz以下の範囲で1点、上端範囲として102Hzを超え104Hz未満の範囲で1点、中間範囲として100Hz以上102Hz以下の範囲で1点を少なくとも含む測定点でのインピーダンスを取得することが好ましい。下端範囲と上端範囲で少なくとも1点の測定点を含むことが、外れ値の検出精度をより高めることができ好ましい。また、この下端範囲は、10-1Hz以上100Hz未満の範囲であることがより好ましい。低周波数帯では、測定時間がより長くなるため、外れ値検出プログラム35では、低周波数帯の中でもより高い周波数での測定点を用いることがより好ましい。The
種別推定プログラム36は、制御部21により実行され、処理対象14の測定結果と種別推定モデル33とにより処理対象14の種別を推定し、その種別に応じた特性推定モデル34を設定する際に実行される。この種別推定プログラム36は、例えば、測定装置15から取得した少なくとも、処理対象である蓄電デバイス13のインピーダンスの実部Z’と、その測定温度Tと、開放電圧Vとを説明変数として用いて、種別推定モデル33から蓄電デバイスの種別を推定するものとしてもよい。種別推定プログラム36は、更に、インピーダンスの虚部Z”をも取得し、説明変数として用いて処理対象14の種別を推定するものとしてもよい。また、種別推定プログラム36は、10-2Hz以上104Hz未満の範囲、より好ましくは、10-1Hz以上103Hz未満の範囲の処理対象14のインピーダンスを取得するものとしてもよい。種別推定プログラム36は、例えば、処理対象14の種別の推定を行うインピーダンスの測定点が10以下の範囲としてもよい。このインピーダンスの測定点は、3点以上がより好ましく、4点以上であることがより好ましい。また、この測定点は、8点以下であることがより好ましく、6点以下としてもよい。この測定点は、3点以上10以下の範囲では、種別の推定の精度をより高めることができ好ましい。また、種別推定プログラム36は、下端範囲として10-2Hz以上100Hz以下の範囲で1点、上端範囲として102Hzを超え104Hz未満の範囲で1点、中間範囲として100Hz以上102Hz以下の範囲で1点を少なくとも含む測定点でのインピーダンスを取得することが好ましい。下端範囲と上端範囲で少なくとも1点の測定点を含むことが、種別の推定精度をより高めることができ好ましい。また、この下端範囲は、10-1Hz以上100Hz未満の範囲であることがより好ましい。低周波数帯では、測定時間がより長くなるため、種別推定プログラム36では、低周波数帯の中でもより高い周波数での測定点を用いることがより好ましい。The
劣化判定プログラム37は、制御部21により実行され、処理対象14の測定結果と特性推定モデル34とにより処理対象14の劣化度を推定し、そのリユースが可能かを判定するプログラムである。この劣化判定プログラム37は、例えば、測定装置15から取得した少なくとも、処理対象である蓄電デバイス13のインピーダンスの実部Z’と、その測定温度Tと、開放電圧Vとを説明変数として用いて、特性推定モデル34から蓄電デバイスの劣化度を推定するものとしてもよい。劣化判定プログラム37は、更に、インピーダンスの虚部Z”をも取得し、取得したものを説明変数として用いて処理対象14の劣化度を判定するものとしてもよい。また、劣化判定プログラム37は、10-2Hz以上104Hz未満の範囲、より好ましくは、10-1Hz以上103Hz未満の範囲の処理対象14のインピーダンスを取得するものとしてもよい。劣化判定プログラム37は、例えば、処理対象14の劣化判定を行うインピーダンスの測定点が10以下の範囲としてもよい。このインピーダンスの測定点は、3点以上がより好ましく、4点以上であることがより好ましい。また、この測定点は、8点以下であることがより好ましく、6点以下としてもよい。この測定点は、3点以上10以下の範囲では、劣化度の推定の精度をより高めることができ好ましい。また、劣化判定プログラム37は、下端範囲として10-2Hz以上100Hz以下の範囲で1点、上端範囲として102Hzを超え104Hz未満の範囲で1点、中間範囲として100Hz以上102Hz以下の範囲で1点を少なくとも含む測定点でのインピーダンスを取得することが好ましい。下端範囲と上端範囲で少なくとも1点の測定点を含むことが、劣化度の推定精度をより高めることができ好ましい。また、この下端範囲は、10-1Hz以上100Hz未満の範囲であることがより好ましい。低周波数帯では、測定時間がより長くなるため、劣化判定プログラム37では、低周波数帯の中でもより高い周波数での測定点を用いることがより好ましい。The
(評価方法)
次に、こうして構成された本実施形態の評価装置20の動作、特に、評価装置20が実行する評価方法について説明する。この評価方法は、複数の種別を含む蓄電デバイス13の評価を実行する方法である。この評価方法は、例えば、変換モデル32を用いて機械学習によって第1データベース23のデータを第2データベース28のデータへ変換して第2データベース28のデータ点数を増加した変換後データベースを取得する変換ステップと、変換後データベースを用いて第2種別の蓄電デバイスに関する評価を実行する評価ステップと、を含むものとしてもよい。更に、この評価方法は、例えば、機械学習によって許容範囲31、種別推定モデル33、特性推定モデル34を構築する構築ステップ、を更に含むものとしてもよい。なお、この評価方法において、既に構築した許容範囲31、種別推定モデル33及び特性推定モデル34を用いて上記構築ステップを省略してもよい。(Evaluation method)
Next, the operation of the
(変換ステップ)
ここでは、まず、測定因子のデータ点数が少ないデータベースを他のデータベースで拡充する変換処理について説明する。この変換処理では、変換モデル32を用いて機械学習によって第1データベース23のデータを第2データベース28のデータへ変換して第2データベース28のデータ点数を増加した変換後データベースを取得する。この処理において、機械学習によって第1種別と第2種別との測定因子を一対一で対応させて変換モデル32を構築するものとしてもよい。なお、ここでは、説明の便宜のため、第2種別の第2データベース28よりも多いデータ点数を有する第1種別の第1データベース23を用いて第2種別の変換後データベースを取得する処理を主として説明する。この変換処理の機械学習には、例えば、統計分析ソフトRやPython(登録商標)、SQL、Excel(登録商標)などを用いることができ、手法として、線形回帰、カーネルリッジ、サポートベクター、XGBoost、ニューラルネットワーク(nnet)及びランダムフォレスト(RF)のうち1以上を用いることができる。機械学習の手法としては、精度がより高いことから、ランダムフォレストが好ましい。(conversion step)
Here, first, a conversion process for expanding a database with a small number of data points of measurement factors with another database will be explained. In this conversion process, data in the
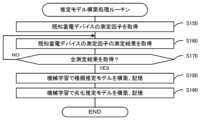
図2は、制御部21により実行される変換処理ルーチンの一例を示すフローチャートである。このルーチンは、記憶部22に記憶され、使用者の指示に応じて実行される。制御部21は、このルーチンを実行すると、まず、機械学習に用いる測定因子を設定する(S100)。制御部21は、測定因子として、インピーダンスの実部Z’、虚部Z”、測定温度T及び開放電圧Vを設定することができる。次に、制御部21は、拡充元のデータベースと拡充するデータベースとを記憶部22から読み出して取得する(S110)。ここでは、例えば、データ点数の少ない第2データベース28を拡充するものとし、データ点数の多い第1データベース23を拡充元とする。続いて、制御部21は、変換モデル32を用い、機械学習により拡充元のデータベース(第1データベース23)から拡充するデータベース(第2データベース28)のデータを拡充する(S120)。制御部21は、変換モデル32を用いて機械学習により、第1データベース23のデータを第2データベース28のデータへ変換して第2データベース28のデータ点数を増加する処理を実行する。このとき、制御部21は、第2種別の蓄電デバイス13の測定因子を第1種別の蓄電デバイス13の測定因子に一対一で対応させる処理を行う。例えば、制御部21は、第1種別の蓄電デバイス13のインピーダンスを目的変数とし、説明変数には第2種別の蓄電デバイス13のインピーダンスおよび測定温度T、開放電圧Vとして機械学習を行うものとしてもよい。そして、制御部21は、データ点数を増加したデータベースを変換後データベースとして記憶部22に記憶させ(S140)、このルーチンを終了する。制御部21は、その後、ここで得られた変換後データベースを第2データベース28として用い、第2種別の蓄電デバイス13の評価に用いる。 FIG. 2 is a flowchart showing an example of a conversion processing routine executed by the
(構築ステップ)
次に、許容範囲31を構築する処理について説明する。この構築処理では、使用者が既知種別及び既知劣化度の複数の蓄電デバイス13を用意し、評価システム10が測定因子としてのインピーダンス24や、開放電圧25、測定温度26を含む第1データベース23や第2データベース28を用い、所定の外れ値検出手法を用いて評価値を導出し、外れ値を適正に検出可能な閾値を求め、この閾値の範囲を許容範囲31として設定する処理を行う。例えば、外れ値検出手法としてLOFを用いると、適正な評価値の範囲と、明らかに外れ値である評価値の分布が得られる(後述図8参照)。この評価値の分布から、誤検出無しに外れ値を判定できる閾値を設定することができる。(construction step)
Next, the process of constructing the
次に、種別推定モデル33及び特性推定モデル34を構築する処理について説明する。この構築処理では、第1データベース23や、機械学習でデータ点数を増加した第2データベース28に含まれる測定因子としてのインピーダンス24や、開放電圧25、測定温度26を用い、種別推定モデル33や特性推定モデル34を構築する。図3は、制御部21により実行される推定モデル構築処理ルーチンの一例を示すフローチャートである。このルーチンは、記憶部22に記憶され、使用者の指示に応じて実行される。制御部21は、このルーチンを実行すると、まず、種別及び劣化度が既知である蓄電デバイス13の測定因子をデータベースから取得し(S150)、取得した測定因子に該当する蓄電デバイス13の測定結果を取得する(S160)。ここでは、インピーダンス24や、開放電圧25、測定温度26が測定因子として設定される。制御部21は、処理対象14を取り替えながら、測定装置15が測定した開放電圧Vやインピーダンスの測定結果をリアルタイムで直接取得してもよいし、測定済の開放電圧Vやインピーダンスの測定結果を第1データベース23から間接的に取得してもよい。また、インピーダンスの測定結果には、実部Z’のほか、虚部Z”などを含むものとしてもよい。S160のあと、制御部21は、全ての既知蓄電デバイス13の測定結果を取得したか否かを判定し(S170)、全ての測定結果を取得していないときには、S160以降の処理を繰り返し実行する。一方、S170で全ての測定結果を取得したときには、制御部21は、機械学習により種別推定モデル33を構築して記憶部22に記憶し(S180)、機械学習により特性推定モデル34を構築して記憶部22に記憶し(S190)、このルーチンを終了する。 Next, a process for constructing the
劣化した蓄電デバイス13のインピーダンスと劣化度とは、その劣化の態様によってリニアな関係性を有さず、周波数帯域ごとに初期セルに対して劣化セルのインピーダンス値が高く出る場合もあれば、低く出る場合もある(後述図9参照)。ここでは、機械学習を利用して、インピーダンスZ’,Z”やその測定温度T、開放電圧Vから劣化度を推定することが可能な特性推定モデル34を構築するのである。また、蓄電デバイス13は、その種別に応じて、そのインピーダンスの変化や開放電圧Vの変化に一定の傾向を有する。ここでは、機械学習を利用して、インピーダンスZ’,Z”やその測定温度T、開放電圧Vから蓄電デバイス13の種別を推定することが可能な種別推定モデル33を構築するのである。制御部21は、例えば、種別推定モデル33や特性推定モデル34の構築には統計分析ソフトRやPython(登録商標)、SQL、Excel(登録商標)などを用いることができ、手法として、線形回帰、カーネルリッジ、サポートベクター、XGBoost、ニューラルネットワーク(nnet)及びランダムフォレスト(RF)のうち1以上、好ましくは、ランダムフォレストを用いることができる。 The impedance of the deteriorated
(評価ステップ)
この評価ステップでは、処理対象14である蓄電デバイス13の測定因子の測定結果を説明変数として用い種別推定モデル33からこの処理対象14の種別を推定し、推定した種別に該当する特性推定モデル34から測定結果を説明変数として用いてこの処理対象14の蓄電デバイス13の容量及び/又は抵抗を導出し、劣化度を判定する処理を行う。また、この評価ステップでは、処理対象14である蓄電デバイス13の測定因子の測定結果を用いて外れ値検出手法によって評価値を導出し、この評価値が許容範囲31外であるものを外れ値として出力する処理を行う。また、評価値が許容範囲31内である測定結果を説明変数として用いて特性推定モデル34から該蓄電デバイス13の容量及び/又は抵抗を導出し、劣化度を判定する処理を行う。この評価ステップにおいて、測定因子は、インピーダンスの実部Z’及び/又は虚部Z”、その測定温度T、開放電圧Vとして説明する。また、種別推定モデル33及び特性推定モデル34は、第1データベース23や第2データベース28などのデータベースに基づいてそれぞれの種別ごとに構築されているものとする。(evaluation step)
In this evaluation step, the type of the
図4は、制御部21により実行される劣化判定処理ルーチンの一例を示すフローチャートである。このルーチンは、記憶部22に記憶され、使用者の指示に応じて実行される。使用者は、許容範囲31、種別推定モデル33及び特性推定モデル34を構築したのち、処理対象14(蓄電デバイス13)を交流インピーダンスアナライザ17へ接続したのち、このルーチンを実行させる。このルーチンを実行すると、制御部21は、処理対象14の測定因子を取得し(S200)、処理対象14の測定因子の測定結果を取得する(S210)。ここでは、測定因子として、測定因子の種別(Z’,Z”,T,Vなど)のほか、インピーダンスの測定点(周波数の点数)についても取得するものとする。測定点は、例えば、特定の周波数帯において3点以上10点以下の範囲、より好ましくは、4点以上8点以下の範囲に設定されている。また、測定点は、上述したように、下端範囲として10-2Hz以上100Hz以下の範囲で1点、上端範囲として102Hzを超え104Hz未満の範囲で1点、中間範囲として100Hz以上102Hz以下の範囲で1点を少なくとも含むものとすることが好ましい。この範囲に測定点が少なくとも3点含まれるものとすれば、処理対象14の種別や劣化度をより精度よく推定することができる。この測定点は、例えば、0.01Hz以上100000Hz以下の周波数範囲に含まれるものとしてもよい。具体的には、測定点は、0.01Hz、0.1Hz、1Hz、10Hz、100Hz、1000Hz、10000Hz、100000Hzなどを含むものとしてもよい。また、測定点は、0.05Hz、0.5Hz、5Hz、50Hz、500Hz、5000Hz、50000Hzや、0.02Hz、0.2Hz、2Hz、20Hz、200Hz、2000Hz、20000Hzなどを含むものとしてもよい。測定点は、例えば、0.1Hz、1Hz、10Hz、100Hz、1000Hzを含むことが好ましい。測定温度Tは、例えば、上述したように、-30℃~60℃の範囲で適宜定めるものとしてもよい。測定装置15は、設定された測定温度Tに恒温槽16を制御し、設定された測定点で交流インピーダンスアナライザ17によってインピーダンスを測定する。FIG. 4 is a flowchart showing an example of a deterioration determination processing routine executed by the
次に、制御部21は、全ての測定結果を取得したか否かを判定し(S220)、全ての測定点のデータを取得していないときには、S210以降の処理を実行する。制御部21は、S210では、取得していない次の測定点を設定する。一方、S220で全ての測定結果を取得したときには、制御部21は、インピーダンスの実部Z’及び/又は虚部Z”と開放電圧Vと、更には測定温度Tを用い、外れ値検出手法を用いて評価値を算出する(S230)。制御部21は、例えば、LOFを用いて評価値を算出する。次に、制御部21は、評価値が許容範囲31内であるか否かを判定し(S240)、許容範囲31内でないとき、即ち評価値が許容範囲31外であるときには、外れ値情報を出力する(S250)。外れ値情報には、処理対象14の測定結果が異常値である旨の内容を含むものとしてもよい。外れ値情報の出力は、例えば、表示装置19への表示出力としてもよいし、図示しないスピーカから音声出力してもよいし、図示しない印刷装置から印刷出力してもよいし、記憶部22へ記憶出力してもよい。使用者は、この外れ値情報を確認すると、処理対象14の接続などを確認し、測定装置15で再測定させるなどの作業を行う。 Next, the
一方、S240で評価値が許容範囲31内であるときには、制御部21は、測定結果を用いて、種別推定モデル33から処理対象14の種別を推定する処理を実行する(S260)。制御部21は、全測定点の説明変数の測定値に最も適合する種別を種別推定モデル33を用いて導出する。種別推定モデル33は、機械学習によって構築されており、極めて高い確率で処理対象14の種別を推定することができる。次に、制御部21は、推定した種別に応じた特性推定モデル34を設定し(S270)、測定結果を用いて、この特性推定モデル34から処理対象14の劣化度を推定する(S280)。制御部21は、全測定点の説明変数の測定値に最も適合する劣化度を特性推定モデル34を用いて導出する。特性推定モデル34は、機械学習によって構築されており、極めて高い確率で処理対象14の劣化度を推定することができる。続いて、制御部21は、推定された劣化度が所定の閾値内であるか否かを判定する(S290)。この閾値は、例えば、処理対象14の蓄電デバイス13が再調整によってリユース可能である下限値に基づいて経験的に設定されているものとする。 On the other hand, when the evaluation value is within the
処理対象14の劣化度が所定の閾値内であるときには、制御部21は、リユース可能である旨の表示を出力する(S300)。一方、処理対象14の劣化度が所定の閾値外であるときには、制御部21は、リサイクルすべき旨の表示を出力する(S310)。図5は、診断結果を表す表示画面40の説明図である。図5に示すように、リサイクル、リユースのほか、分解して資源活用するリビルドの判定を行ってもよいし、診断結果として、残存容量や抵抗増加度などの情報を付記してもよい。 When the degree of deterioration of the
S300のあと、またはS310のあと、あるいは、S250のあと、制御部21は、S300、S310、S250の判定結果を記憶すると共に、次の処理対象14の蓄電デバイス13があるか否かを判定する(S320)。次の処理対象14があるときには、制御部21は、S200以降の処理を繰り返し実行する一方、S320で次の処理対象14がないときには、制御部21は、このルーチンを終了する。このように、評価装置20では、蓄電デバイス13の交流インピーダンスの実部Z’及び/又は虚部Z”と開放電圧Vと、更には測定温度Tを用い、外れ値を検出してこれを除外し、種別推定モデル33や特性推定モデル34から処理対象14の劣化度を推定することにより、蓄電デバイス13のリユースの可否を判定する。 After S300, or after S310, or after S250, the
図6は、データベースを拡充する処理と、外れ値検出と劣化推定との関係を説明するスキームである。評価装置20では、まず、モデル構築用の測定を行い、データベースを準備する。この際に、測定データに対して外れ値検出を実行するものとしてもよい。新機製品種別のデータベースなど測定因子のデータ点数が少ないデータベースに対して、データ点数が十分であるデータベースのデータを変換モデルを用いて拡充する。そして、データ点数が所定の閾値を超えたデータベースを用いて、種別推定モデルや特性推定モデルを構築する。そして、処理対象である、未知の蓄電デバイスに対して診断用の測定を行う。まず測定が正しく実行されているかを判断し、外れ値検出されたときには、測定不良として再測定する。外れ値検出にはもう一つ役目がある。診断モデル構築に使用したデータベースとは異質のデータとして検知した場合、その蓄電デバイスの詳細な測定を行い、診断用データベースに繰り込み、種別推定モデルや特性推定モデルをアップデートしていくことができる。外れ値検出で、正常値とみなされた場合は、測定値を用いて蓄電デバイスの種別の推定を行う。回収された蓄電デバイスが複数の種別からなる場合は、この種別推定を行う方がより好ましい。蓄電デバイスの種別が特定できたら各蓄電デバイスの種別に応じた特性推定モデルを用いて劣化推定を行うことによって、より高い精度で劣化判定を行うことができる。 FIG. 6 is a scheme illustrating the relationship between database expansion processing, outlier detection, and deterioration estimation. The
以上説明した本実施形態の評価装置20及び評価システム10では、より効率よく、精度をより向上して蓄電デバイスを評価することができる。本開示がこのような効果を奏する理由は、以下のように推察される。例えば、蓄電デバイスの性能を精度よく推定するためには、蓄電デバイスの測定データなど、測定因子を充実させることが求められる。例えば、蓄電デバイスであるリチウムイオン2次電池の主な劣化としては「正極劣化」、「負極劣化」および「正負極の容量ずれ」の3つの劣化モードが知られており、どの製品種別の電池も共通である。そのため、劣化に対する応答の感度は、電池の製品種別により変化はするが(劣化に対してインピーダンスが増加するなど)、その応答の傾向はおおよそ変化しない。このため、データベースの軸、例えば、高レート充放電サイクル劣化や高温保存劣化などのインピーダンスの2軸など、を調整することにより、電池種別の異なるデータの変換が可能となり、データベースの転用も可能となると推察される。本開示では、既に準備してあるデータベースを、データ点数が不十分なデータベースに機械学習を用いて転用することにより、データベースを拡充する。このため、充実したデータベースを用意することなく、蓄電デバイスの劣化診断のための異常値検出や、種別の判定、更に、蓄電デバイスの容量や抵抗の推定などを精度よく実行可能になる。その結果、例えば、蓄電デバイスの劣化診断なども高精度化できる。したがって、本開示では、より効率よく、精度をより向上して蓄電デバイスを評価することができる。 The
また、劣化判定を行う蓄電デバイス13は、例えば、同種であっても製造会社が異なるなど、細かな点で異なることがある。このような場合、全ての蓄電デバイス13から劣化判定を行う推定モデルを構築するのに比して、各種別ごとに推定モデルを構築した場合の方が、より高精度な劣化判定を行うことができる。また、蓄電デバイスの種別を特定するアルゴリズムを導入することによって、蓄電デバイスの種別を高精度に推定し、劣化判定の精度をより高めることができる。更に、測定不良の結果など、外れ値を用いて蓄電デバイスの劣化度を推定すると、間違った判断をすることがあり得る。一方、本開示では、所定の外れ値検出手法の評価値を用いて事前にこのような外れ値のデータを報知するから、誤った判定を低減することができる。また、劣化推定の推定モデル構築に使用したデータベースにはない新規現象などで外れ値として検出されたセルの詳細を調べ、それを推定モデル構築用データベースに繰り込むことにより、新規現象に対応した予測が行えるようになり、予測精度を向上することができる。 Further, the
なお、本開示は上述した実施形態に何ら限定されることはなく、本開示の技術的範囲に属する限り種々の態様で実施し得ることはいうまでもない。 It goes without saying that the present disclosure is not limited to the embodiments described above, and can be implemented in various forms as long as they fall within the technical scope of the present disclosure.
例えば、上述した実施形態では、評価システム10は、測定装置15と評価装置20とを備えるものとしたが、特にこれに限定されず、交流インピーダンスや開放電圧などの測定因子の測定結果を外部から取得するものとして測定装置15を省略してもよい。この評価装置20においても、より効率よく、精度をより向上して蓄電デバイスを評価することができる。 For example, in the embodiment described above, the
上述した実施形態では、測定因子を交流インピーダンスやその測定温度、開放電圧として説明したが、蓄電デバイス13を評価可能な因子であれば、特にこれに限定されない。例えば、蓄電デバイス13の評価を特許文献6~10で示された処理で行うものとしてもよい。測定因子としては、例えば、定電流(CC)充電を行いVcに達したら定電圧(CV)充電に切り替えその時点から時間tだけ経過した充電電流値Itや、放電時の磁場、ひずみゲージにより測定したセルの体積変化、正負のパルス電流を印加したときの正負それぞれの電圧値の関係、内部抵抗と残容量SOCなどのうち1以上が挙げられる。この場合、機械学習する対象をこの測定因子とし、変換モデル32や種別推定モデル33、特性推定モデル34を構築すればよい。 In the embodiment described above, the measurement factors are described as alternating current impedance, its measurement temperature, and open circuit voltage, but the factors are not particularly limited to these as long as they are factors that can evaluate the
上述した実施形態では、本開示を評価システム10や評価装置20、評価方法として説明したが、例えば、評価方法を実行するためのプログラムとしてもよい。このプログラムは、コンピュータが読み取り可能な記録媒体(例えばハードディスク、ROM、FD、CD、DVDなど)に記録されていてもよいし、伝送媒体(インターネットやLANなどの通信網)を介してあるコンピュータから別のコンピュータへ配信されてもよいし、その他どのような形で授受されてもよい。このプログラムを1つのコンピュータに実行させるか又は複数のコンピュータに各ステップを分担して実行させれば、上述した評価方法の各ステップが実行されるため、この評価方法と同様の作用効果が得られる。 In the embodiments described above, the present disclosure has been described as the
以下には、本開示の評価方法及び評価装置を具体的に検討した例を実験例として説明する。なお、実験例1~19は参考例に相当する。 Below, an example in which the evaluation method and evaluation device of the present disclosure were specifically studied will be described as an experimental example. Note that Experimental Examples 1 to 19 correspond to reference examples.
中古電池の評価としての劣化診断の検討として、パナソニック製リチウムイオン電池NCR18650を用い、診断にはインピーダンス、開放電圧、測定温度の結果を用いた。インピーダンス、開放電圧、測定温度の測定には、ソーラートロン社製CELLTEST-8T(7ch:1A仕様、1ch:25A仕様)を用いて、測定時の電流は5mAとし、測定温度Tは測定セルの入っている恒温槽の温度を用いた。新品電池7本、劣化電池35本の測定を行った。劣化電池としては、2.5Vから4.2Vの間を20℃で2C充電し0.1C放電を繰り返したものや、60℃で0.5C充電し0.1C放電を繰り返したもの、60℃で保管し続けたもの、など、劣化モードの異なるものを用意した。また、種別の異なるリチウムイオン二次電池として、LG製18650-M26、プラタ販売b18650-01を用い、劣化モードとして、20℃、2Cでそれぞれ12、24、30、36、42、48、54回充放電サイクルを行った電池を用意した。まず、測定データに含まれる外れ値の検討及び、劣化度の判定を行ったのち、種別の推定について検討した。インピーダンスおよび開放電圧は、電池の残容量SOCや測定温度で変化するので、SOCは10%刻みで0~100%、測定温度は10℃刻みで-20~50℃の範囲で測定した。また、劣化度の指標として、電池容量を用い、各電池に対してアスカ電池社製5V/10A-80CHを用いて、電池容量を0.1CのCV放電の放電容量とした。測定条件は、42本の電池容量と各電池88条件(SOC11条件×測定温度8条件)とした。表1~4に各実験例の測定条件をまとめて示した。 As a study of deterioration diagnosis as an evaluation of used batteries, a Panasonic lithium ion battery NCR18650 was used, and the results of impedance, open circuit voltage, and measured temperature were used for diagnosis. To measure the impedance, open circuit voltage, and measurement temperature, we used Solartron's CELLTEST-8T (7ch: 1A specification, 1ch: 25A specification), the current at the time of measurement was 5mA, and the measurement temperature T was The temperature of the constant temperature bath was used. Measurements were performed on 7 new batteries and 35 deteriorated batteries. Deteriorated batteries include those that have been repeatedly charged between 2.5V and 4.2V at 20°C for 2C and 0.1C discharged, those that have been repeatedly charged for 0.5C and discharged for 0.1C at 60°C, and those that have been repeatedly charged for 0.1C and discharged for 0.1C at 60°C. We prepared items with different deterioration modes, such as those that had been kept in storage. In addition, LG 18650-M26 and Plata B18650-01 were used as different types of lithium ion secondary batteries, and the deterioration modes were 12, 24, 30, 36, 42, 48, and 54 times at 20°C and 2C, respectively. A battery that had been subjected to charge and discharge cycles was prepared. First, after examining outliers included in the measurement data and determining the degree of deterioration, we examined estimation of the type. Since the impedance and open circuit voltage change depending on the remaining capacity SOC of the battery and the measurement temperature, the SOC was measured in 10% increments from 0 to 100%, and the measurement temperature was measured in a range of -20 to 50°C in 10°C increments. In addition, battery capacity was used as an index of the degree of deterioration, and a 5V/10A-80CH manufactured by Asuka Battery Co., Ltd. was used for each battery, and the battery capacity was defined as the discharge capacity of 0.1C CV discharge. The measurement conditions were 42 battery capacities and 88 conditions for each battery (SOC 11 conditions x measurement temperature 8 conditions). Tables 1 to 4 summarize the measurement conditions for each experimental example.
図7は、パナソニック製リチウムイオン二次電池(LIB)の測定結果であり、図7Aが新品電池と劣化電池の容量、図7Bが新品電池と劣化電池の抵抗の違いを示す。図7に示すように、劣化電池では、新品電池に対して容量が減少すると共に、抵抗が増加することがわかる。ここでは、各電池に対してアスカ電池社製5V/10A-80CHを用いて、20℃、0.1CのCCCV放電の放電容量を測定し、それを電池容量とした。また、20℃、SOC50%で交流インピーダンスを詳細に測定し、図7Bに示すcole-coleプロットにおいて、正負極の電荷移動抵抗が二つの円弧として現れたのち交流インピーダンスの虚部Z”が極小値を取るときの実部Z’を、この電池の特徴的な抵抗R1と定義し、容量とともに劣化の指標とした。抵抗R1は、比較的応答が早い抵抗成分からなり、直流抵抗と正負極の電荷移動抵抗とを足し合わせた抵抗の指標となる。 FIG. 7 shows the measurement results of a Panasonic lithium ion secondary battery (LIB), where FIG. 7A shows the capacity of a new battery and a deteriorated battery, and FIG. 7B shows the difference in resistance between a new battery and a deteriorated battery. As shown in FIG. 7, it can be seen that in a deteriorated battery, the capacity decreases and the resistance increases compared to a new battery. Here, for each battery, the discharge capacity of CCCV discharge at 20°C and 0.1C was measured using a 5V/10A-80CH manufactured by Asuka Battery Co., Ltd., and this was taken as the battery capacity. In addition, the AC impedance was measured in detail at 20°C and SOC 50%, and in the cole-cole plot shown in Figure 7B, the charge transfer resistance of the positive and negative electrodes appeared as two circular arcs, and then the imaginary part Z'' of the AC impedance reached a minimum value. The real part Z' is defined as the characteristic resistance R1 of this battery, and is used as an indicator of deterioration along with the capacity.Resistance R1 consists of a resistance component with a relatively quick response, and is composed of DC resistance and positive and negative electrodes. This is an index of the resistance that is the sum of the charge transfer resistance and the charge transfer resistance.
まず、測定データの外れ値について検討した。外れ値を検知するための機械学習には、統計分析ソフトRを用い、手法としてLOF(Local outlier factor)を用いた。図8は、劣化電池(パナソニック製LIB)とLOFの評価値との関係図の一例である。ここでは、交流インピーダンス(0.1、1、10、100、1000Hz)の実部Z’と虚部Z”と、開放電圧(V)と、測定温度(℃)とをLOFを計算するパラメータとして用いたため、12次元空間で評価している。LOFのスコアが高いと空間に対するデータの密度が少ないことを意味し、外れ値とみなすことができる。図8では、ハイパーパラメータkをk=15として計算しており、横軸は電池データの管理番号を意味している。例えば、図8のLOFのスコアが6以上の4個のデータ点のデータを確認してみると、インピーダンスの測定値が異常な値を示し、同じ測定温度でかつ近い開放電圧の正常なデータと比較すると一桁以上小さかった。このように、診断のための測定結果を診断モデル構築に使用したデータベースと合わせて計算し、許容範囲(例えばLOFのスコアが4以下)を用いることで、測定不良や異質の測定結果を抽出することができることがわかった。 First, we examined outliers in the measurement data. Statistical analysis software R was used for machine learning to detect outliers, and LOF (Local outlier factor) was used as the method. FIG. 8 is an example of a relationship diagram between a deteriorated battery (LIB manufactured by Panasonic) and an evaluation value of LOF. Here, the real part Z' and imaginary part Z'' of AC impedance (0.1, 1, 10, 100, 1000 Hz), open circuit voltage (V), and measured temperature (℃) are used as parameters to calculate the LOF. Therefore, the evaluation was performed in a 12-dimensional space.A high LOF score means that the density of data in the space is low, and can be considered an outlier.In Figure 8, the hyperparameter k is set to k = 15. The horizontal axis represents the management number of the battery data.For example, when checking the data of the four data points with LOF scores of 6 or higher in Figure 8, the measured impedance value is It showed an abnormal value and was more than an order of magnitude smaller than normal data at the same measurement temperature and close open voltage.In this way, the measurement results for diagnosis were calculated by combining them with the database used to construct the diagnostic model. It has been found that by using an acceptable range (for example, the LOF score is 4 or less), it is possible to extract measurement defects or abnormal measurement results.
次に、リチウムイオン電池の劣化診断について検討した。図9は、SOC50%、測定温度20℃における新品電池と劣化電池のインピーダンス実部Z’の周波数依存性を示す測定結果である。図10は、SOC50%、測定温度20℃における新品電池と劣化電池のインピーダンス虚部Z”の周波数依存性を示す測定結果である。図9、10に示すように、新品電池では、インピーダンスはほぼ同じ形状、値を示した。一方、劣化電池は、新品電池と異なるインピーダンスの形状及び値を示した。また、劣化電池では、その劣化モードの違いにより、例えば、101Hz以下の周波数帯では、新品電池の上下に劣化電池のZ’があり、102Hz~104Hzの周波数帯では新品電池よりも上に劣化電池のZ’があり、105Hzではいずれの電池も同じZ’を示すなど、一様の傾向は得られなかった。このため、容量の劣化度に対するインピーダンスの変化量は、単純なモデルでは説明できないことがわかった。そこで得られたデータセットを用いて機械学習から電池容量を予測した。Next, we examined deterioration diagnosis for lithium-ion batteries. FIG. 9 shows measurement results showing the frequency dependence of the real part Z' of impedance of a new battery and a deteriorated battery at an SOC of 50% and a measurement temperature of 20°C. Figure 10 shows the measurement results showing the frequency dependence of the impedance imaginary part Z'' of a new battery and a deteriorated battery at an SOC of 50% and a measurement temperature of 20°C.As shown in Figures 9 and 10, in a new battery, the impedance is approximately On the other hand, the deteriorated battery showed a different impedance shape and value than the new battery.In addition, due to the difference in the deterioration mode of the deteriorated battery, for example, in the frequency band below 101 Hz, , the Z' of the degraded battery is above and below the new battery, and the Z' of the degraded battery is above the new battery in the frequency band of 102 Hz to 104 Hz, and the Z' of the degraded battery is the same at 105 Hz. Therefore, it was found that the amount of change in impedance with respect to the degree of capacity deterioration could not be explained by a simple model. The battery capacity was predicted from
機械学習には統計分析ソフトRを用い、パッケージとしてcaretを使用し、手法としてランダムフォレスト(RF)、ニューラルネットワーク(nnet)を検討した。予測精度を、実験値と予測値との平均平方二乗誤差RMSEにより評価した。このRMSEは、その値が低いほど予測精度が高いことを表す。今回は、推定モデルの汎用性を評価するため、10分割交差検証を行い、10回推定モデルを構築しており、その10回の平均のRMSEで比較評価した。表1に各モデルで電池容量を予測した結果を示す。表1において、インピーダンスの実部Z’は、0.01、0.1、1、10、100、1000、10000、100000Hzの各周波数の値を用いた。また表1には、開放電圧V、測定温度Tも検討した結果をまとめた。表1に示すように、機械学習の手法にかかわらず、説明変数に開放電圧Vを入れると、予測精度が向上することがわかった。また、開放電圧Vに加えて、測定温度Tを入れると、さらに予測精度が増すことがわかった。また機械学習の手法としては、nnetよりRFの方が予測精度が高いことがわかった。 Statistical analysis software R was used for machine learning, caret was used as the package, and random forest (RF) and neural network (nnet) were considered as methods. Prediction accuracy was evaluated by the mean squared error RMSE between the experimental value and the predicted value. The lower the RMSE value, the higher the prediction accuracy. This time, in order to evaluate the versatility of the estimation model, we performed 10-fold cross validation and constructed the
表2にRFで電池容量を予測した結果の使用周波数帯依存性をまとめた。表2に示すように、全ての周波数のデータを用いればよいというわけではなく、予測精度を向上させるための最適な周波数帯が存在することが推察された。例えば、10000Hz近傍の周波数帯では容量変化によるインピーダンスの変化量がノイズや電池の個体差と同程度になるため、予測精度を上げるために周波数帯を制限する必要がある。電池容量を判定するためのインピーダンスの測定周波数帯の上限範囲は、好ましくは100Hzより大きく10000Hz未満、さらに好ましくは100Hzより大きく1000Hz以下である。下限範囲に関しては、0.01Hzから0.1Hzに変更しても予測精度がほとんど同じであり、0.1Hzより低い周波数帯では周波数を低下させるにつれ測定時間が急激に増大することから、好ましくは0.1Hz以上となる。表3にインピーダンスの虚部Z”を加えて説明変数の組合せを変更しRFで電池容量を予測したRMSEを示す。表3に示すように、Vを考慮し、更にTを考慮することが好ましく、更にZ”を考慮することがより好ましく、Z’,Z”,V,Tの全て考慮するほうが予測精度を向上することがわかった。また、虚部Z”,V,Tを説明変数とした場合も(実験例14)、実部Z’,V,Tを説明変数とした場合(実験例11)と同等の結果が得られることから、虚部Z”と開放電圧Vとを説明変数としても、実部Z’のみや虚部Z”のみを説明変数とするものに比して、より高い精度で劣化度を推定できるものと推察された。 Table 2 summarizes the dependence of the frequency band used as a result of predicting battery capacity using RF. As shown in Table 2, it is assumed that it is not sufficient to use data of all frequencies, and that there is an optimal frequency band for improving prediction accuracy. For example, in a frequency band around 10,000 Hz, the amount of change in impedance due to a change in capacitance is comparable to noise and individual differences between batteries, so it is necessary to limit the frequency band in order to improve prediction accuracy. The upper limit range of the impedance measurement frequency band for determining battery capacity is preferably greater than 100 Hz and less than 10000 Hz, and more preferably greater than 100 Hz and less than 1000 Hz. Regarding the lower limit range, the prediction accuracy is almost the same even when changing from 0.01 Hz to 0.1 Hz, and in the frequency band lower than 0.1 Hz, the measurement time increases rapidly as the frequency is lowered, so it is preferable to It becomes 0.1Hz or more. Table 3 shows the RMSE of battery capacity predicted by RF by adding the imaginary part Z'' of impedance and changing the combination of explanatory variables.As shown in Table 3, it is preferable to consider V and further consider T. , it is more preferable to consider Z'', and it was found that considering all of Z', Z'', V, and T improves the prediction accuracy. Also, the imaginary parts Z'', V, and T are used as explanatory variables. (Experimental Example 14), the same results as when the real parts Z', V, and T are used as explanatory variables (Experimental Example 11) can be obtained, so the imaginary part Z'' and the open circuit voltage V are used as explanatory variables Even so, it is presumed that the degree of deterioration can be estimated with higher accuracy than when only the real part Z' or only the imaginary part Z'' is used as an explanatory variable.
図11は、説明変数としてインピーダンスの実部Z’,虚部Z”,開放電圧V,測定温度Tを用い(実験例12)複数の劣化モードで劣化した電池の容量実験値と容量予測値との関係図である。図12は、説明変数としてインピーダンスの実部Z’,虚部Z”,開放電圧V,測定温度Tを用い(実験例12)複数の劣化モードで劣化した電池の容量実験値と抵抗予測値との関係図である。図中には、全体の90%のデータが含まれる誤差ラインを示した。図11に示すように、どの劣化モードの電池においても高い精度で容量予測ができていることがわかった。特に、3000mAh程度の電池容量に対して±25mAhの誤差で90%以上のデータが予測できていることがわかった。また、図12に示すように、どの劣化モードの電池においても高い精度で抵抗予測ができていることがわかった。 Figure 11 shows the experimental capacity values and predicted capacity values of a battery degraded in multiple degradation modes using the real part Z', imaginary part Z'' of impedance, open circuit voltage V, and measured temperature T as explanatory variables (Experimental Example 12). Fig. 12 is a capacity experiment of a battery degraded in multiple degradation modes using the real part Z', imaginary part Z'', open circuit voltage V, and measurement temperature T of impedance as explanatory variables (Experiment Example 12). It is a relationship diagram between a value and a resistance prediction value. In the figure, an error line containing 90% of the total data is shown. As shown in FIG. 11, it was found that the capacity could be predicted with high accuracy for batteries in any deterioration mode. In particular, it was found that more than 90% of the data could be predicted with an error of ±25 mAh for a battery capacity of about 3000 mAh. Furthermore, as shown in FIG. 12, it was found that resistance could be predicted with high accuracy for batteries in any deterioration mode.
図13は、各周波数(Hz)と測定時間(s)との関係図である。電池診断は、短時間で行うことが望まれる。この点において、近い周波数のインピーダンス同士は強い相関があることから、ある程度測定するデータ点を間引いても劣化診断には影響しないことが予想される。このため、測定するデータ点を少なくすることが考えられる。例えば、0.01~100000Hzのインピーダンスを周波数のログスケールで均等に85点取った場合、測定時間が1170sであったが、8点(0.01、0.1、1、10、100、1000、10000、100000Hz)にすると、202sと1/5程度の測定時間で済むことがわかった。直接的に電池容量を0.1Cで測定した場合、測定時間は最低でも10時間かかることから、インピーダンスの測定時間は電池容量測定時間に比べて圧倒的に短く、劣化診断向きであった。 FIG. 13 is a diagram showing the relationship between each frequency (Hz) and measurement time (s). It is desirable to perform battery diagnosis in a short time. In this regard, since there is a strong correlation between impedances at close frequencies, it is expected that even if the data points to be measured are thinned out to some extent, it will not affect the deterioration diagnosis. Therefore, it is conceivable to reduce the number of data points to be measured. For example, when impedance from 0.01 to 100,000 Hz was taken at 85 points evenly on a frequency log scale, the measurement time was 1170 s, but 8 points (0.01, 0.1, 1, 10, 100, 1000 , 10,000, 100,000 Hz), it was found that the measurement time was only 202 seconds, which was about ⅕. When battery capacity is directly measured at 0.1 C, the measurement time is at least 10 hours, so the impedance measurement time is overwhelmingly shorter than the battery capacity measurement time and is suitable for deterioration diagnosis.
次に、表4にインピーダンスの虚部Z”を加えてRFで電池容量を予測した結果の使用周波数帯依存性を示す。図14は、測定点数とRMSE(mAh)との関係図である。表4、図14に示すように、データの測定点数に関しては、使用周波数に対応する測定点数は、3点以上が好ましく、4点以上で高い予測精度を示すことがわかった。また、測定点数が6点の場合と3点の場合とで予測精度がほぼ同じことから、測定点数をこれ以上増やしても予測精度は向上しにくいと推測された。データの測定点数が増えると、診断時間がかかることから、望ましくは、測定点数は8点以下、さらに望ましくは6点以下であると推察された。 Next, Table 4 shows the dependence on the used frequency band as a result of predicting battery capacity by RF by adding the imaginary part Z'' of impedance. FIG. 14 is a diagram showing the relationship between the number of measurement points and RMSE (mAh). As shown in Table 4 and Figure 14, regarding the number of data measurement points, it was found that the number of measurement points corresponding to the frequency used is preferably 3 or more, and that 4 or more indicates high prediction accuracy. Since the prediction accuracy is almost the same when the data is 6 points and when it is 3 points, it is assumed that it is difficult to improve the prediction accuracy even if the number of measurement points is increased further.As the number of data measurement points increases, the diagnosis time decreases. From this, it was inferred that the number of measurement points is preferably 8 or less, more preferably 6 or less.
劣化診断時の測定は直接インピーダンスを測定するものとしてもよいが、間接的に測定する場合についても検討した。その一例として、電流ステップ法を検討した。図15は、測定温度20℃ でのZ’の周波数依存性と、電流ステップ法により求めた各周波数におけるZ’の対応関係を示した説明図である。図15には、電流ステップ法で0.1Cの電流を0.01s印加した時の電圧の振る舞いを付記した。この電流と電圧を用いて、ラプラス変換により図中の劣化電池(残容量SOC50%、測定温度20℃)の100HzにおけるZ’を求めた。図15に示すように、電流ステップ法で求めたインピーダンスZ’は、直接インピーダンスを求めた測定結果に非常によい精度で対応することがわかった。この結果から、劣化診断の手法としては、電流ステップ法以外に電圧ステップ法や、電流パルス法でも良好な結果が得られるものと推察された。 Although the measurement at the time of deterioration diagnosis may be a direct measurement of impedance, indirect measurement was also considered. As an example, we investigated the current step method. FIG. 15 is an explanatory diagram showing the frequency dependence of Z' at a measurement temperature of 20° C. and the correspondence of Z' at each frequency determined by the current step method. FIG. 15 also shows the behavior of voltage when a current of 0.1 C is applied for 0.01 s using the current step method. Using this current and voltage, Z' at 100 Hz of the degraded battery shown in the figure (remaining capacity SOC 50%,


次に、リチウムイオン二次電池の種別の影響について検討した。電池の種別の特定を行うために、統計分析ソフトRでランダムフォレスト(RF)を用い、分類を行った。ハイパーパラメータntree、mtryをそれぞれntree=10000、mtry=5として計算した。10分割交差検証を採用し、10回推定モデルを構築しており、その10回の平均のAccuracy(正答率)で評価した。説明変数に交流インピーダンス(0.1、1、10、100、1000Hz)の実部Z’及び虚部Z”、開放電圧V、測定温度Tを使用し、データ点数はそれぞれパナソニック製LIBが3696点、LG製LIBが792点、プラタ販売のLIBが528点で評価した。その結果、Accuracyは、0.998と、ほぼ100%の確率で3つの種別に分離できていることを確認できた。なお、測定因子や種別特定の手法は、表1~4などに示したように、上記内容とすることが好ましいことが推察された。このように前もって電池の種別を特定できることによる利点を以下に示す。 Next, we examined the influence of the type of lithium-ion secondary battery. In order to identify the type of battery, classification was performed using random forest (RF) using statistical analysis software R. Hyperparameters ntree and mtry were calculated with ntree=10000 and mtry=5, respectively. A 10-fold cross-validation was adopted, and an estimation model was constructed 10 times, and the accuracy (correct answer rate) of the 10 times was used for evaluation. The real part Z' and imaginary part Z'' of AC impedance (0.1, 1, 10, 100, 1000 Hz), open circuit voltage V, and measurement temperature T are used as explanatory variables, and the number of data points is 3696 for each Panasonic LIB. , LG LIB was evaluated with 792 points, and LIB sold by Plata was evaluated with 528 points.As a result, Accuracy was 0.998, which confirmed that the accuracy could be separated into three types with almost 100% probability. In addition, it was inferred that it is preferable to use the measurement factors and the method for identifying the type as described above, as shown in Tables 1 to 4.The advantages of being able to identify the battery type in advance in this way are as follows. show.
電池の容量および抵抗を推定するために、統計分析ソフトRでランダムフォレストを用い、種別推定モデルを構築した。ハイパーパラメータntree、mtryをそれぞれntree=10000、mtry=5として、交流インピーダンス(0.1、1、10、100、1000Hz)、開放電圧V、測定温度Tの測定結果で電池の容量および抵抗を予測した。単一の種別(パナソニック製LIB)の結果は、前述の図11、12に示した。次に、上記3種別の電池の測定結果を全て用いて推定モデルを構築した場合と、各種別で測定結果を分けて推定モデルを構築した場合とを比較した。図16は、単独種又は3種混合で予測した容量実験値と容量予測値との関係図である。図16はLG製LIBの容量の実験値と予測値とを比較した結果である。3種別の電池の測定結果を全て用いて推定モデルを構築した場合、単独種の電池のデータベースの場合と比較して一部の予測値が実験値に対して大きく外れる結果となった。この結果は、パナソニック製LIBやプラタ販売のLIBでも同様のことが起きていた。つまり、予測精度を上げるには単独種の電池の測定結果だけで推定モデルを構築したほうが良好な結果が得られることがわかった。電池の種別が特定できない場合、複数の種別の電池のデータベースを混合して推定モデルを作るしかないので、前もって電池の種別を特定することは予測精度を向上させることにつながることが明らかとなった。 In order to estimate the capacity and resistance of the battery, a type estimation model was constructed using random forest using the statistical analysis software R. Predict the battery capacity and resistance based on the measurement results of AC impedance (0.1, 1, 10, 100, 1000Hz), open circuit voltage V, and measurement temperature T, with hyperparameters ntree and mtry set to ntree=10000 and mtry=5, respectively. did. The results for a single type (LIB manufactured by Panasonic) are shown in FIGS. 11 and 12 described above. Next, a comparison was made between a case where an estimation model was constructed using all the measurement results of the three types of batteries and a case where an estimation model was constructed by dividing the measurement results for each type. FIG. 16 is a diagram showing the relationship between experimental capacity values and predicted capacity values predicted for a single species or a mixture of three species. FIG. 16 shows the results of comparing the experimental value and predicted value of the capacity of LG LIB. When an estimation model was constructed using all of the measurement results of the three types of batteries, some of the predicted values deviated significantly from the experimental values compared to the database of a single type of battery. This result was similar to the LIB made by Panasonic and the LIB sold by Plata. In other words, in order to improve prediction accuracy, it was found that better results could be obtained by building an estimation model using only the measurement results of a single type of battery. If the battery type cannot be identified, the only way to create an estimation model is to mix databases of multiple battery types, so it has become clear that identifying the battery type in advance can improve prediction accuracy. .
(異なる製品種のデータセット転用についての検討)
中古電池の劣化診断の検討として、パナソニック製リチウムイオン電池(LIB)NCR18650を第1電池とし、LG製18650-M26を第2電池として用い、診断には交流インピーダンスZ、開放電圧V、測定温度Tの測定結果を用いた。インピーダンス、開放電圧、測定温度の測定には、ソーラートロン社製CELLTEST-8T(7ch:1A仕様、1ch:25A仕様)を用いて、測定時の交流電圧振幅は5mVとした。パナソニック製LIBの劣化電池として、20℃で2C(Cレート)充電、0.1C放電を繰り返したもの(高レート電池とも称する)と、残容量SOCを100%(4.2V)に調整した電池を長期保存したもの(高温保存電池とも称する)とを用意した。インピーダンスおよび開放電圧は、電池のSOCや測定温度で変化することから、SOCは10%刻みで0~100%、測定温度は10℃刻みで-20~50℃の範囲で測定した。劣化度の指標として、電池容量を今回考慮した。今回は各電池に対してアスカ電池社製5V/10A-80CHを用いて、20℃で0.1CのCCCV放電の放電容量を測定し、それを電池容量とした。得られたデータベースを基に機械学習により、温度-20~50℃、SOCが0~100%の範囲で、交流インピーダンスZ(0.1、1、10、100、1000Hz)、開放電圧V(V)、測定温度T(℃)の測定結果から容量を予測できるようにした。(Consideration of data set diversion for different product types)
As a study on deterioration diagnosis of used batteries, Panasonic's lithium ion battery (LIB) NCR18650 was used as the first battery, and LG's 18650-M26 was used as the second battery, and AC impedance Z, open circuit voltage V, and measured temperature T were used for diagnosis. The measurement results were used. The impedance, open circuit voltage, and measurement temperature were measured using Solartron's CELLTEST-8T (7ch: 1A specification, 1ch: 25A specification), and the AC voltage amplitude at the time of measurement was 5mV. Deteriorated Panasonic LIB batteries include one that has been repeatedly charged at 2C (C rate) and discharged at 0.1C at 20°C (also referred to as a high rate battery), and one that has been adjusted to have a remaining capacity SOC of 100% (4.2V). A long-term storage battery (also called a high-temperature storage battery) was prepared. Since the impedance and open circuit voltage change depending on the SOC of the battery and the measurement temperature, the SOC was measured in 10% increments from 0 to 100%, and the measurement temperature was measured in 10°C increments in the range of -20 to 50°C. This time, we considered battery capacity as an indicator of the degree of deterioration. This time, for each battery, the discharge capacity of 0.1C CCCV discharge at 20°C was measured using 5V/10A-80CH manufactured by Asuka Battery Co., Ltd., and this was taken as the battery capacity. Based on the obtained database, machine learning was used to calculate AC impedance Z (0.1, 1, 10, 100, 1000Hz), open circuit voltage V (V ), the capacity can be predicted from the measurement results of the measurement temperature T (°C).
電池の容量を推定するために、統計分析ソフトRでランダムフォレスト(RF)を用い、予測モデルを構築した。ハイパーパラメータntree、mtryをそれぞれntree=10000、mtry=8として、交流インピーダンス(0.1、1、10、100、1000Hz)、開放電圧、測定温度の測定結果でパナソニック製LIBの容量を予測した。新品電池7本、高レート電池21本、高温保存電池8本で、88条件(温度8条件×SOC11条件)の実測データを取得し、その内、異常値を除いた3164データ点を含むデータベースから予測モデルを構築した。図17は、予測モデルを用いた予測値と実測値との関係図である。図17には、測定結果の90%が含まれる境界ラインも載せて示した。この検討では、10分割交差検証を行ったことから、10回予測モデルをトレーニングデータにより構築しており、その10回のテストデータの平均のRMSE、すなわちRMSECVも図17に示した。ここで検討した予測モデルのRMSECVは、46.30mAhであった。図17に示すように、第1電池のデータベースを用いて予測した予測値(容量)が実測値に対して良好な対応関係を示しており、この予測モデルが実測値に近い予測を実行可能であることが確認された。In order to estimate the battery capacity, a prediction model was constructed using random forest (RF) using statistical analysis software R. The capacity of the Panasonic LIB was predicted based on the measurement results of AC impedance (0.1, 1, 10, 100, 1000 Hz), open circuit voltage, and measured temperature, with the hyperparameters ntree and mtry set to ntree=10000 and mtry=8, respectively. We obtained actual measurement data under 88 conditions (8 temperature conditions x 11 SOC conditions) using 7 new batteries, 21 high-rate batteries, and 8 high-temperature storage batteries, from a database containing 3164 data points excluding abnormal values. A predictive model was constructed. FIG. 17 is a relationship diagram between predicted values using a prediction model and actual measured values. FIG. 17 also shows a boundary line that includes 90% of the measurement results. In this study, 10-fold cross validation was performed, so a 10-time prediction model was constructed using training data, and the average RMSE of the 10-time test data, that is, RMSECV , is also shown in FIG. The RMSECV of the prediction model considered here was 46.30mAh. As shown in Figure 17, the predicted value (capacity) predicted using the database of the first battery shows a good correspondence with the actual measured value, and this prediction model is able to perform predictions close to the actual measured value. It was confirmed that there is.
次に、第1電池としてのパナソニック製LIBのインピーダンスを、第2電池としてのLG製LIBのインピーダンスに変換する変換モデルを機械学習により構築し、上記予測モデルの構築に使用したデータベースを転用することを検討した。第2電池の新品電池1本、高レート電池1本、高温保存電池1本を、第1電池のそれらに一対一で対応させた。図18は、SOC50%、温度20℃における新品電池のインピーダンス(実部Z’、虚部Z”)の例である。図18に示すように、第1電池の測定結果を、第2電池の測定結果に変換することが可能であると予測された。次に、それぞれ88条件のデータを、統計分析ソフトRでランダムフォレストを用い、ハイパーパラメータをntree=10000、mtry=5として、インピーダンス変換モデルを構築した。第2電池の周波数f(f=0.1、1、10、100、1000Hz)におけるZ’(f)およびZ”(f)を目的変数とし、説明変数には第1電池の周波数fにおけるZ’(f)およびZ”(f)と、温度T、開放電圧Vとした。図19は、変換モデルを用いて予測したインピーダンスの予測値と実験値との関係図であり、図19Aが実部Z’、図19Bが虚部Z”である。ここでは、変換モデルによる264データ点(電池3本×88条件)の予測結果を示した。ここでは、構築した変換モデルを用いて、第1電池の3164データ点を第2電池のインピーダンスに変換した。即ち、第2電池の264データ点を含む第2データベースと変換モデルとにより、第2電池のデータベースを3164データ点に増やした変換後データベースを得た。図19に示すように、変換モデルを用いてデータ点数を増加した変換後データベースを用いた場合、実測値と予測値とは良好に対応することがわかった。なお、図19Bでは、Logスケールで示しており、3×10-4以下の領域での対応関係が不良に見えるが、これは略値0の領域であり、特に対応関係に支障はないものと判断した。Next, a conversion model that converts the impedance of the Panasonic LIB as the first battery to the impedance of the LG LIB as the second battery is constructed by machine learning, and the database used to construct the above prediction model is repurposed. It was investigated. One new battery, one high-rate battery, and one high-temperature storage battery of the second battery were matched one-to-one with those of the first battery. Fig. 18 is an example of the impedance (real part Z', imaginary part Z'') of a new battery at SOC 50% and
(異常値判定の検討)
次に、この構築された変換モデルにより拡充させた変換後データベースを異常値判定に用いた場合について検討した。第2電池の264データ点に異常データを加え、および変換モデルで得られた3164データ点に異常データを加えて異常値検出を試みた。異常データは、新品の第2電池の20℃、SOC50%のデータのインピーダンスのみを意図的に二桁小さくした値とした。異常値検出を行う機械学習には、統計分析ソフトRを用い、手法として局所外れ値因子法(LOF)を用いた。図20は、異常データを加えた第2電池のデータNo.とLOFとの関係図であり、図20Aが第2電池の実測値のみのデータベースを用いた検出結果であり、図20Bが変換モデルによりデータ点を拡充した変換後データベースを用いた検出結果である。ここでは、交流インピーダンス(0.1、1、10、100、1000Hz)の実部Z’と虚部Z”、開放電圧V、測定温度Tをパラメータとして用いてLOFを計算したため、12次元空間で評価している。LOFのスコアが高いと、空間に対するそのデータの周りのデータ密度が少ないことを意味し、異常値とみなすことができる。図20では、ハイパーパラメータk=5として計算しており、横軸は電池データの管理番号である。図20Aに示すように、第2電池の生データである264データ点では、異常データのLOFが2程度を示し、他の正常データと同程度の値をとり、異常データを発見することはできなかった。一方、インピーダンス変換モデルで得られた3164データ点を参照する変換後データベースを用いると、異常データのLOFが20以上を示し、所定の閾値(例えばLOFのスコアが10以上や15以上など)を用いることで、測定不良や異質の測定結果を抽出することができることがわかった。図20Aに示すように、参照するデータベースが充実していない場合には異常値検出は困難であり、本手法を用いることで参照するデータベースを充実させることができる。この場合の本手法とは、特定の電池種と他の電池種のインピーダンスを一対一で対応させて、変換モデルを構築することである。なお、機械学習には統計分析ソフトRを用いたが、python、matlab、excelなどの環境下でも同様の結果が得られるものと推察された。また、変換モデルを構築する手法としてランダムフォレスト(RF)を用いたが、線形回帰、ニューラルネットワーク、サポートベクターマシーン、ブースティングなどでも同様の結果が得られるものと推察された。(Examination of abnormal value determination)
Next, we considered the case where the converted database expanded by this constructed conversion model was used for abnormal value determination. Abnormal value detection was attempted by adding abnormal data to the 264 data points of the second battery and adding abnormal data to the 3164 data points obtained by the conversion model. The abnormal data was a value in which only the impedance of the data of the new second battery at 20° C. and 50% SOC was intentionally made smaller by two orders of magnitude. Statistical analysis software R was used for machine learning to detect abnormal values, and the local outlier factor method (LOF) was used as the method. FIG. 20 shows data No. of the second battery including abnormal data. FIG. 20A is a detection result using a database of only actual measured values of the second battery, and FIG. 20B is a detection result using a converted database in which data points are expanded by a conversion model. . Here, the LOF was calculated using the real part Z' and imaginary part Z'' of AC impedance (0.1, 1, 10, 100, 1000 Hz), the open circuit voltage V, and the measured temperature T as parameters, so it can be calculated in a 12-dimensional space. If the LOF score is high, it means that the data density around the data in the space is low, and it can be considered as an abnormal value.In Figure 20, it is calculated with the hyperparameter k = 5. , the horizontal axis is the management number of the battery data.As shown in FIG. 20A, for the 264 data points that are the raw data of the second battery, the LOF of abnormal data is about 2, which is about the same as other normal data. On the other hand, when using the converted database that refers to 3164 data points obtained with the impedance conversion model, the LOF of abnormal data was 20 or more, and it was not possible to find any abnormal data. (For example, the LOF score is 10 or more or 15 or more) It was found that it is possible to extract poor measurement or abnormal measurement results.As shown in Figure 20A, there is not enough database to refer to. In such cases, it is difficult to detect abnormal values, and by using this method, it is possible to enrich the reference database. Correspondingly, a conversion model was constructed.Although statistical analysis software R was used for machine learning, it was assumed that similar results could be obtained in environments such as Python, Matlab, and Excel. In addition, although Random Forest (RF) was used as a method for constructing the conversion model, it was assumed that similar results could be obtained using linear regression, neural networks, support vector machines, boosting, etc.
(電池種判定の検討)
次に、第2電池の264データ点および変換モデルで得られた第1電池の3164データ点を加えた変換後データベースを用いて、電池種の同定を試みた。統計分析ソフトRでランダムフォレストを用い、説明変数として交流インピーダンス(0.1、1、10、100、1000Hz)の実部Z’と虚部Z”、開放電圧V、測定温度Tを使用し、ハイパーパラメータntree=10000、mtry=5として分類を行った。10分割交差検証を採用しており、その10回の平均の正答率で評価した。その正答率は、生データの264データ点のみを用いた場合が0.994であったが、変換モデルで得られた3164データ点を用いた場合は0.999であり、正答率が大きく改善した。このように、予測に用いているデータベースが充実していない場合は、電池種の同定の正答率が落ちるが、本手法を用いることで参照するデータベースを充実させることができ、正答率を向上させることができることがわかった。(Consideration of battery type determination)
Next, an attempt was made to identify the battery type using a converted database including 264 data points of the second battery and 3164 data points of the first battery obtained by the conversion model. Using random forest with statistical analysis software R, real part Z' and imaginary part Z'' of AC impedance (0.1, 1, 10, 100, 1000 Hz), open circuit voltage V, and measurement temperature T are used as explanatory variables. Classification was performed using hyperparameters ntree = 10000 and mtry = 5. 10-fold cross-validation was used, and the evaluation was based on the average correct answer rate of 10 times. The correct answer rate was based on only 264 data points of raw data. When the database used for prediction was If the database is not complete, the correct answer rate for battery type identification will drop, but it was found that by using this method, the reference database can be enriched and the correct answer rate can be improved.
(容量判定の検討)
上述したように、第2電池のデータベースよりもデータ点数の多い第1電池のデータベースを変換モデルにより変換してデータ点数を拡充させた第2電池の変換後データベースでは、より正確な異常値判定及び電池種判定が可能であることがわかった。次に、この変換後データベースを用いて容量の予測モデルを構築した場合について検討した。図21は、3本の第2電池の容量とそれぞれに対応した第1電池の容量との関係図である。各第1電池の容量を第2電池の容量へ図20の線形補間を用いて換算した。第2電池の容量をy、第1電池の容量をxとすると、高レート電池の場合は、y=1.41x-2091であり、高温保存電池の場合は、y=0.56x+821であった。変換後データベースを用いて、統計分析ソフトR、ランダムフォレスト(RF)で、説明変数に交流インピーダンス(0.1、1、10、100、1000Hz)の実部Z’と虚部Z”、開放電圧V、測定温度Tを使用し、ハイパーパラメータntree=10000、mtry=8として容量の予測モデルを構築した。図22は、変換後データベースを用いて構築した予測モデルによる実測容量値と予測容量値との関係図である。この予測モデルを用いて、評価用として用意した高レート電池(2322mAh)、高温保存電池(2604mAh)の容量を予測した。図23は、変換後データベースを用いて構築した予測モデルを用いて劣化電池の容量を予測した結果図であり、図23Aが高レート電池、図23Bが高温保存電池の予測結果である。変換データベースを使用した予測モデルでは、図22に示すように、RMSECV=74.01mAh程度の誤差で予測できることがわかった。表5に変換データベースを用いた予測モデルと第2電池の264データ点(生データ)のみから構築した予測モデルの高レート電池(2322mAh)、高温保存電池(2604mAh)の容量予測の88条件(温度8条件×SOC11条件)の平均誤差をまとめて示した。変換後データベースを用いた予測モデルでは、RMSECVは小さく、第1電池のデータを転用してデータベースを拡充することによって予測精度を向上させることができることがわかった。また、図23に示すように、予測結果が極めて良好な領域や、予測結果が良好な領域など、予測精度の分布を取得することができた。なお、このデータベースの変換による転用に関して、本実施例では、交流インピーダンスZ’,Z”、開放電圧V、測定温度Tを用いたが、直流電流、電圧応答、磁場、ひずみゲージなどを用いた劣化推定でも本手法は有効であることが推察された。(Consideration of capacity determination)
As mentioned above, the converted database of the second battery, which has expanded the number of data points by converting the database of the first battery, which has more data points than the database of the second battery, by using the conversion model, allows for more accurate abnormal value determination and It was found that battery type determination is possible. Next, we considered the case where a capacity prediction model was constructed using this converted database. FIG. 21 is a diagram showing the relationship between the capacities of the three second batteries and the capacities of the corresponding first batteries. The capacity of each first battery was converted to the capacity of the second battery using linear interpolation in FIG. When the capacity of the second battery is y and the capacity of the first battery is x, in the case of a high rate battery, y = 1.41x - 2091, and in the case of a high temperature storage battery, y = 0.56x + 821. . Using the converted database, the real part Z' and imaginary part Z'' of AC impedance (0.1, 1, 10, 100, 1000 Hz) and open circuit voltage were used as explanatory variables using the statistical analysis software R and Random Forest (RF). A capacity prediction model was constructed using the measured temperature T and the hyperparameters ntree=10000 and mtry=8. Figure 22 shows the measured capacity value and predicted capacity value by the prediction model built using the converted database. This prediction model was used to predict the capacity of a high-rate battery (2322mAh) and a high-temperature storage battery (2604mAh) prepared for evaluation.Figure 23 shows the prediction constructed using the converted database. These are the results of predicting the capacity of a degraded battery using the model, where FIG. 23A is the prediction result for a high rate battery and FIG. 23B is the prediction result for a high temperature storage battery.In the prediction model using the conversion database, as shown in FIG. , RMSECV was found to be able to predict with an error of about 74.01 mAh.Table 5 shows the prediction model using the conversion database and the prediction model constructed from only 264 data points (raw data) of the second battery (high rate battery). 2322mAh) and high temperature storage battery (2604mAh) under 88 conditions (8 temperature conditions x 11 SOC conditions).In the prediction model using the converted database, the RMSECV is small, and the first battery It was found that the prediction accuracy could be improved by reusing the data of We were able to obtain a distribution of prediction accuracy. Regarding the conversion of this database, in this example, AC impedances Z', Z'', open circuit voltage V, and measured temperature T were used, but DC current, It was inferred that this method is also effective for deterioration estimation using voltage responses, magnetic fields, strain gauges, etc.

次に、使用されているデータベースが変換後データベースであるか否かを定量的に評価する手法を検討した。変換後データベースは、拡充元のデータベース(第1電池のデータベース)の空間に対するデータのばらつき度合いが近いものとなる。但し、拡充元のデータベースと変換後データベースの空間に対するデータのばらつき度合いは、表6のように一見で明確に区別することは困難である。表6は、拡充元の第1電池であるパナソニック製LIBの3164データ点からなるデータベースと、それを第2電池としてのLG製LIBに転用した3164データ点からなる変換後データベースの一部を示した。まず、データベース内の各データのLOFをハイパーパラメータk=15として計算した。交流インピーダンス(0.1、1、10、100、1000Hz)の実部Z’と虚部Z”、開放電圧V、測定温度TをLOFを計算するパラメータとして用い、12次元空間で評価した。LOFのスコアが高いと、空間に対するそのデータの周りのデータ密度が少ないことを意昧する。図24は、LOFの小さい順にソートを行った結果図である。横軸は電池データの管理番号を意味している。拡充元データベースと変換後データベースはよく似た傾向を示すことがわかった。図24には、第2電池の生データのみによる実測データベースの結果も示した。この場合の第2電池の実測データベースとは、新品電池2本、20℃-2Cサイクル電池7本、60℃保存電池4本で、88条件(温度8条件×SOC11条件)の測定を行いデータベースを作成し、その内、異常値を除いた1139データ点を基に、3回重複させて3417点としたものを指す。次に、それぞれのデータベースにおける計算したLOFのヒストグラムを計算した。LOFの始点を0.89とし、0.003刻みに101点でヒストグラムを作成した。図25は、LOFと頻度との関係図である。第2電池の実測データベースは、LOFが0.98付近の最強ピークに対して0.95付近の頻度の適合率が低く見られた。ヒストグラムの101点を用いて、変換後データベースおよび第2電池の実測データベースが拡充元データベースにどれだけ似ているかを相関係数で評価し、ヒストグラム(データのばらつき度合い)を定量評価した。その結果を表7に示す。相関係数が1に近いほどデータベースが近似することを意味し、明らかに変換後データベースは実測データベースに比して、拡充元データベースに近似していることがわかった。拡充元データベースと変換後データベースとの結果を示したが、変換後データベース同士でも当然データのばらつき度合いが近似するため、相関係数は高くなることは容易に想像できる。以上のことから、例えば装置内の電池A、電池Bのデータベースを比較し、上記の相間係数が0.95以上である爆合は、変換後データベースであるというように、本発明の実施を発見することができる。また、装置が違っていても装置Aの電池Aと、装置Bの電池Bとのそれぞれのデータベースの相関係数が0.95以上である場合は、変換後データベースであると判断することができる。即ち、本発明を実施していると判断することができる。 Next, we considered a method for quantitatively evaluating whether the database being used is a converted database. The converted database has a degree of data variation in space similar to that of the original database (database of the first battery). However, as shown in Table 6, it is difficult to clearly distinguish the degree of data variation in space between the original database and the converted database at a glance. Table 6 shows a part of the database consisting of 3164 data points of Panasonic's LIB, which is the first battery that was expanded, and the converted database consisting of 3,164 data points that was transferred to LG's LIB, which is the second battery. Ta. First, the LOF of each data in the database was calculated with the hyperparameter k=15. The real part Z' and imaginary part Z'' of AC impedance (0.1, 1, 10, 100, 1000 Hz), open circuit voltage V, and measured temperature T were used as parameters to calculate the LOF, and the evaluation was performed in a 12-dimensional space.LOF A high score means that the data density around that data in space is low. Figure 24 shows the results of sorting in descending order of LOF. The horizontal axis means the management number of battery data. It was found that the expanded original database and the converted database showed very similar trends. Figure 24 also shows the results of the actual measurement database using only the raw data of the second battery. The actual measurement database was created by conducting measurements under 88 conditions (8 temperature conditions x 11 SOC conditions) using 2 new batteries, 7 20℃-2C cycle batteries, and 4 batteries stored at 60℃. Based on 1139 data points excluding abnormal values, 3417 points were obtained by repeating them three times.Next, we calculated the histogram of the calculated LOF in each database.The starting point of LOF was set as 0.89, A histogram was created with 101 points in 0.003 increments. Figure 25 is a diagram showing the relationship between LOF and frequency. The actual measurement database of the second battery shows that LOF is 0.95 for the strongest peak near 0.98. The precision of nearby frequencies was seen to be low. Using the 101 points of the histogram, the correlation coefficient was used to evaluate how similar the converted database and the measured database of the second battery were to the original database, and the histogram ( The results are shown in Table 7. The closer the correlation coefficient is to 1, the more similar the databases are, and it is clear that the converted database is more similar to the original database than the actual measured database. It was found that the correlation coefficient is similar to that of the database.We have shown the results for the original database and the converted database, but the degree of data variation is naturally similar between the converted databases, so it is easy for the correlation coefficient to become high. From the above, for example, the present invention can be used to compare the databases of batteries A and B in the device, and find that the above-mentioned correlation coefficient is 0.95 or more in the converted database. In addition, even if the devices are different, if the correlation coefficient of each database for battery A of device A and battery B of device B is 0.95 or more, after conversion It can be determined that the database is a database, that is, it can be determined that the present invention is being implemented.


なお、本明細書で開示した評価装置、評価システム、評価方法及びそのプログラムは、上述した実施例に何ら限定されることはなく、本開示の技術的範囲に属する限り種々の態様で実施し得ることはいうまでもない。 Note that the evaluation device, evaluation system, evaluation method, and program thereof disclosed in this specification are not limited to the above-mentioned embodiments, and may be implemented in various forms as long as they fall within the technical scope of the present disclosure. Needless to say.
本明細書で開示した評価装置、評価システム、評価方法及びそのプログラムは、蓄電デバイスの特性を評価する技術分野に利用可能である。 The evaluation device, evaluation system, evaluation method, and program thereof disclosed in this specification can be used in the technical field of evaluating characteristics of power storage devices.
10 評価システム、12 ネットワーク、13 蓄電デバイス、14 処理対象、15 測定装置、16 恒温槽、17 交流インピーダンスアナライザ、18 入力装置、19 表示装置、20 評価装置、21 制御部、22 記憶部、23 第1データベース、24 インピーダンス、25 開放電圧、26 測定温度、27 劣化度、28 第2データベース、30 機械学習プログラム、31 許容範囲、32 変換モデル、33 種別推定モデル、34 特性推定モデル、35 外れ値検出プログラム、36 種別推定プログラム、37 劣化判定プログラム、40 表示画面。10 evaluation system, 12 network, 13 electricity storage device, 14 processing target, 15 measurement device, 16 constant temperature chamber, 17 AC impedance analyzer, 18 input device, 19 display device, 20 evaluation device, 21 control unit, 22 storage unit, 23 No. 1 database, 24 impedance, 25 open circuit voltage, 26 measured temperature, 27 degree of deterioration, 28 second database, 30 machine learning program, 31 tolerance range, 32 conversion model, 33 type estimation model, 34 characteristic estimation model, 35 outlier detection program, 36 type estimation program, 37 deterioration determination program, 40 display screen.
Claims (17)
Translated fromJapanese第1種別の蓄電デバイスの測定因子をデータとして含む第1データベースと、前記第1種別とは異なる第2種別の蓄電デバイスの測定因子をデータとして含む第2データベースと、蓄電デバイスの測定因子を用い機械学習によりデータを変換する変換モデルと、を有し、前記変換モデルを用いて前記第1データベースのデータを前記第2データベースのデータへ変換して前記第2データベースのデータ点数を増加した変換後データベースを取得し、該変換後データベースを用いて前記第2種別の蓄電デバイスに関する評価を実行する制御部、を備えた評価装置。An evaluation device that performs evaluation of power storage devices including multiple types,
A first database containing measurement factors of a first type of electricity storage device as data, a second database containing measurement factors of a second type of electricity storage device different from the first type as data, and a measurement factor of the electricity storage device. a conversion model that converts data by machine learning, and after conversion, the data of the first database is converted to the data of the second database using the conversion model, and the number of data points of the second database is increased. An evaluation device comprising: a control unit that acquires a database and executes an evaluation regarding the second type of power storage device using the converted database.
蓄電デバイスの測定因子の測定結果を得る測定装置と、
請求項1~14のいずれか1項に記載の評価装置と、を備え、
前記制御部は、前記測定装置から前記蓄電デバイスの測定結果を取得する、評価システム。An evaluation system for evaluating electricity storage devices,
A measuring device that obtains a measurement result of a measurement factor of an electricity storage device;
An evaluation device according to any one of claims 1 to 14,
The control unit is an evaluation system that obtains a measurement result of the electricity storage device from the measurement device.
第1種別の蓄電デバイスの測定因子をデータとして含む第1データベースと、前記第1種別とは異なる第2種別の蓄電デバイスの測定因子をデータとして含む第2データベースと、蓄電デバイスの測定因子を用い機械学習によりデータを変換する変換モデルと、を有し、前記変換モデルを用いて前記第1データベースのデータを前記第2データベースのデータへ変換して前記第2データベースのデータ点数を増加した変換後データベースを取得する変換ステップと、
前記変換後データベースを用いて前記第2種別の蓄電デバイスに関する評価を実行する評価ステップと、
を含む評価方法。An evaluation method for evaluating power storage devices including multiple types, the method comprising:
A first database containing measurement factors of a first type of electricity storage device as data, a second database containing measurement factors of a second type of electricity storage device different from the first type as data, and a measurement factor of the electricity storage device. a conversion model that converts data by machine learning, and after conversion, the data of the first database is converted to the data of the second database using the conversion model, and the number of data points of the second database is increased. a conversion step to obtain a database;
an evaluation step of performing an evaluation regarding the second type of electricity storage device using the converted database;
Evaluation methods including.
Priority Applications (3)
| Application Number | Priority Date | Filing Date | Title |
|---|---|---|---|
| JP2021117063AJP7380654B2 (en) | 2021-07-15 | 2021-07-15 | Evaluation device, evaluation system, evaluation method and its program |
| US18/567,052US20240264237A1 (en) | 2021-07-15 | 2022-05-23 | Evaluation device, evaluation system, evaluation method and its storage medium |
| PCT/JP2022/021067WO2023286452A1 (en) | 2021-07-15 | 2022-05-23 | Evaluation device, evaluation system, evaluation method, and program therefor |
Applications Claiming Priority (1)
| Application Number | Priority Date | Filing Date | Title |
|---|---|---|---|
| JP2021117063AJP7380654B2 (en) | 2021-07-15 | 2021-07-15 | Evaluation device, evaluation system, evaluation method and its program |
Publications (2)
| Publication Number | Publication Date |
|---|---|
| JP2023013116A JP2023013116A (en) | 2023-01-26 |
| JP7380654B2true JP7380654B2 (en) | 2023-11-15 |
Family
ID=84919936
Family Applications (1)
| Application Number | Title | Priority Date | Filing Date |
|---|---|---|---|
| JP2021117063AActiveJP7380654B2 (en) | 2021-07-15 | 2021-07-15 | Evaluation device, evaluation system, evaluation method and its program |
Country Status (3)
| Country | Link |
|---|---|
| US (1) | US20240264237A1 (en) |
| JP (1) | JP7380654B2 (en) |
| WO (1) | WO2023286452A1 (en) |
Families Citing this family (4)
| Publication number | Priority date | Publication date | Assignee | Title |
|---|---|---|---|---|
| EP4296701B1 (en)* | 2022-06-24 | 2025-08-06 | NOVUM engineerING GmbH | Battery test system, battery test bench and server and method for assessing a battery state |
| WO2024057996A1 (en)* | 2022-09-14 | 2024-03-21 | 株式会社Gsユアサ | Electricity storage element degradation state calculating device, degradation state calculating method, degradation state calculating program, degradation state estimating device, degradation state estimating method, abnormality detecting device, and abnormality detecting method |
| KR20240136169A (en)* | 2023-03-06 | 2024-09-13 | 주식회사 엘지에너지솔루션 | Device for determining condition of component based on type of component and operating method thereof |
| CN118759230B (en)* | 2024-09-06 | 2024-11-22 | 中缆盛(青岛)智能科技有限公司 | Cable conductor resistance detection method and system applied to cable production line |
Citations (7)
| Publication number | Priority date | Publication date | Assignee | Title |
|---|---|---|---|---|
| JP2013516614A (en) | 2010-06-24 | 2013-05-13 | パナソニック株式会社 | Method and system for obtaining the degree of battery degradation |
| JP2016537702A (en) | 2013-09-27 | 2016-12-01 | ドイッチェ テレコム アーゲー | Method and system for evaluating measurements obtained from a system |
| US20170184680A1 (en) | 2015-12-29 | 2017-06-29 | Samsung Electronics Co., Ltd. | Sensor management apparatus and method |
| US20190317152A1 (en) | 2018-03-23 | 2019-10-17 | Bloom Energy Corporation | Real-time electrochemical impedance spectroscopy apparatus (eisa) testing |
| WO2020045033A1 (en) | 2018-08-28 | 2020-03-05 | 本田技研工業株式会社 | Presentation device, presentation method, and program |
| WO2020152901A1 (en) | 2019-01-21 | 2020-07-30 | 株式会社日立製作所 | Secondary battery module remaining life diagnosis method and remaining life diagnosis system |
| WO2020234980A1 (en) | 2019-05-21 | 2020-11-26 | 本田技研工業株式会社 | Information processing device, information processing method, and program |
- 2021
- 2021-07-15JPJP2021117063Apatent/JP7380654B2/enactiveActive
- 2022
- 2022-05-23WOPCT/JP2022/021067patent/WO2023286452A1/ennot_activeCeased
- 2022-05-23USUS18/567,052patent/US20240264237A1/enactivePending
Patent Citations (7)
| Publication number | Priority date | Publication date | Assignee | Title |
|---|---|---|---|---|
| JP2013516614A (en) | 2010-06-24 | 2013-05-13 | パナソニック株式会社 | Method and system for obtaining the degree of battery degradation |
| JP2016537702A (en) | 2013-09-27 | 2016-12-01 | ドイッチェ テレコム アーゲー | Method and system for evaluating measurements obtained from a system |
| US20170184680A1 (en) | 2015-12-29 | 2017-06-29 | Samsung Electronics Co., Ltd. | Sensor management apparatus and method |
| US20190317152A1 (en) | 2018-03-23 | 2019-10-17 | Bloom Energy Corporation | Real-time electrochemical impedance spectroscopy apparatus (eisa) testing |
| WO2020045033A1 (en) | 2018-08-28 | 2020-03-05 | 本田技研工業株式会社 | Presentation device, presentation method, and program |
| WO2020152901A1 (en) | 2019-01-21 | 2020-07-30 | 株式会社日立製作所 | Secondary battery module remaining life diagnosis method and remaining life diagnosis system |
| WO2020234980A1 (en) | 2019-05-21 | 2020-11-26 | 本田技研工業株式会社 | Information processing device, information processing method, and program |
Also Published As
| Publication number | Publication date |
|---|---|
| WO2023286452A1 (en) | 2023-01-19 |
| US20240264237A1 (en) | 2024-08-08 |
| JP2023013116A (en) | 2023-01-26 |
Similar Documents
| Publication | Publication Date | Title |
|---|---|---|
| JP7380654B2 (en) | Evaluation device, evaluation system, evaluation method and its program | |
| JP7153196B2 (en) | BATTERY CHARACTERISTICS EVALUATION DEVICE AND BATTERY CHARACTERISTICS EVALUATION METHOD | |
| Chang et al. | Micro-fault diagnosis of electric vehicle batteries based on the evolution of battery consistency relative position | |
| Zhao et al. | Data-driven lithium-ion battery degradation evaluation under overcharge cycling conditions | |
| JP2022139501A (en) | Deterioration determination device, deterioration determination system, deterioration determination method and its program | |
| US20120019253A1 (en) | Method for determining an aging condition of a battery cell by means of impedance spectroscopy | |
| JP7396244B2 (en) | Deterioration determination device, deterioration determination system, deterioration determination method and its program | |
| JP6342612B2 (en) | Secondary battery diagnostic device and secondary battery diagnostic method | |
| Salinas et al. | A second life for li-ion cells rescued from notebook batteries | |
| JP2023543747A (en) | Battery diagnostic device and method | |
| Song et al. | Series-connected lithium-ion battery pack health modeling with cell inconsistency evaluation | |
| Chen et al. | Lithium plating detection of lithium-ion batteries based on the improved variance entropy algorithm | |
| Zhang et al. | Online lithium plating detection based on charging internal resistance for lithium-ion batteries | |
| Bruj et al. | Lifecycle Evaluation of Lithium-Ion Batteries Under Fast Charging and Discharging Conditions. | |
| Narula | Modeling of ageing of lithium-ion battery at low temperaturas | |
| Chen et al. | Impedance estimation for lithium-ion battery using support vector regression and cuckoo search algorithm | |
| Oeser | From the production of the single cell to the end of life of the battery module: the development of parameter variation of lithium-ion cells | |
| Anekal et al. | Wide-ranging parameter extraction of lithium-ion batteries to estimate state of health using electrochemical impedance spectroscopy | |
| Lin et al. | Research on inconsistency identification of Lithium-ion battery pack based on operational data | |
| Patrizi et al. | Life Cycle Analysis of Lithium Batteries for Smart Grids using Electrochemical Impedance Spectroscopy Data | |
| KR102803936B1 (en) | Method for diagnosing lithium plating in lithium ion batteries using electrochemical impedance spectroscopy | |
| CN116487676A (en) | Single-chip battery and screening method of battery materials | |
| Sohaib et al. | Identifying Failure Conditions In Li-Ion Batteries Using Distribution of Relaxation Time Method | |
| Cheng et al. | Two-step square wave testing: A 110-second method for diagnosing internal short circuit and two states of lithium-ion batteries | |
| Rasentharah et al. | Lithium Iron Phosphate (LiFePo4) Batteries Health Prognosis via Plateau Identification During High-Rate Charging and Discharging |
Legal Events
| Date | Code | Title | Description |
|---|---|---|---|
| A621 | Written request for application examination | Free format text:JAPANESE INTERMEDIATE CODE: A621 Effective date:20221021 | |
| TRDD | Decision of grant or rejection written | ||
| A01 | Written decision to grant a patent or to grant a registration (utility model) | Free format text:JAPANESE INTERMEDIATE CODE: A01 Effective date:20231003 | |
| A61 | First payment of annual fees (during grant procedure) | Free format text:JAPANESE INTERMEDIATE CODE: A61 Effective date:20231016 | |
| R150 | Certificate of patent or registration of utility model | Ref document number:7380654 Country of ref document:JP Free format text:JAPANESE INTERMEDIATE CODE: R150 |