JP7364857B2 - Position detection system, sensor terminal and position detection method - Google Patents
Position detection system, sensor terminal and position detection methodDownload PDFInfo
- Publication number
- JP7364857B2 JP7364857B2JP2019103649AJP2019103649AJP7364857B2JP 7364857 B2JP7364857 B2JP 7364857B2JP 2019103649 AJP2019103649 AJP 2019103649AJP 2019103649 AJP2019103649 AJP 2019103649AJP 7364857 B2JP7364857 B2JP 7364857B2
- Authority
- JP
- Japan
- Prior art keywords
- satellite
- sensor terminal
- satellites
- search
- captured
- Prior art date
- Legal status (The legal status is an assumption and is not a legal conclusion. Google has not performed a legal analysis and makes no representation as to the accuracy of the status listed.)
- Active
Links
Images


Classifications
- G—PHYSICS
- G01—MEASURING; TESTING
- G01S—RADIO DIRECTION-FINDING; RADIO NAVIGATION; DETERMINING DISTANCE OR VELOCITY BY USE OF RADIO WAVES; LOCATING OR PRESENCE-DETECTING BY USE OF THE REFLECTION OR RERADIATION OF RADIO WAVES; ANALOGOUS ARRANGEMENTS USING OTHER WAVES
- G01S19/00—Satellite radio beacon positioning systems; Determining position, velocity or attitude using signals transmitted by such systems
- G01S19/01—Satellite radio beacon positioning systems transmitting time-stamped messages, e.g. GPS [Global Positioning System], GLONASS [Global Orbiting Navigation Satellite System] or GALILEO
- G01S19/03—Cooperating elements; Interaction or communication between different cooperating elements or between cooperating elements and receivers
- G01S19/09—Cooperating elements; Interaction or communication between different cooperating elements or between cooperating elements and receivers providing processing capability normally carried out by the receiver
- G—PHYSICS
- G01—MEASURING; TESTING
- G01S—RADIO DIRECTION-FINDING; RADIO NAVIGATION; DETERMINING DISTANCE OR VELOCITY BY USE OF RADIO WAVES; LOCATING OR PRESENCE-DETECTING BY USE OF THE REFLECTION OR RERADIATION OF RADIO WAVES; ANALOGOUS ARRANGEMENTS USING OTHER WAVES
- G01S19/00—Satellite radio beacon positioning systems; Determining position, velocity or attitude using signals transmitted by such systems
- G01S19/01—Satellite radio beacon positioning systems transmitting time-stamped messages, e.g. GPS [Global Positioning System], GLONASS [Global Orbiting Navigation Satellite System] or GALILEO
- G01S19/13—Receivers
- G01S19/24—Acquisition or tracking or demodulation of signals transmitted by the system
- G01S19/28—Satellite selection
- G—PHYSICS
- G01—MEASURING; TESTING
- G01S—RADIO DIRECTION-FINDING; RADIO NAVIGATION; DETERMINING DISTANCE OR VELOCITY BY USE OF RADIO WAVES; LOCATING OR PRESENCE-DETECTING BY USE OF THE REFLECTION OR RERADIATION OF RADIO WAVES; ANALOGOUS ARRANGEMENTS USING OTHER WAVES
- G01S19/00—Satellite radio beacon positioning systems; Determining position, velocity or attitude using signals transmitted by such systems
- G01S19/01—Satellite radio beacon positioning systems transmitting time-stamped messages, e.g. GPS [Global Positioning System], GLONASS [Global Orbiting Navigation Satellite System] or GALILEO
- G01S19/03—Cooperating elements; Interaction or communication between different cooperating elements or between cooperating elements and receivers
- G01S19/05—Cooperating elements; Interaction or communication between different cooperating elements or between cooperating elements and receivers providing aiding data
- G01S19/06—Cooperating elements; Interaction or communication between different cooperating elements or between cooperating elements and receivers providing aiding data employing an initial estimate of the location of the receiver as aiding data or in generating aiding data
- G—PHYSICS
- G01—MEASURING; TESTING
- G01S—RADIO DIRECTION-FINDING; RADIO NAVIGATION; DETERMINING DISTANCE OR VELOCITY BY USE OF RADIO WAVES; LOCATING OR PRESENCE-DETECTING BY USE OF THE REFLECTION OR RERADIATION OF RADIO WAVES; ANALOGOUS ARRANGEMENTS USING OTHER WAVES
- G01S19/00—Satellite radio beacon positioning systems; Determining position, velocity or attitude using signals transmitted by such systems
- G01S19/01—Satellite radio beacon positioning systems transmitting time-stamped messages, e.g. GPS [Global Positioning System], GLONASS [Global Orbiting Navigation Satellite System] or GALILEO
- G01S19/13—Receivers
- G01S19/24—Acquisition or tracking or demodulation of signals transmitted by the system
- G01S19/246—Acquisition or tracking or demodulation of signals transmitted by the system involving long acquisition integration times, extended snapshots of signals or methods specifically directed towards weak signal acquisition
- G—PHYSICS
- G01—MEASURING; TESTING
- G01S—RADIO DIRECTION-FINDING; RADIO NAVIGATION; DETERMINING DISTANCE OR VELOCITY BY USE OF RADIO WAVES; LOCATING OR PRESENCE-DETECTING BY USE OF THE REFLECTION OR RERADIATION OF RADIO WAVES; ANALOGOUS ARRANGEMENTS USING OTHER WAVES
- G01S19/00—Satellite radio beacon positioning systems; Determining position, velocity or attitude using signals transmitted by such systems
- G01S19/01—Satellite radio beacon positioning systems transmitting time-stamped messages, e.g. GPS [Global Positioning System], GLONASS [Global Orbiting Navigation Satellite System] or GALILEO
- G01S19/13—Receivers
- G01S19/24—Acquisition or tracking or demodulation of signals transmitted by the system
- G01S19/25—Acquisition or tracking or demodulation of signals transmitted by the system involving aiding data received from a cooperating element, e.g. assisted GPS
- G01S19/254—Acquisition or tracking or demodulation of signals transmitted by the system involving aiding data received from a cooperating element, e.g. assisted GPS relating to Doppler shift of satellite signals
- G—PHYSICS
- G01—MEASURING; TESTING
- G01S—RADIO DIRECTION-FINDING; RADIO NAVIGATION; DETERMINING DISTANCE OR VELOCITY BY USE OF RADIO WAVES; LOCATING OR PRESENCE-DETECTING BY USE OF THE REFLECTION OR RERADIATION OF RADIO WAVES; ANALOGOUS ARRANGEMENTS USING OTHER WAVES
- G01S19/00—Satellite radio beacon positioning systems; Determining position, velocity or attitude using signals transmitted by such systems
- G01S19/01—Satellite radio beacon positioning systems transmitting time-stamped messages, e.g. GPS [Global Positioning System], GLONASS [Global Orbiting Navigation Satellite System] or GALILEO
- G01S19/13—Receivers
- G01S19/24—Acquisition or tracking or demodulation of signals transmitted by the system
- G01S19/26—Acquisition or tracking or demodulation of signals transmitted by the system involving a sensor measurement for aiding acquisition or tracking
- G—PHYSICS
- G01—MEASURING; TESTING
- G01S—RADIO DIRECTION-FINDING; RADIO NAVIGATION; DETERMINING DISTANCE OR VELOCITY BY USE OF RADIO WAVES; LOCATING OR PRESENCE-DETECTING BY USE OF THE REFLECTION OR RERADIATION OF RADIO WAVES; ANALOGOUS ARRANGEMENTS USING OTHER WAVES
- G01S19/00—Satellite radio beacon positioning systems; Determining position, velocity or attitude using signals transmitted by such systems
- G01S19/01—Satellite radio beacon positioning systems transmitting time-stamped messages, e.g. GPS [Global Positioning System], GLONASS [Global Orbiting Navigation Satellite System] or GALILEO
- G01S19/13—Receivers
- G01S19/24—Acquisition or tracking or demodulation of signals transmitted by the system
- G01S19/29—Acquisition or tracking or demodulation of signals transmitted by the system carrier including Doppler, related
- G—PHYSICS
- G01—MEASURING; TESTING
- G01S—RADIO DIRECTION-FINDING; RADIO NAVIGATION; DETERMINING DISTANCE OR VELOCITY BY USE OF RADIO WAVES; LOCATING OR PRESENCE-DETECTING BY USE OF THE REFLECTION OR RERADIATION OF RADIO WAVES; ANALOGOUS ARRANGEMENTS USING OTHER WAVES
- G01S19/00—Satellite radio beacon positioning systems; Determining position, velocity or attitude using signals transmitted by such systems
- G01S19/01—Satellite radio beacon positioning systems transmitting time-stamped messages, e.g. GPS [Global Positioning System], GLONASS [Global Orbiting Navigation Satellite System] or GALILEO
- G01S19/13—Receivers
- G01S19/24—Acquisition or tracking or demodulation of signals transmitted by the system
- G01S19/30—Acquisition or tracking or demodulation of signals transmitted by the system code related
- G—PHYSICS
- G01—MEASURING; TESTING
- G01S—RADIO DIRECTION-FINDING; RADIO NAVIGATION; DETERMINING DISTANCE OR VELOCITY BY USE OF RADIO WAVES; LOCATING OR PRESENCE-DETECTING BY USE OF THE REFLECTION OR RERADIATION OF RADIO WAVES; ANALOGOUS ARRANGEMENTS USING OTHER WAVES
- G01S19/00—Satellite radio beacon positioning systems; Determining position, velocity or attitude using signals transmitted by such systems
- G01S19/01—Satellite radio beacon positioning systems transmitting time-stamped messages, e.g. GPS [Global Positioning System], GLONASS [Global Orbiting Navigation Satellite System] or GALILEO
- G01S19/13—Receivers
- G01S19/34—Power consumption
Landscapes
- Engineering & Computer Science (AREA)
- Radar, Positioning & Navigation (AREA)
- Remote Sensing (AREA)
- Computer Networks & Wireless Communication (AREA)
- Physics & Mathematics (AREA)
- General Physics & Mathematics (AREA)
- Position Fixing By Use Of Radio Waves (AREA)
Description
Translated fromJapanese本件は、位置検知システム、センサ端末および位置検知方法に関する。 The present case relates to a position detection system, a sensor terminal, and a position detection method.
人工衛星からの衛星信号を用いて、測位する技術が開示されている。1軌道上で複数の人工衛星が周回する場合、1つの人口衛星が捕捉されても、他の人口衛星が捕捉されるわけではない。そこで、各衛星間の相対位置情報を基に、次に探索する衛星を選択する技術が開示されている(例えば、特許文献1,2参照)。 Techniques for positioning using satellite signals from artificial satellites have been disclosed. When multiple artificial satellites orbit in one orbit, even if one artificial satellite is captured, other artificial satellites are not captured. Therefore, a technique has been disclosed in which a satellite to be searched for next is selected based on relative position information between each satellite (see, for example, Patent Documents 1 and 2).
しかしながら、次に探索する衛星を衛星間の相対位置情報から選択する場合、捕捉される確率が低い衛星が選択されるなど、探索範囲を絞り込めない場合がある。 However, when selecting the next satellite to search from the relative position information between the satellites, there are cases where the search range cannot be narrowed down, such as when a satellite with a low probability of being captured is selected.
1つの側面では、本発明は、衛星の探索範囲を絞り込むことができる位置検知システム、センサ端末および位置検知方法を提供することを目的とする。 In one aspect, the present invention aims to provide a position detection system, a sensor terminal, and a position detection method that can narrow down the search range for satellites.
1つの態様では、位置検知システムは、探索対象の衛星を順番に定め、当該順番に従い、探索対象の衛星からの衛星信号に対して捕捉処理を行うことで得られた信号を送信するセンサ端末と、前記センサ端末が送信する信号に基づいて、前記センサ端末の位置を演算する演算装置と、を備え、前記センサ端末は、1つ目の探索対象を定める際に、当該1つ目の衛星が捕捉される場合の他の衛星の発見確率が高いほどもしくは低いほど大きく反映される指標を用い、2つ目以降の探索対象については、特定の推定法に基づいて発見確率が最も高い衛星を定める。 In one embodiment, the position detection system includes a sensor terminal that sequentially determines satellites to be searched for, and transmits signals obtained by performing acquisition processing on satellite signals from the satellites to be searched according to the order. , an arithmetic device that calculates the position of the sensor terminal based on a signal transmitted by the sensor terminal, and the sensor terminal is configured to detect the position of the first satellite when determining the first search target. Using an index that reflects the higher or lower probability of discovery of other satellites when captured, for the second and subsequent search targets, determine the satellite with the highest probability of discovery based on a specific estimation method. .
1つの態様では、センサ端末は、探索対象の衛星を順番に指示する衛星指示部と、前記衛星指示部が指示した順番に従い、探索対象の衛星からの衛星信号に対して捕捉処理を行う捕捉処理部と、を備え、前記衛星指示部は、1つ目の探索対象を定める際に、当該1つ目の衛星が捕捉される場合の他の衛星の発見確率が高いほどもしくは低いほど大きく反映される指標を用い、2つ目以降の探索対象については、特定の推定法に基づいて発見確率が最も高い衛星を定める。 In one aspect, the sensor terminal includes a satellite instruction unit that sequentially instructs satellites to be searched, and an acquisition process that performs an acquisition process on satellite signals from the satellites to be searched in accordance with the order instructed by the satellite instruction unit. and the satellite instruction unit, when determining the first search target, the higher or lower the probability of finding other satellites when the first satellite is captured, the more the probability is reflected. For the second and subsequent search targets, the satellite with the highest probability of discovery is determined based on a specific estimation method.
衛星の探索範囲を絞り込むことができる。 The satellite search range can be narrowed down.
以下、図面を参照しつつ、実施例について説明する。 Examples will be described below with reference to the drawings.
例えば、GNSS(Global Navigation Satellite System)の一種であるGPS(Global Positioning System)受信用のセンサ端末は、消費電力が大きいため、大きなバッテリが積まれることになる。この構成では、センサ端末の小型化および軽量化が阻害される。小さなバッテリを用いると、センサ端末の動作可能時間が短くなる。この構成では、バッテリ交換によるメンテナンスコストの増大を招く。GPS受信用のセンサ端末の消費電力が大きい理由は、衛星信号のデータレートが50bpsと低く、センサ端末が衛星信号を受信するための動作時間が30秒~12.5分と長くなるためである。 For example, a sensor terminal for receiving GPS (Global Positioning System), which is a type of GNSS (Global Navigation Satellite System), consumes a large amount of power, so a large battery is required. This configuration hinders miniaturization and weight reduction of the sensor terminal. Using a small battery reduces the operating time of the sensor terminal. This configuration increases maintenance costs due to battery replacement. The reason why the power consumption of the sensor terminal for GPS reception is high is that the data rate of the satellite signal is low at 50 bps, and the operating time for the sensor terminal to receive the satellite signal is long, 30 seconds to 12.5 minutes. .
この課題を解決する手段としてスナップショット測位と呼ばれる技術が開発されている。この技術は、数10msec程度と短い時間だけセンサ端末を動作させ、この間に得られるコード位相およびドップラ周波数を用いて測位演算を行うものである。測位演算に必要なエフェメリス(衛星軌道データ)等はネット上から取得し、測位演算もクラウド上で行う方式が提案されている。 A technique called snapshot positioning has been developed as a means to solve this problem. In this technique, a sensor terminal is operated for a short period of about several tens of milliseconds, and positioning calculations are performed using the code phase and Doppler frequency obtained during this period. A method has been proposed in which the ephemeris (satellite orbit data) necessary for positioning calculations is obtained from the Internet, and the positioning calculations are also performed on the cloud.
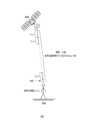
図1で例示するように、スナップショット受信では、GNSS衛星からセンサ端末までの信号伝搬時間のうち、ミリ秒を単位とした場合の整数値の部分の情報を得ることが困難である。この整数値が得られないと、センサ端末の測位演算を行うことが困難である。そこで、受信信号のドップラ周波数を用いて大まかな位置の絞り込みを行う。さらに、センサ端末からコード位相およびドップラ周波数を受信する中継装置(受信局)の位置を用いて、センサ端末の位置を正確に測定できるようになる。 As illustrated in FIG. 1, in snapshot reception, it is difficult to obtain information about an integer value in milliseconds of the signal propagation time from the GNSS satellite to the sensor terminal. If this integer value is not obtained, it is difficult to perform positioning calculations for the sensor terminal. Therefore, the rough location is narrowed down using the Doppler frequency of the received signal. Furthermore, the position of the sensor terminal can be accurately measured using the position of the relay device (receiving station) that receives the code phase and Doppler frequency from the sensor terminal.
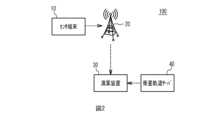
図2は、実施例1に係る位置検知システム100について例示するブロック図である。図2で例示するように、位置検知システム100は、センサ端末10、中継装置20、演算装置30などを備える。 FIG. 2 is a block diagram illustrating the
図3は、センサ端末10について例示するブロック図である。センサ端末10は、GNSSセンサ端末である。図3で例示するように、センサ端末10は、フロントエンド部11、ベースバンド部12、送受信機13、制御部14、AFE電源コントローラ15、BB電源コントローラ16、TR電源コントローラ17などを備える。制御部14は、相関テーブル格納部51、探索衛星指示部52、探索範囲指示部53などを備える。 FIG. 3 is a block diagram illustrating the
図4は、中継装置20について例示するブロック図である。中継装置20は、LPWA(Low Power Wide Area)の基地局、アクセスポイントまたはゲートウェイである。図2(b)で例示するように、中継装置20は、信号受信部21、記憶装置22、GNSS受信部23、測位演算部24、タイマ25、送信機26などを備える。中継装置20は、複数設けられている。各中継装置20は、異なる箇所に配置されている。 FIG. 4 is a block diagram illustrating the
センサ端末10は、無線で信号を送受信する。中継装置20は、センサ端末10から受信したスナップショットGNSS信号に、自身の位置情報等の情報を付加し、演算装置30に送信する。中継装置20は、無線で信号を送信してもよく、有線で信号を送信してもよく、無線および有線の両方を用いて信号を送信してもよい。演算装置30は、中継装置20から受信した信号を用いて、センサ端末10の初期位置を算出する。 The
まず、フロントエンド部11は、アナログフロントエンドとしての機能を有し、GNSS衛星からのGNSS衛星信号をスナップショット受信し、受信したGNSS衛星信号をデジタルIQサンプルに変換する。IQサンプルとは、GNSS衛星信号をRF(Radio Frequency)周波数帯からIF(Intermediate Frequency)周波数帯にダウンコンバートし、帯域制限フィルタを通した後にアナログ・デジタル変換を施して得られる信号である。IとQの二つの直交位相でダウンコンバートすることから、IQサンプルと呼ばれる。 First, the front end unit 11 has a function as an analog front end, receives a snapshot of a GNSS satellite signal from a GNSS satellite, and converts the received GNSS satellite signal into a digital IQ sample. An IQ sample is a signal obtained by down-converting a GNSS satellite signal from an RF (Radio Frequency) frequency band to an IF (Intermediate Frequency) frequency band, passing it through a band-limiting filter, and then performing analog-to-digital conversion. It is called an IQ sample because it is down-converted with two orthogonal phases, I and Q.
ベースバンド部12は、フロントエンド部11から受信したIQサンプルからベースバンド処理によりrawデータを算出し、算出したrawデータを出力する。rawデータとは、GNSS衛星信号から得られたIQサンプルに対して、ベースバンド処理(衛星捕捉処理)を行って得られる、コード位相およびドップラ周波数である。捕捉されるGNSS衛星の数だけ、これら2種類の値が算出されることになる。コード位相とは、GNSS衛星からセンサ端末10までの信号伝搬遅延のうち、1msecを単位とした場合の少数部を表す。送受信機13は、ベースバンド部12が出力したrawデータを、スナップショットGNSS信号として無線で送信する。 The
なお、AFE電源コントローラ15は、アナログフロントエンドとして機能するフロントエンド部11の電源のオンオフを制御する。それにより、必要な期間以外のフロントエンド部11の電力消費を抑制することができる。BB電源コントローラ16は、ベースバンド処理を行うベースバンド部12の電源のオンオフを制御する。それにより、必要な期間以外のベースバンド部12の電力消費を抑制することができる。TR電源コントローラ17は、送受信機13の電源のオンオフを制御する。それにより、必要な期間以外の送受信機13の電力消費を抑制することができる。 Note that the AFE power supply controller 15 controls power on/off of the front end section 11 functioning as an analog front end. Thereby, power consumption of the front end section 11 during periods other than the required period can be suppressed. The
信号受信部21は、センサ端末10から送信されたrawデータを受信する。信号受信部21は、rawデータに含まれるコード位相およびドップラ周波数を抽出して記憶装置22に記憶させる。GNSS受信部23は、GNSS衛星からのGNSS衛星信号を受信する。この場合、GNSS受信部23は、スナップショット受信を行うのではなく、信号伝搬時間の整数値および小数値の両方を受信する。測位演算部24は、GNSS受信部23が受信したGNSS衛星信号を用いて、中継装置20の位置を算出し、記憶装置22に記憶させる。タイマ25は、時刻情報(現在時間など)を記憶装置22に記憶させる。記憶装置22は、信号受信部21から受け取ったコード位相およびドップラ周波数と、測位演算部24から受け取った中継装置20の位置とを、タイマ25から受け取った時刻情報に関連付けて記憶する。すなわち、記憶装置22は、rawデータに、中継装置20の位置情報と、時刻情報とを付加する。送信機26は、記憶装置22に記憶された情報を送信する。 The
演算装置30は、NASAなどのネット上の衛星軌道サーバ40から衛星軌道情報を取得し、中継装置20から送信された情報と併せて測位演算を行う。この測位演算においては、演算装置30は、コード位相およびドップラ周波数を用いてセンサ端末10の位置を演算する。この場合、Shadow Locationが残る。しかしながら、本実施例においては、演算装置30は、測位結果候補のうち、センサ端末10からスナップショットGNSS信号を受信した中継装置20の位置情報を用いることで、GNSS信号の整数値を正しい値に絞り込むことができる。例えば、LPWAのように通信距離が数km程度である場合、どの中継装置20がセンサ端末10から信号を受信したかを取得することで、Shadow Locationを生成するような整数値の組み合わせを排除することができる。それにより、演算装置30は、センサ端末10の初期位置を推定することができる。 The
次に、センサ端末10による衛星捕捉処理の一例について説明する。センサ端末10は、探索対象の衛星を順番に定め、当該順番に従い、探索対象の衛星からの衛星信号に対して捕捉処理を行う。衛星は、例えば地表に対して3.9km/sといった高速で相対移動するため、図5の上図で例示するように、各衛星の探索のために全ての周波数binを探索することが考えられる。図5においては、網掛けの各区画は、各衛星について探索した各周波数binを表す。「○」は、衛星が捕捉された周波数binを例示する。全ての衛星について探索を行うと、演算量が多くなってしまう。また、全ての周波数binを探索すると、演算量が多くなってしまう。 Next, an example of satellite acquisition processing by the
そこで、図5の下図で例示するように、捕捉される確率(発見確率)が高い衛星についてのみ探索すれば、演算量が低減される。そこで、捕捉された衛星から、次に発見確率の高い衛星を導くアルゴリズムが望まれる。さらに、衛星が捕捉される確率の高い周波数binの範囲のみ探索すれば、演算量がさらに低減されることになる。 Therefore, as illustrated in the lower diagram of FIG. 5, the amount of calculation can be reduced by searching only for satellites with a high probability of being captured (probability of discovery). Therefore, an algorithm is desired that guides the satellite with the next highest detection probability from the captured satellites. Furthermore, if only the frequency bin range with a high probability of being captured by a satellite is searched, the amount of calculation can be further reduced.
地表のある地点において、全ての衛星が捕捉されるわけではない。例えば、1軌道上において5機以上の衛星が周回する場合、当該軌道上の衛星のうち同一時刻に捕捉される衛星は最大で3機程度である。例えば、図6(a)の例では、2つの衛星が同一時刻で見える一方で、残りの3つの衛星は見えない。したがって、見えないと予測される衛星については探索対象から除外されることが好ましい。 Not all satellites are captured at a given point on the Earth's surface. For example, when five or more satellites orbit in one orbit, the number of satellites on the orbit that can be captured at the same time is about three at most. For example, in the example of FIG. 6(a), two satellites are visible at the same time, while the remaining three satellites are not visible. Therefore, satellites that are predicted to be invisible are preferably excluded from search targets.
また、それぞれの衛星の相対位置関係は不変であるため、ドップラ周波数も予測可能である。例えば、図6(b)の例では、一方の衛星が負のドップラ周波数を有する場合には、他方の衛星は正のドップラ周波数を有すると予測される。別軌道に位置する衛星についても、周回周期が近いため、位置に相関関係がある。 Furthermore, since the relative positional relationship of each satellite remains unchanged, the Doppler frequency can also be predicted. For example, in the example of FIG. 6(b), if one satellite has a negative Doppler frequency, the other satellite is predicted to have a positive Doppler frequency. Satellites located in different orbits also have similar orbital periods, so there is a correlation in their positions.
ところで、GNSS/GPSの初期fix時間を減少させる手法として、外部から補助情報を与える技術や、各衛星の相対位置を覚えておいて見つかった衛星に応じて相対位置が近い衛星を調べる技術が挙げられる。しかしながら、本実施例においては、センサ端末10自体は測位を行なわず、必要が無いときは電源がオフになっている。したがって、センサ端末10自身が、自分がどこにいるのか、現在時刻が何時であるかを知らない。また、GPS放送信号上にある衛星軌道情報は使用できない。取得出来るデータは、捕捉した衛星のコード位相およびドップラ周波数である。 By the way, as methods to reduce the initial fix time of GNSS/GPS, there are techniques to provide auxiliary information from outside, and techniques to memorize the relative position of each satellite and search for satellites whose relative positions are close according to the found satellite. It will be done. However, in this embodiment, the
前処理の結果として、ある地点では衛星が図7のように見えたとする。横軸は、一定の時間間隔での経過時間を表す。したがって、右に進むほど、後の時間になる。衛星1については、8点の時刻で捕捉されている。衛星2については、7点の時刻で捕捉されている。衛星3については、9点の時刻で捕捉されている。衛星32については、6点の時刻で捕捉されている。これらの時刻点数は、時間期間に対応する。 Assume that as a result of preprocessing, the satellite looks like the one shown in FIG. 7 at a certain point. The horizontal axis represents elapsed time at constant time intervals. Therefore, the further to the right you go, the later in time you are. Satellite 1 is captured at eight times. Satellite 2 is captured at seven times. Satellite 3 is captured at nine times. Satellite 32 is captured at six times. These time points correspond to time periods.
衛星1の8点に対して衛星2の4点が重複している。この場合、衛星1についての衛星2の可視相関係数C1,2を、4/8=0.5とする。次に、衛星2の7点に対して衛星1の4点が重複している。この場合、衛星2についての衛星1の可視相関係数C2,1を、4/7=0.57とする。このように、Cm,nは、衛星mが捕捉された時刻点数に対する、衛星nが捕捉された重複時刻点数の比を表すこととする。8 points of Satellite 1 and 4 points of Satellite 2 overlap. In this case, the visible correlation coefficient C1,2 of satellite 2 with respect to satellite 1 is set to 4/8=0.5. Next, 4 points of satellite 1 overlap with 7 points of satellite 2. In this case, let the visible correlation coefficient C2,1 of satellite 1 with respect to satellite 2 be 4/7=0.57. In this way, Cm,n represents the ratio of the number of overlapping time points at which satellite n is captured to the number of time points at which satellite m is captured.
相関テーブル格納部51は、これらの可視相関係数のテーブルを格納している。可視相関係数は、事前の計算によって取得しておくことができる。可視相関係数は、ドップラ周波数テーブルから作成することができる。ドップラ周波数テーブルも、事前の計算によって取得しておくことができる。 The correlation
図8は、ドップラ周波数テーブルの作成フローを例示する図である。図8で例示するように、まず、衛星軌道サーバ40から衛星軌道情報を取得し、対象とする衛星の座標を取得する(ステップS1)。次に、当該衛星の衛星方位および高度を計算する(ステップS2)。次に、ステップS2で計算された高度が0以上であるか否かを判定する(ステップS3)。高度が0以上であることは、衛星が見えることを意味する。高度が0以上でなければ、衛星が見えないことを意味する。 FIG. 8 is a diagram illustrating a flow of creating a Doppler frequency table. As illustrated in FIG. 8, first, satellite orbit information is acquired from the
ステップS3で「Yes」の場合には、ドップラ周波数を計算する(ステップS4)。ステップS3で「No」の場合には、ドップラ周波数を欠損値とみなす(ステップS5)。ステップS4またはステップS5の実行後、ドップラ周波数テーブルに、対象とする衛星と、観測緯度経度および観測時刻と、ドップラ周波数とを関連づけて記録する(ステップS6)。以上のステップS1~ステップS6を、経度-180°から+180°までの30°ごとに、緯度-90°から+90°までの30°ごとに、1年前から現在までの1時間ごとの指定時刻で、衛星番号1から32まで、繰り返し実行する。それにより、各緯度、各経度で、指定時刻の衛星ごとのドップラ周波数を取得することができる。 If "Yes" in step S3, the Doppler frequency is calculated (step S4). If "No" in step S3, the Doppler frequency is regarded as a missing value (step S5). After executing step S4 or step S5, the target satellite, observation latitude and longitude, observation time, and Doppler frequency are recorded in association with each other in a Doppler frequency table (step S6). The above steps S1 to S6 are performed every 30 degrees from -180° to +180° longitude, every 30° from latitude -90° to +90°, and at specified times every hour from one year ago to the present. Then, repeat the execution for satellite numbers 1 to 32. Thereby, it is possible to obtain the Doppler frequency of each satellite at the specified time at each latitude and each longitude.
図9は、可視相関テーブルの作成フローを例示する図である。図9で例示するように、衛星番号1と衛星番号2とが異なる番号であるか否かを判定する(ステップS11)。ステップS11の実行によって、同じ衛星についての可視相関係数の計算を回避することができる。ステップS11で「Yes」と判定された場合、全数=0とし、相関数=0とする(ステップS12)。 FIG. 9 is a diagram illustrating a flow of creating a visible correlation table. As illustrated in FIG. 9, it is determined whether satellite number 1 and satellite number 2 are different numbers (step S11). By performing step S11, calculation of visible correlation coefficients for the same satellite can be avoided. If it is determined "Yes" in step S11, the total number is set to 0 and the number of correlations is set to 0 (step S12).
次に、ドップラ周波数テーブルを参照し、指定時刻において、衛星番号1のドップラ周波数が存在するか否かを判定する(ステップS13)。ステップS13で「Yes」と判定された場合、ドップラ周波数テーブルを参照し、当該指定時刻において、衛星番号2のドップラ周波数が存在するか否かを判定する(ステップS14)。ステップS14で「Yes」と判定された場合、相関数に1を足し合わせる(ステップS15)。 Next, referring to the Doppler frequency table, it is determined whether or not the Doppler frequency of satellite number 1 exists at the specified time (step S13). If it is determined "Yes" in step S13, the Doppler frequency table is referred to and it is determined whether or not the Doppler frequency of satellite number 2 exists at the specified time (step S14). If the determination in step S14 is "Yes", 1 is added to the correlation number (step S15).
ステップS15の実行後、またはステップS14で「No」と判定された場合、全数に1を足し合わせる(ステップS16)。ステップS13~ステップS16を、1年前から現在までの1時間ごとの指定時刻について繰り返し実行する。次に、相関数/全数を、衛星番号1について衛星番号2の可視相関係数として記録する(ステップS17)。ステップS11~ステップS17を、衛星番号1について1~32まで、衛星番号2について1~32まで、繰り返し実行する。それにより、全ての可視相関係数を含む可視相関テーブルを作成することができる。この可視相関テーブルは、相関テーブル格納部51に格納される。 After executing step S15, or if the determination is "No" in step S14, 1 is added to the total number (step S16). Steps S13 to S16 are repeatedly executed for hourly designated times from one year ago to the present. Next, the correlation number/total number is recorded as the visible correlation coefficient of satellite number 2 for satellite number 1 (step S17). Steps S11 to S17 are repeatedly executed for satellite number 1 from 1 to 32 and for satellite number 2 from 1 to 32. Thereby, a visible correlation table containing all visible correlation coefficients can be created. This visible correlation table is stored in the correlation
探索衛星指示部52は、相関テーブル格納部51に格納された可視相関係数テーブルを参照することで、探索対象の衛星番号をベースバンド部12に指示する。例えば、探索衛星指示部52は、1つ目の探索対象を定める際に、下記式(1)に従って弁別度Dsatを計算し、最もDsatが高い衛星satの全周波数binの探索をベースバンド部12に指示する。なお、下記式(1)において、satは衛星番号であり、Cm,nは、衛星mについての衛星nの可視相関係数であって、衛星mが捕捉された時刻点数に対する、衛星nが捕捉された重複時刻点数の比を表す。
可視相関係数が0.5から離れるほど、スコアが高くなる。例えば、可視相関係数が1に近いと、衛星mを見つけた場合に、衛星nを見つけられる発見確率が高くなる。一方、可視相関係数が0に近いと、衛星mを見つけた場合に、衛星nを見つけられる発見確率が低くなる。このように、弁別度Dsatは、1つ目の衛星が捕捉される場合の他の衛星の発見確率が高いほどもしくは低いほど大きく反映される指標である。弁別度Dsatを用いることで、2つ目以降の探索が収束しやすくなる。The further away the visible correlation coefficient is from 0.5, the higher the score. For example, when the visible correlation coefficient is close to 1, the discovery probability of finding satellite n when satellite m is found increases. On the other hand, when the visible correlation coefficient is close to 0, the discovery probability of finding satellite n when satellite m is found becomes low. In this way, the degree of discrimination Dsat is an index that is more reflected as the probability of finding other satellites when the first satellite is captured is higher or lower. By using the discrimination degree Dsat , it becomes easier for the second and subsequent searches to converge.
衛星nの発見確率をSnとする。発見確率Snの初期値は、1とする。1つ前に探索した衛星mが見つかった場合には、Sn=Sn×Cm,nとして発見確率を再計算する。この場合の「n」は、m以外の全ての衛星番号を表す。1つ前に探索した衛星mが見つからなかった場合には、Sn=Sn×(1-Cm,n)として発見確率を再計算する。今まで探索していない衛星のうち、Snが最も高いものを次の候補とする。Let Sn be the discovery probability of satellite n. The initial value of the discovery probability Sn is 1. If the previously searched satellite m is found, the discovery probability is recalculated as Sn =Sn ×Cm,n . "n" in this case represents all satellite numbers other than m. If the previously searched satellite m is not found, the probability of discovery is recalculated as Sn =Sn ×(1−Cm,n ). Among the satellites that have not been searched so far, the one with the highest Sn is selected as the next candidate.
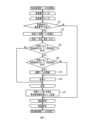
図10は、制御部14の動作を整理したフローチャートを例示する図である。図10で例示するように、探索衛星指示部52は、相関テーブル格納部51が格納している可視相関テーブルを参照し、1つ目の探索対象である初期探索衛星を決定する(ステップS21)。この場合、探索衛星指示部52は、上記式(1)に従って弁別度Dsatを計算し、最もDsatが高い衛星satを決定し、ベースバンド部12に当該衛星の捕捉を指示する。FIG. 10 is a diagram illustrating a flowchart illustrating the operations of the
次に、探索衛星指示部52は、受信した電波から、ベースバンド部12が、指示された衛星を捕捉したか否かを判定する(ステップS22)。ステップS22で「Yes」と判定された場合、探索衛星指示部52は、今までに捕捉された衛星が規定数(例えば、8個)以上であるか否かを判定する(ステップS23)。ステップS23で「No」と判定された場合、探索衛星指示部52は、可視相関係数を発見確率に乗算し、新たな発見確率とする(ステップS24)。この場合、探索衛星指示部52は、Sn=Sn×Cm,nとして発見確率を再計算する。「m」は指示された衛星番号であり、「n」は「m」以外の全ての衛星番号である。Next, the search
次に、探索衛星指示部52は、未探索の衛星のうち、最も発見確率が高い衛星を選択する(ステップS25)。次に、探索衛星指示部52は、選択した衛星の発見確率が閾値以下(例えば0.05以下)であるか否かを判定する(ステップS26)。ステップS26で「Yes」と判定された場合、フローチャートの実行が終了する。ステップS26で「No」と判定された場合、ステップS22から再度実行される。この場合、探索衛星指示部52は、ベースバンド部12に、選択した衛星の捕捉を指示する。 Next, the search
ステップS22で「No」と判定された場合、探索衛星指示部52は、全衛星を探索済であるか否かを判定する(ステップS27)。ステップS27で「No」と判定された場合、探索衛星指示部52は、(1-可視相関係数)を発見確率に乗算し、新たな発見確率とする(ステップS28)。この場合、探索衛星指示部52は、Sn=Sn×(1-Cm,n)として発見確率を再計算する。「m」は指示された衛星番号であり、「n」は「m」以外の全ての衛星番号である。その後、ステップS25が実行される。ステップS23で「Yes」と判定された場合、またはステップS27で「Yes」と判定された場合、フローチャートの実行が終了する。If the determination in step S22 is "No", the search
本実施例によれば、1つ目の探索対象を定める際に、当該1つ目の衛星が捕捉される場合の他の衛星の発見確率が高いほどもしくは低いほど大きく反映される指標が用いられる。この場合、2つ目以降の探索が収束しやすくなる。また、2つ目以降の探索対象については、特定の推定法(例えば、ベイズ推定法)に基づいて発見確率が最も高い衛星が定められる。この場合、発見確率の低い衛星の探索を回避することができる。以上のことから、本実施例によれば、衛星の探索範囲を絞り込むことができる。 According to this embodiment, when determining the first search target, an index is used that reflects the higher or lower the probability of finding another satellite when the first satellite is captured. . In this case, it becomes easier for the second and subsequent searches to converge. Furthermore, for the second and subsequent search targets, the satellite with the highest discovery probability is determined based on a specific estimation method (eg, Bayesian estimation method). In this case, it is possible to avoid searching for satellites with a low discovery probability. From the above, according to this embodiment, the search range for satellites can be narrowed down.
(変形例)
探索対象の衛星からのドップラ周波数に基づいて、次の探索対象の周波数範囲を定め、当該周波数範囲で当該次の探索対象の捕捉処理を行ってもよい。例えば、図11で例示するように、衛星1が捕捉された8点の時刻を、ドップラ周波数が高い2点と、ドップラ周波数が中程度の4点と、ドップラ周波数が低い2点と、の複数段階に分けてもよい。衛星2については、捕捉された7点の時刻を、ドップラ周波数が高い2点と、ドップラ周波数が中程度の3点と、ドップラ周波数が低い2点と、の複数段階に分けてもよい。(Modified example)
A frequency range for the next search target may be determined based on the Doppler frequency from the satellite to be searched, and acquisition processing for the next search target may be performed in the frequency range. For example, as illustrated in FIG. 11, the eight points at which satellite 1 was captured are divided into two points with high Doppler frequency, four points with medium Doppler frequency, and two points with low Doppler frequency. It may be divided into stages. Regarding the satellite 2, the times of the seven captured points may be divided into multiple stages: two points with high Doppler frequencies, three points with medium Doppler frequencies, and two points with low Doppler frequencies.
各周波数レンジでの周波数相関係数Cxr1,n,r2,mを計算する。下付き文字の1番目(r1)および3番目(r2)は、それぞれの衛星のドップラ周波数レンジ(高、中、低のいずれか)である。下付き文字の2番目(n)は、指示された衛星以外の衛星である。下付き文字の4番目(m)は、指示された衛星である。今まで探索して見つかった衛星nについて下記式(2)に従って計算し、Sxが最も高い周波数レンジr2を探索対象とする。
図12は、周波数相関テーブルの作成フローを例示する図である。図12で例示するように、衛星番号1と衛星番号2とが異なるか否かを判定する(ステップS31)。ステップS31で「Yes」と判定された場合、全数=0とし、周波数相関テーブル(T1,1~T3,3)を初期化する(ステップS32)。次に、指定時刻において、衛星番号1のドップラ周波数1のドップラ周波数が存在するか否かを判定する(ステップS33)。ステップS33で「Yes」と判定された場合、当該指定時刻において、衛星番号2のドップラ周波数が存在するか否かを判定する(ステップS34)。ステップS34で「Yes」と判定された場合、周波数相関テーブルを更新する(ステップS35)。更新表は、表1のとおりである。次に、全数に1を足し合わせる(ステップS36)。ステップS33~ステップS36を、1年前から現在までの1時間ごとに繰り返し実行する。
次に、相関数/全数を、衛星番号1についての衛星番号2の周波数相関係数として記録する(ステップS37)。Cx衛星番号1,1,衛星番号2,1=T1,1/全数となる。Cx衛星番号1,2,衛星番号2,1=T1,2/全数となる。Cx衛星番号1,3,衛星番号2,1=T1,3/全数となる。Cx衛星番号1,1,衛星番号2,2=T2,1/全数となる。Cx衛星番号1,2,衛星番号2,2=T2,2/全数となる。Cx衛星番号1,3,衛星番号2,2=T2,3/全数となる。Cx衛星番号1,1,衛星番号2,3=T3,1/全数となる。Cx衛星番号1,2,衛星番号2,3=T3,2/全数となる。Cx衛星番号1,3,衛星番号2,3=T3,3/全数となる。ステップS31~ステップS37を、衛星番号1について1~32まで、衛星番号2について1~32まで、繰り返し実行する。Next, the correlation number/total number is recorded as the frequency correlation coefficient of satellite number 2 with respect to satellite number 1 (step S37). Cxsatellite number 1,1, satellite number 2,1 = T1,1 /total number. Cxsatellite number 1, 2, satellite number 2, 1 = T1,2 /total number. Cxsatellite number 1, 3, satellite number 2, 1 = T1,3 /total number. Cxsatellite number 1,1, satellite number 2,2 = T2,1 /total number. Cxsatellite number 1, 2, satellite number 2, 2 = T2, 2 /total number. Cxsatellite numbers 1, 3, satellite numbers 2, 2 = T2,3 /total number. Cxsatellite number 1,1, satellite number 2,3 = T3,1 /total number. Cxsatellite numbers 1, 2, satellite numbers 2, 3 = T3,2 /total number. Cxsatellite numbers 1, 3, satellite numbers 2, 3 = T3,3 /total number. Steps S31 to S37 are repeatedly executed from 1 to 32 for satellite number 1 and from 1 to 32 for satellite number 2.
図13は、制御部14の動作を整理したフローチャートを例示する図である。図13で例示するように、探索衛星指示部52は、相関テーブル格納部51が格納している可視相関テーブルを参照し、初期探索衛星を決定する(ステップS41)。この場合、探索衛星指示部52は、上記式(1)に従って弁別度Dsatを計算し、最もDsatが高い衛星satを決定し、ベースバンド部12に当該衛星を探索対象として指示する。この場合、探索範囲指示部53は、探索周波数を全ての周波数範囲に設定する。FIG. 13 is a diagram illustrating a flowchart illustrating the operations of the
次に、探索範囲指示部53は、探索対象および探索周波数を記録する(ステップS42)。次に、探索衛星指示部52は、受信した電波から、ベースバンド部12が、探索対象の衛星を捕捉したか否かを判定する(ステップS43)。ステップS43で「Yes」と判定された場合、探索衛星指示部52は、今までに捕捉された衛星が規定数(例えば、8個)以上であるか否かを判定する(ステップS44)。ステップS44で「No」と判定された場合、探索衛星指示部52は、可視相関係数を発見確率に乗算し、新たな発見確率とする(ステップS45)。この場合、探索衛星指示部52は、Sn=Sn×Cm,nとして発見確率を再計算する。「m」は指示された衛星番号であり、「n」は「m」以外の全ての衛星番号である。Next, the search
次に、探索衛星指示部52は、未探索の衛星のうち、最も発見確率が高い衛星を選択する(ステップS46)。次に、探索衛星指示部52は、選択した衛星の発見確率が閾値以下(例えば0.05以下)であるか否かを判定する(ステップS47)。ステップS47で「Yes」と判定された場合、フローチャートの実行が終了する。 Next, the search
ステップ47で「No」と判定された場合、探索範囲指示部53は、周波数選択フローを実行する(ステップS48)。その後、ステップS42から再度実行される。この場合、探索衛星指示部52は、ベースバンド部12に、選択した衛星の捕捉を指示する。また、探索範囲指示部53は、選択した周波数範囲をベースバンド部12に指示する。 If the determination in step 47 is "No", the search
ステップS43で「No」と判定された場合、探索範囲指示部53は、選択された衛星について全ての周波数を探索済みであるか否かを判定する(ステップS49)。ステップS49で「No」と判定された場合、探索衛星指示部52が選択された衛星を再選択するとともに、探索範囲指示部53は、再選択された衛星について、未探索の周波数範囲を指定する(ステップS50)。その後、ステップS42から再度実行される。 If it is determined "No" in step S43, the search
ステップS49で「Yes」と判定された場合、探索衛星指示部52は、全衛星を探索済であるか否かを判定する(ステップS51)。ステップS51で「No」と判定された場合、探索衛星指示部52は、(1-可視相関係数)を発見確率に乗算し、新たな発見確率とする(ステップS52)。その後、ステップS46が実行される。ステップS44で「Yes」と判定された場合、またはステップS51で「Yes」と判定された場合、フローチャートの実行が終了する。 If it is determined "Yes" in step S49, the search
図14は、周波数選択フローを例示する図である。図14で例示するように、探索範囲指示部53は、確率変数L,M,Hのすべてを1に初期化する(ステップS61)。次に、探索範囲指示部53は、指示衛星の衛星信号を発見済みであるか否かを判定する(ステップS62)。ステップS62で「Yes」と判定された場合、探索範囲指示部53は、捕捉された衛星のドップラ周波数を取得する(ステップS63)。次に、探索範囲指示部53は、ドップラ周波数が-2kHzから+2kHzまでの間であるか否かを判定する(ステップS64)。この場合、探索範囲指示部53は、ドップラ周波数の絶対値が閾値以下であるか否かを判定することができる。ステップS64で「Yes」と判定された場合、探索範囲指示部53は、H=H×Cx探索衛星,3,指示衛星,2とし、M=M×Cx探索衛星,2,指示衛星,2とし、L=L×Cx探索衛星,1,指示衛星,2とする(ステップS65)。FIG. 14 is a diagram illustrating a frequency selection flow. As illustrated in FIG. 14, the search
ステップS65の実行後またはステップS64で「No」と判定された場合、探索範囲指示部53は、ドップラ周波数が正の値であるか否かを判定する(ステップS66)。この場合、探索範囲指示部53は、ドップラ周波数の正の値であって絶対値が閾値以上の値であるか、負の値であって絶対値が閾値以上の値であるかを判定することができる。ステップS66で「Yes」と判定された場合、探索範囲指示部53は、H=H×Cx探索衛星,3,指示衛星,3とし、M=M×Cx探索衛星,2,指示衛星,3とし、L=L×Cx探索衛星,1,指示衛星,3とする(ステップS67)。ステップS66で「No」と判定された場合、探索範囲指示部53は、H=H×Cx探索衛星,3,指示衛星,1とし、M=M×Cx探索衛星,2,指示衛星,1とし、L=L×Cx探索衛星,1,指示衛星,1とする(ステップS68)。探索範囲指示部53は、ステップS62~ステップS68を、指示衛星=1から32まで繰り返し実行する。After executing step S65 or when the determination is "No" in step S64, the search
次に、探索範囲指示部53は、L>MかつL>Hであるか否かを判定する(ステップS69)。ステップS69で「Yes」と判定された場合、探索範囲指示部53は、H>Mであるか否かを判定する(ステップS70)。ステップS70で「Yes」と判定された場合、探索範囲指示部53は、探索周波数として上位半分を選択する(ステップS71)。ステップS70で「No」と判定された場合、探索範囲指示部53は、探索周波数として中央部を選択する(ステップS72)。ステップS69で「No」と判定された場合、探索範囲指示部53は、探索周波数として下位半分を選択する(ステップS73)。ステップS71~ステップS73のいずれかの実行後、フローチャートが終了する。 Next, the search
本変形例によれば、探索対象の衛星からのドップラ周波数に基づいて、次の探索対象の周波数範囲が定まり、当該周波数範囲で当該次の探索対象の捕捉処理が行われる。それにより、捕捉されやすい周波数範囲から優先的に探索される。その結果、演算量を低減することができるようになる。 According to this modification, the frequency range of the next search target is determined based on the Doppler frequency from the satellite of the search target, and the acquisition process of the next search target is performed in the frequency range. As a result, the frequency range that is easily captured is preferentially searched. As a result, the amount of calculations can be reduced.
なお、上記例では、1つ目の探索対象の捕捉処理を行った後に、2つ目の探索対象を取得しているが、1つ目の探索対象の捕捉処理を行っているうちに2つ目の探索対象を取得してもよい。2つ目以降も同様に、1つ前の探索対象の捕捉処理を行っているうちに、次の探索対象を取得するようにしてもよい。このようにすることで、アイドル時間を削減することができる。それにより、演算時間および消費電力を抑制することができる。 Note that in the above example, the second search target is acquired after the first search target is captured, but while the first search target is captured, two search targets are acquired. An eye search target may also be obtained. Similarly, for the second and subsequent search targets, the next search target may be acquired while the capture process for the previous search target is being performed. By doing so, idle time can be reduced. Thereby, calculation time and power consumption can be suppressed.
また、ステップS28およびステップS52では、(1-可視相関係数)を発見確率に乗算しているが、α(1-可視相関係数)を発見確率に乗算してもよい。αとして、0<α<1を用いることができる。このように、重み付けを行うことで、衛星が水平線上にあっても建物などで遮られる場合などを反映させることができる。 Further, in steps S28 and S52, the discovery probability is multiplied by (1-visible correlation coefficient), but the discovery probability may be multiplied by α (1-visible correlation coefficient). As α, 0<α<1 can be used. By performing weighting in this way, it is possible to reflect cases where the satellite is obstructed by buildings etc. even if it is on the horizon.
上記各例においては、センサ端末10が、探索対象の衛星を順番に定め、当該順番に従い、探索対象の衛星からの衛星信号に対して捕捉処理を行うことで得られた信号を送信するセンサ端末の一例である。演算装置30が、前記センサ端末が送信する信号に基づいて、前記センサ端末の位置を演算する演算装置の一例である。探索衛星指示部52が、探索対象の衛星を順番に指示する衛星指示部の一例である。ベースバンド部12が、前記衛星指示部が指示した順番に従い、探索対象の衛星からの衛星信号に対して捕捉処理を行う捕捉処理部の一例である。相関テーブル格納部51が、各衛星について、探索対象の衛星が捕捉される場合の他の衛星の発見確率を予め格納する格納部の一例である。探索範囲指示部53が、探索対象の衛星からのドップラ周波数に基づいて、次の探索対象の周波数範囲を指示する範囲指示部の一例である。 In each of the above examples, the
以上、本発明の実施例について詳述したが、本発明は係る特定の実施例に限定されるものではなく、特許請求の範囲に記載された本発明の要旨の範囲内において、種々の変形・変更が可能である。 Although the embodiments of the present invention have been described in detail above, the present invention is not limited to these specific embodiments, and various modifications and variations can be made within the scope of the gist of the present invention as described in the claims. Changes are possible.
10 センサ端末
11 フロントエンド部
12 ベースバンド部
13 送受信機
14 制御部
15 AFE電源コントローラ
16 BB電源コントローラ
17 TR電源コントローラ
20 中継装置
21 信号受信部
22 記憶装置
23 GNSS受信部
24 測位演算部
25 タイマ
26 送信機
30 演算装置
51 相関テーブル格納部
52 探索衛星指示部
53 探索範囲指示部
100 位置検知システム10 Sensor terminal 11
Claims (7)
Translated fromJapanese前記センサ端末が送信する信号に基づいて、前記センサ端末の位置を演算する演算装置と、を備え、
前記センサ端末は、各衛星について、探索対象の衛星が捕捉される場合の時間期間に対する、他の衛星が捕捉される時間期間の比である可視相関係数をあらかじめ保持または格納しており、1つ目の探索対象を定める際に、当該1つ目の衛星が捕捉される場合に他の衛星について前記可視相関係数が高いほどもしくは低いほど大きく反映される指標を用いて定め、2つ目以降の探索対象については、特定の推定法に基づいて、前記可視相関係数から算出される発見確率が最も高い衛星を定めることを特徴とする位置検知システム。A sensor terminal that determines satellites to be searched in order and transmits signals obtained by performing acquisition processing on satellite signals from the satellites to be searched according to the order;
a calculation device that calculates the position of the sensor terminal based on a signal transmitted by the sensor terminal,
The sensor terminal holds or stores in advance a visible correlation coefficient for each satellite, which is the ratio of the time period during which the search target satellite is captured to the time period during which other satellites are captured, and 1 When determining the second search target,it is determined using an index that reflects the higher or lowervisible correlation coefficient of other satellites when the first satellite is captured, and The position detection system is characterized in that, for subsequent search targets, a satellite with the highest probability of discoverycalculated from the visible correlation coefficient is determined based on a specific estimation method.
前記衛星指示部が指示した順番に従い、探索対象の衛星からの衛星信号に対して捕捉処理を行う捕捉処理部と、を備え、
各衛星について、探索対象の衛星が捕捉される場合の時間期間に対する、他の衛星が捕捉される時間期間の比である可視相関係数をあらかじめ保持または格納しており、
前記衛星指示部は、1つ目の探索対象を定める際に、当該1つ目の衛星が捕捉される場合に他の衛星について前記可視相関係数が高いほどもしくは低いほど大きく反映される指標を用いて定め、2つ目以降の探索対象については、特定の推定法に基づいて、前記可視相関係数から算出される発見確率が最も高い衛星を定めることを特徴とするセンサ端末。a satellite instruction unit that sequentially instructs satellites to be searched;
an acquisition processing unit that performs acquisition processing on satellite signals from a satellite to be searched in accordance with the order instructed by the satellite instruction unit;
For each satellite, a visible correlation coefficient, which is the ratio of the time period during which other satellites are captured to the time period during which the search target satellite is captured, is maintained or stored in advance;
When determining the first search target, the satellite instruction unit determines an index that will be reflected more greatly asthe visible correlation coefficient for other satellites increases or decreases when the first satellite is captured. The sensor terminal is characterized in that, for the second and subsequent search targets, a satellite with the highest probability of discoverycalculated from the visible correlation coefficient is determined based ona specific estimation method.
前記捕捉処理部は、前記範囲指示部が指示する周波数範囲で当該次の探索対象の捕捉処理を行うことを特徴とする請求項4に記載のセンサ端末。A range indicating section that indicates the next frequency range to be searched based on the Doppler frequency from the satellite to be searched,
5. The sensor terminal accordingto claim 4 , wherein the acquisition processing section performs acquisition processing of the next search target in a frequency range specified by the range instruction section.
前記センサ端末が送信する信号に基づいて、前記センサ端末の位置を演算装置が演算し、
前記センサ端末は、各衛星について、探索対象の衛星が捕捉される場合の時間期間に対する、他の衛星が捕捉される時間期間の比である可視相関係数をあらかじめ保持または格納しており、
1つ目の探索対象を定める際に、当該1つ目の衛星が捕捉される場合に他の衛星について前記可視相関係数が高いほどもしくは低いほど大きく反映される指標を用いて定め、2つ目以降の探索対象については、特定の推定法に基づいて、前記可視相関係数から算出される発見確率が最も高い衛星を定めることを特徴とする位置検知方法。The sensor terminal transmits a signal obtained by performing acquisition processing on the satellite signal from the satellite to be searched according to the order of the satellite to be searched,
A calculation device calculates the position of the sensor terminal based on a signal transmitted by the sensor terminal,
The sensor terminal holds or stores in advance a visible correlation coefficient for each satellite, which is the ratio of the time period during which other satellites are captured to the time period during which the search target satellite is captured;
When determining the first search target,it is determined using an index that reflects the higher or lowervisible correlation coefficient of other satellites when the first satellite is captured, and A position detection method characterized in that, for search targets after the second one, a satellite with the highest detection probabilitycalculated from the visible correlation coefficient is determined based on a specific estimation method.
Priority Applications (2)
| Application Number | Priority Date | Filing Date | Title |
|---|---|---|---|
| JP2019103649AJP7364857B2 (en) | 2019-06-03 | 2019-06-03 | Position detection system, sensor terminal and position detection method |
| US16/881,367US11506792B2 (en) | 2019-06-03 | 2020-05-22 | Position detection system, sensor terminal, and position detection method |
Applications Claiming Priority (1)
| Application Number | Priority Date | Filing Date | Title |
|---|---|---|---|
| JP2019103649AJP7364857B2 (en) | 2019-06-03 | 2019-06-03 | Position detection system, sensor terminal and position detection method |
Publications (2)
| Publication Number | Publication Date |
|---|---|
| JP2020197446A JP2020197446A (en) | 2020-12-10 |
| JP7364857B2true JP7364857B2 (en) | 2023-10-19 |
Family
ID=73551219
Family Applications (1)
| Application Number | Title | Priority Date | Filing Date |
|---|---|---|---|
| JP2019103649AActiveJP7364857B2 (en) | 2019-06-03 | 2019-06-03 | Position detection system, sensor terminal and position detection method |
Country Status (2)
| Country | Link |
|---|---|
| US (1) | US11506792B2 (en) |
| JP (1) | JP7364857B2 (en) |
Families Citing this family (4)
| Publication number | Priority date | Publication date | Assignee | Title |
|---|---|---|---|---|
| CN116889096A (en)* | 2021-02-26 | 2023-10-13 | Oppo广东移动通信有限公司 | Wireless communication method, terminal equipment and network equipment |
| EP4369677A4 (en)* | 2021-07-05 | 2024-11-13 | Panasonic Intellectual Property Corporation of America | POSITION INFORMATION RELAY DEVICE, POSITION INFORMATION ACQUISITION SYSTEM, POSITION INFORMATION RELAY METHOD, AND PROGRAM |
| CN115542353B (en)* | 2022-09-29 | 2025-07-25 | 中国星网网络创新研究院有限公司 | Satellite capturing method, device, electronic equipment and storage medium |
| CN116347329B (en)* | 2022-12-16 | 2024-03-29 | 中交星宇科技有限公司 | Positioning signal capture method and device, computing equipment and computer storage medium |
Citations (4)
| Publication number | Priority date | Publication date | Assignee | Title |
|---|---|---|---|---|
| JP2002082157A (en) | 2000-09-08 | 2002-03-22 | Japan Radio Co Ltd | Cold start method |
| JP2003527567A (en) | 1999-07-12 | 2003-09-16 | スカイビッツ,インコーポレイテッド | High-speed location reporting system |
| JP2012511161A (en) | 2008-12-09 | 2012-05-17 | クアルコム,インコーポレイテッド | Satellite positioning system signal search method and apparatus |
| JP2016027330A (en) | 2014-06-30 | 2016-02-18 | ハネウェル・インターナショナル・インコーポレーテッド | Adaptive satellite search succession |
Family Cites Families (3)
| Publication number | Priority date | Publication date | Assignee | Title |
|---|---|---|---|---|
| US5402347A (en)* | 1993-07-22 | 1995-03-28 | Trimble Navigation Limited | Satellite search methods for improving time to first fix in a GPS receiver |
| CN103675840A (en)* | 2012-09-05 | 2014-03-26 | 迈实电子(上海)有限公司 | Satellite signal receiver and positioning method thereof |
| JP2016048246A (en)* | 2015-10-30 | 2016-04-07 | セイコーエプソン株式会社 | Electronics |
- 2019
- 2019-06-03JPJP2019103649Apatent/JP7364857B2/enactiveActive
- 2020
- 2020-05-22USUS16/881,367patent/US11506792B2/enactiveActive
Patent Citations (4)
| Publication number | Priority date | Publication date | Assignee | Title |
|---|---|---|---|---|
| JP2003527567A (en) | 1999-07-12 | 2003-09-16 | スカイビッツ,インコーポレイテッド | High-speed location reporting system |
| JP2002082157A (en) | 2000-09-08 | 2002-03-22 | Japan Radio Co Ltd | Cold start method |
| JP2012511161A (en) | 2008-12-09 | 2012-05-17 | クアルコム,インコーポレイテッド | Satellite positioning system signal search method and apparatus |
| JP2016027330A (en) | 2014-06-30 | 2016-02-18 | ハネウェル・インターナショナル・インコーポレーテッド | Adaptive satellite search succession |
Also Published As
| Publication number | Publication date |
|---|---|
| JP2020197446A (en) | 2020-12-10 |
| US20200379119A1 (en) | 2020-12-03 |
| US11506792B2 (en) | 2022-11-22 |
Similar Documents
| Publication | Publication Date | Title |
|---|---|---|
| JP7364857B2 (en) | Position detection system, sensor terminal and position detection method | |
| US11187540B2 (en) | Navigate, track, and position mobile devices in GPS-denied or GPS-inaccurate areas with automatic map generation | |
| RU2326398C2 (en) | Signal search procedure for location systems | |
| CN1963558B (en) | Minimization of a GPS satellite search time in a gps receiver | |
| JP5657539B2 (en) | Robust location estimation | |
| CN104869639B (en) | A kind of indoor orientation method and device | |
| EP1571460B1 (en) | Satellite positioning apparatus and current position determining method | |
| EP3608690A1 (en) | Gnss receiver with an on-board capability to implement an optimal error correction mode | |
| JP2007505289A (en) | Seismic measurement system with GPS receiver | |
| JP2004504612A (en) | Method and apparatus for searching for a mobile receiver using a wide area reference network that propagates ephemeris data | |
| CN102272616A (en) | Method and system for improving positioning accuracy | |
| KR20010050336A (en) | Satellite-based location system employing knowledge-based sequential signal search strategy | |
| KR20010030317A (en) | A satellite-based location system employing dynamic integration techniques | |
| US6549850B2 (en) | Receiver of a satellite positioning system and associated method | |
| JP2004184121A (en) | Controller and server unit for gps receiver | |
| JP2007163297A (en) | Positioning terminal | |
| RU2318221C1 (en) | Method for finding satellite signals in multi-channel receiver for signals of satellite radio-navigational systems | |
| JP2005283187A (en) | Satellite search device | |
| JP2025521682A (en) | Wireless communication system and method | |
| JP6440777B2 (en) | Positioning terminal, mobile phone search system, mobile phone search method, program, and server | |
| JP4237581B2 (en) | Positioning device | |
| JP2010032407A (en) | Gps clocking device and method of detecting area of use | |
| JP2818387B2 (en) | Positioning device | |
| JPH07209405A (en) | GPS receiver | |
| JPH11109020A (en) | Satellite signal acquisition system |
Legal Events
| Date | Code | Title | Description |
|---|---|---|---|
| A621 | Written request for application examination | Free format text:JAPANESE INTERMEDIATE CODE: A621 Effective date:20220208 | |
| A977 | Report on retrieval | Free format text:JAPANESE INTERMEDIATE CODE: A971007 Effective date:20221220 | |
| A131 | Notification of reasons for refusal | Free format text:JAPANESE INTERMEDIATE CODE: A131 Effective date:20230105 | |
| A521 | Request for written amendment filed | Free format text:JAPANESE INTERMEDIATE CODE: A523 Effective date:20230303 | |
| A131 | Notification of reasons for refusal | Free format text:JAPANESE INTERMEDIATE CODE: A131 Effective date:20230627 | |
| A521 | Request for written amendment filed | Free format text:JAPANESE INTERMEDIATE CODE: A523 Effective date:20230824 | |
| TRDD | Decision of grant or rejection written | ||
| A01 | Written decision to grant a patent or to grant a registration (utility model) | Free format text:JAPANESE INTERMEDIATE CODE: A01 Effective date:20230905 | |
| A61 | First payment of annual fees (during grant procedure) | Free format text:JAPANESE INTERMEDIATE CODE: A61 Effective date:20230918 | |
| R150 | Certificate of patent or registration of utility model | Ref document number:7364857 Country of ref document:JP Free format text:JAPANESE INTERMEDIATE CODE: R150 |