JP7181033B2 - DATA PROCESSING METHOD, DATA PROCESSING APPARATUS, AND DATA PROCESSING PROGRAM - Google Patents
DATA PROCESSING METHOD, DATA PROCESSING APPARATUS, AND DATA PROCESSING PROGRAMDownload PDFInfo
- Publication number
- JP7181033B2 JP7181033B2JP2018176256AJP2018176256AJP7181033B2JP 7181033 B2JP7181033 B2JP 7181033B2JP 2018176256 AJP2018176256 AJP 2018176256AJP 2018176256 AJP2018176256 AJP 2018176256AJP 7181033 B2JP7181033 B2JP 7181033B2
- Authority
- JP
- Japan
- Prior art keywords
- level
- screen
- graph
- evaluation
- evaluation value
- Prior art date
- Legal status (The legal status is an assumption and is not a legal conclusion. Google has not performed a legal analysis and makes no representation as to the accuracy of the status listed.)
- Active
Links
Images


Classifications
- G—PHYSICS
- G06—COMPUTING OR CALCULATING; COUNTING
- G06F—ELECTRIC DIGITAL DATA PROCESSING
- G06F18/00—Pattern recognition
- G06F18/20—Analysing
- G06F18/24—Classification techniques
- G06F18/241—Classification techniques relating to the classification model, e.g. parametric or non-parametric approaches
- G06F18/2415—Classification techniques relating to the classification model, e.g. parametric or non-parametric approaches based on parametric or probabilistic models, e.g. based on likelihood ratio or false acceptance rate versus a false rejection rate
- G—PHYSICS
- G05—CONTROLLING; REGULATING
- G05B—CONTROL OR REGULATING SYSTEMS IN GENERAL; FUNCTIONAL ELEMENTS OF SUCH SYSTEMS; MONITORING OR TESTING ARRANGEMENTS FOR SUCH SYSTEMS OR ELEMENTS
- G05B23/00—Testing or monitoring of control systems or parts thereof
- G05B23/02—Electric testing or monitoring
- G05B23/0205—Electric testing or monitoring by means of a monitoring system capable of detecting and responding to faults
- G05B23/0218—Electric testing or monitoring by means of a monitoring system capable of detecting and responding to faults characterised by the fault detection method dealing with either existing or incipient faults
- G05B23/0221—Preprocessing measurements, e.g. data collection rate adjustment; Standardization of measurements; Time series or signal analysis, e.g. frequency analysis or wavelets; Trustworthiness of measurements; Indexes therefor; Measurements using easily measured parameters to estimate parameters difficult to measure; Virtual sensor creation; De-noising; Sensor fusion; Unconventional preprocessing inherently present in specific fault detection methods like PCA-based methods
- G—PHYSICS
- G05—CONTROLLING; REGULATING
- G05B—CONTROL OR REGULATING SYSTEMS IN GENERAL; FUNCTIONAL ELEMENTS OF SUCH SYSTEMS; MONITORING OR TESTING ARRANGEMENTS FOR SUCH SYSTEMS OR ELEMENTS
- G05B19/00—Programme-control systems
- G05B19/02—Programme-control systems electric
- G05B19/418—Total factory control, i.e. centrally controlling a plurality of machines, e.g. direct or distributed numerical control [DNC], flexible manufacturing systems [FMS], integrated manufacturing systems [IMS] or computer integrated manufacturing [CIM]
- G05B19/4183—Total factory control, i.e. centrally controlling a plurality of machines, e.g. direct or distributed numerical control [DNC], flexible manufacturing systems [FMS], integrated manufacturing systems [IMS] or computer integrated manufacturing [CIM] characterised by data acquisition, e.g. workpiece identification
- G—PHYSICS
- G06—COMPUTING OR CALCULATING; COUNTING
- G06F—ELECTRIC DIGITAL DATA PROCESSING
- G06F18/00—Pattern recognition
- G—PHYSICS
- G05—CONTROLLING; REGULATING
- G05B—CONTROL OR REGULATING SYSTEMS IN GENERAL; FUNCTIONAL ELEMENTS OF SUCH SYSTEMS; MONITORING OR TESTING ARRANGEMENTS FOR SUCH SYSTEMS OR ELEMENTS
- G05B23/00—Testing or monitoring of control systems or parts thereof
- G05B23/02—Electric testing or monitoring
- G05B23/0205—Electric testing or monitoring by means of a monitoring system capable of detecting and responding to faults
- G05B23/0218—Electric testing or monitoring by means of a monitoring system capable of detecting and responding to faults characterised by the fault detection method dealing with either existing or incipient faults
- G05B23/0224—Process history based detection method, e.g. whereby history implies the availability of large amounts of data
- G05B23/0227—Qualitative history assessment, whereby the type of data acted upon, e.g. waveforms, images or patterns, is not relevant, e.g. rule based assessment; if-then decisions
- G05B23/0235—Qualitative history assessment, whereby the type of data acted upon, e.g. waveforms, images or patterns, is not relevant, e.g. rule based assessment; if-then decisions based on a comparison with predetermined threshold or range, e.g. "classical methods", carried out during normal operation; threshold adaptation or choice; when or how to compare with the threshold
- G—PHYSICS
- G05—CONTROLLING; REGULATING
- G05B—CONTROL OR REGULATING SYSTEMS IN GENERAL; FUNCTIONAL ELEMENTS OF SUCH SYSTEMS; MONITORING OR TESTING ARRANGEMENTS FOR SUCH SYSTEMS OR ELEMENTS
- G05B23/00—Testing or monitoring of control systems or parts thereof
- G05B23/02—Electric testing or monitoring
- G05B23/0205—Electric testing or monitoring by means of a monitoring system capable of detecting and responding to faults
- G05B23/0259—Electric testing or monitoring by means of a monitoring system capable of detecting and responding to faults characterized by the response to fault detection
- G05B23/0267—Fault communication, e.g. human machine interface [HMI]
- G05B23/0272—Presentation of monitored results, e.g. selection of status reports to be displayed; Filtering information to the user
- G—PHYSICS
- G06—COMPUTING OR CALCULATING; COUNTING
- G06F—ELECTRIC DIGITAL DATA PROCESSING
- G06F11/00—Error detection; Error correction; Monitoring
- G06F11/30—Monitoring
- G06F11/32—Monitoring with visual or acoustical indication of the functioning of the machine
- G06F11/324—Display of status information
- G—PHYSICS
- G06—COMPUTING OR CALCULATING; COUNTING
- G06F—ELECTRIC DIGITAL DATA PROCESSING
- G06F3/00—Input arrangements for transferring data to be processed into a form capable of being handled by the computer; Output arrangements for transferring data from processing unit to output unit, e.g. interface arrangements
- G06F3/01—Input arrangements or combined input and output arrangements for interaction between user and computer
- G06F3/048—Interaction techniques based on graphical user interfaces [GUI]
- G06F3/0481—Interaction techniques based on graphical user interfaces [GUI] based on specific properties of the displayed interaction object or a metaphor-based environment, e.g. interaction with desktop elements like windows or icons, or assisted by a cursor's changing behaviour or appearance
- G06F3/0482—Interaction with lists of selectable items, e.g. menus
- G—PHYSICS
- G05—CONTROLLING; REGULATING
- G05B—CONTROL OR REGULATING SYSTEMS IN GENERAL; FUNCTIONAL ELEMENTS OF SUCH SYSTEMS; MONITORING OR TESTING ARRANGEMENTS FOR SUCH SYSTEMS OR ELEMENTS
- G05B2219/00—Program-control systems
- G05B2219/30—Nc systems
- G05B2219/32—Operator till task planning
- G05B2219/32128—Gui graphical user interface
- G—PHYSICS
- G06—COMPUTING OR CALCULATING; COUNTING
- G06F—ELECTRIC DIGITAL DATA PROCESSING
- G06F2218/00—Aspects of pattern recognition specially adapted for signal processing
- G06F2218/12—Classification; Matching
- G06F2218/16—Classification; Matching by matching signal segments
Landscapes
- Engineering & Computer Science (AREA)
- Theoretical Computer Science (AREA)
- Physics & Mathematics (AREA)
- General Physics & Mathematics (AREA)
- General Engineering & Computer Science (AREA)
- Automation & Control Theory (AREA)
- Data Mining & Analysis (AREA)
- Bioinformatics & Cheminformatics (AREA)
- Evolutionary Biology (AREA)
- Evolutionary Computation (AREA)
- Bioinformatics & Computational Biology (AREA)
- Artificial Intelligence (AREA)
- Life Sciences & Earth Sciences (AREA)
- Computer Vision & Pattern Recognition (AREA)
- Human Computer Interaction (AREA)
- Quality & Reliability (AREA)
- Probability & Statistics with Applications (AREA)
- Manufacturing & Machinery (AREA)
- Testing And Monitoring For Control Systems (AREA)
- General Factory Administration (AREA)
- Databases & Information Systems (AREA)
- Fuzzy Systems (AREA)
- Mathematical Physics (AREA)
- Software Systems (AREA)
- Computational Linguistics (AREA)
- Testing Or Measuring Of Semiconductors Or The Like (AREA)
Description
Translated fromJapanese本発明は、デジタルデータ処理に関し、特に、基板処理装置で測定されたデータの処理方法、処理装置、および、処理プログラムに関する。 The present invention relates to digital data processing, and more particularly to a method, processing apparatus, and processing program for processing data measured by a substrate processing apparatus.
機器や装置の異常を検出する方法として、機器や装置の動作状態を示す物理量(例えば、長さ、角度、時間、速さ、力、圧力、電圧、電流、温度、流量など)をセンサなどを用いて測定し、測定結果を時系列順に並べて得られた時系列データを分析する方法が知られている。機器や装置が同じ条件で同じ動作を行う場合、異常がなければ、時系列データは同様に変化する。そこで、同様に変化する複数の時系列データを相互に比較して異常な時系列データを検出し、これを分析して異常の発生箇所や原因を特定することができる。 As a method of detecting anomalies in devices and devices, sensors are used to measure physical quantities (e.g., length, angle, time, speed, force, pressure, voltage, current, temperature, flow rate, etc.) that indicate the operating state of devices and devices. There is known a method of analyzing time-series data obtained by measuring using a device and arranging the measurement results in chronological order. If the equipment or device performs the same operation under the same conditions, the time-series data will change in the same way if there is no abnormality. Therefore, it is possible to detect anomalous time-series data by comparing a plurality of time-series data that change in a similar manner, and to identify the occurrence location and cause of the anomaly by analyzing the detected time-series data.
半導体基板(以下、基板という)の製造工程では、複数の基板処理装置を用いて一連の処理が実行される。基板処理装置は、基板に対して一連の処理の中の特定の処理を行う1以上の処理ユニットを含んでいる。処理ユニットは、基板に対して予め定めた手順(レシピと呼ばれる)に従い処理を行う。このとき処理ユニットにおける測定結果に基づき、時系列データが得られる。得られた時系列データを分析することにより、異常が発生した処理ユニットや異常の原因を特定することができる。 2. Description of the Related Art In a manufacturing process of a semiconductor substrate (hereinafter referred to as substrate), a series of processes are performed using a plurality of substrate processing apparatuses. A substrate processing apparatus includes one or more processing units that perform a specific process in a series of processes on a substrate. The processing unit processes the substrate according to a predetermined procedure (called a recipe). At this time, time-series data is obtained based on the measurement results in the processing unit. By analyzing the obtained time-series data, it is possible to identify the processing unit in which the abnormality occurred and the cause of the abnormality.
本願発明に関連して、特許文献1には、独立して発生するエラーについてはエラー情報を第1階層に表示し、先行するエラーに起因して発生するエラーについてはエラー情報を第2階層以下の下位層エリアに表示するエラー出力方法が記載されている。特許文献2には、各種の情報を表示するためのスクリーンを含む半導体システムプロセス用のグラフィカル・ユーザ・インターフェイスが記載されている。 In relation to the present invention, in
基板処理装置では、多数の測定結果に基づき多数の時系列データが得られる。このため、利用者(基板処理装置のオペレータ)は、時系列データのすべての異常を含む表示画面を見たときに、基板処理装置の状態を容易に把握することができない。 A substrate processing apparatus obtains a large amount of time-series data based on a large number of measurement results. Therefore, the user (operator of the substrate processing apparatus) cannot easily grasp the state of the substrate processing apparatus when viewing the display screen including all the abnormalities in the time-series data.
それ故に、本発明は、基板処理装置の状態を容易に把握できるデータ処理方法を提供することを目的とする。 SUMMARY OF THE INVENTION Therefore, it is an object of the present invention to provide a data processing method that allows the user to easily grasp the state of a substrate processing apparatus.
本発明の第1の局面は、1以上の処理ユニットを有する基板処理装置の動作状態を示す物理量を測定するセンサから得られた時系列データを処理するデータ処理方法であって、
前記時系列データと基準データとを比較することにより、前記時系列データの評価値を求める評価値計算ステップと、
前記評価値を複数のレベルに分類するレベル判定ステップと、
前記処理ユニットについて、前記評価値の各レベルの発生割合を示す第1のグラフを含む評価結果画面を表示する結果表示ステップとを備え、
前記複数のレベルは、最良レベルと最悪レベルを含み、
前記第1のグラフは、悪いレベルであるほど濃い色で表示され、
前記評価結果画面は、前記処理ユニットについて、所定の方法で基板を処理したときの前記評価値の最悪レベルの発生回数の時間的変化を示す第2のグラフをさらに含み、
前記第1のグラフと前記第2のグラフとは、前記処理ユニットごとに表示される。A first aspect of the present invention is a data processing method for processing time-series data obtainedfrom a sensor that measures a physical quantity indicating an operating state of a substrate processing apparatus having one or more processing units,
an evaluation value calculation step of obtaining an evaluation value of the time-series data by comparing the time-series data and reference data;
a level determination step of classifying the evaluation values into a plurality of levels;
a result display step of displaying an evaluation result screen including a first graph showing the rate of occurrence of each level of the evaluation value for the processing unit;
the plurality of levels includes a best level and a worst level;
The first graph is displayed in a darker color as the level is worse,
The evaluation result screen further includes a second graph showing temporal changes in the number of occurrences of the worst level of the evaluation value when the substrate is processed by a predetermined method for the processing unit,
The first graph and the second graph are displayed for each processing unit .
本発明の第2の局面は、本発明の第1の局面において、
前記第1のグラフは、円グラフまたは帯グラフであることを特徴とする。Asecond aspect of the present invention is thefirst aspect of the present invention,
The first graph is characterized by being a pie graph or a band graph.
本発明の第3の局面は、本発明の第1または第2の局面において、
前記評価結果画面は、前記処理ユニットについて、前記評価値の各レベルの発生回数をさらに含むことを特徴とする。Athird aspect of the present invention is the firstor second aspect of the present invention,
The evaluation result screen may further include the number of occurrences of each level of the evaluation value for the processing unit.
本発明の第4の局面は、本発明の第1~第3のいずれかの局面において、
前記第2のグラフは、棒グラフまたは折れ線グラフであることを特徴とする。Afourth aspect of the present inventionis any one of the first to third aspects of the present invention,
The second graph is characterized by being a bar graph or a line graph.
本発明の第5の局面は、本発明の第1~第4のいずれかの局面において、
前記レベル判定ステップで求めたレベルの中から、与えられた条件を満たす基板に関するレベルを選択するレベル選択ステップをさらに備え、
前記結果表示ステップは、前記レベル選択ステップで選択されたレベルに基づき前記評価結果画面を表示することを特徴とする。Afifth aspect of the present invention is any one of the first tofourth aspects of the present invention,
further comprising a level selection step of selecting a level related to the substrate satisfying given conditions from among the levels obtained in the level determination step;
The result display step displays the evaluation result screen based on the level selected in the level selection step.
本発明の第6の局面は、本発明の第5の局面において、
前記レベル選択ステップは、少なくとも基板の処理期間、基板に対する処理、および、基板を処理した処理ユニットのいずれかを条件として、前記レベルを選択することを特徴とする。Asixth aspect of the present invention is thefifth aspect of the present invention,
The level selection step selects the level based on at least one of the substrate processing period, the substrate processing, and the processing unit that processed the substrate.
本発明の第7の局面は、本発明の第1~第6のいずれかの局面において、
前記結果表示ステップは、前記評価結果画面の他に、前記評価値を求めた方法を選択するための画面、前記評価値を求めた履歴を表示する履歴画面、表示対象を選択するための画面、および、前記時系列データのグラフを含む画面、または、前記評価値の時間的変化を示すグラフを含むトレンド画面のいずれかを階層的に表示することを特徴とする。Aseventh aspect of the present invention is any one of the first tosixth aspects of the present invention,
The result display step includes, in addition to the evaluation result screen, a screen for selecting a method for obtaining the evaluation value, a history screen for displaying a history of obtaining the evaluation value, a screen for selecting a display target, Further, either a screen including a graph of the time-series data or a trend screen including a graph showing the temporal change of the evaluation value is hierarchically displayed.
本発明の第8の局面は、本発明の第7の局面において、
前記結果表示ステップは、前記トレンド画面を表示し、
前記トレンド画面内のグラフには、前記履歴画面内で選択された処理結果に対応する位置にマークが付けられていることを特徴とする。Aneighth aspect of the present invention is theseventh aspect of the present invention,
The result display step displays the trend screen,
The graph in the trend screen is characterized in that a mark is attached at a position corresponding to the processing result selected in the history screen.
本発明の第9の局面は、本発明の第1~第8のいずれかの局面において、
前記結果表示ステップは、集計期間内に処理された基板について前記評価値の各レベルの発生回数の時間的変化を示すグラフと、前記集計期間内に処理された基板について前記評価値の最悪レベルの発生回数を発生要因に分けてランキング形式で示すグラフとを含むログ統計画面を表示することを特徴とする。Aninth aspect of the present invention is any one of the first toeighth aspects of the present invention,
In the result display step, a graph showing a temporal change in the number of occurrences of each level of the evaluation value for the substrates processed within the aggregation period and the worst level of the evaluation value for the substrates processed within the aggregation period. It is characterized by displaying a log statistics screen including a graph showing the number of occurrences divided into causes and showing them in a ranking format.
本発明の第10の局面は、本発明の第1~第9のいずれかの局面において、
前記基準データは、他の時系列データであることを特徴とする。Atenth aspect of the present invention is any one of the first toninth aspects of the present invention,
The reference data is characterized by being other time-series data.
本発明の第11の局面は、1以上の処理ユニットを有する基板処理装置の動作状態を示す物理量を測定するセンサから得られた時系列データを処理するデータ処理装置であって、
前記時系列データと基準データとを比較することにより、前記時系列データの評価値を求める評価値計算部と、
前記評価値を複数のレベルに分類するレベル判定部と、
前記処理ユニットについて、前記評価値の各レベルの発生割合を示す第1のグラフを含む評価結果画面を表示する結果表示部とを備え、
前記複数のレベルは、最良レベルと最悪レベルを含み、
前記第1のグラフは、悪いレベルであるほど濃い色で表示され、
前記評価結果画面は、前記処理ユニットについて、所定の方法で基板を処理したときの前記評価値の最悪レベルの発生回数の時間的変化を示す第2のグラフをさらに含み、
前記第1のグラフと前記第2のグラフとは、前記処理ユニットごとに表示される。Aneleventh aspect of the present invention is a data processing apparatus for processing time-series data obtainedfrom a sensor that measures a physical quantity indicating an operating state of a substrate processing apparatus having one or more processing units,
an evaluation value calculation unit that calculates an evaluation value of the time-series data by comparing the time-series data with reference data;
a level determination unit that classifies the evaluation values into a plurality of levels;
a result display unit for displaying an evaluation result screen including a first graph showing the rate of occurrence of each level of the evaluation value for the processing unit;
the plurality of levels includes a best level and a worst level;
The first graph is displayed in a darker color as the level is worse,
The evaluation result screen further includes a second graph showing temporal changes in the number of occurrences of the worst level of the evaluation value when the substrate is processed by a predetermined method for the processing unit,
The first graph and the second graph are displayed for each processing unit .
本発明の第12の局面は、本発明の第11の局面において、
前記評価結果画面は、前記処理ユニットについて、前記評価値の各レベルの発生回数をさらに含むことを特徴とする。Atwelfth aspect of the present invention is theeleventh aspect of the present invention,
The evaluation result screen may further include the number of occurrences of each level of the evaluation value for the processing unit.
本発明の第13の局面は、本発明の第11または第12の局面において、
前記レベル判定部で求めたレベルの中から、与えられた条件を満たす基板に関するレベルを選択するレベル選択部をさらに備え、
前記結果表示部は、前記レベル選択部で選択されたレベルに基づき前記評価結果画面を表示することを特徴とする。Athirteenth aspect of the present invention isthe eleventh or twelfth aspect of the present invention,
further comprising a level selection unit that selects a level related to a substrate that satisfies a given condition from among the levels determined by the level determination unit;
The result display section displays the evaluation result screen based on the level selected by the level selection section.
本発明の第14の局面は、本発明の第11~第13のいずれかの局面において、
前記結果表示部は、前記評価結果画面の他に、前記評価値を求めた方法を選択するための画面、前記評価値を求めた履歴を表示する履歴画面、表示対象を選択するための画面、および、前記時系列データのグラフを含む画面、または、前記評価値の時間的変化を示すグラフを含むトレンド画面のいずれかを階層的に表示することを特徴とする。Afourteenth aspect of the present invention is any one ofthe eleventh to thirteenth aspects of the present invention,
The result display unit includes, in addition to the evaluation result screen, a screen for selecting a method for obtaining the evaluation value, a history screen for displaying a history of obtaining the evaluation value, a screen for selecting a display target, Further, either a screen including a graph of the time-series data or a trend screen including a graph showing the temporal change of the evaluation value is hierarchically displayed.
本発明の第15の局面は、1以上の処理ユニットを有する基板処理装置の動作状態を示す物理量を測定するセンサから得られた時系列データを処理するデータ処理プログラムであって、
前記時系列データと基準データとを比較することにより、前記時系列データの評価値を求める評価値計算ステップと、
前記評価値を複数のレベルに分類するレベル判定ステップと、
前記処理ユニットについて、前記評価値の各レベルの発生割合を示す第1のグラフを含む評価結果画面を表示する結果表示ステップとを、
コンピュータにCPUがメモリを利用して実行させ、
前記複数のレベルは、最良レベルと最悪レベルを含み、
前記第1のグラフは、悪いレベルであるほど濃い色で表示され、
前記評価結果画面は、前記処理ユニットについて、所定の方法で基板を処理したときの前記評価値の最悪レベルの発生回数の時間的変化を示す第2のグラフをさらに含み、
前記第1のグラフと前記第2のグラフとは、前記処理ユニットごとに表示される。Afifteenth aspect of the present invention is a data processing program for processing time-series data obtainedfrom a sensor that measures a physical quantity indicating an operating state of a substrate processing apparatus having one or more processing units,
an evaluation value calculation step of obtaining an evaluation value of the time-series data by comparing the time-series data and reference data;
a level determination step of classifying the evaluation values into a plurality of levels;
a result display step of displaying an evaluation result screen including a first graph showing the rate of occurrence of each level of the evaluation value for the processing unit;
The CPU makes the computer execute using the memory,
the plurality of levels includes a best level and a worst level;
The first graph is displayed in a darker color as the level is worse,
The evaluation result screen further includes a second graph showing temporal changes in the number of occurrences of the worst level of the evaluation value when the substrate is processed by a predetermined method for the processing unit,
The first graph and the second graph are displayed for each processing unit .
上記第1、第11または第15の局面によれば、処理ユニットについて、評価値の各レベルの発生割合を示す第1のグラフを含む評価結果画面が表示される。第1のグラフは、悪いレベルほど濃い色で表示される。したがって、利用者は、第1のグラフを見ることにより、処理ユニットにおいて各レベル(特に、最悪レベル)がどの程度の割合で発生しているかを容易に認識することができる。特に、基板処理装置が複数の処理ユニットを含む場合には、利用者は、複数の第1のグラフを相互に比較することにより、いずれの処理ユニットで最悪レベルが高い割合で発生しているかを容易に認識することができる。このように利用者は、基板処理装置の状態を容易に把握することができる。また、利用者は、第2のグラフを見ることにより、最悪レベルの発生状況の時間的変化を知り、処理ユニットが異常状態に近づいているか否かを認識することができる。According to the first,eleventh , orfifteenth aspect, the evaluation result screen including the first graph showing the rate of occurrence of each level of evaluation value for the processing unit is displayed.The first graph is displayed in darker colors for worse levels. Therefore, by viewing the first graph, the user can easily recognize the rate at which each level (especially the worst level) occurs in the processing unit. In particular, when the substrate processing apparatus includes a plurality of processing units, the user can determine in which processing unit the worst level occurs at a high rate by comparing the plurality of first graphs. easily recognizable. Thus, the user can easily grasp the state of the substrate processing apparatus.Also, by looking at the second graph, the user can know the temporal change of the worst-level occurrence situation, and can recognize whether the processing unit is approaching an abnormal state.
上記第2の局面によれば、第1のグラフとして円グラフまたは帯グラフを用いることにより、評価値の各レベルの発生割合を容易に示すことができる。According to thesecond aspect, by using a pie chart or band chart as the first graph, it is possible to easily show the rate of occurrence of each level of the evaluation value.
上記第3または第12の局面によれば、利用者は、処理ユニットにおける評価値の各レベルの発生回数の正確な値を知ることができる。According to thethird ortwelfth aspect, the user can know the exact number of occurrences of each level of evaluation value in the processing unit.
上記第4の局面によれば、第2のグラフとして棒グラフまたは折れ線グラフを用いることにより、最悪レベルの発生状況の時間的変化を容易に示すことができる。According to thefourth aspect, by using a bar graph or a line graph as the second graph, it is possible to easily show temporal changes in the occurrence of the worst level.
上記第5または第13の局面によれば、評価結果画面は、条件を満たす基板に関する評価値のレベルに基づき表示される。したがって、利用者は、好適な条件を与えて、基板処理装置の状態を容易に把握することができる。According to thefifth orthirteenth aspect, the evaluation result screen is displayed based on the level of the evaluation value for the board that satisfies the conditions. Therefore, the user can easily grasp the state of the substrate processing apparatus by giving suitable conditions.
上記第6の局面によれば、利用者は、特定の期間における処理ユニットの状態、特定の処理を行ったときの処理ユニットの状態、および、特定の処理ユニットの状態を容易に把握することができる。According to thesixth aspect, the user can easily grasp the state of the processing unit during a specific period, the state of the processing unit when the specific process is performed, and the state of the specific processing unit. can.
上記第7または第14の局面によれば、各種の画面を階層的に表示することにより、利用者は、悪いレベルの評価値を有する基板について時系列データや評価値を容易に解析することができる。According to theseventh orfourteenth aspect, by hierarchically displaying various screens, the user can easily analyze time-series data and evaluation values of substrates having evaluation values of poor levels. can.
上記第8の局面によれば、利用者は、履歴画面内で選択した処理結果に対応する、トレンド画面内のグラフ上の位置を容易に認識することができる。According to theeighth aspect, the user can easily recognize the position on the graph within the trend screen corresponding to the processing result selected within the history screen.
上記第9の局面によれば、利用者は、ログ統計画面を見ることにより、評価値の各レベルの発生回数の時間的変化を認識すると共に、最悪レベルが多く発生する要因を容易に認識することができる。According to theninth aspect, by viewing the log statistics screen, the user can recognize temporal changes in the number of occurrences of each level of the evaluation value, and easily recognize the factors that cause the worst level to occur frequently. be able to.
上記第10の局面によれば、基準データとして他の時系列データを用いることにより、時系列データについて好適な評価値を求めることができる。According to thetenth aspect, by using other time-series data as the reference data, it is possible to obtain a suitable evaluation value for the time-series data.
以下、図面を参照して、本発明の実施形態に係るデータ処理方法、データ処理装置、および、データ処理プログラムについて説明する。本実施形態に係るデータ処理方法は、典型的にはコンピュータを用いて実行される。本実施形態に係るデータ処理プログラムは、コンピュータを用いてデータ処理方法を実施するためのプログラムである。本実施形態に係るデータ処理装置は、典型的にはコンピュータを用いて構成される。データ処理プログラムを実行するコンピュータは、データ処理装置として機能する。 A data processing method, a data processing apparatus, and a data processing program according to embodiments of the present invention will be described below with reference to the drawings. The data processing method according to this embodiment is typically executed using a computer. A data processing program according to this embodiment is a program for carrying out a data processing method using a computer. The data processing apparatus according to this embodiment is typically configured using a computer. A computer that executes a data processing program functions as a data processing device.
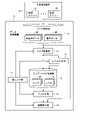
図1は、本発明の実施形態に係るデータ処理装置の構成を示すブロック図である。図1に示すデータ処理装置10は、データ記憶部11、スコア計算部12、レベル判定部13、スコア/レベル記憶部14、フィルタ部15、結果表示部16、および、指示入力部17を備えている。データ処理装置10は、基板処理装置20に接続して用いられる。 FIG. 1 is a block diagram showing the configuration of a data processing device according to an embodiment of the present invention. The
基板処理装置20は複数の処理ユニット25を含み、各処理ユニット25では処理ユニット25の動作状態を示す複数の物理量(例えば、長さ、角度、時間、速さ、力、圧力、電圧、電流、温度、流量など。以下、パラメータともいう)が測定される。これにより、複数の時系列データSDが得られる。なお、ここでは基板処理装置20は複数の処理ユニット25を含むこととするが、基板処理装置20は1個の処理ユニット25を含んでいてもよい。一般に、基板処理装置20は1以上の処理ユニット25を含んでいればよい。 The
データ記憶部11は、上記の方法で求めた時系列データSDと、時系列データSDの期待値データである基準データRDとを記憶する。基準データRDには、例えば、多数の時系列データの中で期待値データとして最適と判断された他の時系列データが使用される。スコア計算部12は、データ記憶部11に記憶された時系列データSDについて評価値(以下、スコアという)を求める。スコア計算部12は、データ記憶部11から時系列データSDと対応する基準データRDとを読み出し、両者を比較することによりスコアSCを求める。 The
レベル判定部13は、スコア計算部12で求めたスコアSCを複数のレベルに分類し、スコアSCのレベルLVを出力する。スコア/レベル記憶部14は、スコア計算部12で求めたスコアSCと、レベル判定部13で求めたレベルLVとを記憶する。フィルタ部15は、スコア/レベル記憶部14に記憶されたスコアSCとレベルLVの中から、与えられた条件を満たす基板に関するスコアSCとレベルLVを選択する。スコア計算部12は評価値計算部として機能し、フィルタ部15はレベル選択部として機能する。 The
結果表示部16は、処理ユニット25について、スコアSCの各レベルの発生割合を示すグラフを含む評価結果画面を表示する。指示入力部17には、利用者からの指示が入力される。利用者は、指示入力部17を用いて、スコア計算部12におけるスコアの計算方法、レベル判定部13におけるレベルの設定方法、フィルタ部15におけるフィルタ方法、結果表示部16に表示される画面の選択などを指示する。 The
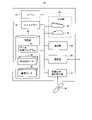
図2は、基板処理装置20の概略構成を示す図である。基板処理装置20は、インデクサ部21と処理部22を備えている。インデクサ部21は、複数のカセット保持部23とインデクサロボット24を含んでいる。処理部22は、複数の処理ユニット25と基板搬送ロボット26を含んでいる。カセット保持部23には、複数の基板を収容するカセット(図示せず)が載置される。インデクサロボット24は、カセットから基板を取り出す動作と、カセットに基板を入れる動作とを行う。処理ユニット25は、基板に対して処理を行うための空間(以下、チャンバーという)を有する。チャンバーは、処理ユニット25と1対1に対応する。チャンバーの内部では、例えば、処理液を用いて基板を洗浄するなどの処理が行われる。基板搬送ロボット26は、処理ユニット25に基板を搬入する動作と、処理ユニット25から基板を搬出する動作とを行う。処理ユニット25の個数は、任意でよい。例えば、処理ユニット25の個数が12個である場合、3個の処理ユニット25を積層したタワー構造体が、基板搬送ロボット26の周囲の4箇所に設けられる。 FIG. 2 is a diagram showing a schematic configuration of the
インデクサロボット24は、カセット保持部23に載置されたカセットから処理対象の基板を取り出し、取り出した基板を基板受け渡し部27を介して基板搬送ロボット26に渡す。基板搬送ロボット26は、インデクサロボット24から受け取った基板を対象の処理ユニット25に搬入する。基板に対する処理が終了すると、基板搬送ロボット26は、対象の処理ユニット25から基板を取り出し、取り出した基板を基板受け渡し部27を介してインデクサロボット24に渡す。インデクサロボット24は、基板搬送ロボット26から受け取った基板を対象のカセットに入れる。インデクサ部21と処理部22の制御は、基板処理装置20の制御部(図示せず)によって行われる。 The
以下、処理ユニット25が1枚の基板に対して行う処理を「単位処理」という。単位処理の実行中に、処理ユニット25では、センサなどを用いて複数の物理量(パラメータ)が測定される。複数の物理量の測定結果に基づき、複数の時系列データSDが得られる。得られた複数の時系列データSDは、データ記憶部11に記憶される。時系列データSDをグラフ化して示すと、例えば図3に実線で示すようになる。対応する基準データRDをグラフ化して示すと、例えば図3に破線で示すようになる。図3に示す例では、時系列データSDは、基準データRDと比べて立ち上がり時に遅れている。 Hereinafter, a process performed by the
図4は、データ処理装置10として機能するコンピュータの構成例を示すブロック図である。図4に示すコンピュータ30は、CPU31、メインメモリ32、記憶部33、入力部34、表示部35、通信部36、および、記録媒体読み取り部37を備えている。メインメモリ32には、例えば、DRAMが使用される。記憶部33には、例えば、ハードディスクが使用される。入力部34には、例えば、キーボード38やマウス39が含まれる。表示部35には、例えば、液晶ディスプレイが使用される。通信部36は、有線通信または無線通信のインターフェイス回路である。基板処理装置20や他のデータ処理装置との間の通信は、通信部36を用いて行われる。記録媒体読み取り部37は、プログラムなどを記録した記録媒体40のインターフェイス回路である。記録媒体40には、例えば、CD-ROMなどの非一過性の記録媒体が使用される。なお、以上に述べたコンピュータ30の構成は一例に過ぎず、任意のコンピュータを用いてデータ処理装置10を構成することができる。 FIG. 4 is a block diagram showing a configuration example of a computer that functions as the
以下、コンピュータ30がデータ処理装置10として機能する場合について説明する。この場合、記憶部33は、データ処理プログラム41、時系列データSD、および、基準データRDを記憶する。時系列データSDは、基板処理装置20から通信部36を用いて受信したものである。データ処理プログラム41と基準データRDは、例えば、サーバや他のコンピュータから通信部36を用いて受信したものでもよく、記録媒体40から記録媒体読み取り部37を用いて読み出したものでもよい。基準データRDは、記憶部33に記憶された時系列データSDの中から利用者が入力部34を用いて選択したものでもよい。データ処理プログラム41を実行するときには、データ処理プログラム41、時系列データSD、および、基準データRDはメインメモリ32に複写転送される。CPU31は、メインメモリ32を作業用メモリとして利用して、メインメモリ32に記憶されたデータ処理プログラム41を実行することにより、時系列データSDのスコアSCを求める処理、スコアSCのレベルLVを求める処理、与えられた条件を満たす基板に関するスコアSCとレベルLVを選択する処理、選択されたスコアSCとレベルLVに基づき評価結果画面を表示する処理などを行う。このときコンピュータ30は、データ処理装置10として機能する。 A case where the
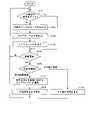
図5は、データ処理装置10の動作を示すフローチャートである。データ処理装置10が動作を開始する前に、データ記憶部11には時系列データSDと基準データRDが記憶されている。データ処理装置10は、図5に示すステップS101~S109を繰り返し実行する。 FIG. 5 is a flow chart showing the operation of the
図5に示すように、スコア計算部12は、未処理の時系列データSDがあるか否かを判断し、Yesの場合はステップS102へ進み、Noの場合はステップS105へ進む(ステップS101)。前者の場合、スコア計算部12は、未処理の時系列データSDのスコアSCを求める(ステップS102)。ステップS102において、スコア計算部12は、時系列データSDと対応する基準データRDとを比較することによりスコアSCを求める。 As shown in FIG. 5, the
次に、レベル判定部13は、ステップS102で求めたスコアSCのレベルLVを求める(ステップS103)。レベル判定部13は、スコアSCのレベル分けに用いる複数の閾値を有する。ステップS103において、レベル判定部13は、ステップS102で求めたスコアSCと複数の閾値とを比較することにより、スコアSCのレベルLVを求める。次に、スコア/レベル記憶部14は、ステップS102で求めたスコアSCと、ステップS103で求めたレベルLVとを記憶する(ステップS104)。 Next, the
次に、結果表示部16は、画面を更新するか否かを判断し、Yesの場合はステップS106へ進み、Noの場合はステップS101へ進む(ステップS105)。ステップS105において、結果表示部16は、スコア/レベル記憶部14が新しいレベルLVを記憶したとき、利用者が指示を入力したときなどに画面を更新すると判断する。 Next, the
ステップS105でYesの場合、結果表示部16は、表示すべき画面の種類が評価結果画面かログ統計画面かを判断し、前者の場合はステップS107へ進み、後者の場合はステップS109へ進む(ステップS106)。前者の場合、フィルタ部15は、スコア/レベル記憶部14に記憶されたスコアSCとレベルLVの中から、与えられた条件を満たす基板に関するスコアSCとレベルLVを選択する(ステップS107)。次に、結果表示部16は、ステップS107で選択されたスコアSCとレベルLVに基づき、評価結果画面を表示する(ステップS108)。 If Yes in step S105, the
ステップS106でログ統計画面の場合、データ処理装置10は、ログ統計画面を表示する(ステップS109)。ステップS108またはS109を実行した後、データ処理装置10の制御はステップS101へ進む。 In the case of the log statistics screen in step S106, the
図5に示すフローチャートにおいて、スコア計算部12が行うステップS102は、評価値計算ステップに該当する。レベル判定部13が行うステップS103は、レベル判定ステップに該当する。フィルタ部15が行うステップS107は、レベル選択ステップに該当する。結果表示部16が行うステップS108とS109は、結果表示ステップに該当する。 In the flowchart shown in FIG. 5, step S102 performed by the
以下、基板処理装置20は12個の処理ユニット25を有し、レベル判定部13はスコアSCを4個のレベルに分類するものとする。基板処理装置20が1回の単位処理を行うと、複数の時系列データSDが得られる。スコア計算部12は、基板ごとに各時系列データSDについてスコアSCを求める。レベル判定部13は、スコアSCの種類に対応して、3個の閾値THa~THc(ただし、THa<THb<THc)を有する。レベル判定部13は、閾値THa~THcを用いてスコアSCを4個のレベルに分類する。より詳細には、レベル判定部13は、THa未満のスコア、THa以上THb未満のスコア、THb以上THc未満のスコア、および、THc以上のスコアを、それぞれ、レベル1~4に分類する。スコアSCが小さいほど(スコアSCが良いほど)、レベルLVは小さくなる。レベル1~4のうち、レベル1は最良レベルであり、レベル4は最悪レベルである。 Hereinafter, it is assumed that the
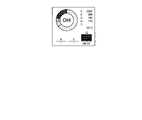
図6は、結果表示部16が表示する評価結果画面を示す図である。図6に示す評価結果画面50は、複数の処理ユニット25に対応して、複数の表示領域51を有する。複数の表示領域51は、評価結果画面50内に2次元状に配置される。評価結果画面50の左側部分には、基板処理装置20の外観図や識別子、状態表示アイコンなどが表示される。評価結果画面50の上側部分には、アイコン55~57が表示される。なお、図6に示す評価結果画面50は、悪いレベルの発生回数が多いときの説明用の画面である。実際には、悪いレベルの発生回数は、図6に示す値よりも少ない。 FIG. 6 is a diagram showing an evaluation result screen displayed by the
評価結果画面50は、12個の処理ユニット25に対応して、12個の表示領域51を有する。各表示領域51の内部には、円グラフ52、レベル発生回数53、および、棒グラフ54が表示される。円グラフ52の内部に表示された文字列「CHn(nは自然数)」は、処理ユニット25に対応するチャンバーの番号がnであることを示す。 The
評価結果画面50を表示するときには、スコア評価期間(例えば30日間)が設定され、スコア評価期間内に処理された基板について、処理ユニット25についてスコアSCのレベル1~4の発生回数が求められる。レベル発生回数53は、レベル1~4の発生回数とその合計(文字Tの右下に記載された数字)とを含んでいる。 When the
円グラフ52は、レベル1~4の発生割合を示す。円グラフ52は、悪いレベルほど利用者によって認識されやすい態様で表示される。評価結果画面50の背景が白色の場合、円グラフ52は、例えば、悪いレベルほど濃い色で表示される。レベル1~4は、それぞれ、例えば、薄い水色、濃い水色、薄い青色、および、濃い青色で表示される。 A
棒グラフ54は、所定の方法で基板を処理したときのスコアの最悪レベルの発生回数の時間的変化を示す。スコア評価期間は3個の期間(以下、第1~第3期間という)に分割され、複数のレシピの中から一のレシピ(以下、特定レシピという)が選択される。第1~第3期間においてある基板(1枚の基板)を特定レシピで処理したときの結果を、それぞれ、第1~第3レシピ処理結果という。棒グラフ54は、第1~第3レシピ処理結果に含まれるレベル4の発生回数を時系列順に示す。棒グラフ54の各棒線の上には、レベル4の発生回数が表示される。棒グラフ54の各棒線の下には、それぞれ、「old」、「middle」、および、「latest」と表示される。棒グラフ54は、最も高い棒線の高さが一定になるように、高さを調整して表示される。 A
スコア評価期間が30日間である場合、スコア評価期間は30日前から21日前までの第1期間、20日前から11日前までの第2期間、および、10日前から本日までの第3期間に分割される。棒グラフ54は、例えば、30日前にある基板を特定レシピで処理したときのレシピ処理結果に含まれるレベル4の発生回数、15日前にある基板を特定レシピで処理したときのレシピ処理結果に含まれるレベル4の発生回数、および、直前にある基板を特定レシピで処理したときのレシピ処理結果に含まれるレベル4の発生回数を示す。 If the score evaluation period is 30 days, the score evaluation period is divided into a first period from 30 days ago to 21 days ago, a second period from 20 days ago to 11 days ago, and a third period from 10 days ago to today. be. The
利用者は、評価結果画面50を見ることにより、基板処理装置20の状態を容易に把握することができる。特に、本実施形態に係る基板処理装置20は、複数の処理ユニット25を含んでいる。したがって、利用者は、処理ユニット25において多数の測定結果に基づき得られた多数の時系列データが示す基板処理装置20の異常状態を容易に把握することができる。 A user can easily grasp the state of the
なお、図6では、図面記載の都合上、評価結果画面50を白色、黒色、および、パターンを用いて表現しているが、実際には、評価結果画面50は複数の色を用いて表示される。評価結果画面50は、円グラフ52に代えて、スコアの各レベルの発生割合を示す帯グラフを含んでいてもよく、棒グラフ54に代えて、スコアの最悪レベルの発生状況の時間的変化を示す折れ線グラフを含んでいてもよい。評価結果画面50は、4個以上の棒線を有する棒グラフ54を含んでいてよい。また、分割した各期間において複数の基板を特定レシピで処理した結果をレシピ処理結果として用いてもよい。また、複数のレシピを特定レシピとして選択し、特定レシピで処理した結果をレシピ処理結果として用いてもよい。 In FIG. 6, the
データ処理装置10は、評価結果画面50を表示する機能に加えて、期間フィルタ機能、レシピフィルタ機能、チャンバーフィルタ機能、階層表示機能、および、ログ統計画面表示機能を有する。以下、これらの機能を順に説明する。 The
まず、期間フィルタ機能について説明する。図7は、評価結果画面50の一部を拡大して示す図である。利用者がマウス39を操作してアイコン56を選択すると、図7に示すプルダウンメニュー58が表示される。プルダウンメニュー58の各項目は、スコア評価期間の長さを示す。「12h」、「24h」、「2d」、「7d」および「30d」は、それぞれ、12時間、24時間、2日間、7日間、および、30日間を示す。利用者がマウス39を操作してプルダウンメニュー58の中から1個の項目を選択することにより、スコア評価期間が設定される。 First, the period filter function will be described. FIG. 7 is an enlarged view of a portion of the
フィルタ部15は、スコア/レベル記憶部14に記憶されたスコアSCとレベルLVの中から、スコア評価期間内に処理された基板に関するスコアSCとレベルLVを選択する。結果表示部16は、フィルタ部15で選択されたスコアSCとレベルLVに基づき、処理ユニット25について、円グラフ52、レベル発生回数53、および、棒グラフ54を含む評価結果画面50を表示する。例えば、スコア評価期間の長さが30日間の場合、評価結果画面50に含まれるレベル発生回数53は、30日前から現時点までに処理された基板に関するスコアSCのレベル1~4の発生回数とその合計を示す。 The
次に、レシピフィルタ機能について説明する。利用者がマウス39を操作してアイコン55を選択すると、評価結果画面50に重畳して、図8に示すレシピ選択画面60が表示される。レシピ選択画面60は、オン状態とオフ状態に切り替え可能なスイッチ61とレシピリスト62を含んでいる。スイッチ61のデフォルトの状態は、オン状態である。レシピリスト62の各行には、レシピの識別子、レシピの名称、および、レシピの状態が表示される。レシピの状態は、有効状態(Enabled)または無効状態(Disabled)である。 Next, the recipe filter function will be explained. When the user operates the
スイッチ61がオン状態のときには、レシピリスト62に含まれる、すべての有効状態のレシピが選択される。スイッチ61がオフ状態のときには、利用者がマウス39を操作してレシピリスト62の中から1個または複数のレシピを選択する。フィルタ部15は、スコア/レベル記憶部14に記憶されたスコアSCとレベルLVの中から、選択されたレシピに従い処理された基板に関するスコアSCとレベルLVを選択する。結果表示部16は、フィルタ部15で選択されたスコアSCとレベルLVに基づき、処理ユニット25について、円グラフ52、レベル発生回数53、および、棒グラフ54を含む評価結果画面50を表示する。例えば、レシピ「Recipe031」が選択された場合、評価結果画面50に含まれるレベル発生回数53は、レシピ「Recipe031」に従い処理された基板についてのスコアSCのレベル1~4の発生回数とその合計を示す。 When the
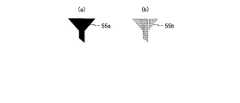
アイコン55は、スイッチ61の状態に応じた態様で表示される。スイッチ61がオン状態のときは、所定の色を用いて、図9(a)に示すアイコン55aが表示される。スイッチ61がオフ状態のときは、異なる色を用いて、図9(b)に示すアイコン55bが表示される。このようにレシピフィルタの適用状態に応じてアイコン55を異なる態様で(異なる色で)表示することにより、利用者はレシピフィルタを適用しているか否かを容易に認識することができる。
スイッチ61がオン状態、または、スイッチ61がオフ状態で複数のレシピが選択されている場合には、上述したように、棒グラフ54の各棒線の下には、それぞれ、「old」、「middle」、および、「latest」と表示される(図6)。これに対して、スイッチ61がオフ状態で1個のレシピだけが選択されている場合には、図10に示すように、棒グラフ54の3番目の棒線の下には、第3レシピ処理結果が得られたときの基板に対する処理の開始日(または、開始時刻)が表示される。図10に記載された文字列「8/22」は、第3レシピ処理結果が得られたときの基板に対する処理の開始日が8月22日であることを示す。棒グラフ54の1番目および2番目の棒線の下には、対象期間外であることを示す記号「-」が表示される。1個のレシピだけが選択されている場合に上記の表示を行うことにより、利用者はどの日時に処理された時系列データから詳細な調査を行えばよいかを知ることができる。 When the
次に、チャンバーフィルタ機能について説明する。図11は、データ処理装置10の他の評価結果画面を示す図である。図11に示す評価結果画面59は、12個の処理ユニット25のうち9個の処理ユニットに対応して、9個の表示領域51を有する。評価結果画面59の各表示領域51の内部には、円グラフ52、レベル発生回数53、および、棒グラフ54が表示される。 Next, the chamber filter function will be explained. FIG. 11 is a diagram showing another evaluation result screen of the
評価結果画面59を表示するときには、12個の処理ユニット25の中から、評価結果を表示する処理ユニット(以下、表示対象処理ユニットという)が選択される。表示対象処理ユニットは、データ処理装置10の初期設定時に予め選択されていてもよく、利用者が任意に選択してもよい。フィルタ部15は、スコア/レベル記憶部14に記憶されたスコアSCとレベルLVの中から、表示対象処理ユニットで処理された基板に関するスコアSCとレベルLVを選択する。結果表示部16は、フィルタ部15で選択されたスコアSCとレベルLVに基づき、表示対象処理ユニットについて、円グラフ52、レベル発生回数53、および、棒グラフ54を含む評価結果画面59を表示する。When the
表示対象処理ユニットの個数が処理ユニット25の個数(ここでは12個)よりも少ない場合には、評価結果画面内の表示領域の位置は、評価結果画面50内の表示領域51の位置と異なっていてもよい。また、評価結果画面内の表示領域のサイズは、評価結果画面50内の表示領域51のサイズよりも大きくてもよい。 When the number of processing units to be displayed is smaller than the number of processing units 25 (here, 12), the position of the display area within the evaluation result screen is different from the position of the
フィルタ部15は、期間フィルタ、レシピフィルタ、および、チャンバーフィルタを任意に組み合わせて、スコアSCとレベルLVを選択してもよい。また、フィルタ部15は、上記以外のフィルタ処理を行ってもよい。 The
次に、図12~図19を参照して、階層表示機能について説明する。図12~図19には、図6に示す評価結果画面50に重畳して、タブ形式で切り替えて表示される各種の画面が記載されている。図12~図19に示す画面の上側部分には、アイコン81~84が表示される。 Next, the hierarchical display function will be described with reference to FIGS. 12 to 19. FIG. FIGS. 12 to 19 describe various screens that are displayed by switching in a tab format superimposed on the
利用者がマウス39を操作して評価結果画面50内で1個の処理ユニット(ここでは、12番目の処理ユニット25)を選択すると、図12に示すスコアリング設定画面71が表示される。スコアリング設定画面71内のリストの各行には、スコアを求めた方法(以下、スコアリング設定という)と、その方法を用いたときの各レベルの発生回数とが表示される。スコアリング設定には、スコアリング設定の識別子、レシピの名称、基準データの名称などが含まれる。スコアリング設定画面71内のリストの3行目に記載された数字「8086」は、12番目の処理ユニット25が複数の基板に対してレシピ「Recipe031」に従い処理を行い、そのときに得られた時系列データを基準データ「ReferenceData038」と比較してスコアを求めたときに、レベル4の発生回数が8086回であることを示す。 When the user operates the
利用者がマウス39を操作してスコアリング設定画面71内のリストの中から1個のスコアリング設定(ここでは、3行目のスコアリング設定)を選択すると、図13に示すスコアリング履歴画面72が表示される。スコアリング履歴画面72のリストの各行には、1枚の基板に対して単位処理を行った結果(以下、処理結果という)が表示される。処理結果には、全体評価(Total)、レベル1~4の発生回数、レシピの名称、処理開始日時、処理終了日時などが含まれる。スコアリング履歴画面72内のリストの2行目に記載された数字「8」は、12番目の処理ユニット25が2018年8月23日9時52分54秒から処理を開始した基板についてレベル4の発生回数が8回であることを示す。全体評価の欄は、発生した最悪レベルに割り当てられた色で表示される。発生した最悪レベルがレベル1~4のときには、全体評価の欄は、それぞれ、例えば、薄い水色、濃い水色、薄い青色、および、濃い青色で表示される。 When the user operates the
スコアリング履歴画面72は、検索設定部85を有する。利用者は、マウス39とキーボード38を操作して、検索設定部85内の各欄(レシピの名称、期間、警告などの欄)に検索用の文字列を入力したり、チェックを入れたりした後に、検索ボタン86を押す。これにより、スコアリング履歴画面72内のリストには、検索設定部85を用いて指定された条件を満たす基板に対する処理結果が表示される。なお、文字列検索を行うときには、部分一致と全文一致を選択することができる。
The scoring
利用者がマウス39を操作してスコアリング履歴画面72内のリストの中から1個の処理結果(ここでは、2行目の処理結果)を選択し、その後にアイコン81を選択すると、図14に示す詳細スコア画面73が表示される。詳細スコア画面73内のリストの各行には、パラメータの名称とスコアが表示される。スコアの欄は、スコアのレベルに割り当てられた色で表示される。スコアのレベルが1~4のときには、スコアの欄は、それぞれ、例えば、薄い水色、濃い水色、薄い青色、および、濃い青色で表示される。詳細スコア画面73内のリストの3行目に記載された数字「21.138」は、パラメータ「Parameter006」についてのスコアが21.138であることを示す。このスコアのレベルは4である。 When the user operates the
利用者がマウス39を操作して詳細スコア画面73内のリストの中から1個のパラメータ(ここでは、3行目のパラメータ)を選択し、その後にアイコン82を選択すると、図15に示すグラフ画面74が表示される。グラフ画面74には、縦方向のサイズが相対的に大きい2個のグラフと、縦方向のサイズが相対的に小さい2個のグラフとが含まれる(以下、前者を拡大グラフ、後者を全体グラフという)。2個のグラフのうち一方は基準データRDのグラフであり、他方は時系列データSDのグラフである。 When the user operates the
全体グラフは、表示すべき期間の全体を示す。拡大グラフは、全体グラフのうち利用者が指定した範囲を拡大して示す。拡大グラフに含まれる全体グラフの横方向の範囲は、利用者がマウス39を操作して全体グラフの一部を選択することにより指定される。拡大グラフに含まれる全体グラフの縦方向の範囲は、利用者がマウス39とキーボード38を操作して「Set Y Range」と記載された2個の欄に縦方向の最小値と最大値を入力することにより指定される。なお、図15(および後述する図16、図18、図19)では、全体グラフの横方向の全体が、拡大グラフに含まれる全体グラフの横方向の範囲として指定されている。 The overall graph shows the entire period to be displayed. The enlarged graph shows an enlarged range specified by the user in the entire graph. The horizontal range of the overall graph included in the enlarged graph is designated by the user operating the
利用者がマウス39を操作して詳細スコア画面73内のリストの中から1個のパラメータ(ここでは、3行目のパラメータ)を選択し、その後にアイコン83を選択すると、図16に示すトレンド画面75が表示される。トレンド画面75には、1個の全体グラフと1個の部分グラフが含まれる。各グラフは、スコアの時間的変化を示す。トレンド画面75内の全体グラフには、スコアリング履歴画面72内で選択された処理結果に対応する位置にマーク87が付けられる。マーク87は、利用者が認識しやすい態様で(例えば、赤色の円で)表示される。 When the user operates the
利用者がマウス39を操作してスコアリング履歴画面72内のリストの中から複数の処理結果(ここでは、2行目、4行目、7行目、および、8行目の処理結果)を選択し、その後にアイコン84を選択すると、図17に示すサマリー画面76が表示される。サマリー画面76には、2個のリストが含まれる。上側のリストには、スコアリング履歴画面72内で選択された複数の処理結果が表示される。下側のリストの各行には、複数の基板に対する処理結果として、パラメータの名称とレベル1~4の発生回数が表示される。サマリー画面76内の下側のリストの3行目に記載された数字「2」は、スコアリング履歴画面72内で選択された4個の処理結果(4枚の基板の処理結果)では、パラメータ「Parameter006」についてレベル4の発生回数が2回であることを示す。 The user operates the
利用者がマウス39を操作してサマリー画面76内の下側のリストの中から1個のパラメータ(ここでは、3行目のパラメータ)を選択し、その後にアイコン82を選択すると、図18に示すグラフ画面77が表示される。スコアリング履歴画面72内のリストの中から選択された処理結果の個数がm個(mは2以上の自然数)のとき、グラフ画面77には(m+1)個の部分グラフと(m+1)個の全体グラフとが含まれる。(m+1)個のグラフのうち1個は基準データRDのグラフであり、それ以外は時系列データSDのグラフである。 When the user operates the
利用者がマウス39を操作してサマリー画面76内の下側のリストの中から1個のパラメータ(ここでは、3行目のパラメータ)を選択し、その後にアイコン83を選択すると、図19に示すトレンド画面78が表示される。トレンド画面78に表示されるグラフは、トレンド画面75に表示されるグラフと同じである。トレンド画面78内の全体グラフには、スコアリング履歴画面72内で選択された複数の処理結果に対応する位置に複数のマーク87(ここでは、4個のマーク)が付けられる。 When the user operates the
このように結果表示部16は、評価結果画面50、スコアリング設定画面71、および、スコアリング履歴画面72を階層的に表示する。スコアリング履歴画面72内で1個の処理結果が選択されたときには、結果表示部16は、続いて詳細スコア画面73、および、グラフ画面74またはトレンド画面75を階層的に表示する。スコアリング履歴画面72内で複数の処理結果が選択されたときには、結果表示部16は、続いてサマリー画面76、および、グラフ画面77またはトレンド画面78を階層的に表示する。 Thus, the
スコアリング設定画面71は、評価値を求めた方法(スコアリング設定)を選択するための画面に該当する。スコアリング履歴画面72は、評価値(スコア)を求めた履歴を表示する履歴画面に該当する。詳細スコア画面73とサマリー画面76は、表示対象を選択するための画面に該当する。グラフ画面74、77は、時系列データSDのグラフを含む画面に該当する。トレンド画面75、78は、評価値(スコア)の時間的変化を示すグラフを含んでいる。 The
次に、ログ統計画面表示機能について説明する。図20は、図5に示すステップS109で表示されるログ統計画面を示す図である。図20に示すログ統計画面90は、4個の棒グラフ91~94を含んでいる。ログ統計画面90の上側部分には、アイコン55、95、96が表示される。ログ統計画面90は、図6に示す評価結果画面50の左側部分にある状態表示アイコンを切り替えることにより表示される。なお、図面記載の都合上、ログ統計画面90におけるレベル1~4の発生回数と評価結果画面50におけるレベル1~4の発生回数とは一致していない。 Next, the log statistics screen display function will be described. FIG. 20 shows the log statistics screen displayed in step S109 shown in FIG. A log statistics screen 90 shown in FIG. 20 includes four bar graphs 91-94.
ログ統計画面90を表示するときには、集計期間と集計単位が設定される。利用者がマウス39を操作してアイコン96を選択すると、カレンダー画面(図示せず)が表示される。利用者がマウス39を操作してカレンダー画面の中から2個の日付を選択することにより、集計期間の開始日と終了日が設定される。利用者がマウス39を操作してアイコン95を選択すると、プルダウンメニュー(図示せず)が表示される。プルダウンメニューの各項目は、集計単位を示す。利用者がマウス39を操作してプルダウンメニューの中から1個の項目を選択することにより、集計単位が設定される。ログ統計画面90では、集計期間は2018年6月23日から2018年8月22日までの期間に設定され、集計単位は1日(Daily)に設定されている。 When the log statistics screen 90 is displayed, an aggregation period and an aggregation unit are set. When the user operates the
棒グラフ91は、集計期間内に処理された基板についてスコアSCのレベル1~4の発生回数の時間的変化を示す。棒グラフ91に含まれる各棒線は、すべての処理ユニット25で集計単位(ここでは、1日)内に処理された基板についてレベル1~4の発生回数を示す。棒グラフ91は、円グラフ52と同様に、悪いレベルほど利用者によって認識されやすい態様で表示される。レベル1~4は、それぞれ、例えば、薄い水色、濃い水色、薄い青色、および、濃い青色で表示される。棒グラフ92~94は、集計期間内に処理された基板についてレベル4の発生回数を発生要因に分けてランキング形式で示す。棒グラフ92は、パラメータごとにレベル4の発生回数をランキング形式で示す。棒グラフ93は、チャンバーごとにレベル4の発生回数をランキング形式で示す。棒グラフ94は、レシピごとにレベル4の発生回数をランキング形式で示す。 A
利用者がマウス39を操作してログ統計画面90に含まれるアイコン55を選択したときには、フィルタ部15は、利用者が評価結果画面50に含まれるアイコン55を選択したときと同じフィルタ処理を行う。結果表示部16は、フィルタ部15で選択されたスコアSCとレベルLVに基づき、ログ統計画面90を表示する。 When the user operates the
以上に示すように、本実施形態に係るデータ処理方法は、1以上の処理ユニット25を有する基板処理装置20で得られた時系列データSDを処理するために、時系列データSDと基準データRDとを比較することにより、時系列データSDの評価値(スコアSC)を求める評価値計算ステップ(S102)と、評価値を複数のレベルに分類するレベル判定ステップ(S103)と、処理ユニット25について、評価値の各レベルの発生割合を示す第1のグラフ(円グラフ52)を含む評価結果画面50を表示する結果表示ステップ(S108)とを備えている。 As described above, in the data processing method according to the present embodiment, in order to process the time-series data SD obtained by the
したがって、利用者は、第1のグラフを見ることにより、処理ユニット25において各レベル(特に、最悪レベルであるレベル4)がどの程度の割合で発生しているかを容易に認識することができる。特に、基板処理装置20が複数の処理ユニット25を含む場合には、利用者は、複数の第1のグラフを相互に比較することにより、いずれの処理ユニット25で最悪レベル(レベル4)が高い割合で発生しているかを容易に認識することができる。このように利用者は、基板処理装置20の状態を容易に把握することができる。 Therefore, by looking at the first graph, the user can easily recognize how often each level (in particular,
第1のグラフは、悪いレベルほど認識しやすい態様で(濃い色で)表示される。これにより、上記の効果は顕著になる。第1のグラフは、円グラフまたは帯グラフである。したがって、評価値の各レベルの発生割合を容易に示すことができる。 The first graph is displayed (in a darker color) in a manner that makes it easier to recognize worse levels. Thereby, the above effect becomes remarkable. The first graph is a pie graph or band graph. Therefore, it is possible to easily indicate the rate of occurrence of each level of the evaluation value.
評価結果画面50は、処理ユニット25について、評価値の各レベルの発生回数(レベル発生回数53)を含む。したがって、利用者は、処理ユニット25における評価値の各レベルの発生回数の正確な値を知ることができる。 The
評価結果画面50は、処理ユニット25について、所定の方法で(特定レシピで)基板を処理したときの評価値の最悪レベルの発生回数の時間的変化を示す第2のグラフ(棒グラフ54)を含む。したがって、利用者は、第2のグラフを見ることにより、最悪レベルの発生状況の時間的変化を知り、処理ユニット25が異常状態に近づいているか否かを認識することができる。第2のグラフは、棒グラフまたは折れ線グラフである。したがって、最悪レベルの発生状況の時間的変化を容易に示すことができる。 The
本実施形態に係るデータ処理方法は、評価値計算ステップで求めた評価値の中から、与えられた条件を満たす基板に関する評価値を選択する評価値選択ステップ(S106)を備え、結果表示ステップは、評価値選択ステップで選択された評価値に基づき評価結果画面50を表示する。したがって、利用者は、好適な条件を与えて、基板処理装置20の状態を容易に把握することができる。評価値選択ステップは、少なくとも基板の処理期間、基板に対する処理、および、基板を処理した処理ユニットのいずれかを条件として、レベルを選択する。したがって、利用者は、特定の期間における処理ユニット25の状態、特定の処理を行ったときの処理ユニット25の状態、および、特定の処理ユニット25の状態を容易に把握することができる。 The data processing method according to this embodiment includes an evaluation value selection step (S106) for selecting an evaluation value relating to a substrate that satisfies a given condition from among the evaluation values obtained in the evaluation value calculation step, and the result display step includes the result display step. , the
結果表示ステップは、評価結果画面50の他に、評価値を求めた方法を選択するための画面(スコアリング設定画面71)、評価値を求めた履歴を表示する履歴画面(スコアリング履歴画面72)、表示対象を選択するための画面(詳細スコア画面73、サマリー画面76)、および、時系列データSDのグラフを含む画面(グラフ画面74、77)、または、評価値の時間的変化を示すグラフを含むトレンド画面75、78のいずれかを階層的に表示する。したがって、利用者は、悪いレベルの評価値を有する基板について時系列データSDや評価値を容易に解析することができる。結果表示ステップは、トレンド画面75、78を表示し、トレンド画面75、78内のグラフには、履歴画面内で選択された処理結果に対応する位置にマーク87が付けられている。したがって、利用者は、履歴画面内で選択した処理結果に対応する、トレンド画面75、78内のグラフ上の位置を容易に認識することができる。 The result display step includes, in addition to the
結果表示ステップは、集計期間内に処理された基板について評価値の各レベルの発生回数の時間的変化を示すグラフ(棒グラフ91)と、集計期間内に処理された基板について評価値の最悪レベルの発生回数を発生要因に分けてランキング形式で示すグラフ(棒グラフ92~94)とを含むログ統計画面90を表示する。したがって、利用者は、ログ統計画面90を見ることにより、各レベルの発生回数の時間的変化を認識すると共に、最悪レベルが多く発生する要因を容易に認識することができる。基準データRDとして他の時系列データを用いることにより、時系列データSDについて好適な評価値を求めることができる。 In the result display step, a graph (bar graph 91) showing temporal changes in the number of occurrences of each level of evaluation values for substrates processed within the aggregation period and the worst level of evaluation values for substrates processed within the aggregation period. A log statistics screen 90 including graphs (
本実施形態に係るデータ処理装置10およびデータ処理プログラム41は、上記のデータ処理方法と同様の特徴を有し、同様の効果を奏する。本実施形態に係るデータ処理方法、データ処理装置10、および、データ処理プログラム41によれば、利用者は、基板処理装置20に含まれる1以上の処理ユニット25の状態を容易に把握することができる。 The
なお、以上に述べたデータ処理方法では、評価結果画面50は、レベル発生回数53、円グラフ52、および、棒グラフ54を含むこととした。しかし、評価結果画面50は、レベル発生回数53、円グラフ52、および、棒グラフ54を必ずしもすべて含む必要はない。また、本実施形態に係るデータ処理方法は、期間フィルタ機能、レシピフィルタ機能、チャンバーフィルタ機能、階層表示機能、および、ログ統計画面表示機能を有することとした。変形例に係るデータ処理方法では、上記の処理を全く有していなくてもよく、上記の処理から任意に選択した処理だけを有していてもよい。変形例に係るデータ処理装置およびデータ処理プログラムについても、これと同様である。 In the data processing method described above, the
10…データ処理装置
11…データ記憶部
12…スコア計算部
13…レベル判定部
14…スコア/レベル記憶部
15…フィルタ部
16…結果表示部
17…指示入力部
20…基板処理装置
25…処理ユニット
30…コンピュータ
31…CPU
32…メインメモリ
40…記録媒体
41…データ処理プログラム
50、59…評価結果画面
51…表示領域
52…円グラフ
53…レベル発生回数
54、91~94…棒グラフ
60…レシピ選択画面
71…スコアリング設定画面
72…スコアリング履歴画面
73…詳細スコア画面
74、77…グラフ画面
75、78…トレンド画面
76…サマリー画面
87…マーク
90…ログ統計画面
SD…時系列データ
RD…基準データ
SC…スコア
LV…レベルDESCRIPTION OF
32
Claims (15)
Translated fromJapanese前記時系列データと基準データとを比較することにより、前記時系列データの評価値を求める評価値計算ステップと、
前記評価値を複数のレベルに分類するレベル判定ステップと、
前記処理ユニットについて、前記評価値の各レベルの発生割合を示す第1のグラフを含む評価結果画面を表示する結果表示ステップとを備え、
前記複数のレベルは、最良レベルと最悪レベルを含み、
前記第1のグラフは、悪いレベルであるほど濃い色で表示され、
前記評価結果画面は、前記処理ユニットについて、所定の方法で基板を処理したときの前記評価値の最悪レベルの発生回数の時間的変化を示す第2のグラフをさらに含み、
前記第1のグラフと前記第2のグラフとは、前記処理ユニットごとに表示される、データ処理方法。A data processing method for processing time-series data obtainedfrom a sensor that measures a physical quantity indicating an operating state of a substrate processing apparatus having one or more processing units,
an evaluation value calculation step of obtaining an evaluation value of the time-series data by comparing the time-series data and reference data;
a level determination step of classifying the evaluation values into a plurality of levels;
a result display step of displaying an evaluation result screen including a first graph showing the rate of occurrence of each level of the evaluation value for the processing unit;
the plurality of levels includes a best level and a worst level;
The first graph is displayed in a darker color as the level is worse,
The evaluation result screen further includes a second graph showing temporal changes in the number of occurrences of the worst level of the evaluation value when the substrate is processed by a predetermined method for the processing unit,
The data processing method, wherein the first graph and the second graph are displayed for each processing unit .
前記結果表示ステップは、前記レベル選択ステップで選択されたレベルに基づき前記評価結果画面を表示することを特徴とする、請求項1~4のいずれかに記載のデータ処理方法。further comprising a level selection step of selecting a level related to the substrate satisfying given conditions from among the levels obtained in the level determination step;
5. The data processing method according to claim 1, wherein said result display step displays said evaluation result screen based on the level selected in said level selection step.
前記トレンド画面内のグラフには、前記履歴画面内で選択された処理結果に対応する位置にマークが付けられていることを特徴とする、請求項7に記載のデータ処理方法。The result display step displays the trend screen,
8. The data processing method according to claim7 , wherein the graph in the trend screen is marked at a position corresponding to the processing result selected in the history screen.
前記時系列データと基準データとを比較することにより、前記時系列データの評価値を求める評価値計算部と、
前記評価値を複数のレベルに分類するレベル判定部と、
前記処理ユニットについて、前記評価値の各レベルの発生割合を示す第1のグラフを含む評価結果画面を表示する結果表示部とを備え、
前記複数のレベルは、最良レベルと最悪レベルを含み、
前記第1のグラフは、悪いレベルであるほど濃い色で表示され、
前記評価結果画面は、前記処理ユニットについて、所定の方法で基板を処理したときの前記評価値の最悪レベルの発生回数の時間的変化を示す第2のグラフをさらに含み、
前記第1のグラフと前記第2のグラフとは、前記処理ユニットごとに表示される、データ処理装置。A data processing apparatus for processing time-series data obtained from a sensor that measures a physical quantity indicating an operating state of a substrate processing apparatus having one or more processing units,
an evaluation value calculation unit that calculates an evaluation value of the time-series data by comparing the time-series data with reference data;
a level determination unit that classifies the evaluation values into a plurality of levels;
a result display unit for displaying an evaluation result screen including a first graph showing the rate of occurrence of each level of the evaluation value for the processing unit;
the plurality of levels includes a best level and a worst level;
The first graph is displayed in a darker color as the level is worse,
The evaluation result screen further includes a second graph showing temporal changes in the number of occurrences of the worst level of the evaluation value when the substrate is processed by a predetermined method for the processing unit,
The data processing device, wherein the first graph and the second graph are displayed for each processing unit .
前記結果表示部は、前記レベル選択部で選択されたレベルに基づき前記評価結果画面を表示することを特徴とする、請求項11または12に記載のデータ処理装置。further comprising a level selection unit that selects a level related to a substrate that satisfies a given condition from among the levels determined by the level determination unit;
13. The data processing apparatus according to claim 11 , wherein said result display section displays said evaluation result screen based on the level selected by said level selection section.
前記時系列データと基準データとを比較することにより、前記時系列データの評価値を求める評価値計算ステップと、
前記評価値を複数のレベルに分類するレベル判定ステップと、
前記処理ユニットについて、前記評価値の各レベルの発生割合を示す第1のグラフを含む評価結果画面を表示する結果表示ステップとを、
コンピュータにCPUがメモリを利用して実行させ、
前記複数のレベルは、最良レベルと最悪レベルを含み、
前記第1のグラフは、悪いレベルであるほど濃い色で表示され、
前記評価結果画面は、前記処理ユニットについて、所定の方法で基板を処理したときの前記評価値の最悪レベルの発生回数の時間的変化を示す第2のグラフをさらに含み、
前記第1のグラフと前記第2のグラフとは、前記処理ユニットごとに表示される、データ処理プログラム。A data processing program for processing time-series data obtainedfrom a sensor that measures a physical quantity indicating an operating state of a substrate processing apparatus having one or more processing units,
an evaluation value calculation step of obtaining an evaluation value of the time-series data by comparing the time-series data and reference data;
a level determination step of classifying the evaluation values into a plurality of levels;
a result display step of displaying an evaluation result screen including a first graph showing the rate of occurrence of each level of the evaluation value for the processing unit;
The CPU makes the computer execute using the memory,
the plurality of levels includes a best level and a worst level;
The first graph is displayed in a darker color as the level is worse,
The evaluation result screen further includes a second graph showing temporal changes in the number of occurrences of the worst level of the evaluation value when the substrate is processed by a predetermined method for the processing unit,
The data processing program, wherein the first graph and the second graph are displayed for each processing unit .
Priority Applications (9)
| Application Number | Priority Date | Filing Date | Title |
|---|---|---|---|
| JP2018176256AJP7181033B2 (en) | 2018-09-20 | 2018-09-20 | DATA PROCESSING METHOD, DATA PROCESSING APPARATUS, AND DATA PROCESSING PROGRAM |
| KR1020190097208AKR102305100B1 (en) | 2018-09-20 | 2019-08-09 | Data processing method, data processing device, and computer readable recording medium with data processing program recorded thereon |
| CN201910752319.2ACN110928250A (en) | 2018-09-20 | 2019-08-15 | Data processing method, data processing apparatus, and recording medium |
| US16/543,611US11243862B2 (en) | 2018-09-20 | 2019-08-18 | Data processing method, data processing apparatus, and recording medium with data processing program recorded thereon |
| TW108130200ATWI736958B (en) | 2018-09-20 | 2019-08-23 | Data processing method, data processing apparatus, and recording medium with data processing program recorded thereon |
| KR1020210123038AKR102422220B1 (en) | 2018-09-20 | 2021-09-15 | Data processing method, data processing device, and computer readable recording medium with data processing program recorded thereon |
| US17/535,578US11829451B2 (en) | 2018-09-20 | 2021-11-25 | Data processing method, data processing apparatus, and recording medium with data processing program recorded thereon |
| JP2022183867AJP7498760B2 (en) | 2018-09-20 | 2022-11-17 | DATA PROCESSING METHOD, DATA PROCESSING APPARATUS, AND DATA PROCESSING PROGRAM |
| US18/472,213US12271448B2 (en) | 2018-09-20 | 2023-09-21 | Data processing method, data processing apparatus, and recording medium with data processing program recorded thereon |
Applications Claiming Priority (1)
| Application Number | Priority Date | Filing Date | Title |
|---|---|---|---|
| JP2018176256AJP7181033B2 (en) | 2018-09-20 | 2018-09-20 | DATA PROCESSING METHOD, DATA PROCESSING APPARATUS, AND DATA PROCESSING PROGRAM |
Related Child Applications (1)
| Application Number | Title | Priority Date | Filing Date |
|---|---|---|---|
| JP2022183867ADivisionJP7498760B2 (en) | 2018-09-20 | 2022-11-17 | DATA PROCESSING METHOD, DATA PROCESSING APPARATUS, AND DATA PROCESSING PROGRAM |
Publications (2)
| Publication Number | Publication Date |
|---|---|
| JP2020047077A JP2020047077A (en) | 2020-03-26 |
| JP7181033B2true JP7181033B2 (en) | 2022-11-30 |
Family
ID=69856607
Family Applications (2)
| Application Number | Title | Priority Date | Filing Date |
|---|---|---|---|
| JP2018176256AActiveJP7181033B2 (en) | 2018-09-20 | 2018-09-20 | DATA PROCESSING METHOD, DATA PROCESSING APPARATUS, AND DATA PROCESSING PROGRAM |
| JP2022183867AActiveJP7498760B2 (en) | 2018-09-20 | 2022-11-17 | DATA PROCESSING METHOD, DATA PROCESSING APPARATUS, AND DATA PROCESSING PROGRAM |
Family Applications After (1)
| Application Number | Title | Priority Date | Filing Date |
|---|---|---|---|
| JP2022183867AActiveJP7498760B2 (en) | 2018-09-20 | 2022-11-17 | DATA PROCESSING METHOD, DATA PROCESSING APPARATUS, AND DATA PROCESSING PROGRAM |
Country Status (5)
| Country | Link |
|---|---|
| US (3) | US11243862B2 (en) |
| JP (2) | JP7181033B2 (en) |
| KR (2) | KR102305100B1 (en) |
| CN (1) | CN110928250A (en) |
| TW (1) | TWI736958B (en) |
Families Citing this family (8)
| Publication number | Priority date | Publication date | Assignee | Title |
|---|---|---|---|---|
| USD843402S1 (en)* | 2017-04-10 | 2019-03-19 | Fisher & Paykel Healthcare Limited | Display screen or portion thereof with graphical user interface |
| JP7423396B2 (en)* | 2020-04-13 | 2024-01-29 | キヤノン株式会社 | Information processing device, detection method, program, substrate processing system, and article manufacturing method |
| CN112526418B (en)* | 2020-11-24 | 2024-05-28 | 上海辰光医疗科技股份有限公司 | Data recording and processing method for magnetic field uniformity measurement of magnetic resonance imaging |
| CN112565275B (en)* | 2020-12-10 | 2022-09-20 | 杭州安恒信息技术股份有限公司 | Anomaly detection method, device, equipment and medium for network security scene |
| JP2023031722A (en)* | 2021-08-25 | 2023-03-09 | 富士電機株式会社 | Log information analysis support device, analysis system, log information analysis support method, and program |
| JP2023043716A (en)* | 2021-09-16 | 2023-03-29 | 株式会社Screenホールディングス | Processing apparatus group management system, processing apparatus group management method, and program |
| USD1076952S1 (en)* | 2023-09-12 | 2025-05-27 | Salesforce, Inc. | Display screen or portion thereof with graphical user interface |
| TWI869170B (en)* | 2024-01-16 | 2025-01-01 | 一休資訊科技股份有限公司 | Data aggregation device and method thereof |
Citations (7)
| Publication number | Priority date | Publication date | Assignee | Title |
|---|---|---|---|---|
| JP2000077495A (en) | 1998-09-03 | 2000-03-14 | Hitachi Ltd | Inspection system and method for manufacturing electronic device using the same |
| JP2000200819A (en) | 2000-01-25 | 2000-07-18 | Hitachi Ltd | Inspection data analysis system and inspection data analysis method |
| JP2005267241A (en) | 2004-03-18 | 2005-09-29 | Toshiba Corp | Operation data management device and operation data management method |
| US20070219738A1 (en) | 2006-03-15 | 2007-09-20 | Applied Materials, Inc. | Tool health information monitoring and tool performance analysis in semiconductor processing |
| JP2009070052A (en) | 2007-09-12 | 2009-04-02 | Omron Corp | Monitoring device and program |
| JP2017112212A (en) | 2015-12-16 | 2017-06-22 | 株式会社荏原製作所 | Substrate processing apparatus and quality assurance method therefor |
| JP2018120533A (en) | 2017-01-27 | 2018-08-02 | 株式会社Screenホールディングス | Data processing system, data processing method and program |
Family Cites Families (34)
| Publication number | Priority date | Publication date | Assignee | Title |
|---|---|---|---|---|
| JPH08124977A (en)* | 1994-10-19 | 1996-05-17 | Hitachi Ltd | Semiconductor device failure analysis system |
| US6185324B1 (en) | 1989-07-12 | 2001-02-06 | Hitachi, Ltd. | Semiconductor failure analysis system |
| JPH08279526A (en) | 1995-04-07 | 1996-10-22 | Toshiba Corp | Abnormality monitoring system for semiconductor resin encapsulation equipment |
| JPH0950949A (en)* | 1995-05-26 | 1997-02-18 | Hitachi Ltd | Product manufacturing method and production management calculation system |
| JPH0954613A (en) | 1995-08-11 | 1997-02-25 | Toshiba Corp | Plant equipment monitoring device |
| JPH09184069A (en) | 1995-12-28 | 1997-07-15 | Canon Inc | Manufacturing process management method and display control method for continuous body |
| WO2000014790A1 (en)* | 1998-09-03 | 2000-03-16 | Hitachi, Ltd. | Inspection system and method for producing electronic device by using the same |
| JP2001265431A (en) | 2000-03-15 | 2001-09-28 | Hitachi Kokusai Electric Inc | Error output method |
| US7007038B1 (en)* | 2001-04-06 | 2006-02-28 | Ciena Corporation | Defect management database for managing manufacturing quality information |
| TWI286785B (en) | 2002-03-29 | 2007-09-11 | Tokyo Electron Ltd | Method for interaction with status and control apparatus |
| US7738693B2 (en)* | 2002-12-24 | 2010-06-15 | Lam Research Corporation | User interface for wafer data analysis and visualization |
| CA2567280A1 (en)* | 2004-05-21 | 2005-12-01 | Pressco Technology Inc. | Graphical re-inspection user setup interface |
| US7570797B1 (en)* | 2005-05-10 | 2009-08-04 | Kla-Tencor Technologies Corp. | Methods and systems for generating an inspection process for an inspection system |
| US7966150B2 (en)* | 2005-11-17 | 2011-06-21 | Florida Power & Light Company | Data analysis applications |
| JP4522423B2 (en) | 2007-02-23 | 2010-08-11 | 三菱電機株式会社 | Plant monitoring operation image integration system and monitoring operation image integration method |
| US7979362B2 (en)* | 2007-08-10 | 2011-07-12 | Motorola Solutions, Inc. | Interactive data mining system |
| JP4961390B2 (en)* | 2008-06-12 | 2012-06-27 | 株式会社日立製作所 | Plant monitoring and control apparatus and event analysis support method |
| JP5323457B2 (en)* | 2008-11-28 | 2013-10-23 | 株式会社日立ハイテクノロジーズ | Observation condition determination support apparatus and observation condition determination support method |
| JP5662738B2 (en)* | 2010-08-23 | 2015-02-04 | ミツミ電機株式会社 | Luminance control device and luminance control method |
| JP5634170B2 (en)* | 2010-08-31 | 2014-12-03 | キヤノン株式会社 | Information processing apparatus, power consumption management method, and program |
| US8723869B2 (en) | 2011-03-21 | 2014-05-13 | Tokyo Electron Limited | Biologically based chamber matching |
| CN102193857B (en)* | 2011-05-21 | 2014-12-03 | 浙江工业大学 | Method for quantitatively testing abnormal state of file allocation table (FAT) file system in embedded system |
| US8989478B2 (en)* | 2011-07-29 | 2015-03-24 | Kla-Tencor Corporation | Method and system for visualization of semiconductor wafer inspection data acquired in a photovoltaic cell production process |
| CN103556664B (en)* | 2013-11-13 | 2016-05-11 | 山推工程机械股份有限公司 | A kind of bull-dozer fault automatic protecting method and system |
| WO2015092679A1 (en)* | 2013-12-20 | 2015-06-25 | Koninklijke Philips N.V. | Medical intervention data display for patient monitoring systems |
| US9760273B2 (en)* | 2014-03-11 | 2017-09-12 | Sas Institute Inc. | Overview axis having a different graph element type |
| CN104503444B (en)* | 2014-12-31 | 2017-03-15 | 中联重科股份有限公司 | Fault handling method and system for engineering machinery |
| US10447546B1 (en)* | 2015-06-24 | 2019-10-15 | EMC IP Holding Company LLC | Customized visualizations for data centers |
| WO2017055073A1 (en)* | 2015-09-29 | 2017-04-06 | Asml Netherlands B.V. | Methods of modelling systems or performing predictive maintenance of lithographic systems |
| JP6599727B2 (en)* | 2015-10-26 | 2019-10-30 | 株式会社Screenホールディングス | Time-series data processing method, time-series data processing program, and time-series data processing apparatus |
| JP6645993B2 (en)* | 2016-03-29 | 2020-02-14 | 株式会社Kokusai Electric | Processing device, device management controller, program, and method of manufacturing semiconductor device |
| CN106385218B (en)* | 2016-11-23 | 2019-03-01 | 北京新能源汽车股份有限公司 | Method and device for controlling three-phase current fault of motor |
| WO2018179586A1 (en)* | 2017-03-31 | 2018-10-04 | 日本電気株式会社 | Analysis system, analysis method, and program |
| US11150635B2 (en)* | 2017-10-02 | 2021-10-19 | Fisher-Rosemount Systems, Inc. | Projects within a process control asset management system |
- 2018
- 2018-09-20JPJP2018176256Apatent/JP7181033B2/enactiveActive
- 2019
- 2019-08-09KRKR1020190097208Apatent/KR102305100B1/enactiveActive
- 2019-08-15CNCN201910752319.2Apatent/CN110928250A/enactivePending
- 2019-08-18USUS16/543,611patent/US11243862B2/enactiveActive
- 2019-08-23TWTW108130200Apatent/TWI736958B/enactive
- 2021
- 2021-09-15KRKR1020210123038Apatent/KR102422220B1/enactiveActive
- 2021-11-25USUS17/535,578patent/US11829451B2/enactiveActive
- 2022
- 2022-11-17JPJP2022183867Apatent/JP7498760B2/enactiveActive
- 2023
- 2023-09-21USUS18/472,213patent/US12271448B2/enactiveActive
Patent Citations (7)
| Publication number | Priority date | Publication date | Assignee | Title |
|---|---|---|---|---|
| JP2000077495A (en) | 1998-09-03 | 2000-03-14 | Hitachi Ltd | Inspection system and method for manufacturing electronic device using the same |
| JP2000200819A (en) | 2000-01-25 | 2000-07-18 | Hitachi Ltd | Inspection data analysis system and inspection data analysis method |
| JP2005267241A (en) | 2004-03-18 | 2005-09-29 | Toshiba Corp | Operation data management device and operation data management method |
| US20070219738A1 (en) | 2006-03-15 | 2007-09-20 | Applied Materials, Inc. | Tool health information monitoring and tool performance analysis in semiconductor processing |
| JP2009070052A (en) | 2007-09-12 | 2009-04-02 | Omron Corp | Monitoring device and program |
| JP2017112212A (en) | 2015-12-16 | 2017-06-22 | 株式会社荏原製作所 | Substrate processing apparatus and quality assurance method therefor |
| JP2018120533A (en) | 2017-01-27 | 2018-08-02 | 株式会社Screenホールディングス | Data processing system, data processing method and program |
Also Published As
| Publication number | Publication date |
|---|---|
| JP7498760B2 (en) | 2024-06-12 |
| CN110928250A (en) | 2020-03-27 |
| US20200097382A1 (en) | 2020-03-26 |
| US11243862B2 (en) | 2022-02-08 |
| US11829451B2 (en) | 2023-11-28 |
| KR102422220B1 (en) | 2022-07-18 |
| US20240012880A1 (en) | 2024-01-11 |
| TW202013439A (en) | 2020-04-01 |
| US12271448B2 (en) | 2025-04-08 |
| TWI736958B (en) | 2021-08-21 |
| JP2020047077A (en) | 2020-03-26 |
| KR20210118016A (en) | 2021-09-29 |
| JP2023025068A (en) | 2023-02-21 |
| KR20200033724A (en) | 2020-03-30 |
| US20220083443A1 (en) | 2022-03-17 |
| KR102305100B1 (en) | 2021-09-24 |
Similar Documents
| Publication | Publication Date | Title |
|---|---|---|
| JP7181033B2 (en) | DATA PROCESSING METHOD, DATA PROCESSING APPARATUS, AND DATA PROCESSING PROGRAM | |
| US20210405833A1 (en) | Data processing method, data processing device, and computer-readable recording medium having recorded thereon data processing program | |
| JP5866446B2 (en) | Graph drawing apparatus, graph drawing method, process management system, process management method, control program, and readable storage medium | |
| JP5008525B2 (en) | Defect factor extraction device and process stabilization support system | |
| JP2009070052A (en) | Monitoring device and program | |
| KR102247116B1 (en) | Data processing method, data processing device, and data processing program | |
| JP5128219B2 (en) | Display device and display method | |
| JP2009265944A (en) | Screen display method, screen display program and screen display device | |
| US9239665B2 (en) | Dynamic faceplates for multiple objects | |
| JP2019140196A (en) | Data processing method, data processing apparatus, data processing system, and data processing program | |
| US12386341B2 (en) | Information processing method, information processing apparatus, control program, storage medium, method of manufacturing product, and method of acquiring learning data | |
| US20210350296A1 (en) | Productivity improvement support system and productivity improvement support method | |
| JP6875878B2 (en) | Information processing equipment, programs, and control methods | |
| KR20060058328A (en) | Process monitor device of semiconductor device manufacturing facilities |
Legal Events
| Date | Code | Title | Description |
|---|---|---|---|
| A621 | Written request for application examination | Free format text:JAPANESE INTERMEDIATE CODE: A621 Effective date:20210618 | |
| A977 | Report on retrieval | Free format text:JAPANESE INTERMEDIATE CODE: A971007 Effective date:20220418 | |
| A131 | Notification of reasons for refusal | Free format text:JAPANESE INTERMEDIATE CODE: A131 Effective date:20220517 | |
| A521 | Request for written amendment filed | Free format text:JAPANESE INTERMEDIATE CODE: A523 Effective date:20220628 | |
| TRDD | Decision of grant or rejection written | ||
| A01 | Written decision to grant a patent or to grant a registration (utility model) | Free format text:JAPANESE INTERMEDIATE CODE: A01 Effective date:20221025 | |
| A61 | First payment of annual fees (during grant procedure) | Free format text:JAPANESE INTERMEDIATE CODE: A61 Effective date:20221117 | |
| R150 | Certificate of patent or registration of utility model | Ref document number:7181033 Country of ref document:JP Free format text:JAPANESE INTERMEDIATE CODE: R150 |