JP7160929B2 - Methods and systems for computer-generated predictive applications of neuroimaging and gene expression mapping data - Google Patents
Methods and systems for computer-generated predictive applications of neuroimaging and gene expression mapping dataDownload PDFInfo
- Publication number
- JP7160929B2 JP7160929B2JP2020539686AJP2020539686AJP7160929B2JP 7160929 B2JP7160929 B2JP 7160929B2JP 2020539686 AJP2020539686 AJP 2020539686AJP 2020539686 AJP2020539686 AJP 2020539686AJP 7160929 B2JP7160929 B2JP 7160929B2
- Authority
- JP
- Japan
- Prior art keywords
- gene
- phenotype
- topography
- neurobehavioral
- gene expression
- Prior art date
- Legal status (The legal status is an assumption and is not a legal conclusion. Google has not performed a legal analysis and makes no representation as to the accuracy of the status listed.)
- Active
Links
- 230000014509gene expressionEffects0.000titleclaimsdescription495
- 238000013507mappingMethods0.000titleclaimsdescription352
- 238000000034methodMethods0.000titledescription266
- 238000002610neuroimagingMethods0.000titledescription80
- 238000012876topographyMethods0.000claimsdescription415
- 108090000623proteins and genesProteins0.000claimsdescription411
- 230000003188neurobehavioral effectEffects0.000claimsdescription356
- 210000004556brainAnatomy0.000claimsdescription280
- 239000000523sampleSubstances0.000claimsdescription115
- 230000001054cortical effectEffects0.000claimsdescription84
- 230000001537neural effectEffects0.000claimsdescription56
- 208000024891symptomDiseases0.000claimsdescription54
- 230000002739subcortical effectEffects0.000claimsdescription42
- 230000003542behavioural effectEffects0.000claimsdescription35
- 238000005259measurementMethods0.000claimsdescription30
- 230000015654memoryEffects0.000claimsdescription21
- 230000000873masking effectEffects0.000claimsdescription20
- 210000002569neuronAnatomy0.000claimsdescription20
- 230000019771cognitionEffects0.000claimsdescription18
- 230000001965increasing effectEffects0.000claimsdescription14
- 208000014644Brain diseaseDiseases0.000claimsdescription13
- 230000001747exhibiting effectEffects0.000claimsdescription12
- 230000009471actionEffects0.000claimsdescription9
- 238000002759z-score normalizationMethods0.000claimsdescription8
- 230000002708enhancing effectEffects0.000claimsdescription4
- 101150112095map geneProteins0.000claimsdescription4
- 238000001914filtrationMethods0.000claimsdescription3
- 239000003814drugSubstances0.000description102
- 229940079593drugDrugs0.000description70
- 239000003596drug targetSubstances0.000description66
- 208000037265diseases, disorders, signs and symptomsDiseases0.000description62
- 238000013459approachMethods0.000description53
- 208000035475disorderDiseases0.000description37
- 238000011282treatmentMethods0.000description37
- 238000004458analytical methodMethods0.000description36
- 208000020016psychiatric diseaseDiseases0.000description32
- 230000000694effectsEffects0.000description31
- 201000000980schizophreniaDiseases0.000description31
- 201000010099diseaseDiseases0.000description25
- 229940124597therapeutic agentDrugs0.000description23
- 230000001225therapeutic effectEffects0.000description22
- 238000002599functional magnetic resonance imagingMethods0.000description21
- 230000004044responseEffects0.000description21
- 210000003169central nervous systemAnatomy0.000description20
- 230000002068genetic effectEffects0.000description19
- 210000004884grey matterAnatomy0.000description18
- 238000012545processingMethods0.000description18
- 230000011218segmentationEffects0.000description18
- 230000000875corresponding effectEffects0.000description16
- 102000005962receptorsHuman genes0.000description16
- 108020003175receptorsProteins0.000description16
- 208000018737Parkinson diseaseDiseases0.000description15
- 230000018109developmental processEffects0.000description15
- 230000008569processEffects0.000description15
- 238000009826distributionMethods0.000description14
- 101000992298Homo sapiens Kappa-type opioid receptorProteins0.000description13
- 102100031819Kappa-type opioid receptorHuman genes0.000description13
- 241001465754MetazoaSpecies0.000description13
- 238000010171animal modelMethods0.000description13
- 210000003710cerebral cortexAnatomy0.000description13
- 238000009510drug designMethods0.000description13
- 230000000144pharmacologic effectEffects0.000description13
- 238000007781pre-processingMethods0.000description13
- 208000015114central nervous system diseaseDiseases0.000description12
- 238000011161developmentMethods0.000description12
- 208000022821personality diseaseDiseases0.000description12
- 208000019901Anxiety diseaseDiseases0.000description11
- 101000783617Homo sapiens 5-hydroxytryptamine receptor 2AProteins0.000description11
- VAYOSLLFUXYJDT-RDTXWAMCSA-NLysergic acid diethylamideChemical compoundC1=CC(C=2[C@H](N(C)C[C@@H](C=2)C(=O)N(CC)CC)C2)=C3C2=CNC3=C1VAYOSLLFUXYJDT-RDTXWAMCSA-N0.000description11
- 229950002454lysergideDrugs0.000description11
- 238000002600positron emission tomographyMethods0.000description11
- 108010074732preproenkephalinProteins0.000description11
- 230000000284resting effectEffects0.000description11
- 230000008685targetingEffects0.000description11
- 238000012360testing methodMethods0.000description11
- 102100024622Proenkephalin-BHuman genes0.000description10
- 230000006870functionEffects0.000description10
- 230000000926neurological effectEffects0.000description10
- 1021000363215-hydroxytryptamine receptor 2AHuman genes0.000description9
- 101150037123APOE geneProteins0.000description9
- 102000017692GABRA5Human genes0.000description9
- 101000893331Homo sapiens Gamma-aminobutyric acid receptor subunit alpha-1Proteins0.000description9
- 101001001388Homo sapiens Gamma-aminobutyric acid receptor subunit alpha-5Proteins0.000description9
- 101001129365Homo sapiens PrepronociceptinProteins0.000description9
- 102100031292PrepronociceptinHuman genes0.000description9
- 208000028017Psychotic diseaseDiseases0.000description9
- 239000000090biomarkerSubstances0.000description9
- 238000012512characterization methodMethods0.000description9
- 238000013461designMethods0.000description9
- 102000004169proteins and genesHuman genes0.000description9
- 102000017696GABRA1Human genes0.000description8
- 102000017695GABRA2Human genes0.000description8
- 101000893333Homo sapiens Gamma-aminobutyric acid receptor subunit alpha-2Proteins0.000description8
- 102100028139Oxytocin receptorHuman genes0.000description8
- 208000030886Traumatic Brain injuryDiseases0.000description8
- 230000004913activationEffects0.000description8
- 238000001994activationMethods0.000description8
- 230000036506anxietyEffects0.000description8
- 230000006399behaviorEffects0.000description8
- 230000002596correlated effectEffects0.000description8
- 238000000537electroencephalographyMethods0.000description8
- 238000003384imaging methodMethods0.000description8
- 238000000513principal component analysisMethods0.000description8
- 230000001953sensory effectEffects0.000description8
- 230000009529traumatic brain injuryEffects0.000description8
- 208000024827Alzheimer diseaseDiseases0.000description7
- 208000020925Bipolar diseaseDiseases0.000description7
- LFQSCWFLJHTTHZ-UHFFFAOYSA-NEthanolChemical compoundCCOLFQSCWFLJHTTHZ-UHFFFAOYSA-N0.000description7
- 101000986765Homo sapiens Oxytocin receptorProteins0.000description7
- 208000019022Mood diseaseDiseases0.000description7
- 102100028646Nociceptin receptorHuman genes0.000description7
- 210000004027cellAnatomy0.000description7
- 230000001149cognitive effectEffects0.000description7
- 230000006735deficitEffects0.000description7
- 238000010586diagramMethods0.000description7
- 238000009509drug developmentMethods0.000description7
- 238000002372labellingMethods0.000description7
- 230000004630mental healthEffects0.000description7
- 108010020615nociceptin receptorProteins0.000description7
- 230000008448thoughtEffects0.000description7
- 1080910321515-hydroxytryptamine receptor familyProteins0.000description6
- 102100029470Apolipoprotein EHuman genes0.000description6
- 102100022631Glutamate receptor ionotropic, NMDA 2CHuman genes0.000description6
- 101000972846Homo sapiens Glutamate receptor ionotropic, NMDA 2CProteins0.000description6
- 206010026749ManiaDiseases0.000description6
- 108010083674Myelin ProteinsProteins0.000description6
- 102000006386Myelin ProteinsHuman genes0.000description6
- 230000002996emotional effectEffects0.000description6
- 208000024714major depressive diseaseDiseases0.000description6
- 210000005012myelinAnatomy0.000description6
- 208000028173post-traumatic stress diseaseDiseases0.000description6
- 238000012216screeningMethods0.000description6
- QZAYGJVTTNCVMB-UHFFFAOYSA-NserotoninChemical compoundC1=C(O)C=C2C(CCN)=CNC2=C1QZAYGJVTTNCVMB-UHFFFAOYSA-N0.000description6
- 208000006096Attention Deficit Disorder with HyperactivityDiseases0.000description5
- 208000036864Attention deficit/hyperactivity diseaseDiseases0.000description5
- 238000012935AveragingMethods0.000description5
- 102000017925CHRM3Human genes0.000description5
- 238000000018DNA microarrayMethods0.000description5
- 206010012239DelusionDiseases0.000description5
- 108010017544GlucosylceramidaseProteins0.000description5
- 102000004547GlucosylceramidaseHuman genes0.000description5
- 101000928919Homo sapiens Muscarinic acetylcholine receptor M3Proteins0.000description5
- 208000021384Obsessive-Compulsive diseaseDiseases0.000description5
- 108090000185alpha-SynucleinProteins0.000description5
- 208000015802attention deficit-hyperactivity diseaseDiseases0.000description5
- 208000013404behavioral symptomDiseases0.000description5
- 230000003925brain functionEffects0.000description5
- 230000008859changeEffects0.000description5
- 231100000868delusionToxicity0.000description5
- 238000007876drug discoveryMethods0.000description5
- 238000005516engineering processMethods0.000description5
- 230000007246mechanismEffects0.000description5
- 230000035772mutationEffects0.000description5
- 229940126585therapeutic drugDrugs0.000description5
- 210000004885white matterAnatomy0.000description5
- 230000003936working memoryEffects0.000description5
- 1021000403685-hydroxytryptamine receptor 6Human genes0.000description4
- 1020000401255-hydroxytryptamine receptor familyHuman genes0.000description4
- 102100026882Alpha-synucleinHuman genes0.000description4
- 102100028661Amine oxidase [flavin-containing] AHuman genes0.000description4
- 102100035875C-C chemokine receptor type 5Human genes0.000description4
- 101710149870C-C chemokine receptor type 5Proteins0.000description4
- 102100031650C-X-C chemokine receptor type 4Human genes0.000description4
- 102000017927CHRM1Human genes0.000description4
- XPOQHMRABVBWPR-UHFFFAOYSA-NEfavirenzNatural productsO1C(=O)NC2=CC=C(Cl)C=C2C1(C(F)(F)F)C#CC1CC1XPOQHMRABVBWPR-UHFFFAOYSA-N0.000description4
- 102000017694GABRA3Human genes0.000description4
- 102000017693GABRA4Human genes0.000description4
- NTYJJOPFIAHURM-UHFFFAOYSA-NHistamineChemical compoundNCCC1=CN=CN1NTYJJOPFIAHURM-UHFFFAOYSA-N0.000description4
- 101000964051Homo sapiens 5-hydroxytryptamine receptor 6Proteins0.000description4
- 101000834898Homo sapiens Alpha-synucleinProteins0.000description4
- 101000694718Homo sapiens Amine oxidase [flavin-containing] AProteins0.000description4
- 101000922348Homo sapiens C-X-C chemokine receptor type 4Proteins0.000description4
- 101000893321Homo sapiens Gamma-aminobutyric acid receptor subunit alpha-3Proteins0.000description4
- 101000893324Homo sapiens Gamma-aminobutyric acid receptor subunit alpha-4Proteins0.000description4
- 101001016833Homo sapiens Histamine H3 receptorProteins0.000description4
- 101000782981Homo sapiens Muscarinic acetylcholine receptor M1Proteins0.000description4
- 208000012902Nervous system diseaseDiseases0.000description4
- 208000029726Neurodevelopmental diseaseDiseases0.000description4
- 206010037180Psychiatric symptomsDiseases0.000description4
- 102000003802alpha-SynucleinHuman genes0.000description4
- 230000004075alterationEffects0.000description4
- 239000005557antagonistSubstances0.000description4
- 230000011157brain segmentationEffects0.000description4
- 208000026725cyclothymic diseaseDiseases0.000description4
- 230000006378damageEffects0.000description4
- 238000002597diffusion-weighted imagingMethods0.000description4
- 238000010494dissociation reactionMethods0.000description4
- 230000005593dissociationsEffects0.000description4
- 208000024732dysthymic diseaseDiseases0.000description4
- XPOQHMRABVBWPR-ZDUSSCGKSA-NefavirenzChemical compoundC([C@]1(C2=CC(Cl)=CC=C2NC(=O)O1)C(F)(F)F)#CC1CC1XPOQHMRABVBWPR-ZDUSSCGKSA-N0.000description4
- 229960003804efavirenzDrugs0.000description4
- 238000011156evaluationMethods0.000description4
- 229960003692gamma aminobutyric acidDrugs0.000description4
- BTCSSZJGUNDROE-UHFFFAOYSA-Ngamma-aminobutyric acidChemical compoundNCCCC(O)=OBTCSSZJGUNDROE-UHFFFAOYSA-N0.000description4
- 238000002595magnetic resonance imagingMethods0.000description4
- 238000002582magnetoencephalographyMethods0.000description4
- 238000002493microarrayMethods0.000description4
- 208000015122neurodegenerative diseaseDiseases0.000description4
- 238000005457optimizationMethods0.000description4
- 208000019906panic diseaseDiseases0.000description4
- 208000011580syndromic diseaseDiseases0.000description4
- 238000002626targeted therapyMethods0.000description4
- 210000001103thalamusAnatomy0.000description4
- 238000002560therapeutic procedureMethods0.000description4
- 238000010200validation analysisMethods0.000description4
- 1080100725645-HT2A Serotonin ReceptorProteins0.000description3
- 1020000497735-HT2A Serotonin ReceptorHuman genes0.000description3
- 1021000249595-hydroxytryptamine receptor 2CHuman genes0.000description3
- 102000017919ADRB2Human genes0.000description3
- 102100022716Atypical chemokine receptor 3Human genes0.000description3
- 102100020756D(2) dopamine receptorHuman genes0.000description3
- 206010012374Depressed moodDiseases0.000description3
- 208000020401Depressive diseaseDiseases0.000description3
- 208000026331Disruptive, Impulse Control, and Conduct diseaseDiseases0.000description3
- 102000027484GABAA receptorsHuman genes0.000description3
- 108091008681GABAA receptorsProteins0.000description3
- 208000011688Generalised anxiety diseaseDiseases0.000description3
- 208000004547HallucinationsDiseases0.000description3
- 102000004384Histamine H3 receptorsHuman genes0.000description3
- 108090000981Histamine H3 receptorsProteins0.000description3
- 241000282412HomoSpecies0.000description3
- 101000761348Homo sapiens 5-hydroxytryptamine receptor 2CProteins0.000description3
- 101000678890Homo sapiens Atypical chemokine receptor 3Proteins0.000description3
- 101000959437Homo sapiens Beta-2 adrenergic receptorProteins0.000description3
- 101000931901Homo sapiens D(2) dopamine receptorProteins0.000description3
- 208000030988Schizoid Personality diseaseDiseases0.000description3
- 230000023445activated T cell autonomous cell deathEffects0.000description3
- 208000024823antisocial personality diseaseDiseases0.000description3
- 230000008901benefitEffects0.000description3
- 238000002512chemotherapyMethods0.000description3
- 230000007278cognition impairmentEffects0.000description3
- 230000009429distressEffects0.000description3
- 238000002651drug therapyMethods0.000description3
- 230000007717exclusionEffects0.000description3
- 208000029364generalized anxiety diseaseDiseases0.000description3
- 206010022437insomniaDiseases0.000description3
- GSNHKUDZZFZSJB-QYOOZWMWSA-NmaravirocChemical compoundCC(C)C1=NN=C(C)N1[C@@H]1C[C@H](N2CC[C@H](NC(=O)C3CCC(F)(F)CC3)C=3C=CC=CC=3)CC[C@H]2C1GSNHKUDZZFZSJB-QYOOZWMWSA-N0.000description3
- 229960004710maravirocDrugs0.000description3
- 239000011159matrix materialSubstances0.000description3
- 230000036651moodEffects0.000description3
- 210000001577neostriatumAnatomy0.000description3
- 210000000653nervous systemAnatomy0.000description3
- 229940126027positive allosteric modulatorDrugs0.000description3
- 238000011160researchMethods0.000description3
- 230000000698schizophrenic effectEffects0.000description3
- 229940076279serotoninDrugs0.000description3
- 230000011664signalingEffects0.000description3
- 238000000638solvent extractionMethods0.000description3
- 238000007619statistical methodMethods0.000description3
- 230000000638stimulationEffects0.000description3
- 238000003860storageMethods0.000description3
- 239000000126substanceSubstances0.000description3
- 230000002123temporal effectEffects0.000description3
- 230000009466transformationEffects0.000description3
- 238000012800visualizationMethods0.000description3
- 206010054196Affect labilityDiseases0.000description2
- 206010003805AutismDiseases0.000description2
- 208000020706Autistic diseaseDiseases0.000description2
- 102100039705Beta-2 adrenergic receptorHuman genes0.000description2
- 208000028698Cognitive impairmentDiseases0.000description2
- 206010061818Disease progressionDiseases0.000description2
- 102000015554Dopamine receptorHuman genes0.000description2
- 108050004812Dopamine receptorProteins0.000description2
- 208000030814Eating diseaseDiseases0.000description2
- 208000032274EncephalopathyDiseases0.000description2
- 208000008967EnuresisDiseases0.000description2
- 208000019454Feeding and Eating diseaseDiseases0.000description2
- 208000024412Friedreich ataxiaDiseases0.000description2
- 102100029458Glutamate receptor ionotropic, NMDA 2AHuman genes0.000description2
- 102100022630Glutamate receptor ionotropic, NMDA 2BHuman genes0.000description2
- 102100022626Glutamate receptor ionotropic, NMDA 2DHuman genes0.000description2
- 101150113721HRH3 geneProteins0.000description2
- 101001125242Homo sapiens Glutamate receptor ionotropic, NMDA 2AProteins0.000description2
- 101000972850Homo sapiens Glutamate receptor ionotropic, NMDA 2BProteins0.000description2
- 101000972840Homo sapiens Glutamate receptor ionotropic, NMDA 2DProteins0.000description2
- 101000636883Homo sapiens Oxytocin-neurophysin 1Proteins0.000description2
- 206010020400HostilityDiseases0.000description2
- 241000713772Human immunodeficiency virus 1Species0.000description2
- 208000023105Huntington diseaseDiseases0.000description2
- 208000009829Lewy Body DiseaseDiseases0.000description2
- 201000002832Lewy body dementiaDiseases0.000description2
- 108090001041N-Methyl-D-Aspartate ReceptorsProteins0.000description2
- 102000014649NMDA glutamate receptor activity proteinsHuman genes0.000description2
- 208000027120Narcissistic personality diseaseDiseases0.000description2
- 208000025966Neurological diseaseDiseases0.000description2
- 102000004108Neurotransmitter ReceptorsHuman genes0.000description2
- 108090000590Neurotransmitter ReceptorsProteins0.000description2
- 241000208125NicotianaSpecies0.000description2
- 235000002637Nicotiana tabacumNutrition0.000description2
- 206010029897Obsessive thoughtsDiseases0.000description2
- 102100031951Oxytocin-neurophysin 1Human genes0.000description2
- 101150075130PNOC geneProteins0.000description2
- 208000002193PainDiseases0.000description2
- 208000027030Premenstrual dysphoric diseaseDiseases0.000description2
- 208000027418Wounds and injuryDiseases0.000description2
- 230000001154acute effectEffects0.000description2
- 230000002411adverseEffects0.000description2
- 239000000556agonistSubstances0.000description2
- 210000004727amygdalaAnatomy0.000description2
- 210000003484anatomyAnatomy0.000description2
- 230000000798anti-retroviral effectEffects0.000description2
- 208000029560autism spectrum diseaseDiseases0.000description2
- 230000009286beneficial effectEffects0.000description2
- 230000002457bidirectional effectEffects0.000description2
- 230000015572biosynthetic processEffects0.000description2
- 230000000903blocking effectEffects0.000description2
- 230000007177brain activityEffects0.000description2
- 244000309464bullSpecies0.000description2
- RYYVLZVUVIJVGH-UHFFFAOYSA-NcaffeineChemical compoundCN1C(=O)N(C)C(=O)C2=C1N=CN2CRYYVLZVUVIJVGH-UHFFFAOYSA-N0.000description2
- 230000001413cellular effectEffects0.000description2
- 238000006243chemical reactionMethods0.000description2
- 208000010877cognitive diseaseDiseases0.000description2
- 238000004891communicationMethods0.000description2
- 239000000470constituentSubstances0.000description2
- 230000007583cortical expressionEffects0.000description2
- 238000007405data analysisMethods0.000description2
- 208000030964dependent personality diseaseDiseases0.000description2
- 230000005750disease progressionEffects0.000description2
- 235000014632disordered eatingNutrition0.000description2
- VYFYYTLLBUKUHU-UHFFFAOYSA-NdopamineChemical compoundNCCC1=CC=C(O)C(O)=C1VYFYYTLLBUKUHU-UHFFFAOYSA-N0.000description2
- 235000006694eating habitsNutrition0.000description2
- 230000008451emotionEffects0.000description2
- 201000003104endogenous depressionDiseases0.000description2
- 230000007613environmental effectEffects0.000description2
- 230000003203everyday effectEffects0.000description2
- 238000002474experimental methodMethods0.000description2
- 230000008921facial expressionEffects0.000description2
- 230000036541healthEffects0.000description2
- 238000013537high throughput screeningMethods0.000description2
- 210000001320hippocampusAnatomy0.000description2
- 229960001340histamineDrugs0.000description2
- 208000013403hyperactivityDiseases0.000description2
- 238000011337individualized treatmentMethods0.000description2
- 208000014674injuryDiseases0.000description2
- 230000003993interactionEffects0.000description2
- 230000002452interceptive effectEffects0.000description2
- 210000001153interneuronAnatomy0.000description2
- 229940125425inverse agonistDrugs0.000description2
- 230000000670limiting effectEffects0.000description2
- 238000003012network analysisMethods0.000description2
- 230000007171neuropathologyEffects0.000description2
- 238000010606normalizationMethods0.000description2
- 238000009206nuclear medicineMethods0.000description2
- 208000030459obsessive-compulsive personality diseaseDiseases0.000description2
- 208000024817paranoid personality diseaseDiseases0.000description2
- 238000011458pharmacological treatmentMethods0.000description2
- 208000019899phobic diseaseDiseases0.000description2
- 230000003234polygenic effectEffects0.000description2
- 210000002442prefrontal cortexAnatomy0.000description2
- 230000002360prefrontal effectEffects0.000description2
- 210000000977primary visual cortexAnatomy0.000description2
- 238000012913prioritisationMethods0.000description2
- 210000004129prosencephalonAnatomy0.000description2
- 238000011002quantificationMethods0.000description2
- 230000009467reductionEffects0.000description2
- 230000007958sleepEffects0.000description2
- 241000894007speciesSpecies0.000description2
- 238000001228spectrumMethods0.000description2
- 208000002320spinal muscular atrophyDiseases0.000description2
- 230000035882stressEffects0.000description2
- 208000011117substance-related diseaseDiseases0.000description2
- 238000003786synthesis reactionMethods0.000description2
- 230000009885systemic effectEffects0.000description2
- 238000011491transcranial magnetic stimulationMethods0.000description2
- 238000011269treatment regimenMethods0.000description2
- 210000000857visual cortexAnatomy0.000description2
- 1080910054355-HT6 receptorsProteins0.000description1
- 206010000087Abdominal pain upperDiseases0.000description1
- 208000008811AgoraphobiaDiseases0.000description1
- 208000007848AlcoholismDiseases0.000description1
- 108700028369AllelesProteins0.000description1
- 208000000044AmnesiaDiseases0.000description1
- 208000007415AnhedoniaDiseases0.000description1
- 206010002650Anorexia nervosa and bulimiaDiseases0.000description1
- 208000008035Back PainDiseases0.000description1
- 101710152983Beta-2 adrenergic receptorProteins0.000description1
- 208000030336Bipolar and Related diseaseDiseases0.000description1
- RZZPDXZPRHQOCG-OJAKKHQRSA-OCDP-choline(1+)Chemical compoundO[C@@H]1[C@H](O)[C@@H](COP(O)(=O)OP(O)(=O)OCC[N+](C)(C)C)O[C@H]1N1C(=O)N=C(N)C=C1RZZPDXZPRHQOCG-OJAKKHQRSA-O0.000description1
- 241000282693CercopithecidaeSpecies0.000description1
- 206010010144Completed suicideDiseases0.000description1
- 208000027691Conduct diseaseDiseases0.000description1
- 206010011168Cortical dysfunctionDiseases0.000description1
- 101150049660DRD2 geneProteins0.000description1
- 206010011971Decreased interestDiseases0.000description1
- 206010012218DeliriumDiseases0.000description1
- 206010012289DementiaDiseases0.000description1
- 206010013142DisinhibitionDiseases0.000description1
- 208000025967Dissociative Identity diseaseDiseases0.000description1
- 102000004980Dopamine D2 ReceptorsHuman genes0.000description1
- 108090001111Dopamine D2 ReceptorsProteins0.000description1
- 208000026097Factitious diseaseDiseases0.000description1
- 108010005551GABA ReceptorsProteins0.000description1
- 102000005915GABA ReceptorsHuman genes0.000description1
- 208000001613GamblingDiseases0.000description1
- 208000004230Gender DysphoriaDiseases0.000description1
- 208000031886HIV InfectionsDiseases0.000description1
- 208000037357HIV infectious diseaseDiseases0.000description1
- -1HRTR2CProteins0.000description1
- 102000017679HTR3AHuman genes0.000description1
- 101150064529HTR6 geneProteins0.000description1
- 206010019233HeadachesDiseases0.000description1
- 102100032508Histamine H3 receptorHuman genes0.000description1
- 208000016619Histrionic personality diseaseDiseases0.000description1
- 208000014513Hoarding diseaseDiseases0.000description1
- 101000822895Homo sapiens 5-hydroxytryptamine receptor 1AProteins0.000description1
- 101000761343Homo sapiens 5-hydroxytryptamine receptor 3AProteins0.000description1
- 101000941877Homo sapiens Leucine-rich repeat serine/threonine-protein kinase 1Proteins0.000description1
- 101000996780Homo sapiens Probable G-protein coupled receptor 139Proteins0.000description1
- 101001033058Homo sapiens Probable G-protein coupled receptor 88Proteins0.000description1
- 201000001916HypochondriasisDiseases0.000description1
- 206010021030HypomaniaDiseases0.000description1
- 208000030990Impulse-control diseaseDiseases0.000description1
- 206010021567Impulsive behaviourDiseases0.000description1
- LPHGQDQBBGAPDZ-UHFFFAOYSA-NIsocaffeineNatural productsCN1C(=O)N(C)C(=O)C2=C1N(C)C=N2LPHGQDQBBGAPDZ-UHFFFAOYSA-N0.000description1
- 108010006444Leucine-Rich Repeat ProteinsProteins0.000description1
- 102100032656Leucine-rich repeat serine/threonine-protein kinase 1Human genes0.000description1
- 241000282560Macaca mulattaSpecies0.000description1
- 208000037490Medically Unexplained SymptomsDiseases0.000description1
- 206010027951Mood swingsDiseases0.000description1
- 206010028980NeoplasmDiseases0.000description1
- 208000009668Neurobehavioral ManifestationsDiseases0.000description1
- 208000027626Neurocognitive diseaseDiseases0.000description1
- 108091028043Nucleic acid sequenceProteins0.000description1
- 101150105974OPRK1 geneProteins0.000description1
- 240000007594Oryza sativaSpecies0.000description1
- 235000007164Oryza sativaNutrition0.000description1
- 101150106956Oxtr geneProteins0.000description1
- 101150102323PDYN geneProteins0.000description1
- 238000012879PET imagingMethods0.000description1
- 102000001675ParvalbuminHuman genes0.000description1
- 108060005874ParvalbuminProteins0.000description1
- 208000032769PedophiliaDiseases0.000description1
- 108091000080PhosphotransferaseProteins0.000description1
- 201000009916Postpartum depressionDiseases0.000description1
- 241000288906PrimatesSpecies0.000description1
- 102100033836Probable G-protein coupled receptor 139Human genes0.000description1
- 102100038404Probable G-protein coupled receptor 88Human genes0.000description1
- 206010037249Psychotic behaviourDiseases0.000description1
- 238000003559RNA-seq methodMethods0.000description1
- 208000005793Restless legs syndromeDiseases0.000description1
- 241001653634Russula vescaSpecies0.000description1
- 208000027674Schizophrenia Spectrum and Other Psychotic diseaseDiseases0.000description1
- 201000001880Sexual dysfunctionDiseases0.000description1
- 208000013738Sleep Initiation and Maintenance diseaseDiseases0.000description1
- 102000005157SomatostatinHuman genes0.000description1
- 108010056088SomatostatinProteins0.000description1
- 206010042458Suicidal ideationDiseases0.000description1
- 208000027568Trauma and Stressor Related diseaseDiseases0.000description1
- 208000031674Traumatic Acute Stress diseaseDiseases0.000description1
- 208000026345acute stress diseaseDiseases0.000description1
- 208000012826adjustment diseaseDiseases0.000description1
- 230000032683agingEffects0.000description1
- 238000013019agitationMethods0.000description1
- 206010001584alcohol abuseDiseases0.000description1
- 208000025746alcohol use diseaseDiseases0.000description1
- 206010002026amyotrophic lateral sclerosisDiseases0.000description1
- 239000000164antipsychotic agentSubstances0.000description1
- 230000036528appetiteEffects0.000description1
- 235000019789appetiteNutrition0.000description1
- 238000013528artificial neural networkMethods0.000description1
- 208000025748atypical depressive diseaseDiseases0.000description1
- 108010014499beta-2 Adrenergic ReceptorsProteins0.000description1
- 230000008238biochemical pathwayEffects0.000description1
- 208000028683bipolar I diseaseDiseases0.000description1
- 230000036995brain healthEffects0.000description1
- 208000029028brain injuryDiseases0.000description1
- 230000008309brain mechanismEffects0.000description1
- 210000000133brain stemAnatomy0.000description1
- 210000005013brain tissueAnatomy0.000description1
- 229960001948caffeineDrugs0.000description1
- VJEONQKOZGKCAK-UHFFFAOYSA-NcaffeineNatural productsCN1C(=O)N(C)C(=O)C2=C1C=CN2CVJEONQKOZGKCAK-UHFFFAOYSA-N0.000description1
- 238000004422calculation algorithmMethods0.000description1
- 238000004364calculation methodMethods0.000description1
- 201000011510cancerDiseases0.000description1
- 210000001638cerebellumAnatomy0.000description1
- 230000001684chronic effectEffects0.000description1
- 230000003930cognitive abilityEffects0.000description1
- 231100000870cognitive problemToxicity0.000description1
- 238000002648combination therapyMethods0.000description1
- 230000000295complement effectEffects0.000description1
- 238000004590computer programMethods0.000description1
- 238000005094computer simulationMethods0.000description1
- 238000007596consolidation processMethods0.000description1
- 238000012937correctionMethods0.000description1
- 230000034994deathEffects0.000description1
- 238000000354decomposition reactionMethods0.000description1
- 230000003247decreasing effectEffects0.000description1
- 210000001947dentate gyrusAnatomy0.000description1
- 230000000994depressogenic effectEffects0.000description1
- 206010012601diabetes mellitusDiseases0.000description1
- 238000003745diagnosisMethods0.000description1
- 235000005911dietNutrition0.000description1
- 230000000378dietary effectEffects0.000description1
- 238000009792diffusion processMethods0.000description1
- 230000003292diminished effectEffects0.000description1
- 208000035548disruptive behavior diseaseDiseases0.000description1
- 206010013461dissociative amnesiaDiseases0.000description1
- 208000018459dissociative diseaseDiseases0.000description1
- 229960003638dopamineDrugs0.000description1
- 229940052760dopamine agonistsDrugs0.000description1
- 239000003136dopamine receptor stimulating agentSubstances0.000description1
- 238000001647drug administrationMethods0.000description1
- 229940000406drug candidateDrugs0.000description1
- 239000000890drug combinationSubstances0.000description1
- 230000000857drug effectEffects0.000description1
- 238000009511drug repositioningMethods0.000description1
- 230000004064dysfunctionEffects0.000description1
- 206010015037epilepsyDiseases0.000description1
- 230000029142excretionEffects0.000description1
- 230000010326executive functioningEffects0.000description1
- 230000001815facial effectEffects0.000description1
- 210000003608feceAnatomy0.000description1
- 230000004907fluxEffects0.000description1
- 238000003205genotyping methodMethods0.000description1
- 231100000869headacheToxicity0.000description1
- 230000005802health problemEffects0.000description1
- 208000019622heart diseaseDiseases0.000description1
- 244000144980herdSpecies0.000description1
- 230000000971hippocampal effectEffects0.000description1
- 208000033519human immunodeficiency virus infectious diseaseDiseases0.000description1
- 210000000987immune systemAnatomy0.000description1
- 230000001771impaired effectEffects0.000description1
- 230000008676importEffects0.000description1
- 230000006872improvementEffects0.000description1
- 238000007901in situ hybridizationMethods0.000description1
- 238000001727in vivoMethods0.000description1
- 230000004968inflammatory conditionEffects0.000description1
- 230000010365information processingEffects0.000description1
- 230000010354integrationEffects0.000description1
- 208000015046intermittent explosive diseaseDiseases0.000description1
- 238000002955isolationMethods0.000description1
- FPCCSQOGAWCVBH-UHFFFAOYSA-NketanserinChemical compoundC1=CC(F)=CC=C1C(=O)C1CCN(CCN2C(C3=CC=CC=C3NC2=O)=O)CC1FPCCSQOGAWCVBH-UHFFFAOYSA-N0.000description1
- 229960005417ketanserinDrugs0.000description1
- 206010023461kleptomaniaDiseases0.000description1
- 230000008449languageEffects0.000description1
- 230000002045lasting effectEffects0.000description1
- 201000010901lateral sclerosisDiseases0.000description1
- 201000003723learning disabilityDiseases0.000description1
- 210000004901leucine-rich repeatAnatomy0.000description1
- 210000004558lewy bodyAnatomy0.000description1
- 239000004973liquid crystal related substanceSubstances0.000description1
- 230000033001locomotionEffects0.000description1
- 230000005923long-lasting effectEffects0.000description1
- 230000007257malfunctionEffects0.000description1
- 239000000463materialSubstances0.000description1
- 230000001404mediated effectEffects0.000description1
- 238000002483medicationMethods0.000description1
- 230000003340mental effectEffects0.000description1
- 230000002503metabolic effectEffects0.000description1
- 230000004060metabolic processEffects0.000description1
- 239000000203mixtureSubstances0.000description1
- 230000009456molecular mechanismEffects0.000description1
- 230000008450motivationEffects0.000description1
- 208000005264motor neuron diseaseDiseases0.000description1
- 208000027881multiple personality diseaseDiseases0.000description1
- 230000003551muscarinic effectEffects0.000description1
- 210000000478neocortexAnatomy0.000description1
- 210000005036nerveAnatomy0.000description1
- 210000000118neural pathwayAnatomy0.000description1
- 230000010004neural pathwayEffects0.000description1
- 230000004770neurodegenerationEffects0.000description1
- 230000002981neuropathic effectEffects0.000description1
- 239000002858neurotransmitter agentSubstances0.000description1
- 230000007935neutral effectEffects0.000description1
- 208000005346nocturnal enuresisDiseases0.000description1
- 210000001009nucleus accumbenAnatomy0.000description1
- 229940124636opioid drugDrugs0.000description1
- 230000003287optical effectEffects0.000description1
- 230000008520organizationEffects0.000description1
- 230000010355oscillationEffects0.000description1
- 230000036407painEffects0.000description1
- 208000012198paraphilic diseaseDiseases0.000description1
- 230000001575pathological effectEffects0.000description1
- 230000007170pathologyEffects0.000description1
- 230000007310pathophysiologyEffects0.000description1
- 230000002085persistent effectEffects0.000description1
- 230000004526pharmaceutical effectEffects0.000description1
- 239000002831pharmacologic agentSubstances0.000description1
- 102000020233phosphotransferaseHuman genes0.000description1
- YIQPUIGJQJDJOS-UHFFFAOYSA-NplerixaforChemical compoundC=1C=C(CN2CCNCCCNCCNCCC2)C=CC=1CN1CCCNCCNCCCNCC1YIQPUIGJQJDJOS-UHFFFAOYSA-N0.000description1
- 229960002169plerixaforDrugs0.000description1
- 238000011176poolingMethods0.000description1
- 230000003334potential effectEffects0.000description1
- 229940124606potential therapeutic agentDrugs0.000description1
- 230000003389potentiating effectEffects0.000description1
- 206010036596premature ejaculationDiseases0.000description1
- 238000002203pretreatmentMethods0.000description1
- 238000007639printingMethods0.000description1
- 108090000765processed proteins & peptidesProteins0.000description1
- 210000001176projection neuronAnatomy0.000description1
- 230000008433psychological processes and functionsEffects0.000description1
- 210000002637putamenAnatomy0.000description1
- 210000002763pyramidal cellAnatomy0.000description1
- 238000004445quantitative analysisMethods0.000description1
- 239000000700radioactive tracerSubstances0.000description1
- 230000009257reactivityEffects0.000description1
- 239000000018receptor agonistSubstances0.000description1
- 239000003237recreational drugSubstances0.000description1
- 238000007670refiningMethods0.000description1
- 230000001105regulatory effectEffects0.000description1
- 238000009877renderingMethods0.000description1
- 230000003252repetitive effectEffects0.000description1
- 235000009566riceNutrition0.000description1
- 208000012672seasonal affective diseaseDiseases0.000description1
- 210000002265sensory receptor cellAnatomy0.000description1
- 230000000862serotonergic effectEffects0.000description1
- 231100000872sexual dysfunctionToxicity0.000description1
- 230000001568sexual effectEffects0.000description1
- 230000036332sexual responseEffects0.000description1
- 208000027596sexual sadism diseaseDiseases0.000description1
- 230000019491signal transductionEffects0.000description1
- 201000002859sleep apneaDiseases0.000description1
- 208000019116sleep diseaseDiseases0.000description1
- 208000022925sleep disturbanceDiseases0.000description1
- 208000020685sleep-wake diseaseDiseases0.000description1
- 239000007787solidSubstances0.000description1
- NHXLMOGPVYXJNR-ATOGVRKGSA-NsomatostatinChemical compoundC([C@H]1C(=O)N[C@H](C(N[C@@H](CO)C(=O)N[C@@H](CSSC[C@@H](C(=O)N[C@@H](CCCCN)C(=O)N[C@@H](CC(N)=O)C(=O)N[C@@H](CC=2C=CC=CC=2)C(=O)N[C@@H](CC=2C=CC=CC=2)C(=O)N[C@@H](CC=2C3=CC=CC=C3NC=2)C(=O)N[C@@H](CCCCN)C(=O)N[C@H](C(=O)N1)[C@@H](C)O)NC(=O)CNC(=O)[C@H](C)N)C(O)=O)=O)[C@H](O)C)C1=CC=CC=C1NHXLMOGPVYXJNR-ATOGVRKGSA-N0.000description1
- 229960000553somatostatinDrugs0.000description1
- 230000003595spectral effectEffects0.000description1
- 238000000528statistical testMethods0.000description1
- 201000009032substance abuseDiseases0.000description1
- 231100000736substance abuseToxicity0.000description1
- 230000024587synaptic transmission, glutamatergicEffects0.000description1
- 230000001360synchronised effectEffects0.000description1
- 230000009897systematic effectEffects0.000description1
- 230000000542thalamic effectEffects0.000description1
- 238000009601thyroid function testMethods0.000description1
- 239000003053toxinSubstances0.000description1
- 231100000765toxinToxicity0.000description1
- 108700012359toxinsProteins0.000description1
- 238000012549trainingMethods0.000description1
- 238000012546transferMethods0.000description1
- 230000000472traumatic effectEffects0.000description1
- 238000011277treatment modalityMethods0.000description1
- 208000002271trichotillomaniaDiseases0.000description1
- 230000010415tropismEffects0.000description1
- 210000002700urineAnatomy0.000description1
- 238000012795verificationMethods0.000description1
- 208000008918voyeurismDiseases0.000description1
- 230000003313weakening effectEffects0.000description1
- 229940126550α5-GABAA receptorDrugs0.000description1
Images


Classifications
- G—PHYSICS
- G16—INFORMATION AND COMMUNICATION TECHNOLOGY [ICT] SPECIALLY ADAPTED FOR SPECIFIC APPLICATION FIELDS
- G16B—BIOINFORMATICS, i.e. INFORMATION AND COMMUNICATION TECHNOLOGY [ICT] SPECIALLY ADAPTED FOR GENETIC OR PROTEIN-RELATED DATA PROCESSING IN COMPUTATIONAL MOLECULAR BIOLOGY
- G16B20/00—ICT specially adapted for functional genomics or proteomics, e.g. genotype-phenotype associations
- G—PHYSICS
- G16—INFORMATION AND COMMUNICATION TECHNOLOGY [ICT] SPECIALLY ADAPTED FOR SPECIFIC APPLICATION FIELDS
- G16B—BIOINFORMATICS, i.e. INFORMATION AND COMMUNICATION TECHNOLOGY [ICT] SPECIALLY ADAPTED FOR GENETIC OR PROTEIN-RELATED DATA PROCESSING IN COMPUTATIONAL MOLECULAR BIOLOGY
- G16B25/00—ICT specially adapted for hybridisation; ICT specially adapted for gene or protein expression
- G16B25/10—Gene or protein expression profiling; Expression-ratio estimation or normalisation
- G—PHYSICS
- G16—INFORMATION AND COMMUNICATION TECHNOLOGY [ICT] SPECIALLY ADAPTED FOR SPECIFIC APPLICATION FIELDS
- G16B—BIOINFORMATICS, i.e. INFORMATION AND COMMUNICATION TECHNOLOGY [ICT] SPECIALLY ADAPTED FOR GENETIC OR PROTEIN-RELATED DATA PROCESSING IN COMPUTATIONAL MOLECULAR BIOLOGY
- G16B40/00—ICT specially adapted for biostatistics; ICT specially adapted for bioinformatics-related machine learning or data mining, e.g. knowledge discovery or pattern finding
- G—PHYSICS
- G16—INFORMATION AND COMMUNICATION TECHNOLOGY [ICT] SPECIALLY ADAPTED FOR SPECIFIC APPLICATION FIELDS
- G16H—HEALTHCARE INFORMATICS, i.e. INFORMATION AND COMMUNICATION TECHNOLOGY [ICT] SPECIALLY ADAPTED FOR THE HANDLING OR PROCESSING OF MEDICAL OR HEALTHCARE DATA
- G16H20/00—ICT specially adapted for therapies or health-improving plans, e.g. for handling prescriptions, for steering therapy or for monitoring patient compliance
- G16H20/10—ICT specially adapted for therapies or health-improving plans, e.g. for handling prescriptions, for steering therapy or for monitoring patient compliance relating to drugs or medications, e.g. for ensuring correct administration to patients
- G—PHYSICS
- G16—INFORMATION AND COMMUNICATION TECHNOLOGY [ICT] SPECIALLY ADAPTED FOR SPECIFIC APPLICATION FIELDS
- G16H—HEALTHCARE INFORMATICS, i.e. INFORMATION AND COMMUNICATION TECHNOLOGY [ICT] SPECIALLY ADAPTED FOR THE HANDLING OR PROCESSING OF MEDICAL OR HEALTHCARE DATA
- G16H50/00—ICT specially adapted for medical diagnosis, medical simulation or medical data mining; ICT specially adapted for detecting, monitoring or modelling epidemics or pandemics
- G16H50/20—ICT specially adapted for medical diagnosis, medical simulation or medical data mining; ICT specially adapted for detecting, monitoring or modelling epidemics or pandemics for computer-aided diagnosis, e.g. based on medical expert systems
- G—PHYSICS
- G16—INFORMATION AND COMMUNICATION TECHNOLOGY [ICT] SPECIALLY ADAPTED FOR SPECIFIC APPLICATION FIELDS
- G16H—HEALTHCARE INFORMATICS, i.e. INFORMATION AND COMMUNICATION TECHNOLOGY [ICT] SPECIALLY ADAPTED FOR THE HANDLING OR PROCESSING OF MEDICAL OR HEALTHCARE DATA
- G16H30/00—ICT specially adapted for the handling or processing of medical images
- G16H30/20—ICT specially adapted for the handling or processing of medical images for handling medical images, e.g. DICOM, HL7 or PACS
Landscapes
- Health & Medical Sciences (AREA)
- Engineering & Computer Science (AREA)
- Medical Informatics (AREA)
- Life Sciences & Earth Sciences (AREA)
- Physics & Mathematics (AREA)
- General Health & Medical Sciences (AREA)
- Bioinformatics & Cheminformatics (AREA)
- Public Health (AREA)
- Spectroscopy & Molecular Physics (AREA)
- Theoretical Computer Science (AREA)
- Bioinformatics & Computational Biology (AREA)
- Biotechnology (AREA)
- Evolutionary Biology (AREA)
- Genetics & Genomics (AREA)
- Biophysics (AREA)
- Epidemiology (AREA)
- Data Mining & Analysis (AREA)
- Biomedical Technology (AREA)
- Databases & Information Systems (AREA)
- Molecular Biology (AREA)
- Chemical & Material Sciences (AREA)
- Primary Health Care (AREA)
- Software Systems (AREA)
- Proteomics, Peptides & Aminoacids (AREA)
- Evolutionary Computation (AREA)
- Artificial Intelligence (AREA)
- Computer Vision & Pattern Recognition (AREA)
- Bioethics (AREA)
- Analytical Chemistry (AREA)
- Pathology (AREA)
- Medicinal Chemistry (AREA)
- Measuring Or Testing Involving Enzymes Or Micro-Organisms (AREA)
- Medicines That Contain Protein Lipid Enzymes And Other Medicines (AREA)
- Medical Treatment And Welfare Office Work (AREA)
Description
Translated fromJapanese本明細書に記載のツール及び方法は、脳神経画像処理マップ及び遺伝子発現マップを分析して、神経行動学的表現型に関連する薬物標的を同定し、反対に潜在的な薬物標的に関連する神経行動学的表現型を同定し、脳障害のための薬理学的治療薬の合理的設計及び応用を展開するための、遺伝子型及び神経表現型のトポグラフィに基づくアプローチに関する。これらのツール及び方法は、神経学的治療を必要とする対象の処置ももたらす。本明細書には、神経行動学的表現型及び遺伝子発現マップの双方向アライメントに基づいて、治療薬を選択し、最適化し、究極的には特定の神経回路を標的とすることが記載される。このアプローチは、神経行動学的データとトランスクリプトームデータとのアライメントまたは比較に基づいた治療薬設計及び意思決定を支援する実施可能な一連の実践的ステップ、ならびに新たな神経表現型トポグラフィ及び遺伝子型トポグラフィの定義及び利用をもたらす。 The tools and methods described herein analyze brain neuroimaging maps and gene expression maps to identify drug targets associated with neurobehavioral phenotypes and, conversely, neuronal maps associated with potential drug targets. Genotypic and neurophenotypical topography-based approaches to identify behavioral phenotypes and develop rational design and application of pharmacological therapeutics for brain disorders. These tools and methods also provide treatment for subjects in need of neurological therapy. Described herein is the selection, optimization, and ultimately targeting of therapeutic agents to specific neural circuits based on bidirectional alignment of neurobehavioral phenotypes and gene expression maps. . This approach provides a series of actionable practical steps to support therapeutic drug design and decision-making based on the alignment or comparison of neurobehavioral and transcriptomic data, as well as novel neurophenotypic topography and genotyping. Provides definitions and uses of topography.
このアプローチはとりわけ、例えば、神経画像処理または行動学的測定に基づき、治験における組み入れまたは除外について個々の対象のスクリーニングを行うことにより、臨床治験の設計を容易にすることができ、どの測定値について有効性を評価すべきかを決定することに役立つ。 This approach can, among other things, facilitate the design of clinical trials by screening individual subjects for inclusion or exclusion in trials, for example, based on neuroimaging or behavioral measures, and which measures Helps determine if efficacy should be evaluated.
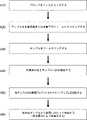
また本明細書には、ユニークな神経表現型トポグラフィ及び遺伝子型トポグラフィの定義、ならびに、所望の結果が得られるように、新たな神経表現型トポグラフィ及び遺伝子型トポグラフィを使用し、神経行動学的表現型情報とトランスクリプトーム情報とのアライメントまたは比較をスコア化する能力を含め、一連の特定の計算手順が記載される。本明細書では、計算ワークフローの例示的な機能ブロック図を提示及び記載する。 Also provided herein are definitions of unique neurophenotypic and genotypic topographies, and neurobehavioral representations using novel neurophenotypic and genotypic topographies to achieve desired results. A series of specific computational procedures are described, including the ability to score alignments or comparisons between type information and transcriptome information. Exemplary functional block diagrams of computational workflows are presented and described herein.
関連技術の説明
新たな中枢神経系(CNS)薬の開発は、とりわけ、CNS疾患の生態の理解不足によって妨げられている。例えば、好適な標的を選択し、介入すべきとき及び生態を効果的に変化させる方法を知ることは困難である。統合失調症及びパーキンソン病(PD)などのいくつかの疾患は長年にわたって進展し、そのため標的の同定が困難になることから、このことが特に当てはまる。更にこの課題は、神経精神障害患者群間の変動が大きいためにより大きなものとなり、正しい患者に対して各自の特定の中枢神経系変化に基づいた正しい処置を選ぶことは、未だ達成されていない。また、標的は動物モデル、遺伝学、病態生理学、またはヒト薬理学によって検証され得るものの、検証試験結果の評価は一般に、データの強度及び生産性に関する個人間及び企業間で異なる判断に基づいている。Description of the Related Art The development of new central nervous system (CNS) drugs is hampered, among other things, by a lack of understanding of the biology of CNS diseases. For example, it is difficult to choose suitable targets, know when to intervene, and how to effectively change biology. This is especially true as some diseases such as schizophrenia and Parkinson's disease (PD) evolve over many years, making target identification difficult. Furthermore, this challenge is exacerbated by the large variability between groups of neuropsychiatric patients, and choosing the right treatment for the right patient based on their specific central nervous system changes remains elusive. Also, although targets may be validated by animal models, genetics, pathophysiology, or human pharmacology, evaluation of validation test results is generally based on judgments that vary between individuals and companies regarding the strength and productivity of the data. .
CNS薬の開発に使用される動物モデルについては、多くの制限が認識されている。したがって、代替的な検証方法がますます重要になっている。また、CNS障害のための予測動物モデルは不足している。Bain et al.,Therapeutic Development in the Absence of Predictive Animal Models of Nervous System Disorders:Proceedings of a Workshop,THE NATIONAL ACADEMIES PRESS(2017)(非特許文献1)、http://nap.edu/24672にて閲覧可能(「Bain」)。また、十分に説明されている特徴的な生物現象を統合失調症などの複雑な疾患の症状と結び付けるために動物モデルが使用され得るとしても、そのようなモデルの説明能力は、表現型の基本メカニズムを解明し、結果の過剰一般化を防止するために多大な訓練を行うことからもたらされる。一般に、動物におけるCNS行動パラダイムを試験して、その動物における神経行動学的表現型を測定することは、臨床応用のための目的のヒト神経行動学的表現型に漫然と関連するのみであり得る。 A number of recognized limitations are associated with the animal models used to develop CNS drugs. Therefore, alternative verification methods are becoming increasingly important. Also, predictive animal models for CNS disorders are lacking. Bain et al. , Therapeutic Development in the Absence of Predictive Animal Models of Nervous System Disorders: Proceedings of a Workshop, THE NATIONAL ACADEMIES Press. Available at edu/24672 (“Bain”). Also, even though animal models can be used to link well-described characteristic biological phenomena to the symptoms of complex diseases such as schizophrenia, the explanatory power of such models is fundamental to phenotypes. It comes from doing a lot of training to elucidate the mechanisms and prevent overgeneralization of results. In general, testing CNS behavioral paradigms in animals to measure neurobehavioral phenotypes in those animals can only loosely relate to human neurobehavioral phenotypes of interest for clinical application.
また、多くの動物モデルがヒト遺伝学の理解の深まりに基づいているとはいえ、個々の遺伝子及びバリアントはわずかな効果しか有せず、完全浸透性ではない場合があると理解されている。一方、効果の大きいバリアントは様々な症状を引き起こすことが多く、これが解釈を更に複雑にする。また、効果の大きいリスク因子は種間で共通しない場合があり、動物の遺伝的バックグラウンドは表現型の解釈を複雑にし得る。一部のCNS障害については、既存の動物モデルは、疾患の主要な病理的特徴または症状をもたらさず、結果として、薬物が有効であるかどうかを実証することができない場合がある(例えば、パーキンソン病動物モデルは、凝集したアルファ-シヌクレインから構成されるレビー小体を示さず、統合失調症などの不均一性の高い疾患は、特定の疾患の態様またはサブタイプに対していくつかのモデルを必要とする)。最後に、単純にヒト神経系には実質的に全ての他の動物において表現されない態様があり、したがって、ヒトCNS疾患を動物モデルにおいて再現する試みには本質的に欠点があり得る。 Also, although many animal models are based on a better understanding of human genetics, it is understood that individual genes and variants may have small effects and may not be completely penetrant. On the other hand, high-efficacy variants often cause a variety of symptoms, further complicating interpretation. Also, high-impact risk factors may not be common across species, and an animal's genetic background can complicate phenotypic interpretation. For some CNS disorders, existing animal models do not elicit the major pathologic features or symptoms of the disease, and as a result may fail to demonstrate whether drugs are effective (e.g. Parkinson's disease). Animal models of disease do not exhibit Lewy bodies composed of aggregated alpha-synuclein, and highly heterogeneous diseases such as schizophrenia have several models for specific disease aspects or subtypes. I need). Finally, there are aspects of simply the human nervous system that are not expressed in virtually all other animals, and thus attempts to replicate human CNS disease in animal models can be inherently flawed.
また、標的の同定及び検証と、応答及び疾患を予測し得る臨床的尺度またはバイオマーカーの開発との間で、技術移転のギャップも存在する。更に、標的が同定及び検証されたとしても、治療的であるようなかたちで生態を変化させることは到達し難いかまたは困難であり得る。これらの問題はCNS障害で特に深刻である。 There is also a technology transfer gap between target identification and validation and the development of clinical measures or biomarkers that can predict response and disease. Moreover, even if a target is identified and validated, it can be elusive or difficult to alter biology in a therapeutic manner. These problems are particularly acute in CNS disorders.
更なるCNS薬の開発を複雑にしている別の要因は、現在のCNS治療薬が、特定の神経行動学的表現型、そして究極的には特定の人々についてスクリーニングされるのではなく、広範な症状の徴候についてスクリーニングされていることである。したがって、患者集団は、広範な症状に関する効果を維持しながら有害事象を最小限に抑えるように群レベルで定義される。この一般化された「群平均」アプローチは、特定の神経行動学的表現型の複雑さを見過ごすものであり、患者のニーズに最適に対処するとは限らない。 Another factor complicating the development of further CNS drugs is that current CNS therapeutics are not screened for specific neurobehavioral phenotypes and, ultimately, for specific populations, but rather broadly. Being screened for signs of symptoms. Patient populations are therefore defined at the herd level to minimize adverse events while maintaining efficacy on a broad spectrum of symptoms. This generalized 'group average' approach overlooks the complexities of specific neurobehavioral phenotypes and may not optimally address patient needs.
CNS薬の開発が直面する上記及び他の課題は、CNS薬の開発の成功率が全ての治療分野の中でも最低水準にあるという事実の主要因である。TCSDD.2014.CNS drugs take longer to develop,have lower success rates,than other drugs.IMPACT REPORT Volume 16,No.6,Tufts University(非特許文献2)。更に、承認薬の多くは反復性(iterative)であるに過ぎないため、承認薬数における見かけの増加は誤った成功感をもたらし得る。したがって、患者の役に立つため、またCNS障害(うつ病、統合失調症、及びアルツハイマー病(AD)など)ならびに他のCNS症状及び認知プロセスの問題を有する何億もの人々を処置するのに必要な薬物の流れを増加させるために、より効率的な創製及び開発方法が必要とされている。既存のアプローチに対して実践的かつ実施可能な変化及び影響をもたらすためには、かかる方法は、ヒト神経生物学に根差している必要がある。 These and other challenges facing CNS drug development are major factors in the fact that the success rate of CNS drug development is among the lowest of all therapeutic areas. TCS D.D. 2014. CNS drugs take longer to develop, have lower success rates, than other drugs. IMPACT REPORT Volume 16, No. 6, Tufts University (Non-Patent Document 2). Moreover, since many of the approved drugs are only iterative, the apparent increase in the number of approved drugs can give a false sense of success. Therefore, the drugs needed to help patients and treat hundreds of millions of people with CNS disorders such as depression, schizophrenia, and Alzheimer's disease (AD), as well as other CNS symptoms and problems with cognitive processes There is a need for more efficient creation and development methods to increase the flux of . Such methods need to be grounded in human neurobiology in order to bring about practical and workable changes and impacts on existing approaches.
重要なことに、脳機能は従来、神経回路、すなわち特定の機能を行うように接続した脳領域の集まりが関与するものとして説明されてきた。つまり、生命システムは、脳のメカニズム:解剖学的回路網の生理的作用を通してのみ、その認知能力を達成すると理解されている。脳回路は、ニューロンが単独では機能しないために重要であり、小(ミクロ)規模から大(マクロ)規模に及ぶ様々なサイズをとり得る。脳回路の概念は、我々の脳による情報処理が可能であるのは、1つのニューロンが隣のニューロンへと次々に情報を送る事実によるという原理に基づいている。したがって、重要なのはニューロン間の接続である。脳回路は、神経画像処理及び関連するマッピングデータを用いて観察及びマッピングすることができ、異なる領域にあるいくつかの異なるニューロンが互いと接続して一緒に働き、共同して情報を処理またはプロセスすることができるという事実を反映している。神経科学及び関連分野における知識の増加により、これらの回路のレイアウト及び特性を特徴付けるために不可欠なデータが明らかになっているが、未だ学ぶべきことは数多くあり、様々な回路の特徴付けの定義は不完全または不十分である。 Importantly, brain function has traditionally been described as involving neural circuits, collections of brain regions that are connected to perform specific functions. It is thus understood that living systems achieve their cognitive abilities only through the physiological action of brain mechanisms: anatomical networks. Brain circuits are important because neurons cannot function in isolation and can come in a variety of sizes ranging from small (micro) to large (macro) scales. The concept of brain circuits is based on the principle that information processing by our brain is possible due to the fact that one neuron in turn sends information to its neighbors. Therefore, it is the connections between neurons that matter. Brain circuits can be observed and mapped using neuroimaging and associated mapping data, in which several different neurons in different regions connect to each other and work together to jointly process or process information. It reflects the fact that you can Although increasing knowledge in neuroscience and related fields has revealed data essential to characterize the layout and properties of these circuits, there is still much to learn and definitions of the various circuit characterizations. incomplete or insufficient.
ヒトの脳は、保存された太古の(例えば、爬虫類の)回路の上に層になった進化的に新しい前脳回路設計(終脳回路)からなり、新しい設計がヒト脳の体積の90%超を占めると一般に考えられている。終脳前脳には、4つの主な区分(皮質、線条体複合体、海馬体、扁桃核)、及び多くの細区分(例えば、前部対後部皮質、5つの皮層、局所回路、線条体構成要素、海馬野CA1、CA3、歯状回、海馬台など)があり、それぞれ独自の細胞型及び局所回路設計レイアウトを有し、したがって、それぞれがユニークな計算的特性をもたらすと推定される。R.Granger,Essential circuits of cognition:The brain’s basic operations,architecture,and representations(2006)(非特許文献3)。とはいえ、新たな回路が発見されるにつれて脳回路網の理解は発展し続け、これまでに説明されている回路は再定義されるか、またはより良好に特徴付けられている。 The human brain consists of an evolutionarily new forebrain circuit design (telencephalic circuits) layered over conserved ancient (e.g., reptilian) circuits, with the new design occupying 90% of the human brain volume. It is generally considered to account for super. The telencephalic forebrain has four major divisions (cortex, striatal complex, hippocampal formation, amygdaloid nucleus) and many subdivisions (e.g., anterior vs. posterior cortex, five cortices, regional circuits, line striatal components, hippocampal areas CA1, CA3, dentate gyrus, subiculum, etc.), each with its own cell type and local circuit design layout, thus presumed to result in unique computational properties. be. R. Granger, Essential circuits of cognition: The brain's basic operations, architecture, and representations (2006) (Non-Patent Document 3). Nonetheless, our understanding of brain networks continues to evolve as new circuits are discovered, and previously described circuits are redefined or better characterized.
現在、ヒト「コネクトーム」、すなわち脳の回路の網羅的マップを構築する試みが進行中である。脳は数十億の細胞からなり、各細胞は数千の他の細胞に接触しているため、これは非常に難易度の高い試みである。脳回路の理解が向上すれば、科学者は、健康時の脳がどのように機能するか、そして損傷または疾病時にどのように機能不全に陥るか、また脳の健康を回復させる最良の方法の理解に一歩近づくだろう。 Attempts are currently underway to construct the human 'connectome', an exhaustive map of the brain's circuits. Since the brain is made up of billions of cells, and each cell contacts thousands of other cells, this is a very challenging undertaking. As our understanding of brain circuits improves, scientists will be able to better understand how the brain functions when healthy, how it malfunctions during injury or disease, and how best to restore brain health. One step closer to understanding.
同時に、精神障害を脳回路の障害として再定義することがCNS障害の薬学的処置の合理的設計のために不可欠であるという認識も高まっている。Insel et al.,Next-generation treatments for mental disorders,SCI.TRANSL.MED.,4:155ps19(2012)(非特許文献4)。しかし、回路定義ならびに神経行動学的プロセス及び病理の特徴付けの新たな所見、例えばCNS障害の薬学的処置の合理的設計のための非侵襲的神経画像処理によって明らかにされる脳領域のレベルにおける効果の特異性をどのように利用するかについては、大きな課題が残っている。この問題は双方向的に提起され得る。つまり、所与の薬物については、それが処置するのによく適した神経行動学的病態は何であり得るか?反対に、所与の病態については、どの薬物標的(例えば、シナプス受容体)または薬物がその処置によく適し得るか? At the same time, there is growing recognition that redefining psychiatric disorders as disorders of brain circuits is essential for the rational design of pharmaceutical treatments for CNS disorders. Insel et al. , Next-generation treatments for mental disorders, SCI. TRANSL. MED. , 4:155ps19 (2012) (Non-Patent Document 4). However, new findings in circuit definition and characterization of neurobehavioral processes and pathologies, such as those at the level of brain regions revealed by noninvasive neuroimaging for the rational design of pharmacological treatments for CNS disorders, have been demonstrated. A major challenge remains as to how to exploit the specificity of the effects. This issue can be raised both ways. That is, for a given drug, what neurobehavioral conditions might it be well suited to treat? Conversely, for a given disease state, which drug targets (eg, synaptic receptors) or drugs may be well suited for its treatment?
機能的磁気共鳴画像法(fMRI)などの非侵襲的神経画像処理法は、障害(例えば統合失調症)、症状ディメンション(例えば認知欠損)、及びプロセス(例えば作業記憶)を含め、多様な神経行動学的表現型に関与する回路の解明における大きな進歩を可能にしている。更に、これらの方法は、患者特異的処置に関する情報を提示する可能性があり得る神経バイオマーカーを発見するために応用されている。例えば、Drysdale et al.,Resting-state connectivity biomarkers define neurophysiological subtypes of depression,NAT.MED.(2016)(非特許文献5)、http://000ev39.myregisteredwp.com/wp-content/uploads/sites/3661/2017/01/Resting-state-connectivity-biomarkers-define-neurophysiological-subtypes-of-depression.pdfにて印刷前の電子出版が閲覧可能;Drysdale et al.,Resting-state connectivity biomarkers define neurophysiological subtypes of depression,NAT.MED.,Jan;23(1):28-38(2017)(非特許文献6)(合わせて「Drysdale」)を参照されたい。神経画像処理研究により、異なる脳領域における表現型関連効果の構造及び変動が明らかになり、特定の回路の全領域をより良く含めるような回路ベースの視点の必要性が強調されている。この変動は脳マップとして表現することができる。一例において、脳マップは、対象内または対象間の表現型関連変動に関連し得る特定の特徴の大きさを反映する数値の各脳領域への割り当てを使用し得る。 Non-invasive neuroimaging methods, such as functional magnetic resonance imaging (fMRI), are used to analyze a wide variety of neurobehavioral disorders, including disorders (e.g. schizophrenia), symptom dimensions (e.g. cognitive deficits), and processes (e.g. working memory). have enabled major advances in elucidating the circuits involved in biological phenotypes. In addition, these methods have been applied to discover neural biomarkers that may potentially provide information regarding patient-specific treatments. For example, Drysdale et al. , Resting-state connectivity biomarkers define neurophysiological subtypes of depression, NAT. MED. (2016) (Non-Patent Document 5), http://000ev39. my registered wp. com/wp-content/uploads/sites/3661/2017/01/Resting-state-connectivity-biomarkers-define-neurophysiological-subtypes-of-depression. Pre-print electronic publication available at pdf; Drysdale et al. , Resting-state connectivity biomarkers define neurophysiological subtypes of depression, NAT. MED. , Jan; 23(1):28-38 (2017) (Non-Patent Document 6) (together “Drysdale”). Neuroimaging studies have revealed the structure and variation of phenotype-related effects in different brain regions, highlighting the need for a circuit-based perspective that better encompasses all regions of a particular circuit. This variation can be represented as a brain map. In one example, a brain map may employ numerical values assigned to each brain region that reflect the magnitude of particular features that may be associated with phenotype-related variation within or between subjects.
一方、回路ベースのマップを作成するために遺伝情報が使用されてきた限りにおいて、これらは、対象内または対象間の画像データから導出される参照機能的マップを用いない事後分析に基づいていた。Tebbenkamp et al.,The developmental transcriptome of the human brain:implications for neurodevelopmental disorders,www.co-neurology.com,vol.27,no.00(2014)(非特許文献7)、Akbarian et al.,The PsychENCODE project,NATURE NEUROSCIENCE,Vol.18,No.12,DEC.(2015)(非特許文献8)、及びGandal et al.,Shared molecular neuropathology across major psychiatric disorders parallels polygenic overlap,SCIENCE,359,693-697,9 February(2018)(非特許文献9)を参照されたい。 On the other hand, to the extent that genetic information has been used to create circuit-based maps, these have been based on post hoc analyzes without reference functional maps derived from intra- or inter-subject image data. Tebbenkamp et al. , The developmental transcript of the human brain: Implications for neurodevelopmental disorders, www. co-neurology. com, vol. 27, no. 00 (2014) (Non-Patent Document 7), Akbarian et al. , The PsychENCODE project, NATURE NEUROSCIENCE, Vol. 18, No. 12, DEC. (2015) (Non-Patent Document 8), and Gandal et al. , Shared molecular neuropathology across major psychological disorders parallels polygenic overlap, SCIENCE, 359, 693-697, 9 February (2018) (Non-Patent Document 9).
以下に更に記載するように、従来理解されている神経回路は、本明細書に記載の神経表現型トポグラフィ及び遺伝子型トポグラフィと容易に区別可能である。ここで、神経回路ベースの所見は、全身性である医薬の投与が、特定の脳回路または脳回路のサブセットを優先的に標的とするようにどのように調整され得るかという疑問を含め、いくつかの疑問を提起する。合理的な薬物設計及び実世界の患者処置において重要な考慮事項は、「オフターゲット」分子効果の最小化である。そして、脳回路ベースのアプローチは、「オフターゲット」脳領域すなわち脳回路または脳回路のサブセット以外の脳領域に全身性薬物投与が与える潜在的な効果も考慮し得る。 As described further below, conventionally understood neural circuits are readily distinguishable from the neurophenotypic and genotypic topographies described herein. Here, neural circuit-based observations have been made several times, including the question of how administration of drugs that are systemic can be tailored to preferentially target specific brain circuits or subsets of brain circuits. raises the question of An important consideration in rational drug design and real-world patient treatment is the minimization of "off-target" molecular effects. And brain circuit-based approaches can also consider the potential effects of systemic drug administration on "off-target" brain regions, ie brain regions other than brain circuits or subsets of brain circuits.
細胞モデル及び計算的モデルなどの革新的モデル化システムは、現在の予測動物モデルの不足を緩和し得る。ヒト疾患の本質的な理解を進展させるために、ヒト臨床試験及び実験医学アプローチからのデータをより良く使用すべきであると提案されている。また、意義深いことに、科学界は、神経画像処理データベース及び脳遺伝子発現の空間的に網羅的なマップへの自由なアクセスを得ている。また、公的に利用可能な神経画像処理及び遺伝子発現データの量は増加し続けている。このデータは、遺伝子発現データ及び神経画像処理データを使用して脳組織を理解する心躍る方法を開拓し、基礎科学及び臨床科学の両方に対して大きな利益をもたらす。しかしこれらの新たな機会は、多数の技術的及び理論的課題も提示する。そのような課題としては、例えば、(1)神経画像処理データをオープンソースからスケーラブルに、再現性よく、かつ効率的に取り込み分析するマルチモーダルなデータ分析パイプラインが存在しないこと、(2)神経画像処理結果が解釈される皮質表面及び脳ボリュームに遺伝子発現データを投影するのが困難であること、ならびに(3)こうした患者を特徴付ける根底にある行動または症状構造を解明することなく患者集団の分類的記述を使用することが挙げられる。 Innovative modeling systems such as cellular models and computational models can alleviate the current deficit of predictive animal models. It has been proposed that data from human clinical trials and experimental medicine approaches should be better used to advance the essential understanding of human disease. Significantly, the scientific community has also gained unfettered access to neuroimaging databases and spatially comprehensive maps of brain gene expression. Also, the amount of publicly available neuroimaging and gene expression data continues to grow. This data opens up exciting ways to understand brain tissue using gene expression and neuroimaging data, with significant benefits for both basic and clinical sciences. But these new opportunities also present a number of technical and theoretical challenges. Such issues include, for example, (1) the lack of a multimodal data analysis pipeline that imports and analyzes neural imaging data from open sources in a scalable, reproducible and efficient manner; (3) the classification of patient populations without elucidating the underlying behavioral or symptomatic structures that characterize these patients; the use of explicit descriptions.
歴史的に、薬物の創製または開発の指針とするための神経画像処理の使用に対する従来のアプローチは、候補薬物が脳領域において結合するか(例えばPETベースの画像法)または活性を変化させるか(例えばfMRIベースの画像法)の同定に重点を置いてきた。Gunn et al.,Imagine in CNS Drug Discovery,SEMINARS IN NUCLEAR MEDICINE,UPDATES IN MOLECULAR BRAIN IMAGING,vol.47,issue 1,January(2017)(非特許文献10)、Wong et al.,The Role of Imaging in Proof of Concept for CNS Drug Discovery and Development,NEUROPSYCHOPHARMACOLOGY REVIEWS,34,187-203(2009)(非特許文献11)。各方法は、関心領域(ROI)アプローチに依存する。対照的に、本明細書で提案するアプローチは、表面ベースのトポグラフィ及び皮質区画化を組み込み、遺伝子、及び潜在的な薬物標的を、目的の表現型に関連する大域的な脳活性に関連付ける。ROIベースの方法から皮質表面トポグラフィを省略すると、CNS薬の創製及び開発のための神経画像処理の従来的な使用に固有の制限がもたらされる。 Historically, the conventional approach to using neuroimaging to guide drug creation or development has been to determine whether drug candidates bind (e.g., PET-based imaging) or alter activity (e.g., PET-based imaging) in brain regions. For example, fMRI-based imaging) has been focused on identification. Gunn et al. , Imagine in CNS Drug Discovery, SEMINARS IN NUCLEAR MEDICINE, UPDATES IN MOLECULAR BRAIN IMAGING, vol. 47,
本明細書に記載のツール及び方法は、脳神経画像処理マップ及び遺伝子発現マップ、または遺伝子型トポグラフィを分析して、神経行動学的表現型に関連する薬物標的を同定するため、および反対に潜在的な薬物標的に関連する神経行動学的表現型を同定するための、新たな遺伝子型及び神経表現型のトポグラフィに基づく方法及びツールに関する。一実施形態において、これらのツール及び方法は、脳障害のための薬理学的治療薬の合理的設計及び応用を促進または展開するために使用され得る。別の実施形態では、本発明のツール及び方法は、神経学的治療を必要とする対象を処置するためのトポグラフィに基づく方法及びツールも提供する。 The tools and methods described herein analyze brain neuroimaging maps and gene expression maps, or genotypic topographies, to identify drug targets associated with neurobehavioral phenotypes, and conversely, potential novel genotype and neurophenotype topography-based methods and tools for identifying neurobehavioral phenotypes associated with relevant drug targets. In one embodiment, these tools and methods can be used to facilitate or develop the rational design and application of pharmacological therapeutics for brain disorders. In another embodiment, the tools and methods of the present invention also provide topography-based methods and tools for treating subjects in need of neurological therapy.
これらのツール及び方法は、計算的ニューロインフォマティクスソフトウェア及びコンピュータプラットフォームを含み得る。このプラットフォームは、対象内または対象間の表現型関連変動に関連し得る特定の特徴の大きさを反映する数値を各脳領域に与える導出された脳神経画像処理マップを、1名以上の対象から得られた脳領域間の遺伝子の発現レベルを反映する数値を与える遺伝子発現マップまたは遺伝子型トポグラフィと統合し、大規模な脳マッピングニューロインフォマティクスにおける進歩を活用して、導出されたマップのアライメントを反映するスコアを導出する。遺伝子発現マップと神経画像処理マップとのアライメントをプールし、選択し、評価し、適応させ、重み付けし、マスクし、比較し、定量化すること、及びトポグラフィに基づくアプローチを使用して特定の神経表現型に関連する脳領野もしくは領域、または回路の特徴付けを行うことにより、これらのツール及び方法は、治療標的と神経行動学的表現型(例えば、障害、症状、認知プロセスなど)との関連性に関する予測能を提供する。本発明のツール及び方法はまた、CNS障害に関する遺伝子型及び神経表現型のトポグラフィに基づく処置方法を定義し評価する能力の増大をもたらし得る。したがって、本発明のツール及び方法は、神経行動学的表現型をモジュレートするための(すなわち、機能不全の処置及び機能の増強の両方のための)、遺伝子型及び神経表現型のトポグラフィに基づく治療薬の効率的で合理的な設計ならびに洗練及び応用のための新たな道を開く。 These tools and methods can include computational neuroinformatics software and computer platforms. The platform obtains derived neuroimaging maps from one or more subjects that give each brain region a numerical value that reflects the magnitude of a particular feature that may be associated with phenotype-related variation within or between subjects. Integrate with gene expression maps or genotypic topographies that give numerical values reflecting the expression levels of genes across the derived brain regions, and leverage advances in large-scale brain-mapping neuroinformatics to reflect the alignment of the derived maps. Derive the score. Pooling, selecting, evaluating, adapting, weighting, masking, comparing and quantifying alignments of gene expression maps with neuroimaging maps and using topography-based approaches to identify specific neurons By characterizing phenotype-associated brain areas or regions, or circuits, these tools and methods can be used to determine the association of therapeutic targets with neurobehavioral phenotypes (e.g., disorders, symptoms, cognitive processes, etc.). provide predictability about gender. The tools and methods of the present invention may also provide an increased ability to define and evaluate treatment modalities based on genotypic and neurophenotypic topography for CNS disorders. Thus, the tools and methods of the present invention are based on genotypic and neurophenotypic topography for modulating neurobehavioral phenotypes (i.e., both for treating dysfunction and enhancing function). It opens new avenues for efficient and rational design as well as refinement and application of therapeutic agents.
本発明のツール及び方法は、治療的関心の標的に関して利用可能な脳マッピング情報(例えば、神経画像処理マップ及び遺伝子発現マップ)を紐解き、再整理し、優先順位を付け、階層付け、比較し、解釈し、統合し、応用するために必要であり、遺伝子型及び神経表現型のトポグラフィに基づくアプローチ、すなわち従来理解されている脳回路の特徴付けに必ずしも制限されないアプローチを使用してこれを行う。 The tools and methods of the present invention unpack, reorganize, prioritize, rank, compare, and compare available brain mapping information (e.g., neuroimaging maps and gene expression maps) with respect to targets of therapeutic interest. We do this using genotypic and neurophenotypic topography-based approaches that are necessary to interpret, integrate and apply, i.e., approaches that are not necessarily confined to the characterization of brain circuits as conventionally understood.
本発明のツール及び方法は、神経行動学的表現型情報及びトランスクリプトーム情報を考慮することにより、神経回路の新たな特徴付けを行う。このアプローチには、個々もしくは群の行動学的表現型もしくは症状表現型から導出されたデータを含むように、またはこのデータが情報もしくは指針を示すように設計された方法が含まれる。この態様において、本発明のアプローチは、特定の遺伝子における遺伝子もしくは薬物の関与を示すためにトランスクリプトームプロファイルをオントロジーにより関連付けること、または特定の遺伝子もしくは薬物標的と無関係に安静時機能的結合性を精神障害の潜在的なバイオマーカーとして説明することに依存する他のアプローチとは異なる。Hawrylcz et al.,Canonical genetic signatures of the adult human brain,NATURE NEUROSCIENCE,vol.18,no.12,pp.1832-1842 and online methods(December 2015)、Yamada et al.,Resting-State Functional Connectivity-Based Biomarkers and Functional MRI-Based Neurofeedback for Psychiatric Disorders:A Challenge for Developing Theranostic Biomarkers,INTL.J.OF NEUROPSYCHOPHARMACOLOGY,20(10):769-781(2017)。 The tools and methods of the present invention provide a new characterization of neural circuits by considering neurobehavioral phenotypic and transcriptomic information. This approach includes methods designed to include data derived from individual or group behavioral or symptom phenotypes, or in which this data is informative or indicative. In this aspect, the approach of the present invention involves ontologically linking transcriptome profiles to indicate gene or drug involvement in specific genes, or resting state functional connectivity independent of specific gene or drug targets. It differs from other approaches that rely on describing it as a potential biomarker of psychiatric disorders. Hawrylcz et al. , Canonical genetic signatures of the adult human brain, NATURE NEUROSCIENCE, vol. 18, no. 12, pp. 1832-1842 and online methods (December 2015), Yamada et al. , Resting-State Functional Connectivity-Based Biomarkers and Functional MRI-Based Neurofeedback for Psychiatric Disorders: A Challenge for Developing Theranostic Biomarkers. J. OF NEUROPSY CHOPHARMA COLOGY, 20(10):769-781 (2017).
本発明のツール及び方法は、とりわけ、当技術分野におけるある特定のギャップに対処する。例えば、多くの調査は、対照集団と患者集団との間で差次的に調節された遺伝子転写物を同定することに焦点を当てていた。したがって、そのような研究は、「スペクトラム」レベルで、すなわち、特定の症状プロファイルの主要因である根底にある生態と無関係に、患者集団を定義していた。例えば、Liu et al.,DAWN:a framework to identify autism genes and subnetworks using gene expression and genetics,MOLECULAR AUTISM,5:22(2014)、Zhao et al.,Connectome-scale group-wise consistent resting-state network analysis in autism spectrum disorder,NEUROIMAGE:CLINICAL 12;23-33(2016)を参照されたい。ここで本発明のツール及び方法は、神経行動学的表現型の主要因である根底にある生態の参照を含めることにより、かかるギャップを埋める。 The tools and methods of the present invention address, among other things, certain gaps in the art. For example, many studies have focused on identifying differentially regulated gene transcripts between control and patient populations. Such studies have thus defined patient populations at a 'spectrum' level, ie, independently of the underlying biology that is the primary driver of a particular symptom profile. For example, Liu et al. , DAWN: a framework to identify autism genes and subnetworks using gene expression and genetics, MOLECULAR AUTISM, 5:22 (2014), Zhao et al. , Connectome-scale group-wise consistent resting-state network analysis in autism spectrum disorder, NEUROIMAGE: CLINICAL 12; 23-33 (2016). Here the tools and methods of the present invention fill this gap by including the underlying ecological reference that is the primary driver of the neurobehavioral phenotype.
ここで、合理的CNS薬設計及びCNS障害の処置に影響する問題は、CNS障害の薬学的処置の合理的設計のために遺伝子発現データ及び神経画像処理データを組み込む、遺伝子型及び神経表現型のトポグラフィに基づくアプローチを使用して対処される。本発明のアプローチは、特定の神経表現型に関して脳領域間で神経回路の生物物理学的特性及び薬物標的密度がどのように異なるかに関する、回路から導出される知識を向上させ、これに基づき、これを洗練し、またこれを再定義し、かつ、神経行動学的表現型マッピング及び遺伝子発現マッピングという2つのタイプの脳マッピングを統合して、下記に詳述する新たな遺伝子型及び神経表現型のトポグラフィに基づくアプローチを提供する。 Here, the issues affecting rational CNS drug design and treatment of CNS disorders are genotypic and neurophenotypic studies that incorporate gene expression and neuroimaging data for the rational design of pharmaceutical treatments for CNS disorders. Addressed using a topography-based approach. The present approach improves circuit-derived knowledge of how biophysical properties of neural circuits and drug target densities differ between brain regions for specific neurophenotypes, and based thereon: Refining and redefining this, and integrating two types of brain mapping, neurobehavioral phenotype mapping and gene expression mapping, to develop new genotypes and neurophenotypes detailed below. provide a topography-based approach.
本発明のツール及び方法によって対処される問いは、例えば、神経行動学的表現型に関連する薬物標的の同定と、反対に潜在的な薬物標的に関連する神経行動学的表現型の同定とを対象とし得る。したがって、本発明の遺伝子型及び神経表現型のトポグラフィに基づくアプローチは、脳障害の薬理学的治療薬の合理的設計及び応用の発展をもたらす。 The questions addressed by the tools and methods of the present invention include, for example, identifying drug targets associated with neurobehavioral phenotypes and, conversely, identifying neurobehavioral phenotypes associated with potential drug targets. Can be targeted. Thus, the genotypic and neurophenotypic topography-based approach of the present invention leads to the development of rational design and application of pharmacological therapeutic agents for brain disorders.
本発明のツール及び方法は、神経行動学的表現型と治療薬との間の結び付きを見定めたり、同定したり、比較したり、決定したり、またはマッピングしたりするためのより高い特異性をもたらすことを含め、いくつかの問題に対処する。この事例では、神経画像処理マップ及び遺伝子発現マップの両方を考慮して、潜在的または実質的な治療活性のある領野または領域を定義または特徴付け、また、オフターゲット送達の潜在的領野または領域を同定し得る、遺伝子型及び神経表現型のトポグラフィに基づくアプローチにより、従来の回路ベースのアプローチが置き換えられる。 The tools and methods of the present invention provide greater specificity for discerning, identifying, comparing, determining, or mapping links between neurobehavioral phenotypes and therapeutic agents. address several issues, including bringing In this case, both neuroimaging maps and gene expression maps are considered to define or characterize areas or regions of potential or substantial therapeutic activity, as well as potential areas or regions of off-target delivery. Identifiable genotypic and neurophenotypical topography-based approaches replace traditional circuit-based approaches.
本発明のツール及び方法によって対処される問題は、広範な神経行動学的表現型に存在する変動に対処するために必要とされる、より精確な標的化の提供である。 The problem addressed by the tools and methods of the present invention is the provision of the more precise targeting needed to address the variability present in a wide range of neurobehavioral phenotypes.
本発明のツール及び方法によって対処される別の問題は、遺伝子型及び神経表現型のトポグラフィに基づくアプローチを提供することによる、より重要な領野または領域を優先的にモジュレートするため、及びオフターゲットの領野または領域に対する効果を最小限に抑えるために必要とされる、特定の脳領野に対する治療薬のより精確な標的化の提供である。 Another problem addressed by the tools and methods of the present invention is to preferentially modulate more important areas or areas and off-target by providing a topography-based approach of genotype and neurophenotype. The provision of more precise targeting of therapeutic agents to specific brain areas is required to minimize effects on the area or regions of the brain.
本発明のツール及び方法によって対処される更に別の問題は、特定の目的の神経行動学的表現型に関与する重要な領野または領域をより精確に標的とするために、潜在的な治療薬を同定するために必要な形式論の提供である。例えば、本発明のツール及び方法は、目的の神経行動学的表現型に関与する脳領野または領域を選択的に標的とし得る薬物を同定するために使用され得る。 Yet another problem addressed by the tools and methods of the present invention is to target potential therapeutic agents more precisely to key areas or areas involved in a particular neurobehavioral phenotype. It is the provision of the formalism necessary for identification. For example, the tools and methods of the invention can be used to identify drugs that can selectively target brain areas or regions involved in a neurobehavioral phenotype of interest.
本発明のツール及び方法によって対処される別の問題は、神経行動学的表現型を処置のための候補として同定するために必要な形式論の提供であり、この候補は、特定の目的の薬物に関連する遺伝子発現マップと特徴的脳マップがアラインされる表現型によって同定され得る。 Another problem addressed by the tools and methods of the present invention is the provision of the formalism necessary to identify a neurobehavioral phenotype as a candidate for treatment, where the candidate is a drug of particular interest. can be identified by phenotypes that are aligned with gene expression maps and characteristic brain maps associated with .
本発明のツール及び方法によって対処される別の問題は、遺伝子発現マップを関連付けることに基づく種間の見識を生み出すために必要な形式論の提供である。 Another issue addressed by the tools and methods of the present invention is the provision of the formalism necessary to generate cross-species insights based on correlating gene expression maps.
本発明のツール及び方法によって対処される別の問題は、主要な脳領野または領域を精確に標的とするための複数の治療薬の組み合わせを合理的に開発するために必要とされる、脳遺伝子型及び神経表現型のトポグラフィに基づく形式論の提供である。現在、薬物標的をコードする遺伝子を発現する領野に対する多剤療法の効果を最大化するための形式論は存在しない。 Another problem addressed by the tools and methods of the present invention is the need to rationally develop combinations of therapeutic agents to precisely target a key brain area or region. It provides a formalism based on type and neurophenotype topography. Currently, there is no formalism for maximizing the effects of multidrug therapy on regions expressing genes encoding drug targets.
本発明のツール及び方法はまた、個別化された処置選択をもたらし得る。本発明のプラットフォームは、患者から得られた神経データまたは行動データのいずれかに基づいて、個々の患者レベルで推定上の処置応答に関する情報を提示するツール及び方法を提供する。 The tools and methods of the invention can also provide for individualized treatment selection. The platform of the present invention provides tools and methods to present information on putative treatment response at the individual patient level based on either neurological or behavioral data obtained from the patient.
本発明のツール及び方法はまた、関与する遺伝子との類似性に基づく薬物標的の同定をもたらし得る。例えば、本発明のツール及び方法は、アルツハイマー病と結び付けられ、かつ直接的に投薬可能(drugable)ではないAPOE遺伝子との類似性に基づいて、薬物標的を同定するのに適し得る。 The tools and methods of the invention can also result in the identification of drug targets based on their similarity to the genes involved. For example, the tools and methods of the invention may be suitable for identifying drug targets based on their similarity to the APOE gene, which has been linked to Alzheimer's disease and is not directly druggable.
本発明のツール及び方法はまた、関与する神経回路に対する1つ以上の遺伝子の類似性に基づく薬物標的の同定をもたらし得る。 The tools and methods of the invention can also result in the identification of drug targets based on the similarity of one or more genes to the neural circuits involved.
本発明のツール及び方法はまた、神経行動学的表現型に関連する薬物標的、または反対に潜在的な薬物標的に関連する神経行動学的表現型を検査することにより、応用有効性の試験(すなわち、臨床治験の最適化)を行うための、好適な患者集団サブセットの選択、または患者集団の精製をもたらし得る。 The tools and methods of the present invention can also be used to test the efficacy of applications ( selection of suitable patient population subsets, or refinement of patient populations for conducting clinical trials.
本発明のツール及び方法はまた、臨床治験または動物実験のための薬物の選択をもたらし得る。本発明のアプローチは、神経画像処理マップに対する潜在的な薬物標的のアライメントに基づいて推定上の標的関与(target engagement)に関する情報を提示する方法を提供する。 The tools and methods of the invention can also effect the selection of drugs for clinical trials or animal studies. The present approach provides a method of presenting information about putative target engagement based on alignment of potential drug targets to neuroimaging maps.
本発明のツール及び方法はまた、表現型-トランスクリプトームマッピングの動物への応用をもたらし得る。本発明のアプローチは、疾患動物モデル(例えばノックアウト)を介したハイスループットスクリーニングをもたらす方法を提供する。動物における神経表現型マップを所与として、本発明のアプローチは、かかるマップと最大限にアラインする遺伝子を一括処理する(sweep across)方法を提供する。これは、改善された、またはより正確な治療設計のための使用方法を提供する。 The tools and methods of the invention can also provide animal applications of phenotype-transcriptome mapping. The approach of the present invention provides a method for high-throughput screening via animal models of disease (eg, knockouts). Given a neurophenotype map in an animal, the present approach provides a method to sweep across genes that align maximally with such map. This provides a method of use for improved or more precise treatment design.
本発明のツール及び方法はまた、関与する神経回路に基づく、または関連する神経表現型と定量的な結び付きがある行動的変動に基づく、特定の人々に関する診断決定をもたらし得る。 The tools and methods of the invention can also result in diagnostic decisions for particular people based on the neural circuits involved or based on behavioral variations that are quantitatively linked to the associated neural phenotype.
本発明のツール及び方法はまた、遺伝子トランスクリプトームアライメントに基づく、供与される治療法の効果の予知をもたらし得る。 The tools and methods of the invention can also provide prediction of the efficacy of delivered therapeutics based on gene transcriptome alignments.
本発明のツール及び方法はまた、遺伝子トランスクリプトームアライメントに基づく、神経回路の変化に対する本格的な病気の前の推定上の処置応答(すなわち、リスク)の予知をもたらし得る。 The tools and methods of the invention can also provide prediction of putative treatment responses (ie, risks) prior to full-blown disease to alterations in neural circuits based on gene transcriptome alignments.
本発明のツール及び方法はまた、侵襲的なファーマコイメージングの回避をもたらし得る。具体的に言うと、本発明のアプローチは、既知の症状応答を有する個人群において既知の臨床的な薬理学的応答がある場合に神経表現型を同定するための方法を提供し得る。ここで、神経行動学的マッピングが未知である場合、この応用は、その薬物に対する遺伝子トランスクリプトームとの関連で既知の応答に基づいて所与の回路を特定する。 The tools and methods of the present invention may also provide for the avoidance of invasive pharmacoimaging. Specifically, the approach of the present invention may provide a method for identifying neurophenotypes when there is a known clinical pharmacological response in a group of individuals with known symptomatic responses. Here, where neurobehavioral mapping is unknown, this application identifies a given circuit based on its known response in the context of the gene transcriptome to that drug.
本発明のツール及び方法はまた、多剤療法を提供し得る。 The tools and methods of the invention may also provide for multi-drug therapy.
本発明のツール及び方法はまた、所与の薬物によって標的とされる受容体についてのトランスクリプトームプロファイル、または遺伝子マッピングを介して、所与の薬物に対する臨床応答における神経行動学的マッピングに関する情報を提示し得る。例えば、ここで「トランスクリプトームプロファイル」とは、遺伝子-遺伝子マッピングを指し得る。すなわち、特定の遺伝子(遺伝子#1)を標的とする薬物が何をするかは臨床的証拠に基づいて分かるため、新規の遺伝子(遺伝子#2)を標的とする薬物の分布の類似性に基づいて同様の臨床応答を推論することができる。また「遺伝子マッピング」とは、機能回路(すなわち、特定の機能を行うために一緒に働く脳領域の集まり)において治療薬が標的とする遺伝子の発現パターンのみに基づいて治療薬の効果を推論する能力を指し得る。 The tools and methods of the present invention also provide information on neurobehavioral mapping in the clinical response to a given drug through transcriptome profiling, or genetic mapping, for receptors targeted by a given drug. can present. For example, "transcriptome profile" herein can refer to gene-gene mapping. That is, because we know based on clinical evidence what a drug that targets a particular gene (gene #1) will do, it is likely that drugs targeting a novel gene (gene #2) will not similar clinical responses can be inferred. “Gene mapping” is the inference of therapeutic drug effects based solely on the expression patterns of the genes they target in functional circuits (i.e., collections of brain regions that work together to perform a particular function). can refer to ability.
具体的に言うと、2つの薬物が臨床治験において差次的な症状応答を誘導する場合、それらの受容体標的化と、所与のトランスクリプトームマップとの既知のアライメントは、その症状の変化における神経回路の関与を示す。 Specifically, if two drugs induce differential symptomatic responses in clinical trials, their receptor targeting and their known alignment with a given transcriptome map may indicate that symptomatic change. shows the involvement of neural circuits in
例えば、従来の神経回路の境界は侵襲的または非侵襲的な神経記録または神経画像処理技術によって定められるが、本発明による、神経表現型トポグラフィと遺伝子発現マップまたは遺伝子型トポグラフィとの間のアライメントは、従来の回路マッピング技術では見ることのできない回路を指し示すことができる。言い換えれば、遺伝子発現と神経マップまたは神経表現型マップとの組み合わせを使用すると、最大限に相互にアラインされる(co-aligned)新規の推定上の回路の定義が可能になる。 For example, while the boundaries of conventional neural circuits are defined by invasive or non-invasive neural recording or neuroimaging techniques, according to the present invention, alignments between neural phenotypic topography and gene expression maps or genotypic topography are , can point to circuits that cannot be seen with conventional circuit mapping techniques. In other words, the combination of gene expression and neural or neural phenotype maps allows the definition of novel putative circuits that are maximally co-aligned.
したがって、本発明の遺伝子-神経表現型アライメントトポグラフィアプローチを使用して定められた神経回路の境界は、従来の神経回路の境界から逸脱する場合がある。この逸脱の一例は、所与の疾患に関連する神経表現型変動マップが、1つより多くの遺伝子マップと最大のアライメントを呈するため、そのような複数の遺伝子のアライメントなしでは従来は同定不可能な回路にわたるアライメントをもたらすということであり得る。
[本発明1001]
コンピューティングデバイスであって、
コンピュータ命令を記憶するメモリと、
プロセッサとを備え、
前記プロセッサが、前記コンピュータ命令を実行するとき、
選択された神経行動学的表現型についての神経表現型トポグラフィを、前記選択された神経行動学的表現型についての神経行動学的表現型マッピングデータに基づいて生成する動作;
複数の遺伝子のうちの各遺伝子それぞれについての遺伝子型トポグラフィを、前記各遺伝子についての遺伝子発現マッピングデータに基づいて生成する動作;
前記選択された神経行動学的表現型と前記複数の遺伝子との間の複数の表現型-遺伝子ペアトポグラフィを定める動作であって、各表現型-遺伝子ペアそれぞれについての各表現型-遺伝子ペアトポグラフィが、前記選択された神経行動学的表現型の前記神経表現型トポグラフィと、前記各表現型-遺伝子ペアについての前記各遺伝子の前記遺伝子型トポグラフィとに基づいて定められる、前記定める動作;
前記複数の表現型-遺伝子ペアトポグラフィのうちの各々についての定量的スコアを、前記選択された神経行動学的表現型の前記神経表現型トポグラフィと、前記各表現型-遺伝子ペアについての前記各遺伝子の前記遺伝子型トポグラフィとの間の相関関係に基づいて決定する動作;
選択された閾値を超えるスコアをそれぞれ有する、前記複数の表現型-遺伝子ペアトポグラフィのうちの1つ以上を選択する動作;及び
前記選択された1つ以上の表現型-遺伝子ペアトポグラフィのそれぞれの前記遺伝子をユーザに表示する動作
を実施する、コンピューティングデバイス。
[本発明1002]
前記プロセッサが、前記コンピュータ命令を実行するとき、前記選択された1つ以上の表現型-遺伝子ペアトポグラフィのそれぞれの前記遺伝子に関連するそれぞれの神経薬物標的を1つ以上同定する動作を更に実施する、本発明1001のコンピューティングデバイス。
[本発明1003]
前記プロセッサが、前記選択された神経行動学的表現型を有する複数の人々のうちの各々についての前記神経行動学的表現型マッピングデータから前記神経表現型トポグラフィを生成するための更なるコンピュータ命令を実行することにより、前記神経表現型トポグラフィを生成する、本発明1001のコンピューティングデバイス。
[本発明1004]
前記プロセッサが、前記各遺伝子についての前記遺伝子発現マッピングデータと前記神経行動学的表現型マッピングデータとの間のアライメントに基づいて各表現型-遺伝子ペアトポグラフィについての統計的有意性を決定するための更なるコンピュータ命令を実行することにより、前記複数の表現型-遺伝子ペアトポグラフィのうちの各々についての前記スコアを決定する、本発明1001のコンピューティングデバイス。
[本発明1005]
前記プロセッサが、前記選択された神経行動学的表現型の前記神経表現型トポグラフィと、標的表現型-遺伝子ペアトポグラフィについての前記各遺伝子の前記遺伝子型トポグラフィとの間の決定された関連性の程度が最も高い前記標的表現型-遺伝子ペアトポグラフィを選択するための更なるコンピュータ命令を実行することにより、前記1つ以上の表現型-遺伝子ペアトポグラフィを選択する、本発明1001のコンピューティングデバイス。
[本発明1006]
前記複数の遺伝子のうちの各々についての前記遺伝子発現マッピングデータが、前記選択された神経行動学的表現型を有しない複数の人々からの複数の遺伝子発現に関する遺伝子発現マッピングデータを含む、本発明1001のコンピューティングデバイス。
[本発明1007]
前記プロセッサが、前記複数の人々の前記複数の遺伝子発現における前記複数の遺伝子のうちの各々についての代表的プローブを選択するための更なるコンピュータ命令を実行することにより、各遺伝子それぞれについての前記遺伝子型トポグラフィを生成する、本発明1006のコンピューティングデバイス。
[本発明1008]
前記プロセッサが、遺伝子発現マッピングサンプルを脳構造における部位にマッピングするための更なるコンピュータ命令を実行することにより、各遺伝子それぞれについての前記遺伝子型トポグラフィを生成する、本発明1001のコンピューティングデバイス。
[本発明1009]
前記プロセッサが、バックグラウンドシグナルを超える閾値レベル未満の発現レベル測定値を有するサンプルを除外することによって遺伝子発現マッピングサンプルをフィルタリングするための更なるコンピュータ命令を実行することにより、各遺伝子それぞれについての前記遺伝子型トポグラフィを生成する、本発明1001のコンピューティングデバイス。
[本発明1010]
前記プロセッサが、プローブ値が欠損している遺伝子発現マッピングサンプルにおいてプローブ値を補完するための更なるコンピュータ命令を実行することにより、各遺伝子それぞれについての前記遺伝子型トポグラフィを生成する、本発明1001のコンピューティングデバイス。
[本発明1011]
前記プロセッサが、前記遺伝子発現マッピングデータから外的バイアスを除去するための更なるコンピュータ命令を実行することにより、各遺伝子それぞれについての前記遺伝子型トポグラフィを生成する、本発明1001のコンピューティングデバイス。
[本発明1012]
前記プロセッサが、前記遺伝子発現マッピングデータを捕捉するために使用される遺伝子プローブにわたって平均値除去及びzスコア正規化を行うための更なるコンピュータ命令を実行することにより、前記外的バイアスを除去する、本発明1011のコンピューティングデバイス。
[本発明1013]
前記プロセッサが、前記遺伝子発現マッピングデータにおけるシグナル対ノイズ比を高めるための更なるコンピュータ命令を実行することにより、各遺伝子それぞれについての前記遺伝子型トポグラフィを生成する、本発明1001のコンピューティングデバイス。
[本発明1014]
前記プロセッサが、同じ表面頂点上にマッピングされたサンプルに関する前記遺伝子発現マッピングデータの発現レベルを平均化するための更なるコンピュータ命令を実行することにより、前記シグナル対ノイズ比を高める、本発明1013のコンピューティングデバイス。
[本発明1015]
前記プロセッサが、低密度遺伝子発現サンプルを、サンプリングされた脳領域から、他のサンプリングされていない脳領域に内挿するための更なるコンピュータ命令を実行することにより、各遺伝子それぞれについての前記遺伝子型トポグラフィを生成する、本発明1001のコンピューティングデバイス。
[本発明1016]
前記プロセッサが、区画化された皮質マップもしくは皮質下マップ、または高密度の皮質マップもしくは皮質下マップのうちの少なくとも1つを生成するための更なるコンピュータ命令を実行することにより、前記低密度遺伝子発現サンプルを内挿する、本発明1015のコンピューティングデバイス。
[本発明1017]
前記プロセッサが、前記遺伝子発現マッピングデータにおける複数の脳領域のうちの各々に重み値を割り当てるための更なるコンピュータ命令を実行することにより、各遺伝子それぞれについての前記遺伝子型トポグラフィを生成する、本発明1001のコンピューティングデバイス。
[本発明1018]
前記プロセッサが、前記神経行動学的表現型マッピングデータにおける複数の脳領域のうちの各々に重み値を割り当てるための更なるコンピュータ命令を実行することにより、前記神経行動学的トポグラフィを生成する、本発明1001のコンピューティングデバイス。
[本発明1019]
前記プロセッサが、
前記神経行動学的表現型マッピングデータにおける前記複数の脳領域のうちの第1の脳領域セットに対して閾値を超える第1の重み値セットを割り当て;かつ
前記神経行動学的表現型マッピングデータにおける前記複数の脳領域のうちの第2の脳領域セットに対して前記閾値未満の第2の重み値セットを割り当てる
ための更なるコンピュータ命令を実行することにより、前記複数の脳領域のうちの各々に前記重み値を割り当てる、本発明1018のコンピューティングデバイス。
[本発明1020]
前記プロセッサが、標的脳領域に関連する情報を前記神経行動学的表現型マッピングデータから除去するように、前記複数の脳領域のうちの前記標的脳領域にマスキング重み値を割り当てるための更なるコンピュータ命令を実行することにより、前記複数の脳領域のうちの各々に前記重み値を割り当てる、本発明1018のコンピューティングデバイス。
[本発明1021]
前記プロセッサが、前記神経行動学的表現型トポグラフィと、遺伝子の組み合わせに関する遺伝子型トポグラフィの組み合わせとの間の少なくとも1つの組み合わせ表現型-遺伝子ペアトポグラフィを定めるための更なるコンピュータ命令を実行することにより、前記複数の表現型-遺伝子ペアトポグラフィを定める、本発明1001のコンピューティングデバイス。
[本発明1022]
前記プロセッサが、前記コンピュータ命令を実行するとき、
前記選択された閾値を超える前記スコアをそれぞれ有する、前記複数の表現型-遺伝子ペアトポグラフィのうちの前記1つ以上として、前記少なくとも1つの組み合わせ表現型-遺伝子ペアトポグラフィを選択する動作;及び
前記遺伝子の組み合わせを前記ユーザに表示する動作
を更に行う、本発明1021のコンピューティングデバイス。
[本発明1023]
前記プロセッサが、前記コンピュータ命令を実行するとき、
個々の遺伝子または神経薬物標的それぞれについての遺伝子発現マッピングデータと神経行動学的表現型マッピングデータとのアライメントと比べて向上した、前記神経行動学的表現型マッピングデータとのアライメントを呈する遺伝子発現マッピングデータを組み合わせることにより、遺伝子または神経薬物標的の組み合わせを同定する動作
を更に行う、本発明1001のコンピューティングデバイス。
[本発明1024]
前記神経行動学的表現型マッピングデータが、脳障害、症状、または認知プロセスのうちの1つに関するものである、本発明1001のコンピューティングデバイス。
[本発明1025]
コンピューティングデバイスによって、選択された神経表現型についての神経表現型マッピングデータを得る工程;
前記コンピューティングデバイスによって、1つ以上の遺伝子についての遺伝子発現マッピングデータを得る工程;
前記コンピューティングデバイスによって、前記選択された神経行動学的表現型と前記1つ以上の遺伝子のうちの各遺伝子との間の各表現型-遺伝子ペアそれぞれについての定量的スコアを、前記選択された神経行動学的表現型についての前記神経行動学的表現型マッピングデータと、前記各表現型-遺伝子ペアの前記各遺伝子についての前記遺伝子発現マッピングデータとの間の相関関係に基づいて決定する工程;及び
前記コンピューティングデバイスによって、各表現型-遺伝子ペアについて決定された前記スコアをユーザに提示する工程
を含む、方法。
[本発明1026]
コンピューティングデバイスであって、
コンピュータ命令を記憶するメモリと、
プロセッサとを備え、
前記プロセッサが、前記コンピュータ命令を実行するとき、
前記コンピューティングデバイスによって、選択された遺伝子についての遺伝子型トポグラフィを、前記選択された遺伝子についての遺伝子発現マッピングデータに基づいて生成する動作;
前記コンピューティングデバイスによって、複数の神経行動学的表現型のうちの各神経行動学的表現型それぞれについての神経表現型トポグラフィを、前記各神経行動学的表現型についての神経行動学的表現型マッピングデータに基づいて生成する動作;
前記コンピューティングデバイスによって、前記選択された遺伝子と前記複数の神経行動学的表現型との間の複数の遺伝子-表現型ペアトポグラフィを定める動作であって、各遺伝子-表現型ペアそれぞれについての各遺伝子-表現型ペアトポグラフィが、前記選択された遺伝子の前記遺伝子型トポグラフィと、前記各遺伝子-表現型ペアについての前記各神経行動学的表現型の前記神経表現型トポグラフィとに基づいて定められる、前記定める動作;
前記コンピューティングデバイスによって、前記複数の遺伝子-表現型ペアトポグラフィのうちの各々についての定量的スコアを、前記選択された遺伝子の前記遺伝子型トポグラフィと、前記各遺伝子-表現型ペアについての前記各神経行動学的表現型の前記神経表現型トポグラフィとの間の相関関係に基づいて決定する動作;
選択された閾値を超えるスコアをそれぞれ有する、前記複数の遺伝子-表現型ペアトポグラフィのうちの1つ以上を選択する動作;及び
前記選択された1つ以上の遺伝子-表現型ペアトポグラフィの前記各神経行動学的表現型をユーザに表示する動作
を実施する、前記コンピューティングデバイス。
[本発明1027]
前記プロセッサが、前記コンピュータ命令を実行するとき、ユーザにより選択された神経薬物標的が前記選択された遺伝子に関連することに基づいて前記選択された遺伝子を選択する動作を更に実施する、本発明1026のコンピューティングデバイス。
[本発明1028]
前記プロセッサが、前記選択された神経行動学的表現型を有する複数の人々のうちの各々についての前記神経行動学的表現型マッピングデータから前記神経表現型トポグラフィを生成するための更なるコンピュータ命令を実行することにより、前記神経表現型トポグラフィを生成する、本発明1026のコンピューティングデバイス。
[本発明1029]
前記プロセッサが、前記各神経行動学的表現型についての前記神経行動学的表現型マッピングデータと前記遺伝子発現マッピングデータとの間のアライメントに基づいて各遺伝子-表現型ペアトポグラフィについての統計的有意性を決定するための更なるコンピュータ命令を実行することにより、前記複数の遺伝子-表現型ペアトポグラフィのうちの各々についての前記スコアを決定する、本発明1026のコンピューティングデバイス。
[本発明1030]
前記プロセッサが、前記選択された遺伝子の前記遺伝子型トポグラフィと、標的遺伝子-表現型ペアトポグラフィについての前記各神経行動学的表現型の前記神経表現型トポグラフィとの間の決定された関連性の程度が最も高い前記標的遺伝子-表現型ペアトポグラフィを選択するための更なるコンピュータ命令を実行することにより、前記1つ以上の遺伝子-表現型ペアトポグラフィを選択する、本発明1026のコンピューティングデバイス。
[本発明1031]
前記選択された遺伝子についての前記遺伝子発現マッピングデータが、前記複数の神経行動学的表現型のうちの1つを有しない複数の人々からの複数の遺伝子発現に関する遺伝子発現マッピングデータを含む、本発明1026のコンピューティングデバイス。
[本発明1032]
前記プロセッサが、前記複数の人々の前記複数の遺伝子発現における前記選択された遺伝子についての代表的プローブを選択するための更なるコンピュータ命令を実行することにより、前記選択された遺伝子についての前記遺伝子型トポグラフィを生成する、本発明1031のコンピューティングデバイス。
[本発明1033]
前記プロセッサが、遺伝子発現マッピングサンプルを脳構造における部位にマッピングするための更なるコンピュータ命令を実行することにより、前記選択された遺伝子についての前記遺伝子型トポグラフィを生成する、本発明1026のコンピューティングデバイス。
[本発明1034]
前記プロセッサが、バックグラウンドシグナルを超える閾値レベル未満の発現レベル測定値を有するサンプルを除外することによって遺伝子発現マッピングサンプルをフィルタリングするための更なるコンピュータ命令を実行することにより、前記選択された遺伝子についての前記遺伝子型トポグラフィを生成する、本発明1026のコンピューティングデバイス。
[本発明1035]
前記プロセッサが、プローブ値が欠損している遺伝子発現マッピングサンプルにおいてプローブ値を補完するための更なるコンピュータ命令を実行することにより、前記選択された遺伝子についての前記遺伝子型トポグラフィを生成する、本発明1026のコンピューティングデバイス。
[本発明1036]
前記プロセッサが、前記遺伝子発現マッピングデータから外的バイアスを除去するための更なるコンピュータ命令を実行することにより、前記選択された遺伝子についての前記遺伝子型トポグラフィを生成する、本発明1026のコンピューティングデバイス。
[本発明1037]
前記プロセッサが、前記遺伝子発現マッピングデータを捕捉するために使用される遺伝子プローブにわたって平均値除去及びzスコア正規化を行うための更なるコンピュータ命令を実行することにより、前記外的バイアスを除去する、本発明1036のコンピューティングデバイス。
[本発明1038]
前記プロセッサが、前記遺伝子発現マッピングデータにおけるシグナル対ノイズ比を高めるための更なるコンピュータ命令を実行することにより、前記選択された遺伝子についての前記遺伝子型トポグラフィを生成する、本発明1026のコンピューティングデバイス。
[本発明1039]
前記プロセッサが、同じ表面頂点上にマッピングされたサンプルに関する前記遺伝子発現マッピングデータの発現レベルを平均化するための更なるコンピュータ命令を実行することにより、前記シグナル対ノイズ比を高める、本発明1038のコンピューティングデバイス。
[本発明1040]
前記プロセッサが、低密度遺伝子発現サンプルを、サンプリングされた脳領域から、他のサンプリングされていない脳領域に内挿するための更なるコンピュータ命令を実行することにより、前記選択された遺伝子についての前記遺伝子型トポグラフィを生成する、本発明1026のコンピューティングデバイス。
[本発明1041]
前記プロセッサが、区画化された皮質マップもしくは皮質下マップ、または高密度の皮質マップもしくは皮質下マップのうちの少なくとも1つを生成するための更なるコンピュータ命令を実行することにより、前記低密度遺伝子発現サンプルを内挿する、本発明1040のコンピューティングデバイス。
[本発明1042]
前記プロセッサが、前記遺伝子発現マッピングデータにおける複数の脳領域のうちの各々に重み値を割り当てるための更なるコンピュータ命令を実行することにより、前記選択された遺伝子についての前記遺伝子型トポグラフィを生成する、本発明1026のコンピューティングデバイス。
[本発明1043]
前記プロセッサが、前記神経行動学的表現型マッピングデータにおける複数の脳領域のうちの各々に重み値を割り当てるための更なるコンピュータ命令を実行することにより、各神経行動学的表現型それぞれについての前記神経行動学的トポグラフィを生成する、本発明1026のコンピューティングデバイス。
[本発明1044]
前記プロセッサが、
前記神経行動学的表現型マッピングデータにおける前記複数の脳領域のうちの第1の脳領域セットに対して閾値を超える第1の重み値セットを割り当て、かつ、
前記神経行動学的表現型マッピングデータにおける前記複数の脳領域のうちの第2の脳領域セットに対して前記閾値未満の第2の重み値セットを割り当てる
ための更なるコンピュータ命令を実行することにより、前記複数の脳領域のうちの各々に前記重み値を割り当てる、本発明1043のコンピューティングデバイス。
[本発明1045]
前記プロセッサが、標的脳領域に関連する情報を前記神経行動学的表現型マッピングデータから除去するように、前記複数の脳領域のうちの前記標的脳領域にマスキング重み値を割り当てるための更なるコンピュータ命令を実行することにより、前記複数の脳領域のうちの各々に前記重み値を割り当てる、本発明1043のコンピューティングデバイス。
[本発明1046]
前記プロセッサが、前記遺伝子型トポグラフィと、神経行動学的表現型の組み合わせに関する神経表現型トポグラフィの組み合わせとの間の少なくとも1つの組み合わせ遺伝子-表現型ペアトポグラフィを定めるための更なるコンピュータ命令を実行することにより、前記複数の遺伝子-表現型ペアトポグラフィを定める、本発明1026のコンピューティングデバイス。
[本発明1047]
前記プロセッサが、前記コンピュータ命令を実行するとき、
前記選択された閾値を超える前記スコアをそれぞれ有する、前記複数の遺伝子-表現型ペアトポグラフィのうちの前記1つ以上として、前記少なくとも1つの組み合わせ遺伝子-表現型ペアトポグラフィを選択する動作;及び
前記神経行動学的表現型の組み合わせを前記ユーザに表示する動作
を更に行う、本発明1046のコンピューティングデバイス。
[本発明1048]
前記プロセッサが、前記コンピュータ命令を実行するとき、
個々の神経行動学的表現型それぞれについての神経表現型マッピングデータと遺伝子発現マッピングデータとのアライメントと比べて向上した、前記遺伝子発現マッピングデータとのアライメントを呈する神経表現型マッピングデータを組み合わせることにより、神経行動学的表現型の組み合わせを同定する動作
を更に行う、本発明1026のコンピューティングデバイス。
[本発明1049]
前記神経行動学的表現型マッピングデータが、脳障害、症状、または認知プロセスのうちの1つに関するものである、本発明1026のコンピューティングデバイス。
[本発明1050]
コンピューティングデバイスによって、1つ以上の遺伝子についての遺伝子発現マッピングデータを得る工程;
コンピューティングデバイスによって、選択された神経表現型についての神経表現型マッピングデータを得る工程;
コンピューティングデバイスによって、前記選択された遺伝子と前記1つ以上の神経行動学的表現型のうちの各神経表現型との間の各遺伝子-表現型ペアそれぞれについての定量的スコアを、前記選択された遺伝子についての前記遺伝子発現マッピングデータと、前記各遺伝子-表現型ペアの前記各神経行動学的表現型についての前記神経表現型マッピングデータとの間の相関関係に基づいて決定する工程;及び
コンピューティングデバイスによって、各遺伝子-表現型ペアについて決定された前記スコアをユーザに提示する工程
を含む、方法。
[本発明1051]
コンピューティングデバイスであって、
コンピュータ命令を記憶するメモリと、
プロセッサとを備え、
前記プロセッサが、前記コンピュータ命令を実行するとき、
複数の遺伝子についての複数の遺伝子型トポグラフィを、各遺伝子それぞれについての各遺伝子発現マッピングデータに基づいて生成する動作;
前記複数の遺伝子のうちの第1の遺伝子について、前記複数の遺伝子型トポグラフィから第1の遺伝子型トポグラフィを選択する動作;
前記複数の遺伝子のうちの複数の第2の遺伝子について、前記複数の遺伝子型トポグラフィから複数の第2の遺伝子型トポグラフィを選択する動作;
前記第1の遺伝子と前記複数の第2の遺伝子との間の複数の遺伝子-遺伝子ペアトポグラフィを定める動作であって、各遺伝子-遺伝子ペアそれぞれについての各遺伝子-遺伝子ペアトポグラフィが、選択された遺伝子の前記第1の遺伝子型トポグラフィと、前記各遺伝子-遺伝子ペアについての前記各第2の遺伝子の各第2の遺伝子型トポグラフィとに基づいて定められる、前記定める動作;
前記複数の遺伝子-遺伝子ペアトポグラフィのうちの各々についての定量的スコアを、前記第1の遺伝子の前記第1の遺伝子型トポグラフィと、前記各遺伝子-遺伝子ペアについての前記各第2の遺伝子の前記第2の遺伝子型トポグラフィとの間の相関関係に基づいて決定する動作;
選択された閾値を超えるスコアをそれぞれ有する、前記複数の遺伝子-遺伝子ペアトポグラフィのうちの1つ以上を選択する動作;及び
前記選択された1つ以上の遺伝子-遺伝子ペアトポグラフィの前記各第2の遺伝子をユーザに表示する動作
を実施する、前記コンピューティングデバイス。
[本発明1052]
前記プロセッサが、前記コンピュータ命令を実行するとき、ユーザにより選択された神経薬物標的が前記第1の遺伝子に関連することに基づいて前記第1の遺伝子を選択する動作を更に実施する、本発明1051のコンピューティングデバイス。
[本発明1053]
前記プロセッサが、前記コンピュータ命令を実行するとき、前記選択された1つ以上の遺伝子-遺伝子ペアトポグラフィの前記各第2の遺伝子に関連するそれぞれの神経薬物標的を1つ以上同定する動作を更に実施する、本発明1051のコンピューティングデバイス。
[本発明1054]
前記プロセッサが、前記各第2の遺伝子についての前記各遺伝子発現マッピングデータと前記第1の遺伝子についての前記各遺伝子発現マッピングデータとの間のアライメントに基づいて各遺伝子-遺伝子ペアトポグラフィについての統計的有意性を決定するための更なるコンピュータ命令を実行することにより、前記複数の遺伝子-遺伝子ペアトポグラフィのうちの各々についての前記スコアを決定する、本発明1051のコンピューティングデバイス。
[本発明1055]
前記プロセッサが、前記第1の遺伝子の前記第1の遺伝子型トポグラフィと、標的遺伝子-遺伝子ペアトポグラフィについての前記各第2の遺伝子の前記各第2の遺伝子型トポグラフィとの間の決定された関連性の程度が最も高い前記標的遺伝子-遺伝子ペアトポグラフィを選択するための更なるコンピュータ命令を実行することにより、前記1つ以上の遺伝子-遺伝子ペアトポグラフィを選択する、本発明1051のコンピューティングデバイス。
[本発明1056]
前記遺伝子発現マッピングデータが、複数の人々からの複数の遺伝子発現に関する遺伝子発現マッピングデータを含む、本発明1051のコンピューティングデバイス。
[本発明1057]
前記プロセッサが、前記複数の人々の前記複数の遺伝子発現における各遺伝子についての代表的プローブを選択するための更なるコンピュータ命令を実行することにより、前記複数の遺伝子型トポグラフィを生成する、本発明1056のコンピューティングデバイス。
[本発明1058]
前記プロセッサが、遺伝子発現マッピングサンプルを脳構造における部位にマッピングするための更なるコンピュータ命令を実行することにより、前記複数の遺伝子型トポグラフィを生成する、本発明1051のコンピューティングデバイス。
[本発明1059]
前記プロセッサが、バックグラウンドシグナルを超える閾値レベル未満の発現レベル測定値を有するサンプルを除外することによって遺伝子発現マッピングサンプルをフィルタリングするための更なるコンピュータ命令を実行することにより、前記複数の遺伝子型トポグラフィを生成する、本発明1051のコンピューティングデバイス。
[本発明1060]
前記プロセッサが、プローブ値が欠損している遺伝子発現マッピングサンプルにおいてプローブ値を補完するための更なるコンピュータ命令を実行することにより、前記複数の遺伝子型トポグラフィを生成する、本発明1051のコンピューティングデバイス。
[本発明1061]
前記プロセッサが、前記遺伝子発現マッピングデータから外的バイアスを除去するための更なるコンピュータ命令を実行することにより、前記複数の遺伝子型トポグラフィを生成する、本発明1051のコンピューティングデバイス。
[本発明1062]
前記プロセッサが、前記遺伝子発現マッピングデータを捕捉するために使用される遺伝子プローブにわたって平均値除去及びzスコア正規化を行うための更なるコンピュータ命令を実行することにより、前記外的バイアスを除去する、本発明1061のコンピューティングデバイス。
[本発明1063]
前記プロセッサが、前記遺伝子発現マッピングデータにおけるシグナル対ノイズ比を高めるための更なるコンピュータ命令を実行することにより、前記複数の遺伝子型トポグラフィを生成する、本発明1051のコンピューティングデバイス。
[本発明1064]
前記プロセッサが、同じ表面頂点上にマッピングされたサンプルに関する前記遺伝子発現マッピングデータの発現レベルを平均化するための更なるコンピュータ命令を実行することにより、前記シグナル対ノイズ比を高める、本発明1063のコンピューティングデバイス。
[本発明1065]
前記プロセッサが、低密度遺伝子発現サンプルを、サンプリングされた脳領域から、他のサンプリングされていない脳領域に内挿するための更なるコンピュータ命令を実行することにより、前記複数の遺伝子型トポグラフィを生成する、本発明1051のコンピューティングデバイス。
[本発明1066]
前記プロセッサが、区画化された皮質マップもしくは皮質下マップ、または高密度の皮質マップもしくは皮質下マップのうちの少なくとも1つを生成するための更なるコンピュータ命令を実行することにより、前記低密度遺伝子発現サンプルを内挿する、本発明1065のコンピューティングデバイス。
[本発明1067]
前記プロセッサが、前記遺伝子発現マッピングデータにおける複数の脳領域のうちの各々に重み値を割り当てるための更なるコンピュータ命令を実行することにより、前記複数の遺伝子型トポグラフィを生成する、本発明1051のコンピューティングデバイス。
[本発明1068]
前記プロセッサが、
前記遺伝子発現マッピングデータにおける前記複数の脳領域のうちの第1の脳領域セットに対して閾値を超える第1の重み値セットを割り当て、かつ、
前記遺伝子発現マッピングデータにおける前記複数の脳領域のうちの第2の脳領域セットに対して前記閾値未満の第2の重み値セットを割り当てる
ための更なるコンピュータ命令を実行することにより、前記複数の脳領域のうちの各々に前記重み値を割り当てる、本発明1067のコンピューティングデバイス。
[本発明1069]
前記プロセッサが、標的脳領域に関連する情報を前記遺伝子発現マッピングデータから除去するように、前記複数の脳領域のうちの前記標的脳領域にマスキング重み値を割り当てるための更なるコンピュータ命令を実行することにより、前記複数の脳領域のうちの各々に前記重み値を割り当てる、本発明1067のコンピューティングデバイス。
[本発明1070]
前記プロセッサが、前記第1の遺伝子型トポグラフィと、第2の遺伝子の組み合わせに関する第2の遺伝子型トポグラフィの組み合わせとの間の少なくとも1つの組み合わせ遺伝子-遺伝子ペアトポグラフィを定めるための更なるコンピュータ命令を実行することにより、前記複数の遺伝子-遺伝子ペアトポグラフィを定める、本発明1051のコンピューティングデバイス。
[本発明1071]
前記プロセッサが、前記コンピュータ命令を実行するとき、
前記選択された閾値を超える前記スコアをそれぞれ有する、前記複数の遺伝子-遺伝子ペアトポグラフィのうちの前記1つ以上として、前記少なくとも1つの組み合わせ遺伝子-遺伝子ペアトポグラフィを選択する動作;及び
前記第2の遺伝子の組み合わせを前記ユーザに表示する動作
を更に行う、本発明1070のコンピューティングデバイス。
[本発明1072]
コンピューティングデバイスによって、複数の遺伝子についての遺伝子発現マッピングデータを得る工程;
前記コンピューティングデバイスによって、選択された遺伝子と1つ以上の他の遺伝子との間の各遺伝子-遺伝子ペアそれぞれについての定量的スコアを、前記選択された遺伝子についての前記遺伝子発現マッピングデータと、前記各遺伝子-遺伝子ペアの前記1つ以上の他の遺伝子についての前記遺伝子発現マッピングデータとの間の相関関係に基づいて決定する工程;及び
前記コンピューティングデバイスによって、各遺伝子-遺伝子ペアについて決定された前記スコアをユーザに提示する工程
を含む、方法。
[本発明1073]
神経薬物標的を同定する方法であって、
神経行動学的表現型を選択する工程;
遺伝子発現マッピングデータ及び神経行動学的表現型マッピングデータを処理する工程;
関連性のある神経表現型トポグラフィを定める工程;及び
前記神経薬物標的に関する遺伝子発現と前記神経行動学的表現型との間に関連性がある可能性を予測する工程
を含み、
方法の少なくとも1つの工程が、コンピュータ実装方法またはコンピュータ可読媒体のうちの1つを使用して実施される、
前記方法。
[本発明1074]
前記神経行動学的表現型マッピングデータを前処理する工程を更に含む、本発明1073の方法。
[本発明1075]
前記神経行動学的表現型マッピングデータを重み付けする工程またはマスキングする工程のうちの1つを更に含む、本発明1074の方法。
[本発明1076]
前記遺伝子発現マッピングデータから外的バイアスを除去する工程、または遺伝子発現マッピングデータのシグナル対ノイズ比を向上させる工程のうちの少なくとも1つを更に含む、本発明1073の方法。
[本発明1077]
前記関連性のある神経表現型トポグラフィを定める前記工程が、少なくとも1つの脳部位または領域に関連する前記遺伝子発現マッピングデータを前処理することを含む、本発明1073の方法。
[本発明1078]
前記遺伝子発現マッピングデータが、低密度サンプルレベル、内挿された高密度マップレベル、または離散的な区画化された脳マップレベルのうちの1つにおいて生じる、本発明1077の方法。
[本発明1079]
1つ以上の遺伝子発現値を、皮質における連続的な高密度部位、または皮質における離散的な部位に割り当てる工程を更に含む、本発明1073の方法。
[本発明1080]
前記神経行動学的表現型マッピングデータが、脳障害、症状、または認知プロセスのうちの1つに関するものである、本発明1073の方法。
[本発明1081]
神経薬物標的療法がオフターゲット脳領域に影響する可能性を予測する工程を更に含む、本発明1073の方法。
[本発明1082]
前記方法が、遺伝子発現マッピングデータを組み合わせることによって神経薬物標的の組み合わせを同定する工程を更に含み、前記組み合わされた遺伝子発現マッピングデータが、個々の神経薬物標的それぞれについての遺伝子発現マッピングデータと神経行動学的表現型マッピングデータとのアライメントと比べて向上した、前記神経行動学的表現型マッピングデータとのアライメントを呈する、本発明1073の方法。
[本発明1083]
神経行動学的表現型を同定する方法であって、
前処理された遺伝子発現マッピングデータを神経行動学的表現型マッピングデータとアラインする工程;及び
関連性のある神経の神経表現型トポグラフィを定める工程
を含む、前記方法。
[本発明1084]
前記遺伝子発現マッピングデータを前処理する工程を更に含む、本発明1083の方法。
[本発明1085]
前記遺伝子発現マッピングデータを重み付けする工程またはマスキングする工程のうちの1つを更に含む、本発明1084の方法。
[本発明1086]
外的バイアスを除去するかまたはシグナル対ノイズ比を向上させるかのいずれかのために前記遺伝子発現マッピングデータを前処理する工程を更に含む、本発明1084の方法。
[本発明1087]
前記関連性のある神経表現型トポグラフィを定める前記工程が、少なくとも1つの脳部位または領域に関連する前記遺伝子発現マッピングデータを前処理することを含む、本発明1083の方法。
[本発明1088]
前記遺伝子発現マッピングデータが、低密度サンプルレベル、内挿された高密度マップレベル、または離散的な区画化された脳マップレベルのうちの1つにおいて生じる、本発明1083の方法。
[本発明1089]
1つ以上の遺伝子発現値を、皮質における連続的な高密度部位、または皮質における離散的な部位に割り当てる工程を更に含む、本発明1083の方法。
[本発明1090]
前記神経行動学的表現型マッピングデータが、脳障害、症状、または認知プロセスのうちの1つに関するものである、本発明1083の方法。
[本発明1091]
神経薬物標的療法がオフターゲット脳領域に影響する可能性を予測する工程を更に含む、本発明1083の方法。
[本発明1092]
命令を記憶した非一時的コンピュータ可読媒体であって、前記命令が、コンピューティングデバイスによって実行されると、前記コンピューティングデバイスに、遺伝子発現マッピングデータと神経行動学的表現型マッピングデータとのアライメントを定量化すること;及び関連性のある神経の神経表現型トポグラフィを定めることを含む、治療標的を同定するためのオペレーションを行わせる、前記コンピュータ可読媒体。
[本発明1093]
命令を記憶した非一時的コンピュータ可読媒体であって、前記命令が、コンピューティングデバイスによって実行されると、前記コンピューティングデバイスに、遺伝子発現マッピングデータと神経行動学的表現型マッピングデータとのアライメントを定量化すること;及び関連性のある神経の神経表現型トポグラフィを定めることを含む、神経行動学的表現型を同定するためのオペレーションを行わせる、前記コンピュータ可読媒体。
[本発明1094]
遺伝子発現マッピングデータと神経行動学的表現型マッピングデータとのアライメントを分析するためのコンピュータ実装システムであって、
メモリと、
前記メモリに接続された1つ以上のプロセッサとを備え、
前記1つ以上のプロセッサが、遺伝子発現マッピングデータと神経行動学的表現型マッピングデータとのアライメントを定量化するように構成されている、
前記コンピュータ実装システム。Thus, neural circuit boundaries defined using the gene-neurophenotype alignment topography approach of the present invention may deviate from conventional neural circuit boundaries. One example of this deviation is that the neurophenotypic variation map associated with a given disease exhibits maximal alignment with more than one gene map and is thus conventionally unidentifiable without such multiple gene alignments. may be that it provides alignment across a wide range of circuits.
[Invention 1001]
a computing device,
a memory that stores computer instructions;
a processor;
When the processor executes the computer instructions,
an act of generating a neurophenotypic topography for a selected neurobehavioral phenotype based on neurobehavioral mapping data for the selected neurobehavioral phenotype;
an act of generating a genotypic topography for each gene of a plurality of genes based on gene expression mapping data for each gene;
an act of defining a plurality of phenotype-gene pair topographies between the selected neurobehavioral phenotype and the plurality of genes, each phenotype-gene pair topography for each respective phenotype-gene pair; is determined based on the neurophenotypic topography of the selected neurobehavioral phenotype and the genotypic topography of each gene for each phenotype-gene pair;
generating a quantitative score for each of said plurality of phenotype-gene pair topographies, said neurophenotype topography of said selected neurobehavioral phenotype and said each gene for said each phenotype-gene pair; determining based on the correlation between the genotypic topography of
an act of selecting one or more of the plurality of phenotype-gene pair topographies, each having a score exceeding a selected threshold; and
an act of displaying to a user the gene for each of the selected one or more phenotype-gene pair topographies;
A computing device that performs
[Invention 1002]
The processor, when executing the computer instructions, further performs the act of identifying one or more respective neurodrug targets associated with each of the genes of the one or more selected phenotype-gene pair topographies. , the computing device of the present invention 1001;
[Invention 1003]
further computer instructions for the processor to generate the neurobehavioral topography from the neurobehavioral phenotype mapping data for each of the plurality of people with the selected neurobehavioral phenotype; 1002. The computing device of the invention 1001, which upon execution generates said neurophenotype topography.
[Invention 1004]
for the processor to determine statistical significance for each phenotype-gene pair topography based on alignments between the gene expression mapping data and the neurobehavioral phenotype mapping data for each of the genes; 1002. The computing device of invention 1001, determining said score for each of said plurality of phenotype-gene pair topographies by executing further computer instructions.
[Invention 1005]
The processor determines the degree of relatedness between the neurophenotypic topography of the selected neurobehavioral phenotype and the genotypic topography of each of the genes for a target phenotype-gene pair topography. 1002. The computing device of invention 1001, wherein said one or more phenotype-gene pair topographies are selected by executing further computer instructions for selecting said target phenotype-gene pair topography with the highest .
[Invention 1006]
1001. The method 1001, wherein said gene expression mapping data for each of said plurality of genes comprises gene expression mapping data for a plurality of gene expression from a plurality of people without said selected neurobehavioral phenotype. computing device.
[Invention 1007]
said gene for each gene by executing further computer instructions for selecting representative probes for each of said plurality of genes in said plurality of gene expressions of said plurality of people; The computing device of the invention 1006 that generates a type topography.
[Invention 1008]
1002. The computing device of invention 1001, wherein said processor generates said genotypic topography for each respective gene by executing further computer instructions for mapping gene expression mapping samples to sites in brain structures.
[Invention 1009]
for each gene by said processor executing further computer instructions to filter gene expression mapping samples by excluding samples having expression level measurements below a threshold level above background signal; The computing device of the invention 1001 that generates a genotypic topography.
[Invention 1010]
1002. The method of claim 1001, wherein said processor generates said genotypic topography for each respective gene by executing further computer instructions for imputing probe values in gene expression mapping samples lacking probe values. computing device.
[Invention 1011]
1002. The computing device of invention 1001, wherein said processor generates said genotypic topography for each respective gene by executing further computer instructions for removing external biases from said gene expression mapping data.
[Invention 1012]
the processor removes the external bias by executing further computer instructions to perform mean removal and z-score normalization over the gene probes used to capture the gene expression mapping data; The computing device of the present invention 1011.
[Invention 1013]
1002. The computing device of invention 1001, wherein said processor generates said genotypic topography for each respective gene by executing further computer instructions for increasing signal-to-noise ratio in said gene expression mapping data.
[Invention 1014]
1014. The method of claim 1013, wherein said processor enhances said signal-to-noise ratio by executing further computer instructions to average expression levels of said gene expression mapping data for samples mapped onto the same surface vertex. computing device.
[Invention 1015]
said genotype for each gene respectively by said processor executing further computer instructions to interpolate low-density gene expression samples from sampled brain regions to other unsampled brain regions; The computing device of the invention 1001 that generates topography.
[Invention 1016]
the low density gene by the processor executing further computer instructions to generate at least one of a compartmentalized cortical or subcortical map or a high density cortical or subcortical map; A computing device of the invention 1015 for interpolating expression samples.
[Invention 1017]
The present invention wherein said processor generates said genotypic topography for each respective gene by executing further computer instructions for assigning a weight value to each of a plurality of brain regions in said gene expression mapping data. 1001 computing devices.
[Invention 1018]
wherein said processor generates said neurobehavioral topography by executing further computer instructions for assigning a weight value to each of a plurality of brain regions in said neurobehavioral phenotype mapping data; The computing device of invention 1001.
[Invention 1019]
the processor
assigning a first set of weight values above a threshold to a first set of the plurality of brain regions in the neurobehavioral phenotype mapping data; and
assigning a second set of weight values below the threshold to a second set of brain regions of the plurality of brain regions in the neurobehavioral phenotype mapping data;
1019. The computing device of invention 1018, assigning said weight value to each of said plurality of brain regions by executing further computer instructions for.
[Invention 1020]
a further computer for assigning a masking weight value to the target brain region of the plurality of brain regions such that the processor removes information associated with the target brain region from the neurobehavioral phenotype mapping data; 1019. The computing device of invention 1018, executing instructions to assign said weight value to each of said plurality of brain regions.
[Invention 1021]
by said processor executing further computer instructions for defining at least one combined phenotype-gene pair topography between said neurobehavioral phenotypic topography and a combination of genotypic topographies for gene combinations; , the computing device of the invention 1001, which defines said plurality of phenotype-gene pair topographies.
[Invention 1022]
When the processor executes the computer instructions,
selecting said at least one combined phenotype-gene pair topography as said one or more of said plurality of phenotype-gene pair topographies each having said score exceeding said selected threshold; and
An operation of displaying the gene combination to the user
The computing device of the present invention 1021, further comprising:
[Invention 1023]
When the processor executes the computer instructions,
Gene expression mapping data exhibiting an improved alignment with the neurobehavioral phenotype mapping data compared to the alignment of the gene expression mapping data and the neurobehavioral phenotype mapping data for each individual gene or neurodrug target. The act of identifying combinations of genes or neurodrug targets by combining
The computing device of the invention 1001, further comprising:
[Invention 1024]
1002. The computing device of invention 1001, wherein said neurobehavioral phenotype mapping data relates to one of a brain disorder, a symptom, or a cognitive process.
[Invention 1025]
obtaining neurophenotype mapping data for the selected neurophenotype with a computing device;
obtaining gene expression mapping data for one or more genes by the computing device;
The computing device calculates a quantitative score for each phenotype-gene pair between the selected neurobehavioral phenotype and each of the one or more genes, the selected determining based on the correlation between the neurobehavioral phenotype mapping data for a neurobehavioral phenotype and the gene expression mapping data for each of the genes of each phenotype-gene pair; as well as
presenting to a user, by the computing device, the score determined for each phenotype-gene pair;
A method, including
[Invention 1026]
a computing device,
a memory that stores computer instructions;
a processor;
When the processor executes the computer instructions,
an act of generating, by said computing device, a genotypic topography for a selected gene based on gene expression mapping data for said selected gene;
neurobehavioral topography for each neurobehavioral phenotype of a plurality of neurobehavioral phenotypes and neurobehavioral mapping for each neurobehavioral phenotype by the computing device; actions to generate based on the data;
defining, by the computing device, a plurality of gene-phenotype pair topographies between the selected gene and the plurality of neurobehavioral phenotypes, wherein for each gene-phenotype pair respectively a gene-phenotype pair topography is defined based on the genotypic topography of the selected gene and the neurophenotypic topography of each neurobehavioral phenotype for each gene-phenotype pair; the action defined above;
The computing device generates a quantitative score for each of the plurality of gene-phenotype pair topographies, the genotypic topography of the selected gene, and the each neuron for each gene-phenotype pair. determining actions based on correlations between behavioral phenotypes and said neurophenotype topography;
an act of selecting one or more of the plurality of gene-phenotype pair topographies, each having a score exceeding a selected threshold; and
an act of displaying to a user each of said neurobehavioral phenotypes of said one or more selected gene-phenotype pair topographies;
Said computing device for implementing
[Invention 1027]
The present invention 1026, wherein the processor, when executing the computer instructions, further performs an act of selecting the selected gene based on the association of the neuropharmaceutical target selected by the user with the selected gene. computing device.
[Invention 1028]
further computer instructions for the processor to generate the neurobehavioral topography from the neurobehavioral phenotype mapping data for each of the plurality of people with the selected neurobehavioral phenotype; 1026. The computing device of the invention 1026 which, by executing, generates said neurophenotype topography.
[Invention 1029]
The processor determines statistical significance for each gene-phenotype pair topography based on alignments between the neurobehavioral phenotype mapping data and the gene expression mapping data for each neurobehavioral phenotype. 1026. The computing device of invention 1026, wherein said score for each of said plurality of gene-phenotype pair topographies is determined by executing further computer instructions for determining a .
[Invention 1030]
The processor determines the degree of relatedness between the genotypic topography of the selected gene and the neurophenotypic topography of each neurobehavioral phenotype for a target gene-phenotype paired topography. 1026. The computing device of invention 1026, which selects said one or more gene-phenotype pair topographies by executing further computer instructions for selecting said target gene-phenotype pair topography with the highest .
[Invention 1031]
The invention, wherein said gene expression mapping data for said selected genes comprises gene expression mapping data for a plurality of gene expression from a plurality of people who do not have one of said plurality of neurobehavioral phenotypes. 1026 computing devices.
[Invention 1032]
the genotype for the selected gene by the processor executing further computer instructions to select representative probes for the selected gene in the plurality of gene expressions of the plurality of people; The computing device of the invention 1031 that generates a topography.
[Invention 1033]
1027. The computing device of invention 1026, wherein said processor generates said genotypic topography for said selected gene by executing further computer instructions for mapping gene expression mapping samples to sites in brain structures. .
[Invention 1034]
for the selected genes by the processor executing further computer instructions for filtering gene expression mapping samples by excluding samples with expression level measurements below a threshold level above background signal; 1026. The computing device of the invention 1026, which generates said genotypic topography of
[Invention 1035]
The present invention, wherein said processor generates said genotypic topography for said selected gene by executing further computer instructions for imputing probe values in gene expression mapping samples lacking probe values. 1026 computing devices.
[Invention 1036]
1027. The computing device of invention 1026, wherein said processor generates said genotypic topography for said selected genes by executing further computer instructions for removing external biases from said gene expression mapping data. .
[Invention 1037]
the processor removes the external bias by executing further computer instructions to perform mean removal and z-score normalization over the gene probes used to capture the gene expression mapping data; A computing device of the present invention 1036.
[Invention 1038]
1027. The computing device of invention 1026, wherein said processor generates said genotypic topography for said selected gene by executing further computer instructions for enhancing signal-to-noise ratio in said gene expression mapping data. .
[Invention 1039]
of the present invention 1038, wherein the processor enhances the signal-to-noise ratio by executing further computer instructions to average expression levels of the gene expression mapping data for samples mapped onto the same surface vertex. computing device.
[Invention 1040]
said processor for said selected gene by executing further computer instructions for interpolating low-density gene expression samples from sampled brain regions to other unsampled brain regions; A computing device of the invention 1026 that generates a genotypic topography.
[Invention 1041]
the low density gene by the processor executing further computer instructions to generate at least one of a compartmentalized cortical or subcortical map or a high density cortical or subcortical map; A computing device of the invention 1040 that interpolates expression samples.
[Invention 1042]
wherein the processor generates the genotypic topography for the selected gene by executing further computer instructions to assign a weight value to each of a plurality of brain regions in the gene expression mapping data; A computing device of the present invention 1026.
[Invention 1043]
for each neurobehavioral phenotype by the processor executing further computer instructions to assign a weight value to each of a plurality of brain regions in the neurobehavioral phenotype mapping data; A computing device of the invention 1026 that generates a neurobehavioral topography.
[Invention 1044]
the processor
assigning a first set of weight values above a threshold to a first set of the plurality of brain regions in the neurobehavioral phenotype mapping data; and
assigning a second set of weight values below the threshold to a second set of brain regions of the plurality of brain regions in the neurobehavioral phenotype mapping data;
1044. The computing device of Invention 1043, assigning said weight value to each of said plurality of brain regions by executing further computer instructions for.
[Invention 1045]
a further computer for assigning a masking weight value to the target brain region of the plurality of brain regions such that the processor removes information associated with the target brain region from the neurobehavioral phenotype mapping data; 1044. The computing device of invention 1043, executing instructions to assign said weight value to each of said plurality of brain regions.
[Invention 1046]
The processor executes further computer instructions for defining at least one combined gene-phenotype pair topography between the genotypic topography and a combination of neurophenotypic topographies for a combination of neurobehavioral phenotypes. The computing device of the invention 1026, thereby defining said plurality of gene-phenotype pair topographies.
[Invention 1047]
When the processor executes the computer instructions,
selecting said at least one combined gene-phenotype paired topography as said one or more of said plurality of gene-phenotype paired topographies each having said score exceeding said selected threshold; and
an act of displaying the combination of neurobehavioral phenotypes to the user;
The computing device of the present invention 1046, further performing
[Invention 1048]
When the processor executes the computer instructions,
by combining neurophenotype mapping data that exhibits an improved alignment with the gene expression mapping data as compared to the alignment of the gene expression mapping data with the neurophenotype mapping data for each individual neurobehavioral phenotype; Behaviors that identify combinations of neurobehavioral phenotypes
The computing device of the present invention 1026, further performing the.
[Invention 1049]
1027. The computing device of invention 1026, wherein said neurobehavioral phenotype mapping data relates to one of a brain disorder, a symptom, or a cognitive process.
[Invention 1050]
obtaining gene expression mapping data for one or more genes by a computing device;
obtaining neurophenotype mapping data for the selected neurophenotype with a computing device;
A computing device calculates a quantitative score for each gene-phenotype pair between the selected gene and each neurophenotype of the one or more neurobehavioral phenotypes for each of the selected gene-phenotype pairs. determining based on correlations between the gene expression mapping data for the genes identified and the neurophenotype mapping data for each neurobehavioral phenotype of each gene-phenotype pair; and
presenting to a user, by means of a computing device, said score determined for each gene-phenotype pair;
A method, including
[Invention 1051]
a computing device,
a memory that stores computer instructions;
a processor;
When the processor executes the computer instructions,
an act of generating a plurality of genotypic topographies for a plurality of genes based on respective gene expression mapping data for each respective gene;
an act of selecting a first genotypic topography from the plurality of genotypic topographies for a first gene of the plurality of genes;
an act of selecting a plurality of second genotypic topographies from the plurality of genotypic topographies for a plurality of second genes of the plurality of genes;
an act of defining a plurality of gene-gene pair topographies between said first gene and said plurality of second genes, wherein each gene-gene pair topography for each respective gene-gene pair is selected said determining act determined based on said first genotypic topography of genes and each second genotypic topography of said each second gene for said each gene-gene pair;
a quantitative score for each of said plurality of gene-gene pair topographies, said first genotypic topography of said first gene and said each second gene for said each gene-gene pair; an act of determining based on the correlation between the second genotypic topography;
an act of selecting one or more of the plurality of gene-gene pair topographies, each having a score exceeding a selected threshold; and
an act of displaying to a user each said second gene of said selected one or more gene-gene pair topographies;
Said computing device for implementing
[Invention 1052]
The present invention 1051, wherein the processor, when executing the computer instructions, further performs an act of selecting the first gene based on the association of the neuropharmaceutical target selected by the user with the first gene, the present invention 1051 computing device.
[Invention 1053]
The processor, when executing the computer instructions, further performs the act of identifying one or more respective neurodrug targets associated with each of the second genes of the selected one or more gene-gene pair topographies. the computing device of the present invention 1051.
[Invention 1054]
The processor performs statistical analysis for each gene-gene pair topography based on alignments between each gene expression mapping data for each second gene and each gene expression mapping data for each first gene. 1052. The computing device of invention 1051, wherein said score for each of said plurality of gene-gene pair topographies is determined by executing further computer instructions for determining significance.
[Invention 1055]
the processor determines the determined association between the first genotypic topography of the first gene and the respective second genotypic topography of the respective second gene for a target gene-gene pair topography; 1052. The computing device of invention 1051, which selects said one or more gene-gene pair topographies by executing further computer instructions for selecting said target gene-gene pair topographies with the highest degree of sexuality.
[Invention 1056]
1052. The computing device of invention 1051, wherein said gene expression mapping data comprises gene expression mapping data relating to multiple gene expressions from multiple people.
[Invention 1057]
The present invention 1056, wherein said processor generates said plurality of genotypic topographies by executing further computer instructions to select representative probes for each gene in said plurality of gene expressions of said plurality of people. computing device.
[Invention 1058]
1052. The computing device of invention 1051, wherein said processor generates said plurality of genotypic topographies by executing further computer instructions for mapping gene expression mapping samples to sites in brain structures.
[Invention 1059]
the plurality of genotypic topographies by the processor executing further computer instructions for filtering gene expression mapping samples by excluding samples with expression level measurements below a threshold level above background signal; The computing device of the present invention 1051 that generates
[Invention 1060]
1052. The computing device of invention 1051, wherein said processor generates said plurality of genotypic topographies by executing further computer instructions for imputing probe values in gene expression mapping samples lacking probe values. .
[Invention 1061]
1052. The computing device of invention 1051, wherein said processor generates said plurality of genotypic topographies by executing further computer instructions for removing external biases from said gene expression mapping data.
[Invention 1062]
the processor removes the external bias by executing further computer instructions to perform mean removal and z-score normalization over the gene probes used to capture the gene expression mapping data; A computing device of the present invention 1061.
[Invention 1063]
1052. The computing device of invention 1051, wherein said processor generates said plurality of genotypic topographies by executing further computer instructions for enhancing signal-to-noise ratio in said gene expression mapping data.
[Invention 1064]
of the present invention 1063, wherein the processor enhances the signal-to-noise ratio by executing further computer instructions to average expression levels of the gene expression mapping data for samples mapped onto the same surface vertex. computing device.
[Invention 1065]
The processor generates the plurality of genotypic topographies by executing further computer instructions to interpolate low-density gene expression samples from sampled brain regions to other unsampled brain regions. the computing device of the present invention 1051.
[Invention 1066]
the low density gene by the processor executing further computer instructions to generate at least one of a compartmentalized cortical or subcortical map or a high density cortical or subcortical map; A computing device of the invention 1065 that interpolates expression samples.
[Invention 1067]
1052. The computer system of invention 1051, wherein said processor generates said plurality of genotypic topographies by executing further computer instructions to assign a weight value to each of a plurality of brain regions in said gene expression mapping data. device.
[Invention 1068]
the processor
assigning a first set of weight values exceeding a threshold to a first set of brain regions of the plurality of brain regions in the gene expression mapping data; and
assigning a second set of weight values less than the threshold to a second set of brain regions of the plurality of brain regions in the gene expression mapping data
1067. The computing device of Invention 1067, assigning said weight value to each of said plurality of brain regions by executing further computer instructions for.
[Invention 1069]
The processor executes further computer instructions for assigning a masking weight value to the target brain region of the plurality of brain regions such that information associated with the target brain region is removed from the gene expression mapping data. 1067. The computing device of the invention 1067, thereby assigning said weight value to each of said plurality of brain regions.
[Invention 1070]
The processor further computer instructions for defining at least one combined gene-gene pair topography between the first genotypic topography and a second genotypic topography combination for a second gene combination. 1052. The computing device of the invention 1051, by executing which defines said plurality of gene-gene pair topographies.
[Invention 1071]
When the processor executes the computer instructions,
an act of selecting said at least one combined gene-gene pair topography as said one or more of said plurality of gene-gene pair topographies each having said score exceeding said selected threshold; and
an operation of displaying the second gene combination to the user
The computing device of the present invention 1070, further comprising:
[Invention 1072]
obtaining gene expression mapping data for a plurality of genes by a computing device;
The computing device generates a quantitative score for each gene-gene pair between the selected gene and one or more other genes, with the gene expression mapping data for the selected gene; determining based on correlations between said gene expression mapping data for said one or more other genes for each gene-gene pair; and
presenting to a user, by said computing device, said score determined for each gene-gene pair;
A method, including
[Invention 1073]
A method of identifying a neurodrug target comprising:
selecting a neurobehavioral phenotype;
processing gene expression mapping data and neurobehavioral phenotype mapping data;
defining a relevant neurophenotype topography; and
Predicting a likely association between gene expression for said neurodrug target and said neurobehavioral phenotype
including
at least one step of the method is performed using one of a computer-implemented method or a computer-readable medium;
the aforementioned method.
[Invention 1074]
1073. The method of the invention 1073, further comprising preprocessing said neurobehavioral phenotype mapping data.
[Invention 1075]
1074. The method of invention 1074, further comprising one of weighting or masking said neurobehavioral phenotype mapping data.
[Invention 1076]
1073. The method of invention 1073, further comprising at least one of removing external biases from said gene expression mapping data or improving the signal-to-noise ratio of gene expression mapping data.
[Invention 1077]
1074. The method of invention 1073, wherein said step of defining said relevant neurophenotype topography comprises pre-processing said gene expression mapping data associated with at least one brain region or region.
[Invention 1078]
1078. The method of invention 1077, wherein said gene expression mapping data occurs at one of a low density sample level, an interpolated high density map level, or a discrete compartmentalized brain map level.
[Invention 1079]
1073. The method of invention 1073, further comprising assigning one or more gene expression values to either continuous high-density sites in the cortex or discrete sites in the cortex.
[Invention 1080]
1073. The method of invention 1073, wherein said neurobehavioral phenotype mapping data relates to one of a brain disorder, a symptom, or a cognitive process.
[Invention 1081]
1073. The method of invention 1073, further comprising predicting the likelihood that a neurodrug-targeted therapy will affect an off-target brain region.
[Invention 1082]
The method further comprises identifying combinations of neuronal drug targets by combining gene expression mapping data, wherein the combined gene expression mapping data comprises gene expression mapping data and neurobehavioral data for each individual neuronal drug target. 1073. The method of the invention 1073, exhibiting improved alignment with said neurobehavioral phenotype mapping data as compared to alignment with said neurobehavioral phenotype mapping data.
[Invention 1083]
A method of identifying a neurobehavioral phenotype comprising:
aligning the preprocessed gene expression mapping data with the neurobehavioral phenotype mapping data; and
Determining neurophenotype topography of relevant neurons
The above method, comprising
[Invention 1084]
1083. The method of invention 1083, further comprising preprocessing said gene expression mapping data.
[Invention 1085]
1084. The method of invention 1084, further comprising one of weighting or masking said gene expression mapping data.
[Invention 1086]
1084. The method of invention 1084, further comprising preprocessing said gene expression mapping data to either remove external biases or improve signal-to-noise ratio.
[Invention 1087]
1083. The method of invention 1083, wherein said step of defining said relevant neurophenotype topography comprises pre-processing said gene expression mapping data associated with at least one brain region or region.
[Invention 1088]
1084. The method of invention 1083, wherein said gene expression mapping data occurs at one of a low density sample level, an interpolated high density map level, or a discrete compartmentalized brain map level.
[Invention 1089]
1083. The method of invention 1083, further comprising assigning one or more gene expression values to either continuous high-density sites in the cortex or discrete sites in the cortex.
[Invention 1090]
1083. The method of invention 1083, wherein said neurobehavioral phenotype mapping data relates to one of a brain disorder, a symptom, or a cognitive process.
[Invention 1091]
1083. The method of invention 1083, further comprising predicting the likelihood that a neurodrug-targeted therapy will affect an off-target brain region.
[Invention 1092]
A non-transitory computer-readable medium storing instructions that, when executed by a computing device, cause the computing device to align gene expression mapping data with neurobehavioral phenotype mapping data. quantifying; and defining a neurophenotype topography of relevant neurons.
[Invention 1093]
A non-transitory computer-readable medium storing instructions that, when executed by a computing device, cause the computing device to align gene expression mapping data with neurobehavioral phenotype mapping data. quantifying; and defining a neurophenotype topography of the relevant neuron.
[Invention 1094]
A computer-implemented system for analyzing alignments of gene expression mapping data and neurobehavioral phenotype mapping data, comprising:
memory;
one or more processors connected to the memory;
wherein the one or more processors are configured to quantify alignment of gene expression mapping data and neurobehavioral phenotype mapping data;
said computer-implemented system.
詳細な説明
本発明のツール及び方法は、標的を定めた遺伝子型及び神経表現型トポグラフィの提供のために神経行動学的表現型マッピング及び遺伝子発現マッピング情報を統合し、計算的ニューロインフォマティクスプラットフォームを構成する。このプラットフォームは、神経画像処理マップをヒト脳内の遺伝子発現のマップと統合し、大規模な脳マッピングニューロインフォマティクスにおける進歩を活用する。遺伝子型及び神経表現型のトポグラフィに基づくアプローチを使用して、遺伝子発現マップと神経画像処理マップとのアライメントを定量化し、目的の脳領野及び領域を定義することにより、このプラットフォームは、薬物標的を神経行動学的表現型(例えば、障害、症状、認知プロセスなど)と関連付ける方法を提供し、脳障害のための薬理学的治療薬の効率的な合理的設計への道を開拓する。DETAILED DESCRIPTION The tools and methods of the present invention integrate neurobehavioral phenotypic mapping and gene expression mapping information to provide targeted genotypic and neurophenotypic topographies and constitute a computational neuroinformatics platform. do. This platform integrates neuroimaging maps with maps of gene expression in the human brain, leveraging advances in large-scale brain-mapping neuroinformatics. By using a genotypic and neurophenotypic topography-based approach to quantify the alignment of gene expression maps with neuroimaging maps and to define brain areas and regions of interest, this platform identifies drug targets. It provides a way to correlate neurobehavioral phenotypes (eg, disorders, symptoms, cognitive processes, etc.) and paves the way for efficient rational design of pharmacological therapeutics for brain disorders.
概して、本発明のツール及び方法は、神経行動学的表現型マッピング及び遺伝子発現マッピングという2つの主なデータインプットを含み、これらを組み合わせて処理し、所与のマップ-遺伝子ペアに対する数値スコアをもたらす。この数値スコアは、所与の表現型及び遺伝子発現のマッピングのアライメントを反映し、特定の遺伝子型及び神経表現型トポグラフィに基づくこの関係の統計的有意性または信頼度の程度を含む。この数値スコアは、脳部位間のマップ値の相関関係を反映してもよく、1つ以上のマップ-遺伝子ペア、マップ、遺伝子、または神経行動学的表現型に関連し得る。 In general, the tools and methods of the present invention involve two main data inputs, neurobehavioral phenotype mapping and gene expression mapping, which are processed in combination to produce a numerical score for a given map-gene pair. . This numerical score reflects the alignment of a given phenotype and gene expression mapping and includes the degree of statistical significance or confidence of this relationship based on a particular genotype and neurophenotype topography. This numerical score may reflect the correlation of map values between brain regions and may be associated with one or more map-gene pairs, maps, genes, or neurobehavioral phenotypes.
神経画像処理マップ及び遺伝子発現マップは、別個のソースから得られるものでもよく、不均一なソース資料を含んでもよい。神経画像処理マップ及び遺伝子発現マップは、計算的ニューロインフォマティクスプラットフォームによる処理前もしくは処理中に、ある特定の情報を選別もしくは除外するために前処理されるか、または平均化され得る。神経画像処理マップ及び遺伝子発現マップは、計算的ニューロインフォマティクスプラットフォームによる処理前もしくは処理中に、特定の遺伝子型及び神経表現型トポグラフィを考慮して、またはそれに合わせて前処理されるか、または平均化されてもよい。任意選択により、神経表現型マッピング情報は、限定された脳部位に対して重み付けされるか、または明確に制限されてもよい。任意選択により、遺伝子マッピング情報は、限定された脳部位に対して重み付けされるか、または明確に制限されてもよい。 The neuroimaging maps and gene expression maps may be obtained from separate sources or may include heterogeneous source material. Neuroimaging maps and gene expression maps may be preprocessed or averaged to filter out or exclude certain information before or during processing by a computational neuroinformatics platform. The neuroimaging maps and gene expression maps are preprocessed or averaged to take into account or to a particular genotype and neurophenotype topography before or during processing by a computational neuroinformatics platform. may be Optionally, the neurophenotype mapping information may be weighted or specifically restricted to limited brain regions. Optionally, the genetic mapping information may be weighted or specifically restricted to restricted brain regions.
プラットフォームアウトプットは、全ての計算されたマップデータの神経画像処理データファイルを含む。これらのアウトプットは、表現型及び遺伝子発現マッピングの脳部位のアライメント及びミスアライメントを特徴付けるマップを含む。そのようなアウトプットは、「オフターゲット」脳部位/領域に関連し得る。アウトプットされたマップは、公的に利用可能な神経画像処理ソフトウェアを使用して可視化され得る。プラットフォームアウトプットは、本発明のツール及び方法によって決定された特定の遺伝子型及び神経表現型トポグラフィを反映するフォーマットで提供され得る。 Platform output includes a neuroimaging data file of all computed map data. These outputs include maps characterizing the alignment and misalignment of brain regions for phenotype and gene expression mapping. Such output may relate to "off-target" brain regions/regions. Output maps can be visualized using publicly available neuroimaging software. Platform output can be provided in a format that reflects the particular genotypic and neurophenotypic topography determined by the tools and methods of the invention.
用語の定義:
別途定義されない限り、本明細書において使用される全ての技術用語及び科学用語は、これらのツール及び方法が属する技術分野の当業者によって一般的に理解されているものと同じ意味を有する。更なる定義は、本開示の随所に規定される。Definition of terms:
Unless defined otherwise, all technical and scientific terms used herein have the same meaning as commonly understood by one of ordinary skill in the art to which these tools and methods belong. Further definitions are provided throughout this disclosure.
本明細書において使用される場合、「神経表現型トポグラフィ」という用語は、ある神経表現型に関連する所与の神経画像処理測定から得られる値の空間的パターンを指す。これは、より従来的な回路ベースのアプローチとは対照的である。そのようなアプローチは、何らかの尺度の部位特異的読み出し情報を提供するからである。ここでのツール及び方法では、遺伝子発現の神経表現型とのオンターゲット対オフターゲット関係の空間的マッピングのために分散した全脳または神経系を考慮する。同様に、本方法は、点状の予め定義された回路を超えた推定上の治療効果の空間的定量化を可能にするため、神経画像処理マップのみに基づく回路ベースのアプローチを優に超える。本明細書において使用される場合、神経画像処理マップ、神経行動学的表現型マップ、及び神経表現型トポグラフィという用語は、互いと同義である。 As used herein, the term "neurophenotype topography" refers to the spatial pattern of values obtained from a given neuroimaging measurement associated with a neurophenotype. This is in contrast to more traditional circuit-based approaches. This is because such an approach provides some measure of site-specific readout. The tools and methods herein consider a distributed whole brain or nervous system for spatial mapping of on-target versus off-target relationships of gene expression with neuronal phenotypes. Similarly, the method well exceeds circuit-based approaches based solely on neuroimaging maps, as it allows spatial quantification of putative therapeutic effects beyond punctiform pre-defined circuits. As used herein, the terms neuroimaging map, neurobehavioral phenotype map, and neurophenotype topography are synonymous with each other.
本明細書において使用される場合、「遺伝子発現マッピング」及び「遺伝子型トポグラフィ」という用語は、交換可能に使用され得る。 As used herein, the terms "gene expression mapping" and "genotypic topography" can be used interchangeably.
本明細書において使用される場合、「神経行動学的表現型」という用語は、例えば神経画像処理マッピングデータとして表現または提供される行動または神経の測定可能な特徴を指す。神経行動学的表現型の例としては、広範な精神医学的または神経学的な障害またはスペクトラム(例えば、統合失調症)、症状ディメンション(例えば、実行機能)、心理プロセス(例えば、作業記憶)、機能的特徴(例えば、BOLD fMRIから導出される安静時機能的結合性)、構造的特徴(例えば、DWIから導出される確率的トラクトグラフィ、ミエリン、皮質曲率、皮質厚さ、皮質下体積、異方性度)、代謝的特徴(例えば、PETトレーサーマップ)、電気生理学的特徴(例えば、EEGマップ)、ある特徴から導出される潜在的尺度(例えば、ネットワークトポロジーの潜在的尺度)、及び薬理学的操作の効果(例えば、PET代謝及び/またはBOLD機能的結合性の抗精神病薬の効果)を反映する特徴が挙げられるが、これらに限定されない。本明細書において使用される場合、神経行動学的表現型は神経表現型と同義であり得る。 As used herein, the term "neurobehavioral phenotype" refers to behavioral or neuromeasurable characteristics expressed or provided, for example, as neuroimaging mapping data. Examples of neurobehavioral phenotypes include broad psychiatric or neurological disorders or spectrums (e.g. schizophrenia), symptom dimensions (e.g. executive functioning), psychological processes (e.g. working memory), Functional features (e.g. resting functional connectivity derived from BOLD fMRI), structural features (e.g. probabilistic tractography derived from DWI, myelin, cortical curvature, cortical thickness, subcortical volume, tropism), metabolic features (e.g., PET tracer maps), electrophysiological features (e.g., EEG maps), potential measures derived from certain features (e.g., potential measures of network topology), and pharmacology. Features that reflect the effects of psychological manipulation (eg, effects of antipsychotic drugs on PET metabolism and/or BOLD functional connectivity) include, but are not limited to. As used herein, neurobehavioral phenotype may be synonymous with neurophenotype.
本明細書において使用される場合、「脳マップ」という用語は、所与の分析による各脳部位/領域への数値の割り当てを指す。 As used herein, the term "brain map" refers to the assignment of numerical values to each brain region/region by a given analysis.
本明細書において使用される場合、「神経画像処理マップ」という用語は、対象内または対象間の表現型関連変動に関連し得る特定の特徴の大きさを反映する、各脳領域に対する数値を指す。 As used herein, the term "neuroimaging map" refers to a numerical value for each brain region that reflects the magnitude of a particular feature that may be associated with phenotype-related variation within or between subjects. .
本明細書において使用される場合、「遺伝子発現マップ」という用語は、1名以上の対象から得られた脳領域間の特定の遺伝子の発現レベルを反映する数値を指す。 As used herein, the term "gene expression map" refers to a numerical value reflecting the expression levels of particular genes among brain regions obtained from one or more subjects.
本明細書で神経表現型マップ生成において使用される場合、「部位」という用語は、特定の点を指し、「領域」または「領野」という用語は、いくらかより広い面積範囲を指し、「系」または「ネットワーク」という用語は、機能的に体系付けられた領域の群を指す。 As used herein in neurophenotype map generation, the term "site" refers to a particular point, the term "region" or "area" refers to a somewhat larger area area, and the term "system" Or the term "network" refers to a group of functionally organized regions.
本明細書において使用される場合、データを「前処理する」という用語は、神経表現型マップをもたらすデータの任意のクリーンアップ方策を指す。例えば、BOLDデータの場合、これらのステップは、運動補正、フレーム間のアライメント、位相接続法、人為的であり得る有害シグナル(nuisance signal)の除去、空間的に特異的または広汎性のアーチファクトのデータ駆動型除去、グループアトラスへの登録などを含み得るが、これらに限定されない。 As used herein, the term "preprocessing" data refers to any cleanup strategy for the data that results in a neurophenotype map. For example, for BOLD data, these steps include motion correction, frame-to-frame alignment, phase unwrapping, removal of nuisance signals that can be artificial, spatially specific or diffuse artifacts in the data. May include, but is not limited to, driven removal, enrollment in group atlases, and the like.
本明細書において使用される場合、「接触」という用語は、第1のソースからのデータが第2のソースからのデータと通信すること、触れること、近接すること、アラインすること、または相互作用することに関して使用される場合があり、ここで当該接触は、第1のソースからのデータの、第2のソースからのデータに対する分析、比較、類似性もしくは対比についての評価、類似点の比較(likened)、相関付け、関連付け、結び付け、または関係付けのうちの1つ以上を可能にする。「接触」は、データを記憶し、その分配、処理、または他の使用を可能にする任意の物理的または電子的な媒体において行われ得る。 As used herein, the term "contact" means the communication, touching, proximity, alignment, or interaction of data from a first source with data from a second source. may be used in reference to doing, where said contacting is the analysis, comparison, evaluation of similarity or contrast of data from a first source to data from a second source, comparison of similarities ( like), allows for one or more of correlation, association, connection, or association. "Contacting" can occur in any physical or electronic medium that allows data to be stored, distributed, processed, or otherwise used.
本明細書において使用される場合、データの「正規化」という用語は、共通参照に対する値にデータを定量的にスケーリングする処理を指す。 As used herein, the term "normalization" of data refers to the process of quantitatively scaling data to values relative to a common reference.
本明細書において使用される場合、データの「重み付け」という用語は、データの値を相対的優先順位に従って定量的にスケーリングする処理を指す。 As used herein, the term "weighting" data refers to the process of quantitatively scaling data values according to relative priority.
本明細書において使用される場合、データの「マスキング」という用語は、データの一部を更なる分析から除外するか、または更なる分析に含める処理を指す。 As used herein, the term "masking" of data refers to the process of excluding or including portions of data from further analysis.
神経行動学的表現型及びマッピング
神経行動学的表現型は、障害、症状、認知プロセスなどを指す(また、本明細書では集合的に「障害」という場合がある)。そのような障害の例としては、次の障害:精神病を含む統合失調症;パニック障害、外傷後ストレス障害、及び不安を含む不安障害;大うつ病、老年期うつ病、及び双極性障害を含む気分障害及び他の感情障害;てんかんに伴う気分障害;パーソナリティ障害、例えば情緒不安定性パーソナリティ障害、強迫性障害;化学療法に伴う認知変化;注意欠陥多動性障害(ADHD);健康時及び疾病時における脳機能の性差(例えば、月経前不快気分障害);ならびに外傷性脳傷害が挙げられるが、これらに限定されない。Neurobehavioral phenotypes and mapping neurobehavioral phenotypes refer to disorders, symptoms, cognitive processes, etc. (and may also be collectively referred to herein as "disorders"). Examples of such disorders include: schizophrenia, including psychosis; anxiety disorders, including panic disorder, post-traumatic stress disorder, and anxiety; major depression, geriatric depression, and bipolar disorder. Mood disorders and other affective disorders; Mood disorders associated with epilepsy; Personality disorders such as emotionally unstable personality disorder, obsessive-compulsive disorder; Cognitive changes associated with chemotherapy; Attention Deficit Hyperactivity Disorder (ADHD); (eg, premenstrual dysphoric disorder); and traumatic brain injury.
精神疾患の主なクラスには、例えば、以下のものが含まれる。神経発達障害とは、通常は乳児期または幼児期、多くの場合は幼児が小学校に入る前に始まる幅広い問題を含む精神疾患クラスを指す。例としては、自閉症スペクトラム障害、注意欠陥/多動障害(ADHD)及び学習障害が挙げられる。統合失調症スペクトラム及び他の精神病性障害は、妄想、幻覚、ならびに思考及び会話の解体などの現実からの解離を引き起こす精神病性障害のクラスを指す。最も注目に値する例は統合失調症であるが、時には他のクラスの障害も現実からの解離に関連し得る。双極性障害及び関連障害は、躁病、過剰な活動、活力及び興奮の期間、ならびにうつ病のエピソードが交互に起こる障害を含むクラスを指す。うつ病性障害は、情緒的にどのように感じるか、例えば悲嘆及び幸福のレベルに影響する障害を含むクラスを指し、機能する能力を低下させ得る。例としては、大うつ病性障害及び月経前不快気分障害が挙げられる。不安障害は、過剰な心配を伴う将来の危険または不運の予期によって特徴付けられる情動である不安の感情に関する。不安障害は、不安を引き起こす状況を回避することを目的とした行動を含み得る。このクラスには、全般不安症、パニック障害、及び恐怖症が含まれる。強迫性障害及び関連障害は、執着または強迫観念ならびに反復性思考及び動作を伴う障害を含む。例としては、強迫性障害、ためこみ症、及び抜毛症(トリコチロマニー)が挙げられる。外傷及びストレッサー関連障害は、個人がストレスの多い生活上の出来事の間または後に対処に苦労する適応障害を含む。例としては、外傷後ストレス障害(PTSD)及び急性ストレス障害が挙げられる。解離性障害は、解離性同一性障害及び解離性健忘などのように自己感覚が混乱する障害を含む。身体症状及び関連障害は、明らかな医学的原因のない身体的症状を有し得る個人に見出され得るが、これらの障害は、著しい苦悩及び機能障害に関連している。こうした障害には、身体症状症(旧称、心気症)及び作為症が含まれる。摂食障害及び食事障害は、神経性食欲不振症及び過食性障害など、食事に関する乱れを含み得る。排泄障害は、偶然または故意による尿または便の不適切な排泄に関連し得る。夜尿症(遺尿症)がその一例である。睡眠覚醒障害は、不眠、睡眠時無呼吸、及び下肢静止不能症候群など、臨床的注意を必要とするほど重度の睡眠の障害を含み得る。性機能不全は、早漏及び女性オルガズム障害などの性的応答の障害を含み得る。性別違和とは、別の性別になりたいとする個人の願望の表明に付随する苦悩を指す場合がある。破壊的障害、衝動制御障害、及び行為障害は、窃盗癖または間欠性爆発性障害など、情動的及び行動的な自己制御に関する問題を含み得る。物質関連障害及び嗜癖障害は、アルコール、カフェイン、タバコ、及び薬物の過剰な使用に関連する問題を含み得る。このクラスには、ギャンブル障害も含まれる。神経認知障害は、思考及び判断する個人の能力に影響し得る。これらの後天性の(発達性ではない)認知的問題には、せん妄のほか、外傷性脳傷害またはアルツハイマー病などの状態または疾患に起因する神経認知障害が含まれる。パーソナリティ障害は、生活及び対人関係における問題を引き起こす情緒不安定及び不健全な行動の持続的パターンを伴い得る。例としては、情緒不安定性、反社会性、及び自己愛性パーソナリティ障害が挙げられる。パラフィリア障害は、個人的苦悩もしくは機能障害を引き起こすか、または別の個人に対する潜在的もしくは実質的な危害を引き起こす性的関心を含み得る。例は、性的サディズム障害、窃視障害、及び小児性愛障害である。他の精神障害には、他の医学的状態に起因する精神障害、または上記の障害のうちの1つに関して全基準を満たさない精神障害が含まれ得る。 Major classes of mental illness include, for example: Neurodevelopmental disorders refer to a class of psychiatric illnesses involving a wide range of problems, usually beginning in infancy or early childhood, often before young children enter primary school. Examples include autism spectrum disorders, attention deficit/hyperactivity disorder (ADHD) and learning disabilities. Schizophrenia Spectrum and other psychotic disorders refer to a class of psychotic disorders that cause dissociation from reality such as delusions, hallucinations, and disorganization of thoughts and speech. The most notable example is schizophrenia, but sometimes other classes of disorders can also be associated with dissociation from reality. Bipolar and related disorders refer to a class that includes disorders with alternating episodes of mania, hyperactivity, periods of energy and agitation, and depression. Depressive disorders refer to a class that includes disorders that affect how you feel emotionally, such as levels of grief and happiness, and can reduce your ability to function. Examples include major depressive disorder and premenstrual dysphoric disorder. Anxiety disorders relate to feelings of anxiety, an emotion characterized by anticipation of future danger or misfortune accompanied by excessive worry. Anxiety disorders can involve behaviors aimed at avoiding situations that cause anxiety. This class includes generalized anxiety disorders, panic disorders, and phobias. Obsessive-compulsive and related disorders include disorders involving obsessions or obsessions and repetitive thoughts and actions. Examples include obsessive-compulsive disorder, hoarding disorder, and trichotillomania. Trauma- and stressor-related disorders include adjustment disorders that individuals struggle to cope with during or after stressful life events. Examples include post-traumatic stress disorder (PTSD) and acute stress disorder. Dissociative disorders include disorders that disrupt the sense of self, such as dissociative identity disorder and dissociative amnesia. Physical symptoms and related disorders can be found in individuals who may have physical symptoms with no apparent medical cause, but these disorders are associated with significant distress and impairment. Such disorders include somatic symptom disorder (formerly called hypochondriasis) and factitious disorder. Eating and eating disorders can include dietary disturbances such as anorexia nervosa and bulimia. Excretory disorders can be associated with inappropriate excretion of urine or faeces, either accidentally or intentionally. Nocturnal enuresis (enuresis) is an example. Sleep-wake disorders can include sleep disturbances severe enough to require clinical attention, such as insomnia, sleep apnea, and restless leg syndrome. Sexual dysfunction can include disorders of sexual response such as premature ejaculation and female orgasm disturbance. Gender dysphoria may refer to the distress that accompanies an individual's manifestation of a desire to be of another gender. Disruptive disorders, impulse control disorders, and conduct disorders can include problems with emotional and behavioral self-control, such as kleptomania or intermittent explosive disorder. Substance-related and addictive disorders can include problems associated with excessive use of alcohol, caffeine, tobacco, and drugs. This class also includes gambling disorders. Neurocognitive disorders can affect an individual's ability to think and judge. These acquired (non-developmental) cognitive problems include delirium as well as neurocognitive impairment resulting from conditions or diseases such as traumatic brain injury or Alzheimer's disease. Personality disorders can involve persistent patterns of emotional instability and unhealthy behavior that cause problems in life and relationships. Examples include emotional lability, antisocial, and narcissistic personality disorders. Paraphilic disorders can involve sexual interests that cause personal distress or impairment, or cause potential or actual harm to another individual. Examples are sexual sadism disorder, voyeurism disorder, and pedophilia disorder. Other psychiatric disorders may include psychiatric disorders resulting from other medical conditions or psychiatric disorders that do not meet all criteria for one of the above disorders.
各精神疾患を定義付ける症状は、American Psychiatric Associationが発行するDiagnostic and Statistical Manual of Mental Disorders(DSM-5)に詳述されている。このマニュアルは、精神医療従事者が精神状態を診断するため、及び保険会社が治療費を払い戻すために使用されている。 The symptoms that define each mental disorder are detailed in the Diagnostic and Statistical Manual of Mental Disorders (DSM-5) published by the American Psychiatric Association. The manual is used by mental health practitioners to diagnose mental conditions and by insurance companies to reimburse treatment costs.
精神疾患の従来の診断は、症状を引き起こし得る身体的問題を排除しようと試みる身体検査、例えば甲状腺機能の検査またはアルコール及び薬物に関するスクリーニングを含む臨床試験、ならびに心理学的評価を含み得る。心理学的評価中、医師または精神医療従事者は、個人の症状、思考、感情、及び行動パターンについて当人と話す場合があり、個人は、これらの質問に答えるのに役立てるための質問票に記入するよう求められる場合がある。 Conventional diagnosis of mental illness may include physical examinations, such as thyroid function tests or clinical tests, including screening for alcohol and drugs, in an attempt to rule out physical problems that may cause symptoms, as well as psychological evaluations. During a psychological evaluation, a physician or mental health practitioner may talk with the individual about their symptoms, thoughts, feelings, and behavioral patterns, and the individual completes questionnaires to help answer these questions. You may be asked to complete
精神医学者は、妄想性パーソナリティ障害、スキゾイドパーソナリティ障害、統合失調型パーソナリティ障害、反社会性パーソナリティ障害、情緒不安定性パーソナリティ障害、演技性パーソナリティ障害、自己愛性パーソナリティ障害、回避性(または不安性)パーソナリティ障害、依存性パーソナリティ障害、及び強迫性パーソナリティ障害という10タイプのパーソナリティ障害を同定する診断体系を使用する傾向がある。これらのタイプは、(1)猜疑性-妄想性、スキゾイド、統合失調型、及び反社会性、(2)情動性及び衝動性-情緒不安定性、演技性、及び自己愛性、ならびに(3)不安性-回避性、依存性、及び強迫性という3つのカテゴリーにグループ化される。 Psychiatrists have identified paranoid personality disorder, schizoid personality disorder, schizoid personality disorder, antisocial personality disorder, emotionally unstable personality disorder, histrionic personality disorder, narcissistic personality disorder, avoidant (or anxiety) There is a tendency to use diagnostic systems that identify ten types of personality disorders: personality disorders, dependent personality disorders, and obsessive-compulsive personality disorders. These types are: (1) skeptical-paranoid, schizoid, schizophrenic, and sociopathic, (2) emotional and impulsive-emotionally labile, histrionic, and narcissistic, and (3) Anxiety - grouped into three categories: avoidance, dependence, and compulsivity.
注意欠陥多動性障害は、不注意型、過活動衝動型、及び複合型という3つのタイプに分類され得る。 Attention deficit hyperactivity disorder can be classified into three types: inattentive, hyperactive-impulsive, and combined.
神経変性疾患には、例えば、アルツハイマー病、パーキンソン病、筋萎縮性側索硬化症、フリートライヒ運動失調症、ハンチントン病、レビー小体病、及び脊髄性筋萎縮症が含まれ得る。 Neurodegenerative diseases can include, for example, Alzheimer's disease, Parkinson's disease, amyotrophic lateral sclerosis, Friedreich's ataxia, Huntington's disease, Lewy body disease, and spinal muscular atrophy.
精神疾患の兆候及び症状は、障害、状況及び他の要因に応じて異なり得る。精神疾患症状は、情動、思考、及び行動に影響し得る。兆候及び症状の例には、例えば、悲しい気分もしくは気分の落ち込み、思考の混乱もしくは集中力の低下、過剰な恐れもしくは心配、または極端な罪悪感、気分の浮き沈みの極端な変化、友人及び活動からの離脱、著しい疲労、低い活力もしくは睡眠困難、現実からの解離(妄想)、妄想症もしくは幻覚、日常の問題もしくはストレスに対処する能力の不全、状況及び他者の理解及び共感の困難、アルコールもしくは薬物の乱用、食習慣の大きな変化、性欲の変化、過剰な怒り、敵意もしくは暴力、及び自殺念慮が含まれ得る。時にメンタルヘルス障害の症状は、胃痛、背部痛、頭痛、または他の原因不明の痛み及び疼痛といった身体的問題として現れる。 Signs and symptoms of mental illness can vary depending on the disorder, circumstances and other factors. Psychotic symptoms can affect emotions, thoughts, and behavior. Examples of signs and symptoms include, for example, feeling sad or depressed, confused thoughts or difficulty concentrating, excessive fear or worry, or extreme guilt, extreme changes in mood, loss of friends and activity. severe fatigue, low energy or difficulty sleeping, dissociation from reality (delusions), delusions or hallucinations, inability to cope with everyday problems or stresses, difficulty understanding and empathizing with situations and others, alcohol or It may include substance abuse, major changes in eating habits, changes in libido, excessive anger, hostility or violence, and suicidal thoughts. Sometimes symptoms of mental health disorders manifest themselves as physical problems such as stomachaches, backaches, headaches, or other unexplained aches and pains.
大うつ病の症状としては、悲嘆感、通常は快い活動における興味の喪失(快感消失)、食欲及び睡眠の変化、活力の喪失、ならびに集中及び意思決定に関する問題が挙げられる。気分変調症のエピソードはうつ病に似ているが、より軽度であり、多くの場合でより長く持続する。双極性障害は、うつ病及び躁病の交互のサイクルによって特徴付けられる。躁病の症状は、気分高揚または開放的気分、自己肯定感または自尊心の肥大、睡眠欲の減少、思考の早まり、及び衝動的行動を含む。軽躁病のエピソードは、典型的には躁病と比べて期間が短く、重症度が低い。気分循環症は、低レベルのうつ病及び軽躁病のサイクルを特徴とする。 Symptoms of major depression include feelings of sadness, loss of interest in activities that are normally pleasant (anhedonia), changes in appetite and sleep, loss of energy, and problems with concentration and decision making. Episodes of dysthymia resemble depression but are milder and often longer lasting. Bipolar disorder is characterized by alternating cycles of depression and mania. Symptoms of mania include an elevated or expansive mood, increased self-esteem or self-esteem, decreased desire to sleep, rapid thinking, and impulsive behavior. Hypomanic episodes are typically shorter in duration and less severe than manic episodes. Cyclothymia is characterized by cycles of low-level depression and hypomania.
感情障害には、単極性うつ病及びその変種、例えば産後うつ病、非定型うつ病、季節性感情障害;双極性障害;気分変調症及び気分循環症;全般不安症;パニック障害;広場恐怖症などの恐怖症;強迫性障害(OCD);及び外傷後ストレス障害(PTSD)が含まれ得る。気分障害には、大うつ病、双極性障害(別称、躁うつ病)、気分変調症、及び気分循環症といった、いくつかのタイプがある。 Affective disorders include unipolar depression and its variants such as postpartum depression, atypical depression, seasonal affective disorder; bipolar disorder; dysthymia and cyclothymia; generalized anxiety disorder; panic disorder; agoraphobia. obsessive-compulsive disorder (OCD); and post-traumatic stress disorder (PTSD). There are several types of mood disorders: major depression, bipolar disorder (also known as manic depression), dysthymia, and cyclothymia.
精神疾患は、一般に、種々の遺伝的要因及び環境的要因によって引き起こされると考えられている。これらの要因は、遺伝形質、出生前の環境曝露、及び脳化学を含み得る。例えば、精神疾患は、精神疾患を有する血縁者がいる人々において比較的一般的である。ある特定の遺伝子は、精神疾患を発症するリスクを増加させる可能性があり、生活状況がその引き金となる可能性がある。また、胎内にいる間の環境的ストレッサー、炎症状態、毒素、アルコール、または薬物への曝露が、場合によっては精神疾患に結び付けられ得る。更に、神経伝達物質は、脳及び身体の他の部分にシグナルを伝える天然に存在する脳内化学物質である。これらの化学物質が関与する神経ネットワークが損なわれると、神経受容体及び神経系の機能が変化し、うつ病につながる。 Mental illness is generally believed to be caused by a variety of genetic and environmental factors. These factors may include genetic traits, prenatal environmental exposures, and brain chemistry. For example, mental illness is relatively common in people who have relatives with mental illness. Certain genes can increase the risk of developing mental illness, and life situations can trigger it. Also, exposure to environmental stressors, inflammatory conditions, toxins, alcohol, or drugs while in the womb can be linked to mental illness in some cases. Additionally, neurotransmitters are naturally occurring brain chemicals that carry signals to the brain and other parts of the body. Impairment of the neural network that these chemicals engage alters the function of neuroreceptors and the nervous system, leading to depression.
ある特定の要因は、個人にメンタルヘルス問題が生じるリスクを増加させ得る。これには、血縁者、例えば親または兄弟姉妹に精神疾患があること;金銭的問題、大切な人の死または離婚などのストレスの多い生活状況;継続中の(慢性の)医学的状態、例えば糖尿病;頭部への強打などの深刻な傷害(外傷性脳傷害)の結果としての脳損傷;戦闘または暴行を受けるなどの外傷的体験;アルコールまたはレクリエーショナルドラッグの使用;幼児期に虐待またはネグレクトされること;友人が少ないまたは健全な対人関係が少ないこと;及び精神疾患歴が含まれる。 Certain factors can increase an individual's risk of developing mental health problems. This includes having a relative, such as a parent or sibling, with mental illness; stressful life situations such as financial problems, death of a loved one or divorce; ongoing (chronic) medical conditions, such as diabetes; brain injury as a result of a serious injury such as a blow to the head (traumatic brain injury); traumatic experiences such as being in combat or being assaulted; alcohol or recreational drug use; few friends or healthy interpersonal relationships; and a history of psychiatric illness.
精神疾患は一般的である。毎年、成人の約5人に1人が精神疾患を有する。精神疾患は、幼児期から成人後期まで、いかなる年齢でも始まり得るが、ほとんどは人生の早い段階で始まる。精神疾患の影響は一時的である場合もあれば、長きにわたる場合もある。個人が1つより多くのメンタルヘルス障害を同時に有する場合もある。例えば、個人がうつ病及び物質使用障害を有する場合がある。 Mental illness is common. About one in five adults has a mental illness each year. Mental illness can begin at any age, from infancy to late adulthood, but most begin early in life. The effects of mental illness may be temporary or long-lasting. An individual may have more than one mental health disorder simultaneously. For example, an individual may have depression and a substance use disorder.
精神疾患は、能力障害の主因である。未処置の精神疾患は、重度の情緒的、行動的、及び身体的な健康問題を引き起こし得る。場合により精神疾患に結び付けられる複雑化要因としては、不幸感及び人生の楽しみの減少;家庭争議;対人関係の問題;社会的孤立;タバコ、アルコール、及び他の薬物に関する問題;欠勤もしくは学校の欠席、または仕事もしくは学校に関連する他の問題;法的及び金銭的問題;貧困及びホームレス状態;自殺または殺人を含む自傷及び他者への危害;身体が感染に抵抗することが困難になるような免疫系の弱体化;心疾患及び他の医学的状態が挙げられる。 Mental illness is a leading cause of disability. Untreated mental illness can lead to severe emotional, behavioral, and physical health problems. Complicating factors sometimes linked to mental illness include unhappiness and diminished enjoyment of life; family disputes; interpersonal problems; social isolation; problems with tobacco, alcohol, and other drugs; legal and financial problems; poverty and homelessness; self-harm and harm to others, including suicide or murder; weakening of the immune system; heart disease and other medical conditions.
かかる神経行動学的表現型は、関連する神経領野を含め、例えば、非侵襲的神経画像処理法を使用して解明され得る。 Such neurobehavioral phenotypes, including associated neural areas, can be elucidated using, for example, non-invasive neuroimaging methods.
構造的磁気共鳴画像法(MRI)、安静時またはタスクベースの機能的MRI(fMRI)、拡散強調画像法(DWI)、ポジトロン放出断層撮影(PET)、脳波記録法(EEG)、脳磁気図検査(MEG)、皮質脳波検査法(ECoG)などの様々な神経画像処理タイプが、非公開及び公開データベースから利用可能である。 Structural magnetic resonance imaging (MRI), resting or task-based functional MRI (fMRI), diffusion weighted imaging (DWI), positron emission tomography (PET), electroencephalography (EEG), magnetoencephalography Various neuroimaging types, such as electroencephalography (MEG), cortical electroencephalography (ECoG), etc., are available from private and public databases.
これらの神経画像処理技術は、脳マップ、すなわち、神経行動学的表現型に関連し得る特徴の大きさを反映する数値の脳内の各部位への割り当てをもたらし得る。神経画像処理技術によって評価または定量化される特徴の例としては、MRベースのもの(例えば、認知パラダイムに応じた活性化、脳の幾何学的形状、組織の拡散特性、例えば拡散強調画像法、時間に対するシグナル間の関係、例えば機能的結合性分析、任意の画像処理測定値と行動的測定値との間の個人差マップなど)、非MRベースのもの(例えば、EEG、MEG、ECoGによる電気生理学的記録、力のスペクトル特性における変化、振動シグネチャーなど)、経頭蓋磁気刺激(TMS)などの前述の技術のいずれかにおける刺激に基づく脳の変化、前述のMRベース及び非MRベースのシグナルの薬理学的操作などが挙げられるが、これらに限定されない。 These neuroimaging techniques can result in brain maps, ie, assignments of numerical values to regions in the brain that reflect the magnitude of features that can be associated with neurobehavioral phenotypes. Examples of features evaluated or quantified by neuroimaging techniques include MR-based (e.g. activation according to cognitive paradigms, brain geometry, tissue diffusion properties, e.g. diffusion weighted imaging, Relationships between signals over time, e.g. functional connectivity analysis, individual difference maps between arbitrary imaging and behavioral measures, etc.), non-MR-based (e.g. EEG, MEG, electrical by ECoG). physiological recordings, changes in force spectral properties, vibrational signatures, etc.), brain changes upon stimulation in any of the aforementioned techniques such as transcranial magnetic stimulation (TMS), MR-based and non-MR-based signals as described above. Examples include, but are not limited to, pharmacological manipulation.
データソースは、公的及び私的データベースまたは将来の研究から得られる神経画像処理マップを含む。例としては、限定されるものではないが、The Human Connectome Project Database、The National Institute of Mental Health Data Archive、及びNeuroimaging Informatics Tools and Resources Clearinghouseが挙げられ、これらについては以下に更に記載する。 Data sources include neuroimaging maps from public and private databases or future research. Examples include, but are not limited to, The Human Connectome Project Database, The National Institute of Mental Health Data Archive, and Neuroimaging Informatics Tools and Resources Clearinghouse, which are further described below.
The Human Connectome Project Database。The Human Connectome Project(HCP)は、1100名を超える健康な若年成人における質の高い神経画像処理データを含む、脳機能及び行動の根底にある神経路を図表にすることにより、この課題の主要な態様に取り組んできた。データ獲得、分析、及び共有のための大幅に改善された方法を使用して、HCPは、ヒト脳の構造、機能、及び結合性、ならびにそれらの行動との関係に関する我々の理解を大幅に向上させるデータ及び発見を科学界に提供してきた。「HCPスタイル」の神経画像処理アプローチは一般化可能であり、他のプロジェクトにも応用されている。 The Human Connect Project Database. The Human Connectome Project (HCP) has addressed this challenge by mapping the neural pathways that underlie brain function and behavior, including high-quality neuroimaging data in over 1100 healthy young adults. I've been working on the mods. Using vastly improved methods for data acquisition, analysis, and sharing, HCP greatly enhances our understanding of human brain structure, function, and connectivity, and their relationship to behavior. has provided the scientific community with compelling data and discoveries. The 'HCP-style' neuroimaging approach is generalizable and has been applied to other projects.
The National Institute of Mental Health Data Archive(NDA)。NDAは、多くの科学ドメインにまたがる数百の研究プロジェクトから収集されたヒト対象データを提供している。NDAは、研究データ、ツール、方法、及び分析を共有するための基盤を提供し、協調的な科学及び発見を可能にしている。要件を満たした研究者には、共通基準に調和させた、匿名化されたヒト対象データが利用可能である。要約データは誰でも利用可能である。 The National Institute of Mental Health Data Archive (NDA). NDA provides human subject data collected from hundreds of research projects across many scientific domains. NDA provides a platform for sharing research data, tools, methods, and analysis to enable collaborative science and discovery. Anonymized human subject data harmonized to common standards are available to qualified researchers. Summary data is publicly available.
Neuroimaging Informatics Tools and Resources Clearinghouse(NITRC)。NITRCは、神経画像処理分析ソフトウェア、公的に利用可能なデータセット、または計算能力などのリソースを必要とする科学研究者のための無料のワンストップショップ共同実験室である。NITRCは、2007年に初公開されて以来、ソフトウェアと、NITRC以前はルーチン的に喪失または無視されていた研究からもたらされるデータとを使用して更なる発見ができるよう、神経科学界を助けてきた。 Neuroimaging Informatics Tools and Resources Clearinghouse (NITRC). NITRC is a free, one-stop-shop collaborative laboratory for scientific researchers who need resources such as neuroimaging analysis software, publicly available datasets, or computational power. Since its first publication in 2007, the NITRC has helped the neuroscience community make further discoveries using software and data from studies that were routinely lost or ignored prior to the NITRC. rice field.
ここで本発明者らは、公的に利用可能なHuman Connectome Project(HCP)データベースから導出された神経画像処理表現型マップを活用した。このデータセットから得られるマップは、fMRI活動を神経行動学的表現型に関連付ける。表現型マップのデータベースとのインターフェースの増加に伴って本発明のプラットフォームの有用性が増加することが想定される。 Here we leveraged neuroimaging phenotype maps derived from the publicly available Human Connectome Project (HCP) database. Maps derived from this dataset relate fMRI activity to neurobehavioral phenotypes. It is envisioned that the usefulness of the platform of the present invention will increase with increasing interfaces to phenotype map databases.
HCPデータセットは、多数の健康な対象から得た安静時及びタスクベースのfMRIデータならびに様々な人口統計学的な行動的測定値を含む。Barch DM et al.,Function in the Human Connectome:Task-fMRI and Individual Differences in Behavior,NEUROIMAGE,80:169-189,Oct 15(2013)。ここで使用されるHCPから導出されたマップは、例えば、以下の認知タスクにわたる群レベルでの活性化(N=334)を提供する。(i)運動野(Motor Strip)マッピングタスク(右対左の足指の動きまたは手指の動き;舌の動き)。Bizzi A.et al.,Presurgical functional MR imaging of language and motor functions:validation with intraoperative electrocortical mapping,RADIOLOGY,248:579-589(2008)、Morioka T.et al.,Comparison of magnetoencephalography,functional MRI,and motor evoked potentials in the localization of the sensory-motor cortex,NEUROLOGICAL RESEARCH,17:361-367(1995)を参照されたい;(ii)言語処理タスク。((a)意味、文法、及び語用の違反の検知を伴う文の聴覚提示と、(b)理解を問う質問を伴う物語の聴覚提示に対する数学の問題との対比)。Binder JR et al.,Mapping anterior temporal lobe language areas with fMRI:a multicenter normative study,NEUROIMAGE,54:1465-1475(2011)、Ditman T.et al.,An investigation of concurrent ERP and self-paced reading methodologies,PSYCHOPHYSIOLOGY,44:927-935(2007)、及びKuperberg GR et al.,Neuroanatomical distinctions within the semantic system during sentence comprehension:evidence from functional magnetic resonance imaging,NEUROIMAGE,40:367-388(2008)を参照されたい;(iii)作業記憶及び認知制御タスク。(0バック及び2バック作業記憶の交互になったブロック;顔、非生体人工物、動物、身体部分、家屋、または言葉。Nバックタスク(2バック対0バック)を組み込んだカテゴリー別表象タスク)。Drobyshevsky A.et al.,A rapid fMRI task battery for mapping of visual,motor,cognitive,and emotional function,NEUROIMAGE,31:732-744(2006)(「Drobyshevsky」)、及びCaceres A.et al.,Measuring fMRI reliability with the intra-class correlation coefficient,NEUROIMAGE,45:758-768(2009)を参照されたい;及び感情処理。((i)価数評価(IAPSの不快画像及び中性画像)対(ii)Hariri Hammerタスク)。Drobyshevsky、Phan KL et.al.,Real-time fMRI of cortico-limbic brain activity during emotional processing,NEUROREPORT,15:527-532(2004)、Manuck SB et al.,Temporal stability of individual differences in amygdala reactivity,AM.J.PSYCHIATRY,164:1613-1614(2007a)、Hariri AR et al.,The amygdala response to emotional stimuli:a comparison of faces and scenes,NEUROIMAGE,17:317-323(2002)を参照されたい。 The HCP dataset includes resting and task-based fMRI data and various demographic and behavioral measures from a large number of healthy subjects. Barch DM et al. , Function in the Human Connectome: Task-fMRI and Individual Differences in Behavior, NEUROIMAGE, 80:169-189, Oct 15 (2013). The HCP-derived map used here provides, for example, group-level activations (N=334) across the following cognitive tasks: (i) Motor Strip mapping tasks (right vs. left toe movements or finger movements; tongue movements). Bizzi A. et al. , Presurgical functional MR imaging of language and motor functions: validation with intraoperative electrocortical mapping, RADIOLOGY, 248: 579-589 (2008), Morioka T. et al. , Comparison of magnetoencephalography, functional MRI, and motor evoked potentials in the localization of the sensor-motor cortex, NEUROLOGICAL RESEARCH, 7 (see task 17:361-91i); ((a) auditory presentation of sentences with detection of semantic, grammatical, and pragmatic violations versus (b) math problems for auditory presentation of stories with comprehension questions). Binder JR et al. , Mapping anterior temporal lobe language areas with fMRI: a multicenter normative study, NEUROIMAGE, 54: 1465-1475 (2011), Ditman T.; et al. , An investment of concurrent ERP and self-paced reading methodologies, PSYCHOPHYSIOLOGY, 44:927-935 (2007), and Kuperberg GR et al. , Neuroanatomical distinctions within the semantic system during sentence compensation: evidence from functional magnetic resonance imaging, NEUROIMAGE, 40: 367-388 (see task memory and control) ii 8 (2000 task memory); (Alternating blocks of 0-back and 2-back working memory; faces, non-bioartifacts, animals, body parts, houses, or words. Categorical representation tasks incorporating N-back tasks (2-back vs. 0-back)) . Drobyshevsky A. et al. , A rapid fMRI task battery for mapping of visual, motor, cognitive, and emotional function, NEUROIMAGE, 31:732-744 (2006) ("Drobyshevsky"), and Caceres A.; et al. , Measuring fMRI reliability with the intra-class correlation coefficient, NEUROIMAGE, 45:758-768 (2009); and emotional processing. ((i) valence assessment (IAPS unpleasant and neutral images) vs. (ii) Hariri Hammer task). Drobyshevsky, Phan KL et. al. , Real-time fMRI of cortico-limbic brain activity during emotional processing, NEUROREPORT, 15:527-532 (2004), Manuck SB et al. , Temporal stability of individual differences in amygdala reactivity, AM. J. PSYCHIATRY, 164:1613-1614 (2007a), Hariri AR et al. , The amygdala response to emotional stimulation: a comparison of faces and scenes, NEUROIMAGE, 17:317-323 (2002).
マップの更なるソースは、Neurosynthオンラインデータベースなどのメタ分析ソースから導出され得る。Yarkoni et al.,Large-scale automated synthesis of human functional neuroimaging data,NAT.METHODS 8:665-70(2011)(「Yarkoni」)。Neurosynthは、公開されているfMRI研究の自動化されたメタ分析から統計マップを生成する。Neurosynthのサイトから、「作業記憶」などの所与の用語でラベル付けされた数百のfMRI研究の合成から導出された、その用語に関連するモジュレーションの統計的強度である値をとるマップをダウンロードすることができる。Neurosynthデータを使用する際には、2つの主な注意事項がある。第1に、これらは閾値処理されたマップであり、したがって脳の大部分に関する値が欠如している。遺伝子-マップ相関関係には、完全な適用範囲を有する閾値処理されていない統計マップがより良く適する。第2に、これらのマップは、ボリュメトリックなNeuroimaging Informatics Technology Initiative(NIfTI)フォーマットで与えられる。本発明者らは、これらのマップのConnectivity Informatics Technology Initiative(CIFTI)フォーマットへの変換は可能であるが、そのようなマップは本質的にCIFTI用に最適化されていないため、空間分解能が粗い場合があることを見出した。とはいえ、目的の用語に関連するマップが本発明のツール及び方法に使用するために選択され得ると想定される。例えば、次の用語:作業記憶、認知制御、動機づけ、意思決定、及び感情処理に関連するマップが抽出され得る。 Additional sources of maps can be derived from meta-analytic sources such as the Neurosynth online database. Yarkoni et al. , Large-scale automated synthesis of human functional neuroimaging data, NAT. METHODS 8:665-70 (2011) (“Yarkoni”). Neurosynth generates statistical maps from automated meta-analyses of published fMRI studies. Download from the Neurosynth site a map that takes a value derived from a synthesis of hundreds of fMRI studies labeled with a given term, such as "working memory," which is the statistical strength of the modulation associated with that term. can do. There are two main caveats when using Neurosynth data. First, they are thresholded maps and thus lack values for large parts of the brain. Gene-map correlations are better suited to non-thresholded statistical maps with full coverage. Second, these maps are provided in volumetric Neuroimaging Informatics Technology Initiative (NIfTI) format. We believe that conversion of these maps to the Connectivity Informatics Technology Initiative (CIFTI) format is possible, but such maps are not inherently optimized for CIFTI, so if the spatial resolution is coarse found that there is Nonetheless, it is envisioned that maps associated with terms of interest may be selected for use with the tools and methods of the present invention. For example, maps associated with the following terms: working memory, cognitive control, motivation, decision-making, and emotional processing may be extracted.
現在の神経画像処理マップの集まりは不均一である。臨床的神経画像処理における局所的な神経特異性の例示的な一例として、本発明者らは、fMRIを用いて統合失調症における皮質の結合障害(dysconnectivity)のパターンを研究した。本発明者らは、統合失調症患者が安静時BOLDシグナルの共分散の全体的増加を呈したことを見出した。Yang et al.,Functional hierarchy underlies preferential connectivity disturbances in schizophrenia,PROC.NATL.ACAD.SCI.USA 113:E219-28(2016)(「Yang」)。際立ったことに、この神経画像処理から導出される増加した共分散のマップは、皮質全体で均一ではなく、感覚皮質と比べて連合皮質において優先的に上昇していた。これは、高次連合領域に対する優先的な変化を明らかにする他の所見と一致している。Whitfield-Gabrieli et al,Hyperactivity and hyperconnectivity of the default network in schizophrenia and in first-degree relatives of persons with schizophrenia,PROC.NATL.ACAD.SCI.USA 106:1279-84(2009)(「Whitfield-Gabrieli」)、Baker et al.,Disruption of cortical association networks in schizophrenia and psychotic bipolar disorder,JAMA PSYCHIATRY 71:109-18(2014)(「Baker」)。これは、臨床的関連性(ここでは、統合失調症における安静時結合障害)のある神経画像処理マップが皮質全体における潜在的に重要な局所的変動を示す一例を提供する。現在、こうした遺伝子発現などの生物物理学的特性における変動があるパターンを結び付けたり、外挿したり、関連付けたり、解釈したり、またはそれらから導出したりするニューロインフォマティクスプラットフォームはない。神経行動学的表現型に対する標的を定めた薬物の創製は、分類上の障害における特定の機能(例えば、作業記憶中の活性化、または報酬処理)、症状ディメンション(例えば、統合失調症における陰性症状)、またはデータ駆動型「バイオタイプ」に関する神経画像処理マップによって、より良い情報を得られる可能性がある。Drysdale。 The current collection of neuroimaging maps is heterogeneous. As an illustrative example of regional neural specificity in clinical neuroimaging, we used fMRI to study patterns of cortical dysconnectivity in schizophrenia. The inventors found that schizophrenics exhibited an overall increase in the covariance of the resting BOLD signal. Yang et al. , Functional hierarchy underlies preferred connectivity disturbances in schizophrenia, PROC. NATL. ACAD. SCI. USA 113: E219-28 (2016) ("Yang"). Strikingly, maps of increased covariance derived from this neuroimaging were not uniform across cortices and were preferentially elevated in association cortex compared to sensory cortex. This is consistent with other findings revealing preferential changes to higher association regions. Whitfield-Gabrieli et al, Hyperactivity and hyperconnectivity of the default network in schizophrenia and in first-degree relatives of persons with schizophren. NATL. ACAD. SCI. USA 106:1279-84 (2009) (“Whitfield-Gabrieli”), Baker et al. , Disruption of cortical association networks in schizophrenia and psychotic bipolar disorder, JAMA PSYCHIATRY 71:109-18 (2014) (“Baker”). This provides an example of a neuroimaging map of clinical relevance (here resting connectivity impairment in schizophrenia) showing potentially important regional variations across the cortex. Currently, there is no neuroinformatics platform that connects, extrapolates, correlates, interprets, or derives from these patterns of variation in biophysical properties such as gene expression. The creation of drugs targeted against neurobehavioral phenotypes may be associated with specific functions in categorical disorders (e.g., activation during working memory, or reward processing), symptom dimensions (e.g., negative symptoms in schizophrenia). ), or data-driven 'biotype' neuroimaging maps may provide better information. Drysdale.
遺伝子発現及びマッピング
遺伝子は、薬物の標的であるかまたは別様に治療薬の効果に関与する可能性があるタンパク質(例えば、受容体サブユニット)をコードする。遺伝子発現は、異なる脳部位にわたり、生涯期間にわたり、異なる病期、異なる処置段階にわたり、著しく不均一である。また、いくつかの遺伝形質は完全浸透性である(すなわち、変異を有する全ての個人が表現型を提示する)のに対して、いくつかの遺伝形質は不完全浸透性である(すなわち、遺伝子の特定のバリアント(またはアレル)(遺伝子型)を有しかつ関連する形質(表現型)を発現する個人の割合が100%ではない)。完全浸透性の変異の場合、その遺伝子は可能性の高い候補標的であり得るため、この区別は重要である。とはいえ、所与の表現型を現すリスクに関連する遺伝子と、潜在的な治療標的をコードする遺伝子との間に、更なる区別をつける必要がある。完全浸透性、不完全浸透性、または目的の下流治療標的遺伝子に関連するマップが、本発明のツール及び方法に使用するために選択され得ると想定される。Gene Expression and Mapping Genes encode proteins (eg, receptor subunits) that may be targets of drugs or otherwise involved in the effects of therapeutic agents. Gene expression is remarkably heterogeneous across different brain regions, over life spans, different disease stages, and different stages of treatment. Also, some genetic traits are fully penetrant (i.e., all individuals with the mutation display the phenotype), whereas some traits are incompletely penetrant (i.e., the gene The percentage of individuals who have a particular variant (or allele) (genotype) of and express the relevant trait (phenotype) is not 100%). This distinction is important because for fully penetrant mutations, the gene may be a likely candidate target. Nonetheless, a further distinction needs to be made between genes associated with the risk of expressing a given phenotype and those encoding potential therapeutic targets. It is envisioned that fully penetrant, incompletely penetrant, or maps associated with downstream therapeutic target genes of interest may be selected for use in the tools and methods of the invention.
遺伝子発現は、DNAマイクロアレイ、インサイツハイブリダイゼーション、及びRNAシーケンシングを含む技術によって測定することができる。脳構造、例えば皮質における遺伝子発現は、バルク組織、特定の皮層、及び個々の細胞を含め、複数のレベルの空間分解能において測定することができる。 Gene expression can be measured by techniques including DNA microarrays, in situ hybridization, and RNA sequencing. Gene expression in brain structures such as the cortex can be measured at multiple levels of spatial resolution, including bulk tissue, specific cortex, and individual cells.
ヒト及び他の種にわたる脳部位間の遺伝子発現に関するデータソースとしては、Allen Human Brain Atlas(AHBA)(成人ヒト全脳における遺伝子発現)、Allen Mouse Brain Atlas(成体マウス全脳における遺伝子発現)、Allen Developing Mouse Brain Atlas(複数の発生段階でのマウス脳における遺伝子発現)、BrainSpan Atlas of the Developing Human Brain(複数の発生段階におけるヒト脳のトランスクリプトーム)、NIH Blueprint Non-Human Primate(NHP)Atlas(発生中のアカゲザル脳から得た遺伝子発現データ及び神経解剖学的データ)、Aging,Dementia and Traumatic Brain Injury(TBI)Study(対照及びTBI曝露事例の脳の神経病理的、分子的、及びトランスクリプトーム的な特徴付け)、Allen Cell Types Database(ニューロン細胞型からの単細胞レベルの遺伝子発現)、及びBrainCloudデータベース(生涯期間にわたるヒト前頭前皮質におけるトランスクリプトーム)が挙げられる。 Data sources for gene expression across brain regions across humans and other species include the Allen Human Brain Atlas (AHBA) (gene expression in adult human whole brain), Allen Mouse Brain Atlas (gene expression in adult mouse whole brain), Allen Developing Mouse Brain Atlas, BrainSpan Atlas of the Developing Human Brain, NIH Blueprint Non-Human Primate (NHP) Atlas Gene expression and neuroanatomical data from developing rhesus monkey brain), Aging, Dementia and Traumatic Brain Injury (TBI) Study (neuropathological, molecular, and transcriptome of control and TBI-exposed brains). Genetic characterization), the Allen Cell Types Database (single-cell level gene expression from neuronal cell types), and the BrainCloud database (transcriptome in human prefrontal cortex over life span).
現在の遺伝子発現マップの集まりも不均一である。薬学的効果の局所的特異性を達成するためには、脳領野間の薬物標的の発現における局所的変動が必要である。これらのパターンは、薬物標的に関与するタンパク質をコードする遺伝子の発現の分析によって明らかにすることができる。 The current collection of gene expression maps is also heterogeneous. Regional variations in the expression of drug targets between brain areas are required to achieve regional specificity of pharmaceutical effects. These patterns can be revealed by analysis of the expression of genes encoding proteins involved in drug targets.
AHBAは、6名の対象の数百の脳部位(皮質及び皮質下)からサンプリングされた約60,000個のマイクロアレイプローブによって表される約30,000の遺伝子の遺伝子発現の公的に利用可能なデータベースである。Hawrylycz et al.,Canonical genetic signatures of the adult human brain,NAT.NEUROSCI.18:1832-44(2015)(「Hawrylycz 2015」)。AHBAデータベースは、薬物標的の局所的変動の特徴付けを行うユニークな機会を提供する。実に、遺伝子発現は、異なる脳領域間で著しく不均一である。例えば、ドパミンシグナル伝達経路遺伝子の発現には、皮質及び皮質下の脳領域間で大きな変動がある。例えば、Hawrylycz et al.,An anatomically comprehensive atlas of the adult human brain transcriptome,NATURE 489:391-9,Figure 2(2012)(「Hawrylycz 2012」)を参照されたい。新皮質内でさえ、遺伝子発現の勾配が、例えば一次感覚皮質から連合皮質へのミクロ回路の調整された特殊化を明らかにする。Burt et al.,Hierarchy of transcriptomic specialization across human cortex captured by structural neuroimaging topography,NATURE NEUROSCIENCE 21:1251-9(2018)(「Burt」)。AHBAデータを使用した先行研究により、遺伝子発現マップ及び神経画像処理マップを統合する実現可能性は既に実証された。同様の遺伝子発現プロファイルを有する皮質領域は、構造的に相互接続されている可能性が高く、高い機能的結合性(安静時BOLDシグナルによって特徴付けられる)を有する可能性が高い(Hawrylycz 2015、Richiardi et al.,Correlated gene expression supports synchronous activity in brain networks,IMAGEN consortium,SCIENCE 348:1241-4(2015)(「Richiardi」)。また、統合失調症のリスク遺伝子が、神経発生、及び拡散MRIにより導出される構造結合性の統合失調症関連変化に関連する有意義なパターンで発現することも、研究により見出されている。Whitaker et al.,Adolescence is associated with genomically patterned consolidation of the hubs of the human brain connectome,NSPN Consortium,PROC.NATL.ACAD.SCI.USA 113:9105-10(2016)(「Whitaker」)、Romme et al.,Connectome disconnectivity and cortical gene expression in patients with schizophrenia,BIOL.PSYCHIATRY(2016)(「Romme」)。これらの先行研究ならびに本発明者らの分析は、ヒト脳における有意義な遺伝子発現変動の質の高いソースとしてのAHBAデータセットの妥当性を裏付ける。本発明のツール及び方法は、これらの先行研究の先を行き、遺伝子及び神経行動学的表現型をそれらの空間マップの定量的アライメントに基づいて双方向的に同定する。 AHBA is publicly available gene expression of approximately 30,000 genes represented by approximately 60,000 microarray probes sampled from hundreds of brain sites (cortical and subcortical) in 6 subjects. database. Hawrylycz et al. , Canonical genetic signatures of the adult human brain, NAT. NEUROS CI. 18:1832-44 (2015) (“Hawrycz 2015”). The AHBA database offers a unique opportunity to characterize regional variation of drug targets. Indeed, gene expression is markedly heterogeneous between different brain regions. For example, the expression of dopamine signaling pathway genes is highly variable between cortical and subcortical brain regions. For example, Hawrylycz et al. , An anatomically comprehensive atlas of the adult human brain transcriptome, NATURE 489:391-9, Figure 2 (2012) (“Hawrylycz 2012”). Even within the neocortex, gradients of gene expression reveal coordinated specialization of microcircuitry, for example from the primary sensory cortex to the association cortex. Burt et al. , Hierarchy of transcriptomic specialization across human cortex captured by structural neuroimaging topography, NATURE NEUROSCIENCE 21:1251-9 (2018) ("Burt"). Previous studies using AHBA data have already demonstrated the feasibility of integrating gene expression maps and neuroimaging maps. Cortical regions with similar gene expression profiles are likely to be structurally interconnected and likely to have high functional connectivity (characterized by resting BOLD signal) (Hawrylycz 2015, Richiardi et al., Correlated gene expression supports synchronous activity in brain networks, IMAGEN consortium, SCIENCE 348:1241-4 (2015) (“Richiardi”). Studies have also found it to be expressed in a meaningful pattern associated with structurally associated schizophrenia-associated alterations, Whitaker et al., Adolescence is associated with genomically patterned consolidation of the hubs of the human brain. connectome,NSPN Consortium,PROC.NATL.ACAD.SCI.USA 113:9105-10(2016)(「Whitaker」)、Romme et al.,Connectome disconnectivity and cortical gene expression in patients with schizophrenia,BIOL.PSYCHIATRY(2016) ("Romme") These previous studies, as well as our analysis, support the relevance of the AHBA dataset as a high-quality source of meaningful gene expression changes in the human brain. , going beyond these previous studies, interactively identify genes and neurobehavioral phenotypes based on quantitative alignments of their spatial maps.
ここで本発明者らは、AHBAデータセットを使用した。AHBAデータセットには、6名の対象の左半球(皮質及び皮質下)における数百の領域からサンプリングされた、約60,000個のマイクロアレイプローブによって表される約30,000の遺伝子についての、ヒト脳における遺伝子発現レベルが含まれる。Hawrylycz 2012、Hawrylycz 2015。AHBAによって使用される用語法において、「サンプル」とは、脳内の特定の部位からの遺伝子発現測定値である。目的の遺伝子に対し、マイクロアレイプローブ(特定のDNA配列)が選択され、この発現値が測定される。 Here we used the AHBA dataset. The AHBA dataset contains approx. 30,000 genes represented by approx. Gene expression levels in human brain are included. Hawlycz 2012, Hawlycz 2015. In the terminology used by AHBA, a "sample" is a gene expression measurement from a specific site within the brain. A microarray probe (specific DNA sequence) is selected for the gene of interest and its expression value is measured.
本発明のツール及び方法は、皮質における遺伝子発現データの分析について、(1)低密度サンプルまたは特定の部位、(2)内挿された高密度マップ、またはそのネイティブ(すなわち、密な)解像度における連続的マップ全体、及び(3)離散的な領域または領野に区画化されたマップという3つのレベルを含み得る。発現の部位に対するマップ座標は、異なる神経画像処理脳アトラス(例えば、Montreal Neurological Institute(MNI)アトラス)に変換することができる。使用するまばらさのレベルは、神経行動学的表現型マッピングデータまたは遺伝子発現プロファイルを定量化しようとする目的の領野の解像度に基づいて選択することができる。 The tools and methods of the present invention can be used for analysis of gene expression data in the cortex for (1) low density samples or specific sites, (2) interpolated high density maps, or at their native (i.e., dense) resolution. It may contain three levels: an overall continuous map, and (3) a map partitioned into discrete regions or regions. Map coordinates for sites of expression can be transformed into different neuroimaging brain atlases (eg, the Montreal Neurological Institute (MNI) atlas). The level of sparseness used can be selected based on the neurobehavioral phenotype mapping data or the resolution of the region of interest in which the gene expression profile is to be quantified.
AHBAデータセットは、各サンプルに関するMNI座標を提供する。皮質におけるサンプルの場合、本方法は、この座標をCIFTI皮質表面において最も近い灰白質内座標(grayordinate)にマッピングする。これを達成するには2つの方法がある。比較的粗い方法は、遺伝子発現の各部位についてAHBAによって提供されるMNI座標を共通のアトラスにマッピングすることを伴う。第2のより精確な方法は、遺伝子発現データが存在する各個々の対象の灰白質及び白質全ての完全なセグメンテーションの計算を伴う。次いで、これらのセグメンテーションを使用して、FreeSurferなどの自動化されたツールによって各対象に関する皮質表面の境界を計算する(例えば、Dale AM et al.,Cortical surface-based analysis I.Segmentation and surface reconstruction,NEUROIMAGE,9(2),179-194,4931(1999)、Fischl B.et al,Whole brain segmentation:Automated labeling of neuroanatomical structures in the human brain,NEURON,33(3),341-355,3776(2002)、及びFischl B.et al,Cortical surface-based analysis.II:Inflation,flattening,and a surface-based coordinate system,NEUROIMAGE,9(2),195-207(1999)を参照されたい)。次に、遺伝子発現の対象特異的な「ネイティブ空間」部位を当該対象の皮質表面メッシュ上にマッピングする。次に、メッシュ上の値を、最新式の表面ベースの登録方法に基づいて共通のアトラスに変換する(上記、及びAnticevic A.et al.,Comparing surface-based and volume-based analyses of functional neuroimaging data in patients with schizophrenia,NEUROIMAGE,41(3):835-48,Jul 1(2008)、Glasser MF et al.,A multi-modal parcellation of human cerebral cortex,NATURE,536,171-178(11 August 2016)を参照されたい)。 The AHBA dataset provides MNI coordinates for each sample. For samples in the cortex, the method maps this coordinate to the nearest grayordinate on the CIFTI cortical surface. There are two ways to achieve this. A relatively crude method involves mapping the MNI coordinates provided by AHBA for each site of gene expression into a common atlas. A second, more precise method involves computing a complete segmentation of all gray and white matter for each individual subject for which gene expression data are available. These segmentations are then used to calculate cortical surface boundaries for each subject by an automated tool such as FreeSurfer (see, e.g., Dale AM et al., Cortical surface-based analysis I. Segmentation and surface reconstruction, NEUROIMAGE , 9(2), 179-194, 4931 (1999), Fischl B. et al, Whole brain segmentation: Automated labeling of neuroanatomical structures in the human brain, NEURON, 33(3), 341-355,326 (341-3520327) and Fischl B. et al, Cortical surface-based analysis II: Inflation, flattening, and a surface-based coordinate system, NEUROMAGE, 9(2), 195-207 (1999)). Subject-specific "native spatial" sites of gene expression are then mapped onto the subject's cortical surface mesh. The values on the mesh are then transformed into a common atlas based on state-of-the-art surface-based registration methods (see above and Anticevic A. et al., Comparing surface-based and volume-based analyzes of functional neuroimaging data in patients with schizophrenia, NEUROIMAGE, 41(3): 835-48, Jul 1 (2008), Glasser MF et al., A multi-modal parcellation of human cerebral cortex, NATURE, 51A121-17, 836, 17 (see ).
皮質下におけるサンプルについては、脳領域に対するAHBAの割り当てによるラベルが使用され得る。皮質に関して記載した第2の方法と同様に、代替的方法は、遺伝子発現データが存在する各個々の対象の灰白質及び白質全ての完全なセグメンテーションの計算を伴う。次いで、これらのセグメンテーションを使用して、FreeSurferなどの自動化されたツールによって各対象に関する皮質下ボリュームの境界を計算する(Dale AM et al.,Cortical surface-based analysis I.Segmentation and surface reconstruction,NEUROIMAGE,9(2),179-194,4931(1999)、Fischl B.et al,Whole brain segmentation:Automated labeling of neuroanatomical structures in the human brain,NEURON,33(3),341-355,3776(2002)Fischl B.et al,Cortical surface-based analysis.II:Inflation,flattening,and a surface-based coordinate system,NEUROIMAGE,9(2),195-207(1999))。次に、遺伝子発現の対象特異的な「ネイティブ空間」部位を当該対象の皮質下ボリューム上にマッピングし、最新式の登録方法に基づいて共通のアトラスに変換する(Anticevic A.et al.,Comparing surface-based and volume-based analyses of functional neuroimaging data in patients with schizophrenia,NEUROIMAGE,41(3):835-48,Jul 1(2008)、Glasser MF et al.,A multi-modal parcellation of human cerebral cortex,NATURE,536,171-178(11 August 2016))。 For subcortical samples, labeling by assignment of AHBA to brain regions can be used. Similar to the second method described for cortex, an alternative method involves computing a complete segmentation of all gray and white matter for each individual subject for which gene expression data are available. These segmentations are then used to calculate subcortical volume boundaries for each subject by an automated tool such as FreeSurfer (Dale AM et al., Cortical surface-based analysis I. Segmentation and surface reconstruction, NEUROIMAGE, 9(2), 179-194, 4931 (1999), Fischl B. et al, Whole brain segmentation: Automated labeling of neuroanatomical structures in the human brain, NEURON, 33(3), 341-355, Fischl 20326 (Fischl 20326) B. et al, Cortical surface-based analysis II: Inflation, flattening, and a surface-based coordinate system, NEUROIMAGE, 9(2), 195-207 (1999)). Subject-specific 'native spatial' sites of gene expression are then mapped onto the subject's subcortical volume and transformed into a common atlas based on state-of-the-art registration methods (Anticevic A. et al., Comparing surface-based and volume-based analyses of functional neuroimaging data in patients with schizophrenia,NEUROIMAGE,41(3):835-48,Jul 1(2008)、Glasser MF et al.,A multi-modal parcellation of human cerebral cortex, NATURE, 536, 171-178 (11 August 2016)).
分析は、AHBAサンプルがマッピングされる低密度の灰白質内座標を使用して、サンプルレベルで進めることができる。 Analysis can proceed at the sample level using the low density gray matter coordinates to which the AHBA samples are mapped.
高密度マップ及び区画化されたマップは、皮質内の全ての灰白質内座標への遺伝子発現値の内挿を必要とする。この内挿を行うには、複数の方法を使用することができる。本発明者らの本方法は、Voronoi図を構築し、各灰白質内座標をその最も近いAHBAサンプル部位に割り当て、次いでこのサンプルの遺伝子発現値を、これらの灰白質内座標に与えることである。皮質表面に沿ったサンプルからの増加する測地的距離を用いる(例えば、遺伝子発現の空間的自己相関構造によって決定される特徴的な長さ定数を用いる)指数関数的減衰に基づいた重み付き平均化を含め、他の方法を使用してもよい。これにより高密度マップがもたらされる。区画化されたマップを作成するには、例えば、Connectome WorkbenchソフトウェアまたはCIFTIフォーマットを読み取ることができる任意の他のマトリクス操作ソフトウェア(例えばMatlab、R統計計算環境、Octave、Pythonなど)を使用したCIFTI定義された区画化により、高密度マップを区画化することができる。例えば、HCPチームによる新たな皮質区画化を使用してもよい。Glasser et al.,A multi-modal parcellation of human cerebral cortex,NATURE 536:171-8(2016)(「Glasser」)。遺伝子発現を含む区画について、1つの方法は、その区画内のサンプルの平均としての区画値を割り当てることであり、これは、重み付き平均(例えば、区画内のサンプルの相対的なVoronoi図適用範囲に基づくもの)であり得る。 Dense and compartmentalized maps require interpolation of gene expression values to all gray matter coordinates within the cortex. Several methods can be used to perform this interpolation. Our method is to construct a Voronoi map, assign each gray matter coordinate to its nearest AHBA sample site, and then give the gene expression values for this sample to these gray matter coordinates. . Weighted averaging based on exponential decay using increasing geodesic distances from the sample along the cortical surface (e.g. using a characteristic length constant determined by the spatial autocorrelation structure of gene expression) Other methods may be used, including This results in a high density map. To create a compartmentalized map, define CIFTI using, for example, Connectome Workbench software or any other matrix manipulation software that can read the CIFTI format (e.g. Matlab, R statistical computing environment, Octave, Python, etc.) A high-density map can be partitioned due to the partitioned partitioning. For example, new cortical compartmentalization by the HCP team may be used. Glasser et al. , A multi-modal parcellation of human cerebral cortex, NATURE 536:171-8 (2016) (“Glasser”). For compartments containing gene expression, one method is to assign the compartment value as the average of the samples within that compartment, which is a weighted average (e.g., the relative Voronoi diagram coverage of samples within the compartment). based on).
前述のように、AHBAに寄与する各個々の対象の皮質及び皮質下のセグメンテーションを、それらの高解像度の構造の死後スキャンに基づいて明確に計算することにより、更なる座標を測定部位に割り当てることができる。次に、そのようなセグメンテーションを活用して、皮質メッシュ及び皮質下の解剖学的核の割り当てを計算することができる。次にこのメッシュが、近接性を伴って表面を形成し、次いでこの近接性を各個々の対象について算出すると、対象特異的な座標セットを得ることができる。次に、表面ベースの特徴を使用し、かかる皮質表面メッシュを、グループアトラスに対して対象間でアラインすることができる。このことは、対象レベルでその解剖所見に基づいて定義され、次に所与のグループアトラスに対してアラインされ得る、皮質下の発現部位にも適用される。この空間変換の後、各対象の個々の座標をアライメントさせる。次に、特定の部位レベルで、その部位における遺伝子発現に対する特定の座標を使用して、分析を進めることができる。重要なことに、神経画像処理マップは、関連性のある皮質部位及び皮質下部位も捕捉することになる。 Assigning additional coordinates to the measurement sites by explicitly calculating the cortical and subcortical segmentations of each individual subject contributing to AHBA, as described above, based on postmortem scans of their high-resolution structures. can be done. Such segmentation can then be leveraged to compute cortical mesh and subcortical anatomical nucleus assignments. This mesh then forms a surface with the proximity, which can then be calculated for each individual object to obtain an object-specific set of coordinates. Surface-based features can then be used to align such cortical surface meshes across subjects against a group atlas. This also applies to subcortical sites of expression, which can be defined based on their anatomy at the subject level and then aligned to a given group atlas. After this spatial transformation, the individual coordinates of each object are aligned. Analysis can then proceed at a specific site level, using specific coordinates for gene expression at that site. Importantly, the neuroimaging map will also capture relevant cortical and subcortical regions.
反対に、連続的な「高密度」マップ及び離散的な「区画化された」マップは、ネイティブ解像度における所与の高密度マップまたは所与の離散的な区画/領野のいずれかにおける所与の皮質部位に遺伝子発現値を割り当てることを必要とする。この割り当てのための方法例には、次のものが含まれる。(1)遺伝子発現が測定された部位、すなわち遺伝子発現測定部位との近接性に基づいた所与のマップ部位への値の割り当て。これは、例えばVoronoi図の構築による、例えば最近接点割り当てを介して行うことができる。(2)例えば、皮質表面に沿った遺伝子発現測定部位からの距離により重み付けされた、遺伝子発現が測定された部位への近接性に基づいたマップ部位への加重和による割り当て。(3)所与の区画化による区画境界内にある遺伝子発現測定部位間の加重和による割り当て。 Conversely, a continuous "dense" map and a discrete "compartmentalized" map are either a given high-density map at native resolution or a given It requires assigning gene expression values to cortical sites. Example methods for this assignment include the following. (1) Assignment of a value to a given map site based on its proximity to the sites where gene expression was measured, ie gene expression measurement sites. This can be done for example via nearest point assignment, for example by constructing a Voronoi diagram. (2) Weighted sum assignment to map sites based on proximity to sites where gene expression was measured, for example weighted by distance from the gene expression measurement site along the cortical surface. (3) Weighted sum assignment between gene expression measurement sites within the compartment boundaries of a given compartmentalization.
皮質下遺伝子発現データは、皮質下部位または領域に値を割り当てるために使用され得る。この割り当てのための方法としては、神経解剖学的評価によるラベル付け、皮質下領域の区画内の加重和、または他の形態の解剖学的もしくは機能的部位の割り当てが挙げられる。 Subcortical gene expression data can be used to assign values to subcortical sites or regions. Methods for this assignment include labeling by neuroanatomical assessment, intra-compartmental weighted sums of subcortical regions, or other forms of anatomical or functional site assignment.
更なる処理工程を遺伝子発現データに適用して、神経行動学的表現型マッピングデータと組み合わせる前に外的バイアスを除去し、シグナル対ノイズ比を向上させることもできる。これらの工程は、対象間の安定性測定基準によって定量化され得るマップの再現性を向上させることができる。工程の例には、次のものが含まれる。(1)発現値は、対象間で組み合わせる前の各対象(すなわち脳)内で(例えば、平均値または中央値によって)正規化することができる。(2)遺伝子発現測定部位は、それらが遺伝子間の発現レベルにおいて例外的に低い他の測定部位との類似性を呈することに基づいてフィルタリングアウトすることができる。(3)空間的発現パターンのシグナル対ノイズ比は、主成分分析(PCA)を介した次元縮退などのデータ処理技術によって向上させることができる。 Additional processing steps can also be applied to the gene expression data to remove external biases and improve signal-to-noise ratios before combining with neurobehavioral phenotype mapping data. These steps can improve the reproducibility of the map, which can be quantified by inter-subject stability metrics. Examples of steps include: (1) Expression values can be normalized (eg, by mean or median) within each subject (ie, brain) before combining across subjects. (2) Gene expression measurement sites can be filtered out based on their exhibiting exceptionally low similarity in inter-gene expression levels to other measurement sites. (3) The signal-to-noise ratio of spatial expression patterns can be enhanced by data processing techniques such as dimensionality reduction via principal component analysis (PCA).
本発明者らは、生のAHBAデータセットを使用する際に種々の複雑化要因に直面したため、本発明のツール及び方法のプラットフォームに使用するための更なる前処理が必要であった。これらの問題は、外的バイアスを除去し、シグナル対ノイズ比を向上させるための、いくつかの更なる前処理工程の展開を必要とする。例えば、本発明者らは、補正されるべきである、AHBAサンプルにわたる平均発現レベルにおけるバイアスを見出した。6名の対象にわたるデータを組み合わせる最も良い方法も評価され、これはデータから平均値を引いて(de-mean)正規化することを必要とする。 The inventors faced various complications in using the raw AHBA dataset, which required further preprocessing for use in the tool and method platform of the present invention. These issues require the development of several additional pretreatment steps to remove external biases and improve the signal-to-noise ratio. For example, we found a bias in mean expression levels across AHBA samples that should be corrected. The best method of combining data across 6 subjects was also assessed, which required de-mean normalization of the data.
所与の目的の遺伝子のためのプローブの選択が重要であることも留意される。多くの遺伝子に対して複数のプローブがあり、これらは、それらの発現レベル及びサンプル間の全体的な適用範囲に基づいて選択され得る。本発明のツール及び方法は、プローブまたは遺伝子が、その対象間の示差的な安定性(すなわち、発現値の対象間平均相関性)の特徴付けによる分析に好適であるかどうかを試験する。Hawrylycz 2015。また、本発明のツール及び方法は、更なる分析のために安定な対象間発現マップを有する対象のサブセットを選択するために、示差的な安定性を使用し得る。これらの工程の注意深い特徴付けは、AHBAデータセットから有意義な結果を得る能力を大幅に向上させると期待される。例えば、本発明者らは、皮質区画間の適用範囲(適用範囲スコアを定義する)が閾値率未満であったために高密度または区画化された遺伝子発現マップを形成するための内挿に好適でなかったプローブをフィルタリングアウトした。1つの遺伝子に対して、許容可能な適用範囲及び微分安定性スコアを各々が有する2つのプローブが利用可能であった場合、選択されたプローブを、遺伝子発現の最大分散を有するものとして設定した。3つ以上の許容可能なプローブが利用可能であった場合、選択されたプローブは、それが利用可能な遺伝子プローブの中で代表性が最も高いため、他のプローブとの類似性が最も高いものである。 It is also noted that the choice of probe for a given gene of interest is important. There are multiple probes for many genes, which can be selected based on their expression levels and overall coverage between samples. The tools and methods of the present invention test whether a probe or gene is suitable for analysis by characterizing its inter-subject differential stability (ie, inter-subject average correlation of expression values). Hawrycz 2015. The tools and methods of the invention can also use differential stability to select subsets of subjects with stable cross-subject expression maps for further analysis. Careful characterization of these steps is expected to greatly improve the ability to obtain meaningful results from the AHBA dataset. For example, we found that the coverage between cortical compartments (defining the coverage score) was less than a threshold rate and thus suitable for interpolation to form dense or compartmentalized gene expression maps. Filtered out probes that were not If two probes were available for a gene, each with acceptable coverage and differential stability score, the selected probe was set as the one with the maximum variance of gene expression. If three or more acceptable probes were available, the selected probe is the one with the highest similarity to the other probes, as it is the most representative of the available genetic probes. is.
DNAマイクロアレイ測定から導出される遺伝子発現データセットについて、目的の遺伝子のためのマイクロアレイプローブの選択は重要である。プローブは、脳領域に対するプローブの適用範囲、及び対象(例えば、死後のヒトまたは動物の脳)におけるプローブの発現パターンの一貫性を含め、複数の要因に基づいて選択される。AHBAにおけるDNAマイクロアレイプローブの例(Agilent製)は、A_23_P40262(PDYNのため)、A_23_P132619(OXTRのため)、A_23_P169061(OPRK1のため)、A_24_P382579(OXTのため)、A_23_P9883(AVPのため)、及びA_23_P345564(OPRL1のため]である。選択された複数のプローブを加重和に組み合わせて、例えば、PCAからの第1の主成分を使用すること、プローブ間の平均値もしくは中間値を使用すること、または何らかの中心傾向尺度によって最も代表的なプローブを使用することによって、シグナル対ノイズ比を向上させることができる。プローブ情報は、例えば、公的に利用可能なデータベースから得ることもできるし、または更なる実験によって最適化することもできる。 For gene expression datasets derived from DNA microarray measurements, the selection of microarray probes for genes of interest is critical. Probes are selected based on a number of factors, including the coverage of the probe to brain regions and the consistency of the probe's expression pattern in subjects (eg, post-mortem human or animal brains). Examples of DNA microarray probes in AHBA (from Agilent) are A_23_P40262 (for PDYN), A_23_P132619 (for OXTR), A_23_P169061 (for OPRK1), A_24_P382579 (for OXT), A_23_P9883 (for AVP), and A_23_P345564. (for OPRL1], combining selected probes into a weighted sum, e.g., using the first principal component from PCA, using the mean or median between probes, or The signal-to-noise ratio can be improved by using probes that are most representative by some central tendency measure.Probe information can be obtained, for example, from publicly available databases, or further It can also be optimized by experiment.
計算フレームワーク
本発明のプラットフォームの全体的な計算フレームワークは、図1に概略的に示されている。簡潔に述べると、本明細書に記載の実施形態は、脳マッピングデータ及び遺伝子発現データを前処理することによって神経行動学的表現型(例えば、障害、症状、認知プロセスなど)と遺伝子(またはそれに関連する薬物もしくは薬物標的)とを相関付けること;及び、神経行動学的表現型に関連する脳マップ(ヒト神経画像処理によって作成することができるもの)と、遺伝子の発現値の脳マップとの間の類似性を計算することに関する。Computational Framework The overall computational framework of the platform of the present invention is shown schematically in FIG. Briefly, embodiments described herein identify neurobehavioral phenotypes (e.g., disorders, symptoms, cognitive processes, etc.) and genes (or and correlation of neurobehavioral phenotype-related brain maps (which can be generated by human neuroimaging) with brain maps of gene expression values. It relates to calculating the similarity between
概して、本プラットフォームは、図1においてパス110及びパス120として表されている2つのパスを含む。 Generally, the platform includes two paths, represented as
プラットフォーム概略図のパス110は、1つ以上の神経行動学的表現型112のリストから始まる。本明細書においてより詳細に記載するように、このプロセスは、選択された神経行動学的表現型から始まって遺伝子もしくは薬物標的を同定もしくは予測してもよいし、または、選択された遺伝子もしくは薬物標的から始まって神経行動学的表現型を同定もしくは予測してもよい。1名または複数名のヒトの1つまたは複数の神経画像から得た神経行動学的表現型マッピングデータから、神経行動学的表現型マップ114(すなわち、神経表現型トポグラフィ)のセットが生成される。これらの神経行動学的表現型マップ114は、全脳測定レベルで、または選択された部位もしくは脳領域にわたって、障害、症状、及び認知プロセスの特徴を反映する。そのような神経行動学的表現型マップ114は、本明細書に記載の遺伝子型トポグラフィ及び神経表現型トポグラフィに基づく方法に使用するために、タスクベースのfMRI、安静時fMRI、DWI、構造的、EEG、MEG、PETマップなどの様々な神経画像処理モダリティから導出され得る。これらの神経行動学的表現型マップは、それらに関連する神経行動学的表現型によってラベル付けされる。神経行動学的表現型マップ114を生成するために使用される神経行動学的表現型マッピングデータセットは、したがって、公的に利用可能なデータベースからのみならず、種々のソースから得ることができる。したがって、本システムは、神経行動学的表現型のオントロジーを神経画像処理マップと関連付けるデータベースとインターフェース接続することができる。 A platform
様々な実施形態において、本システムは、全脳レベルまたは選択された部位もしくは脳領域にわたってのいずれかにおける神経行動学的表現型の特徴を反映する神経画像処理マップを、神経行動学的表現型マップとして利用する。神経行動学的表現型マップは、過去のソースからの事前計算及び/または情報収集によって導出されてもよいし、あるいは、動物及びヒトの研究における新たな観測及び実験の作業中に経験的に生成されてもよい。 In various embodiments, the system produces a neuroimaging map that reflects neurobehavioral phenotypic features either at the whole brain level or across selected sites or brain regions. Use as Neurobehavioral phenotype maps may be derived by precomputation and/or information gathering from historical sources, or generated empirically during new observations and experimental work in animal and human studies. may be
いくつかの実施形態では、神経行動学的表現型マップ114の任意選択の重み付け及びマスキング116を用いてもよい。つまり、任意選択の重み付けでは、各脳部位または領域に重み値が割り当てられ得る。そのような重み付けは、特定の部位または脳領域の優先順位付け、ある特定の部位または脳領域における発現のペナルティ付けなどを可能にする。例えば、特定の脳領域に優先順位を付けることは、それらの領域に閾値を超える重みを割り当てること、及び他の脳領域に閾値未満の重みを割り当てることを含み得る。また、任意選択のマスキングは、特定の部位または脳領域からの情報をマスクまたは除去するために使用される重み付けによって、例えばゼロまたは別のより低い閾値未満に重みを割り当てることによって、達成され得る。マスキングは、特定の脳構造の優先順位付け、すなわち、全脳レベルではなく、ある特定の脳構造内、例えば皮質内のみにおける(皮質下構造のマスキングアウト)、神経行動学的表現型マップと遺伝子発現マップとのアライメントを評価する柔軟性を可能にする。 In some embodiments, optional weighting and masking 116 of the
例えば、神経行動学的表現型マップ114の柔軟性は、これを任意選択の重みマップと組み合わせることによって拡大することができ、ここで、本発明の遺伝子型トポグラフィ及び神経表現型トポグラフィに基づく方法の一環として、各脳領域についての重み値が定義される。次いで、この重みマップを、例えば重み付きピアソン相関係数によるアライメント測定値の算出において使用することができる。これにより、ある特定の脳領域をマスキングアウトすること、いくつかの領域に他より高い優先順位を付けること、ある特定の領域における発現にペナルティを付けることなどのオペレーションを柔軟に実装することができる。次いで、神経行動学的表現型マップ114及び重みマップを、遺伝子発現マップ128と接触させ、遺伝子発現マップ128との比較のために使用する。 For example, the flexibility of the
図のパス120は、選択された治療薬(例えば、特定の神経伝達物質受容体及びそれらのサブユニットを標的とする薬物)の分子標的(特定の遺伝子126によってコードされる)に関連する治療行為をアラインする。遺伝子発現マップ128(すなわち、遺伝子型トポグラフィ)は、脳全体における特定の遺伝子126の差次的発現を特徴付ける。これらの遺伝子発現マップ128は、AHBAデータセットから計算されてよく、前処理された遺伝子マッピング情報をもたらし得る。これらの遺伝子126によってコードされるタンパク質、及びそれらが関与する生化学的経路は、特定の薬物標的124と、そして特定の薬物122または治療薬と結び付けられ得る。したがって、本発明のプラットフォームは、特定の遺伝子、関連する薬物標的または特定の薬物との結び付きを示す新たな遺伝子発現マップ(すなわち、遺伝子型トポグラフィ)を作成し得る。本システムは、薬物122及び薬物標的124を遺伝子116と関連付けるデータベースとインターフェース接続することができる。
いくつかの実施形態では、これら2つのパスをインプットとして使用し、接触させ、所与の神経行動学的表現型についての1つ以上の表現型-遺伝子ペアトポグラフィ(すなわち、同じ表現型と異なる遺伝子についての1つ以上の表現型-遺伝子ペア)を定義するように相関付ける。各表現型-遺伝子ペアについての各表現型-遺伝子ペアトポグラフィについて、データの接触及び対応する神経行動学的表現型マップと各遺伝子発現マップとのアライメントに基づいて、数値スコア130が生成される。 In some embodiments, these two paths are used as inputs and brought into contact to generate one or more phenotype-gene pair topographies for a given neurobehavioral phenotype (i.e., same phenotype and different gene correlate to define one or more phenotype-gene pairs) for For each phenotype-gene pair topography for each phenotype-gene pair, a
例えば、重み付けされた神経行動学的表現型マップ(すなわち、神経表現型トポグラフィ)及び遺伝子発現マップ(遺伝子型トポグラフィ)を接触させ比較すると、表現型-遺伝子ペアの対応する表現型-遺伝子ペアトポグラフィを定めることができ、このようなマップについて関連性のレベルを反映するスコアが算出される。所与の表現型-遺伝子ペアに対する数値スコアは、重み付けされた神経行動学的表現型マップと遺伝子発現マップとの接触及びアライメントに基づいてよく、領域間のマップ値の相関性として計算され得る。神経行動学的表現型マップデータと遺伝子発現マップデータとの間で接触される、相関付けられる、またはアラインされる1つまたは複数の脳領域の定義及び特徴付けは、その表現型-遺伝子ペアについての表現型-遺伝子ペアトポグラフィをもたらす。このスコアは、統計的関連性の程度(例えば、相関性の算出または他の共有分散(shared variance)の程度)から導出することができ、関連性が強いほどランクが高くなる。関連性が高いほど、神経行動学的表現型マップと遺伝子発現マップとの間の関係が強いことを示し、関連する治療効果と神経行動学的表現型との間の可能性のある結び付きがより強いことを示唆する。このスコアを評価するために、統計的有意性の程度または信頼区間も生成及び提供される。 For example, a weighted neurobehavioral phenotype map (i.e., neurophenotype topography) and a gene expression map (genotype topography) are brought into contact and compared to yield the corresponding phenotype-gene pair topography of the phenotype-gene pair. can be defined, and a score is calculated for such maps that reflects the level of relevance. A numerical score for a given phenotype-gene pair may be based on the contact and alignment of the weighted neurobehavioral phenotype map with the gene expression map and calculated as the correlation of map values between regions. Definition and characterization of one or more brain regions that are contacted, correlated, or aligned between the neurobehavioral phenotype map data and the gene expression map data for that phenotype-gene pair phenotype-gene pair topography. This score can be derived from a measure of statistical relevance (eg, a correlation calculation or other measure of shared variance), with stronger relevance being ranked higher. A higher association indicates a stronger relationship between the neurobehavioral phenotype map and the gene expression map, indicating a more likely connection between the relevant treatment effect and the neurobehavioral phenotype. suggest strong. A degree of statistical significance or confidence interval is also generated and provided to assess this score.
他の実施形態では、これらの2つのパスをインプットとして使用し、接触させ、所与の遺伝子についての1つ以上の遺伝子-表現型ペアトポグラフィ(すなわち、同じ遺伝子と異なる表現型についての1つ以上の遺伝子-表現型ペア)を定義するように相関付ける。各遺伝子-表現型ペアについての各遺伝子-表現型ペアトポグラフィについて、データの接触及び対応する遺伝子発現マップと各神経行動学的表現型マップとのアライメントに基づいて、数値スコア130が生成される。上記と同様に、重み付けされた神経行動学的表現型マップ(すなわち、神経表現型トポグラフィ)及び遺伝子発現マップ(遺伝子型トポグラフィ)を接触させ比較すると、遺伝子-表現型ペアの対応する遺伝子-表現型ペアトポグラフィを定めることができ、このようなマップについて関連性のレベルを反映するスコアが算出される。 In other embodiments, these two paths are used as inputs, brought into contact, and one or more gene-phenotype pair topographies for a given gene (i.e., one or more for the same gene and different phenotypes). gene-phenotype pairs). For each gene-phenotype pair topography for each gene-phenotype pair, a
図1に例示されていない他の実施形態では、パス120をインプットとして使用し、接触させ、所与の遺伝子についての1つ以上の遺伝子-遺伝子ペアトポグラフィ(すなわち、同じ遺伝子と異なる他の遺伝子についての1つ以上の遺伝子-遺伝子ペア)を定義するように相関付ける。各遺伝子-遺伝子ペアについての各遺伝子-遺伝子ペアトポグラフィについて、データの接触及び対応する遺伝子発現マップの互いとのアライメントに基づいて、数値スコア130が生成される。同様に、遺伝子発現マップ(遺伝子型トポグラフィ)(これは重み付けまたはマスクされ得る)を接触させ比較すると、遺伝子-遺伝子ペアの対応する遺伝子-遺伝子ペアトポグラフィを定めることができ、このようなマップについて関連性のレベルを反映するスコアが算出される。 In other embodiments not illustrated in FIG. 1, the
様々な実施形態において、プラットフォームのアウトプットは、あらゆる計算されたマップまたは他の情報、及び有形フォーマット、音声フォーマット、または他のフォーマットにおけるデータの神経画像処理データファイルを含む。これには、神経行動学的表現型マップ及び遺伝子発現マップが接触しアラインされる領域(すなわち、ペアトポグラフィ)、及び接触しミスアラインされる領域を特徴付けるマップが含まれる。ミスアラインされた神経行動学的表現型マップ及び遺伝子発現マップは、潜在的な「オフターゲット」回路効果への見識をもたらし得る。可視化のために、マップデータファイルは、Human Connectome Project(HCP)Connectome Workbenchソフトウェアと適合性があってよい。アウトプットには、遺伝子(例えば、表現型-遺伝子ペアまたは遺伝子-遺伝子ペアをスコア化するとき)、または神経行動学的表現型(例えば、遺伝子-表現型ペアをスコア化するとき)の同定も含まれ得る。いくつかの実施形態では、アウトプットは、最も高いスコアのペアまたは閾値を超えるスコアを有するペアであり得る。 In various embodiments, the output of the platform includes neuroimaging data files of any computed maps or other information and data in tangible, audio, or other formats. This includes maps that characterize regions where neurobehavioral phenotypic maps and gene expression maps contact and align (ie, paired topography) and regions that contact and misalign. Misaligned neurobehavioral phenotype maps and gene expression maps can provide insight into potential 'off-target' circuit effects. For visualization, the map data files may be compatible with the Human Connectome Project (HCP) Connectome Workbench software. Output also includes identification of genes (eg, when scoring phenotype-gene pairs or gene-gene pairs), or neurobehavioral phenotypes (eg, when scoring gene-phenotype pairs). can be included. In some embodiments, the output may be the pair with the highest score or the pair with a score above a threshold.
一実施形態において、全ての脳マップ(神経画像処理及び遺伝子発現)、及び本発明のプラットフォームは、HCPによって利用される神経画像処理データのために新たなCIFTIファイルフォーマットを使用し得る。Glasser。純粋にボリュメトリックなNIfTIフォーマットとは対照的に、CIFTIは、皮質を幾何的に忠実な二次元メッシュとして表し、皮質下サンプルをボリュームとして表し、これらは集合的に約95,000の灰白質内座標を含む。本発明者らは、レガシーNIfTIデータをCIFTIベースの分析と統合して、大きな神経画像処理データベースなどの既存のデータ、ならびに新たなCIFTI対応データセットと本発明のプラットフォームの統合を可能にした。 In one embodiment, all brain maps (neuroimaging and gene expression) and platforms of the present invention may use the new CIFTI file format for neuroimaging data utilized by HCP. Glasser. In contrast to the purely volumetric NIfTI format, CIFTI represents the cortex as a geometrically faithful two-dimensional mesh and the subcortical samples as volumes, collectively representing approximately 95,000 gray matter cells. Contains coordinates. We have integrated legacy NIfTI data with CIFTI-based analysis to enable integration of our platform with existing data, such as large neuroimaging databases, as well as new CIFTI-compatible datasets.
CIFTIベースの分析は、溝間のシグナルブリードを最小限に抑える表面ベースの分析を使用した皮質の折り畳みの優れた管理及びアライメントを含め、いくつかの利点を有する。Anticevic et al.,Comparing surface-based and volume-based analyses of functional neuroimaging data in patients with schizophrenia,NEUROIMAGE 41:835-48(2008)(「Anticevic」)、Glasser。CIFTIスタイルのフォーマットは柔軟性が高く、区画化において「マトリクスレベル」情報を表現することができる。本明細書に記載のように、CIFTIフォーマットは、離散的なサンプルから密な皮質マントル上への表面ベースの内挿を可能にするため、遺伝子発現データを用いて作業するのに有利である。更に、CIFTIは、本発明のプラットフォームがマップ可視化のために使用し得るHCP Connectome Workbenchソフトウェアにおける可視化及び分析と適合性がある。 CIFTI-based analysis has several advantages, including better control and alignment of cortical folding using surface-based analysis that minimizes signal bleed between grooves. Anticevic et al. , Comparing surface-based and volume-based analyzes of functional neuroimaging data in patients with schizophrenia, NEUROIMAGE 41:835-48 (2008) (“Anticeviser”). The CIFTI-style format is flexible and can express "matrix-level" information in the partitioning. As described herein, the CIFTI format is advantageous for working with gene expression data because it allows surface-based interpolation from discrete samples onto the dense cortical mantle. Additionally, CIFTI is compatible with visualization and analysis in the HCP Connectome Workbench software that the platform of the present invention can use for map visualization.
本発明のプラットフォームは、統計分析における向上を必要とする。上述のように、AHBA遺伝子発現データの適切な分析は、解釈可能な結果を裏付けるためにかなりの前処理を必要とする。例えば、示差的な安定性の特徴付けにより、低い遺伝子-マップ相関関係値が、マップの相違に起因するのか、または単に示差的な安定性の不足に起因するのかを区別することが可能になる。所与の遺伝子について、高い微分安定性を有する対象のサブセットを選択することは、全ての対象を組み合わせることと比べてシグナル対ノイズ比を向上させ得る。 The platform of the present invention requires improvements in statistical analysis. As noted above, proper analysis of AHBA gene expression data requires considerable preprocessing to support interpretable results. For example, differential stability characterization makes it possible to distinguish whether low gene-map correlation values are due to map divergence or simply to lack of differential stability. . Selecting a subset of subjects with high differential stability for a given gene can improve the signal-to-noise ratio compared to combining all subjects.
別の重要な問題は、観察される相関関係が偶然起こり得る確率、すなわち、それらの統計的有意性を評価することを含む。単純相関(例えば、ピアソンまたはスピアマン)は、関連するパラメトリックp値をもたらす。しかしながら、このp値は、データ点(ここでは脳領域)間の統計的独立性の仮定のもとに導出される。異なる脳マップでは、測定値が脳領域間で空間的に自己相関するため、この独立性の仮定は無視される場合がある。本発明者らは、空間的自己相関に関する統計検定(例えば、Moran’s I、Mantel’s検定)を使用して、相関スコアの統計的有意性の推論に対する自己相関の影響を評価し得る。モデル推論において自己相関により誘導されるバイアスを補正するため、本発明者らは、空間的自己回帰(SAR)モデルを用いて統計的有意性を算出することができる。これらの統計及びデータ分析における進歩は、プラットフォームの推論力を更に向上させ得る。 Another important issue involves assessing the probability that the observed correlations could occur by chance, ie their statistical significance. A simple correlation (eg, Pearson or Spearman) yields the associated parametric p-value. However, this p-value is derived under the assumption of statistical independence between data points (here brain regions). In different brain maps, this independence assumption may be ignored as measurements are spatially autocorrelated between brain regions. We can use statistical tests for spatial autocorrelation (e.g., Moran's I, Mantel's test) to assess the impact of autocorrelation on inferring the statistical significance of correlation scores. To correct for autocorrelation-induced bias in model inference, we can calculate statistical significance using a spatial autoregressive (SAR) model. Advances in these statistics and data analysis can further improve the platform's inference power.
図2を見ると、処理工程は、神経行動学的表現型マップ(すなわち、神経行動学的表現型トポグラフィ)、重みマップ(任意選択により)、及び遺伝子発現マップ(すなわち、遺伝子型トポグラフィ)という3つのタイプのマップの生成を含む。これらのマップを接触させ、表現型-遺伝子ペア、遺伝子-表現型ペア、または遺伝子-遺伝子ペアについての1つ以上のペアトポグラフィを定めるために使用する。これらのマップは、対応するペアについての神経行動学的表現型マップと遺伝子発現マップとの間のアライメントの重み付き尺度を定量化するスコアを算出するためにも使用される。処理は、行動学的神経表現型マップの生成(ボックス210)及び遺伝子発現マップの生成(ボックス230)から始まる。行動学的神経表現型マップの生成については、上記の「神経行動学的表現型及びマッピング」の小項目においてより詳細に論じてある。遺伝子発現マップの生成については、上記の「遺伝子発現及びマッピング」の小項目においてより詳細に、また図3及び4と併せて以下により詳細に論じてある。 Looking at FIG. 2, there are three processing steps: a neurobehavioral phenotype map (ie, neurobehavioral phenotypic topography), a weight map (optionally), and a gene expression map (ie, genotypic topography). Includes generation of two types of maps. These maps are collated and used to define one or more pairwise topographies for phenotype-gene pairs, gene-phenotype pairs, or gene-gene pairs. These maps are also used to calculate a score that quantifies a weighted measure of alignment between the neurobehavioral phenotype map and the gene expression map for the corresponding pairs. Processing begins with the generation of a behavioral neurophenotype map (box 210) and the generation of a gene expression map (box 230). The generation of behavioral neurophenotype maps is discussed in more detail in the "Neurobehavioral Phenotyping and Mapping" subsection above. The generation of gene expression maps is discussed in more detail in the "Gene Expression and Mapping" subsection above and in more detail below in conjunction with FIGS.
いくつかの実施形態では、重みマップまたはマスキングマップが任意選択により生成されてもよく(ボックス220)、これは、図1における任意選択の重み付け及びマスキング116に関して上記により詳細に記載されている。 In some embodiments, a weight map or masking map may optionally be generated (box 220), which is described in more detail above with respect to optional weighting and masking 116 in FIG.
AHBAデータセットからの遺伝子発現マップの生成(230)は、複数の工程を含む(図3)。各対象について、遺伝子発現プローブに対する脳マップを生成する(310)。これは、複数段階のデータ処理を含む(図4と併せて以下により詳細に示してある)。 Gene expression map generation (230) from the AHBA dataset involves multiple steps (FIG. 3). For each subject, a brain map is generated 310 for the gene expression probes. This involves multiple stages of data processing (shown in more detail below in conjunction with FIG. 4).
ボックス320に示したように(図3)、目的の遺伝子それぞれについて、1つ以上の代表的プローブが各対象のために選択される。プローブ-遺伝子の関連性は、例えば、公的に利用可能なデータベースから得ることもできるし、または実験的試験によって最適化することもできる。多くの遺伝子に対して複数の関連するプローブがあり、これらは、それらの発現レベル及びサンプル間の全体的な適用範囲に基づいて選択され得る。本発明のツール及び方法は、プローブまたは遺伝子が、その複数の対象間の示差的な安定性(すなわち、発現値の対象間平均相関性)の特徴付けによる分析に好適であるかどうかを試験する。Hawrylycz 2015。また、本発明のツール及び方法は、更なる分析のために安定な対象間発現マップを有する対象のサブセットを選択するために、示差的な安定性を使用し得る。 As shown in box 320 (FIG. 3), one or more representative probes are selected for each subject for each gene of interest. Probe-gene relationships can be obtained, for example, from publicly available databases or optimized by empirical testing. There are multiple relevant probes for many genes, which can be selected based on their expression levels and overall coverage between samples. The tools and methods of the present invention test whether a probe or gene is suitable for analysis by characterizing its differential stability across multiple subjects (i.e. mean inter-subject correlation of expression values). . Hawlycz 2015. The tools and methods of the invention can also use differential stability to select subsets of subjects with stable cross-subject expression maps for further analysis.
これらの工程の注意深い特徴付けは、AHBAデータセットから有意義な結果を得る能力を大幅に向上させると期待される。例えば、いくつかの実施形態では、皮質区画間の適用範囲(適用範囲スコアを定義する)が閾値率未満であるために高密度または区画化された遺伝子発現マップを形成するための内挿に好適でないプローブはフィルタリングアウトされ得る。1つの遺伝子に対して、許容可能な適用範囲及び示差的な安定性スコアを各々が有する2つのプローブが利用可能である場合、選択されたプローブを、遺伝子発現の最大分散を有するものとして設定することができる。3つ以上の許容可能なプローブが利用可能である場合、選択されたプローブは、それが利用可能な遺伝子プローブの中で代表性が最も高いため、他のプローブとの類似性が最も高いものである。 Careful characterization of these steps is expected to greatly improve the ability to obtain meaningful results from the AHBA dataset. For example, in some embodiments, the coverage between cortical compartments (defining the coverage score) is less than a threshold percentage, making it suitable for interpolation to form dense or compartmentalized gene expression maps. Probes that are not may be filtered out. If two probes are available for a gene, each with acceptable coverage and a differential stability score, the selected probe is set as having the largest variance of gene expression. be able to. If three or more acceptable probes are available, the selected probe is the one with the highest similarity to the other probes, as it is the most representative of the available genetic probes. be.
DNAマイクロアレイ測定から導出される遺伝子発現データセットについて、目的の遺伝子のためのマイクロアレイプローブは、脳領域に対するプローブの適用範囲、及び対象(例えば、死後のヒトまたは動物の脳)におけるプローブの発現パターンの一貫性を含め、複数の要因に基づいて選択され得る。AHBAにおけるDNAマイクロアレイプローブの例(Agilent製)は、A_23_P40262(PDYNのため)、A_23_P132619(OXTRのため)、A_23_P169061(OPRK1のため)、A_24_P382579(OXTのため)、A_23_P9883(AVPのため)、及びA_23_P345564(OPRL1のため]である。選択された複数のプローブを加重和に組み合わせて、例えば、PCAからの第1の主成分を使用すること、プローブ間の平均値もしくは中間値を使用すること、または何らかの中心傾向尺度によって最も代表的なプローブを使用することによって、シグナル対ノイズ比を向上させることができる。プローブ情報は、例えば、公的に利用可能なデータベースから得ることもできるし、または更なる実験によって最適化することもできる。 For gene expression datasets derived from DNA microarray measurements, the microarray probes for the gene of interest are selected based on the coverage of the probe to the brain region and the expression pattern of the probe in the subject (e.g., post-mortem human or animal brain). Selection may be based on a number of factors, including consistency. Examples of DNA microarray probes in AHBA (from Agilent) are A_23_P40262 (for PDYN), A_23_P132619 (for OXTR), A_23_P169061 (for OPRK1), A_24_P382579 (for OXT), A_23_P9883 (for AVP), and A_23_P345564. (for OPRL1], combining selected probes into a weighted sum, e.g., using the first principal component from PCA, using the mean or median between probes, or The signal-to-noise ratio can be improved by using probes that are most representative by some central tendency measure.Probe information can be obtained, for example, from publicly available databases, or further It can also be optimized by experiment.
ボックス330に示したように(図3)、対象間の個人レベルの遺伝子発現マップを接触させ組み合わせることによって、目的の遺伝子に関する群レベルの遺伝子発現マップを計算することができる。この工程は、平均化によって行うことができ、更なる処理工程を介して向上させることができる。例えば、各対象レベルの遺伝子発現プロファイルは、その遺伝子のためのプローブが割り当てられた対象間の平均値を計算することによって得られる群レベルの発現プロファイルを計算する前に、zスコア化され得る。対象は、その遺伝子に関連するプローブに対する値を含むサンプルが、閾数によって判定して少なすぎる場合、組み入れから除外され得る。最後に、群レベルの発現プロファイルが、各遺伝子に対して全ての領野間でzスコア化され得る。群レベルのマップの計算における他の任意選択の工程は、区画が各対象のサンプルを含んだかどうかに基づく、各区画に対する対象間の優先的な重み付けを含み得る。 Group-level gene expression maps for genes of interest can be calculated by contacting and combining individual-level gene expression maps between subjects, as shown in box 330 (FIG. 3). This step can be done by averaging and can be improved through further processing steps. For example, each subject-level gene expression profile can be z-scored prior to calculating a group-level expression profile obtained by calculating the average value among subjects to which probes for that gene have been assigned. Subjects may be excluded from inclusion if too few samples contain values for probes associated with that gene, as determined by a threshold number. Finally, group-level expression profiles can be z-scored across all regions for each gene. Another optional step in computing the group-level map may include preferential weighting between subjects for each compartment based on whether the compartment contained samples for each subject.
図4を見ると、ボックス410に示したように、遺伝子プローブが、既知の遺伝子に対応するようにフィルタリングされる。例えば、有効なEntrez Gene IDを有しないプローブは除外され得る。 Looking at FIG. 4, the gene probes are filtered to correspond to known genes, as shown in
概して、諸実施形態は、皮質または皮質下における遺伝子発現データの分析について、(1)低密度サンプルまたは特定の部位、(2)内挿された高密度マップ、またはそのネイティブ(すなわち、密な)解像度における連続的マップ全体、及び(3)離散的な領域または領野に区画化されたマップという3つのレベルを含み得る。発現の部位に対するマップ座標は、異なる神経画像処理脳アトラス(例えば、Montreal Neurological Institute(MNI)アトラス)に変換することができる。使用するまばらさのレベルは、神経行動学的表現型マッピングデータまたは遺伝子発現プロファイルを定量化しようとする目的の領野の解像度に基づいて選択することができる。 In general, embodiments use (1) low-density samples or specific sites, (2) interpolated high-density maps, or their native (i.e., dense) maps for analysis of gene expression data in the cortex or subcortex. It may include three levels: a whole continuous map in resolution, and (3) a map partitioned into discrete regions or regions. Map coordinates for sites of expression can be transformed into different neuroimaging brain atlases (eg, the Montreal Neurological Institute (MNI) atlas). The level of sparseness used can be selected based on the neurobehavioral phenotype mapping data or the resolution of the region of interest in which the gene expression profile is to be quantified.
ボックス420に示したように(図4)、遺伝子発現サンプルは、それらのボリュメトリック画像化空間における脳構造における部位にマッピングされる。AHBAデータセットは、各サンプルに関するMNI座標を提供する。 As shown in box 420 (FIG. 4), gene expression samples are mapped to sites in brain structures in their volumetric imaging space. The AHBA dataset provides MNI coordinates for each sample.
いくつかの実施形態では、皮質におけるサンプルの場合、この座標をCIFTI皮質表面において最も近い灰白質内座標にマッピングする方法が2つある。比較的粗い方法は、遺伝子発現の各部位についてAHBAによって提供されるMNI座標を共通のアトラスにマッピングすることを伴い得る。第2のより精確な方法は、遺伝子発現データが存在する各個々の対象の灰白質及び白質全ての完全なセグメンテーションの計算を伴い得る。 In some embodiments, for samples in the cortex, there are two ways to map this coordinate to the nearest gray matter coordinate on the CIFTI cortical surface. A relatively crude method may involve mapping the MNI coordinates provided by AHBA for each site of gene expression into a common atlas. A second, more precise method may involve computing a complete segmentation of all gray and white matter for each individual subject for which gene expression data are available.
例えば、皮質からのサンプルは、そのサンプルに対する定位的なMNI座標と、各対象のネイティブな皮質表面メッシュにおける灰白質内座標頂点の座標との間のユークリッド距離が最小である灰白質内座標を選択することにより、CIFTIフォーマットの表面灰白質内座標にマッピングすることができる。 For example, samples from the cortex select the gray matter coordinates that have the smallest Euclidean distance between the stereotaxic MNI coordinates for that sample and the coordinates of the gray matter coordinate vertices in each subject's native cortical surface mesh. can be mapped to surface gray matter coordinates in CIFTI format.
AHBAにおける6名の対象の各々についての単一対象の表面登録は、HCPの最小限の前処理パイプラインから適合された手順に従って行うことができる。簡潔に述べると、T1w画像をまずMNI座標軸に厳密にアラインして、ネイティブ空間ボリュームを生成することができ、次いでこれを、FSLのFLIRT及びFNIRTを使用して標準的なMNIテンプレートに非線形に登録することができる。各対象の皮質表面境界は、FreeSurferなどの自動化されたツールによって計算することができる(例えば、Dale AM et al.,Cortical surface-based analysis I.Segmentation and surface reconstruction,NEUROIMAGE,9(2),179-194,4931(1999)、Fischl B.et al,Whole brain segmentation:Automated labeling of neuroanatomical structures in the human brain,NEURON,33(3),341-355,3776(2002)、及びFischl B.et al,Cortical surface-based analysis.II:Inflation,flattening,and a surface-based coordinate system,NEUROIMAGE,9(2),195-207(1999)を参照されたい)。ここで、ネイティブ空間画像は、脳構造の自動化されたセグメンテーションを行って白質及び軟膜表面を再構築する、FreeSurferのrecon-allパイプラインに通すことができる。次いで、FreeSurferがアウトプットした表面を標準的なGIFTIフォーマットに変換して、各対象のネイティブな表面メッシュを作成する。最後に、対象のネイティブな表面メッシュを、標準的なHCP表面メッシュに登録することができる。 Single-subject surface registration for each of the 6 subjects in AHBA can be performed according to procedures adapted from the HCP minimal pretreatment pipeline. Briefly, a T1w image can first be strictly aligned to the MNI coordinate axes to generate a native spatial volume, which is then non-linearly registered to a standard MNI template using FSL's FLIRT and FNIRT. can do. The cortical surface boundary for each subject can be calculated by automated tools such as FreeSurfer (see, e.g., Dale AM et al., Cortical surface-based analysis I. Segmentation and surface reconstruction, NEUROIMAGE, 9(2), 179 -194, 4931 (1999), Fischl B. et al, Whole brain segmentation: Automated labeling of neuroanatomical structures in the human brain, NEURON, 33(3), 341-355, 3776 (2002), and Fischl B. et al. , Cortical surface-based analysis II: Inflation, flattening, and a surface-based coordinate system, NEUROIMAGE, 9(2), 195-207 (1999)). Here, native spatial images can be passed through FreeSurfer's recon-all pipeline, which performs automated segmentation of brain structures to reconstruct white matter and pia surfaces. The surface output by FreeSurfer is then converted to standard GIFTI format to create a native surface mesh for each object. Finally, the native surface mesh of the object can be registered to the standard HCP surface mesh.
皮質下構造からのサンプルは、表面灰白質内座標と対照的に、ボリュメトリック・ボクセルにマッピングされる。AHBAにおける皮質下サンプルは、それらの収集源となる構造(例えば、視床または線条体)によってアノテートされる。サンプルは、皮質と同様の手順においてボクセルにマッピングすることができる。ここでサンプルは、各対象のネイティブ空間においてセグメンテーションされたそのFreesurfer構造(例えば視床、線条体)でラベル付けされたボクセルの最小ユークリッド距離を有するボクセルに対してマッピングされる。この方法は、遺伝子発現データが存在する各個々の対象の灰白質及び白質全ての完全なセグメンテーションの計算を伴う。次いで、これらのセグメンテーションを使用して、FreeSurferなどの自動化されたツールによって各対象に関する皮質下ボリュームの境界を計算することができる(Dale AM et al.,Cortical surface-based analysis I.Segmentation and surface reconstruction,NEUROIMAGE,9(2),179-194,4931(1999)、Fischl B.et al,Whole brain segmentation:Automated labeling of neuroanatomical structures in the human brain,NEURON,33(3),341-355,3776(2002)Fischl B.et al,Cortical surface-based analysis.II:Inflation,flattening,and a surface-based coordinate system,NEUROIMAGE,9(2),195-207(1999))。次に、遺伝子発現の対象特異的な「ネイティブ空間」部位を当該対象の皮質下ボリューム上にマッピングし、最新式の登録方法に基づいて共通のアトラスに変換することができる(Anticevic A.et al.,Comparing surface-based and volume-based analyses of functional neuroimaging data in patients with schizophrenia,NEUROIMAGE,41(3):835-48,Jul 1(2008)、Glasser MF et al.,A multi-modal parcellation of human cerebral cortex,NATURE,536,171-178(11 August 2016))。 Samples from subcortical structures are mapped to volumetric voxels as opposed to surface gray matter coordinates. Subcortical samples in AHBA are annotated by the structures from which they were collected (eg, thalamus or striatum). Samples can be mapped to voxels in a similar procedure to cortex. Here the samples are mapped to the voxel with the smallest Euclidean distance of the voxels labeled with that Freesurfer structure (eg thalamus, striatum) segmented in each subject's native space. This method involves computation of a complete segmentation of all gray and white matter for each individual subject for which gene expression data are available. These segmentations can then be used to compute subcortical volume boundaries for each subject by automated tools such as FreeSurfer (Dale AM et al., Cortical surface-based analysis I. Segmentation and surface reconstruction , NEUROIMAGE, 9(2), 179-194, 4931 (1999), Fischl B. et al, Whole brain segmentation: Automated labeling of neuroanatomical structures in the human brain, NEURON, 33, 733(3), 33 2002) Fischl B. et al, Cortical surface-based analysis II: Inflation, flattening, and a surface-based coordinate system, NEUROIMAGE, 9(2), 195-207 (1999)). Subject-specific 'native spatial' sites of gene expression can then be mapped onto the subject's subcortical volume and transformed into a common atlas based on state-of-the-art registration methods (Anticevic A. et al. .,Comparing surface-based and volume-based analyses of functional neuroimaging data in patients with schizophrenia,NEUROIMAGE,41(3):835-48,Jul 1(2008)、Glasser MF et al.,A multi-modal parcellation of human cerebral cortex, NATURE, 536, 171-178 (11 August 2016)).
ボックス430に示したように(図4)、サンプルは、様々な基準に従い、品質についてフィルタリングされる。例えば、AHBAデータセットにおいて提供される、発現レベル測定値がバックグラウンドを優に上回らないサンプルは、除外され得る。この工程を通過したサンプルは、(i)シグナル平均値が対応するバックグラウンドと著しく異なるプローブに属し、(ii)バックグラウンドの標準偏差と比べて最低でも2.6倍大きいバックグラウンド減算シグナルを有した。更に、最も近い表面灰白質内座標までのユークリッド距離が、全サンプル間で計算された距離平均値から標準偏差2つ分を超えて大きいサンプルも除外され得る。 As shown in box 430 (FIG. 4), the samples are filtered for quality according to various criteria. For example, samples provided in the AHBA dataset for which expression level measurements are not well above background can be excluded. Samples that passed this step belonged to probes that (i) had a signal mean significantly different from the corresponding background and (ii) had a background-subtracted signal that was at least 2.6 times greater than the standard deviation of the background. did. In addition, samples whose Euclidean distance to the nearest surface gray matter coordinate is greater than two standard deviations from the mean distance calculated across all samples can also be excluded.
ボックス440に示したように(図4)、値が欠損しているサンプルに補完を行ってもよい。所与の遺伝子プローブに対して、全てのAHBAサンプルがそのプローブに対する値を含むとは限らない。こうした欠損値は、複数のアルゴリズム的アプローチによって推定することができる。例えば、欠損値は、特異値分解(SVD)アプローチによって補完され得る。これは、あるサンプルからいくつかのプローブに対する値が欠損していても、サンプル間で共通する多くの他のプローブに対する値が含まれているという特性を利用する。SVDベースの補完は、プローブが欠損しているサンプルの発現値を推定するために、共通のプローブに関するサンプルの類似性を使用する。他の補完アプローチは、主成分分析(PCA)及び空間的近接に基づく方法を含み得る。 Imputation may be performed on samples with missing values, as shown in box 440 (FIG. 4). For a given gene probe, not all AHBA samples contain values for that probe. Such missing values can be estimated by several algorithmic approaches. For example, missing values can be imputed by a singular value decomposition (SVD) approach. This takes advantage of the property that even if a sample lacks values for some probes, it contains values for many other probes that are common across samples. SVD-based imputation uses the similarity of samples with respect to common probes to estimate the expression values of samples lacking probes. Other complementary approaches may include principal component analysis (PCA) and spatial proximity-based methods.
ボックス450に示したように(図4)、例えば、神経行動学的表現型マッピングデータを組み合わせる前に外的バイアスを除去し、シグナル対ノイズ比を向上させるために、データ品質クリーンアップの様々な工程を行ってよい。これらの工程は、対象間の安定性測定基準(示差的な安定性)によって定量化され得るマップの再現性を向上させることができる。工程の例には、次のものが含まれる。(1)発現値は、対象間で組み合わせる前の各対象(すなわち脳)内で(例えば、平均値または中央値によって)正規化することができる。(2)遺伝子発現測定部位は、それらが遺伝子間の発現レベルにおいて例外的に低い他の測定部位との類似性を呈することに基づいてフィルタリングアウトすることができる。(3)空間的発現パターンのシグナル対ノイズ比は、主成分分析(PCA)を介した次元縮退などのデータ処理技術によって向上させることができる。 As indicated in box 450 (FIG. 4), various data quality clean-ups are performed, e.g., to remove external biases and improve signal-to-noise ratios before combining neurobehavioral phenotype mapping data. You can do the process. These steps can improve the reproducibility of the map, which can be quantified by the inter-subject stability metric (differential stability). Examples of steps include: (1) Expression values can be normalized (eg, by mean or median) within each subject (ie, brain) before combining across subjects. (2) Gene expression measurement sites can be filtered out based on their exhibiting exceptionally low similarity in inter-gene expression levels to other measurement sites. (3) The signal-to-noise ratio of spatial expression patterns can be enhanced by data processing techniques such as dimensionality reduction via principal component analysis (PCA).
例えば、同じ表面頂点にマッピングされたサンプルの発現レベルは平均化され得る。しかしながら、生のAHBAデータセットを使用すると、更なる課題が提示され得る。その課題には、更なる前処理によって対処することができる。例えば、いくつかの状況において、AHBAサンプルにわたる平均発現レベルにバイアスがある場合があり、これは補正されるべきである。したがって、全遺伝子プローブにわたって、残りの各サンプルにおける発現レベルから平均値を引いてzスコア化による正規化を行い、データ値の全体平均値におけるサンプル間の変動(これは実験的アーチファクトによって駆動され得る)を補正することができる。 For example, the expression levels of samples mapped to the same surface vertex can be averaged. However, using the raw AHBA dataset can present additional challenges. The problem can be addressed by further pretreatment. For example, in some situations there may be a bias in mean expression levels across AHBA samples, which should be corrected. Therefore, across all gene probes, expression levels in each of the remaining samples were normalized by z-scoring by subtracting the mean, resulting in sample-to-sample variation in the overall mean of data values (which can be driven by experimental artifacts). ) can be corrected.
ボックス460に示したように(図4)、脳全体マップの生成は、脳構造(例えば、皮質または視床)内の空間的近接性に基づいた、低密度サンプルから、直接的にサンプリングされない他の脳領域への内挿を必要とする。これらのマップは、「高密度」または「区画化された」レベルで算出され得る。 As shown in box 460 (FIG. 4), the generation of a whole-brain map is based on spatial proximity within brain structures (e.g., cortex or thalamus) from sparse samples to other not directly sampled samples. Requires interpolation to brain regions. These maps can be computed at a "dense" or "compartmentalized" level.
内挿には複数の方法が使用され得る。例えば、区画化された皮質マップを生成するための「Burt」の方法は次の通りである。対象のネイティブな表面メッシュ上にマッピングされた皮質サンプルを使用して、HCPのMMP1.0による皮質区画化における180個の片側区画の各々の発現プロファイルを、次の2つの方法のうちの1つにおいて計算することができる。(i)区画の構成要素である表面頂点のうちの1つに直接マッピングされたサンプルが少なくとも1つあった区画では、区画に直接マッピングされた全サンプルで発現レベルを平均化することにより、区画化された発現値を計算することができる。(ii)区画の構成要素である頂点のうちのいずれかにマッピングされたサンプルがなかった区画では、まず、密に内挿された発現マップを作成する。このマップにおいて、ネイティブな表面メッシュにおける各頂点には、各対象の皮質表面メッシュに沿った表面ベースの測地的距離(すなわち、Voronoi図アプローチ)を使用して決定された、サンプルが直接マッピングされた最も近位の表面頂点に関連する発現レベルが割り当てられる。次いで、重み付き平均化を行うのと事実上同様に、区画の構成要素である頂点間の発現レベルの平均を計算して、区画化された発現値を得る。 Several methods can be used for interpolation. For example, Burt's method for generating compartmentalized cortical maps is as follows. Using cortical samples mapped onto the subject's native surface mesh, the expression profile of each of the 180 unilateral compartments in the MMP1.0 cortical compartmentalization of HCP was analyzed in one of two ways: can be calculated in (i) in compartments where there was at least one sample directly mapped to one of the constituent surface vertices of the compartment, the compartment A normalized expression value can be calculated. (ii) In those segments where there were no samples mapped to any of the component vertices of the segment, first create a densely interpolated expression map. In this map, each vertex in the native surface mesh was directly mapped with samples determined using surface-based geodesic distances (i.e., the Voronoi map approach) along the cortical surface mesh of each subject. Expression levels associated with the most proximal surface vertex are assigned. The mean of expression levels between the constituent vertices of a compartment is then calculated to obtain a compartmentalized expression value, effectively similar to weighted averaging.
高密度皮質マップは、皮質表面のVoronoi分割から直接生成され得る。皮質表面に沿ったサンプルからの増加する測地的距離を用いる(例えば、遺伝子発現の空間的自己相関構造によって決定される特徴的な長さ定数を用いる)指数関数的減衰に基づいた重み付き平均化を含め、他の方法を使用してもよい。 Dense cortical maps can be generated directly from the Voronoi division of the cortical surface. Weighted averaging based on exponential decay using increasing geodesic distances from the sample along the cortical surface (e.g. using a characteristic length constant determined by the spatial autocorrelation structure of gene expression) Other methods may be used, including
皮質下構造の遺伝子発現マップは、区画化されたレベルで計算されても、または密なレベルで計算されてもよい。これは、区画化が3次元のボクセルのセットとして定義され、距離が表面に沿った測地的距離ではなくユークリッド距離とみなされることを除いては、上述した皮質の場合と同様の手順に従う。 Gene expression maps of subcortical structures may be computed at a compartmentalized level or at a dense level. This follows a similar procedure as for the cortex described above, except that the segmentation is defined as a set of three-dimensional voxels and the distances are considered Euclidean rather than geodesic distances along the surface.
高密度マップ及び区画化されたマップは、皮質内の全ての灰白質内座標への遺伝子発現値の内挿を含む。この内挿を行うには、複数の方法を使用することができる。例えば、Voronoi図を構築し、各灰白質内座標をその最も近いAHBAサンプル部位に割り当て、次いでこのサンプルの遺伝子発現値を、これらの灰白質内座標に与える。皮質表面に沿ったサンプルからの増加する測地的距離を用いる(例えば、遺伝子発現の空間的自己相関構造によって決定される特徴的な長さ定数を用いる)指数関数的減衰に基づいた重み付き平均化を含め、他の方法を使用してもよい。これにより高密度マップがもたらされる。区画化されたマップを作成するには、例えば、Connectome WorkbenchソフトウェアまたはCIFTIフォーマットを読み取ることができる任意の他のマトリクス操作ソフトウェア(例えばMatlab、R統計計算環境、Octave、Pythonなど)を使用したCIFTI定義された区画化により、高密度マップを区画化することができる。例えば、HCPチームによる新たな皮質区画化を使用してもよい。Glasser et al.,A multi-modal parcellation of human cerebral cortex,NATURE 536:171-8(2016)(「Glasser」)。遺伝子発現を含む区画について、1つの方法は、その区画内のサンプルの平均としての区画値を割り当てることであり、これは、重み付き平均(例えば、区画内のサンプルの相対的なVoronoi図適用範囲に基づくもの)であり得る。 Dense and compartmentalized maps include interpolation of gene expression values to all gray matter coordinates within the cortex. Several methods can be used to perform this interpolation. For example, a Voronoi map is constructed, assigning each gray matter coordinate to its nearest AHBA sample site, and then the gene expression values for this sample are given to these gray matter coordinates. Weighted averaging based on exponential decay using increasing geodesic distances from the sample along the cortical surface (e.g. using a characteristic length constant determined by the spatial autocorrelation structure of gene expression) Other methods may be used, including This results in a high density map. To create a compartmentalized map, define CIFTI using, for example, Connectome Workbench software or any other matrix manipulation software that can read the CIFTI format (e.g. Matlab, R statistical computing environment, Octave, Python, etc.) A high-density map can be partitioned due to the partitioned partitioning. For example, new cortical compartmentalization by the HCP team may be used. Glasser et al. , A multi-modal parcellation of human cerebral cortex, NATURE 536:171-8 (2016) (“Glasser”). For compartments containing gene expression, one method is to assign the compartment value as the average of the samples within that compartment, which is a weighted average (e.g., the relative Voronoi diagram coverage of samples within the compartment). based on).
前述のように、AHBAに寄与する各個々の対象の皮質及び皮質下のセグメンテーションを、それらの高解像度の構造の死後スキャンに基づいて明確に計算することにより、更なる座標を測定部位に割り当てることができる。次に、そのようなセグメンテーションを活用して、皮質メッシュ及び皮質下の解剖学的核の割り当てを計算することができる。次にこのメッシュが、近接性を伴って表面を形成し、次いでこの近接性を各個々の対象について算出すると、対象特異的な座標セットを得ることができる。次に、表面ベースの特徴を使用し、かかる皮質表面メッシュを、グループアトラスに対して対象間でアラインすることができる。このことは、対象レベルでその解剖所見に基づいて定義され、次に所与のグループアトラスに対してアラインされ得る、皮質下の発現部位にも適用される。この空間変換の後、各対象の個々の座標をアライメントさせる。次に、特定の部位レベルで、その部位における遺伝子発現に対する特定の座標を使用して、分析を進めることができる。神経画像処理マップは、関連性のある皮質部位及び皮質下部位も捕捉することができる。 Assigning additional coordinates to the measurement sites by explicitly calculating the cortical and subcortical segmentations of each individual subject contributing to AHBA, as described above, based on postmortem scans of their high-resolution structures. can be done. Such segmentation can then be leveraged to compute cortical mesh and subcortical anatomical nucleus assignments. This mesh then forms a surface with the proximity, which can then be calculated for each individual object to obtain an object-specific set of coordinates. Surface-based features can then be used to align such cortical surface meshes across subjects against a group atlas. This also applies to subcortical sites of expression, which can be defined on the basis of their anatomy at the subject level and then aligned to a given group atlas. After this spatial transformation, the individual coordinates of each object are aligned. Analysis can then proceed at a specific site level, using specific coordinates for gene expression at that site. Neuroimaging maps can also capture relevant cortical and subcortical regions.
反対に、連続的な「高密度」マップ及び離散的な「区画化された」マップは、ネイティブ解像度における所与の高密度マップまたは所与の離散的な区画/領野のいずれかにおける所与の皮質部位に遺伝子発現値を割り当てることを含む。この割り当てのための方法例には、次のものが含まれる。(1)遺伝子発現が測定される部位、すなわち遺伝子発現測定部位との近接性に基づいた所与のマップ部位への値の割り当て。これは、例えばVoronoi図の構築による、例えば最近接点割り当てを介して行うことができる。(2)例えば、皮質表面に沿った遺伝子発現測定部位からの距離により重み付けされた、遺伝子発現が測定される部位への近接性に基づいたマップ部位への加重和による割り当て。(3)所与の区画化による区画境界内にある遺伝子発現測定部位間の加重和による割り当て。 Conversely, a continuous "dense" map and a discrete "compartmentalized" map are either a given high-density map at native resolution or a given Including assigning gene expression values to cortical sites. Example methods for this assignment include the following. (1) Assignment of a value to a given map site based on its proximity to the sites where gene expression is measured, ie gene expression measurement sites. This can be done for example via nearest point assignment, for example by constructing a Voronoi diagram. (2) Weighted sum assignment to map sites based on proximity to sites where gene expression is measured, eg, weighted by distance from the gene expression measurement sites along the cortical surface. (3) Weighted sum assignment between gene expression measurement sites within the compartment boundaries of a given compartmentalization.
皮質下遺伝子発現データは、皮質下部位または領域に値を割り当てるために使用され得る。この割り当てのための方法としては、神経解剖学的評価によるラベル付け、皮質下領域の区画内の加重和、または他の形態の解剖学的もしくは機能的部位の割り当てが挙げられる。 Subcortical gene expression data can be used to assign values to subcortical sites or regions. Methods for this assignment include labeling by neuroanatomical assessment, intra-compartmental weighted sums of subcortical regions, or other forms of anatomical or functional site assignment.
本発明のプラットフォームは、双方向的に機能することができる。遺伝子(または薬物標的)から表現型への方向(図5A)もしくは表現型から遺伝子(または薬物標的)への方向(図5B)、または遺伝子から遺伝子への方向(図5C)である。図5Aに関して、このプラットフォームは、所与の目的の薬物標的に関する遺伝子発現マップと特徴的脳マップ(神経行動学的表現型マッピングデータ)がアラインされる、1つ以上の神経行動学的表現型を同定することができる。この方向は、表現型と結び付けられる神経画像処理マップのデータベースが大きいほど益々強力になる。目標は、遺伝子または薬物標的から始めて、遺伝子発現マップを同定し、次にこれを使用して、その遺伝子発現マップと統計的にアラインする1つ以上の神経行動学的表現型を同定することである。これは次に、遺伝子または薬物標的から同定される神経行動学的表現型をもたらし得る。 The platform of the present invention can function bi-directionally. Gene (or drug target) to phenotype (Figure 5A) or phenotype to gene (or drug target) (Figure 5B), or gene to gene (Figure 5C). With reference to FIG. 5A, this platform generates one or more neurobehavioral phenotypes to which gene expression maps and characteristic brain maps (neurobehavioral phenotype mapping data) for a given drug target of interest are aligned. can be identified. This direction becomes all the more powerful the larger the database of neuroimaging maps associated with phenotypes. The goal is to start with a gene or drug target, identify a gene expression map, and then use this to identify one or more neurobehavioral phenotypes that align statistically with the gene expression map. be. This in turn can lead to neurobehavioral phenotypes identified from genetic or drug targets.
具体的に言うと、遺伝子が同定される(ボックス502)。これは、選択された薬物または薬物標的との関連性に基づいて遺伝子を選択することを含み得る。同定された遺伝子についての遺伝子発現マッピングデータと、1つ以上の表現型についての神経行動学的表現型マッピングとが得られる(ボックス504)。同定された遺伝子についての遺伝子発現マッピングデータを、各ペアの各表現型についての神経行動学的表現型マッピングデータと接触させて相関付けることにより、各遺伝子-表現型ペアそれぞれについてのスコアが生成される(ボックス506)。遺伝子-表現型ペアが、それらに対応するスコアに基づいてランク付けされる(ボックス508)。そして、選択された遺伝子(または薬物もしくは薬物標的)について、最もスコアの高いペアが同定される(ボックス510)。 Specifically, genes are identified (box 502). This may involve selecting genes based on their relevance to the drug or drug target of choice. Gene expression mapping data for the identified genes and neurobehavioral phenotype mapping for one or more phenotypes are obtained (box 504). A score for each gene-phenotype pair is generated by contacting and correlating the gene expression mapping data for the identified genes with the neurobehavioral phenotype mapping data for each phenotype of each pair. (box 506). Gene-phenotype pairs are ranked based on their corresponding scores (box 508). The highest scoring pair is then identified for the selected gene (or drug or drug target) (box 510).
反対に、表現型から遺伝子(または薬物標的)への方向(図5B)では、このプラットフォームは、関連する遺伝子発現マップが、所与の目的の神経行動学的表現型に関連する脳マップ(神経行動学的表現型マッピングデータ)と接触及びアラインされる、遺伝子または薬物標的を同定することができる。目標は、特定の神経行動学的表現型から始めて、その神経行動学的表現型と統計的にアラインする1つ以上の遺伝子発現マップを同定し、次にこれを使用して、これらの同定された遺伝子発現マップとどの薬物標的がアラインするかを同定することである。これは次に、神経行動学的表現型から同定される薬物標的をもたらし得る。 Conversely, in the phenotype-to-gene (or drug-target) direction (Fig. 5B), the platform predicts that relevant gene expression maps are associated with a given neurobehavioral phenotype of interest (neurobehavioral phenotype). Gene or drug targets that are contacted and aligned with behavioral phenotype mapping data) can be identified. The goal is to start with a particular neurobehavioral phenotype, identify one or more gene expression maps that statistically align with that neurobehavioral phenotype, and then use this to identify these identified phenotypes. to identify which drug targets align with the gene expression map obtained. This in turn can lead to drug targets identified from neurobehavioral phenotypes.
具体的に言うと、神経行動学的表現型が選択される(ボックス512)。選択された表現型についての神経行動学的表現型マッピングと、1つ以上の遺伝子についての遺伝子発現マッピングデータとが得られる(ボックス514)。選択された神経行動学的表現型についての神経行動学的マッピングデータを、各ペアの各遺伝子についての遺伝子発現マッピングデータと接触させて相関付けることにより、各表現型-遺伝子ペアそれぞれについてのスコアが生成される(ボックス516)。表現型-遺伝子ペアが、それらに対応するスコアに基づいてランク付けされる(ボックス518)。そして、選択された神経行動学的表現型について、最もスコアの高いペアに関連する遺伝子(または薬物標的)が同定される(ボックス520)。 Specifically, a neurobehavioral phenotype is selected (box 512). Neurobehavioral phenotype mapping for the selected phenotype and gene expression mapping data for one or more genes are obtained (box 514). By contacting and correlating the neurobehavioral mapping data for the selected neurobehavioral phenotypes with the gene expression mapping data for each gene in each pair, a score for each phenotype-gene pair is obtained. generated (box 516). Phenotype-gene pairs are ranked based on their corresponding scores (box 518). The genes (or drug targets) associated with the highest scoring pairs are then identified for the selected neurobehavioral phenotype (box 520).
いくつかの実施形態では、遺伝子から遺伝子への方向(図5C)において、このプラットフォームは、関連する遺伝子発現マップが、他の遺伝子または薬物標的の遺伝子発現マップと接触及びアラインされる、遺伝子または薬物標的を同定することができる。目標は、特定の遺伝子から始めて、その特定の遺伝子と統計的にアラインする他の遺伝子についての1つ以上の遺伝子発現マップを同定し、次にこれを使用して、これらの同定された遺伝子発現マップとどの薬物標的がアラインするかを同定することである。これは次に、他の遺伝子から同定される薬物標的をもたらし得る。 In some embodiments, in the gene-to-gene direction (FIG. 5C), the platform provides gene or drug target gene expression maps whose associated gene expression maps are contacted and aligned with those of other genes or drug targets. Targets can be identified. Starting with a particular gene, the goal is to identify one or more gene expression maps for other genes that align statistically with that particular gene, which are then used to map these identified gene expression The challenge is to identify which drug targets align with the map. This in turn may lead to drug targets identified from other genes.
具体的に言うと、遺伝子が選択される(ボックス522)。選択された遺伝子についての遺伝子発現マッピングと、1つ以上の他の遺伝子についての遺伝子発現マッピングデータとが得られる(ボックス524)。選択された遺伝子についての遺伝子発現マッピングデータを、各ペアの他の遺伝子それぞれについての遺伝子発現マッピングデータと接触させて相関付けることにより、各遺伝子-遺伝子ペアそれぞれについてのスコアが生成される(ボックス526)。遺伝子-遺伝子ペアが、それらに対応するスコアに基づいてランク付けされる(ボックス528)。そして、選択された遺伝子について、最もスコアの高いペアに関連する遺伝子(または薬物標的)が同定される(ボックス530)。 Specifically, a gene is selected (box 522). Gene expression mapping for the selected gene and gene expression mapping data for one or more other genes are obtained (box 524). A score is generated for each gene-gene pair by contacting and correlating the gene expression mapping data for the selected gene with the gene expression mapping data for each of the other genes in each pair (box 526). ). Gene-gene pairs are ranked based on their corresponding scores (box 528). Then, for the selected genes, the gene (or drug target) associated with the highest scoring pair is identified (box 530).
いくつかの実施形態では、過去に生成された表現型-遺伝子ペアトポグラフィが、特定の個人に関する複数の遺伝子または薬物標的から遺伝子または薬物標的を同定するために利用され得る。例えば、個々の対象の神経画像処理が得られ、神経表現型トポグラフィが生成され得る。次いで、この神経表現型トポグラフィが、複数の過去に生成された表現型-遺伝子ペアトポグラフィと(本明細書に記載のように生成される場合に)比較される。次いで、個人の神経行動学的表現型トポグラフィと最も近くアラインする標的表現型-遺伝子ペアトポグラフィが選択される。標的表現型-遺伝子ペアトポグラフィを生成するために使用された対応する遺伝子型トポグラフィが同定され、その対応する遺伝子が選択される。次いで、この遺伝子の選択から、選択された遺伝子に関連する薬物標的が、その個人に対する特定の薬物標的として選択される。 In some embodiments, a previously generated phenotype-gene pair topography can be utilized to identify a gene or drug target from multiple gene or drug targets for a particular individual. For example, neuroimaging of individual subjects can be obtained and a neurophenotype topography generated. This neurophenotype topography is then compared (when generated as described herein) to a plurality of previously generated phenotype-gene pair topographies. The target phenotype-gene pair topography that most closely aligns with the individual's neurobehavioral phenotype topography is then selected. The corresponding genotype topography used to generate the target phenotype-gene pair topography is identified and its corresponding gene is selected. From this selection of genes, drug targets associated with the selected genes are then selected as specific drug targets for that individual.
他の実施形態では、過去に生成された遺伝子-表現型ペアトポグラフィが、特定の薬物または薬物標的に関する個人を同定するために利用され得る。例えば、選択された薬物標的に関連する遺伝子についての遺伝子型トポグラフィが生成され得る。次いで、この遺伝子型トポグラフィが、複数の過去に生成された遺伝子-表現型ペアトポグラフィと(本明細書に記載のように生成される場合に)比較される。次いで、遺伝子型トポグラフィと最も近くアラインする標的遺伝子-表現型ペアトポグラフィが選択される。次いで、個人の神経行動学的表現型マッピングデータが、標的遺伝子-表現型ペアトポグラフィと比較され、神経行動学的表現型マッピングデータが標的遺伝子-表現型ペアトポグラフィと(閾値レベル以内で)アラインする個人が、選択された薬物標的が有効であり得る候補として選択される。 In other embodiments, previously generated gene-phenotype pair topographies can be utilized to identify individuals for specific drugs or drug targets. For example, a genotypic topography can be generated for genes associated with a selected drug target. This genotype topography is then compared to a plurality of previously generated gene-phenotype pair topographies (if generated as described herein). The target gene-phenotype pair topography that most closely aligns with the genotype topography is then selected. The individual's neurobehavioral phenotype mapping data is then compared to the target gene-phenotype pair topography, and the neurobehavioral phenotype mapping data is aligned (within a threshold level) with the target gene-phenotype pair topography. Individuals are selected as candidates for whom the selected drug target may be effective.
このようにして、対象の神経行動学的表現型を検知、診断、予測、予知、または処置するために、個々の対象の神経画像処理データ及び/または遺伝子発現データを、過去に生成されたトポグラフィペアと接触/アラインさせることができる。 In this way, the neuroimaging data and/or gene expression data of an individual subject can be combined with previously generated topography to detect, diagnose, predict, prognose, or treat the subject's neurobehavioral phenotype. Pairs can be contacted/aligned.
本明細書に記載の実施形態の実装は、1つ以上のコンピューティングデバイスまたはシステムによって行うことができる。本明細書に記載のかかる実施形態を実装するには、1つ以上の特殊用途のコンピューティングシステムが使用され得る。したがって、本明細書に記載の様々な実施形態は、ソフトウェア、ハードウェア、ファームウェア、またはそれらの何らかの組み合わせにおいて実装され得る。そのようなコンピューティングシステムは、メモリまたは他のコンピュータ可読媒体、1つ以上のプロセッサ、ディスプレイデバイス、ネットワークインターフェース、他のインプット/アウトプット(I/O)インターフェース、及び他の構成要素を含む。 Implementation of the embodiments described herein can be done by one or more computing devices or systems. One or more special purpose computing systems may be used to implement such embodiments described herein. Accordingly, various embodiments described herein may be implemented in software, hardware, firmware, or some combination thereof. Such computing systems include memory or other computer-readable media, one or more processors, display devices, network interfaces, other input/output (I/O) interfaces, and other components.
1つ以上のプロセッサは、本明細書に記載される少なくともいくつかの実施形態を含む動作を実施するためのコンピュータ命令を実行する処理デバイス(複数可)を含む。様々な実施形態において、プロセッサは、1つ以上の中央処理装置(CPU)、プログラマブル論理、または他の処理回路網を含み得る。 The one or more processors comprise processing device(s) that execute computer instructions to perform operations, including at least some embodiments described herein. In various embodiments, a processor may include one or more central processing units (CPUs), programmable logic, or other processing circuitry.
メモリは、1つ以上の様々なタイプの不揮発性及び/または揮発性記憶技術を含み得る。そのようなメモリの例としては、フラッシュメモリ、ハードディスクドライブ、光学ドライブ、ソリッドステートドライブ、様々なタイプのランダムアクセスメモリ(RAM)、様々なタイプの読出し専用メモリ(ROM)、他のコンピュータ可読記憶媒体(プロセッサ可読記憶媒体ともいう)、もしくは他のメモリ技術、またはそれらの任意の組み合わせが挙げられるが、これらに限定されない。メモリは、本明細書に記載される少なくともいくつかの実施形態を含む動作を実施するために1つ以上のプロセッサによって利用されるコンピュータ可読命令などの情報を記憶するために利用され得る。メモリは、他のプログラム及び他のコンテンツ、例えばオペレーティングシステム、ユーザアプリケーション、他のコンピュータプログラム、神経行動学的表現型マッピングデータ、遺伝子発現マッピングデータ、生成された神経表現型トポグラフィ、及びスコア/ランキング、または他のデータを記憶してもよい。コンピューティングシステムは、他のタイプの固定型または取り外し可能型のコンピュータ可読媒体、例えば取り外し可能型フラッシュドライブ、外付けハードドライブなどを含み得る、他のコンピュータ可読媒体を含んでもよい。 Memory may include one or more of various types of non-volatile and/or volatile storage technologies. Examples of such memory include flash memory, hard disk drives, optical drives, solid state drives, various types of random access memory (RAM), various types of read only memory (ROM), and other computer readable storage media. (also referred to as processor-readable storage media), or other memory technologies, or any combination thereof. Memory may be utilized to store information, such as computer readable instructions, utilized by one or more processors to perform operations, including at least some embodiments described herein. The memory stores other programs and other content, such as operating systems, user applications, other computer programs, neurobehavioral phenotype mapping data, gene expression mapping data, generated neurophenotype topographies, and scores/rankings; Or other data may be stored. A computing system may include other computer-readable media, which may include other types of fixed or removable computer-readable media, such as removable flash drives, external hard drives, and the like.
ディスプレイデバイスは、神経表現型トポグラフィ、スコア、薬物標的または神経行動学的表現型の選択などのコンテンツをユーザのためにレンダリングすることができる任意のディスプレイデバイスである。そのようなディスプレイデバイスの例は、液晶ディスプレイ、発光ダイオード、または他のタイプのディスプレイデバイスを含んでよく、ユーザの手、スタイラス、または他の物体からインプットを受信することができるタッチ式スクリーンを含んでよい。 The display device is any display device capable of rendering content for a user, such as neurophenotype topography, scores, drug targets or neurobehavioral phenotype selections. Examples of such display devices may include liquid crystal displays, light emitting diodes, or other types of display devices, and include touch screens capable of receiving input from a user's hand, stylus, or other object. OK.
ネットワークインターフェースは、有線または無線の通信ネットワークを介して他のコンピューティングデバイスと通信するように構成されている。そのようなネットワークインターフェースには、限定されるものではないが、遺伝子発現マッピングデータまたは神経行動学的表現型マッピングデータなどのデータを送信及び受信するための送信機及び受信機が含まれる。他のI/Oインターフェースは、様々な他のインプットデバイスまたはアウトプットデバイスのためのインターフェース、例えば音声インターフェース、他のビデオインターフェース、USBインターフェース、物理的ボタン、キーボードなどを含み得る。 A network interface is configured to communicate with other computing devices over a wired or wireless communication network. Such network interfaces include, but are not limited to, transmitters and receivers for transmitting and receiving data such as gene expression mapping data or neurobehavioral phenotype mapping data. Other I/O interfaces may include interfaces for various other input or output devices, such as audio interfaces, other video interfaces, USB interfaces, physical buttons, keyboards, and the like.
いくつかの実施形態では、本発明のプラットフォームは、コンピューティングデバイスであって、コンピュータ命令を記憶するメモリと、プロセッサとを備え、プロセッサが、コンピュータ命令を実行するとき、選択された神経行動学的表現型についての神経表現型トポグラフィを、選択された神経行動学的表現型についての神経行動学的表現型マッピングデータに基づいて生成する動作;複数の遺伝子のうちの各遺伝子それぞれについての遺伝子型トポグラフィを、各遺伝子についての遺伝子発現マッピングデータに基づいて生成する動作;選択された神経行動学的表現型と複数の遺伝子との間の複数の表現型-遺伝子ペアトポグラフィを定める動作であって、各表現型-遺伝子ペアそれぞれについての各表現型-遺伝子ペアトポグラフィが、選択された神経行動学的表現型の神経表現型トポグラフィと、各表現型-遺伝子ペアについての各遺伝子の遺伝子型トポグラフィとに基づいて定められる、動作;複数の表現型-遺伝子ペアトポグラフィのうちの各々についての定量的スコアを、選択された神経行動学的表現型の神経表現型トポグラフィと、各表現型-遺伝子ペアについての各遺伝子の遺伝子型トポグラフィとの間の相関関係に基づいて決定する動作;選択された閾値を超えるスコアをそれぞれ有する、複数の表現型-遺伝子ペアトポグラフィのうちの1つ以上を選択する動作;及び、選択された1つ以上の表現型-遺伝子ペアトポグラフィのそれぞれの遺伝子をユーザに表示する動作を実施する、コンピューティングデバイスを含む。ある実施形態では、プロセッサは、コンピュータ命令を実行するとき、選択された1つ以上の表現型-遺伝子ペアトポグラフィのそれぞれの遺伝子に関連するそれぞれの神経薬物標的を1つ以上同定する動作を更に実施する。ある実施形態では、プロセッサは、選択された神経行動学的表現型を有する複数の人々のうちの各々についての神経行動学的表現型マッピングデータから神経表現型トポグラフィを生成するための更なるコンピュータ命令を実行することにより、神経表現型トポグラフィを生成する。ある実施形態では、プロセッサは、各遺伝子についての遺伝子発現マッピングデータと神経行動学的表現型マッピングデータとの間のアライメントに基づいて各表現型-遺伝子ペアトポグラフィについての統計的有意性を決定するための更なるコンピュータ命令を実行することにより、複数の表現型-遺伝子ペアトポグラフィのうちの各々についてのスコアを決定する。ある実施形態では、プロセッサは、選択された神経行動学的表現型の神経表現型トポグラフィと、標的表現型-遺伝子ペアトポグラフィについての各遺伝子の遺伝子型トポグラフィとの間の決定された関連性の程度が最も高い標的表現型-遺伝子ペアトポグラフィを選択するための更なるコンピュータ命令を実行することにより、1つ以上の表現型-遺伝子ペアトポグラフィを選択する。ある実施形態では、複数の遺伝子のうちの各々についての遺伝子発現マッピングデータは、選択された神経行動学的表現型を有しない複数の人々からの複数の遺伝子発現に関する遺伝子発現マッピングデータを含む。ある実施形態では、プロセッサは、複数の人々の複数の遺伝子発現における複数の遺伝子のうちの各々についての代表的プローブを選択するための更なるコンピュータ命令を実行することにより、各遺伝子それぞれについての遺伝子型トポグラフィを生成する。ある実施形態では、プロセッサは、遺伝子発現マッピングサンプルを脳構造における部位にマッピングするための更なるコンピュータ命令を実行することにより、各遺伝子それぞれについての遺伝子型トポグラフィを生成する。ある実施形態では、プロセッサは、バックグラウンドシグナルを超える閾値レベル未満の発現レベル測定値を有するサンプルを除外することによって遺伝子発現マッピングサンプルをフィルタリングするための更なるコンピュータ命令を実行することにより、各遺伝子それぞれについての遺伝子型トポグラフィを生成する。ある実施形態では、プロセッサは、プローブ値が欠損している遺伝子発現マッピングサンプルにおいてプローブ値を補完するための更なるコンピュータ命令を実行することにより、各遺伝子それぞれについての遺伝子型トポグラフィを生成する。ある実施形態では、プロセッサは、遺伝子発現マッピングデータから外的バイアスを除去するための更なるコンピュータ命令を実行することにより、各遺伝子それぞれについての遺伝子型トポグラフィを生成する。ある実施形態では、プロセッサは、遺伝子発現マッピングデータを捕捉するために使用される遺伝子プローブにわたって平均値除去及びzスコア正規化を行うための更なるコンピュータ命令を実行することにより、外的バイアスを除去する。ある実施形態では、プロセッサは、遺伝子発現マッピングデータにおけるシグナル対ノイズ比を高めるための更なるコンピュータ命令を実行することにより、各遺伝子それぞれについての遺伝子型トポグラフィを生成する。ある実施形態では、プロセッサは、同じ表面頂点上にマッピングされたサンプルに関する遺伝子発現マッピングデータの発現レベルを平均化するための更なるコンピュータ命令を実行することにより、シグナル対ノイズ比を高める。ある実施形態では、プロセッサは、低密度遺伝子発現サンプルを、サンプリングされた脳領域から、他のサンプリングされていない脳領域に内挿するための更なるコンピュータ命令を実行することにより、各遺伝子それぞれについての遺伝子型トポグラフィを生成する。ある実施形態では、プロセッサは、区画化された皮質マップもしくは皮質下マップ、または高密度の皮質マップもしくは皮質下マップのうちの少なくとも1つを生成するための更なるコンピュータ命令を実行することにより、低密度遺伝子発現サンプルを内挿する。ある実施形態では、プロセッサは、遺伝子発現マッピングデータにおける複数の脳領域のうちの各々に重み値を割り当てるための更なるコンピュータ命令を実行することにより、各遺伝子それぞれについての遺伝子型トポグラフィを生成する。ある実施形態では、プロセッサは、神経行動学的表現型マッピングデータにおける複数の脳領域のうちの各々に重み値を割り当てるための更なるコンピュータ命令を実行することにより、神経行動学的トポグラフィを生成する。ある実施形態では、プロセッサは、神経行動学的表現型マッピングデータにおける複数の脳領域のうちの第1の脳領域セットに対して閾値を超える第1の重み値セットを割り当て、かつ、神経行動学的表現型マッピングデータにおける複数の脳領域のうちの第2の脳領域セットに対して閾値未満の第2の重み値セットを割り当てるための、更なるコンピュータ命令を実行することにより、複数の脳領域のうちの各々に重み値を割り当てる。ある実施形態では、プロセッサは、標的脳領域に関連する情報を神経行動学的表現型マッピングデータから除去するように、複数の脳領域のうちの標的脳領域にマスキング重み値を割り当てるための更なるコンピュータ命令を実行することにより、複数の脳領域のうちの各々に重み値を割り当てる。ある実施形態では、プロセッサは、神経行動学的表現型トポグラフィと、遺伝子の組み合わせに関する遺伝子型トポグラフィの組み合わせとの間の少なくとも1つの組み合わせ表現型-遺伝子ペアトポグラフィを定めるための更なるコンピュータ命令を実行することにより、複数の表現型-遺伝子ペアトポグラフィを定める。ある実施形態では、プロセッサは、コンピュータ命令を実行するとき、選択された閾値を超えるスコアをそれぞれ有する、複数の表現型-遺伝子ペアトポグラフィのうちの1つ以上として、少なくとも1つの組み合わせ表現型-遺伝子ペアトポグラフィを選択する動作と、遺伝子の組み合わせをユーザに表示する動作とを更に行う。ある実施形態では、プロセッサは、コンピュータ命令を実行するとき、個々の遺伝子または神経薬物標的それぞれについての遺伝子発現マッピングデータと神経行動学的表現型マッピングデータとのアライメントと比べて向上した神経行動学的表現型マッピングデータとのアライメントを呈する遺伝子発現マッピングデータを組み合わせることにより、遺伝子または神経薬物標的の組み合わせを同定する動作を更に実施する。ある実施形態では、神経行動学的表現型マッピングデータは、脳障害、症状、または認知プロセスのうちの1つに関するものである。 In some embodiments, a platform of the invention is a computing device comprising a memory storing computer instructions and a processor, wherein when the processor executes the computer instructions, the selected neurobehavioral An act of generating a neurophenotypic topography for a phenotype based on neurobehavioral mapping data for a selected neurobehavioral phenotype; a genotypic topography for each gene of a plurality of genes. based on the gene expression mapping data for each gene; defining a plurality of phenotype-gene pair topographies between the selected neurobehavioral phenotype and the plurality of genes, wherein each Each phenotype-gene pair topography for each phenotype-gene pair is based on the neurophenotypic topography of the selected neurobehavioral phenotype and the genotype topography of each gene for each phenotype-gene pair. a quantitative score for each of a plurality of phenotype-gene pair topographies, the neurophenotype topography of the selected neurobehavioral phenotype, and each score for each phenotype-gene pair. an act of determining based on correlations between genotypic topographies of genes; an act of selecting one or more of a plurality of phenotype-gene pair topographies each having a score above a selected threshold; and A computing device is included that performs the operation of displaying to a user each gene of one or more selected phenotype-gene pair topographies. In an embodiment, the processor, when executing the computer instructions, further performs the act of identifying one or more respective neurodrug targets associated with respective genes of the one or more selected phenotype-gene pair topographies. do. In an embodiment, the processor further computer instructions for generating a neurophenotype topography from the neurobehavioral phenotype mapping data for each of the plurality of people having the selected neurobehavioral phenotype. Generate a neural phenotype topography by performing In an embodiment, the processor determines statistical significance for each phenotype-gene pair topography based on the alignment between the gene expression mapping data and the neurobehavioral phenotype mapping data for each gene. A score for each of the plurality of phenotype-gene pair topographies is determined by executing the additional computer instructions of . In an embodiment, the processor calculates the determined degree of association between the neurophenotypic topography of the selected neurobehavioral phenotype and the genotypic topography of each gene for the target phenotype-gene pair topography. Select one or more phenotype-gene pair topographies by executing further computer instructions to select the target phenotype-gene pair topographies with the highest . In certain embodiments, the gene expression mapping data for each of the multiple genes comprises gene expression mapping data for multiple gene expression from multiple people without the selected neurobehavioral phenotype. In some embodiments, the processor selects representative probes for each of the plurality of genes in the plurality of gene expressions of the plurality of people by executing further computer instructions to select representative probes for each of the plurality of genes. Generate type topography. In one embodiment, the processor generates a genotypic topography for each respective gene by executing further computer instructions to map the gene expression mapping samples to sites in brain structures. In an embodiment, the processor performs further computer instructions to filter the gene expression mapping samples by excluding samples with expression level measurements below a threshold level above background signal, thereby Generate a genotypic topography for each. In one embodiment, the processor generates a genotypic topography for each respective gene by executing additional computer instructions to impute probe values in gene expression mapping samples lacking probe values. In one embodiment, the processor generates a genotypic topography for each respective gene by executing further computer instructions for removing external biases from the gene expression mapping data. In an embodiment, the processor removes external bias by executing further computer instructions to perform mean removal and z-score normalization over the gene probes used to capture the gene expression mapping data. do. In one embodiment, the processor generates a genotypic topography for each respective gene by executing additional computer instructions for increasing signal-to-noise ratio in the gene expression mapping data. In certain embodiments, the processor enhances the signal-to-noise ratio by executing additional computer instructions to average the expression levels of the gene expression mapping data for samples mapped onto the same surface vertex. In some embodiments, the processor for each gene by executing further computer instructions to interpolate low-density gene expression samples from sampled brain regions to other unsampled brain regions. generate a genotypic topography of In an embodiment, the processor executes further computer instructions to generate at least one of a compartmentalized cortical or subcortical map or a dense cortical or subcortical map; Interpolate low-density gene expression samples. In one embodiment, the processor generates a genotypic topography for each respective gene by executing further computer instructions to assign weight values to each of the plurality of brain regions in the gene expression mapping data. In an embodiment, the processor generates the neurobehavioral topography by executing further computer instructions to assign weight values to each of the plurality of brain regions in the neurobehavioral phenotype mapping data. . In an embodiment, the processor assigns a first set of weight values above a threshold to a first set of brain regions in the neurobehavioral phenotype mapping data; the plurality of brain regions by executing further computer instructions to assign a second set of weight values below the threshold to a second set of the plurality of brain regions in the physical phenotype mapping data; assign a weight value to each of the . In an embodiment, the processor further assigns a masking weight value to a target brain region of the plurality of brain regions so as to remove information associated with the target brain region from the neurobehavioral phenotype mapping data. A weight value is assigned to each of the plurality of brain regions by executing computer instructions. In an embodiment, the processor executes further computer instructions for defining at least one combined phenotype-gene pair topography between a neurobehavioral phenotypic topography and a combination of genotypic topographies for a combination of genes. Define multiple phenotype-gene pair topographies. In an embodiment, the processor, when executing the computer instructions, generates at least one combined phenotype-gene pair topography as one or more of the plurality of phenotype-gene pair topographies, each having a score exceeding a selected threshold. Further acts of selecting a paired topography and displaying the gene combinations to the user are performed. In an embodiment, the processor, when executing the computer instructions, produces improved neurobehavioral mapping data compared to alignment of gene expression mapping data and neurobehavioral phenotype mapping data for each individual gene or neurodrug target. A further act of identifying combinations of genes or neurodrug targets is performed by combining gene expression mapping data exhibiting alignment with phenotype mapping data. In certain embodiments, the neurobehavioral phenotype mapping data relates to one of an encephalopathy, a symptom, or a cognitive process.
いくつかの実施形態では、本発明のプラットフォームは、コンピューティングデバイスによって、選択された神経表現型についての神経表現型マッピングデータを得ること;コンピューティングデバイスによって、1つ以上の遺伝子についての遺伝子発現マッピングデータを得ること;コンピューティングデバイスによって、選択された神経行動学的表現型と1つ以上の遺伝子のうちの各遺伝子との間の各表現型-遺伝子ペアそれぞれについての定量的スコアを、選択された神経行動学的表現型についての神経行動学的表現型マッピングデータと、各表現型-遺伝子ペアの各遺伝子についての遺伝子発現マッピングデータとの間の相関関係に基づいて決定する工程;及び、コンピューティングデバイスによって、各表現型-遺伝子ペアについて決定されたスコアをユーザに提示する工程を含む、方法を含む。 In some embodiments, the platform of the invention obtains neurophenotype mapping data for a selected neurophenotype by a computing device; gene expression mapping for one or more genes by a computing device; Obtaining data; calculating, by a computing device, a quantitative score for each phenotype-gene pair between the selected neurobehavioral phenotype and each of the one or more genes; determining based on the correlation between the neurobehavioral phenotype mapping data for each neurobehavioral phenotype and the gene expression mapping data for each gene of each phenotype-gene pair; presenting to a user the score determined for each phenotype-gene pair by a viewing device.
いくつかの実施形態では、本発明のプラットフォームは、コンピューティングデバイスであって、コンピュータ命令を記憶するメモリと、プロセッサとを備え、プロセッサが、コンピュータ命令を実行するとき、コンピューティングデバイスによって、選択された遺伝子についての遺伝子型トポグラフィを、選択された遺伝子についての遺伝子発現マッピングデータに基づいて生成する動作;コンピューティングデバイスによって、複数の神経行動学的表現型のうちの各神経行動学的表現型それぞれについての神経表現型トポグラフィを、各神経行動学的表現型についての神経行動学的表現型マッピングデータに基づいて生成する動作;コンピューティングデバイスによって、選択された遺伝子と複数の神経行動学的表現型との間の複数の遺伝子-表現型ペアトポグラフィを定める動作であって、各遺伝子-表現型ペアそれぞれについての各遺伝子-表現型ペアトポグラフィが、選択された遺伝子の遺伝子型トポグラフィと、各遺伝子-表現型ペアについての各神経行動学的表現型の神経表現型トポグラフィとに基づいて定められる、動作;コンピューティングデバイスによって、複数の遺伝子-表現型ペアトポグラフィのうちの各々についての定量的スコアを、選択された遺伝子の遺伝子型トポグラフィと、各遺伝子-表現型ペアについての各神経行動学的表現型の神経表現型トポグラフィとの間の相関関係に基づいて決定する動作;選択された閾値を超えるスコアをそれぞれ有する、複数の遺伝子-表現型ペアトポグラフィのうちの1つ以上を選択する動作;選択された1つ以上の遺伝子-表現型ペアトポグラフィの各神経行動学的表現型をユーザに表示する動作を実施する、コンピューティングデバイスを含む。ある実施形態では、プロセッサは、コンピュータ命令を実行するとき、ユーザにより選択された神経薬物標的が、選択された遺伝子に関連することに基づいて、選択された遺伝子を選択する動作を更に実施する。ある実施形態では、プロセッサは、選択された神経行動学的表現型を有する複数の人々のうちの各々についての神経行動学的表現型マッピングデータから神経表現型トポグラフィを生成するための更なるコンピュータ命令を実行することにより、神経表現型トポグラフィを生成する。ある実施形態では、プロセッサは、各神経行動学的表現型についての神経行動学的表現型マッピングデータと遺伝子発現マッピングデータとの間のアライメントに基づいて各遺伝子-表現型ペアトポグラフィについての統計的有意性を決定するための更なるコンピュータ命令を実行することにより、複数の遺伝子-表現型ペアトポグラフィのうちの各々についてのスコアを決定する。ある実施形態では、プロセッサは、選択された遺伝子の遺伝子型トポグラフィと、標的遺伝子-表現型ペアトポグラフィについての各神経行動学的表現型の神経表現型トポグラフィとの間の決定された関連性の程度が最も高い標的遺伝子-表現型ペアトポグラフィを選択するための更なるコンピュータ命令を実行することにより、1つ以上の遺伝子-表現型ペアトポグラフィを選択する。ある実施形態では、選択された遺伝子についての遺伝子発現マッピングデータは、複数の神経行動学的表現型のうちの1つを有しない複数の人々からの複数の遺伝子発現に関する遺伝子発現マッピングデータを含む。ある実施形態では、プロセッサは、複数の人々の複数の遺伝子発現における選択された遺伝子についての代表的プローブを選択するための更なるコンピュータ命令を実行することにより、選択された遺伝子についての遺伝子型トポグラフィを生成する。ある実施形態では、プロセッサは、遺伝子発現マッピングサンプルを脳構造における部位にマッピングするための更なるコンピュータ命令を実行することにより、選択された遺伝子についての遺伝子型トポグラフィを生成する。ある実施形態では、プロセッサは、バックグラウンドシグナルを超える閾値レベル未満の発現レベル測定値を有するサンプルを除外することによって遺伝子発現マッピングサンプルをフィルタリングするための更なるコンピュータ命令を実行することにより、選択された遺伝子についての遺伝子型トポグラフィを生成する。ある実施形態では、プロセッサは、プローブ値が欠損している遺伝子発現マッピングサンプルにおいてプローブ値を補完するための更なるコンピュータ命令を実行することにより、選択された遺伝子についての遺伝子型トポグラフィを生成する。ある実施形態では、プロセッサは、遺伝子発現マッピングデータから外的バイアスを除去するための更なるコンピュータ命令を実行することにより、選択された遺伝子についての遺伝子型トポグラフィを生成する。ある実施形態では、プロセッサは、遺伝子発現マッピングデータを捕捉するために使用される遺伝子プローブにわたって平均値除去及びzスコア正規化を行うための更なるコンピュータ命令を実行することにより、外的バイアスを除去する。ある実施形態では、プロセッサは、遺伝子発現マッピングデータにおけるシグナル対ノイズ比を高めるための更なるコンピュータ命令を実行することにより、選択された遺伝子についての遺伝子型トポグラフィを生成する。ある実施形態では、プロセッサは、同じ表面頂点上にマッピングされたサンプルに関する遺伝子発現マッピングデータの発現レベルを平均化するための更なるコンピュータ命令を実行することにより、シグナル対ノイズ比を高める。ある実施形態では、プロセッサは、低密度遺伝子発現サンプルを、サンプリングされた脳領域から、他のサンプリングされていない脳領域に内挿するための更なるコンピュータ命令を実行することにより、選択された遺伝子についての遺伝子型トポグラフィを生成する。ある実施形態では、プロセッサは、区画化された皮質マップもしくは皮質下マップ、または高密度の皮質マップもしくは皮質下マップのうちの少なくとも1つを生成するための更なるコンピュータ命令を実行することにより、低密度遺伝子発現サンプルを内挿する。ある実施形態では、プロセッサは、遺伝子発現マッピングデータにおける複数の脳領域のうちの各々に重み値を割り当てるための更なるコンピュータ命令を実行することにより、選択された遺伝子についての遺伝子型トポグラフィを生成する。ある実施形態では、プロセッサは、神経行動学的表現型マッピングデータにおける複数の脳領域のうちの各々に重み値を割り当てるための更なるコンピュータ命令を実行することにより、各神経行動学的表現型それぞれについての神経行動学的トポグラフィを生成する。ある実施形態では、プロセッサは、神経行動学的表現型マッピングデータにおける複数の脳領域のうちの第1の脳領域セットに対して閾値を超える第1の重み値セットを割り当て、かつ、神経行動学的表現型マッピングデータにおける複数の脳領域のうちの第2の脳領域セットに対して閾値未満の第2の重み値セットを割り当てるための、更なるコンピュータ命令を実行することにより、複数の脳領域のうちの各々に重み値を割り当てる。ある実施形態では、プロセッサは、標的脳領域に関連する情報を神経行動学的表現型マッピングデータから除去するように、複数の脳領域のうちの標的脳領域にマスキング重み値を割り当てるための更なるコンピュータ命令を実行することにより、複数の脳領域のうちの各々に重み値を割り当てる。ある実施形態では、プロセッサは、遺伝子型トポグラフィと、神経行動学的表現型の組み合わせに関する神経表現型トポグラフィの組み合わせとの間の少なくとも1つの組み合わせ遺伝子-表現型ペアトポグラフィを定めるための更なるコンピュータ命令を実行することにより、複数の遺伝子-表現型ペアトポグラフィを定める。ある実施形態では、プロセッサは、コンピュータ命令を実行するとき、選択された閾値を超えるスコアをそれぞれ有する、複数の遺伝子-表現型ペアトポグラフィのうちの1つ以上として、少なくとも1つの組み合わせ遺伝子-表現型ペアトポグラフィを選択する動作と、神経行動学的表現型の組み合わせをユーザに表示する動作とを更に行う。ある実施形態では、プロセッサは、コンピュータ命令を実行するとき、個々の神経行動学的表現型それぞれについての神経表現型マッピングデータと遺伝子発現マッピングデータとのアライメントと比べて向上した、遺伝子発現マッピングデータとのアライメントを呈する神経表現型マッピングデータを組み合わせることにより、神経行動学的表現型の組み合わせを同定する動作を更に実施する。ある実施形態では、神経行動学的表現型マッピングデータは、脳障害、症状、または認知プロセスのうちの1つに関するものである。 In some embodiments, a platform of the invention is a computing device comprising a memory for storing computer instructions and a processor, wherein when the processor executes the computer instructions, the computing device selects generating a genotypic topography for selected genes based on gene expression mapping data for selected genes; generating a neurobehavioral topography for each neurobehavioral phenotype based on the neurobehavioral mapping data for each neurobehavioral phenotype; wherein each gene-phenotype pair topography for each gene-phenotype pair is a selected gene genotype topography and each gene-phenotype pair topography between a neurophenotypic topography of each neurobehavioral phenotype for the phenotypic pair; and a quantitative score for each of the plurality of gene-phenotype pair topographies by a computing device; Action determining based on correlation between genotypic topography of selected genes and neurophenotypic topography of each neurobehavioral phenotype for each gene-phenotype pair; score above selected threshold displaying to a user each neurobehavioral phenotype of the one or more selected gene-phenotype pair topography; including a computing device that implements In an embodiment, the processor, when executing the computer instructions, further performs an act of selecting the selected gene based on the association of the neuropharmaceutical target selected by the user with the selected gene. In an embodiment, the processor further computer instructions for generating a neurophenotype topography from the neurobehavioral phenotype mapping data for each of the plurality of people having the selected neurobehavioral phenotype. Generate a neural phenotype topography by performing In an embodiment, the processor determines statistical significance for each gene-phenotype pair topography based on the alignment between the neurobehavioral phenotype mapping data and the gene expression mapping data for each neurobehavioral phenotype. A score is determined for each of the plurality of gene-phenotype pair topographies by executing additional computer instructions for determining sex. In an embodiment, the processor calculates the determined degree of association between the genotypic topography of the selected gene and the neurophenotypic topography of each neurobehavioral phenotype for the target gene-phenotype pair topography. One or more gene-phenotype pair topographies are selected by executing further computer instructions to select the target gene-phenotype pair topography with the highest . In certain embodiments, the gene expression mapping data for the selected genes comprises gene expression mapping data for gene expression from multiple people who do not have one of the multiple neurobehavioral phenotypes. In an embodiment, the processor determines the genotypic topography for the selected gene by executing further computer instructions to select representative probes for the selected gene in the multiple gene expression of the multiple people. to generate In one embodiment, the processor generates a genotypic topography for the selected gene by executing further computer instructions to map the gene expression mapping samples to sites in brain structures. In some embodiments, the processor selects by executing further computer instructions to filter the gene expression mapping samples by excluding samples with expression level measurements below a threshold level above background signal. generate a genotypic topography for the selected genes. In one embodiment, the processor generates a genotypic topography for the selected gene by executing additional computer instructions to impute probe values in gene expression mapping samples lacking probe values. In one embodiment, the processor generates a genotypic topography for the selected gene by executing additional computer instructions for removing external biases from the gene expression mapping data. In an embodiment, the processor removes external bias by executing further computer instructions to perform mean removal and z-score normalization over the gene probes used to capture the gene expression mapping data. do. In some embodiments, the processor generates a genotypic topography for the selected gene by executing additional computer instructions for increasing signal-to-noise ratio in gene expression mapping data. In certain embodiments, the processor enhances the signal-to-noise ratio by executing additional computer instructions to average the expression levels of the gene expression mapping data for samples mapped onto the same surface vertex. In some embodiments, the processor performs further computer instructions to interpolate low-density gene expression samples from sampled brain regions to other non-sampled brain regions, such that the selected gene Generate a genotypic topography for In an embodiment, the processor executes further computer instructions to generate at least one of a compartmentalized cortical or subcortical map or a dense cortical or subcortical map; Interpolate low-density gene expression samples. In one embodiment, the processor generates a genotypic topography for the selected gene by executing further computer instructions to assign a weight value to each of the plurality of brain regions in the gene expression mapping data. . In an embodiment, the processor executes further computer instructions to assign a weight value to each of the plurality of brain regions in the neurobehavioral phenotype mapping data, thereby determining each neurobehavioral phenotype Generate a neurobehavioral topography for In an embodiment, the processor assigns a first set of weight values above a threshold to a first set of brain regions in the neurobehavioral phenotype mapping data; the plurality of brain regions by executing further computer instructions to assign a second set of weight values below the threshold to a second set of the plurality of brain regions in the physical phenotype mapping data; assign a weight value to each of the . In an embodiment, the processor further assigns a masking weight value to a target brain region of the plurality of brain regions so as to remove information associated with the target brain region from the neurobehavioral phenotype mapping data. A weight value is assigned to each of the plurality of brain regions by executing computer instructions. In an embodiment, the processor further computer instructions for defining at least one combined gene-phenotype pair topography between a genotypic topography and a combination of neurophenotypic topographies for a combination of neurobehavioral phenotypes. to define multiple gene-phenotype pair topographies. In an embodiment, the processor, when executing the computer instructions, identifies at least one combined gene-phenotype as one or more of a plurality of gene-phenotype pair topographies, each having a score exceeding a selected threshold. The further acts of selecting a paired topography and displaying the combination of neurobehavioral phenotypes to the user are performed. In an embodiment, the processor, when executing the computer instructions, generates improved gene expression mapping data and gene expression mapping data compared to alignment of neurophenotype mapping data and gene expression mapping data for each individual neurobehavioral phenotype. A further act of identifying a combination of neurobehavioral phenotypes is performed by combining the neurophenotype mapping data exhibiting an alignment of . In certain embodiments, the neurobehavioral phenotype mapping data relates to one of an encephalopathy, a symptom, or a cognitive process.
いくつかの実施形態では、本発明のプラットフォームは、コンピューティングデバイスによって、1つ以上の遺伝子についての遺伝子発現マッピングデータを得ること;コンピューティングデバイスによって、選択された神経表現型についての神経表現型マッピングデータを得ること;コンピューティングデバイスによって、選択された遺伝子と1つ以上の神経行動学的表現型のうちの各神経表現型との間の各遺伝子-表現型ペアそれぞれについての定量的スコアを、選択された遺伝子についての遺伝子発現マッピングデータと、各遺伝子-表現型ペアの各神経行動学的表現型についての神経表現型マッピングデータとの間の相関関係に基づいて決定する工程;及び、コンピューティングデバイスによって、各遺伝子-表現型ペアについて決定されたスコアをユーザに提示する工程を含む、方法を含む。 In some embodiments, a platform of the invention obtains gene expression mapping data for one or more genes by a computing device; neurophenotype mapping for a selected neurophenotype by a computing device; obtaining data; by a computing device, a quantitative score for each gene-phenotype pair between the selected gene and each neurophenotype of the one or more neurobehavioral phenotypes; determining based on the correlation between the gene expression mapping data for the selected genes and the neurophenotype mapping data for each neurobehavioral phenotype of each gene-phenotype pair; and computing. The method includes presenting to the user, by the device, the score determined for each gene-phenotype pair.
いくつかの実施形態では、本発明のプラットフォームは、コンピューティングデバイスであって、コンピュータ命令を記憶するメモリと、プロセッサとを備え、プロセッサが、コンピュータ命令を実行するとき、複数の遺伝子についての複数の遺伝子型トポグラフィを、各遺伝子それぞれについての各遺伝子発現マッピングデータに基づいて生成する動作;複数の遺伝子のうちの第1の遺伝子について、複数の遺伝子型トポグラフィから第1の遺伝子型トポグラフィを選択する動作;複数の遺伝子のうちの複数の第2の遺伝子について、複数の遺伝子型トポグラフィから複数の第2の遺伝子型トポグラフィを選択する動作;第1の遺伝子と複数の第2の遺伝子との間の複数の遺伝子-遺伝子ペアトポグラフィを定める動作であって、各遺伝子-遺伝子ペアそれぞれについての各遺伝子-遺伝子ペアトポグラフィが、選択された遺伝子の第1の遺伝子型トポグラフィと、各遺伝子-遺伝子ペアについての各第2の遺伝子の各第2の遺伝子型トポグラフィとに基づいて定められる、動作;複数の遺伝子-遺伝子ペアトポグラフィのうちの各々についての定量的スコアを、第1の遺伝子の第1の遺伝子型トポグラフィと、各遺伝子-遺伝子ペアについての各第2の遺伝子の第2の遺伝子型トポグラフィとの間の相関関係に基づいて決定する動作;選択された閾値を超えるスコアをそれぞれ有する、複数の遺伝子-遺伝子ペアトポグラフィのうちの1つ以上を選択する動作;選択された1つ以上の遺伝子-遺伝子ペアトポグラフィの各第2の遺伝子をユーザに表示する動作を実施する、コンピューティングデバイスを含む。ある実施形態では、プロセッサは、コンピュータ命令を実行するとき、ユーザにより選択された神経薬物標的が第1の遺伝子に関連することに基づいて第1の遺伝子を選択する動作を更に実施する。ある実施形態では、プロセッサは、コンピュータ命令を実行するとき、選択された1つ以上の遺伝子-遺伝子ペアトポグラフィのそれぞれの第2の遺伝子に関連するそれぞれの神経薬物標的を1つ以上同定する動作を更に実施する。ある実施形態では、プロセッサは、各第2の遺伝子についての各遺伝子発現マッピングデータと第1の遺伝子についての各遺伝子発現マッピングデータとの間のアライメントに基づいて各遺伝子-遺伝子ペアトポグラフィについての統計的有意性を決定するための更なるコンピュータ命令を実行することにより、複数の遺伝子-遺伝子ペアトポグラフィのうちの各々についてのスコアを決定する。ある実施形態では、プロセッサは、第1の遺伝子の第1の遺伝子型トポグラフィと、標的遺伝子-遺伝子ペアトポグラフィについての各第2の遺伝子の各第2の遺伝子型トポグラフィとの間の決定された関連性の程度が最も高い標的遺伝子-遺伝子ペアトポグラフィを選択するための更なるコンピュータ命令を実行することにより、1つ以上の遺伝子-遺伝子ペアトポグラフィを選択する。ある実施形態では、遺伝子発現マッピングデータは、複数の人々からの複数の遺伝子発現に関する遺伝子発現マッピングデータを含む。ある実施形態では、プロセッサは、複数の人々の複数の遺伝子発現における各遺伝子についての代表的プローブを選択するための更なるコンピュータ命令を実行することにより、複数の遺伝子型トポグラフィを生成する。ある実施形態では、プロセッサは、遺伝子発現マッピングサンプルを脳構造における部位にマッピングするための更なるコンピュータ命令を実行することにより、複数の遺伝子型トポグラフィを生成する。ある実施形態では、プロセッサは、バックグラウンドシグナルを超える閾値レベル未満の発現レベル測定値を有するサンプルを除外することによって遺伝子発現マッピングサンプルをフィルタリングするための更なるコンピュータ命令を実行することにより、複数の遺伝子型トポグラフィを生成する。ある実施形態では、プロセッサは、プローブ値が欠損している遺伝子発現マッピングサンプルにおいてプローブ値を補完するための更なるコンピュータ命令を実行することにより、複数の遺伝子型トポグラフィを生成する。ある実施形態では、プロセッサは、遺伝子発現マッピングデータから外的バイアスを除去するための更なるコンピュータ命令を実行することにより、複数の遺伝子型トポグラフィを生成する。ある実施形態では、プロセッサは、遺伝子発現マッピングデータを捕捉するために使用される遺伝子プローブにわたって平均値除去及びzスコア正規化を行うための更なるコンピュータ命令を実行することにより、外的バイアスを除去する。ある実施形態では、プロセッサは、遺伝子発現マッピングデータにおけるシグナル対ノイズ比を高めるための更なるコンピュータ命令を実行することにより、複数の遺伝子型トポグラフィを生成する。ある実施形態では、プロセッサは、同じ表面頂点上にマッピングされたサンプルに関する遺伝子発現マッピングデータの発現レベルを平均化するための更なるコンピュータ命令を実行することにより、シグナル対ノイズ比を高める。ある実施形態では、プロセッサは、低密度遺伝子発現サンプルを、サンプリングされた脳領域から、他のサンプリングされていない脳領域に内挿するための更なるコンピュータ命令を実行することにより、複数の遺伝子型トポグラフィを生成する。ある実施形態では、プロセッサは、区画化された皮質マップもしくは皮質下マップ、または高密度の皮質マップもしくは皮質下マップのうちの少なくとも1つを生成するための更なるコンピュータ命令を実行することにより、低密度遺伝子発現サンプルを内挿する。ある実施形態では、プロセッサは、遺伝子発現マッピングデータにおける複数の脳領域のうちの各々に重み値を割り当てるための更なるコンピュータ命令を実行することにより、複数の遺伝子型トポグラフィを生成する。ある実施形態では、プロセッサは、遺伝子発現マッピングデータにおける複数の脳領域のうちの第1の脳領域セットに対して閾値を超える第1の重み値セットを割り当て、かつ、遺伝子発現マッピングデータにおける複数の脳領域のうちの第2の脳領域セットに対して閾値未満の第2の重み値セットを割り当てるための、更なるコンピュータ命令を実行することにより、複数の脳領域のうちの各々に重み値を割り当てる。ある実施形態では、プロセッサは、標的脳領域に関連する情報を遺伝子発現マッピングデータから除去するように、複数の脳領域のうちの標的脳領域にマスキング重み値を割り当てるための更なるコンピュータ命令を実行することにより、複数の脳領域のうちの各々に重み値を割り当てる。ある実施形態では、プロセッサは、第1の遺伝子型トポグラフィと、第2の遺伝子の組み合わせに関する第2の遺伝子型トポグラフィの組み合わせとの間の少なくとも1つの組み合わせ遺伝子-遺伝子ペアトポグラフィを定めるための更なるコンピュータ命令を実行することにより、複数の遺伝子-遺伝子ペアトポグラフィを定める。ある実施形態では、プロセッサは、コンピュータ命令を実行するとき、選択された閾値を超えるスコアをそれぞれ有する、複数の遺伝子-遺伝子ペアトポグラフィのうちの1つ以上として、少なくとも1つの組み合わせ遺伝子-遺伝子ペアトポグラフィを選択する動作と、第2の遺伝子の組み合わせをユーザに表示する動作とを更に行う。 In some embodiments, a platform of the invention is a computing device comprising a memory storing computer instructions and a processor, wherein the processor, when executing the computer instructions, generates a plurality of genes for a plurality of genes. An act of generating a genotypic topography based on each gene expression mapping data for each respective gene; an act of selecting a first genotypic topography from a plurality of genotypic topographies for a first gene of the plurality of genes. an act of selecting a plurality of second genotypic topographies from a plurality of genotypic topographies for a plurality of second genes of the plurality of genes; a plurality between the first gene and the plurality of second genes; wherein each gene-gene pair topography for each gene-gene pair is a first genotypic topography for the selected gene and each gene-gene pair topography for each gene-gene pair. each second genotypic topography of the second gene; and a quantitative score for each of the plurality of gene-gene pair topographies determined based on the first genotypic topography of the first gene; and a second genotypic topography of each second gene for each gene-gene pair; a plurality of gene-genes each having a score exceeding a selected threshold A computing device is included to perform the acts of selecting one or more of the paired topographies; displaying to the user each second gene of the one or more selected gene-gene paired topographies. In some embodiments, the processor, when executing the computer instructions, further performs an act of selecting the first gene based on the association of the neuropharmaceutical target selected by the user with the first gene. In an embodiment, the processor, when executing the computer instructions, acts to identify one or more respective neurodrug targets associated with each second gene of the one or more selected gene-gene pair topographies. Further implementation. In an embodiment, the processor performs statistical analysis for each gene-gene pair topography based on alignments between each gene expression mapping data for each second gene and each gene expression mapping data for the first gene. A score is determined for each of the plurality of gene-gene pair topographies by executing additional computer instructions for determining significance. In an embodiment, the processor generates the determined association between the first genotypic topography of the first gene and each second genotypic topography of each second gene for the target gene-gene pair topography. One or more gene-gene pair topographies are selected by executing further computer instructions to select target gene-gene pair topographies with the highest degree of sexuality. In certain embodiments, the gene expression mapping data includes gene expression mapping data for multiple gene expressions from multiple people. In one embodiment, the processor generates the multiple genotypic topographies by executing further computer instructions to select representative probes for each gene in the multiple gene expressions of the multiple people. In one embodiment, the processor generates a plurality of genotypic topographies by executing further computer instructions for mapping the gene expression mapping samples to sites in brain structures. In an embodiment, the processor performs further computer instructions to filter the gene expression mapping samples by excluding samples with expression level measurements below a threshold level above background signal, thereby Generate a genotypic topography. In some embodiments, the processor generates a plurality of genotypic topographies by executing additional computer instructions for imputing probe values in gene expression mapping samples lacking probe values. In one embodiment, the processor generates a plurality of genotypic topographies by executing additional computer instructions for removing external biases from the gene expression mapping data. In an embodiment, the processor removes external bias by executing further computer instructions to perform mean removal and z-score normalization over the gene probes used to capture the gene expression mapping data. do. In some embodiments, the processor generates a plurality of genotypic topographies by executing additional computer instructions for increasing signal-to-noise ratio in gene expression mapping data. In certain embodiments, the processor enhances the signal-to-noise ratio by executing additional computer instructions to average the expression levels of the gene expression mapping data for samples mapped onto the same surface vertex. In some embodiments, the processor determines the plurality of genotypes by executing further computer instructions to interpolate low-density gene expression samples from sampled brain regions to other unsampled brain regions. Generate topography. In an embodiment, the processor executes further computer instructions to generate at least one of a compartmentalized cortical or subcortical map or a dense cortical or subcortical map; Interpolate low-density gene expression samples. In one embodiment, the processor generates the plurality of genotypic topographies by executing further computer instructions to assign weight values to each of the plurality of brain regions in the gene expression mapping data. In an embodiment, the processor assigns a first set of weight values above a threshold to a first set of brain regions in the gene expression mapping data; assigning a weight value to each of the plurality of brain regions by executing further computer instructions to assign a second set of weight values below the threshold to a second set of brain regions of the brain regions; assign. In an embodiment, the processor executes further computer instructions for assigning a masking weight value to a target brain region of the plurality of brain regions so as to remove information associated with the target brain region from the gene expression mapping data. assigns a weight value to each of the plurality of brain regions. In an embodiment, the processor further comprises a step for defining at least one combined gene-gene pair topography between the first genotypic topography and the second genotypic topography combination for the second gene combination. A plurality of gene-gene pair topographies are defined by executing computer instructions. In an embodiment, the processor, when executing the computer instructions, generates at least one combined gene-gene pair topography as one or more of the plurality of gene-gene pair topographies, each having a score exceeding a selected threshold. and displaying a second gene combination to the user.
いくつかの実施形態では、本発明のプラットフォームは、コンピューティングデバイスによって、複数の遺伝子についての遺伝子発現マッピングデータを得ること;コンピューティングデバイスによって、選択された遺伝子と1つ以上の他の遺伝子との間の各遺伝子-遺伝子ペアそれぞれについての定量的スコアを、選択された遺伝子についての遺伝子発現マッピングデータと各遺伝子-遺伝子ペアの1つ以上の他の遺伝子についての遺伝子発現マッピングデータとの間の相関関係に基づいて決定する工程;及び、コンピューティングデバイスによって、各遺伝子-遺伝子ペアについて決定されたスコアをユーザに提示する工程を含む、方法を含む。 In some embodiments, the platform of the invention obtains gene expression mapping data for a plurality of genes by a computing device; Correlation between the gene expression mapping data for the selected gene and the gene expression mapping data for one or more other genes of each gene-gene pair and presenting to a user, by a computing device, the score determined for each gene-gene pair.
いくつかの実施形態では、本発明のプラットフォームは、神経薬物標的を同定するための方法であって、神経行動学的表現型を選択する工程;遺伝子発現マッピングデータ及び神経行動学的表現型マッピングデータを処理する工程;関連性のある神経表現型トポグラフィを定める工程;及び、神経薬物標的に関する遺伝子発現と神経行動学的表現型との間に関連性がある可能性を予測する工程を含み、方法の少なくとも1つの工程が、コンピュータ実装方法またはコンピュータ可読媒体のうちの1つを使用して行われる、方法を含む。ある実施形態では、本方法は、神経行動学的表現型マッピングデータを前処理する工程を更に含む。ある実施形態では、本方法は、神経行動学的表現型マッピングデータの重み付けまたはマスキングのうちの1つを更に含む。ある実施形態では、本方法は、遺伝子発現マッピングデータから外的バイアスを除去する工程、または遺伝子発現マッピングデータのシグナル対ノイズ比を向上させる工程のうちの少なくとも1つを更に含む。ある実施形態では、本方法は、少なくとも1つの脳部位または領域に関連する遺伝子発現マッピングデータを前処理する工程を含む、関連性のある神経表現型トポグラフィを定める工程を含む。ある実施形態では、本方法は、低密度サンプルレベル、内挿された高密度マップレベル、または離散的な区画化された脳マップレベルのうちの1つにおいて生じる遺伝子発現マッピングデータを含む。ある実施形態では、本方法は、1つ以上の遺伝子発現値を、皮質における連続的な高密度部位、または皮質における離散的な部位に割り当てる工程を更に含む。ある実施形態では、本方法は、脳障害、症状、または認知プロセスのうちの1つに関する神経行動学的表現型マッピングデータを含む。ある実施形態では、本方法は、神経薬物標的療法がオフターゲット脳領域に影響する可能性を予測する工程を更に含む。ある実施形態では、本方法は、遺伝子発現マッピングデータを組み合わせることによって神経薬物標的の組み合わせを同定する工程を更に含み、この組み合わされた遺伝子発現マッピングデータは、個々の神経薬物標的それぞれについての遺伝子発現マッピングデータと神経行動学的表現型マッピングデータとのアライメントと比べて向上した、神経行動学的表現型マッピングデータとのアライメントを呈する。 In some embodiments, the platform of the invention is a method for identifying neurodrug targets, comprising: selecting a neurobehavioral phenotype; gene expression mapping data and neurobehavioral phenotype mapping data defining a relevant neurophenotypic topography; and predicting the likelihood of an association between gene expression for a neurodrug target and a neurobehavioral phenotype; is performed using one of a computer-implemented method or a computer-readable medium. In some embodiments, the method further comprises preprocessing the neurobehavioral phenotype mapping data. In some embodiments, the method further comprises one of weighting or masking the neurobehavioral phenotype mapping data. In certain embodiments, the method further comprises at least one of removing external biases from the gene expression mapping data or improving the signal-to-noise ratio of the gene expression mapping data. In certain embodiments, the method comprises defining a relevant neurophenotype topography comprising preprocessing gene expression mapping data associated with at least one brain site or region. In certain embodiments, the method includes gene expression mapping data occurring at one of a low density sample level, an interpolated high density map level, or a discrete compartmentalized brain map level. In certain embodiments, the method further comprises assigning one or more gene expression values to either continuous high-density sites in the cortex or discrete sites in the cortex. In certain embodiments, the method includes neurobehavioral phenotype mapping data relating to one of brain disorders, symptoms, or cognitive processes. In some embodiments, the method further comprises predicting the likelihood that the neurodrug-targeted therapy will affect off-target brain regions. In certain embodiments, the method further comprises identifying a combination of neurodrug targets by combining gene expression mapping data, wherein the combined gene expression mapping data represents gene expression for each individual neurodrug target. It exhibits improved alignment with neurobehavioral phenotype mapping data compared to alignment of mapping data with neurobehavioral phenotype mapping data.
いくつかの実施形態では、本発明のプラットフォームは、神経行動学的表現型を同定するための方法であって、前処理された遺伝子発現マッピングデータを神経行動学的表現型マッピングデータとアラインする工程;及び、関連性のある神経の神経表現型トポグラフィを定める工程を含む、方法を含む。ある実施形態では、本方法は、遺伝子発現マッピングデータを前処理する工程を更に含む。ある実施形態では、本方法は、遺伝子発現マッピングデータの重み付けまたはマスキングのうちの1つを更に含む。ある実施形態では、本方法は、外的バイアスを除去するか、またはシグナル対ノイズ比を向上させるかのいずれかのために、遺伝子発現マッピングデータを前処理する工程を更に含む。ある実施形態では、本方法は、少なくとも1つの脳部位または領域に関連する遺伝子発現マッピングデータを前処理する工程を含む、関連性のある神経表現型トポグラフィを定める工程を含む。ある実施形態では、本方法は、低密度サンプルレベル、内挿された高密度マップレベル、または離散的な区画化された脳マップレベルのうちの1つにおいて生じる遺伝子発現マッピングデータを含む。ある実施形態では、本方法は、1つ以上の遺伝子発現値を、皮質における連続的な高密度部位、または皮質における離散的な部位に割り当てる工程を更に含む。ある実施形態では、本方法は、脳障害、症状、または認知プロセスのうちの1つに関する神経行動学的表現型マッピングデータを含む。ある実施形態では、本方法は、神経薬物標的療法がオフターゲット脳領域に影響する可能性を予測する工程を更に含む。 In some embodiments, the platform of the invention is a method for identifying a neurobehavioral phenotype, comprising aligning preprocessed gene expression mapping data with neurobehavioral phenotype mapping data. and a method comprising defining a neurophenotype topography of the relevant nerve. In some embodiments, the method further comprises preprocessing the gene expression mapping data. In certain embodiments, the method further comprises one of weighting or masking the gene expression mapping data. In certain embodiments, the method further comprises preprocessing the gene expression mapping data to either remove external biases or improve signal-to-noise ratios. In certain embodiments, the method comprises defining a relevant neurophenotype topography comprising preprocessing gene expression mapping data associated with at least one brain site or region. In certain embodiments, the method includes gene expression mapping data occurring at one of a low density sample level, an interpolated high density map level, or a discrete compartmentalized brain map level. In certain embodiments, the method further comprises assigning one or more gene expression values to either continuous high-density sites in the cortex or discrete sites in the cortex. In certain embodiments, the method includes neurobehavioral phenotype mapping data relating to one of brain disorders, symptoms, or cognitive processes. In some embodiments, the method further comprises predicting the likelihood that the neurodrug-targeted therapy will affect off-target brain regions.
いくつかの実施形態では、本発明のプラットフォームは、命令を記憶した非一時的コンピュータ可読媒体であって、命令が、コンピューティングデバイスによって実行されると、コンピューティングデバイスに、遺伝子発現マッピングデータと神経行動学的表現型マッピングデータとのアライメントを定量化すること;及び、関連性のある神経の神経表現型トポグラフィを定めることを含む、治療標的を同定するためのオペレーションを行わせる、コンピュータ可読媒体を含む。 In some embodiments, a platform of the invention is a non-transitory computer-readable medium storing instructions that, when executed by a computing device, cause the computing device to generate gene expression mapping data and neural quantifying alignment with behavioral phenotype mapping data; and defining a neurophenotype topography of relevant neurons. include.
いくつかの実施形態では、本発明のプラットフォームは、命令を記憶した非一時的コンピュータ可読媒体であって、命令が、コンピューティングデバイスによって実行されると、コンピューティングデバイスに、遺伝子発現マッピングデータと神経行動学的表現型マッピングデータとのアライメントを定量化すること;及び、関連性のある神経の神経表現型トポグラフィを定めることを含む、神経行動学的表現型の同定のためのオペレーションを行わせる、コンピュータ可読媒体を含む。 In some embodiments, a platform of the invention is a non-transitory computer-readable medium storing instructions that, when executed by a computing device, cause the computing device to generate gene expression mapping data and neural quantifying the alignment with the behavioral phenotype mapping data; and performing operations for identification of the neurobehavioral phenotype, including defining a neurophenotypic topography of relevant neurons; Including computer readable media.
いくつかの実施形態では、本発明のプラットフォームは、遺伝子発現マッピングデータと神経行動学的表現型マッピングデータとのアライメントを分析するためのコンピュータ実装システムであって、メモリと、メモリに接続された1つ以上のプロセッサとを備え、1つ以上のプロセッサが、遺伝子発現マッピングデータと神経行動学的表現型マッピングデータとのアライメントを定量化するように構成されている、コンピュータ実装システムを含む。 In some embodiments, a platform of the invention is a computer-implemented system for analyzing alignments of gene expression mapping data and neurobehavioral phenotype mapping data, comprising a memory and a memory connected to the memory. and one or more processors, the one or more processors configured to quantify alignment of gene expression mapping data and neurobehavioral phenotype mapping data.
使用方法
個別化された処置選択。中枢神経系(CNS)障害及び神経精神障害に対する処置の選択を行うときに一般的な問題は、所与の個人に合わせて処置を最適に調整することである。現在、この問題は未だ対処されておらず、医療分野においてこうした決定がなされるのは、臨床医による行動学的観察及び/または患者の自己申告によってなされる群分類上の割り当てに基づく群レベルにおいてである。Usage Individualized treatment selection. A common problem when making treatment choices for central nervous system (CNS) disorders and neuropsychiatric disorders is to optimally tailor treatment to a given individual. Currently, this issue has not yet been addressed, and in the medical field, such decisions are made at the group level based on behavioral observations by clinicians and/or group classification assignments made by patients' self-reports. is.
本発明のツール及び方法は、個々の患者レベルにおける推定上の処置応答の最適化をもたらす。具体的に言うと、神経または行動のいずれかによって測定され得る、所与の患者の神経行動学的表現型を用いることができる。つまり、神経表現型マップから直接的に、またはこの神経行動学的表現型における変動の影響を受ける神経表現型マップに関連する行動学的スコアのセットを活用することにより、神経表現型情報を導出することができる。神経行動学的表現型マップが導出されたら、遺伝子発現マップまたは遺伝子型トポグラフィとの最大のアライメントを計算して、好適な神経表現型トポグラフィを決定する。例えば、1つのシナリオでは、いくらか特徴的な機構を標的とするが、全てが様々な神経精神医学的診断に適応される5種の薬物が、神経表現型トポグラフィと相対的に検査され得る。したがって、本方法は、この遺伝子型及び神経表現型のトポグラフィによるアプローチを使用して決定される特定の患者についての遺伝子発現と神経表現型マップとの間の相対的な類似性または結び付きに基づいた、5種の薬物の定量的なランクの順序付けを可能にする。本方法は、患者に関する処置の決定に優先順位を付けるために使用されてもよい。 The tools and methods of the present invention provide optimization of putative treatment response at the individual patient level. Specifically, a given patient's neurobehavioral phenotype, which can be measured either neurologically or behaviorally, can be used. That is, derive neurophenotypic information either directly from the neurophenotype map or by leveraging a set of behavioral scores associated with the neurophenotype map subject to variation in this neurobehavioral phenotype. can do. Once the neurobehavioral phenotype map is derived, the maximal alignment with the gene expression map or genotypic topography is calculated to determine the preferred neurophenotypic topography. For example, in one scenario, five drugs that target some distinct mechanism, but are all indicated for different neuropsychiatric diagnoses, can be examined relative to neurophenotypic topography. Thus, the method is based on the relative similarity or connection between gene expression and neurophenotype maps for a particular patient as determined using this genotypic and neurophenotypic topography approach. , allowing a quantitative rank ordering of the five drugs. The method may be used to prioritize treatment decisions for a patient.
本発明のツール及び方法はまた、関与する遺伝子との類似性に基づく薬物標的の同定をもたらす。現在、所与の疾患に分子が関与しているが、その標的が直接的に投薬可能ではない場合、疾患に関与する神経回路を薬理学的に標的とするための方法が必要である。これを達成するためには、投薬可能ではない関与する標的との類似性に基づいてスクリーニングされ得る代替的な薬物が必要である。本発明のアプローチは、所与の疾患に関与する遺伝子から始めることにより、これを可能にする。そのような遺伝子及びその関連タンパク質は薬理学的処置によって直接的にモジュレートするのが困難であり得るため、脳全体の遺伝子発現パターンが破壊された標的のものとアラインする別の薬物標的をモジュレートすることができる代替的な方策が必要である。本発明のツール及び方法は、破壊された遺伝子と類似性の高い発現トポグラフィを示し、したがって高い遺伝子-遺伝子マップの類似性スコアを呈する遺伝子について、類似性スコアを計算することにより、そのような遺伝子を同定することができる。この遺伝子対遺伝子のアライメントは、直接的にモジュレートされない場合がある破壊された機構を強く発現する同じ領域を優先的にモジュレートするように、導出される遺伝子に関連する受容体タンパク質を標的とする薬物が良く分布することを示唆する。 The tools and methods of the invention also provide identification of drug targets based on their similarity to the genes involved. Currently, where a molecule is implicated in a given disease but its target is not directly druggable, there is a need for methods to pharmacologically target the neural circuits involved in the disease. To accomplish this, alternative drugs are needed that can be screened based on similarity to the non-drugable target of interest. The approach of the present invention enables this by starting with the genes involved in a given disease. Since such genes and their associated proteins can be difficult to modulate directly by pharmacological treatments, modulating another drug target that aligns the gene expression pattern across the brain with that of the disrupted target would be useful. There is a need for an alternative strategy that can rate. The tools and methods of the present invention calculate similarity scores for genes that exhibit expression topographies that are highly similar to the disrupted gene, and thus exhibit high gene-gene map similarity scores, thereby allowing such gene can be identified. This gene-by-gene alignment targets receptor proteins associated with derived genes to preferentially modulate the same regions that strongly express disrupted machinery that may not be directly modulated. suggesting that the drug is well distributed.
本発明のツール及び方法はまた、関与する神経回路との遺伝子類似性に基づく薬物標的の同定をもたらす。神経精神医学的状態の処置における大きな知識のギャップは、特定の神経の変化に関する薬物標的を同定する能力である。言い換えれば、神経精神医学的症状に関連する神経回路の変化を同定することができれば、課題はその神経回路を薬物標的にマッピングすることである。ここで、本発明のツール及び方法は、得られた神経行動学的マップを遺伝子発現プロファイルとの関連で定量化するための方法を提供する。前述のように、神経行動学的表現型マップから直接的に、またはこの行動における群内変動の影響を受ける神経行動学的表現型マップに関連する行動学的スコアのセットを活用することにより、神経行動学的表現型情報を導出することができる。群の神経行動学的表現型マップが導出されたら、神経行動学的表現型マップと遺伝子発現マップとの最大アライメントを計算または比較する。これにより、破壊された回路と最大にアラインされる遺伝子についての定量的スコアがもたらされ、結果として、そのような回路に対する分子の開発が可能になる。 The tools and methods of the invention also provide identification of drug targets based on their genetic similarity to the neural circuits involved. A major knowledge gap in the treatment of neuropsychiatric conditions is the ability to identify drug targets for specific neuronal alterations. In other words, once alterations in neural circuits associated with neuropsychiatric conditions can be identified, the challenge is to map those circuits to drug targets. Here, the tools and methods of the present invention provide methods for quantifying the resulting neurobehavioral maps in relation to gene expression profiles. As previously described, either directly from the neurobehavioral phenotype map or by leveraging a set of behavioral scores associated with the neurobehavioral phenotype map subject to within-group variability in this behavior, Neurobehavioral phenotypic information can be derived. Once the group neurobehavioral phenotype map is derived, the maximum alignment between the neurobehavioral phenotype map and the gene expression map is calculated or compared. This provides a quantitative score for genes that align maximally with disrupted circuits, thus enabling the development of molecules for such circuits.
本発明のツール及び方法はまた、脳または行動のいずれかにより、応用有効性の試験(すなわち、臨床治験の最適化)を行うための、好適な患者集団サブセットの選択、または患者集団の精製をもたらす。例えば、これが意味するのは、ツールが行動もしくは症状プロファイルに対して既にマッピングしてある患者の脳マップに基づいて患者を選択してもよいし、または、ツールが脳マップに対して既にマッピングしてある問題への応答もしくは行動学的タスクの成績を使用して患者を選択してもよいということである。 The tools and methods of the present invention can also be used to select suitable patient population subsets or refine patient populations for applied efficacy testing (i.e., optimization of clinical trials), either by brain or by behavior. Bring. For example, this means that a patient may be selected based on a patient's brain map that the tool has already mapped to a behavioral or symptom profile, or a patient that the tool has already mapped to a brain map. responses to a given problem or behavioral task performance may be used to select patients.
治療薬の開発における主要課題は、新たな処置が最適であり得る最適な患者コホートの同定である。現在、こうした決定は、分類上のレベルにおいて広範な適応症に基づいて下されている(例えば、うつ病対精神病)。究極的に、この広範なアプローチは、臨床有効性を調査するために使用される所与の薬物と最も良くアラインされ得る患者集団の定量的に駆動された選択または精製を可能にするものではない。本発明のツール及び方法は、所与の分子標的に関する遺伝子発現マップ(すなわち、遺伝子マップ)を導出するための定量的方法をもたらす。次に、本発明のツール及び方法は、所与の遺伝子発現マップとの最大のアライメントをもたらす神経行動学的表現型マッピングに基づいて患者をスクリーニングする。そうすることで、本発明のツール及び方法は、患者の神経行動学的表現型マッピングまたはプロファイルと目的の遺伝子発現マッピングとのアライメントに基づいた、所与の研究または治験における患者の組み入れまたは除外に関する指針または方向性を提供する。 A major challenge in the development of therapeutics is the identification of optimal patient cohorts for which new treatments may be optimal. Currently, such decisions are made on the basis of a wide range of indications at the taxonomic level (eg, depression versus psychosis). Ultimately, this broad approach does not allow quantitatively driven selection or refinement of patient populations that can best align with a given drug used to investigate clinical efficacy. . The tools and methods of the invention provide a quantitative method for deriving gene expression maps (ie, genetic maps) for a given molecular target. The tools and methods of the invention then screen patients based on neurobehavioral phenotype mapping that yields the greatest alignment with a given gene expression map. In doing so, the tools and methods of the present invention are relevant to the inclusion or exclusion of patients in a given study or trial based on the alignment of the patient's neurobehavioral phenotype mapping or profile with the gene expression mapping of interest. Provide guidance or direction.
本発明のツール及び方法はまた、ヒト臨床治験のための推定上の分子の選択をもたらす。所与のヒト臨床集団のための新たな分子の設計における主要課題は、かかる集団にとって関連性があり得る分子標的を、破壊された脳-行動の関係のパターンに基づいて選択することを含む。本発明のアプローチは、目的の神経行動学的表現型マップと所与の遺伝子発現マップとのアライメントに基づいて推定上の標的関与に関する情報を提示する方法を提供する。そうすることで、本発明のツール及び方法は、臨床的な目的の神経行動学的表現型との最大のアライメントを呈する分子を選択することにより、どの既存の分子を臨床治験において使用すべきかという選択に関する情報を直接的に提示し得る。 The tools and methods of the invention also provide for the selection of putative molecules for human clinical trials. A major challenge in the design of new molecules for a given human clinical population involves selecting molecular targets that may be relevant to such population based on patterns of disrupted brain-behavior relationships. The present approach provides a way to present information about putative target involvement based on the alignment of a neurobehavioral phenotype map of interest with a given gene expression map. In doing so, the tools and methods of the present invention help guide which existing molecules to use in clinical trials by selecting the molecules exhibiting the greatest alignment with the neurobehavioral phenotype of clinical interest. Information regarding selection may be presented directly.
本発明のツール及び方法はまた、薬物分子選択のための神経行動学的表現型マッピング及びトランスクリプトームまたは遺伝子発現マッピングの前臨床応用または動物への応用をもたらす。新たな分子の設計に関する本質的課題は、所与の神経標的に対する正しい分子の選択を含む。本発明のアプローチは、疾患動物モデル(例えばノックアウト)を介したハイスループットスクリーニングをもたらす方法を提供する。具体的に言うと、動物における神経行動学的表現型マップを(例えば、動物神経画像処理によって)得る場合、このアプローチは、かかる神経行動学的表現型マップと最大にアラインする遺伝子間で定量的スクリーニングを行う方法をもたらす。本方法は、潜在的な分子標的についてスクリーニングすることによる治療薬設計への本発明のツール及び方法の応用を可能にする。 The tools and methods of the invention also provide preclinical or animal applications of neurobehavioral phenotype mapping and transcriptome or gene expression mapping for drug molecule selection. A fundamental challenge in designing new molecules involves selecting the correct molecule for a given neural target. The approach of the present invention provides a method for high-throughput screening via animal models of disease (eg, knockouts). Specifically, when obtaining neurobehavioral phenotype maps in animals (e.g., by animal neuroimaging), this approach provides a quantitative Provides a method for performing screening. The method enables application of the tools and methods of the invention to therapeutic drug design by screening for potential molecular targets.
本発明のツール及び方法はまた、関与する神経回路に基づく、特定の人々に関する診断決定をもたらす。神経精神医学の分野における大きな必要性は、関与する神経回路に基づいて診断上関連性のある決定を導出する能力である。現在、当分野では、この目標を達成するためのフレームワークが本質的に欠如している。本発明のツール及び方法は、所与の個人についての既存の神経行動学的表現型と、所与の遺伝子発現プロファイルとの間のアライメントのレベルを定量化するための方法を提供する。2つのマップが互いから逸脱(すなわち、相違性を反映)しない限り、この情報は、所与の個人に関する診断決定に達するために使用されてもよい。 The tools and methods of the present invention also provide diagnostic decisions for specific people based on the neural circuits involved. A great need in the field of neuropsychiatry is the ability to derive diagnostically relevant decisions based on the neural circuits involved. Currently, the field is essentially lacking a framework for achieving this goal. The tools and methods of the present invention provide a way to quantify the level of alignment between a pre-existing neurobehavioral phenotype for a given individual and a given gene expression profile. As long as the two maps do not deviate from each other (ie, reflect differences), this information may be used to arrive at a diagnostic decision for a given individual.
本発明のツール及び方法はまた、関連する神経行動学的表現型と定量的な結び付きがある行動的変動に基づく、特定の人々に関する診断決定をもたらす。神経精神医学の分野における関連する大きな必要性は、神経行動学的表現型プロファイルの変化(例えば精神病)に結び付けられる神経回路における診断上関連性のある変動に関する情報を提示する能力である。現在、かかる神経回路が、規範的な遺伝子発現プロファイルと類似または相違する変動を呈するかどうかを定量化する方法はない。本発明のツール及び方法は、所与の個人についての神経行動学的表現型と、所与の遺伝子発現プロファイルとの間のアライメントのレベルを定量化することにより、遺伝子型及び神経表現型のトポグラフィを構築するための方法を提供する。2つのマップが互いから逸脱(すなわち、相違性を反映)しない限り、この情報は、所与の個人に関する診断決定に達するために使用されてもよい。 The tools and methods of the present invention also provide diagnostic decisions for specific people based on behavioral variations that are quantitatively linked to relevant neurobehavioral phenotypes. A related major need in the field of neuropsychiatry is the ability to present information about diagnostically relevant changes in neural circuits that are associated with changes in neurobehavioral phenotypic profiles (eg, psychosis). Currently, there is no way to quantify whether such neural circuits exhibit similar or different variations to canonical gene expression profiles. The tools and methods of the present invention provide genotypic and neurophenotypic topography by quantifying the level of alignment between a neurobehavioral phenotype for a given individual and a given gene expression profile. provides a method for constructing As long as the two maps do not deviate from each other (ie, reflect differences), this information may be used to arrive at a diagnostic decision for a given individual.
本発明のツール及び方法はまた、遺伝子トランスクリプトームまたは遺伝子発現マッピングアライメントに基づく、供与される治療法の効果の予知をもたらす。神経精神障害のための処置の決定における重要な目標は、経時的に臨床的に有意義な予測を行う能力を含む。本発明のツール及び方法を使用して利用可能な使用方法の1つは、所与の個人についての神経行動学的表現型と、これと同じ個人についての所与の遺伝子発現マッピングプロファイルとの間の類似性のレベルを、経時的に、例えば処置前及び処置後に定量化することである。具体的に言うと、本発明のツール及び方法は、処置後に神経行動学的表現型が遺伝子発現マップとより近くアラインするか否かを反映する遺伝子型及び神経表現型トポグラフィの定量的スコアをもたらす。 The tools and methods of the invention also provide prediction of the efficacy of a given therapy based on gene transcriptome or gene expression mapping alignments. An important goal in treatment decisions for neuropsychiatric disorders involves the ability to make clinically meaningful predictions over time. One of the uses available using the tools and methods of the present invention is the correlation between a neurobehavioral phenotype for a given individual and a given gene expression mapping profile for that same individual. to quantify the level of similarity over time, eg, before and after treatment. Specifically, the tools and methods of the present invention provide a quantitative score of genotypic and neurophenotypic topography that reflects whether the neurobehavioral phenotype aligns more closely with the gene expression map after treatment. .
本発明のツール及び方法はまた、神経行動学的表現型との遺伝子トランスクリプトームアライメントに基づく、神経回路の変化に対する本格的な病気の前の推定上の処置応答(すなわち、リスク)の予知をもたらす。神経精神障害のための処置の決定における別の主要な目標は、本格的な病気の発生前に臨床的に有意義な予測を行う能力を含む。換言すると、多くの場合、重度の神経精神医学的病気の「リスクがある」人々を、幅広い神経行動学的表現型症状が発生する前に同定することが重要である。本発明のツール及び方法の使用方法の1つは、所与の個人についての神経行動学的表現型と、所与の神経精神医学的状態に関する遺伝的または臨床的なリスクが高い個人における所与の遺伝子発現プロファイルまたは遺伝子発現マッピングとの間の類似性のレベルを定量化することである。これに関連して、「遺伝子発現プロファイル」とは、カノニカルな機能的ネットワーク(すなわち、特定の機能に関与することが公知である特定の脳領域の集まり)における遺伝子発現の次のレベルの分析を指す場合があり、一方で「遺伝子発現マッピング」とは、サンプリングされた全ての脳領域における発現パターンを指す場合がある。例えば、特定の実施可能な使用方法は、精神病のリスクがある個人についての神経行動学的表現型マッピングを導出し、次いで、目的の神経行動学的表現型マッピングにおける変動を反映する、遺伝子発現プロファイルまたは遺伝子発現マッピングに対する神経行動学的表現型マッピングの類似性のレベルを定量化することである。具体的に言うと、本発明のツール及び方法は、所与の遺伝子発現マップとの定量的類似性または偏差に基づく、精神病の転換に関する「リスク」のレベルを反映する定量的スコアをもたらす。 The tools and methods of the present invention also allow prediction of putative treatment responses (i.e., risk) prior to full-blown disease to changes in neural circuitry based on gene transcriptome alignments with neurobehavioral phenotypes. Bring. Another major goal in treatment decisions for neuropsychiatric disorders involves the ability to make clinically meaningful predictions prior to the onset of full-blown illness. In other words, it is often important to identify people who are "at risk" for severe neuropsychiatric illness before a wide range of neurobehavioral phenotypic symptoms develop. One method of using the tools and methods of the present invention is to determine the neurobehavioral phenotype for a given individual and a given neurobehavioral phenotype in individuals at high genetic or clinical risk for a given neuropsychiatric condition. It is to quantify the level of similarity between gene expression profiles or gene expression mappings. In this context, "gene expression profile" refers to next-level analysis of gene expression in a canonical functional network (i.e., a collection of specific brain regions known to be involved in a particular function). may refer to, while "gene expression mapping" may refer to expression patterns in all sampled brain regions. For example, one possible use is to derive a neurobehavioral phenotype mapping for an individual at risk for psychosis, and then gene expression profiles that reflect variations in the neurobehavioral phenotype mapping of interest. or to quantify the level of similarity of neurobehavioral phenotype mapping to gene expression mapping. Specifically, the tools and methods of the present invention provide a quantitative score that reflects the level of "risk" for psychotic conversion based on quantitative similarity or deviation from a given gene expression map.
本発明のツール及び方法はまた、侵襲的なファーマコイメージングの回避の実用的応用をもたらす。ヒト臨床治験における合理的な薬物の設計においてたびたび生じる支障は、典型的には侵襲的なファーマコニューロイメージング(pharmaconeuroimaging)(例えばfMRIまたはPET)による、標的関与の検証である。特にこれに関連して、このアプローチは、既知の症状応答を有する個人群において既知の臨床的な薬理学的応答がある場合に神経行動学的表現型を同定するための方法を提供し得る。ここで、目的の薬物に基づく標的関与の証拠が過去にない場合、本発明のツール及び方法は、薬物分子に対して応答性を示す所与の神経回路を、かかる神経回路と、その薬物に関する遺伝子トランスクリプトームまたは遺伝子発現マップとのアライメントによって正確に特定し、関連性のある遺伝子型及び神経表現型のトポグラフィを構築する使用方法を提供する。言い換えれば、本発明のツール及び方法は、所与の分子についての神経表現型トポグラフィを、所与の機構、薬理学的応答に関与する遺伝子のトランスクリプトームパターンまたは遺伝子発現マッピングに基づいて導出することができる。次に、この神経表現型トポグラフィを使用して、目的の機構と最大にアラインする神経回路を選択し、標的関与のファーマコイメージングの必要性を効果的に回避することができる。 The tools and methods of the present invention also have practical application in avoidance of invasive pharmacoimaging. A recurring hurdle in rational drug design in human clinical trials is validation of target engagement, typically by invasive pharmaconeuroimaging (eg, fMRI or PET). Of particular relevance to this, this approach may provide a method for identifying neurobehavioral phenotypes when there is a known clinical pharmacological response in a group of individuals with known symptomatic responses. Here, in the absence of previous evidence of target engagement based on the drug of interest, the tools and methods of the present invention are used to identify a given neural circuit that is responsive to a drug molecule. Methods of use are provided to construct a topography of relevant genotypes and neurophenotypes, precisely identified by alignment with gene transcriptomes or gene expression maps. In other words, the tools and methods of the present invention derive a neurophenotypic topography for a given molecule based on the transcriptome pattern or gene expression mapping of genes involved in a given mechanism, pharmacological response. be able to. This neurophenotypic topography can then be used to select neural circuits that align maximally with the mechanism of interest, effectively avoiding the need for pharmacoimaging of target engagement.
本発明のツール及び方法はまた、多剤療法の最適化をもたらす。たいていの場合、多くの患者は、1つよりも多くの薬物に最も良く応答する。そのような多剤療法処置レジメンの選択を「微調整する」プロセスは、現在、定量的または神経生物学的な原則に基づいた方法ではなく、むしろ臨床医による患者の定性的評価または患者の自己申告によって駆動されている。結果として、この多剤療法供与のプロセスは、精確に最適化することが困難である場合が多い。更に、何らかの処置を開始する前に、所与の個人、症状、または症状のセットに対してどの薬物の組み合わせが有効であり得るかについての定量的根拠のある選択に到達するのは、現時点では不可能である。したがって、本発明のツール及び方法は、特定の個人または症状のセットに合わせて多剤療法を選択し、最適化する使用方法を提供する。 The tools and methods of the invention also provide for optimization of polytherapy. Most patients respond best to more than one drug. The process of "fine-tuning" the selection of such multi-drug treatment regimens is currently not based on quantitative or neurobiological principles, but rather on qualitative assessment of the patient by the clinician or on the patient's self-report. Driven by declarations. As a result, this process of multi-drug therapy delivery is often difficult to optimize precisely. Furthermore, reaching a quantitatively justified choice of which drug combinations may be effective for a given individual, condition, or set of conditions before any treatment is initiated is currently not possible. Impossible. Accordingly, the tools and methods of the present invention provide a method of use for selecting and optimizing multi-drug therapy for a particular individual or set of conditions.
本発明のツール及び方法はまた、治療的投薬の決定に関する情報提示をもたらす。たいていの場合、多くの患者は、1つ以上の薬物の初回処方量に最も良く応答するとは言えない。最適な用量範囲の選択を「微調整する」プロセスは、現在、定量的または神経生物学的な原則に基づいた方法ではなく、むしろ臨床医による患者の定性的評価または患者の自己申告によって駆動されている。結果として、投薬の決定を微調整するプロセスは、精確に最適化することが困難である場合が多い。したがって、本発明のツール及び方法は、異なる用量に応じた、遺伝子トランスクリプトームプロファイルまたは遺伝子発現マップに対する、導出された神経行動学的表現型マップの類似性に基づいて、特定の個人または症状のセットに対する用量範囲を選択し、最適化する使用方法を提供する。これと関連して、本発明のツール及び方法は、最初の処置前の神経行動学的表現型マッピングと所与の遺伝子発現マップとのアライメントが、用量レベルを潜在的に最適化するための指針をもたらすような使用方法を提供する。 The tools and methods of the invention also provide information presentation regarding therapeutic dosing decisions. Most of the time, many patients do not respond best to the initial prescribed dose of one or more drugs. The process of “fine-tuning” optimal dose range selection is currently not driven by quantitative or neurobiological principle-based methods, but rather by qualitative assessment of patients by clinicians or by patient self-reports. ing. As a result, the process of fine-tuning dosing decisions is often difficult to optimize with precision. Thus, the tools and methods of the present invention can be used to identify specific individuals or conditions based on the similarity of derived neurobehavioral phenotype maps to gene transcriptome profiles or gene expression maps in response to different doses. Instructions are provided for selecting and optimizing dose ranges for the set. In this context, the tools and methods of the present invention demonstrate that alignment of initial pretreatment neurobehavioral phenotype mapping with a given gene expression map provides guidance for potentially optimizing dose levels. provide a method of use that results in
本発明のツール及び方法はまた、薬物標的の除外に関する情報提示をもたらす。たいていの場合、多くの患者は、当個人が経験している幅広い症状に適応され得る、所与の選ばれた処置に全く応答しないか、または応答するとしても不十分である。現在、所与の薬物が所与の神経回路に対して不十分な候補であり得るかどうかを処置前に決定するための定量的または神経生物学的な原則に基づいた方法はない。したがって、所与の薬物または用量への応答がない、または応答が不十分であるリスクが高い。本発明のツール及び方法は、遺伝子トランスクリプトームプロファイルまたは遺伝子発現マップに対する、導出された神経行動学的表現型マップの相違度に基づいて、どの薬物または用量範囲が特定の個人または症状のセットに対して排他的であり得るかに関する情報を提供する使用方法を提供する。 The tools and methods of the present invention also provide information presentation regarding exclusion of drug targets. Most of the time, many patients do not respond, or respond poorly, to a given treatment of choice, which can be applied to a wide range of symptoms experienced by the individual. Currently, there is no quantitative or neurobiological principle-based method for determining pre-treatment whether a given drug may be a poor candidate for a given neural circuit. Therefore, there is a high risk of no or poor response to a given drug or dose. The tools and methods of the present invention identify which drugs or dose ranges are suitable for a particular individual or set of conditions based on the degree of dissimilarity of a derived neurobehavioral phenotype map to a gene transcriptome profile or gene expression map. It provides a usage that provides information about whether it can be exclusive to
本発明のツール及び方法はまた、所与の処置に対する差次的な神経行動学的表現型の臨床応答に関する情報提示をもたらす。現在、ヒトにおいて、2つ以上の薬物のうちのどれが所与の神経回路に対して最適であり得るかを、行動学的有効性に基づいて決定するのは困難である。具体的に言うと、2つの薬物が臨床治験において差次的な症状応答を誘導する場合、それらの受容体標的化と、所与のトランスクリプトームマップまたは遺伝子発現マップとの既知のアライメントは、その症状の変化における神経回路の関与を示す。この使用方法は、特定の回路の開発及び標的化の所与のパイプラインに対してどの薬物が最適であり得るかに関する臨床治験設計との関連における指針を提供する。 The tools and methods of the invention also provide information presentation regarding the clinical response of differential neurobehavioral phenotypes to a given treatment. Currently, it is difficult to determine which of two or more drugs may be optimal for a given neural circuit in humans based on behavioral efficacy. Specifically, if two drugs induce differential symptom responses in clinical trials, their receptor targeting and known alignments with a given transcriptome map or gene expression map Involvement of neural circuits in the change of symptoms. This method of use provides guidance in the context of clinical trial design as to which drugs may be optimal for a given pipeline of development and targeting of specific circuits.
いくつかの実施形態では、本発明のツール及び方法は、対象における神経行動学的表現型を検知する方法であって、対象から神経行動学的表現型マッピングデータのサンプルを得るかまたは得ている工程;ある遺伝子に関する第1の脳領野の遺伝子型トポグラフィを遺伝子発現マッピングデータに基づいて定める工程;神経行動学的表現型に関する第2の脳領野の神経表現型トポグラフィを神経行動学的表現型マッピングデータに基づいて定める工程;第1の脳領野の遺伝子型トポグラフィと第2の脳領野の神経表現型トポグラフィとを接触させてアライメントを構築する工程;及び、アラインされた遺伝子型トポグラフィ及び神経表現型トポグラフィとサンプルを接触させることにより、サンプルにおいて神経行動学的表現型が存在するかどうかを検知する工程を含む、方法を提供する。この方法の一実施形態では、神経行動学的表現型は、感情障害、パーソナリティ障害、注意欠陥多動性障害、神経変性疾患、神経発達障害、化学療法に伴う認知変化、神経変性疾患に伴う精神症状、健康時及び疾病時における脳機能の性差、外傷性脳傷害、ならびに測定可能な神経の特徴のうちの少なくとも1つである。 In some embodiments, the tools and methods of the present invention are methods of detecting a neurobehavioral phenotype in a subject, wherein samples of neurobehavioral phenotype mapping data are obtained or have been obtained from the subject. Determining a genotypic topography of a first brain area for a gene based on gene expression mapping data; Neurobehaviorally mapping a neurobehavioral topography of a second brain area for a neurobehavioral phenotype contacting the genotypic topography of the first brain area with the neurophenotypic topography of the second brain area to construct an alignment; and the aligned genotypic topography and neurophenotype. A method is provided comprising detecting whether a neurobehavioral phenotype is present in a sample by contacting the sample with a topography. In one embodiment of this method, the neurobehavioral phenotype is affective disorders, personality disorders, attention deficit hyperactivity disorder, neurodegenerative disorders, neurodevelopmental disorders, cognitive changes associated with chemotherapy, psychiatric disorders associated with neurodegenerative disorders. at least one of symptoms, gender differences in brain function in health and disease, traumatic brain injury, and measurable neurological characteristics.
いくつかの実施形態では、本発明のツール及び方法は、対象における神経行動学的表現型を診断、予測、予知、または処置する方法であって、対象から神経行動学的表現型マッピングデータのサンプルを得るかまたは得ている工程;ある遺伝子に関する第1の脳領野の遺伝子型トポグラフィを遺伝子発現マッピングデータに基づいて定める工程;神経行動学的表現型に関する第2の脳領野の神経表現型トポグラフィを神経行動学的表現型マッピングデータに基づいて定める工程;第1の脳領野の遺伝子型トポグラフィと第2の脳領野の神経表現型トポグラフィとを接触させてアライメントを構築する工程;アラインされた遺伝子型トポグラフィ及び神経表現型トポグラフィとサンプルを接触させることにより、サンプルにおいて神経行動学的表現型が存在するかどうかを検知する工程;及び、神経行動学的表現型が検知されたとき、対象を診断、予測、予知、または処置する工程を含む、方法を提供する。ある実施形態では、本方法は、対象に治療剤を投与する工程を更に含む。ある実施形態では、本方法は、検知された神経行動学的表現型の処置に好適な1つ以上の治療剤を同定する工程を更に含む。ある実施形態では、本方法は、検知された神経行動学的表現型に関連する遺伝子に基づいて選択された1つ以上の治療剤を含む。ある実施形態では、本方法は、PDYN、OXTR、OPRK1、PNOC、OXT、AVP、OPRL1、APOE、GRIN2C、GABRA2、HTR2A、HTR3A、HRTR2C、HTR6、MAOA、CHRM1、CHRM3、CCR5、CXCR4、CXCR7、HRH3、ADRB2、DRD2、SNCA、GBA、GPR88、GPR139、及びLRRK2遺伝子のうちの1つ以上を含む。ある実施形態では、本方法は、検知された神経行動学的表現型に関連する遺伝子発現標的を同定する工程を更に含む。ある実施形態では、本方法は、検知された神経行動学的表現型の処置に好適であることが示される1つ以上の治療剤を組み合わせる工程を更に含む。ある実施形態では、本方法は、検知された神経行動学的表現型の処置に有効であることが示される量で1つ以上の治療剤を投薬する工程を更に含む。ある実施形態では、本方法は、検知された神経行動学的表現型の処置に最も好適であることが示される治療剤を選択する工程を更に含む。ある実施形態では、本方法は、検知された神経行動学的表現型の処置に好適でないことが示される対象に1つ以上の治療剤を投与しないことを更に含む。ある実施形態では、本方法は、第1の脳領野と第2の脳領野とのアライメント以外の脳領野において活性を有することが示される1つ以上の治療剤を含む。ある実施形態では、本方法は、対象が、検知された神経行動学的表現型に関する診断、そのリスクがあるという予知、またはそれについての処置を受けた後、方法の1つ以上の工程を繰り返すことを含む。ある実施形態では、本方法は、検知された神経行動学的表現型の変化に基づいて対象の治療レジメンを変更する工程を更に含む。ある実施形態では、本方法は、臨床試験への組み入れについて対象を選択する工程を更に含む。ある実施形態では、本方法は、臨床試験への組み入れに好適な患者集団を形成する工程を更に含む。ある実施形態では、本方法は、感情障害、例えば強迫性障害、双極性障害、単極性うつ病、気分変調症及び気分循環症、全般不安症、パニック障害、恐怖症、ならびに外傷後ストレス障害;パーソナリティ障害、例えば統合失調症、妄想性パーソナリティ障害;スキゾイドパーソナリティ障害;統合失調型パーソナリティ障害;反社会性パーソナリティ障害;情緒不安定性パーソナリティ障害;演技性パーソナリティ障害;自己愛性パーソナリティ障害;回避性(または不安性)パーソナリティ障害;依存性パーソナリティ障害;及び強迫性パーソナリティ障害;不注意型、過活動衝動型、及び複合型などの注意欠陥多動性障害;神経変性疾患、例えばアルツハイマー病、パーキンソン病;筋萎縮性側索硬化症;フリートライヒ運動失調症;ハンチントン病;レビー小体病;及び脊髄性筋萎縮症;神経発達障害、例えば自閉症スペクトラム障害、注意欠陥/多動障害(ADHD)及び学習障害;化学療法に伴う認知変化;悲しい気分もしくは気分の落ち込み、思考の混乱もしくは集中力の低下、過剰な恐れもしくは心配、または極端な罪悪感、気分の浮き沈みの極端な変化、友人及び活動からの離脱、著しい疲労、低い活力もしくは睡眠困難、現実からの解離(妄想)、妄想症もしくは幻覚、日常の問題もしくはストレスに対処する能力の不全、状況及び他者の理解及び共感の困難、アルコールもしくは薬物の乱用、食習慣の大きな変化、性欲の変化、過剰な怒り、敵意もしくは暴力、及び自殺念慮などの神経変性疾患に関連する精神症状;健康時及び疾病時における脳機能の性差;外傷性脳傷害;ならびに任意の測定可能な神経の特徴のうちの1つである神経行動学的表現型を含む。ある実施形態では、本方法は、侵襲的なファーマコイメージングを受けない対象を含む。 In some embodiments, the tools and methods of the present invention are methods of diagnosing, predicting, prognosticating, or treating a neurobehavioral phenotype in a subject, comprising: a sample of neurobehavioral phenotype mapping data from the subject; determining a genotypic topography of a first brain area for a gene based on gene expression mapping data; determining a neurophenotypic topography of a second brain area for a neurobehavioral phenotype Determining based on neurobehavioral mapping data; Contacting the genotypic topography of the first brain area with the neurophenotypic topography of the second brain area to construct an alignment; Aligned genotypes detecting whether a neurobehavioral phenotype is present in the sample by contacting the sample with the topography and the neurophenotypic topography; and diagnosing the subject when the neurobehavioral phenotype is detected; A method is provided that includes the step of predicting, prognosing, or treating. In some embodiments, the method further comprises administering a therapeutic agent to the subject. In some embodiments, the method further comprises identifying one or more therapeutic agents suitable for treatment of the detected neurobehavioral phenotype. In some embodiments, the method includes one or more therapeutic agents selected based on genes associated with the detected neurobehavioral phenotype. In certain embodiments, the method includes PDYN, OXTR, OPRK1, PNOC, OXT, AVP, OPRL1, APOE, GRIN2C, GABRA2, HTR2A, HTR3A, HRTR2C, HTR6, MAOA, CHRM1, CHRM3, CCR5, CXCR4, CXCR7, HRH3 , ADRB2, DRD2, SNCA, GBA, GPR88, GPR139, and LRRK2 genes. In certain embodiments, the method further comprises identifying gene expression targets associated with the detected neurobehavioral phenotype. In certain embodiments, the method further comprises combining one or more therapeutic agents shown to be suitable for treatment of the detected neurobehavioral phenotype. In certain embodiments, the method further comprises administering one or more therapeutic agents in amounts shown to be effective in treating the detected neurobehavioral phenotype. In certain embodiments, the method further comprises selecting a therapeutic agent shown to be most suitable for treating the detected neurobehavioral phenotype. In certain embodiments, the method further comprises not administering one or more therapeutic agents to a subject who is shown to be unsuitable for treatment of the detected neurobehavioral phenotype. In some embodiments, the method includes one or more therapeutic agents shown to have activity in brain areas other than the alignment of the first brain area and the second brain area. In certain embodiments, the method repeats one or more steps of the method after the subject has been diagnosed with, predicted to be at risk for, or treated for a detected neurobehavioral phenotype. Including. In some embodiments, the method further comprises altering the subject's treatment regimen based on the detected change in neurobehavioral phenotype. In some embodiments, the method further comprises selecting subjects for inclusion in a clinical trial. In some embodiments, the method further comprises forming a patient population suitable for inclusion in a clinical trial. In certain embodiments, the method is effective for treating affective disorders such as obsessive-compulsive disorder, bipolar disorder, unipolar depression, dysthymia and cyclothymia, generalized anxiety disorder, panic disorder, phobias, and post-traumatic stress disorder; Personality disorders such as schizophrenia, paranoid personality disorder; schizoid personality disorder; schizoidal personality disorder; antisocial personality disorder; Anxiety) personality disorders; dependent personality disorders; and obsessive-compulsive personality disorders; Atrophic Lateral Sclerosis; Friedreich's Ataxia; Huntington's Disease; Lewy Body Disease; and Spinal Muscular Atrophy; Cognitive changes associated with chemotherapy; sad or depressed mood, confused thoughts or difficulty concentrating, excessive fear or worry, or extreme guilt, extreme mood swings, deprivation from friends and activities Withdrawal, significant fatigue, low energy or difficulty sleeping, dissociation from reality (delusions), delusions or hallucinations, impaired ability to cope with everyday problems or stresses, difficulty understanding and empathizing with situations and others, alcohol or drugs psychiatric symptoms associated with neurodegenerative disorders such as alcohol abuse, major changes in eating habits, changes in libido, excessive anger, hostility or violence, and suicidal ideation; sex differences in brain function in health and disease; traumatic brain injury as well as a neurobehavioral phenotype that is one of any measurable neurological characteristic. In certain embodiments, the method includes subjects who do not undergo invasive pharmacoimaging.
いくつかの実施形態では、本発明のツール及び方法は、神経行動学的表現型を有する対象を処置するための方法であって、対象から神経行動学的表現型マッピングデータのサンプルを得るかまたは得ている工程、ある遺伝子に関する第1の脳領野の遺伝子型トポグラフィを遺伝子発現マッピングデータに基づいて定める工程、神経行動学的表現型に関する第2の脳領野の神経表現型トポグラフィを神経行動学的表現型マッピングデータに基づいて定める工程、第1の脳領野の遺伝子型トポグラフィと第2の脳領野の神経表現型トポグラフィとを接触させてアライメントを構築する工程、対象が神経行動学的表現型を有するかどうかを判定するために、アラインされた遺伝子型トポグラフィ及び神経表現型トポグラフィとサンプルの比較を行うこと、または行っていることにより、神経行動学的表現型を示す神経行動学的表現型マッピングデータを対象が有するかどうかを判定する工程、及び(i)アラインされた遺伝子型トポグラフィ及び神経表現型トポグラフィとサンプルの比較によって判定して、対象が神経行動学的表現型を有する場合、アラインされた遺伝子型トポグラフィ及び神経表現型トポグラフィに関連する1つ以上の遺伝子を標的とする治療剤を投与する工程、または(ii)アラインされた遺伝子型トポグラフィ及び神経表現型トポグラフィとサンプルの比較によって判定して、対象が神経行動学的表現型を有する場合、アラインされた遺伝子型トポグラフィ及び神経表現型トポグラフィに関連する1つ以上の神経行動学的表現型を標的とする治療剤を投与する工程を含む、方法を提供する。ある実施形態では、本方法は、対象に対する処置が神経行動学的表現型の処置に有効である可能性を高める工程を更に含む。 In some embodiments, the tools and methods of the present invention are methods for treating a subject with a neurobehavioral phenotype by obtaining a sample of neurobehavioral phenotype mapping data from the subject or determining the genotypic topography of the first brain area for a gene based on the gene expression mapping data; determining the neurophenotypic topography of the second brain area for the neurobehavioral determining based on the phenotypic mapping data; contacting the genotypic topography of the first brain area with the neurophenotypic topography of the second brain area to construct an alignment; Neurobehavioral phenotype mapping showing a neurobehavioral phenotype by performing or having a comparison of the sample to the aligned genotypic topography and neurophenotypic topography to determine whether the sample has and (i) if the subject has a neurobehavioral phenotype, as determined by comparing the aligned genotypic topography and neurophenotypic topography to the sample; administering a therapeutic agent that targets one or more genes associated with the genotypic topography and neurophenotypic topography, or (ii) comparing the sample to the aligned genotypic topography and neurophenotypic topography administering a therapeutic agent that targets one or more neurobehavioral phenotypes associated with the aligned genotypic topography and the neurobehavioral topography, if the subject has the neurobehavioral phenotype. , to provide a method. In some embodiments, the method further comprises increasing the likelihood that the treatment to the subject will be effective in treating the neurobehavioral phenotype.
いくつかの実施形態では、本発明のツール及び方法は、患者集団のうちの対象における神経行動学的表現型を検知する方法であって、患者集団内の各対象から神経行動学的表現型マッピングデータのサンプルを得るかまたは得ている工程;神経行動学的表現型に関する第2の脳領野の神経表現型トポグラフィを神経行動学的表現型マッピングデータに基づいて定める工程;第1の脳領野の遺伝子型トポグラフィと第2の脳領野の神経表現型トポグラフィとを接触させてアライメントを構築する工程;及び、アラインされた遺伝子型トポグラフィ及び神経表現型トポグラフィとサンプルを接触させることにより、サンプルにおいて神経行動学的表現型が存在するかどうかを検知する工程を含む、方法を提供する。 In some embodiments, the tools and methods of the present invention are methods of detecting neurobehavioral phenotypes in subjects of a patient population, comprising neurobehavioral phenotype mapping from each subject in the patient population. obtaining or obtaining a sample of data; determining a neurophenotypic topography of a second brain area for a neurobehavioral phenotype based on the neurobehavioral phenotype mapping data; contacting the genotypic topography with the neurophenotypic topography of the second brain area to construct an alignment; A method is provided comprising detecting whether a biological phenotype is present.
実施例1:目的の遺伝子についての遺伝子発現マップ及びマップの検証
本発明者らは、群平均した区画化された遺伝子発現マップをAHBAデータセットから作成するためのアルゴリズムを開発した。Example 1: Gene Expression Maps and Validation of Maps for Genes of Interest We developed an algorithm to generate group-averaged compartmentalized gene expression maps from the AHBA dataset.
図6Aは、皮質(左)及び皮質下(右)における目的の遺伝子4種(OPRK1、PDYN、OXTR、及びPNOC)に関する区画化されたた群平均発現マップを示す。これらのマップは、皮質及び皮質下構造間でのこれらの遺伝子の発現パターンにおける実質的だが系統的な変動及び構造を明らかにする。例えば、皮質内においてPDYNは、前側/内側側頭部領域及び内側前頭前野領域では高発現だが、外側前頭前野領域では低発現を示す。遺伝子発現パターンはまた、それらの脳構造全体(例えば、皮質、尾状核、視床、小脳)にわたる平均値、及び異なる機能的に定義された脳ネットワーク(例えば、聴覚性(AUD)、体性運動性(SOM)、視覚性(VIS))にわたる平均値によって分析及び可視化され得る。図6Bは、この遺伝子PDYNに関するネットワーク毎の構造分析(structure-by-network analysis)を示し、PDYNが線条体(尾状核、被殻、側坐核)の構造において高発現することを示している。 FIG. 6A shows compartmentalized group-mean expression maps for four genes of interest (OPRK1, PDYN, OXTR, and PNOC) in the cortex (left) and subcortex (right). These maps reveal substantial but systematic variation and structure in the expression patterns of these genes between cortical and subcortical structures. For example, within the cortex, PDYN shows high expression in the anterior/medial temporal and medial prefrontal regions, but low expression in the lateral prefrontal region. Gene expression patterns are also averaged across their brain structures (e.g., cortex, caudate, thalamus, cerebellum), and in different functionally defined brain networks (e.g., auditory (AUD), somatomotor can be analyzed and visualized by means of mean values across physicality (SOM), visuality (VIS)). FIG. 6B shows a structure-by-network analysis of this gene PDYN, showing that PDYN is highly expressed in structures of the striatum (caudate, putamen, nucleus accumbens). ing.
セロトニン受容体に関する遺伝子発現マップの妥当性を、PETマップとの対応関係によって評価した。これらの遺伝子発現マップの生物学的妥当性は、それらの意味を解釈し、それらを応用して治療標的の情報を提示する能力に不可欠であるからである。妥当性及び解釈可能性は、PET画像法などの別の実験的方法論からの収束的証拠によって裏付けられ得る。例えば、所与の結合標的の密度についてのPETから導出されたマップ(これは「グラウンドトゥルース」により近い場合がある)と、その結合標的をコードする遺伝子についての発現マップとの間で、高い類似性が観察されることにより、妥当性が裏付けられる。次の論文、Beliveau et al.,A high-resolution in vivo atlas of the human brain’s serotonin system,J.NEUROSCI.(2016)(「Beliveau」)から得たPETマップを使用して、複数のセロトニン受容体サブユニットに関するPETマップ及び遺伝子発現マップを並べて示している。 Validity of gene expression maps for serotonin receptors was assessed by correspondence with PET maps. The biological validity of these gene expression maps is essential for the ability to interpret their meaning and apply them to inform therapeutic targets. Validity and interpretability can be supported by convergent evidence from other experimental methodologies such as PET imaging. For example, high similarity between a PET-derived map of the density of a given binding target (which may be closer to the "ground truth") and the expression map for the gene encoding that binding target Validity is supported by observed sex. The next paper, Beliveau et al. , A high-resolution in vivo atlas of the human brain's serotonin system, J. Am. NEUROS CI. (2016) (“Beliveau”) is used to present side-by-side PET maps and gene expression maps for multiple serotonin receptor subunits.
PETマップと遺伝子発現マップとの間に強い全体的な対応関係が見出された。例えば、両方のマップにおいて、5-HT1ARサブユニット(遺伝子HTR1Aによってコードされる)は、一次視覚皮質において低いレベル及び前側頭皮質において高いレベルを有し、一方で5-HT2ARサブユニット(遺伝子HTR2Aによってコードされる)は、一次視覚皮質において高いレベルを有する。この測定間の対応関係は、遺伝子発現マップの生物学的妥当性及び解釈可能性の裏付けを提供する。 A strong global correspondence was found between the PET and gene expression maps. For example, in both maps, the 5-HT1AR subunit (encoded by the gene HTR1A) has low levels in the primary visual cortex and high levels in the anterior temporal cortex, while the 5-HT2AR subunit (encoded by the gene HTR2A) encoded) have high levels in the primary visual cortex. This correspondence between measurements provides support for the biological plausibility and interpretability of gene expression maps.
図6Cはまた、OPRK1、PDYN、OXTR、及びPNOCの遺伝子発現の高密度な(区画化されたものと対照的な)皮質マップの画像を提供する。 FIG. 6C also provides images of dense (as opposed to compartmentalized) cortical maps of OPRK1, PDYN, OXTR, and PNOC gene expression.
実施例2:2つのGABAA受容体サブユニット遺伝子:GABRA1及びGABRA5に関するT1w/T2w(ミエリン)マップとの相反する相関関係
本発明のプラットフォームにおける重要なステップは、遺伝子発現マップと神経画像処理マップとの間の類似性を測定することである。神経表現型マップのテストケースとして、本発明者らは、構造的MRIから導出されるT1w/T2w比(すなわち、T1重み付きMRI画像とT2重み付きMRI画像との比)のマップを使用した。Glasser et al.,Trends and properties of human cerebral cortex:correlations with cortical myelin content,NEUROIMAGE 93 Pt 2:165-75(2014)。T1w/T2wマップは、皮質の階層的組織に関連する皮質領野の微細構造の特殊化を捉えるため、解釈可能な神経表現型マップとして機能する。Burt。T1w/T2wマップは、感覚皮質において高い値、及び連合皮質において低い値を有する。したがって、皮質の遺伝子発現パターンがT1w/T2wマップとの正相関を呈する場合、それは感覚皮質を優先的にモジュレートするように良く分布している。反対に、皮質の遺伝子発現パターンがT1w/T2wマップとの逆相関を呈する場合、それは連合皮質を優先的にモジュレートするように良く分布している。Example 2: Conflicting Correlations with T1w/T2w (Myelin) Maps for Two GABAAReceptor Subunit Genes: GABRA1 and GABRA5 is to measure the similarity between As a test case for the neurophenotype map, we used a map of the T1w/T2w ratio (ie, the ratio of T1-weighted MRI images to T2-weighted MRI images) derived from structural MRI. Glasser et al. , Trends and properties of human cerebral cortex: correlations with cortical myelin content, NEUROIMAGE 93 Pt 2:165-75 (2014). The T1w/T2w map serves as an interpretable neurophenotype map because it captures the fine-structural specialization of cortical areas related to the hierarchical organization of the cortex. Burt. The T1w/T2w map has high values in the sensory cortex and low values in the associative cortex. Therefore, if the cortical gene expression pattern exhibits a positive correlation with the T1w/T2w map, it is well distributed to preferentially modulate the sensory cortex. Conversely, if the cortical gene expression pattern exhibits an inverse correlation with the T1w/T2w map, it is well distributed to preferentially modulate the association cortex.
図7は、T1w/T2wマップと、それぞれα1及びα5サブユニットをコードする、GABAA受容体のサブユニットをコードする2つの遺伝子:GABRA1及びGABRA5の発現マップとの間の関係を示す。α1及びα5のGABAAサブユニットは、異なる生物物理学的特性、細胞分布、及び発達曲線を有する。Gonzalez-Burgos et.al,GABA neurons and the mechanisms of network oscillations:implications for understanding cortical dysfunction in schizophrenia,SCHIZOPHR.BULL.34:944-961(2008)、Datta et al.,Developmental expression patterns of gabaa receptor subunits in layer 3 and 5 pyramidal cells of monkey prefrontal cortex,CEREB.CORTEX 25:2295-305(2015)。 FIG. 7 shows the relationship between the T1w/T2w map and the expression maps of two genes encoding subunits of the GABAA receptor: GABRA1 and GABRA5, which encode the α1 and α5 subunits, respectively. The α1 and α5 GABAA subunits have different biophysical properties, cellular distribution, and developmental curves. Gonzalez-Burgos et. al, GABA neurons and the mechanisms of network oscillations: Implications for underlying cortical dysfunction in schizophrenia, SCHIZOPHR. BULL. 34:944-961 (2008), Datta et al. , Developmental expression patterns of gabaa receptor subunits in
錐体ニューロンにおいて、α1サブユニットは、細胞体周囲(peri-somatic)領域内に優先的に分布し、パルブアルブミン発現介在ニューロンによって活性化されるシナプス内受容体内にあり、速い動態を有する。対照的に、α5サブユニットは、遠位の樹状領域内に優先的に分布し、ソマトスタチン発現介在ニューロンによって活性化されるシナプス外受容体内にあり、遅い動態を有する。これらはまた、いくつかの薬物に対して差次的な感受性がある。例えば、α5 PAMは、統合失調症における認知症状について調査されてきた。Gill et al.,The role of α5 gabaa receptor agonists in the treatment of cognitive deficits in schizophrenia,CURR.PHARM.DES.20:5069-76(2014)。ここで、本発明者らは、T1w/T2wマップとの関連で、それらの領野間分布における相反する傾向を見出した。 In pyramidal neurons, the α1 subunit is preferentially distributed within the peri-somatic region, within intrasynaptic receptors activated by parvalbumin-expressing interneurons, and has fast kinetics. In contrast, the α5 subunit is preferentially distributed within distal dendritic regions, within extrasynaptic receptors activated by somatostatin-expressing interneurons, and has slow kinetics. They are also differentially sensitive to some drugs. For example, α5 PAM has been investigated for cognitive symptoms in schizophrenia. Gill et al. , The role of α5 gabaa receptor agonists in the treatment of cognitive deficits in schizophrenia, CURR. PHARM. DES. 20:5069-76 (2014). Here, we found conflicting trends in their inter-regional distributions in relation to the T1w/T2w maps.
図7Aは、神経表現型マップの一例として、皮質のT1w/T2wマップの神経表現型トポグラフィを示す。図7B及び図7Cは、それぞれ遺伝子GABRA1及びGABRA5についての皮質における遺伝子発現マップまたは遺伝子型トポグラフィ(上)、ならびにそれらの神経表現型マップとの関係(下)を示す。GABRA1発現は、T1w/T2wとの強い正相関を呈し(スピアマン順位相関、rs=0.52)、一方、GABRA5は逆相関を呈する(rs=-0.61)。FIG. 7A shows the neurophenotype topography of a cortical T1w/T2w map as an example of a neurophenotype map. Figures 7B and 7C show gene expression maps or genotypic topographies in the cortex for the genes GABRA1 and GABRA5, respectively (top) and their relationship to the neural phenotype map (bottom). GABRA1 expression exhibits a strong positive correlation with T1w/T2w (Spearman rank correlation, rs =0.52), while GABRA5 exhibits an inverse correlation (rs =−0.61).
このプラットフォームはまた、ユーザが所与の遺伝子セット内の遺伝子間で一括処理及び比較を行うことを可能にし、遺伝子-マップアライメントスコアを返す。図7Dは、そのような、GABAA受容体サブユニット遺伝子セット(GABRA1、GABRA2、GABRA3、GABRA4、及びGABRA5)を比較するT1w/T2wマップの結果を示す。この分析は、GABRA1が、統計的に有意である神経表現型マップとの強い正相関を呈すること、GABRA2、GABRA3、及びGABRA5が、統計的に有意である強い逆相関を呈すること、GABRA4が、統計的に有意でない弱い相関を呈することを示す。これらの所見は、本発明のプラットフォームの実現可能性を実証し、遺伝子発現マップと神経表現型マップとの間の有意な構造化された関係を明らかにし得ることを実証する。 The platform also allows users to batch and compare between genes within a given gene set, returning gene-map alignment scores. FIG. 7D shows the results of such a T1w/T2w map comparing the GABAA receptor subunit gene sets (GABRA1, GABRA2, GABRA3, GABRA4, and GABRA5). This analysis shows that GABRA1 exhibits a strong positive correlation with the neurophenotype map that is statistically significant, GABRA2, GABRA3, and GABRA5 exhibit a strong negative correlation that is statistically significant, GABRA4 It shows a weak correlation that is not statistically significant. These findings demonstrate the feasibility of the platform of the present invention and demonstrate that significant structured relationships between gene expression maps and neurophenotype maps can be revealed.
このプラットフォームから導出されたこれらの所見は、複数の使用方法と共に、治療薬の開発及び応用における実施可能な決定に関する情報を提示し得る。例えば、一次感覚領野(高いT1w/T2w値)と比べて高次連合野(低いT1w/T2w値)において優先的に脱抑制を処置することが目標である場合を調査することができる。これがもっともらしいのは、複数の神経精神医学的及び神経学的な障害が、感覚皮質領野と比べて連合皮質領野において優先的な変化を伴い得るためである。この例となる目標に関する情報を提示すると、これらの特定の所見は、オフターゲット領野に対する効果を最小限に抑えながら、優先される標的領野に対する効果を最大にすることにおいて、α5 PAMがα1 PAMよりも効果的であり得る証拠を提供する。この証拠は、臨床治験の設計に関する情報を提示して、患者集団(例えば、感覚皮質に対して連合皮質の変化を呈する障害をもつもの)を薬理学的薬物(例えば、感覚皮質領域に対して連合皮質領域を優先的にモジュレートするもの)とより良くアラインするために使用され得る。これらのマップの値の間の相関関係は、遺伝子-マップペアについての類似性の定量的スコアとして役立ち得る。これらの結果は、同じ受容体の2つのサブユニットについてでさえ、神経画像処理マップに関連付けられ得る遺伝子発現パターンの有意義な変動を実証する。 These findings, derived from this platform, along with multiple methods of use, can inform actionable decisions in therapeutic drug development and application. For example, the case where the goal is to treat disinhibition preferentially in the higher association cortex (lower T1w/T2w values) compared to the primary sensory cortex (higher T1w/T2w values) can be investigated. This is plausible because multiple neuropsychiatric and neurological disorders can involve preferential changes in association cortical areas compared to sensory cortical areas. Presented with information on this example target, these particular findings suggest that α5 PAM is more potent than α1 PAM in maximizing effects on prioritized target areas while minimizing effects on off-target areas. provide evidence that it can also be effective. This evidence informs the design of clinical trials to target patient populations (e.g., those with disorders exhibiting association cortical changes to sensory cortices) to pharmacological agents (e.g., to sensory cortical regions). that preferentially modulate association cortical regions). The correlation between these map values can serve as a quantitative score of similarity for gene-map pairs. These results demonstrate significant variation in gene expression patterns that can be associated with neuroimaging maps, even for two subunits of the same receptor.
図7Eは、本発明のプラットフォームの別の実施形態による画像を示す。ここに示す結果は、図を生成するために使用される表面ベースのマッピング及び内挿方法(区画化対高密度)における方法論的な差異を含むが必ずしもこれに限定されるとは限らない理由で、図7B及び図7Cに提示されるものと定性的にではなく定量的に異なる。 FIG. 7E shows an image according to another embodiment of the platform of the invention. The results presented here are for reasons including, but not necessarily limited to, methodological differences in the surface-based mapping and interpolation methods (compartmentalization vs. high density) used to generate the figures. , differ quantitatively rather than qualitatively from those presented in FIGS. 7B and 7C.
実施例3:目的の遺伝子についての遺伝子-マップ相関関係
図8は、目的の遺伝子7種(PDYN、OXTR、OPRK1、PNOC、OXT、AVP、及びOPRL1)についてのスコア、ここではT1w/T2w(ミエリン)マップとの相関関係を示す。本発明者らは、7つの遺伝子中4つ(PDYN、OXTR、OPRK1、及びPNOC)がT1w/T2w(ミエリン)マップ値との有意性の高い逆相関を有し、1つの遺伝子(OXT)のみが有意な正相関を有し、2つの遺伝子(AVP、OPRL1)は有意な相関を有しなかったことを見出した。Example 3: Gene-Map correlations for genes of interest ) shows the correlation with the map. We found that four out of seven genes (PDYN, OXTR, OPRK1, and PNOC) had highly significant inverse correlations with T1w/T2w (myelin) map values, and only one gene (OXT) had a significant positive correlation and two genes (AVP, OPRL1) had no significant correlation.
これらの所見は、本発明のプラットフォームの実現可能性を実証し、遺伝子発現マップと神経画像処理マップとの間の有意な構造化された関係を明らかにし得ることを実証する。 These findings demonstrate the feasibility of the platform of the present invention and demonstrate that significant structured relationships between gene expression and neuroimaging maps can be revealed.
実施例4:プラットフォーム双方向性の原理証明の実証
図9A、9B、10A、及び10Bは、HCPタスク活性化マップを使用した双方向性プラットフォームの原理証明の実証を提示する。Example 4: Platform Interactivity Proof-of-Principle Demonstration Figures 9A, 9B, 10A, and 10B present a proof-of-principle demonstration of an interactive platform using HCP task activation maps.
図9A及び9Bは、遺伝子から表現型へのアプローチを表す。ここで、原理証明の実施は、図5の方向(A)に対応する、治療標的としての遺伝子から神経行動学的表現型への方向に流れる。Human Connectome Projectにおける特定のタスクに関して、皮質についてのfMRIから導出されたタスク活性化マップから、例となる神経表現型マップのセットを算出した。(A)において、遺伝子発現マップはOPRK1のものであり、(B)では、OPRL1のものである。プロットされているのは、皮質の遺伝子発現マップと、神経行動学的表現型マップのセットのうちの各々との間の相関関係である。遺伝子-表現型スコア(ここではスピアマン順位相関)は、神経行動学的表現型間で著しく変動し、2つの例となる遺伝子に対して異なる。 Figures 9A and 9B represent the gene-to-phenotype approach. Here, the proof-of-principle implementation flows in the direction from genes as therapeutic targets to neurobehavioral phenotypes, corresponding to direction (A) in FIG. For specific tasks in the Human Connectome Project, a set of exemplary neurophenotype maps was calculated from task activation maps derived from fMRI of the cortex. In (A) the gene expression map is for OPRK1 and in (B) for OPRL1. Plotted are the correlations between the cortical gene expression map and each of a set of neurobehavioral phenotype maps. Gene-phenotype scores (here Spearman rank correlation) vary significantly between neurobehavioral phenotypes and are different for the two example genes.
図10A及び10Bは、表現型から遺伝子へのアプローチを表す。ここで、原理証明の実施は、図5の方向(B)に対応する、神経行動学的表現型から治療標的としての遺伝子への方向に流れる。Human Connectome Projectにおける特定のタスクに関して、皮質についてのfMRIから導出された2つのタスク活性化マップ間の対比として、例となる2つの神経表現型マップの各々を算出した。(A)において、表現型マップは、物語タスクと数学タスクとの対比(言語処理を分離させるため)であり、(B)では、恐怖表情の刺激提示と中性表情の刺激提示との対比(恐怖処理を分離させるため)である。プロットされているのは、神経行動学的表現型マップと、薬物標的をコードし得る様々な遺伝子についての遺伝子発現マップのセットのうちの各々との間の相関関係である。遺伝子-表現型スコア(ここではスピアマン順位相関)は、遺伝子間で著しく変動し、2つの例となる神経行動学的表現型に対して異なる。 Figures 10A and 10B represent the phenotype-to-gene approach. Here, the proof-of-principle implementation flows in the direction from neurobehavioral phenotypes to genes as therapeutic targets, corresponding to direction (B) in FIG. For a specific task in the Human Connectome Project, each of two exemplary neurophenotype maps was calculated as a contrast between two task activation maps derived from fMRI of the cortex. In (A), the phenotype map is a comparison between the story task and the math task (to separate language processing), and in (B), the contrast between the stimulus presentation of fearful facial expressions and the stimulus presentation of neutral facial expressions ( to separate fear processing). Plotted are the correlations between the neurobehavioral phenotype map and each of a set of gene expression maps for different genes that may encode drug targets. Gene-phenotype scores (here Spearman rank correlations) vary significantly between genes and are different for the two exemplary neurobehavioral phenotypes.
こうした、所与の目的の遺伝子に対する表現型間、及び所与の表現型に対する遺伝子間での双方向性一括処理により、例えば、(遺伝子から表現型への方向における)臨床治験における所与の薬物の有効性を評価するためのタスクもしくは行動学的測定の選択、または(表現型から遺伝子への方向における)所与の行動もしくは認知の欠損に対する候補薬物標的の同定及び選択などの、複数の使用方法における実施可能な決定に関する情報を提示することができる。 This bi-directional batching between phenotypes for a given gene of interest and between genes for a given phenotype allows, for example, a given drug in a clinical trial (in the gene-to-phenotype direction) multiple uses, such as selection of tasks or behavioral measures to assess the efficacy of Information about possible decisions in the method can be presented.
実施例5:遺伝子APOEについての遺伝子対遺伝子のアライメント。
1つの使用方法は、図5の方向(C)に対応する、所与の障害またはプロセスに関与する遺伝子に対する類似性に基づいた薬物標的の同定である。例えば、遺伝子APOEはアルツハイマー病において重要である。APOE及びその関連タンパク質は薬理学的にモジュレートするのが困難であることが証明されているため、治療方策は、脳全体の遺伝子発現パターンがAPOEのものとアラインする別の薬物標的をモジュレートすることであり得る。このプラットフォームは、遺伝子間で一括操作すること、及び発現パターンの遺伝子対遺伝子のアライメントを定量化することに基づいて、そのような遺伝子を同定することができる。図11A及び11Bは、遺伝子から遺伝子へのアプローチを例示する。図11Aは、4つのNMDA受容体サブユニット(GRIN2A、GRIN2B、GRIN2C、及びGRIN2D)についての皮質の遺伝子類似性スコアを示す。図11Bは、4つのGABAA受容体サブユニット(GABRA1、GABRA2、GABRA3、GABRA4、及びGABRA5)についての皮質の遺伝子類似性スコアを示す。バックグラウンド分布ヒストグラムは、全ての利用可能な遺伝子にわたるスコアの分布を示す。これらの分析は、これらの遺伝子セットの中でGRIN2C及びGABRA2が、APOEと類似性の高い皮質発現トポグラフィを有し、全ての利用可能な遺伝子のうちの上位1%に入ることを示す。この遺伝子対遺伝子のアライメントは、GRIN2C及びGABRA2に関連する受容体タンパク質を標的とする薬物が、APOEを強く発現する同じ皮質領域を優先的にモジュレートするように良く分布している証拠を提供する。これらの結果は、APOEとの高いアライメントを有する遺伝子(例えば、GRIN2C及びGABRA2)の、アルツハイマー病のための潜在的な治療標的としての同定及び選択に関する情報を提示し得る。Example 5: Gene-by-Gene Alignment for the Gene APOE.
One method of use is the identification of drug targets based on their similarity to genes involved in a given disorder or process, corresponding to direction (C) in FIG. For example, the gene APOE is important in Alzheimer's disease. Because APOE and its related proteins have proven difficult to modulate pharmacologically, therapeutic strategies modulate alternative drug targets whose gene expression patterns throughout the brain align with those of APOE. can be This platform can identify such genes based on batch manipulation among genes and quantification of gene-by-gene alignments of expression patterns. Figures 11A and 11B illustrate the gene-to-gene approach. FIG. 11A shows cortical gene similarity scores for four NMDA receptor subunits (GRIN2A, GRIN2B, GRIN2C, and GRIN2D). FIG. 11B shows cortical gene similarity scores for the four GABAA receptor subunits (GABRA1, GABRA2, GABRA3, GABRA4, and GABRA5). Background distribution histograms show the distribution of scores over all available genes. These analyzes indicate that among these gene sets GRIN2C and GABRA2 have cortical expression topographies that are highly similar to APOE and are in the top 1% of all available genes. This gene-by-gene alignment provides evidence that drugs targeting receptor proteins related to GRIN2C and GABRA2 are well distributed to preferentially modulate the same cortical regions that strongly express APOE. . These results may provide information regarding the identification and selection of genes with high alignment with APOE (eg, GRIN2C and GABRA2) as potential therapeutic targets for Alzheimer's disease.
実施例6:遺伝子発現トポグラフィは、LSDの薬理学的効果の脳全体におけるパターンに関連する。
複数の使用方法は、遺伝子の発現マップと、表現型に関連する神経画像処理マップとのアライメントを評価して、薬理学的治療薬についての意思決定に関する情報を提示する。薬理学的治療薬についての予測を行うためのこのアプローチの有用性及び実現可能性は、薬物が神経画像処理測定値に及ぼす脳全体の効果が、その特定の薬物によってモジュレートされる受容体の遺伝子発現トポグラフィに関連し得ることを実証することにより、裏付けられ得る。Example 6: Gene expression topography correlates with brain-wide patterns of pharmacological effects of LSD.
Multiple uses assess the alignment of gene expression maps with phenotype-associated neuroimaging maps to inform decision-making about pharmacological therapeutics. The utility and feasibility of this approach for making predictions about pharmacological therapeutic agents is due to the fact that the whole-brain effect of a drug on neuroimaging measures depends on the number of receptors modulated by that particular drug. It can be supported by demonstrating that it can be related to gene expression topography.
図12は、本プラットフォームが、遺伝子発現パターンから薬物の神経に対する効果への結び付けを行うことができることを示す。この研究では、健康なヒト対象へのリゼルグ酸ジエチルアミド(LSD)の急性投与によって誘導された機能的結合性における変化を測定するために、安静時fMRIを使用した。Preller et al.,Changes in global and thalamic brain connectivity in LSD-induced altered states are attributable to the 5-HT2A receptor.ELIFE.(印刷中)(「Preller」)。図12Aは、後頭部視覚皮質における大きな増加を呈する、平均機能的結合性(大域的脳結合性、GBC)における変化を示す、fMRIから導出された皮質マップを示す。重要なことに、この神経の変化、ならびにLSDの行動学的効果は、5-HT2Aセロトニン受容体の選択的アンタゴニストであるケタンセリンの前投与によって遮断されることが見出された。Preller。この所見は、LSDの神経及び行動に対する効果における、5-HT2A受容体をコードする遺伝子HTR2Aの関与を強く示す。図12Bは、HTR2Aを含む3つのセロトニン受容体遺伝子に関する遺伝子発現マップを示す。図12Cは、LSD関連神経表現型マップと、セロトニン及びドパミン受容体をコードする6つの候補遺伝子との間の、遺伝子-マップ相関関係を示す。これら6つの候補遺伝子の中で、HTR2Aが、LSD関連神経表現型マップとの最大のアライメント(すなわち、最も高い正相関)を呈する。図12Dは、これらの相関値を、AHBAデータセットにおける全ての利用可能な遺伝子間のスコアの分布を示す灰色のバックグラウンド分布ヒストグラムとの関連で示し、HTR2Aが、LSD関連神経表現型マップとのそのアライメントにおける全ての遺伝子の上位5%に入ることを示している。Preller。この例は、本プラットフォームが、神経に対する薬理の効果を遺伝子発現のトポグラフィに基づいて予測する可能性を例示する。 FIG. 12 shows that the platform can make connections from gene expression patterns to neurological effects of drugs. In this study, resting-state fMRI was used to measure changes in functional connectivity induced by acute administration of lysergic acid diethylamide (LSD) to healthy human subjects. Preller et al. , Changes in global and thalamic brain connectivity in LSD-induced altered states are attributeable to the 5-HT2A receptor. ELIFE. (Printing) ("Preller"). FIG. 12A shows cortical maps derived from fMRI showing changes in mean functional connectivity (global brain connectivity, GBC) exhibiting large increases in the occipital visual cortex. Importantly, this neuronal change, as well as the behavioral effects of LSD, were found to be blocked by pretreatment with ketanserin, a selective antagonist of 5-HT2A serotonin receptors. Preller. This finding strongly implicates the gene HTR2A, which encodes the 5-HT2A receptor, in the neurological and behavioral effects of LSD. FIG. 12B shows gene expression maps for three serotonin receptor genes, including HTR2A. FIG. 12C shows gene-map correlations between LSD-associated neurophenotype maps and six candidate genes encoding serotonin and dopamine receptors. Among these six candidate genes, HTR2A exhibits the greatest alignment (ie, highest positive correlation) with the LSD-associated neurophenotype map. Figure 12D shows these correlation values in relation to a gray background distribution histogram showing the distribution of scores among all available genes in the AHBA dataset, showing that HTR2A correlates with the LSD-associated neurophenotype map. It is shown to be in the top 5% of all genes in that alignment. Preller. This example illustrates the potential of the platform to predict the effects of pharmacology on neurons based on gene expression topography.
実施例7:BSNIPデータセットにおける薬物標的及び表現型の双方向性同定。
図13は、BSNIPデータセットにおける薬物標的及び表現型の双方向性同定を示すプラットフォームの応用を示す。BSNIP(Bipolar-Schizophrenia Network for Intermediate Phenotypes)データセットは、統合失調症-双極性の連続体に沿った多数の対象からの安静時fMRIデータ及び症状スコアを含む。Tamminga et al.,Bipolar and Schizophrenia Network for Intermediate Phenotypes:Outcomes Across the Psychosis Continuum.SCHIZOPHR.BULL.40:S131-S137(2014)(「Tamminga」)。安静時fMRI及び行動学的症状スコアの複合分析により、個人変動の潜在的な神経行動学的ディメンションが複数もたらされた。その各々が、行動学的症状プロファイルと、GBCにおける個人差の関連する脳マップとの両方を特徴付ける。正(明色)の領域においてGBCが高く、負(暗色)の領域においてGBCが低い個人は、その潜在的ディメンションと関連する症状に高いスコアが付けられる。図13A及び図13B(上)は、個人変動の2つの潜在的ディメンションに関する行動学的症状プロファイル及び神経GBCマップを示す。個々の患者は、一方の特定の潜在的ディメンションと類似するが他方とは類似しない神経行動学的表現型を呈するか、または表現型の混合を呈する場合がある。Example 7: Bidirectional identification of drug targets and phenotypes in the BSNIP dataset.
Figure 13 shows an application of the platform showing interactive identification of drug targets and phenotypes in the BSNIP dataset. The BSNIP (Bipolar-Schizophrenia Network for Intermediate Phenotypes) dataset contains resting fMRI data and symptom scores from a number of subjects along the schizophrenia-bipolar continuum. Tamminga et al. , Bipolar and Schizophrenia Network for Intermediate Phenotypes: Outcomes Across the Psychosis Continuum. SCHIZO PHR. BULL. 40: S131-S137 (2014) (“Tamminga”). A combined analysis of resting fMRI and behavioral symptom scores yielded multiple potential neurobehavioral dimensions of individual variability. Each characterizes both behavioral symptom profiles and associated brain maps of individual differences in GBC. Individuals with a high GBC in the positive (light) domain and a low GBC in the negative (dark) domain are scored highly for symptoms associated with that potential dimension. Figures 13A and 13B (top) show behavioral symptom profiles and neural GBC maps for two potential dimensions of individual variability. Individual patients may exhibit neurobehavioral phenotypes similar to one particular underlying dimension but not the other, or may exhibit a mixture of phenotypes.
これらの皮質表現型マップに対するプラットフォーム。各神経表現型マップについて、AHBAデータセットにおける全ての遺伝子間で遺伝子-マップ相関関係スコアを計算し、図13A及び図13B(下)に示されるバックグラウンド分布ヒストグラムを得た。図13A及び図13B(下)はまた、特定の目的遺伝子についての遺伝子-マップ相関関係スコアを示す。図13A(上)に示されている潜在的ディメンション「神経表現型A」については、遺伝子OPRK1に対するスコアはゼロに近く、OPRK1の皮質発現トポグラフィが、その表現型に関連する神経マップと相関しないことを示している。対照的に、図13B(上)に示されている潜在的ディメンション「神経表現型B」については、OPRK1は、全ての遺伝子の最も端にある1%において強い逆相関を呈する。 A platform for these cortical phenotype maps. For each neurophenotype map, gene-map correlation scores were calculated between all genes in the AHBA dataset, resulting in background distribution histograms shown in FIGS. 13A and 13B (bottom). Figures 13A and 13B (bottom) also show gene-map correlation scores for specific genes of interest. For the potential dimension "neural phenotype A" shown in FIG. 13A (top), the score for the gene OPRK1 is close to zero, indicating that the cortical expression topography of OPRK1 does not correlate with the neural maps associated with that phenotype. is shown. In contrast, for the potential dimension 'neurophenotype B' shown in Figure 13B (top), OPRK1 exhibits a strong inverse correlation in the extreme 1% of all genes.
これらの結果は、OPRK1が、皮質トポグラフィにおける重複に起因して、神経表現型Bによってもたらされる行動学的症状プロファイルに対する有望な治療標的である証拠を提供する。したがって、神経表現型Bの症状プロファイルは、カッパ-オピオイド医薬のための臨床治験の設計において、患者セグメンテーションのために使用され得る。薬理学的神経画像処理は、カッパ-オピオイドのモジュレーションによるGBCに対する影響を特徴付けることにより、更なる有用な証拠を提供し得る。この例は、プラットフォームのオペレーションにより、治療薬の開発及び応用との関連における意思決定に関する情報提示がどのように行われ得るかを示す。 These results provide evidence that OPRK1 is a promising therapeutic target for the behavioral symptom profile mediated by neurophenotype B due to its overlap in cortical topography. Therefore, neurophenotype B symptom profiles can be used for patient segmentation in the design of clinical trials for kappa-opioid drugs. Pharmacological neuroimaging may provide additional useful evidence by characterizing the effects of kappa-opioid modulation on GBC. This example shows how the operation of the platform can inform decision-making in the context of therapeutic drug development and application.
実施例8:負の結果の説明及び異なる表現型のための治療剤の再利用を実証する遺伝子対表現型の実施例
以下の実施例は、H3アンタゴニストがCIASにおいて試験されるべきかどうかという疑問に対処する。ここで、答えは「いいえ」である(r=0.04)。そこで別のフォローアップの疑問は、H3インバースアゴニストが有用であるのはどの表現型に対してか?である。Example 8: Gene vs Phenotype Example Demonstrating Negative Results Explanation and Repurposing of Therapeutic Agents for Different Phenotypes The following example addresses the question of whether H3 antagonists should be tested in CIAS. deal with. Here the answer is "no" (r=0.04). So another follow-up question is for which phenotypes are H3 inverse agonists useful? is.
薬物の再利用の可能性を裏付けるには、遺伝子と表現型との間の関係を調査することができる。ここで、遺伝子HRH3に関する遺伝子マップを図14Aに提示し、BSNIP Symptom Correlation GBCS Comp Correlation rZに関する表現型マップを図14Bに提示する。遺伝子と表現型との間の類似性スコアから、2つのマップ間の相関関係及び関連するp値を計算する。ここで、図14Cは、HRH3遺伝子と、BSNIP Symptom Correlation GBCS Comp Correlation rZに関する表現型マップとを示し、ここでは皮質のみが、アライメントのためにマッピングしたようにマスクされた。0.039666395207の相関測度が得られた。 To support drug repurposing potential, relationships between genes and phenotypes can be investigated. Here, the genetic map for gene HRH3 is presented in Figure 14A and the phenotype map for BSNIP Symptom Correlation GBCS Comp Correlation rZ is presented in Figure 14B. From the similarity scores between genes and phenotypes, correlations and associated p-values between the two maps are calculated. Here, FIG. 14C shows the HRH3 gene and phenotype map for the BSNIP Symptom Correlation GBCS Comp Correlation rZ, where only the cortex was masked as mapped for alignment. A correlation measure of 0.039666395207 was obtained.
ここで、ヒトヒスタミンH3受容体をコードするHRH3遺伝子の発現パターンを、Brief Assessment of Cognition in Schizophrenia(BACS)Batteryに関連する大域的脳結合性(Global Brain Connectivity)の測定から導出された関連する表現型マップと比較した。皮質のレベルにおいて、これら2つのマップ間のアライメントは非常に乏しかった(ピアソンのr=0.04)。この結果は、H3受容体を標的とする薬理学的介入が、統合失調症に関連する認知機能障害を改善することは期待されないことを示唆する。 Here, we describe the expression pattern of the HRH3 gene, which encodes the human histamine H3 receptor, as a relevant expression derived from measurements of Global Brain Connectivity associated with the Brief Assessment of Cognition in Schizophrenia (BACS) Battery. compared with the type map. At the cortical level, the alignment between these two maps was very poor (Pearson's r=0.04). This result suggests that pharmacological interventions targeting H3 receptors are not expected to ameliorate cognitive impairment associated with schizophrenia.
実際、Egan及び共同研究者らは、MK-0249を用いたヒスタミン放出の促進が、統合失調症患者の認知欠損を改善できなかったことを示した。Egan et al.,Randomized crossover study of the histamine H3 inverse agonist MK-0249 for the treatment of cognitive impairment in patients with schizophrenia,SCHIZOPHR RES.,146(1-3):224-30 May(2013);doi:10.1016/j.schres.2013.02.030(2013)。しかしながら、H3受容体の発現は、PANSS評価尺度の全般的サブスケールを構成する質問に関連する全脳結合性の変化と有意に相関した(r=0.21;P<0.0001)。この結果は、PANSSの全般的スケールによって指標付けされた不安、うつ病、または注意力不足などの症状を示す統合失調症患者におけるH3受容体のモジュレーションが有効である可能性を示唆する。 Indeed, Egan and coworkers showed that stimulation of histamine release with MK-0249 failed to ameliorate cognitive deficits in schizophrenic patients. Egan et al. , Randomized crossover study of the histamine H3 inverse agonist MK-0249 for the treatment of cognitive impairment in patients with schizophrenia, SCHIZOPHR RES. , 146(1-3):224-30 May (2013); doi: 10.1016/j. schres. 2013.02.030 (2013). However, H3 receptor expression was significantly correlated with changes in whole-brain connectivity associated with the questions that make up the global subscale of the PANSS rating scale (r=0.21; P<0.0001). The results suggest that modulation of H3 receptors in schizophrenia patients who exhibit symptoms such as anxiety, depression, or attention deficits as indexed by the PANSS global scale may be beneficial.
実施例9:遺伝子対遺伝子の実施例(新規治療薬及び患者選択)
以下の実施例は、パーキンソン病における疾患の変容をどのように追求するかという疑問に対処する。Example 9: Gene-to-Gene Examples (Novel Therapeutic Agents and Patient Selection)
The following examples address the question of how to pursue disease transformation in Parkinson's disease.
CNS疾患における新規の治療介入及び患者選択をサポートするには、疾患に関与する遺伝子と、関与が未だ示されていない別の遺伝子との間の関係を調査することができる。2つの遺伝子間の類似性スコアは、2つの発現マップ間の相関関係及び関連するp値を計算する。パーキンソン病(PD)患者における近年の遺伝学的所見は、アルファ-シヌクレイン(SNCA)、グルコセレブロシダーゼ(GBA)、及びロイシンリッチリピートキナーゼ(LRRK2)を標的とすることにより、特定の遺伝子型に対する治療法を開発する可能性をもたらした。これらの遺伝子によってコードされるタンパク質を直接標的とすることに加えて、他のタンパク質がこれらのタンパク質を間接的にモジュレートして、PD患者における症状または疾患進行を変容させることができると示唆する証拠がある。 To support novel therapeutic interventions and patient selection in CNS diseases, relationships between genes involved in disease and other genes whose involvement has not yet been shown can be explored. The similarity score between two genes calculates the correlation and associated p-value between the two expression maps. Recent genetic observations in Parkinson's disease (PD) patients suggest that therapeutics for specific genotypes by targeting alpha-synuclein (SNCA), glucocerebrosidase (GBA), and leucine-rich repeat kinase (LRRK2) provided the possibility of developing law. In addition to directly targeting the proteins encoded by these genes, we suggest that other proteins may indirectly modulate these proteins to alter symptoms or disease progression in PD patients. I have proof.
例えば、β2-アドレナリン受容体(ADRB2によりコードされる)アゴニストは、アルファ-シヌクレインを調節し得る。Mittal et al.,β2-Adrenoreceptor is a regulator of the α-synuclein gene driving risk of Parkinson’s disease,SCIENCE,357(6354):891-898(2017)。また、D2受容体(DRD2によりコードされる)を介して作用するドパミンアゴニストの使用は、LRRK2変異を有するPD患者において有益であり得る。Tozzi et al.,Dopamine D2 receptor activation potently inhibits striatal glutamatergic transmission in a G2019S LRRK2 genetic model of Parkinson’s disease,NEUROBIOL DIS,118:1-8(2018)。ADRB2とSNCAとの間の類似性スコア(r=-0.16;P<0.0001)、ならびにDRD2とLRRK1との間の類似性スコア(r=0.2;P<0.0001)は、既刊文献と一致している。 For example, β2-adrenergic receptor (encoded by ADRB2) agonists can modulate alpha-synuclein. Mittal et al. , β2-Adrenoreceptor is a regulator of the α-synuclein gene driving risk of Parkinson's disease, SCIENCE, 357(6354): 891-898 (2017). Also, the use of dopamine agonists acting through the D2 receptor (encoded by DRD2) may be beneficial in PD patients with LRRK2 mutations. Tozzi et al. , Dopamine D2 receptor activation potently inhibits striatal glutamatergic transmission in a G2019S LRRK2 genetic model of Parkinson's disease, NEUROBIOL DIS, 821-8. The similarity score between ADRB2 and SNCA (r=−0.16; P<0.0001) and between DRD2 and LRRK1 (r=0.2; P<0.0001) was , consistent with published literature.
これらの観察は、本明細書に記載のツール及び方法を使用して、PD患者の症状及び/または疾患進行を変化させ得る非自明の遺伝子を同定するために拡大適用され得る。PNOC遺伝子(ペプチドN/OFQをコードする)についての全脳マップを、PDに関与する遺伝子についてのマップと比較することにより、SNCA(r=0.51;P<0.0001)、LRRK2(r=0.62;P<0.0001)、及びGBA(r=0.71;P<0.0001)の変異を有する患者におけるN/OFQシグナル伝達の関与を予測することができる。この仮説は、アルファ-シヌクレインに基づくPDモデルにおいて、NOP受容体(NOPR)を介してN/OFQシグナル伝達を遮断することの効果を調査することにより、また、これらの変異を有するPD患者においてNOPRアンタゴニストを試験することにより、前臨床的に試験することができる。更に、このアプローチを応用して、GBA活性を調節し得る新規の薬物標的、例えば、ジペプチジルペプチダーゼ様タンパク質をモジュレートするものを同定することができる(DPP10-GBA相関:r=0.85;99.3%類似性)。 These observations can be extended, using the tools and methods described herein, to identify non-obvious genes that may alter symptoms and/or disease progression in PD patients. By comparing whole brain maps for the PNOC gene (encoding peptide N/OFQ) with maps for genes involved in PD, SNCA (r=0.51; P<0.0001), LRRK2 (r = 0.62; P<0.0001), and the involvement of N/OFQ signaling in patients with mutations in GBA (r=0.71; P<0.0001). This hypothesis was supported by investigating the effects of blocking N/OFQ signaling through the NOP receptor (NOPR) in alpha-synuclein-based PD models, and by investigating the effect of blocking N/OFQ signaling through the NOP receptor (NOPR) in PD patients with these mutations. It can be tested preclinically by testing antagonists. Furthermore, this approach can be applied to identify novel drug targets that can modulate GBA activity, such as those that modulate dipeptidyl peptidase-like proteins (DPP10-GBA correlation: r=0.85; 99.3% similarity).
実施例10:表現型対遺伝子の実施例(患者スクリーニングのリスク及び新規の治療介入
以下の実施例は、どの非疾患表現型が遺伝子に関連し得るかという疑問に対処する。Example 10 Phenotype Versus Gene Example (Risks of Patient Screening and Novel Therapeutic Interventions ) The following example addresses the question of which non-disease phenotypes can be associated with genes.
治療介入によってより高いリスクにさらされ得る患者を同定するため、または新規の治療薬の同定の指針とするために、特定の表現型と、それを含む症状に関連する遺伝子または遺伝子セットとの間の関係を調査することができる。 between a particular phenotype and the gene or gene set associated with the condition that includes it, to identify patients who may be placed at higher risk by therapeutic intervention or to guide the identification of new therapeutic agents relationship can be investigated.
例えば、HIV-1を抑制するのに有効な抗レトロウイルス薬であるエファビレンツは、神経精神医学的症状のリスクを増加させることが公知である。こうした神経精神医学的な有害事象は、この薬物の複数の薬物標的との相互作用に起因するとされている。Dalwadi et al.,Molecular mechanisms of serotonergic action of the HIV-1 antiretroviral efavirenz,PHARMACOL RES.,110:10-24(2016)。 For example, efavirenz, an effective antiretroviral drug in suppressing HIV-1, is known to increase the risk of neuropsychiatric symptoms. These neuropsychiatric adverse events have been attributed to interactions of this drug with multiple drug targets. Dalwadi et al. , Molecular mechanisms of serotonergic action of the HIV-1 antiretroviral efavirenz, PHARMACOL RES. , 110:10-24 (2016).
成人用自己記入式(ASR)症候群スケール(SS)には、個人がうつ病、気分、不安、ADHD、及び精神病的行動などの精神症状を報告することを可能にする症状ベースのスケールが含まれる。ASRにおける回答を安静時脳結合性の測定値と比較することにより、このスケールに沿った行動学的変動と大域的脳結合性(GBC)との間の関係を評価することができる。図15Cの表現型マップ(HCP Cognitive Behavioral GBC ASR SS Correlation)に示されるように、赤色の「ホットスポット」は、高いASRスコアを有する個人における超結合(hyperconnected)領域に対応する。 The Adult Self-Reported (ASR) Syndrome Scale (SS) includes a symptom-based scale that allows individuals to report psychiatric symptoms such as depression, mood, anxiety, ADHD, and psychotic behavior. . By comparing responses on the ASR to measures of resting brain connectivity, the relationship between behavioral fluctuations along this scale and global brain connectivity (GBC) can be assessed. As shown in the phenotype map (HCP Cognitive Behavioral GBC ASR SS Correlation) in Figure 15C, the red "hotspots" correspond to hyperconnected regions in individuals with high ASR scores.
図15Dは、表現型遺伝子分布チャートを示す。図15Eは、6つの遺伝子(HTR6、CHRM3、CHRM1、MAOA、HTR2A、及びHTR2C)についての遺伝子-マップ相関関係を示す。 FIG. 15D shows a phenotypic gene distribution chart. FIG. 15E shows gene-map correlations for six genes (HTR6, CHRM3, CHRM1, MAOA, HTR2A, and HTR2C).
次に、報告されている観察に基づいて、異なる薬物に関する新たな予測を行う。 New predictions for different drugs are then made based on reported observations.
次に、ASR-SS GBCマップと、エファビレンツが相互作用する分子標的との間の関係を調査することができる。HTR6遺伝子がASR-SS GBCマップと高い相関性を呈する(r=0.39、99.7%類似性)という所見は、エファビレンツに関連する精神医学的副作用の少なくとも一部が、薬物の5HT6受容体におけるインバースアゴニスト活性及びムスカリン性M3(CHRM3)受容体におけるアンタゴニスト活性に起因し得ると示唆する既刊文献と一致している。 The relationship between the ASR-SS GBC map and the molecular targets with which efavirenz interacts can then be investigated. The finding that the HTR6 gene is highly correlated with the ASR-SS GBC map (r=0.39, 99.7% similarity) suggests that at least some of the psychiatric side effects associated with efavirenz are due to the drug's 5HT6 receptors. This is consistent with published literature suggesting that it may be due to inverse agonist activity in the body and antagonist activity at the muscarinic M3 (CHRM3) receptor.
我々は、がんまたはHIV感染を処置するために異なる薬を受けている個人に精神症状のリスクがあり得るかどうかを評価するために、この観察を拡大適用する。図15Fは、表現型遺伝子分布チャートを示す。 We extend this observation to assess whether individuals receiving different medications to treat cancer or HIV infection may be at risk for psychiatric symptoms. FIG. 15F shows a phenotypic gene distribution chart.
そのような2つの薬物はプレリキサホル及びマラビロクであり、これらは、ケモカイン受容体のCXCR4及びCXCR(プレリキサホル)ならびにCCR5(マラビロク)を標的とする。遺伝子比較によるASR-SS GBC表現型は、これらの遺伝子が精神医学的表現型マップとの統計的に有意な相関性を有することを明らかにした(CCR5、r=0.24;CXCR7、r=0.25;CXCR4、r=0.28、94.1%類似性)。これらの結果は、図15Gに示してある。これらの結果は、プレリキサホルまたはマラビロクを受けている個人に、ASR-SSフォームを使用した精神症状のスクリーニングを行うべきであることを示唆する。 Two such drugs are plelixafor and maraviroc, which target the chemokine receptors CXCR4 and CXCR (plelixafor) and CCR5 (maraviroc). ASR-SS GBC phenotypes by gene comparison revealed that these genes had statistically significant correlations with the psychiatric phenotype map (CCR5, r=0.24; CXCR7, r=0.24; 0.25; CXCR4, r=0.28, 94.1% similarity). These results are shown in FIG. 15G. These results suggest that individuals receiving plerixafor or maraviroc should be screened for psychiatric symptoms using the ASR-SS form.
上述の様々な実施形態は、更なる実施形態を提供するために組み合わせてよい。本明細書において参照及び/または出願データシートに列記した米国特許、米国特許出願公開、米国特許出願、外国特許、外国特許出願、及び非特許公開文献の全ては、2017年10月2日に出願された米国仮出願第62/567,087号を含め、参照によりその全体が本明細書に組み込まれる。諸実施形態の諸態様は、必要であれば、なおも更なる実施形態を提供するために、様々な特許、出願、及び公開文献の概念を用いるように改変してよい。上記に詳述した説明を踏まえ、これら及び他の変更を諸実施形態に行ってよい。概して、続く特許請求の範囲において使用される用語は、本明細書及び特許請求の範囲において開示される特定の実施形態に特許請求の範囲を限定するものと解釈されてはならず、そのような特許請求の範囲の権利範囲と等価な全範囲と併せて可能性のあるあらゆる実施形態を含むものと解釈されるべきである。したがって、特許請求の範囲は本開示によって限定されるものではない。 The various embodiments described above may be combined to provide further embodiments. All U.S. patents, U.S. patent application publications, U.S. patent applications, foreign patents, foreign patent applications, and non-patent publications referenced and/or listed in application data sheets herein were filed on October 2, 2017. US Provisional Application No. 62/567,087, which is incorporated herein by reference in its entirety. Aspects of the embodiments may be modified, if necessary, to employ concepts from the various patents, applications and publications to provide still further embodiments. These and other changes may be made to the embodiments in light of the above detailed description. In general, any terminology used in the following claims should not be construed as limiting the claims to the particular embodiments disclosed in the specification and claims, nor should such claims be construed as limiting the scope of the claims. It should be construed to include any and all possible embodiments along with the full scope of equivalents of the claims. Accordingly, the claims are not limited by the disclosure.
Claims (14)
Translated fromJapaneseコンピュータ命令を記憶するメモリと、
プロセッサとを備え、
前記プロセッサが、前記コンピュータ命令を実行するとき、
選択された神経行動学的表現型についての神経表現型トポグラフィを、前記選択された神経行動学的表現型についての神経行動学的表現型マッピングデータに基づいて生成する動作;
複数の遺伝子のうちの各遺伝子それぞれについての遺伝子型トポグラフィを、前記各遺伝子についての遺伝子発現マッピングデータに基づいて生成する動作;
前記選択された神経行動学的表現型と前記複数の遺伝子との間の複数の表現型-遺伝子ペアトポグラフィを定める動作であって、各表現型-遺伝子ペアそれぞれについての各表現型-遺伝子ペアトポグラフィが、前記選択された神経行動学的表現型の前記神経表現型トポグラフィと、前記各表現型-遺伝子ペアについての前記各遺伝子の前記遺伝子型トポグラフィとに基づいて定められる、前記定める動作;
前記複数の表現型-遺伝子ペアトポグラフィのうちの各々についての定量的スコアを、前記選択された神経行動学的表現型の前記神経表現型トポグラフィと、前記各表現型-遺伝子ペアについての前記各遺伝子の前記遺伝子型トポグラフィとの間の相関関係に基づいて決定する動作;
選択された閾値を超えるスコアをそれぞれ有する、前記複数の表現型-遺伝子ペアトポグラフィのうちの1つ以上を選択する動作;及び
前記選択された1つ以上の表現型-遺伝子ペアトポグラフィのそれぞれの前記遺伝子をユーザに表示する動作
を実施する、コンピューティングデバイス。a computing device,
a memory that stores computer instructions;
a processor;
When the processor executes the computer instructions,
an act of generating a neurophenotypic topography for a selected neurobehavioral phenotype based on neurobehavioral mapping data for the selected neurobehavioral phenotype;
an act of generating a genotypic topography for each gene of a plurality of genes based on gene expression mapping data for each gene;
an act of defining a plurality of phenotype-gene pair topographies between the selected neurobehavioral phenotype and the plurality of genes, each phenotype-gene pair topography for each respective phenotype-gene pair; is determined based on the neurophenotypic topography of the selected neurobehavioral phenotype and the genotypic topography of each gene for each phenotype-gene pair;
generating a quantitative score for each of said plurality of phenotype-gene pair topographies, said neurophenotype topography of said selected neurobehavioral phenotype and said each gene for said each phenotype-gene pair; determining based on the correlation between the genotypic topography of
an act of selecting one or more of said plurality of phenotype-gene pair topographies each having a score above a selected threshold; and said each of said one or more selected phenotype-gene pair topographies. A computing device that performs the operation of displaying genes to a user.
(2)前記プロセッサが、前記選択された神経行動学的表現型を有する複数の人々のうちの各々についての前記神経行動学的表現型マッピングデータから前記神経表現型トポグラフィを生成するための更なるコンピュータ命令を実行することにより、前記神経表現型トポグラフィを生成する、及び/又は、
(3)前記プロセッサが、前記各遺伝子についての前記遺伝子発現マッピングデータと前記神経行動学的表現型マッピングデータとの間のアライメントに基づいて各表現型-遺伝子ペアトポグラフィについての統計的有意性を決定するための更なるコンピュータ命令を実行することにより、前記複数の表現型-遺伝子ペアトポグラフィのうちの各々についての前記スコアを決定する、及び/又は、
(4)前記プロセッサが、前記選択された神経行動学的表現型の前記神経表現型トポグラフィと、標的表現型-遺伝子ペアトポグラフィについての前記各遺伝子の前記遺伝子型トポグラフィとの間の決定された関連性の程度が最も高い前記標的表現型-遺伝子ペアトポグラフィを選択するための更なるコンピュータ命令を実行することにより、前記1つ以上の表現型-遺伝子ペアトポグラフィを選択する、及び/又は、
(5)前記複数の遺伝子のうちの各々についての前記遺伝子発現マッピングデータが、前記選択された神経行動学的表現型を有しない複数の人々からの複数の遺伝子発現に関する遺伝子発現マッピングデータを含み、前記プロセッサが、任意で、前記複数の人々の前記複数の遺伝子発現における前記複数の遺伝子のうちの各々についての代表的プローブを選択するための更なるコンピュータ命令を実行することにより、各遺伝子それぞれについての前記遺伝子型トポグラフィを生成する、及び/又は、
(6)前記プロセッサが、遺伝子発現マッピングサンプルを脳構造における部位にマッピングするための更なるコンピュータ命令を実行することにより、各遺伝子それぞれについての前記遺伝子型トポグラフィを生成する、及び/又は、
(7)前記プロセッサが、バックグラウンドシグナルを超える閾値レベル未満の発現レベル測定値を有するサンプルを除外することによって遺伝子発現マッピングサンプルをフィルタリングするための更なるコンピュータ命令を実行することにより、各遺伝子それぞれについての前記遺伝子型トポグラフィを生成する、及び/又は、
(8)前記プロセッサが、プローブ値が欠損している遺伝子発現マッピングサンプルにおいてプローブ値を補完するための更なるコンピュータ命令を実行することにより、各遺伝子それぞれについての前記遺伝子型トポグラフィを生成する、及び/又は、
(9)前記プロセッサが、前記遺伝子発現マッピングデータから外的バイアスを除去するための更なるコンピュータ命令を実行することにより、各遺伝子それぞれについての前記遺伝子型トポグラフィを生成し、かつ、任意で、前記プロセッサが、前記遺伝子発現マッピングデータを捕捉するために使用される遺伝子プローブにわたって平均値除去及びzスコア正規化を行うための更なるコンピュータ命令を実行することにより、前記外的バイアスを除去する、
請求項1に記載のコンピューティングデバイス。(1) the processor, when executing the computer instructions, identifies one or more respective neurodrug targets associated with each of the genes of the one or more selected phenotype-gene pair topographies; and/or
(2) further for the processor to generate the neurophenotype topography from the neurobehavioral phenotype mapping data for each of the plurality of people with the selected neurobehavioral phenotype; generating the neurophenotype topography by executing computer instructions; and/or
(3) the processor determines statistical significance for each phenotype-gene pair topography based on alignments between the gene expression mapping data and the neurobehavioral phenotype mapping data for each of the genes; determining the score for each of the plurality of phenotype-gene pair topographies by executing further computer instructions for; and/or
(4) the processor determines the determined association between the neurophenotypic topography of the selected neurobehavioral phenotype and the genotypic topography of each of the genes for a target phenotype-gene pair topography; and/or
(5) said gene expression mapping data for each of said plurality of genes comprises gene expression mapping data for a plurality of gene expression from a plurality of people without said selected neurobehavioral phenotype; for each gene, wherein the processor optionally executes further computer instructions to select representative probes for each of the plurality of genes in the plurality of gene expressions of the plurality of people; and/or
(6) said processor generates said genotypic topography for each respective gene by executing further computer instructions to map gene expression mapping samples to sites in brain structures; and/or
(7) each gene by said processor executing further computer instructions to filter the gene expression mapping samples by excluding samples with expression level measurements below a threshold level above background signal; generating said genotypic topography for and/or
(8) the processor generates the genotypic topography for each respective gene by executing additional computer instructions to impute probe values in gene expression mapping samples lacking probe values; / or
(9) said processor generates said genotypic topography for each respective gene by executing further computer instructions for removing external biases from said gene expression mapping data; a processor removing the external bias by executing further computer instructions to perform mean removal and z-score normalization over the gene probes used to capture the gene expression mapping data;
A computing device as recited in claim 1 .
前記神経行動学的表現型マッピングデータにおける前記複数の脳領域のうちの第1の脳領域セットに対して閾値を超える第1の重み値セットを割り当て;かつ
前記神経行動学的表現型マッピングデータにおける前記複数の脳領域のうちの第2の脳領域セットに対して前記閾値未満の第2の重み値セットを割り当てる
ための更なるコンピュータ命令を実行することにより、前記複数の脳領域のうちの各々に前記重み値を割り当てる、請求項3に記載のコンピューティングデバイス。the processor
assigning a first set of weight values above a threshold to a first set of the plurality of brain regions in the neurobehavioral phenotype mapping data; and in the neurobehavioral phenotype mapping data each of the plurality of brain regions by executing further computer instructions to assign a second set of weight values below the threshold to a second set of brain regions of the plurality of brain regions; 4. The computing device of claim3 , assigning the weight value to .
前記プロセッサが、前記コンピュータ命令を実行するとき、
前記選択された閾値を超える前記スコアをそれぞれ有する、前記複数の表現型-遺伝子ペアトポグラフィのうちの前記1つ以上として、前記少なくとも1つの組み合わせ表現型-遺伝子ペアトポグラフィを選択する動作;及び
前記遺伝子の組み合わせを前記ユーザに表示する動作
を、任意で、更に行う、前記コンピューティングデバイス。by said processor executing further computer instructions for defining at least one combined phenotype-gene pair topography between said neurobehavioral phenotypic topography and a combination of genotypic topographies for gene combinations; , defining the plurality of phenotype- gene pair topographies, wherein
When the processor executes the computer instructions,
an act of selecting said at least one combined phenotype-gene pair topography as said one or more of said plurality of phenotype-gene pair topographies each having said score above said selected threshold; and said gene said computing device optionally further performing the act of displaying to said user a combination of .
個々の遺伝子または神経薬物標的それぞれについての遺伝子発現マッピングデータと神経行動学的表現型マッピングデータとのアライメントと比べて向上した、前記神経行動学的表現型マッピングデータとのアライメントを呈する遺伝子発現マッピングデータを組み合わせることにより、遺伝子または神経薬物標的の組み合わせを同定する動作
を更に行う、請求項1~6のいずれか一項に記載のコンピューティングデバイス。When the processor executes the computer instructions,
Gene expression mapping data exhibiting an improved alignment with the neurobehavioral phenotype mapping data compared to the alignment of the gene expression mapping data and the neurobehavioral phenotype mapping data for each individual gene or neurodrug target. 7. The computing device of any one of claims1-6 , further performing the operation of identifying a combination of genes or neurodrug targets by combining .
コンピュータ命令を記憶するメモリと、
プロセッサとを備え、
前記プロセッサが、前記コンピュータ命令を実行するとき、
前記コンピューティングデバイスによって、選択された遺伝子についての遺伝子型トポグラフィを、前記選択された遺伝子についての遺伝子発現マッピングデータに基づいて生成する動作;
前記コンピューティングデバイスによって、複数の神経行動学的表現型のうちの各神経行動学的表現型それぞれについての神経表現型トポグラフィを、前記各神経行動学的表現型についての神経行動学的表現型マッピングデータに基づいて生成する動作;
前記コンピューティングデバイスによって、前記選択された遺伝子と前記複数の神経行動学的表現型との間の複数の遺伝子-表現型ペアトポグラフィを定める動作であって、各遺伝子-表現型ペアそれぞれについての各遺伝子-表現型ペアトポグラフィが、前記選択された遺伝子の前記遺伝子型トポグラフィと、前記各遺伝子-表現型ペアについての前記各神経行動学的表現型の前記神経表現型トポグラフィとに基づいて定められる、前記定める動作;
前記コンピューティングデバイスによって、前記複数の遺伝子-表現型ペアトポグラフィのうちの各々についての定量的スコアを、前記選択された遺伝子の前記遺伝子型トポグラフィと、前記各遺伝子-表現型ペアについての前記各神経行動学的表現型の前記神経表現型トポグラフィとの間の相関関係に基づいて決定する動作;
選択された閾値を超えるスコアをそれぞれ有する、前記複数の遺伝子-表現型ペアトポグラフィのうちの1つ以上を選択する動作;及び
前記選択された1つ以上の遺伝子-表現型ペアトポグラフィの前記各神経行動学的表現型をユーザに表示する動作
を実施する、前記コンピューティングデバイス。a computing device,
a memory that stores computer instructions;
a processor;
When the processor executes the computer instructions,
an act of generating, by said computing device, a genotypic topography for a selected gene based on gene expression mapping data for said selected gene;
neurobehavioral topography for each neurobehavioral phenotype of a plurality of neurobehavioral phenotypes and neurobehavioral mapping for each neurobehavioral phenotype by the computing device; actions to generate based on the data;
defining, by the computing device, a plurality of gene-phenotype pair topographies between the selected gene and the plurality of neurobehavioral phenotypes, wherein for each gene-phenotype pair respectively a gene-phenotype pair topography is defined based on the genotypic topography of the selected gene and the neurophenotypic topography of each neurobehavioral phenotype for each gene-phenotype pair; the action defined above;
The computing device generates a quantitative score for each of the plurality of gene-phenotype pair topographies, the genotypic topography of the selected gene, and the each neuron for each gene-phenotype pair. determining actions based on correlations between behavioral phenotypes and said neurophenotype topography;
an act of selecting one or more of said plurality of gene-phenotype pair topographies each having a score above a selected threshold; and said each neuron of said one or more selected gene-phenotype pair topographies. The computing device that performs the operation of displaying a behavioral phenotype to a user.
(2)前記プロセッサが、前記選択された神経行動学的表現型を有する複数の人々のうちの各々についての前記神経行動学的表現型マッピングデータから前記神経表現型トポグラフィを生成するための更なるコンピュータ命令を実行することにより、前記神経表現型トポグラフィを生成する、及び/又は、
(3)前記プロセッサが、前記各神経行動学的表現型についての前記神経行動学的表現型マッピングデータと前記遺伝子発現マッピングデータとの間のアライメントに基づいて各遺伝子-表現型ペアトポグラフィについての統計的有意性を決定するための更なるコンピュータ命令を実行することにより、前記複数の遺伝子-表現型ペアトポグラフィのうちの各々についての前記スコアを決定する、及び/又は、
(4)前記プロセッサが、前記選択された遺伝子の前記遺伝子型トポグラフィと、標的遺伝子-表現型ペアトポグラフィについての前記各神経行動学的表現型の前記神経表現型トポグラフィとの間の決定された関連性の程度が最も高い前記標的遺伝子-表現型ペアトポグラフィを選択するための更なるコンピュータ命令を実行することにより、前記1つ以上の遺伝子-表現型ペアトポグラフィを選択する、及び/又は、
(5)前記選択された遺伝子についての前記遺伝子発現マッピングデータが、前記複数の神経行動学的表現型のうちの1つを有しない複数の人々からの複数の遺伝子発現に関する遺伝子発現マッピングデータを含み、かつ、任意で、前記プロセッサが、前記複数の人々の前記複数の遺伝子発現における前記選択された遺伝子についての代表的プローブを選択するための更なるコンピュータ命令を実行することにより、前記選択された遺伝子についての前記遺伝子型トポグラフィを生成する、及び/又は、
(6)前記プロセッサが、遺伝子発現マッピングサンプルを脳構造における部位にマッピングするための更なるコンピュータ命令を実行することにより、前記選択された遺伝子についての前記遺伝子型トポグラフィを生成する、及び/又は、
(7)前記プロセッサが、バックグラウンドシグナルを超える閾値レベル未満の発現レベル測定値を有するサンプルを除外することによって遺伝子発現マッピングサンプルをフィルタリングするための更なるコンピュータ命令を実行することにより、前記選択された遺伝子についての前記遺伝子型トポグラフィを生成する、及び/又は、
(8)前記プロセッサが、プローブ値が欠損している遺伝子発現マッピングサンプルにおいてプローブ値を補完するための更なるコンピュータ命令を実行することにより、前記選択された遺伝子についての前記遺伝子型トポグラフィを生成する、及び/又は、
(9)前記プロセッサが、前記遺伝子発現マッピングデータから外的バイアスを除去するための更なるコンピュータ命令を実行することにより、前記選択された遺伝子についての前記遺伝子型トポグラフィを生成し、かつ、任意で、前記遺伝子発現マッピングデータを捕捉するために使用される遺伝子プローブにわたって平均値除去及びzスコア正規化を行うための更なるコンピュータ命令を実行することにより、前記外的バイアスを除去する、及び/又は、
(10)前記プロセッサが、前記遺伝子発現マッピングデータにおけるシグナル対ノイズ比を高めるための更なるコンピュータ命令を実行することにより、前記選択された遺伝子についての前記遺伝子型トポグラフィを生成し、かつ、任意で、同じ表面頂点上にマッピングされたサンプルに関する前記遺伝子発現マッピングデータの発現レベルを平均化するための更なるコンピュータ命令を実行することにより、前記シグナル対ノイズ比を高める、及び/又は、
(11)前記プロセッサが、低密度遺伝子発現サンプルを、サンプリングされた脳領域から、他のサンプリングされていない脳領域に内挿するための更なるコンピュータ命令を実行することにより、前記選択された遺伝子についての前記遺伝子型トポグラフィを生成し、かつ、任意で、区画化された皮質マップもしくは皮質下マップ、または高密度の皮質マップもしくは皮質下マップのうちの少なくとも1つを生成するための更なるコンピュータ命令を実行することにより、前記低密度遺伝子発現サンプルを内挿する、及び/又は、
(12)前記プロセッサが、前記遺伝子発現マッピングデータにおける複数の脳領域のうちの各々に重み値を割り当てるための更なるコンピュータ命令を実行することにより、前記選択された遺伝子についての前記遺伝子型トポグラフィを生成する、及び/又は、
(13)前記プロセッサが、前記コンピュータ命令を実行するとき、個々の神経行動学的表現型それぞれについての神経表現型マッピングデータと遺伝子発現マッピングデータとのアライメントと比べて向上した、前記遺伝子発現マッピングデータとのアライメントを呈する神経表現型マッピングデータを組み合わせることにより、神経行動学的表現型の組み合わせを同定する動作を更に行う、
請求項8に記載のコンピューティングデバイス。(1) the processor, when executing the computer instructions, further performs an act of selecting the selected gene based on the association of the neuropharmaceutical target selected by the user with the selected gene; and/or
(2) further for the processor to generate the neurophenotype topography from the neurobehavioral phenotype mapping data for each of the plurality of people with the selected neurobehavioral phenotype; generating the neurophenotype topography by executing computer instructions; and/or
(3) the processor generates statistics for each gene-phenotype pair topography based on alignments between the neurobehavioral phenotype mapping data and the gene expression mapping data for each neurobehavioral phenotype; determining the score for each of the plurality of gene-phenotype pair topographies by executing further computer instructions for determining statistical significance; and/or
(4) the processor determines the determined association between the genotypic topography of the selected gene and the neurophenotypic topography of each of the neurobehavioral phenotypes for a target gene-phenotype paired topography; and/or
(5) said gene expression mapping data for said selected genes comprises gene expression mapping data for a plurality of gene expressions from a plurality of people who do not have one of said plurality of neurobehavioral phenotypes; and, optionally, the selected by the processor executing further computer instructions to select representative probes for the selected genes in the plurality of gene expressions of the plurality of people. generating said genotypic topography for a gene; and/or
(6) said processor generates said genotypic topography for said selected genes by executing further computer instructions to map gene expression mapping samples to sites in brain structures; and/or
(7) said processor executing further computer instructions for filtering gene expression mapping samples by excluding samples having expression level measurements below a threshold level above background signal; and/or
(8) the processor generates the genotypic topography for the selected gene by executing further computer instructions for imputing probe values in gene expression mapping samples lacking probe values; , and/or
(9) said processor generates said genotypic topography for said selected genes by executing further computer instructions for removing external biases from said gene expression mapping data; and optionally , remove the external bias by executing further computer instructions to perform mean removal and z-score normalization over the gene probes used to capture the gene expression mapping data; and/or ,
(10) said processor generates said genotypic topography for said selected genes by executing further computer instructions for enhancing signal-to-noise ratio in said gene expression mapping data; and optionally , increasing the signal-to-noise ratio by executing further computer instructions to average the expression levels of the gene expression mapping data for samples mapped onto the same surface vertex; and/or
(11) the selected gene by executing further computer instructions for interpolating low-density gene expression samples from sampled brain regions to other unsampled brain regions; and optionally at least one of a compartmentalized cortical or subcortical map or a dense cortical or subcortical map. interpolating the low-density gene expression samples by executing instructions; and/or
(12) the processor determines the genotypic topography for the selected gene by executing further computer instructions to assign a weight value to each of a plurality of brain regions in the gene expression mapping data; generate and/or
(13) when said processor executes said computer instructions, said gene expression mapping data is improved compared to alignment of neurophenotype mapping data and gene expression mapping data for each individual neurobehavioral phenotype; further performing the act of identifying a combination of neurobehavioral phenotypes by combining the neurophenotype mapping data exhibiting an alignment with
A computing device as recited in claim8 .
前記神経行動学的表現型マッピングデータにおける前記複数の脳領域のうちの第1の脳領域セットに対して閾値を超える第1の重み値セットを割り当て、かつ、
前記神経行動学的表現型マッピングデータにおける前記複数の脳領域のうちの第2の脳領域セットに対して前記閾値未満の第2の重み値セットを割り当てる
ための更なるコンピュータ命令を実行することにより、前記複数の脳領域のうちの各々に前記重み値を割り当てる、請求項10に記載のコンピューティングデバイス。the processor
assigning a first set of weight values above a threshold to a first set of the plurality of brain regions in the neurobehavioral phenotype mapping data; and
by executing further computer instructions to assign a second set of weight values below the threshold to a second set of the plurality of brain regions in the neurobehavioral phenotype mapping data; 11. The computing device of claim10 , assigning the weight value to each of the plurality of brain regions.
前記プロセッサが、前記コンピュータ命令を実行するとき、
前記選択された閾値を超える前記スコアをそれぞれ有する、前記複数の遺伝子-表現型ペアトポグラフィのうちの前記1つ以上として、前記少なくとも1つの組み合わせ遺伝子-表現型ペアトポグラフィを選択する動作;及び
前記神経行動学的表現型の組み合わせを前記ユーザに表示する動作
を、任意で、更に行う、前記コンピューティングデバイス。The processor executes further computer instructions for defining at least one combined gene-phenotype pair topography between the genotypic topography and a combination of neurophenotypic topographies for a combination of neurobehavioral phenotypes. A computing device according to any one of claims8 to12 , which defines the plurality of gene-phenotype pair topographies by
When the processor executes the computer instructions,
an act of selecting said at least one combined gene-phenotype paired topography as said one or more of said plurality of gene-phenotype paired topographies each having said score exceeding said selected threshold; and said neural Said computing device, optionally further performing the act of displaying a combination of behavioral phenotypes to said user.
Applications Claiming Priority (3)
| Application Number | Priority Date | Filing Date | Title |
|---|---|---|---|
| US201762567087P | 2017-10-02 | 2017-10-02 | |
| US62/567,087 | 2017-10-02 | ||
| PCT/US2018/054009WO2019070745A1 (en) | 2017-10-02 | 2018-10-02 | Methods and systems for computer-generated predictive application of neuroimaging and gene expression mapping data |
Publications (3)
| Publication Number | Publication Date |
|---|---|
| JP2020537272A JP2020537272A (en) | 2020-12-17 |
| JP2020537272A5 JP2020537272A5 (en) | 2021-11-11 |
| JP7160929B2true JP7160929B2 (en) | 2022-10-25 |
Family
ID=63963540
Family Applications (2)
| Application Number | Title | Priority Date | Filing Date |
|---|---|---|---|
| JP2020539686AActiveJP7160929B2 (en) | 2017-10-02 | 2018-10-02 | Methods and systems for computer-generated predictive applications of neuroimaging and gene expression mapping data |
| JP2020539685AActiveJP6979533B2 (en) | 2017-10-02 | 2018-10-02 | Methods and tools for detecting, diagnosing, predicting, predicting, or treating neurobehavioral phenotypes in a subject. |
Family Applications After (1)
| Application Number | Title | Priority Date | Filing Date |
|---|---|---|---|
| JP2020539685AActiveJP6979533B2 (en) | 2017-10-02 | 2018-10-02 | Methods and tools for detecting, diagnosing, predicting, predicting, or treating neurobehavioral phenotypes in a subject. |
Country Status (5)
| Country | Link |
|---|---|
| US (5) | US20190102511A1 (en) |
| EP (2) | EP3692536A1 (en) |
| JP (2) | JP7160929B2 (en) |
| CA (2) | CA3076242A1 (en) |
| WO (2) | WO2019070745A1 (en) |
Families Citing this family (31)
| Publication number | Priority date | Publication date | Assignee | Title |
|---|---|---|---|---|
| EP3692536A1 (en) | 2017-10-02 | 2020-08-12 | Blackthorn Therapeutics, Inc. | Methods and systems for computer-generated predictive application of neuroimaging and gene expression mapping data |
| US11188850B2 (en)* | 2018-03-30 | 2021-11-30 | Derek Alexander Pisner | Automated feature engineering of hierarchical ensemble connectomes |
| US11715564B2 (en) | 2018-05-01 | 2023-08-01 | Neumora Therapeutics, Inc. | Machine learning-based diagnostic classifier |
| US11669914B2 (en) | 2018-05-06 | 2023-06-06 | Strong Force TX Portfolio 2018, LLC | Adaptive intelligence and shared infrastructure lending transaction enablement platform responsive to crowd sourced information |
| CA3098670A1 (en) | 2018-05-06 | 2019-11-14 | Strong Force TX Portfolio 2018, LLC | Methods and systems for improving machines and systems that automate execution of distributed ledger and other transactions in spot and forward markets for energy, compute, storage and other resources |
| US12412120B2 (en) | 2018-05-06 | 2025-09-09 | Strong Force TX Portfolio 2018, LLC | Systems and methods for controlling rights related to digital knowledge |
| US20190385711A1 (en) | 2018-06-19 | 2019-12-19 | Ellipsis Health, Inc. | Systems and methods for mental health assessment |
| WO2019246239A1 (en) | 2018-06-19 | 2019-12-26 | Ellipsis Health, Inc. | Systems and methods for mental health assessment |
| US11103171B2 (en) | 2018-10-23 | 2021-08-31 | BlackThor Therapeutics, Ine. | Systems and methods for screening, diagnosing, and stratifying patients |
| US20210398672A1 (en)* | 2018-10-29 | 2021-12-23 | Northwestern University | Big Data-Driven Personalized Management of Chronic Pain |
| CA3142254A1 (en) | 2019-06-03 | 2020-12-10 | Biomax Informatics Ag | Computing a pathological condition |
| US11636951B2 (en) | 2019-10-02 | 2023-04-25 | Kpn Innovations, Llc. | Systems and methods for generating a genotypic causal model of a disease state |
| CN110751112B (en)* | 2019-10-24 | 2023-10-03 | 复旦大学 | Computer vision-based mouse brain map drawing auxiliary system and method |
| CN111243669B (en)* | 2020-01-20 | 2021-02-09 | 至本医疗科技(上海)有限公司 | Method, electronic device, and computer storage medium for determining RNA gene fusion |
| US11982993B2 (en)* | 2020-02-03 | 2024-05-14 | Strong Force TX Portfolio 2018, LLC | AI solution selection for an automated robotic process |
| CN111967499B (en)* | 2020-07-21 | 2023-04-07 | 电子科技大学 | Data dimension reduction method based on self-learning |
| CN112037914B (en)* | 2020-08-11 | 2021-06-01 | 深圳大学 | Construction method, system and equipment of obsessive-compulsive disorder risk assessment model |
| US11264138B1 (en)* | 2020-10-08 | 2022-03-01 | Omniscient Neurotechnology Pty Limited | Generating brain network impact scores |
| US11264137B1 (en) | 2020-10-08 | 2022-03-01 | Omniscient Neurotechnology Pty Limited | Centrality rankings of network graphs generated using connectomic brain data |
| US12354256B2 (en)* | 2020-10-19 | 2025-07-08 | Northwestern University | Brain feature prediction using geometric deep learning on graph representations of medical image data |
| CN116508107B (en) | 2020-12-03 | 2024-08-13 | 诺华股份有限公司 | Collaboration platform for enabling collaboration of data analysis across multiple different databases |
| US11152123B1 (en)* | 2021-01-08 | 2021-10-19 | Omniscient Neurotechnology Pty Limited | Processing brain data using autoencoder neural networks |
| CN118175954B (en)* | 2021-06-29 | 2025-06-03 | 上顶医学影像科技股份有限公司 | Method and procedure for evaluating concurrent clinical dementia scores and their future outcomes using predicted age differences |
| US11399757B1 (en) | 2021-07-16 | 2022-08-02 | Omniscient Neurotechnology Pty Limited | Medical imaging with features to determine emotional state |
| WO2023150191A1 (en)* | 2022-02-04 | 2023-08-10 | Bramen Jennifer | Dementia-related neurodegeneration tracking using magnetic resonance imaging (mri) |
| US12144638B2 (en)* | 2022-08-24 | 2024-11-19 | Taipei Medical University | Methods and devices of generating predicted brain images |
| CN116189310B (en)* | 2022-11-16 | 2024-01-23 | 北京理工大学 | Method for providing human motion data set and electronic equipment |
| CN115630307B (en)* | 2022-11-29 | 2023-03-21 | 中国中医科学院中医药信息研究所 | Syndrome diagnosis method and device based on cross-view angle and attention convergence |
| CN116777004B (en)* | 2023-06-29 | 2024-02-06 | 中国人民解放军国防科技大学 | Non-convex discriminative transfer subspace learning method incorporating distribution alignment information |
| WO2025191514A1 (en)* | 2024-03-14 | 2025-09-18 | Manifest Technologies Inc. | Systems and methods for diagnosing, prognosticating, selecting, or treating a subject based on embedding in a generative neural model feature space |
| US12433527B1 (en) | 2024-04-05 | 2025-10-07 | Neumarker Inc. | Predicting patient responses to multiple modalities of CNS disease interventions |
Citations (1)
| Publication number | Priority date | Publication date | Assignee | Title |
|---|---|---|---|---|
| US20080241839A1 (en) | 2006-10-12 | 2008-10-02 | The Regents Of The University Of California | Method for correlating differential brain images and genotypes; genes that correlate with differential brain images |
Family Cites Families (11)
| Publication number | Priority date | Publication date | Assignee | Title |
|---|---|---|---|---|
| US9012143B2 (en) | 2007-04-30 | 2015-04-21 | The Ohio State University Research Foundation | Polymorphisms in genes affecting ace-related disorders and uses thereof |
| UA115657C2 (en) | 2011-09-19 | 2017-12-11 | Аксон Ньюросайєнс Сє | Isolated antibody that binds to one or more epitopes SAU, a pharmaceutical composition that contains it, METHOD OF TREATMENT AND DIAGNOSIS WAY BASED Alzheimer isolated antibody |
| WO2013078370A1 (en) | 2011-11-23 | 2013-05-30 | The Regents Of The University Of Michigan | Voxel-based approach for disease detection and evolution |
| US9230321B2 (en) | 2012-03-30 | 2016-01-05 | University Of Louisville Research Foundation, Inc. | Computer aided diagnostic system incorporating 3D shape analysis of the brain for identifying developmental brain disorders |
| US9976180B2 (en) | 2012-09-14 | 2018-05-22 | Population Bio, Inc. | Methods for detecting a genetic variation in subjects with parkinsonism |
| ES2718343T3 (en) | 2012-11-07 | 2019-07-01 | Univ Yale | Reading and linguistic disability risk assessment |
| US10011875B2 (en) | 2014-01-13 | 2018-07-03 | Trustees Of Boston University | Methods and assays relating to Huntingtons disease and Parkinson's disease |
| US9773308B2 (en)* | 2014-07-15 | 2017-09-26 | The Brigham And Women's Hospital | Systems and methods for generating biomarkers based on multivariate classification of functional imaging and associated data |
| US9754371B2 (en) | 2014-07-31 | 2017-09-05 | California Institute Of Technology | Multi modality brain mapping system (MBMS) using artificial intelligence and pattern recognition |
| US20180094248A1 (en) | 2016-06-30 | 2018-04-05 | Arizona Board Of Regents On Behalf Of Arizona State University | Necroptosis Signaling as a Therapeutic Target for Alzheimer's Disease |
| EP3692536A1 (en) | 2017-10-02 | 2020-08-12 | Blackthorn Therapeutics, Inc. | Methods and systems for computer-generated predictive application of neuroimaging and gene expression mapping data |
- 2018
- 2018-10-02EPEP18792746.2Apatent/EP3692536A1/ennot_activeWithdrawn
- 2018-10-02JPJP2020539686Apatent/JP7160929B2/enactiveActive
- 2018-10-02WOPCT/US2018/054009patent/WO2019070745A1/ennot_activeCeased
- 2018-10-02CACA3076242Apatent/CA3076242A1/enactivePending
- 2018-10-02USUS16/149,903patent/US20190102511A1/ennot_activeAbandoned
- 2018-10-02EPEP18796798.9Apatent/EP3692547B1/enactiveActive
- 2018-10-02CACA3076239Apatent/CA3076239A1/enactivePending
- 2018-10-02USUS16/150,137patent/US11791016B2/enactiveActive
- 2018-10-02JPJP2020539685Apatent/JP6979533B2/enactiveActive
- 2018-10-02WOPCT/US2018/053984patent/WO2019070721A1/ennot_activeCeased
- 2019
- 2019-03-07USUS16/295,374patent/US10950327B2/enactiveActive
- 2021
- 2021-02-03USUS17/166,952patent/US11842793B2/enactiveActive
- 2023
- 2023-10-16USUS18/487,839patent/US20240062847A1/enactivePending
Patent Citations (1)
| Publication number | Priority date | Publication date | Assignee | Title |
|---|---|---|---|---|
| US20080241839A1 (en) | 2006-10-12 | 2008-10-02 | The Regents Of The University Of California | Method for correlating differential brain images and genotypes; genes that correlate with differential brain images |
Non-Patent Citations (2)
| Title |
|---|
| A. Komorowski, et al.,Association of Protein Distribution and Gene Expression Revealed by PET and Post-Mortem Quantification in the Serotonergic System of the Human Brain,Cerebral Cortex [online],2016年12月30日,Volume 27, Issue 1,Pages 117-130,[検索日:2022年7月19日], <URL:https://doi.org/10.1093/cercor/bhw355> |
| Jingwen Yan, et al.,Transcriptome-guided amyloid imaging genetic analysis via a novel structured sparse learning algorithm,Bioinformatics [online],2022年08月22日,Volume 30, Issue 17,Pages i564-i571,[検索日:2022年7月19日], <URL:https://doi.org/10.1093/bioinformatics/btu465> |
Also Published As
| Publication number | Publication date |
|---|---|
| EP3692536A1 (en) | 2020-08-12 |
| WO2019070721A1 (en) | 2019-04-11 |
| US20240062847A1 (en) | 2024-02-22 |
| US11842793B2 (en) | 2023-12-12 |
| WO2019070745A1 (en) | 2019-04-11 |
| US20210158892A1 (en) | 2021-05-27 |
| US20190272889A1 (en) | 2019-09-05 |
| US11791016B2 (en) | 2023-10-17 |
| US20190102511A1 (en) | 2019-04-04 |
| US20190355439A1 (en) | 2019-11-21 |
| JP2020537798A (en) | 2020-12-24 |
| EP3692547B1 (en) | 2024-01-03 |
| CA3076242A1 (en) | 2019-04-11 |
| CA3076239A1 (en) | 2019-04-11 |
| JP2020537272A (en) | 2020-12-17 |
| JP6979533B2 (en) | 2021-12-15 |
| US10950327B2 (en) | 2021-03-16 |
| EP3692547A1 (en) | 2020-08-12 |
Similar Documents
| Publication | Publication Date | Title |
|---|---|---|
| JP7160929B2 (en) | Methods and systems for computer-generated predictive applications of neuroimaging and gene expression mapping data | |
| Lombardi et al. | A robust framework to investigate the reliability and stability of explainable artificial intelligence markers of mild cognitive impairment and Alzheimer’s disease | |
| Kong et al. | Mapping brain asymmetry in health and disease through the ENIGMA consortium | |
| Woo et al. | Building better biomarkers: brain models in translational neuroimaging | |
| Kim et al. | Laterobasal amygdalar enlargement in 6-to 7-year-old children with autism spectrum disorder | |
| Ecker et al. | Brain surface anatomy in adults with autism: the relationship between surface area, cortical thickness, and autistic symptoms | |
| Wolff et al. | Differences in white matter fiber tract development present from 6 to 24 months in infants with autism | |
| Wang et al. | Magnetic resonance imaging of hippocampal subfields in posttraumatic stress disorder | |
| Frässle et al. | Generative models for clinical applications in computational psychiatry | |
| Lee et al. | Sex‐specific effects of the Huntington gene on normal neurodevelopment | |
| Sharaev et al. | Diagnosis of schizophrenia based on the data of various modalities: biomarkers and machine learning techniques | |
| van Eijndhoven et al. | Measuring Integrated Novel Dimensions in Neurodevelopmental and Stress-Related Mental Disorders (MIND-SET): protocol for a cross-sectional comorbidity study from a Research Domain Criteria perspective | |
| Castagna et al. | Parsing the neural correlates of anxious apprehension and anxious arousal in the grey-matter of healthy youth | |
| Crespi et al. | Microstructural correlates of emotional attribution impairment in non-demented patients with amyotrophic lateral sclerosis | |
| An et al. | Stress-resilience impacts psychological wellbeing as evidenced by brain–gut microbiome interactions | |
| Zhou et al. | Cortical thickness distinguishes between major depression and schizophrenia in adolescents | |
| van Eijndhoven et al. | Measuring integrated novel dimensions in neurodevelopmental and stress-related mental disorders (MIND-Set): a cross-sectional comorbidity study from an RDoC perspective | |
| Passaretti et al. | Clinical progression and genetic pathways in body-first and brain-first Parkinson’s disease | |
| Mulders et al. | Association of striatal connectivity gradients to functional domains across psychiatric disorders | |
| Polosecki et al. | Computational psychiatry: Advancing predictive modeling of neurodegeneration with neuroimaging of Huntington's disease | |
| Whitney et al. | Psychopathology: A Neurobiological Perspective | |
| Öztürk | Phenotypical exploration and predictive utility of formal thought disorder in individuals with recent-onset of psychosis | |
| Tahmasian et al. | Phenotypic and genetic correlation between sleep, behavior, and macroscale cortical grey matter | |
| Qiao et al. | The Autism Spectrum Disorder Subtypes Identification Based on Features of Structural and Functional Coupling | |
| Liloia | Reconceptualizing the Neuroanatomical Landscape of Psychiatric Disorders Using Coordinate-Based Meta-Analytic and Bayesian Approaches |
Legal Events
| Date | Code | Title | Description |
|---|---|---|---|
| RD04 | Notification of resignation of power of attorney | Free format text:JAPANESE INTERMEDIATE CODE: A7424 Effective date:20210315 | |
| A521 | Request for written amendment filed | Free format text:JAPANESE INTERMEDIATE CODE: A523 Effective date:20210930 | |
| A621 | Written request for application examination | Free format text:JAPANESE INTERMEDIATE CODE: A621 Effective date:20210930 | |
| A131 | Notification of reasons for refusal | Free format text:JAPANESE INTERMEDIATE CODE: A131 Effective date:20220725 | |
| A521 | Request for written amendment filed | Free format text:JAPANESE INTERMEDIATE CODE: A523 Effective date:20220909 | |
| TRDD | Decision of grant or rejection written | ||
| A01 | Written decision to grant a patent or to grant a registration (utility model) | Free format text:JAPANESE INTERMEDIATE CODE: A01 Effective date:20221012 | |
| A61 | First payment of annual fees (during grant procedure) | Free format text:JAPANESE INTERMEDIATE CODE: A61 Effective date:20221013 | |
| R150 | Certificate of patent or registration of utility model | Ref document number:7160929 Country of ref document:JP Free format text:JAPANESE INTERMEDIATE CODE: R150 | |
| S111 | Request for change of ownership or part of ownership | Free format text:JAPANESE INTERMEDIATE CODE: R313115 | |
| R350 | Written notification of registration of transfer | Free format text:JAPANESE INTERMEDIATE CODE: R350 |