JP6819607B2 - Information processing system, information processing method and information processing program - Google Patents
Information processing system, information processing method and information processing programDownload PDFInfo
- Publication number
- JP6819607B2 JP6819607B2JP2017553600AJP2017553600AJP6819607B2JP 6819607 B2JP6819607 B2JP 6819607B2JP 2017553600 AJP2017553600 AJP 2017553600AJP 2017553600 AJP2017553600 AJP 2017553600AJP 6819607 B2JP6819607 B2JP 6819607B2
- Authority
- JP
- Japan
- Prior art keywords
- variable
- prediction model
- explanatory
- explained
- objective
- Prior art date
- Legal status (The legal status is an assumption and is not a legal conclusion. Google has not performed a legal analysis and makes no representation as to the accuracy of the status listed.)
- Active
Links
Images


Classifications
- G—PHYSICS
- G06—COMPUTING OR CALCULATING; COUNTING
- G06N—COMPUTING ARRANGEMENTS BASED ON SPECIFIC COMPUTATIONAL MODELS
- G06N5/00—Computing arrangements using knowledge-based models
- G06N5/02—Knowledge representation; Symbolic representation
- G06N5/022—Knowledge engineering; Knowledge acquisition
- G06N5/025—Extracting rules from data
- G—PHYSICS
- G06—COMPUTING OR CALCULATING; COUNTING
- G06N—COMPUTING ARRANGEMENTS BASED ON SPECIFIC COMPUTATIONAL MODELS
- G06N20/00—Machine learning
- G—PHYSICS
- G06—COMPUTING OR CALCULATING; COUNTING
- G06N—COMPUTING ARRANGEMENTS BASED ON SPECIFIC COMPUTATIONAL MODELS
- G06N20/00—Machine learning
- G06N20/10—Machine learning using kernel methods, e.g. support vector machines [SVM]
- G—PHYSICS
- G06—COMPUTING OR CALCULATING; COUNTING
- G06N—COMPUTING ARRANGEMENTS BASED ON SPECIFIC COMPUTATIONAL MODELS
- G06N3/00—Computing arrangements based on biological models
- G06N3/02—Neural networks
- G06N3/04—Architecture, e.g. interconnection topology
- G06N3/0499—Feedforward networks
- G—PHYSICS
- G06—COMPUTING OR CALCULATING; COUNTING
- G06N—COMPUTING ARRANGEMENTS BASED ON SPECIFIC COMPUTATIONAL MODELS
- G06N3/00—Computing arrangements based on biological models
- G06N3/02—Neural networks
- G06N3/08—Learning methods
- G—PHYSICS
- G06—COMPUTING OR CALCULATING; COUNTING
- G06N—COMPUTING ARRANGEMENTS BASED ON SPECIFIC COMPUTATIONAL MODELS
- G06N3/00—Computing arrangements based on biological models
- G06N3/02—Neural networks
- G06N3/08—Learning methods
- G06N3/09—Supervised learning
- G—PHYSICS
- G06—COMPUTING OR CALCULATING; COUNTING
- G06N—COMPUTING ARRANGEMENTS BASED ON SPECIFIC COMPUTATIONAL MODELS
- G06N5/00—Computing arrangements using knowledge-based models
- G06N5/01—Dynamic search techniques; Heuristics; Dynamic trees; Branch-and-bound
- G—PHYSICS
- G06—COMPUTING OR CALCULATING; COUNTING
- G06Q—INFORMATION AND COMMUNICATION TECHNOLOGY [ICT] SPECIALLY ADAPTED FOR ADMINISTRATIVE, COMMERCIAL, FINANCIAL, MANAGERIAL OR SUPERVISORY PURPOSES; SYSTEMS OR METHODS SPECIALLY ADAPTED FOR ADMINISTRATIVE, COMMERCIAL, FINANCIAL, MANAGERIAL OR SUPERVISORY PURPOSES, NOT OTHERWISE PROVIDED FOR
- G06Q30/00—Commerce
- G06Q30/02—Marketing; Price estimation or determination; Fundraising
- G06Q30/0283—Price estimation or determination
- G—PHYSICS
- G06—COMPUTING OR CALCULATING; COUNTING
- G06N—COMPUTING ARRANGEMENTS BASED ON SPECIFIC COMPUTATIONAL MODELS
- G06N5/00—Computing arrangements using knowledge-based models
- G06N5/04—Inference or reasoning models
- G06N5/045—Explanation of inference; Explainable artificial intelligence [XAI]; Interpretable artificial intelligence
Landscapes
- Engineering & Computer Science (AREA)
- Theoretical Computer Science (AREA)
- Physics & Mathematics (AREA)
- Software Systems (AREA)
- General Physics & Mathematics (AREA)
- General Engineering & Computer Science (AREA)
- Computing Systems (AREA)
- Evolutionary Computation (AREA)
- Data Mining & Analysis (AREA)
- Mathematical Physics (AREA)
- Artificial Intelligence (AREA)
- Business, Economics & Management (AREA)
- Computational Linguistics (AREA)
- Development Economics (AREA)
- Biomedical Technology (AREA)
- General Health & Medical Sciences (AREA)
- Molecular Biology (AREA)
- Life Sciences & Earth Sciences (AREA)
- Health & Medical Sciences (AREA)
- Accounting & Taxation (AREA)
- Finance (AREA)
- Biophysics (AREA)
- Strategic Management (AREA)
- Computer Vision & Pattern Recognition (AREA)
- Medical Informatics (AREA)
- Game Theory and Decision Science (AREA)
- Marketing (AREA)
- General Business, Economics & Management (AREA)
- Economics (AREA)
- Entrepreneurship & Innovation (AREA)
- Management, Administration, Business Operations System, And Electronic Commerce (AREA)
Description
Translated fromJapanese本発明は、学習された予測モデルに基づいて最適化を行う情報処理システム、情報処理方法および情報処理用プログラムに関する。 The present invention relates to an information processing system, an information processing method, and an information processing program that perform optimization based on a learned prediction model.
過去の実績に基づいて予測モデルを生成する機械学習のアルゴリズムとして、例えば、回帰分析、ニューラルネットワーク、サポートベクターマシン等が知られている。また、特許文献1にも、過去の実績に基づいて予測モデルを生成する方法が記載されている。 Regression analysis, neural networks, support vector machines, and the like are known as machine learning algorithms that generate prediction models based on past achievements. Further,
また、特許文献2には、予想売上および価格感応度に基づいて、見込まれる利益を最大化するように最適化された推奨価格を提示するシステムが記載されている。特許文献2には、このシステムにおいて、価格感応度モデルが、価格に伴って変動する関数を通して特定製品の価格感応度をモデリングすることや、価格変更の関数として売上の変化をモデリングすることが記載されている。さらに、特許文献2に記載のシステムは、所定の仮定のもとでの売上高を予測し、その予測と価格感応度の結論を使用して、製品の売上を予測し、所与の制約下で総利益を最大化する最適価格の集合を生成する。また、このシステムは、価格感応度モデルタイプおよび価格感応度変数値を表示する。 Further,
特許文献3には、通信コンテンツの有効性を査定し、コンテンツ配信を最適化するためのシステムが記載されている。特許文献3に記載のシステムは、強化学習を用いている。特許文献3には、有効性評価尺度(または目的関数)を最大化すると予測されるコンテンツ配信スケジュールを生成することが記載されている。また、特許文献3には、履歴データに対して回帰分析を使用し、成果を最大化する、コンテンツの最良の「混成」を予測することが記載されている。
一般的な数理最適化では、数理計画法への入力データが観測されることを前提としている。例えば、工業製品の生産ラインの最適化では、数理計画法への入力データは、各ラインである製品を作るために必要な材料の量、コスト、製造時間等である。これらの入力データは、いずれも、分析者が数理計画法を実行する時点において、分析者から見て観測可能なデータである。 In general mathematical optimization, it is assumed that the input data to the mathematical programming method is observed. For example, in optimizing a production line for an industrial product, the input data to the actuarial programming method is the amount of material, cost, manufacturing time, etc. required to make the product on each line. All of these input data are observable data to the analyst at the time when the analyst executes the mathematical programming method.
一方で、分析者が数理計画法を実行する時点において分析者から見て観測できないデータを用いないと、解決できない問題もある。例えば、小売店舗において、ある商品群の総売上高を最大化するために、その商品群に属する各商品の価格をそれぞれ最適化したいという問題がある。この問題を解決するために数理計画法を実行しようとすると、例えば、将来の商品の売上数の予測値が数理計画法への入力データとして必要になる。しかし、分析者が数理計画法を実行する時点で、将来の商品の売上数の予測値は、分析者から見て観測可能なデータではない。従って、一般的な数理最適化では、数理解決法を用いてこのような問題を解決することはできなかった。 On the other hand, there is also a problem that cannot be solved unless the data that cannot be observed by the analyst is used when the analyst executes the mathematical programming method. For example, in a retail store, there is a problem that in order to maximize the total sales of a certain product group, it is desired to optimize the price of each product belonging to the product group. When an attempt is made to execute a mathematical programming method to solve this problem, for example, a predicted value of the number of sales of future products is required as input data to the mathematical programming method. However, at the time the analyst executes the mathematical programming method, the predicted value of the number of future product sales is not observable data from the analyst's point of view. Therefore, general mathematical optimization has not been able to solve such problems using mathematical solutions.
また、意思決定に予測を用いる場合、とり得る全ての戦略に対して効果を予測し、最もよい効果が得られる戦略を選ぶという方法が考えられる。しかし、この方法では、計算量が多くなってしまう。 In addition, when using prediction for decision-making, it is conceivable to predict the effect on all possible strategies and select the strategy that gives the best effect. However, this method requires a large amount of calculation.
そこで、本発明は、数理最適化で観測されない入力データが存在する状況であっても、適切に最適化を行うことができる情報処理システム、情報処理方法および情報処理用プログラムを提供することを目的とする。 Therefore, an object of the present invention is to provide an information processing system, an information processing method, and an information processing program capable of appropriately optimizing even in a situation where there is input data that is not observed by mathematical optimization. And.
本発明による情報処理システムは、被説明変数および説明変数に基づいて、被説明変数と説明変数との間の関係を示し説明変数の関数で表される予測モデルであって、被説明変数が個々の説明変数とその個々の説明変数に対応する個々の係数とで表される予測モデルを学習する学習部と、予測モデルを可視化する可視化部と、ユーザからの操作を受け付けたことに応じて、可視化部によって可視化された予測モデルを引数とする目的関数について、制約条件のもとで当該目的関数を最適化する目的変数を算出する最適化部とを備え、予測モデルにおいて、個々の説明変数の一部は、目的変数であることを特徴とする。The information processing system according to the present invention is a prediction model that shows the relationship between the explained variable and the explanatory variable based on the explained variable and the explanatory variable and is represented by a function of theexplanatory variable. A learning unit that learns aprediction model represented by the explanatory variables of and individual coefficients corresponding to the individual explanatory variables, a visualization unit that visualizes the prediction model, and an operation received from the user. For the objective function that takes the prediction model visualized by the visualization unit as an argument, it is equipped with an optimization unit that calculates the objective variable that optimizes the objective function under constraints, and inthe prediction model, each explanatory variable Some are characterized by beingobjective variables .
また、本発明による情報処理方法は、被説明変数および説明変数に基づいて、被説明変数と説明変数との間の関係を示し説明変数の関数で表される予測モデルであって、被説明変数が個々の説明変数とその個々の説明変数に対応する個々の係数とで表される予測モデルを学習し、予測モデルを可視化し、ユーザからの操作を受け付けたことに応じて、可視化された予測モデルを引数とする目的関数について、制約条件のもとで当該目的関数を最適化する目的変数を算出し、予測モデルにおいて、個々の説明変数の一部は、目的変数であることを特徴とする。Further, the information processing method according to the present invention is a prediction model that shows the relationship between the explained variable and the explanatory variable based on the explained variable and the explanatory variable and is represented by a function of theexplanatory variable. Learns a prediction model represented by individual explanatory variables and individual coefficients corresponding to the individual explanatory variables, visualizes the prediction model, and visualizes the prediction in response to receiving an operation from the user. For an objective function that takes a model as an argument, an objective variable that optimizes the objective function is calculated under constraints, and in the prediction model, some of the individual explanatory variables are objective variables. ..
また、本発明による情報処理用プログラムは、コンピュータに、被説明変数および説明変数に基づいて、被説明変数と説明変数との間の関係を示し説明変数の関数で表される予測モデルであって、被説明変数が個々の説明変数とその個々の説明変数に対応する個々の係数とで表される予測モデルを学習する学習処理、予測モデルを可視化する可視化処理、および、ユーザからの操作を受け付けたことに応じて、可視化処理で可視化された予測モデルを引数とする目的関数について、制約条件のもとで当該目的関数を最適化する目的変数を算出する最適化処理を実行させ、予測モデルにおいて、個々の説明変数の一部は、目的変数であることを特徴とする。The information processing program according to the present invention causes a computer,a predictive model based on the explained variable and explanatory variables, expressed by a function of the explanatory variables shows the relationship between the explanatory variables and the dependent variable, Learning process for learning aprediction model in whichthe explained variable is represented by each explanatory variable and individual coefficients corresponding to the individual explanatory variables, visualization processing for visualizing the prediction model, and accepting operations from the user. In response to this, for the objective function that takes the prediction model visualized by the visualization process as an argument, the optimization process that calculates the objective variable that optimizes the objective function is executed under the constraint conditions, andthe prediction model , Some of the individual explanatory variables are characterizedin that they areobjective variables .
本発明によれば、数理最適化で観測されない入力データが存在する状況であっても、適切に最適化を行うことができる。 According to the present invention, even in a situation where there is input data that is not observed by mathematical optimization, optimization can be appropriately performed.
まず、本発明の概要を説明する。本発明の情報処理システムは、観測されないデータを予測する予測モデルを、過去のデータから学習し、その予測モデルに基づいて数理計画法の目的関数を自動的に生成し最適化を実行する。また、本発明の情報処理システムは、学習した予測モデルを可視化し(換言すれば、ディスプレイ装置上に表示し)、最適化を実行することを指示するユーザの操作に応じて、最適化を実行する。 First, an outline of the present invention will be described. The information processing system of the present invention learns a prediction model that predicts unobserved data from past data, automatically generates an objective function of a mathematical programming method based on the prediction model, and executes optimization. Further, the information processing system of the present invention visualizes the learned prediction model (in other words, displays it on the display device), and executes the optimization in response to the user's operation instructing the execution of the optimization. To do.
以下、本発明の実施形態を図面を参照して説明する。なお、以下の説明では、複数の商品の売上数の予測に基づいて複数の商品の売上高の総和を最大にするように複数の商品の価格を最適化する場合を例示する。ただし、最適化の対象は、上記の例に限定されない。また、以下の説明では、機械学習による予測対象となる変数を「被説明変数」と記す。予測に用いられる変数を「説明変数」と記す。最適化の出力となる変数を「目的変数」と記す。なお、これらの変数は排他的な関係ではなく、例えば、説明変数の一部が目的変数となることがある。 Hereinafter, embodiments of the present invention will be described with reference to the drawings. In the following description, a case where the prices of a plurality of products are optimized so as to maximize the total sales of the plurality of products based on the prediction of the number of sales of the plurality of products will be illustrated. However, the target of optimization is not limited to the above example. Further, in the following description, variables to be predicted by machine learning are referred to as "explained variables". The variables used for prediction are referred to as "explanatory variables". The variable that is the output of optimization is described as the "objective variable". Note that these variables are not in an exclusive relationship, and for example, some of the explanatory variables may be objective variables.
図1は、本発明の情報処理システムの例を示すブロック図である。本発明の情報処理システム1は、訓練データ記憶部2と、学習部3と、表示制御部4と、ディスプレイ装置5と、記憶部6と、外的情報入力部7と、問題記憶部8と、目的関数生成部9と、最適化部10とを備える。 FIG. 1 is a block diagram showing an example of the information processing system of the present invention. The
表示制御部4は、学習部3によって学習された予測モデルを可視化する(換言すれば、予測モデルに関する情報をディスプレイ装置5上に表示する)。表示制御部4は、予測モデルに関する情報を表示するだけでなく、学習に用いられるパラメータをユーザが入力するためのユーザインタフェース、最適化における制約条件をユーザが入力するためのユーザインタフェース、最適化結果等もディスプレイ装置5上に表示する。 The display control unit 4 visualizes the prediction model learned by the learning unit 3 (in other words, displays information about the prediction model on the display device 5). The display control unit 4 not only displays information about the prediction model, but also has a user interface for the user to input parameters used for learning, a user interface for the user to input constraint conditions in optimization, and an optimization result. Etc. are also displayed on the display device 5.
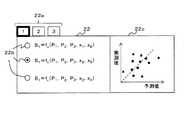
図2は、表示制御部4がディスプレイ装置5上に表示する画面の例を示す説明図である。表示制御部4によって表示される画面21は、予測モデル表示欄22と、学習に用いられるパラメータの入力欄23(以下、第1入力欄23と記す。)と、最適化結果表示欄25と、最適化における制約条件の入力欄26(以下、第2入力欄26と記す)とを含む。さらに、画面21は、学習の実行をユーザが指示するためのボタン24(以下、第1指示ボタン24と記す。)と、最適化の実行をユーザが指示するためのボタン27(以下、第2指示ボタン27と記す。)とを含む。 FIG. 2 is an explanatory diagram showing an example of a screen displayed on the display device 5 by the display control unit 4. The
図2は、表示制御部4によって表示される画面の例示であり、画面の態様は、図2に示す例に限定されない。例えば、図2では、学習の実行や最適化の実行をユーザがボタンによって指示する場合を例にして示しているが、これらの指示が他の態様で行われる画面であってもよい。 FIG. 2 is an example of a screen displayed by the display control unit 4, and the mode of the screen is not limited to the example shown in FIG. For example, FIG. 2 shows a case where the user instructs the execution of learning and the execution of optimization by a button, but the screen may be such that these instructions are given in other modes.
予測モデル表示欄22は、学習された予測モデルに関する情報を表示する欄である。予測モデルは、被説明変数と説明変数との間の関係を示していて、その説明変数の関数で表される。また、本実施形態では、後述するように、学習部3は、被説明変数毎に、複数種類の学習アルゴリズムを用いて、複数種類の予測モデルを学習する。ここでは、説明を簡単にするために、被説明変数の種類が、「商品1の売上数」、「商品2の売上数」、「商品3の売上数」の3種類であるものとする。また、学習部3は、3種類の学習アルゴリズム(ここでは、回帰分析、ニューラルネットワークおよびサポートベクターマシンとする。)を用いて、学習アルゴリズム毎に予測モデルを学習するものとする。従って、学習部3は、商品1の売上数(S1とする。)に関して、回帰分析による予測モデル、ニューラルネットワークによる予測モデル、およびサポートベクターマシンによる予測モデルをそれぞれ学習する。学習部3は、他の被説明変数に関しても、同様に3種類の予測モデルを学習する。なお、学習部3が被説明変数毎に学習する予測モデルは3種類でなくてもよい。The prediction
予測モデル表示欄22は、被説明変数を選択するためのタブ22aを含む。個々のタブと、個々の被説明変数は一対一に対応している。図2では、被説明変数「商品1の売上数」に対応するタブがユーザによって選択され、表示制御部4が、「商品1の売上数」に関して学習された3種類の予測モデルを予測モデル表示欄22に表示している場合を例示している。なお、図2に示すfaは回帰分析による予測モデルであり、fbはニューラルネットワークによる予測モデルであり、fcはサポートベクターマシンによる予測モデルであるものとする。図2では、S1=fa(P1,P2,P3,x1,x6)等のように模式的に予測モデルを示しているが、表示制御部4は、予測モデルとして具体的な関数を予測モデル表示欄22に表示する。他のタブがユーザによって選択された場合、表示制御部4は、そのタブに対応する被説明変数に関して学習された3種類の予測モデルに関する情報を表示する。The prediction
予測モデル表示欄22は、被説明変数毎に(換言すれば、タブ毎に)、3種類の予測モデルの中からユーザが1つの予測モデルを選択するためのユーザインタフェースを含む。図2では、このユーザインタフェースがラジオボタン22bである場合を例示している。ユーザは、被説明変数毎に、表示されている3種類の予測モデルの中から最も適切な1つの予測モデルを判断し、ラジオボタン22bを操作してその1つの予測モデルを選択する。このとき、ユーザは、被説明変数毎に、独立して予測モデルを選択してよい。例えば、ユーザは、「商品1の売上数」に関してニューラルネットワークによる予測モデルを選択し、「商品2の売上数」に関して回帰分析による予測モデルを選択し、「商品3の売上数」に関してサポートベクターマシンによる予測モデルを選択してもよい。 The prediction
第1入力欄23は、学習に用いられるパラメータをユーザが入力するための欄である。図2に示す例では、ユーザによって、予測モデルで用いられる説明変数の数として“5”が入力された場合を例示している。学習部3は、このパラメータを用いて、予測モデルで用いられる説明変数の数が5となるように、各予測モデルを学習する。なお、ここでは、学習に用いられるパラメータの例として、予測モデルで用いられる説明変数の数を例示したが、学習に用いられるパラメータは、本例に限定されない。例えば、「過去のどの期間の訓練データに基づいて学習を行うか」が、第1入力欄23で指定されてもよい。 The
最適化結果表示欄25は、最適化された目的変数の値を表示する欄である。本例では、「商品1の価格」、「商品2の価格」および「商品3の価格」が目的変数であるものとする。表示制御部4は、それらの最適化された結果を最適化結果表示欄25に表示する。 The optimization
第2入力欄26は、最適化における制約条件をユーザが入力するための欄である。制約条件の内容は任意であり、例えば、ビジネス上の制約等が制約条件として入力される。例えば、図2に示す例において、P3は「商品3の価格」に該当する変数であり、P2は「商品2の価格」に該当する変数である。従って、第2入力欄26に例示した「P3>P2」は、「商品3の価格」は「商品2の価格」よりも高いという制約条件を示している。最適化部10は、この制約条件を満たすように各目的変数の値を最適化する。なお、制約条件は上記の例に限定されない。例えば、商品1の売上数をS1とし、ノルマをqとしたときに、“S1≧q”という制約条件が第2入力欄26に入力されてもよい。また、最適化の際に用いられるパラメータが第2入力欄26に入力されてもよい。The
第1指示ボタン24は、学習の実行をユーザが指示するためのボタンである。第1指示ボタン24がクリックされると、学習部3は、予測モデルを学習する。 The
第2指示ボタン27は、最適化の実行をユーザが指示するためのボタンである。第2指示ボタン27がクリックされると、目的関数生成部9および最適化部10が順次、処理を実行する。 The
前述のように、予測モデル表示欄22において、ユーザは、被説明変数毎に、表示されている3種類の予測モデルの中から最も適切な1つの予測モデルを判断し、その予測モデルを選択する。ユーザが最も適切な予測モデルを的確に判断できることが好ましい。そこで、表示制御部4は、予測モデルとして具体的な関数を直接表示するのではなく。図3に例示するように予測モデルに関する情報を表示してもよい。ただし、ここでは、予測モデルは、Y=a1×X1+a2×X2+・・・an×Xn+cという形式で表されるものとする。Yは被説明変数であり、X1,X2,・・・,Xnは説明変数である。a1,a2,・・・,anは、個々の説明変数に対応する係数である。cは定数項である。As described above, in the prediction
図3に示す例では、P1,P2,P3,x1〜x6が説明変数である。図3において、水平に示されたバーは、説明変数に対応する係数を表している。具体的には、バーが中心線より右側にあるか左側にあるかによって、係数の正負を表し、バーの長さによって係数の絶対値を示している。バーが中心線より右側にある場合、係数が正であることを表し、バーが中心線より左側にある場合、係数が負であることを表すものとする。図3に示すfaでは、説明変数P1の係数は正であり、その係数の絶対値は、faにおける他の説明変数の係数の絶対値よりも大きいことが分かる。また、図3では、バーの近傍に説明変数を表す記号を示す場合を例示しているが、個々のバーがどの説明変数に対応しているかを他の態様で示してもよい。図3に例示する表示形式では、ユーザは、重要な説明変数が抜け落ちているか否か、また、重要な説明変数の係数の値が不適当な値になっているか否かを確認しやすくなり、最も適切な予測モデルを的確に判断しやすくなる。重要な説明変数の係数の値が不適当な値になっている場合とは、例えば、正であるべき係数が負になっていたり、負であるべき係数が正になっていたりする場合や、係数の絶対値が極端に大きくなっていたり、極端に小さくなっていたりする場合等である。In the example shown in FIG. 3, P1 , P2 , P3 , and x1 to x6 are explanatory variables. In FIG. 3, the bars shown horizontally represent the coefficients corresponding to the explanatory variables. Specifically, the positive / negative of the coefficient is indicated by whether the bar is on the right side or the left side of the center line, and the absolute value of the coefficient is indicated by the length of the bar. If the bar is to the right of the centerline, it indicates that the coefficient is positive, and if the bar is to the left of the centerline, it indicates that the coefficient is negative. In
また、ユーザが最も適切な予測モデルを的確に判断しやすくするために、表示制御部4は、過去の被説明変数の値および説明変数の値を含むテストデータを用いて、予測モデル毎に被説明変数の値を算出し、その被説明変数の値と過去の被説明変数の値との差を可視化してもよい。また、表示制御部4は、散布図を用いて差を可視化してもよい。図4は、このような散布図の表示欄22cを含む予測モデル表示欄22の例を示す説明図である。散布図の表示欄22cにおいて、テストデータから算出した被説明変数の値を予測値と記し、過去の被説明変数の値を実績値と記している。また、散布図の表示欄22cにおいて、三角形のマーカは、表示されている1番目の予測モデルで算出された予測値と実績値との関係を示しているものとする。丸のマーカは、表示されている2番目の予測モデルで算出された予測値と実績値との関係を示しているものとする。四角形のマーカは、表示されている3番目の予測モデルで算出された予測値と実績値との関係を示しているものとする。マーカが散布図中に示している破線に近いほど、予測値と実績値との差が小さいことになる。従って、例えば、図4に例示する散布図が表示された場合、丸のマーカが破線に近いことから、ユーザは、表示されている2番目の予測モデルが最も適切であると判断できる。なお、タブの選択が切り替えられると、表示制御部4は、散布図を表示し直す。 Further, in order to make it easier for the user to accurately determine the most appropriate prediction model, the display control unit 4 uses test data including the past value of the explained variable and the value of the explanatory variable, and receives each prediction model. The value of the explanatory variable may be calculated and the difference between the value of the explained variable and the value of the explained variable in the past may be visualized. Further, the display control unit 4 may visualize the difference by using a scatter plot. FIG. 4 is an explanatory diagram showing an example of the prediction
また、表示制御部4は、図3に示す表示態様において、図4に例示する散布図の表示欄22cを表示してもよい。 Further, the display control unit 4 may display the
また、ユーザが最も適切な予測モデルを的確に判断しやすくするために、表示制御部4は、交差検証を行ってもよい。 Further, in order to make it easier for the user to accurately determine the most appropriate prediction model, the display control unit 4 may perform cross-validation.
訓練データ記憶部2は、学習部3が予測モデルの学習に用いる各種訓練データを記憶する。本実施形態では、訓練データ記憶部2は、最適化部10が最適化結果として出力する変数(目的変数)について、過去に取得された実績データを記憶する。例えば、最適化部10が複数の商品の価格を最適化しようとする場合、訓練データ記憶部2は、過去に取得された実績データとして、説明変数に対応する各商品の価格や、被説明変数に対応する各商品の売上数を記憶する。また、訓練データ記憶部2は、上記以外の外的情報(例えば、天気や暦情報等)も記憶する。これらの外的情報も説明変数となり得る。訓練データ記憶部2は、例えば、磁気ディスク装置により実現される。 The training
なお、前述のテストデータは、例えば、訓練データとは別に、訓練データ記憶部2に記憶させておけばよい。 The test data described above may be stored in the training
学習部3は、学習の実行を指示する操作が行われると(本例では、第1指示ボタン24がクリックされると)、訓練データ記憶部2に記憶された各種訓練データに基づいて、機械学習により、設定された被説明変数毎に予測モデルを学習する。このとき、学習部3は、被説明変数毎に、複数種類の学習アルゴリズムを用いて、複数種類の予測モデルを学習する。また、学習部3は、第1入力欄23に入力されたパラメータを用いて各予測モデルを学習する。例えば、前述のように、予測モデルで用いられる説明変数の数として“5”が指定された場合、学習部3は、予測モデルで用いられる説明変数の数が5となるように、各予測モデルを学習する。 When the
本実施形態で学習される予測モデルは、最適化部10が最適化結果として出力する変数(目的変数)を説明変数として含む関数で表される。すなわち、目的変数は、予測モデルの説明変数になっている。例えば、「商品1の価格」、「商品2の価格」および「商品3の価格」が目的変数P1,P2,P3であるとする。学習部3は、例えば、各予測モデルにおいて、P1,P2,P3を説明変数として用いる。学習部3は、さらに他の説明変数を、自動的に決定する。このとき、学習部3は、訓練データ記憶部2に記憶されている外的情報に含まれている種々の項目(例えば、天候等)の中から説明変数を決定すればよい。上記のように、パラメータとして、予測モデルで用いられる説明変数の数が定められている場合、学習部3は、その数に合わせて、予測モデルで用いる説明変数を決定する。P1,P2,P3以外の説明変数は、予測モデル同士で異なっていてもよい。The prediction model learned in this embodiment is represented by a function including a variable (objective variable) output as an optimization result by the
上記の複数種類の学習アルゴリズムは、特に限定されない。例えば、前述の例では、回帰分析、ニューラルネットワークおよびサポートベクターマシンを例示したが、学習部3は、予測モデルの学習方法の一つとして、特許文献1に記載の方法を採用してもよい。また、学習アルゴリズムの種類の数も限定されない。 The above-mentioned plurality of types of learning algorithms are not particularly limited. For example, in the above-mentioned example, regression analysis, neural network and support vector machine are illustrated, but the
ここで、最適化対象のインデックスの集合を{m|m=1,・・・,M}と記す。本実施形態の例では、最適化対象は各商品の価格であり、Mは商品数に対応する。また、各最適化対象mについて予測する内容をSmと記す。本実施形態の例では、Smは、商品mの売上数に対応する。また、各最適化対象mについて最適化する内容(すなわち、最適化の目的変数)をPmまたはP´mと記す。本実施形態の例では、Pmは、商品mの価格に対応する。線形回帰(回帰分析の一種)を使用してSm(例えば、売上数)とPm(例えば、価格)との依存関係をモデル化すると、Smを予測する予測モデルは、例えば、以下に例示する式1で表される。Here, the set of indexes to be optimized is described as {m | m = 1, ..., M}. In the example of this embodiment, the optimization target is the price of each product, and M corresponds to the number of products. In addition, the content to be predicted for each optimization targetm is described as Sm . In the example of this embodiment, Sm corresponds to the number of sales of the product m. The contents optimized for each optimized m (i.e., objective variables of optimization) the referred to as Pm orP'm. In the example of this embodiment, Pm corresponds to the price of the product m. When modeling the dependency between Sm (eg, number of sales) and Pm (eg, price) using linear regression (a type of regression analysis), the predictive model that predicts Sm is, for example: It is represented by the illustrated

式1において、fdは特徴生成関数であり、P´mに対する変換を表わす。また、Dは特徴生成関数の数を示し、P´mに対して行われる変換の数を示す。fdの内容は任意であり、例えば、線形変換を行う関数であってもよく、対数や多項式のような非線形変換を行う関数であってもよい。上述するように、Pmが商品mの価格であり、Smが商品mの売上数を示す場合、fdは、例えば、価格に関する売上の反応を表わす。売上の反応とは、例えば、ある程度の値下げをすると売上の反応が良くなる、または、反応が悪くなる、値下げに応じて売上数が二乗になる、等が挙げられる。In
また、式1において、gdは、外的特徴(上述する例の場合、天候等)であり、D´は、外的特徴の数である。なお、外的特徴に関しては、事前に変換をしておいてもよい。また、式1におけるα、β、γは、それぞれ学習部3による機械学習の結果得られる回帰式の定数項および係数である。これまでの説明から明らかである通り、予測モデルは、被説明変数(Sm)および説明変数(Pmや、各種外的特徴等)に基づいて学習され、被説明変数と説明変数との間の関係を示し、説明変数の関数で表されるものである。Further, in
記憶部6は、ユーザによって被説明変数毎に選択された各予測モデル、および第2入力欄26に入力された最適化における制約条件や、最適化の際に用いられるパラメータを記憶する。表示制御部4は、最適化の実行を指示する操作が行われると(本例では、第2指示ボタン27がクリックされると)、ユーザによって被説明変数毎に選択された各予測モデルと、第2入力欄26に入力された制約条件やパラメータ(最適化の際に用いられるパラメータ)を記憶部6に記憶させる。また、記憶部6は、外的情報入力部7が入力した外的情報も記憶する。記憶部6は、例えば、磁気ディスク装置により実現される。 The storage unit 6 stores each prediction model selected by the user for each explained variable, the constraint conditions in the optimization input in the
外的情報入力部7は、ユーザによって被説明変数毎に選択される予測モデル並びに最適化の制約条件およびパラメータ以外で、最適化に用いられる外的情報を入力する。例えば、上述の例において、ある日の価格を最適化しようとする場合、外的情報入力部7は、その日の天気(予測された天気)に関する情報を入力してもよい。また、例えば、その日の来店人数を予測できるような場合、外的情報入力部7は、その日の来店人数に関する情報を入力してもよい。この来店人数の例の様に、外部情報は、機械学習による予測モデルによって生成されたものでもよい。ここで入力される情報は、例えば、予測モデルの説明変数に適用される。 The external information input unit 7 inputs external information used for optimization other than the prediction model selected by the user for each explained variable and the constraints and parameters of optimization. For example, in the above example, when trying to optimize the price of a certain day, the external information input unit 7 may input information about the weather of the day (predicted weather). Further, for example, when the number of visitors to the store on that day can be predicted, the external information input unit 7 may input information on the number of visitors to the store on that day. As in this example of the number of visitors, the external information may be generated by a prediction model by machine learning. The information entered here is applied, for example, to the explanatory variables of the prediction model.
外的情報入力部7が入力する情報は、例えば、ユーザが事前に用意しておけばよい。 The information to be input by the external information input unit 7 may be prepared in advance by the user, for example.
問題記憶部8は、最適化により解こうとする数理計画問題を記憶する。数理計画問題は、ユーザ等によって予め問題記憶部8に記憶される。なお、数理計画問題が、第2入力欄26に入力され、第2指示ボタン27がクリックされたときに、表示制御部4が、その数理計画問題を問題記憶部8に記憶させる構成であってもよい。ここでは、問題記憶部8が予め数理計画問題を記憶している場合を例にして説明する。問題記憶部8は、例えば、磁気ディスク装置により実現される。 The problem storage unit 8 stores the mathematical planning problem to be solved by optimization. The mathematical planning problem is stored in the problem storage unit 8 in advance by the user or the like. When the mathematical planning problem is input to the
なお、本実施形態では、数理計画問題の中で記述される目的関数の“形”は、予測モデルがパラメータになるように定義される。本実施形態の例では、問題記憶部8は、複数の商品の売上高の総和を最大化するための数理計画問題を記憶する。この場合、最適化部10は、複数の商品の売上高の総和を最大化するように各商品の価格を最適化する。各商品の売上高は、商品の価格と予測モデルで予測される売上数の積で定義できる。従って、各商品の売上高の総和を表す目的関数の“形”は、以下に示す式2のように表される。 In this embodiment, the "form" of the objective function described in the mathematical programming problem is defined so that the prediction model becomes a parameter. In the example of this embodiment, the problem storage unit 8 stores a mathematical planning problem for maximizing the total sales of a plurality of products. In this case, the
式2は、商品の価格と予測モデルで予測される売上数の積の合計を式として示したものであるが、売上数Smを表す予測モデルは代入されていない。そのため、式2を目的関数の“形”と称している。
本例の場合、問題記憶部8に、以下の式3に示す数理計画問題を予め記憶させておけばよい。 In the case of this example, the problem storage unit 8 may store the mathematical planning problem shown in the
式3は、各商品の売上高の総和を最大化するという数理計画問題を表している。式3には、式2で示した目的関数の“形”が記述されている。
目的関数生成部9は、数理計画問題の目的関数を生成する。具体的には、目的関数生成部9は、予測モデルをパラメータとする数理計画問題の目的関数を生成する。目的関数生成部9は、問題記憶部8に記憶された数理計画問題に記述されている目的関数の“形”(上記の例では式2)に、ユーザによって被説明変数毎に選択された予測モデルを代入することにより目的関数を生成する。ここでは、説明を簡単にするために、式2におけるMの値が3であるとする(すなわち、商品の数が3であるとする)。この場合、ユーザは、「商品1の売上数S1」、「商品2の売上数S2」、「商品3の売上数S3」という被説明変数毎に、その被説明変数を表す具体的な予測モデル(関数)を選択し、S1,S2,S3に対応する予測モデル(関数)が記憶部6に記憶されている。目的関数生成部9は、それらの各予測モデルを、式2に示す目的関数の“形”に代入することによって、目的変数を生成する。The objective function generation unit 9 generates the objective function of the mathematical programming problem. Specifically, the objective function generation unit 9 generates an objective function of a mathematical programming problem using a prediction model as a parameter. The objective function generation unit 9 predicts that the "form" (
最適化部10は、記憶部6に記憶されている各種情報(第2入力欄26を介して入力された最適化の制約条件およびパラメータ並びに外的情報入力部7が入力した外的情報)に基づいて、目的とする内容の最適化を行う。このとき、最適化部10は、目的関数の値が最適になるように、目的変数の値を最適化する。目的変数等に制約条件が定められているため、最適化部10は、制約条件を満たしつつ、目的関数の値が最適(例えば、最大、最小等)になるように、目的変数の値を最適化する。 The
本例では、問題記憶部8に記憶された数理計画問題が式3のように定められているので、最適化部10は、制約条件を満たしつつ、目的関数の値が最大になるように目的変数の値を最適化する。最適化部10は、式3で特定される数理計画問題を解くことで、目的変数に該当する個々の商品の価格P1,P2,・・・,PMを最適化する。すなわち、最適化部10は、各商品の売上高の総和を最大にするような、各商品の価格を導出する。In this example, since the mathematical planning problem stored in the problem storage unit 8 is defined as in
最適化部10は、各目的変数の値を最適化すると、その各目的変数の値を記憶部6に記憶させる。すると、表示制御部4は、ディスプレイ装置5上に表示されている画面21内の最適化結果表示欄25に、各目的変数の最適値を表示する。 When the
学習部3、表示制御部4、外的情報入力部7、目的関数生成部9および最適化部10は、例えば、プログラム(情報処理用プログラム)に従って動作するコンピュータのCPUによって実現される。この場合、CPUは、例えば、コンピュータのプログラム記憶装置(図1において図示略)等のプログラム記録媒体からプログラムを読み込み、そのプログラムに従って、学習部3、表示制御部4、外的情報入力部7、目的関数生成部9および最適化部10として動作すればよい。 The
また、学習部3、表示制御部4、外的情報入力部7、目的関数生成部9および最適化部10が、それぞれ専用のハードウェアで実現されていてもよい。学習部3、表示制御部4、外的情報入力部7、目的関数生成部9および最適化部10は、それぞれ電気回路構成(circuitry )により実現されていてもよい。ここで、電気回路構成(circuitry )とは、単一のデバイス(single device )、複数のデバイス(multiple devices)、チップセット(chipset )またはクラウド(cloud )を概念的に含む文言である。 Further, the
また、本発明の情報処理システム1は、2つ以上の物理的に分離した装置が有線または無線で接続されている構成であってもよい。 Further, the
次に、本発明の処理経過を説明する。図5および図6は、本発明の処理経過の例を示すフローチャートである。 Next, the processing process of the present invention will be described. 5 and 6 are flowcharts showing an example of the processing process of the present invention.
最初に、表示制御部4は、画面21をディスプレイ装置5上に表示する。ただし、初期状態では、予測モデル表示欄22、最適化結果表示欄25に予測モデルや最適化結果は表示されていない。また、第1入力欄23および第2入力欄26は、空欄となっている。 First, the display control unit 4 displays the
ユーザは、学習に用いられるパラメータを第1入力欄23に入力する。このユーザの操作に応じて、表示制御部4は、第1入力欄23を介して、学習に用いられるパラメータの入力を受け付ける(ステップS11)。表示制御部4は、入力されたパラメータを第1入力欄23内に表示する。 The user inputs the parameters used for learning in the
ユーザが第1指示ボタン24をクリックしない場合(ステップS12のNo)、情報処理システム1は、第1指示ボタン24がクリックされるまで待つ。この間、第1入力欄23に入力されたパラメータがユーザによって修正されてもよい。 If the user does not click the first instruction button 24 (No in step S12), the
ユーザが第1指示ボタン24をクリックした場合(ステップS12のYes)、学習部3は、第1入力欄23に入力されたパラメータと、訓練データ記憶部2に記憶されている各種訓練データに基づいて、予め設定されている被説明変数毎に予測モデルを学習する(ステップS13)。このとき、学習部3は、被説明変数毎に、複数種類の学習アルゴリズムを用いて、複数種類の予測モデルを学習する。 When the user clicks the first instruction button 24 (Yes in step S12), the
次に、表示制御部4は、被説明変数毎に学習された予測モデルに関する情報を表示する(ステップS14)。被説明変数毎に複数種類の予測モデルが学習されているので、表示制御部4は、被説明変数毎に複数の予測モデルを表示する。 Next, the display control unit 4 displays information about the prediction model learned for each explained variable (step S14). Since a plurality of types of prediction models are learned for each explained variable, the display control unit 4 displays a plurality of prediction models for each explained variable.
ステップS14において、表示制御部4は、例えば、図2に例示するように、タブ22aおよびラジオボタン22bを含む予測モデル表示欄22に予測モデルに関する情報を表示すればよい。個々のタブと、個々の被説明変数は一対一に対応している。例えば、表示制御部4は、ユーザによって1つのタブが選択されると、そのタブに対応する被説明変数に関して学習された複数の予測モデルを予測モデル表示欄22に表示する。タブの選択が切り替えられると、表示制御部4は、新たに選択されたタブに対応する被説明変数に関して学習された複数の予測モデルを予測モデル表示欄22に表示すればよい。 In step S14, the display control unit 4 may display information about the prediction model in the prediction
なお、表示制御部4は、図3に例示する態様で予測モデルに関する情報を表示してもよい。また、表示制御部4は、前述の散布図を予測モデルとともに表示してもよい(図4参照)。 The display control unit 4 may display information about the prediction model in the manner illustrated in FIG. Further, the display control unit 4 may display the above-mentioned scatter plot together with the prediction model (see FIG. 4).
ユーザは、被説明変数毎に(換言すれば、タブ毎に)、表示されている複数の予測モデルの中から最も適切な1つの予測モデルを判断し、ラジオボタン22bを操作してその1つの予測モデルを選択する。このユーザの操作に応じて、表示制御部4は、被説明変数毎に、1つの予測モデルの選択を受け付ける(ステップS15)。なお、本実施形態では、予測モデルの中からユーザが1つの予測モデルを選択するためのユーザインタフェースがラジオボタンである場合を例示したが、このユーザインタフェースの形式はラジオボタン以外であってもよい。 The user determines one of the most appropriate prediction models from the plurality of displayed prediction models for each explained variable (in other words, for each tab), and operates the
続いて、ユーザは、第2入力欄26に、最適化における制約条件を入力する。このユーザの操作に応じて、表示制御部4は、第2入力欄26を介して、最適化における制約条件の入力を受け付ける(ステップS16)。表示制御部4は、入力された制約条件を第2入力欄26内に表示する。また、ステップS16において、ユーザは、最適化の際に用いられるパラメータも第2入力欄26に入力してもよい。この場合、表示制御部4は、このパラメータの入力も同様に受け付け、そのパラメータを第2入力欄26内に表示すればよい。 Subsequently, the user inputs the constraint condition in the optimization in the
また、外的情報入力部7は、外的情報を入力し、記憶部6に記憶させる(ステップS17)。 Further, the external information input unit 7 inputs the external information and stores it in the storage unit 6 (step S17).
ステップS17の後、ユーザが第2指示ボタン27をクリックしない場合(ステップS18のNo)、情報処理システム1は、第2指示ボタン27がクリックされるまで待つ。この間、ユーザによって予測モデルが選択し直されたり、第2入力欄26に入力された制約条件等がユーザによって修正されたりしてもよい。 If the user does not click the
ユーザが第2指示ボタン27をクリックした場合(ステップS18のYes)、表示制御部4は、被説明変数毎に選択された予測モデル、および第2入力欄26に入力された制約条件を記憶部6に記憶させる(ステップS19)。最適化の際に用いられるパラメータも入力されている場合、表示制御部4は、そのパラメータも記憶部6に記憶させる。 When the user clicks the second instruction button 27 (Yes in step S18), the display control unit 4 stores the prediction model selected for each explained variable and the constraint conditions input in the
次に、目的関数生成部9は、被説明変数毎に選択された予測モデルを記憶部6から読み込むとともに、問題記憶部8に記憶されている数理計画問題を読み込む。この数理計画問題は、例えば、式3に例示するように表され、数理計画問題には式2に例示する目的関数の“形”が記述されている。目的関数生成部9は、式2に例示する目的関数の“形”に、被説明変数毎に選択された具体的な予測モデルを代入することによって、目的関数を生成する(ステップS20)。 Next, the objective function generation unit 9 reads the prediction model selected for each explained variable from the storage unit 6 and also reads the mathematical planning problem stored in the problem storage unit 8. This mathematical programming problem is represented, for example, as illustrated in
最適化部10は、制約条件や外的情報を記憶部6から読み込み、その制約条件を満たすようにする理計画問題を解くことで、各目的変数の値の最適値を導出する(ステップS21)。例えば、式3に示すように、各商品の売上高の総和を最大化するという数理計画問題が定められている場合、最適化部10は、制約条件のもとで、ステップS20で生成された目的関数が最大になるような目的変数P1,P2,・・・,PMの値を導出する。The
最適化部10は、導出した各目的変数の最適値を記憶部6に記憶させる。表示制御部4は、各目的変数の最適値を記憶部6から読み込み、最適化結果表示欄25に表示する。この結果、ユーザは、各目的変数の最適値(例えば、売上高の総和を最大化する各商品の価格)を把握することができる。 The
上記の処理経過において、ユーザは、ステップS14で表示された予測モデルの中に適切な予測モデルがないと判断した場合、学習に用いるパラメータを見直し、新たなパラメータを第1入力欄23に入力してもよい。その場合、情報処理システム1は、再度、ステップS11から処理を実行し直せばよい。すなわち、情報処理システム1は、ユーザが被説明変数毎に適切な予測モデルが得られたと判断するまで、予測モデルの学習を繰り返すことができる。 In the above processing process, when the user determines that the prediction model displayed in step S14 does not have an appropriate prediction model, the user reviews the parameters used for learning and inputs new parameters into the
また、ユーザは、ステップS21で表示された各目的変数の最適値が適切な値でないと判断した場合にも、学習に用いるパラメータを見直し、新たなパラメータを第1入力欄23に入力してもよい。その場合、情報処理システム1は、再度、ステップS11から処理を実行し直せばよい。あるいは、ユーザは、予測モデル表示欄22で、被説明変数毎に予測モデルを1つ選択する操作をやり直してもよい。この場合、情報処理システム1は、再度、ステップS15から処理を実行し直せばよい。あるいは、ユーザは、最適化における制約条件を見直し、新たな制約条件を第2入力欄26に入力してもよい。この場合、情報処理システム1は、再度、ステップS16から処理を実行し直せばよい。すなわち、情報処理システム1は、各目的変数の最適値として適切な値が得られたとユーザが判断するまで、学習あるいは最適化を繰り返すことができる。 Further, even if the user determines that the optimum value of each objective variable displayed in step S21 is not an appropriate value, the user may review the parameters used for learning and input new parameters in the
本発明によれば、目的関数生成部9が、予め定められた目的関数の“形”に、予測モデルを代入することによって目的関数を生成する。そして、最適化部10は、その目的関数の値が最適になるように、目的変数の値を最適化する。すなわち、最適化部10は、予測モデルを引数とする目的関数について、目的関数の値が最適になるように、目的変数の値を最適化する。従って、本発明によれば、数理最適化で観測されない入力データが存在する状況であっても、適切に最適化を行うことができる。 According to the present invention, the objective function generation unit 9 generates an objective function by substituting a prediction model into a predetermined “form” of the objective function. Then, the
また、本発明によれば、表示制御部4は、被説明変数毎に学習された予測モデルを予測モデル表示欄22に表示する。従って、学習した予測モデルが適切であるか否かをユーザに確認させることができる。従って、ユーザは、例えば、経験的に知られている現象が予測モデルに反映されているか否かを確認できる。また、ユーザは、最適化後に、得られた最適解がなぜ最適になるのかについて検討することができる。 Further, according to the present invention, the display control unit 4 displays the predicted model learned for each explained variable in the predicted
また、本実施形態では、学習部3が、被説明変数毎に複数種類の予測モデルを学習し、表示制御部4は、被説明変数毎に複数種類の予測モデルを予測モデル表示欄22に表示する。従って、ユーザは、被説明変数毎に、複数の予測モデルの中から最も適切であると判断した予測モデルを選択することができる。この結果、目的変数の最適値の精度を向上させることができる。また、例えば、いずれかの被説明変数において、全ての予測モデルが適切でないと判断した場合であっても、上記のように、パラメータを見直して、学習部3に再度、予測モデルの学習を実行させることができる。 Further, in the present embodiment, the
また、ユーザは、いずれかの目的変数の最適値が適切でないと判断した場合にも、上記のように、学習に用いるパラメータを見直したり、被説明変数毎に予測モデルを1つ選択する操作をやり直したり、あるいは、最適化における制約条件を見直したりすることで、情報処理システム1に再度、最適化を実行させることができる。 In addition, even if the user determines that the optimum value of any of the objective variables is not appropriate, he / she can review the parameters used for learning or select one prediction model for each explained variable as described above. The
次に、本実施形態の変形例について説明する。
上記の実施形態では、学習部3が、被説明変数毎に、複数種類の学習アルゴリズムを用いて、複数種類の予測モデルを学習する。学習アルゴリズムが1つに限定され、学習部3が、被説明変数毎に1つの予測モデルを学習してもよい。この場合、表示制御部4は、予測モデル表示欄22において、被説明変数毎に(タブ毎に)、1つの予測モデルに関する情報を表示すればよい。また、この場合、表示制御部4は、予測モデル表示欄22内にラジオボタン22bを表示しなくてよく、ステップS15の処理も実行しなくてよい。また、第1指示ボタン24がクリックされた場合、表示制御部4は、被説明変数毎に作成された予測モデルをそれぞれ記憶部6に記憶させればよい。Next, a modified example of this embodiment will be described.
In the above embodiment, the
また、学習部3は、同じ学習アルゴリズムを用いて、複数の予測モデルを学習してもよい。例えば、学習部3は、2015年11月の訓練データを用いて、ある学習アルゴリズムによって予測モデルを学習するとともに、2015年12月の訓練データを用いて、同一の学習アルゴリズムによって別の予測モデルを学習してもよい。また、例えば、学習部3は、同じ学習アルゴリズムおよび同じ訓練データを用いて、学習区間における残差が小さくなることを優先して予測モデルを学習するとともに、汎化性能を重視して別の予測モデルを学習してもよい。 Further, the
また、表示制御部4は、予測モデル表示欄22において、表示した予測モデルに対するユーザの編集操作を受け付けてもよい。この場合、ユーザは、予測モデル表示欄22に表示された予測モデルを編集することができる。従って、ユーザは、パラメータを見直して学習部3に再度、学習を実行させなくても、表示された予測モデルの説明変数の係数や定数項を調整することができる。編集操作が行われた予測モデルが選択され、第1指示ボタン24がクリックされた場合、表示制御部4は、編集後の予測モデルを記憶部6に記憶させればよい。 Further, the display control unit 4 may accept a user's editing operation on the displayed prediction model in the prediction
また、上記の実施形態では、学習の実行や最適化の実行をユーザがボタンによって指示する場合を例示した。学習の実行や最適化の実行を指示するためのユーザインタフェースは、第1指示ボタン24および第2指示ボタン27以外の形式であってもよい。例えば、表示制御部4は、コマンドラインユーザインタフェースを画面21とともに表示してもよい。この場合、情報処理システム1は、コマンドラインユーザインタフェースに、学習実行指示を示す所定の文字列が入力された場合に、ステップS13以降の処理を実行し、最適化実行指示を示す所定の文字列が入力された場合に、ステップS19移行の処理を実行すればよい。 Further, in the above embodiment, a case where the user instructs the execution of learning or the execution of optimization by a button is illustrated. The user interface for instructing the execution of learning and the execution of optimization may be in a form other than the
なお、図2では、目的変数の数が3つ(「商品1の価格」、「商品2の価格」および「商品3の価格」)である場合を例示したが、値を最適化しようとする目的変数の数は特に限定されない。また、予測対象も、商品に限定されず、例えば、サービス等であってもよい。 In FIG. 2, the case where the number of objective variables is three (“price of
複数の商品の売上数の予測に基づいて複数の商品の売上高の総和を最大にするように複数の商品の価格を最適化する場合の本発明の適用例について、商品がサンドイッチである場合を例にして説明する。ここでは、商品(サンドイッチ)の種類を符号A,B,CおよびDで区別するものとする。 In the application example of the present invention in the case of optimizing the prices of a plurality of products so as to maximize the sum of the sales of the plurality of products based on the forecast of the number of sales of the plurality of products, the case where the products are sandwiches. Let's take an example. Here, the types of goods (sandwiches) are distinguished by the symbols A, B, C and D.
例えば、ある小売店で、将来のある日のサンドイッチ群の売上高の総和を最大にする場合を考える。サンドイッチ群は、サンドイッチA,B,CおよびDの4種類のサンドイッチを含むとする。この場合、本発明の情報処理システム1は、サンドイッチ群の売上高の総和、すなわち、サンドイッチA,B,CおよびDの4種類のサンドイッチの売上高の総和が最大化されるように、サンドイッチA,B,CおよびDの価格を最適化するという問題を解くことになる。 For example, suppose a retail store maximizes the total sales of sandwiches one day in the future. The sandwich group is assumed to include four types of sandwiches, sandwiches A, B, C and D. In this case, the
訓練データ記憶部2は、過去の各サンドイッチの売上数および過去の各サンドイッチの価格を記憶する。訓練データ記憶部2は、例えば、過去の天気や暦情報等の外的情報も記憶する。 The training
学習部3は、訓練データ記憶部2に記憶された各種訓練データに基づいて、個々のサンドイッチの種類毎に、複数種類の学習アルゴリズムを用いて、複数種類の予測モデル(本例では、売上数の予測モデル)を学習する。 The
ここでは、サンドイッチAの売上数の予測モデルを例にして、各サンドイッチの価格を示す説明変数を、売上数の予測モデルに含めることを説明する。サンドイッチの売上数は、サンドイッチA自体の価格の影響を受けると考えられる。また、サンドイッチAの売上数は、サンドイッチAと共に商品棚に陳列されるサンドイッチ、すなわちサンドイッチB,CおよびDの価格の影響も受けると考えられる。その小売店に来店する顧客は、商品棚に同時に陳列されるサンドイッチA,B,CおよびDのうちから、好ましいサンドイッチを選択的に購入すると考えられるからである。 Here, an explanatory variable indicating the price of each sandwich will be described in the forecast model of the number of sales by taking the forecast model of the number of sales of sandwich A as an example. The number of sandwiches sold is considered to be affected by the price of sandwich A itself. It is also considered that the number of sales of sandwich A is affected by the prices of sandwiches displayed on the product shelves together with sandwich A, that is, sandwiches B, C and D. This is because it is considered that the customer who visits the retail store selectively purchases a preferable sandwich from the sandwiches A, B, C and D displayed on the product shelves at the same time.
この状況で、例えば、サンドイッチBが大安売りされている日を想定する。普段はサンドイッチAを好んで購入する顧客であっても、このような日にはサンドイッチAではなくサンドイッチBを選択して購入する可能性がある。顧客(人間)が一度に食することができるサンドイッチの量には限りがあるので、一般的な顧客がサンドイッチA,Bの両方を購入しようと考える可能性は低いからである。 In this situation, for example, assume the day when sandwich B is sold at a bargain price. Even a customer who usually prefers to buy sandwich A may choose sandwich B instead of sandwich A on such a day. This is because the amount of sandwiches that a customer (human) can eat at one time is limited, so it is unlikely that a general customer will consider purchasing both sandwiches A and B.
この場合、結果的には、サンドイッチBが安売りされていることにより、サンドイッチAの売上数が減ることになる。このような関係は、カニバリゼーション(市場の共食い関係)と呼ばれる。 In this case, as a result, the number of sales of sandwich A is reduced because the sandwich B is sold at a bargain price. Such a relationship is called cannibalization (market cannibalization).
すなわち、カニバリゼーションとは、ある商品の価格を下げると、その商品の売上数が上がる一方で、他の競合商品(性質や特徴が互いに類似した複数の商品)の売上数が減少するような関係である。 In other words, cannibalization is a relationship in which lowering the price of a certain product increases the number of sales of that product, while decreasing the number of sales of other competing products (multiple products with similar properties and characteristics). Is.
従って、学習部3は、サンドイッチAの売上数の予測モデルを複数種類学習する場合、いずれの予測モデルも、説明変数として、サンドイッチAの価格PA、サンドイッチBの価格PB、サンドイッチCの価格PCおよびサンドイッチDの価格PDを含む関数として学習する。ただし、その他の説明変数については、学習部3が、予測モデル毎に、外的情報に含まれている種々の項目(例えば、天候等)の中から適宜、自動的に選択する。Thus, the
サンドイッチBの売上数の予測モデルを複数種類学習する場合、サンドイッチCの売上数の予測モデルを複数種類学習する場合、およびサンドイッチDの売上数の予測モデルを複数種類学習する場合に関しても、同様である。 The same applies to the case of learning multiple types of sandwich B sales forecast models, the case of learning multiple types of sandwich C sales forecast models, and the case of learning multiple types of sandwich D sales forecast models. is there.
これまでの説明から明らかなように、予測モデルは、被説明変数(本例では、サンドイッチの売上数)および説明変数(本例では、着目しているサンドイッチの価格および競合するサンドイッチの価格等)に基づいて学習され、被説明変数と説明変数との間の関係を示し、説明変数の関数で表される。 As is clear from the explanation so far, the prediction model includes the dependent variable (in this example, the number of sandwiches sold) and the explanatory variable (in this example, the price of the sandwich of interest and the price of the competing sandwich, etc.). It is learned based on, shows the relationship between the explained variable and the explanatory variable, and is represented by the function of the explanatory variable.
図2に例示する画面を介して、情報処理システム1は、サンドイッチA,B,CおよびDそれぞれについて、ユーザから、1つの予測モデルの選択を受け付ける。さらに、情報処理システム1は、図2に例示する画面を介して、最適化の制約条件の入力を受け付け、第2指示ボタン27がクリックされる。すると、目的関数生成部9は、数理計画問題(本例では式3)の中で記述される目的関数の“形”(本例では式2)に、サンドイッチの種類毎に選択された予測モデルを代入することによって、最適化問題の目的関数を生成する。 Through the screen illustrated in FIG. 2, the
そして、最適化部10は、そのように生成された、予測モデルを引数とする目的関数について、制約条件のもとでその目的関数を最適化する目的変数の値(すなわちPA,PB,PCおよびPDの値)を算出する。Then, the
以上の説明では、複数の商品の売上高の総和を最大にするように複数の商品の価格を最適化する場合を示したが、複数の商品の売上数の総和、あるいは、利益を最大にするように、複数の商品の価格を最適化する場合にも本発明を適用できる。例えば、利益を最大にするように各商品の価格を最適化する場合、利益を表す目的関数の“形”が記述されているとともに、利益を最大化するということを示す数理計画問題を問題記憶部8に記憶させておけばよい。 In the above explanation, the case of optimizing the prices of a plurality of products so as to maximize the total sales of a plurality of products has been shown, but the total number of sales of a plurality of products or the profit is maximized. As described above, the present invention can also be applied when optimizing the prices of a plurality of products. For example, when optimizing the price of each product so as to maximize profit, the "form" of the objective function representing profit is described, and the mathematical planning problem indicating that profit is maximized is memorized. It may be stored in the part 8.
また、本発明の他の適用例として、第1の適用例から第5の適用例を以下に示す。 Further, as other application examples of the present invention, the first application example to the fifth application example are shown below.
第1の適用例として、商品の棚割りの最適化を説明する。この場合、学習部3は、商品毎に、着目している商品mの売上数Smの予測モデルを、複数種類生成する。このとき、学習部3は、個々の商品の棚の位置を示す各説明変数を含む予測モデルを複数種類生成する。その他の説明変数に関しては、学習部3が適宜、自動的に選択する。As a first application example, optimization of product shelving allocation will be described. In this case, the
本例における数理計画問題は、例えば、式3で表される。 The mathematical planning problem in this example is expressed by, for example,
ユーザから、商品毎に1つの予測モデルの選択を受け付け、さらに、最適化の制約条件の入力を受け付け、第2指示ボタン27がクリックされると、目的関数生成部9は、目的関数を生成し、最適化部10は、その目的関数を最大にするような目的変数の値(各商品の棚の位置)を求めればよい。 When the user accepts the selection of one prediction model for each product, further receives the input of the constraint condition of optimization, and the
第2の適用例として、ホテルの価格の最適化を説明する。この適用例の場合、売上高または利益を最大化することが目的であるため、目的関数は、売上高または利益を算出する関数で表される。目的変数として、例えば、ホテルの各部屋の利用プランの設定料金が挙げられる。前述の小売の例と比較すると、小売の例で示した「サンドイッチ」が、本適用では、例えば、「シングルルームの朝食付きプラン」に対応する。また、外部情報として、例えば、天候、季節、ホテルの周辺で行われるイベント等が挙げられる。 As a second application example, hotel price optimization will be described. In the case of this application example, since the purpose is to maximize sales or profit, the objective function is represented by a function for calculating sales or profit. As an objective variable, for example, a setting fee of a usage plan for each room of a hotel can be mentioned. Compared to the retail example above, the "sandwich" shown in the retail example corresponds to, for example, a "single room breakfast plan" in this application. In addition, examples of external information include weather, seasons, and events held around the hotel.
第3の適用例として、ホテル価格と在庫の最適化を説明する。この適用例の場合も、売上高または利益を最大化することが目的であるため、目的関数は、売上高または利益を算出する関数で表される。目的変数には、価格および在庫を考慮した内容が選択される。例えば、第1の目的変数として、各プランで利用される部屋をどの時期にどのくらいの料金で販売するかを表す変数、第2の目的変数として、各プランで利用される部屋をどの時期に何部屋販売するかを表す変数、等が挙げられる。また、第2の適用例と同様、外部情報として、例えば、天候、季節、ホテルの周辺で行われるイベント等が挙げられる。 As a third application example, optimization of hotel price and inventory will be described. In this application example as well, the purpose is to maximize sales or profits, so the objective function is represented by a function that calculates sales or profits. The objective variable is selected in consideration of price and inventory. For example, as the first objective variable, a variable indicating when and how much the room used in each plan will be sold, and as the second objective variable, what time and what room will be used in each plan. Variables indicating whether to sell the room, etc. can be mentioned. Further, as in the second application example, examples of external information include weather, seasons, events held around the hotel, and the like.
第4の適用例として、航空券の価格と在庫の最適化を説明する。この適用例の場合も、売上高または利益を最大化することが目的であるため、目的関数は、売上高または利益を算出する関数で表される。目的変数も、第3の適用例と同様、価格および在庫を考慮した内容が選択される。各航空券が、目的地までのルートや座席の種類(クラス)を表すとする。この場合、例えば、第1の目的変数として、各航空券をどの時期にどのくらいの料金で販売するかを表す変数、第2の目的変数として、各航空券をどの時期に何枚販売するかを表す変数、等が挙げられる。また、外部情報として、例えば、季節や開催されるイベント等が挙げられる。 As a fourth application example, optimization of ticket price and inventory will be described. In this application example as well, the purpose is to maximize sales or profits, so the objective function is represented by a function that calculates sales or profits. As for the objective variable, as in the third application example, the content considering the price and inventory is selected. It is assumed that each ticket represents the route to the destination and the type (class) of the seat. In this case, for example, as the first objective variable, a variable indicating when and at what price each ticket is sold, and as a second objective variable, how many tickets are sold at what time. Variables to represent, etc. can be mentioned. In addition, examples of external information include seasons and events to be held.
第5の適用例として、各駐車場の駐車料金の最適化を説明する。この適用例の場合も、売上高または利益を最大化することが目的であるため、目的関数は、売上高または利益を算出する関数で表される。目的変数として、例えば、時間帯および場所別の駐車料金が挙げられる。また、外部情報として、例えば、周辺の駐車上の駐車料金、ロケーション情報(住宅地、オフィス街、駅からの距離等)が挙げられる。 As a fifth application example, optimization of the parking fee of each parking lot will be described. In this application example as well, the purpose is to maximize sales or profits, so the objective function is represented by a function that calculates sales or profits. Objective variables include, for example, parking fees by time of day and location. In addition, as external information, for example, parking charges for parking in the vicinity and location information (residential area, office district, distance from a station, etc.) can be mentioned.
なお、本発明によるサービスは、SaaS(Software as a Service)形式で提供され得る。 The service according to the present invention may be provided in the form of SaaS (Software as a Service).
図7は、本発明の実施形態に係るコンピュータの構成例を示す概略ブロック図である。コンピュータ1000は、CPU1001と、主記憶装置1002と、補助記憶装置1003と、インタフェース1004と、ディスプレイ装置1005と、入力デバイス1006とを備える。 FIG. 7 is a schematic block diagram showing a configuration example of a computer according to an embodiment of the present invention. The
本発明の情報処理システムは、コンピュータ1000に実装される。本発明の情報処理システムの動作は、プログラム(情報処理用プログラム)の形式で補助記憶装置1003に記憶されている。CPU1001は、プログラムを補助記憶装置1003から読み出して主記憶装置1002に展開し、そのプログラムに従って、上記の処理を実行する。 The information processing system of the present invention is implemented in the
補助記憶装置1003は、一時的でない有形の媒体の一例である。一時的でない有形の媒体の他の例として、インタフェース1004を介して接続される磁気ディスク、光磁気ディスク、CD−ROM、DVD−ROM、半導体メモリ等が挙げられる。また、このプログラムが通信回線によってコンピュータ1000に配信される場合、配信を受けたコンピュータ1000がそのプログラムを主記憶装置1002に展開し、上記の処理を実行してもよい。
また、プログラムは、前述の処理の一部を実現するためのものであってもよい。さらに、プログラムは、補助記憶装置1003に既に記憶されている他のプログラムとの組み合わせで前述の処理を実現する差分プログラムであってもよい。 Further, the program may be for realizing a part of the above-mentioned processing. Further, the program may be a difference program that realizes the above-mentioned processing in combination with another program already stored in the
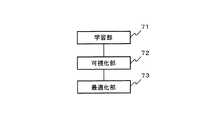
次に、本発明の概要について説明する。図8は、本発明の情報処理システムの概要を示すブロック図である。本発明の情報処理システムは、学習部71と、可視化部72と、最適化部73とを備える。 Next, the outline of the present invention will be described. FIG. 8 is a block diagram showing an outline of the information processing system of the present invention. The information processing system of the present invention includes a
学習部71(例えば、学習部3)は、被説明変数および説明変数に基づいて、被説明変数と説明変数との間の関係を示し説明変数の関数で表される予測モデルを学習する。 The learning unit 71 (for example, the learning unit 3) learns a prediction model that shows the relationship between the explained variable and the explanatory variable and is represented by a function of the explanatory variable based on the explained variable and the explanatory variable.
可視化部72(例えば、表示制御部4)は、その予測モデルを可視化する。 The visualization unit 72 (for example, the display control unit 4) visualizes the prediction model.
最適化部73(例えば、最適化部10)は、ユーザからの操作を受け付けたことに応じて、可視化部72によって可視化された予測モデルを引数とする目的関数について、制約条件のもとで当該目的関数を最適化する目的変数を算出する。 The optimization unit 73 (for example, the optimization unit 10) measures the objective function with the prediction model visualized by the
そのような構成によって、数理最適化で観測されない入力データが存在する状況であっても、適切に最適化を行うことができる。 With such a configuration, even in a situation where there is input data that is not observed by mathematical optimization, optimization can be appropriately performed.
また、学習部71が、被説明変数毎に、複数種類の学習アルゴリズムを用いて複数種類の予測モデルを学習し、可視化部72が、被説明変数毎に、その複数種類の予測モデルを可視化し、ユーザによる予測モデルの選択を受け付け、最適化部73が、ユーザによって被説明変数毎に選択された予測モデルを引数とする目的関数について、制約条件のもとで当該目的関数を最適化する目的変数を算出してもよい。 Further, the
また、可視化部72が、過去の被説明変数の値および説明変数の値を含むテストデータを用いて、予測モデル毎に被説明変数の値を算出し、当該被説明変数の値と過去の被説明変数の値との差を可視化してもよい。 In addition, the
また、可視化部72が、可視化した予測モデルに対するユーザの編集操作を受け付けてもよい。 Further, the
また、学習部71が、予測モデルの学習を指示する操作をユーザから受け付けたことに応じて、予測モデルを学習してもよい。 Further, the
以上、実施形態を参照して本願発明を説明したが、本願発明は、上記の実施形態に限定されるものではない。本願発明の構成や詳細には、本願発明のスコープ内で当業者が理解し得る様々な変更をすることができる。 Although the present invention has been described above with reference to the embodiments, the present invention is not limited to the above embodiments. Various changes that can be understood by those skilled in the art can be made within the scope of the present invention in terms of the structure and details of the present invention.
この出願は、2015年11月30日に出願された米国仮出願62/260,764を基礎とする優先権を主張し、その開示の全てをここに取り込む。 This application claims priority on the basis of US provisional application 62 / 260,764 filed on November 30, 2015, and incorporates all of its disclosures herein.
本発明は、学習された予測モデルに基づいて最適化を行う情報処理システムに好適に適用される。 The present invention is suitably applied to an information processing system that performs optimization based on a learned prediction model.
1 情報処理システム
2 訓練データ記憶部
3 学習部
4 表示制御部
5 ディスプレイ装置
6 記憶部
7 外的情報入力部
8 問題記憶部
9 目的関数生成部
10 最適化部1
Claims (7)
Translated fromJapanese前記予測モデルを可視化する可視化部と、
ユーザからの操作を受け付けたことに応じて、前記可視化部によって可視化された前記予測モデルを引数とする目的関数について、制約条件のもとで当該目的関数を最適化する目的変数を算出する最適化部とを備え、
前記予測モデルにおいて、前記個々の説明変数の一部は、前記目的変数である
ことを特徴とする情報処理システム。It is a prediction model that shows the relationship between the explained variable and the explanatory variable based on the explained variable and the explanatory variable and is represented by a function ofthe explanatory variable, and the explained variable is an individual explanatory variable. A learning unit that learns aprediction model represented by individual coefficients corresponding to the individual explanatory variables, and
A visualization unit that visualizes the prediction model,
Optimization to calculate the objective variable that optimizes the objective function under the constraint condition for the objective function that takes the prediction model visualized by the visualization unit as an argument in response to the reception of the operation from the user. and apart,
An information processing system characterized in that,in the prediction model, a part of the individual explanatory variables is the objective variable .
可視化部は、被説明変数毎に、前記複数種類の予測モデルを可視化し、ユーザによる予測モデルの選択を受け付け、
最適化部は、前記ユーザによって被説明変数毎に選択された予測モデルを引数とする目的関数について、制約条件のもとで当該目的関数を最適化する目的変数を算出する
請求項1に記載の情報処理システム。The learning unit learns multiple types of prediction models using multiple types of learning algorithms for each explained variable.
The visualization unit visualizes the plurality of types of prediction models for each explained variable, and accepts the user's selection of the prediction model.
The optimization unit according to claim 1, wherein the optimization unit calculates an objective variable that optimizes the objective function under constraints for an objective function that takes a prediction model selected for each explained variable by the user as an argument. Information processing system.
請求項1または請求項2に記載の情報処理システム。The visualization unit calculates the value of the explained variable for each prediction model using the test data including the past value of the explained variable and the value of the explanatory variable, and the value of the explained variable and the past explained variable. The information processing system according to claim 1 or 2, which visualizes the difference from the value of.
請求項1から請求項3のうちのいずれか1項に記載の情報処理システム。The information processing system according to any one of claims 1 to 3, wherein the visualization unit accepts a user's editing operation on the visualized prediction model.
請求項1から請求項4のうちのいずれか1項に記載の情報処理システム。The information processing system according to any one of claims 1 to 4, wherein the learning unit learns the prediction model in response to receiving an operation instructing learning of the prediction model from the user.
前記予測モデルを可視化し、
ユーザからの操作を受け付けたことに応じて、可視化された前記予測モデルを引数とする目的関数について、制約条件のもとで当該目的関数を最適化する目的変数を算出し、
前記予測モデルにおいて、前記個々の説明変数の一部は、前記目的変数である
ことを特徴とする情報処理方法。It is a prediction model that shows the relationship between the explained variable and the explanatory variable based on the explained variable and the explanatory variable and is represented by a function ofthe explanatory variable, and the explained variable is an individual explanatory variable. Learna prediction model represented by the individual coefficients corresponding to the individual explanatory variables .
Visualize the prediction model
In response to the reception of the operation from the user, for the objective function that takes the visualized prediction model as an argument, the objective variable that optimizes the objective function is calculated under the constraint conditions.
An information processing method characterized in that,in the prediction model, a part of the individual explanatory variables is the objective variable .
被説明変数および説明変数に基づいて、前記被説明変数と前記説明変数との間の関係を示し前記説明変数の関数で表される予測モデルであって、前記被説明変数が個々の説明変数と前記個々の説明変数に対応する個々の係数とで表される予測モデルを学習する学習処理、
前記予測モデルを可視化する可視化処理、および、
ユーザからの操作を受け付けたことに応じて、前記可視化処理で可視化された前記予測モデルを引数とする目的関数について、制約条件のもとで当該目的関数を最適化する目的変数を算出する最適化処理
を実行させ、
前記予測モデルにおいて、前記個々の説明変数の一部は、前記目的変数である
情報処理用プログラム。On the computer
It is a prediction model that shows the relationship between the explained variable and the explanatory variable based on the explained variable and the explanatory variable and is represented by a function ofthe explanatory variable, and the explained variable is an individual explanatory variable. A learning process that learns aprediction model represented by the individual coefficients corresponding to the individual explanatory variables .
Visualization processing to visualize the prediction model, and
Optimization to calculate the objective variable that optimizes the objective function under the constraint condition for the objective function that takes the prediction model visualized by the visualization process as an argument in response to the reception of the operation from the user. Letthe process run
In the prediction model, some of the individual explanatory variables are the objective variables.
Information processing program.
Applications Claiming Priority (3)
| Application Number | Priority Date | Filing Date | Title |
|---|---|---|---|
| US201562260764P | 2015-11-30 | 2015-11-30 | |
| US62/260,764 | 2015-11-30 | ||
| PCT/JP2016/003927WO2017094207A1 (en) | 2015-11-30 | 2016-08-29 | Information processing system, information processing method, and information processing program |
Publications (2)
| Publication Number | Publication Date |
|---|---|
| JPWO2017094207A1 JPWO2017094207A1 (en) | 2018-09-13 |
| JP6819607B2true JP6819607B2 (en) | 2021-01-27 |
Family
ID=58796613
Family Applications (1)
| Application Number | Title | Priority Date | Filing Date |
|---|---|---|---|
| JP2017553600AActiveJP6819607B2 (en) | 2015-11-30 | 2016-08-29 | Information processing system, information processing method and information processing program |
Country Status (3)
| Country | Link |
|---|---|
| US (1) | US20180336476A1 (en) |
| JP (1) | JP6819607B2 (en) |
| WO (1) | WO2017094207A1 (en) |
Families Citing this family (20)
| Publication number | Priority date | Publication date | Assignee | Title |
|---|---|---|---|---|
| JP6607885B2 (en)* | 2017-07-10 | 2019-11-20 | 株式会社三菱総合研究所 | Information processing apparatus and information processing method |
| US11586951B2 (en) | 2017-11-02 | 2023-02-21 | Nec Corporation | Evaluation system, evaluation method, and evaluation program for evaluating a result of optimization based on prediction |
| JP7044153B2 (en)* | 2018-03-30 | 2022-03-30 | 日本電気株式会社 | Evaluation system, evaluation method and evaluation program |
| US12253494B2 (en)* | 2018-12-05 | 2025-03-18 | Revorn Co., Ltd. | Information processing apparatus, information processing method, learned model generation method, and program |
| EP3903510B1 (en) | 2018-12-24 | 2025-04-09 | DTS, Inc. | Room acoustics simulation using deep learning image analysis |
| JP7163975B2 (en)* | 2019-01-10 | 2022-11-01 | 日本電気株式会社 | Attribute Generating Device, Attribute Generating Method and Attribute Generating Program |
| JP7263020B2 (en)* | 2019-01-16 | 2023-04-24 | 株式会社東芝 | Treated water quality estimation device, treated water quality estimation method and program |
| WO2020157913A1 (en)* | 2019-01-31 | 2020-08-06 | 日本電気株式会社 | Scheduling device, scheduling method and recording medium |
| JP7310171B2 (en)* | 2019-02-28 | 2023-07-19 | 富士通株式会社 | Distribution method, extraction method, distribution program, extraction program, distribution device and extraction device |
| JP6686208B1 (en)* | 2019-04-19 | 2020-04-22 | ヤフー株式会社 | Information processing device, information processing method, and program |
| JP7215324B2 (en)* | 2019-05-17 | 2023-01-31 | 富士通株式会社 | Prediction program, prediction method and prediction device |
| JP7371690B2 (en)* | 2019-08-22 | 2023-10-31 | 日本電気株式会社 | Analysis system, device, control method, and program |
| WO2021038801A1 (en)* | 2019-08-29 | 2021-03-04 | 富士通株式会社 | Pattern extraction program, device, and method |
| JP7012696B2 (en)* | 2019-10-21 | 2022-01-28 | 株式会社三菱総合研究所 | Information processing equipment and information processing method |
| US20220400312A1 (en)* | 2019-11-18 | 2022-12-15 | Nec Corporation | Optimization device, optimization method, and recording medium |
| JP2021144511A (en)* | 2020-03-12 | 2021-09-24 | 株式会社グルーヴノーツ | Information processing device, information processing method and information processing program |
| JP7456273B2 (en)* | 2020-05-11 | 2024-03-27 | Tdk株式会社 | Data analysis system, data analysis method, and data analysis program |
| JP6963062B1 (en)* | 2020-06-22 | 2021-11-05 | 株式会社Yamato | Information processing device and information processing method |
| CN112700011B (en)* | 2020-12-31 | 2024-05-31 | 第四范式(北京)技术有限公司 | Agent decision information display method and device, electronic equipment and storage medium |
| JP2024118777A (en) | 2023-02-21 | 2024-09-02 | オムロン株式会社 | Information processing device, information processing method, and information processing program |
Family Cites Families (3)
| Publication number | Priority date | Publication date | Assignee | Title |
|---|---|---|---|---|
| JP3994910B2 (en)* | 2003-05-08 | 2007-10-24 | 株式会社日立製作所 | Electricity trading support system |
| JP2014180187A (en)* | 2013-03-15 | 2014-09-25 | Toshiba Corp | Power demand prediction device, method and program and demand suppression scheduling device |
| JP6307926B2 (en)* | 2014-02-24 | 2018-04-11 | 富士通株式会社 | Order quantity determination method, order quantity determination device, and order quantity determination program |
- 2016
- 2016-08-29WOPCT/JP2016/003927patent/WO2017094207A1/ennot_activeCeased
- 2016-08-29USUS15/778,690patent/US20180336476A1/ennot_activeAbandoned
- 2016-08-29JPJP2017553600Apatent/JP6819607B2/enactiveActive
Also Published As
| Publication number | Publication date |
|---|---|
| US20180336476A1 (en) | 2018-11-22 |
| JPWO2017094207A1 (en) | 2018-09-13 |
| WO2017094207A1 (en) | 2017-06-08 |
Similar Documents
| Publication | Publication Date | Title |
|---|---|---|
| JP6819607B2 (en) | Information processing system, information processing method and information processing program | |
| Oluyisola et al. | Designing and developing smart production planning and control systems in the industry 4.0 era: a methodology and case study | |
| US12354045B2 (en) | Orchestrated intelligent supply chain optimizer | |
| JP6856023B2 (en) | Optimization system, optimization method and optimization program | |
| Min et al. | Supply chain modeling: past, present and future | |
| Hansen et al. | Modelling ramp-up curves to reflect learning: improving capacity planning in secondary pharmaceutical production | |
| US11244271B2 (en) | Method of making changes to product mixes on boundary constrained shelves by determining optimal business metrics from a product mix constrained by at least physical shelf space and at least one business rule | |
| WO2017056367A1 (en) | Information processing system, information processing method, and information processing program | |
| US11068919B2 (en) | Method of making changes to product mixes placed on boundary constrained shelves by determining the cost of implementing a pricing strategy formed by changeable business rules | |
| Sana | Optimal production lot size and reorder point of a two-stage supply chain while random demand is sensitive with sales teams' initiatives | |
| US20130290072A1 (en) | Automated Planning, Value Calculation And Decision Optimization System And Method | |
| Higle et al. | Production planning under supply and demand uncertainty: A stochastic programming approach | |
| Tsai | The impact of cost structure on supply chain cash flow risk | |
| KR20160146756A (en) | Real time interactive prediction | |
| JP6791151B2 (en) | Optimization system, optimization method and optimization program | |
| Yellanki | Enhancing Retail Operational Efficiency through Intelligent Inventory Planning and Customer Flow Optimization: A Data-Centric Approach | |
| Afshar et al. | Fuzzy multi-objective optimization of finance-based scheduling for construction projects with uncertainties in cost | |
| Debnath et al. | Artificial intelligence based supply chain management strategy during COVID-19 situation | |
| Basavaraju et al. | Developing a demand planning strategy for joint forecasting and employing analytical tool in an empirical case study | |
| Miltenburg et al. | Order quantities for style goods with two order opportunities and Bayesian updating of demand. Part II: capacity constraints | |
| JP2023086075A (en) | Information processing system, information processing method, and information processing program | |
| CN103020724B (en) | Automatically planning and optimized choice system and method | |
| JP6424568B2 (en) | Order quantity determination program, order quantity determination method and order quantity determination apparatus | |
| JP2021039542A (en) | Information processing method and information processing equipment | |
| Alfares | Production and inventory planning with variable holding cost and all-units quantity discounts |
Legal Events
| Date | Code | Title | Description |
|---|---|---|---|
| A621 | Written request for application examination | Free format text:JAPANESE INTERMEDIATE CODE: A621 Effective date:20190704 | |
| A131 | Notification of reasons for refusal | Free format text:JAPANESE INTERMEDIATE CODE: A131 Effective date:20200519 | |
| A521 | Request for written amendment filed | Free format text:JAPANESE INTERMEDIATE CODE: A523 Effective date:20200630 | |
| TRDD | Decision of grant or rejection written | ||
| A01 | Written decision to grant a patent or to grant a registration (utility model) | Free format text:JAPANESE INTERMEDIATE CODE: A01 Effective date:20201201 | |
| A61 | First payment of annual fees (during grant procedure) | Free format text:JAPANESE INTERMEDIATE CODE: A61 Effective date:20201214 | |
| R150 | Certificate of patent or registration of utility model | Ref document number:6819607 Country of ref document:JP Free format text:JAPANESE INTERMEDIATE CODE: R150 |