JP6208526B2 - Biological information display device and biological information display program - Google Patents
Biological information display device and biological information display programDownload PDFInfo
- Publication number
- JP6208526B2 JP6208526B2JP2013214509AJP2013214509AJP6208526B2JP 6208526 B2JP6208526 B2JP 6208526B2JP 2013214509 AJP2013214509 AJP 2013214509AJP 2013214509 AJP2013214509 AJP 2013214509AJP 6208526 B2JP6208526 B2JP 6208526B2
- Authority
- JP
- Japan
- Prior art keywords
- biological information
- information display
- parameter
- parameters
- biological
- Prior art date
- Legal status (The legal status is an assumption and is not a legal conclusion. Google has not performed a legal analysis and makes no representation as to the accuracy of the status listed.)
- Expired - Fee Related
Links
Images


Classifications
- G—PHYSICS
- G06—COMPUTING OR CALCULATING; COUNTING
- G06T—IMAGE DATA PROCESSING OR GENERATION, IN GENERAL
- G06T11/00—2D [Two Dimensional] image generation
- G06T11/20—Drawing from basic elements, e.g. lines or circles
- G06T11/206—Drawing of charts or graphs
- A—HUMAN NECESSITIES
- A61—MEDICAL OR VETERINARY SCIENCE; HYGIENE
- A61B—DIAGNOSIS; SURGERY; IDENTIFICATION
- A61B5/00—Measuring for diagnostic purposes; Identification of persons
- A61B5/74—Details of notification to user or communication with user or patient; User input means
- A61B5/742—Details of notification to user or communication with user or patient; User input means using visual displays
- A—HUMAN NECESSITIES
- A61—MEDICAL OR VETERINARY SCIENCE; HYGIENE
- A61B—DIAGNOSIS; SURGERY; IDENTIFICATION
- A61B5/00—Measuring for diagnostic purposes; Identification of persons
- A61B5/02—Detecting, measuring or recording for evaluating the cardiovascular system, e.g. pulse, heart rate, blood pressure or blood flow
- A61B5/02007—Evaluating blood vessel condition, e.g. elasticity, compliance
- G—PHYSICS
- G06—COMPUTING OR CALCULATING; COUNTING
- G06T—IMAGE DATA PROCESSING OR GENERATION, IN GENERAL
- G06T11/00—2D [Two Dimensional] image generation
- G06T11/60—Editing figures and text; Combining figures or text
- G—PHYSICS
- G06—COMPUTING OR CALCULATING; COUNTING
- G06T—IMAGE DATA PROCESSING OR GENERATION, IN GENERAL
- G06T7/00—Image analysis
- G06T7/0002—Inspection of images, e.g. flaw detection
- G06T7/0012—Biomedical image inspection
Landscapes
- Health & Medical Sciences (AREA)
- Engineering & Computer Science (AREA)
- Life Sciences & Earth Sciences (AREA)
- Physics & Mathematics (AREA)
- Medical Informatics (AREA)
- General Health & Medical Sciences (AREA)
- Theoretical Computer Science (AREA)
- General Physics & Mathematics (AREA)
- Biomedical Technology (AREA)
- Molecular Biology (AREA)
- Surgery (AREA)
- Animal Behavior & Ethology (AREA)
- Heart & Thoracic Surgery (AREA)
- Public Health (AREA)
- Veterinary Medicine (AREA)
- Pathology (AREA)
- Biophysics (AREA)
- Vascular Medicine (AREA)
- Cardiology (AREA)
- Physiology (AREA)
- Radiology & Medical Imaging (AREA)
- Quality & Reliability (AREA)
- Computer Vision & Pattern Recognition (AREA)
- Nuclear Medicine, Radiotherapy & Molecular Imaging (AREA)
- Measuring Pulse, Heart Rate, Blood Pressure Or Blood Flow (AREA)
Description
Translated fromJapanese本発明は、動脈の状態及び/または心機能に関する複数のパラメータの計測値を適切に表示する生体情報表示装置及び生体情報表示用プログラムに関する。 The present invention relates to a biological information display device and a biological information display program that appropriately display measurement values of a plurality of parameters related to an artery state and / or cardiac function.
従来、動脈の状態として、動脈の伸展性及び血流障害の程度を示す計測値のパラメータとして、ABI、%MAP、UT、平均血圧、脈圧、Stiffness Parameter β、API、AVI、AI、TBI、PWVなどがあり、血管疾患の診断に用いられている。また、心機能の程度を示す計測値のパラメータとしては、EF、SV、CO、%FS、mVef、TMF、Vp、Ea、Tei indexなどが用いられている。 Conventionally, as a condition of an artery, as a parameter of a measurement value indicating the degree of arterial extensibility and blood flow disorder, ABI,% MAP, UT, mean blood pressure, pulse pressure, stiffness parameter β, API, AVI, AI, TBI, PWV and the like are used for diagnosis of vascular diseases. In addition, EF, SV, CO,% FS, mVef, TMF, Vp, Ea, Tei index, and the like are used as measured value parameters indicating the degree of cardiac function.
上記パラメータの計測値は、一つの計測値のみを表示することが行われている。また、上記パラメータの計測値は個別に診断に用いられている。このような取り扱いでは、動脈の伸展性/血流障害、心機能の異常においては、生体における発症箇所やその程度により計測値に偏りが発生することが多く、適切に診断を行うことができない。 As the measured value of the parameter, only one measured value is displayed. The measured values of the parameters are individually used for diagnosis. In such handling, in the case of arterial extensibility / blood flow disorder and abnormal cardiac function, there are many cases in which the measured values are biased depending on the location of the onset in the living body and the extent thereof, and appropriate diagnosis cannot be performed.
原点から右上、左上、右下、左下に延びる線分上に四肢で測定した血圧をプロットし、生体部位と測定値とを直観的に捕らえられることができるようにした生体情報レポートが知られている(特許文献1参照)。 A biological information report that plots the blood pressure measured by the extremities on the line segment extending from the origin to the upper right, upper left, lower right, and lower left so that the body part and the measured value can be captured intuitively is known. (See Patent Document 1).
上記生体情報レポートはPWVなどの測定値についても合わせて表示しても良いとされている。しかし、基本的には血圧が測定されるだけであり、多種のパラメータを同時に比較できるものとはなっていない。 The biometric information report may also be displayed for measurement values such as PWV. However, basically only blood pressure is measured, and various parameters cannot be compared simultaneously.
本発明は上記のような従来の生体情報表示装置の現状に鑑みてなされたもので、その目的は、多種のパラメータの計測値を適切に表示し、一つのパラメータによっては偏りが多い計測を補完し、的確な診察を可能とする生体情報表示装置及びプログラムを提供することである。 The present invention has been made in view of the current state of the conventional biological information display device as described above, and its purpose is to appropriately display measurement values of various parameters, and to complement measurement with a large amount of bias depending on one parameter. It is another object of the present invention to provide a biological information display device and a program that enable accurate diagnosis.
本発明に係る生体情報表示装置は、複数の生体信号を取得するための取得手段から得られた生体信号に基づきパラメータの計測値を算出する演算手段と、情報を表示するための表示部と、動脈の硬化に関する硬化パラメータと動脈の狭窄/閉塞に関する狭窄/閉塞パラメータの異なるレーダチャートを作成すると共に、前記パラメータの計測値をレーダチャート上に、中心から放射状に延びる異なるそれぞれの線分上に臨床上の値が悪くなるに連れて中心から遠方の位置にプロットして、前記異なるレーダチャートを前記表示部の同一画面または異なる画面に表示する表示制御手段とを具備する。A biological information display device according to the present invention includes a calculation unit that calculates a measured value of a parameter based on a biological signal obtained from an acquisition unit for acquiring a plurality of biological signals, a display unit for displaying information, Create radar charts with different stiffness parameters for arterial stiffness and stenosis / occlusion parameters for arterial stenosis / occlusion, and measure the measured values of the parameters on the radar chart and on different line segments extending radially from the center. Display control means for plotting at a position farther from the center as the above value gets worseand displaying thedifferent radar charts onthe same screen or different screens of the display unit.
本発明に係る生体情報表示装置では、表示制御手段は、各パラメータにおける正常範囲が対応するそれぞれの線分上において、等距離となるようにスケール調整して表示する。 In the biological information display device according to the present invention, the display control means performs scale adjustment so that the normal ranges in the respective parameters correspond to the corresponding line segments so as to be equidistant.
本発明に係る生体情報表示装置では、表示制御手段は、各パラメータにおいて、少なくとも正常範囲と異常範囲とに範囲分けし、範囲毎に色またはテクスチャを変えて表示する。 In the biological information display device according to the present invention, the display control means divides each parameter into at least a normal range and an abnormal range, and displays the color or texture for each range.
本発明に係る生体情報表示装置では、パラメータを指示入力する入力手段を備え、表示制御手段は、前記入力手段により指示入力されたパラメータについてのみレーダチャートに表示する。 The biological information display apparatus according to the present invention includes input means for inputting and inputting parameters, and the display control means displays only the parameters input and input by the input means on the radar chart.
本発明に係る生体情報表示装置では、表示制御手段は、レーダチャートに重ねて生体図を表示し、パラメータの測定部位に対応する前記表示した生体図の位置に当該パラメータの線分を表示する。 In the biological information display device according to the present invention, the display control means displays a biological chart superimposed on the radar chart, and displays a line segment of the parameter at the position of the displayed biological chart corresponding to the measurement site of the parameter.
本発明に係る生体情報表示装置では、表示制御手段は、レーダチャートにおける線分上のプロット点を結ぶ線分を表示する。 In the biological information display device according to the present invention, the display control means displays a line segment connecting plot points on the line segment in the radar chart.
本発明に係る生体情報表示用プログラムは、生体情報表示装置に備えられるコンピュータを、生体に関する動脈の硬化に関する硬化パラメータと動脈の狭窄/閉塞に関する狭窄/閉塞パラメータの異なるレーダチャートを作成する作成手段、前記パラメータの計測値を前記レーダチャート上に、中心から放射状に延びる異なるそれぞれの線分上に臨床上の値が悪くなるに連れて中心から遠方の位置にプロットして、前記異なるレーダチャートを表示部の同一画面または異なる画面に表示する表示制御手段として機能させる。The biological information display program according to the present invention is a computer that is provided in the biological information display device. The measured values of the parameters are plotted on the radar chart on different line segments extending radially from the center, and thedifferent radar charts are displayed by plotting them at positions far from the center as clinical values deteriorate. Function as display control means for displayingon the same screen or different screens .
本発明に係る生体情報表示用プログラムでは、複数のパラメータの計測値は、複数の生体信号を取得するための取得手段から得られた生体信号に基づき、算出して得たものである。 In the biological information display program according to the present invention, the measured values of the plurality of parameters are obtained by calculation based on the biological signal obtained from the acquisition means for acquiring the plurality of biological signals.
本発明に係る生体情報表示用プログラムでは、表示制御手段は、各パラメータにおける正常範囲が対応するそれぞれの線分上において、等距離となるようにスケール調整して表示する。 In the biological information display program according to the present invention, the display control means performs scale adjustment so that the normal range in each parameter corresponds to each line segment corresponding to each parameter and displays it.
本発明に係る生体情報表示用プログラムでは、表示制御手段は、各パラメータに対して、少なくとも正常範囲と異常範囲とに範囲分けし、範囲毎に色またはテクスチャを変えて表示する。 In the biological information display program according to the present invention, the display control means divides each parameter into at least a normal range and an abnormal range, and displays the color or texture for each range.
本発明に係る生体情報表示用プログラムでは、表示制御手段は、生体情報表示装置に備えられたパラメータを指示入力する入力手段により指示入力されたパラメータについてのみレーダチャートに表示する。 In the biological information display program according to the present invention, the display control means displays on the radar chart only the parameters instructed and inputted by the input means for instructing and inputting parameters provided in the biological information display device.
本発明に係る生体情報表示用プログラムでは、表示制御手段は、レーダチャートに重ねて生体図を表示し、パラメータの測定部位に対応する前記表示した生体図の位置に当該パラメータの線分を表示する。 In the biological information display program according to the present invention, the display control means displays a biological diagram superimposed on the radar chart, and displays a line segment of the parameter at the position of the displayed biological diagram corresponding to the measurement site of the parameter. .
本発明に係る生体情報表示用プログラムでは、表示制御手段は、レーダチャートにおける線分上のプロット点を結ぶ線分を表示する。 In the biological information display program according to the present invention, the display control means displays a line segment connecting plot points on the line segment in the radar chart.
本発明によれば、パラメータの計測値を、中心から放射状に延びる異なるそれぞれの線分上において、臨床上の値が悪くなるに連れて中心から遠方の位置にプロットしたレーダチャートとして表示部に表示するので、一つのパラメータによっては偏りが多い計測を補完し、的確な診察が可能となる。また、本発明によれば、レーダチャートに重ねて生体図を表示し、パラメータの測定部位に対応する前記表示した生体図の位置に当該パラメータの線分を表示するので、複数のパラメータの計測値が測定部位に対応するように表示されており、動脈状態・心機能について直観的に生体位置との関係において診断が可能になる。 According to the present invention, the measured values of the parameters are displayed on the display unit as radar charts plotted at positions far from the center as the clinical values become worse on different line segments extending radially from the center. Therefore, depending on one parameter, the measurement with a large amount of bias is complemented, and an accurate diagnosis becomes possible. In addition, according to the present invention, the biological chart is displayed over the radar chart, and the line segment of the parameter is displayed at the position of the displayed biological chart corresponding to the measurement site of the parameter. Are displayed so as to correspond to the measurement site, and the arterial state and cardiac function can be intuitively diagnosed in relation to the living body position.
以下添付図面を参照して本発明に係る生体情報表示装置及び生体情報表示用プログラムの実施形態を説明する。各図において同一の構成要素には、同一の符号を付して重複する説明を省略する。図1に、本発明に係る生体情報表示装置における一実施形態の構成図を示す。この装置においては、動脈の状態及び/または心機能に関するパラメータの計測値を得るためのセンサ、つまり生体信号の取得を行う取得手段としてのセンサを具備する。センサとして、右上腕カフ11、左上腕カフ21、右下肢カフ31、左下肢カフ41、右手心電図電極51、左手心電図電極52、アース用心電図電極53、心音マイクロフォン61が設けられている。センサは一例であり、これより多くても良く、また、これより少なくても良い。更に本実施形態とは異なる生体信号を取得できるセンサを設けても良い。図1には、生体信号の取得を行う取得手段としてデータ入力部67が備えられ、このデータ入力部67から心エコーの情報が入力され、該心エコーの情報は各波形・血圧記憶部70に記憶される。心エコーの情報を取得する取得手段としては、探触子であってもよい。 Embodiments of a biological information display device and a biological information display program according to the present invention will be described below with reference to the accompanying drawings. In the drawings, the same components are denoted by the same reference numerals and redundant description is omitted. In FIG. 1, the block diagram of one Embodiment in the biometric information display apparatus which concerns on this invention is shown. This apparatus includes a sensor for obtaining a measurement value of a parameter related to an arterial state and / or cardiac function, that is, a sensor as an acquisition unit that acquires a biological signal. As sensors, an upper right arm cuff 11, a left
右上腕カフ11には圧力検出部12が接続され、右上腕カフ11の圧力は圧力検出部12を介して圧力制御部15により制御される。左上腕カフ21には圧力検出部22が接続され、左上腕カフ21の圧力は圧力検出部22を介して圧力制御部25により制御される。右下肢カフ31には圧力検出部32が接続され、右下肢カフ31の圧力は圧力検出部32を介して圧力制御部35により制御される。左下肢カフ41には圧力検出部42が接続され、左下肢カフ41の圧力は圧力検出部42を介して圧力制御部45により制御される。圧力制御部15、25、35、45は、後述するコンピュータによる制御下においてカフの圧力制御を行うようにしても良い。 A
圧力検出部12には脈波検出部13が接続され、圧力検出部22には脈波検出部23が接続され、圧力検出部32には脈波検出部33が接続され、圧力検出部42には脈波検出部43が接続されている。 The
脈波検出部13には、脈波データを得るための脈波演算部14と血圧データを得るための血圧演算部16が接続され、脈波検出部23には、脈波データを得るための脈波演算部24と血圧データを得るための血圧演算部26が接続され、脈波検出部33には、脈波データを得るための脈波演算部34と血圧データを得るための血圧演算部36が接続され、脈波検出部43には、脈波データを得るための脈波演算部44と血圧データを得るための血圧演算部46が接続されている。 A pulse
右手心電図電極51、左手心電図電極52、アース用心電図電極53は心電位検出部54に接続され、心電位検出部54には得られた心電位信号に基づき心電図データを得るための心電図演算部55が接続されている。心音マイクロフォン61には心音検出部62が接続され、心音検出部62には心音信号に基づき心音図データを得るための心音図演算部63が接続されている。 The right-
脈波演算部14、24、34、44により得られた脈波データ、血圧演算部16、2636、46により得られた血圧データ、心電図演算部55により得られた心電図データ、心音図演算部63により得られた心音図データは、各波形・血圧記憶部70に記憶される。この各波形・血圧記憶部70には、各種パラメータ演算部80が接続されており、演算手段である各種パラメータ演算部80によって動脈の状態及び/または心機能に関する複数のパラメータについて計測値の演算が行われる。各種パラメータ演算部80は、既に示したパラメータの全てを演算して得ることができる。なお、各パラメータの計測値を求める手法は公知の手法を用いることができる。本実施形態においては、各種パラメータ演算部80が後述するレーダチャートなどに示されるパラメータを演算して得るものとして説明を行う。 Pulse wave data obtained by the pulse
各種パラメータ演算部80による演算結果は、全計測結果処理部90へ送られる。全計測結果処理部90は、各種パラメータ演算部80による演算結果を受け取る他に、各波形・血圧記憶部70からもデータを取り出すことができる。全計測結果処理部90は、各種パラメータ演算部80による演算結果や各波形・血圧記憶部70から取り出したデータを必要に応じて記憶部110へ記憶する。 The calculation results by the various
記憶部110には、この装置に使用されるパラメータが、動脈の硬化に関する硬化パラメータと、動脈の狭窄/閉塞に関する狭窄/閉塞パラメータに分けたパラメータ分類データベースが記憶されている。また、正常範囲と異常範囲の情報、各パラメータにおける正常範囲が対応するそれぞれの線分上において、等距離となるようにスケール調整するスケール情報なども記憶部110に記憶されている。 The
また、全計測結果処理部90には、表示部100と入力部120が接続されている。表示部100としては、画面に情報を表示するディスプレイの他、プリンタ等であっても良い。入力部120は、情報やコマンドを入力するキーボード(タッチパネルによるものを含む)の他、マウスなどのポインティングデバイスが備えられていても良い。全計測結果処理部90は、演算手段である各種パラメータ演算部80により算出された複数のパラメータの計測値を、中心から放射状に延びる異なるそれぞれの線分上において、臨床上の値が悪くなるに連れて中心から遠方の位置にプロットしたレーダチャートとして表示部100に表示する表示制御手段として機能する。例えば、ABI値については、正常値は1.0〜1.4、異常値は0.9以下、境界値は0.91〜0.99となる。よってABI値は値が小さくなると、臨床上の値が悪くなることを示している。例えば、%MAP値については、正常値は45%未満、異常値は45%以上となる。よって、%MAP値は値が大きくなると、臨床上の値が悪くなることを示している。 Further, the
上記入力部120は、パラメータを指示入力する入力手段として機能するものである。
全計測結果処理部90は表示制御手段として、入力手段である入力部120により指示入力されたパラメータについてのみレーダチャートに表示するように動作することができる。The
The total measurement
上記における脈波演算部14、24、34、44、血圧演算部16、26、36、46、心電図演算部55、心音図演算部63、各波形・血圧記憶部70、各種パラメータ演算部80、全計測結果処理部90、表示部100、記憶部110及び入力部120の部分は、コンピュータとして構成することができる。 Pulse
上記の生体情報表示装置は、図2に示されるようなフローチャートに対応するプログラムにより動作することができる。計測に先立って、被験者の予め決められた四肢などの所定部位に、右上腕カフ11、左上腕カフ21、右下肢カフ31、左下肢カフ41、右手心電図電極51、左手心電図電極52、アース用心電図電極53、心音マイクロフォン61を取り付ける。装置のオンオフスイッチなどを操作すると、動作が開始される。 The biological information display device can operate according to a program corresponding to a flowchart as shown in FIG. Prior to the measurement, the right upper arm cuff 11, the left
本発明では、動脈の硬化に関する硬化パラメータのレーダチャートと、動脈の狭窄/閉塞に関する狭窄/閉塞パラメータのレーダチャートに表示する。実施形態では、複数のパラメータを記憶部110のパラメータ分類データベースのデータに基づき、動脈の硬化に関する硬化パラメータと、動脈の狭窄/閉塞に関する狭窄/閉塞パラメータに分けて、異なるレーダチャートに表示する。これにより、硬化パラメータによる硬化系レーダチャートが表示され、動脈の伸展性に関する計測結果を集約させて観測することができ、動脈の硬化状態を容易に把握可能となる。また、狭窄/閉塞パラメータによる狭窄/閉塞系レーダチャートが表示され、狭窄や閉塞に伴う血流障害に関する計測結果を集約させて観測することができ、血流障害の状態把握を容易に行うことが可能となる。 In the present invention, it is displayed on the radar chart of the hardening parameter concerning the hardening of the artery and the radar chart of the stenosis / obstruction parameter concerning the stenosis / obstruction of the artery. In the embodiment, based on the data of the parameter classification database of the
そこで全計測結果処理部90(表示制御手段)は、硬化パラメータと狭窄/閉塞パラメータに分けたそれぞれにおいて、予め定めた或いは現時点で入力部120から指示入力されたパラメータの数n(整数)に基づき、正n角形のレーダチャートを決定する(S11)。次に、この正n角形の中心から各頂角へ到る線分上に対応するパラメータの計測値をプロットするとして、各パラメータにおける正常範囲が対応するそれぞれの線分上において、等距離となるようにスケール調整する(S12)。 Therefore, the total measurement result processing unit 90 (display control means) is based on the number n (integer) of parameters determined in advance or input from the
次に、各パラメータにおいて、少なくとも正常範囲と異常範囲とに範囲分けし、範囲毎に色及び/またはテクスチャを変えて表示するように画像を作成する(S13)。更に、各パラメータの計測値を、中心から放射状に延びる異なるそれぞれの線分上において、臨床上の値が悪くなるに連れて中心から遠方の位置にプロットし、レーダチャートにおける線分上のプロット点を結ぶ線分を表示する画像を作成する(S14)。更に、レーダチャートに重ねて生体図(実施例では、人体図)を表示し、パラメータの測定部位に対応する前記表示した人体図の位置に当該パラメータの線分を表示する画像を作成する(S15)。 Next, each parameter is divided into at least a normal range and an abnormal range, and an image is created so that the color and / or texture is changed for each range (S13). Furthermore, the measured values of each parameter are plotted at positions farther from the center as the clinical values worsen on different line segments extending radially from the center, and the plot points on the line segments in the radar chart An image displaying a line segment connecting the two is created (S14). Further, a biological chart (in the embodiment, a human figure) is displayed over the radar chart, and an image for displaying a line segment of the parameter at the position of the displayed human figure corresponding to the parameter measurement site is created (S15). ).
本実施形態では、前述の通り、動脈の硬化に関する硬化パラメータと、動脈の狭窄/閉塞に関する狭窄/閉塞パラメータに分けて、異なるレーダチャートに表示する。この異なるレーダチャートを同一画面または異なる2画面に切換表示することを選択できる。この選択は、入力部120から行うことができ、異なる2画面に表示することを選択した場合には、硬化レーダチャートと狭窄/閉塞系レーダチャートのいずれを表示させるかを入力部120から選択入力することができ、二つのレーダチャートを切り換え表示して目視することが可能である。即ち、ステップS15までに作成した画像を、一つの画面に表示するか、異なる2画面に分けて表示する(S16)。 In the present embodiment, as described above, the parameters are displayed on different radar charts by being divided into a hardening parameter related to arterial stiffness and a stenosis / occlusion parameter related to arterial stenosis / occlusion. This different radar chart can be selected to be switched and displayed on the same screen or two different screens. This selection can be made from the
なお、ステップS12からステップS15までの処理順は、上記の順に限定されるものではない。 Note that the processing order from step S12 to step S15 is not limited to the above order.
上記の処理においてパラメータとして、例えば、SBP|R−L|、MBP(RB、LB、RA、LA)、UT(RA、LA)、AVI(RB、LB、RA、LA)、PP(RB、LB、RA、LA)、%MAP(RB、LB、RA、LA)、ABI(R、L)が設定する。記憶部110のパラメータ分類データベースには、図3に示すようなデータが記憶されている。この図3において、コロンの右側に示した内容は記憶されていなくとも良い。但し、R、L、RB、LB、RA、LAについて、コロンの右側に示した内容は、レーダチャートにおいて、人体図のいずれの位置に対応させてパラメータの線分を表示するのかに関する位置情報とすることができる。 As parameters in the above processing, for example, SBP | RL |, MBP (RB, LB, RA, LA), UT (RA, LA), AVI (RB, LB, RA, LA), PP (RB, LB) , RA, LA),% MAP (RB, LB, RA, LA), and ABI (R, L) are set. Data as shown in FIG. 3 is stored in the parameter classification database of the
上記設定されたパラメータにおいて、図3のパラメータ分類データベースによれば、MBP、PP、AVIが硬化パラメータであり、SBP|R−L|、%MAP、UT、ABIが狭窄/閉塞パラメータであると判定できる。そこで、(MBP、PP、AVI)と(SBP|R−L|、%MAP、UT、ABI)に分ける。(MBP、PP、AVI)については、表示の位置情報から全体のパラメータ数は12であり、正12角形に表示と決定される。また、(SBP|R−L|、%MAP、UT、ABI)については、表示の位置情報から全体のパラメータ数は9であり、正9角形に表示と決定される。以上がステップS11において行われる。 Among the above set parameters, according to the parameter classification database of FIG. 3, it is determined that MBP, PP, and AVI are curing parameters, and SBP | R−L |,% MAP, UT, and ABI are stenosis / occlusion parameters. it can. Therefore, it is divided into (MBP, PP, AVI) and (SBP | RL-,% MAP, UT, ABI). For (MBP, PP, AVI), the total number of parameters is 12 from the display position information, and it is determined to be displayed in a regular dodecagon. For (SBP | R−L |,% MAP, UT, ABI), the total number of parameters is 9 based on the display position information, and the display is determined to be a regular hexagon. The above is performed in step S11.
次に、角形の中心から各頂角へ到る線分上に対応するパラメータの計測値をプロットするとして、各パラメータにおける正常範囲が対応するそれぞれの線分上において、等距離となるようにスケール調整する(S12)。更に、少なくとも正常範囲と異常範囲とに範囲分けし、範囲毎に色及び/またはテクスチャを変えて表示するように画像を作成し(S13)、各パラメータの計測値をプロットし、プロット点を結ぶ線分を表示する画像を作成する(S14)。これによって、硬化系レーダチャートの画像が図4に示すように作成され、狭窄/閉塞系レーダチャートの画像が図5に示すように作成される。正n角形の頂角の近傍には、位置情報とパラメータ名が図4、図5の如く付記表示される。 Next, plot the measured values of the parameters corresponding to the line segments from the center of the square to each vertex angle, and scale so that the normal range in each parameter is equidistant on each corresponding line segment. Adjust (S12). Further, the image is divided into at least a normal range and an abnormal range, and an image is created so that the color and / or texture is changed for each range (S13), the measured values of each parameter are plotted, and the plot points are connected. An image displaying a line segment is created (S14). As a result, an image of the curing radar chart is created as shown in FIG. 4, and an image of the stenosis / occlusion radar chart is created as shown in FIG. Position information and parameter names are added and displayed near the apex angle of the regular n-gon as shown in FIGS.
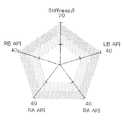
図6は、パラメータとして硬化パラメータであるStiffnessβ、API(RB、LB、RA、LA)が設定された場合の硬化系レーダチャートを示す図である。この例では、パラメータと位置情報とから全体のパラメータ数は5であり、正5角形に表示と決定される。なお、硬化パラメータであるStiffnessβの計測を行うためには、図1の実施例の構成に加えて、頸動脈の血管径を計測する超音波エコーセンサ、超音波送受信部、超音波制御処理部などが具備される。 FIG. 6 is a diagram showing a curing system radar chart when Stiffness β and API (RB, LB, RA, LA) that are curing parameters are set as parameters. In this example, the total number of parameters is 5 based on the parameters and position information, and display is determined to be a regular pentagon. In order to measure the stiffness parameter Stiffness β, in addition to the configuration of the embodiment of FIG. 1, an ultrasonic echo sensor, an ultrasonic transmission / reception unit, an ultrasonic control processing unit, etc. for measuring the diameter of the carotid artery Is provided.
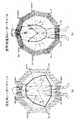
図4〜図6は、ステップS11からステップS14までの処理による画像である。これに対し、図7〜図9にステップS11からステップS16までの処理による画像を一画面に表示した例を示す。これら図7〜図9の例においては、硬化パラメータとして、MBP(RB、LB、RA、LA)、PP(RB、LB、RA、LA)が設定され、狭窄/閉塞パラメータとして、SBP|R−L|、%MAP(RB、LB、RA、LA)、UT(RA、LA)、ABI(R、L)が設定されたものである。この例では、硬化パラメータについてはパラメータと位置情報とから、全体のパラメータ数が8であり、正8角形に表示と決定される。また、狭窄/閉塞パラメータについてはパラメータと位置情報とから、全体のパラメータ数が9であり、正9角形に表示と決定される。 4 to 6 are images obtained by the processing from step S11 to step S14. On the other hand, FIGS. 7 to 9 show examples in which images by the processing from step S11 to step S16 are displayed on one screen. 7 to 9, MBP (RB, LB, RA, LA) and PP (RB, LB, RA, LA) are set as the curing parameters, and SBP | R− as the stenosis / occlusion parameters. L |,% MAP (RB, LB, RA, LA), UT (RA, LA), and ABI (R, L) are set. In this example, with respect to the curing parameters, the total number of parameters is 8 and is determined to be displayed as a regular octagon from the parameters and position information. As for the stenosis / occlusion parameter, the total number of parameters is 9 and is determined to be displayed as a regular hexagon from the parameters and the position information.
図7は、健常者のパラメータを表示したものである。図7(a)に示す硬化系レーダチャートと図7(b)に示す狭窄/閉塞系レーダチャートにおいて、各プロット点を結ぶ線分が正常範囲にあることが一見して明白に分かる。 FIG. 7 shows the parameters of a healthy person. In the hardening radar chart shown in FIG. 7A and the stenosis / occlusion radar chart shown in FIG. 7B, it can be clearly seen at a glance that the line segment connecting the plot points is in the normal range.
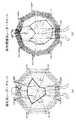
図8は、動脈硬化の兆候が認められる被験者のパラメータを表示したものである。図8(a)に示す硬化系レーダチャートにおいて各プロット点を結ぶ線分が正常範囲から著しく逸脱しており、硬化の問題があることが一見して明白に分かる。一方、図8(b)に示す狭窄/閉塞系レーダチャートにおいて、各プロット点を結ぶ線分が正常範囲にあることが一見して明白に分かる。 FIG. 8 shows the parameters of a subject who has signs of arteriosclerosis. In the curing radar chart shown in FIG. 8 (a), the line segment connecting the plot points deviates significantly from the normal range, and it can be clearly seen at a glance that there is a problem of curing. On the other hand, in the stenosis / occlusion radar chart shown in FIG. 8B, it can be clearly seen at a glance that the line segment connecting the plot points is in the normal range.
図9は、末梢動脈に狭窄疾患のある被験者のパラメータを表示したものである。図9(a)に示す硬化系レーダチャートにおいて各プロット点を結ぶ線分が正常範囲にあることが一見して明白に分かる。一方、図9(b)に示す狭窄/閉塞系レーダチャートにおいて、各プロット点を結ぶ線分が正常範囲から著しく逸脱しており、狭窄/閉塞の問題があることが一見して明白に分かる。 FIG. 9 shows the parameters of a subject who has a stenosis in the peripheral artery. It can be clearly seen at a glance that the line segment connecting the plotted points is in the normal range in the curing radar chart shown in FIG. On the other hand, in the stenosis / occlusion radar chart shown in FIG. 9B, the line segment connecting the plot points deviates significantly from the normal range, and it can be clearly seen at a glance that there is a problem of stenosis / occlusion.
以上の通り、本実施形態では、硬化系レーダチャートと狭窄/閉塞系レーダチャートにおいてそれぞれ正常範囲にあるか否かが一見して明白に分かり、適切な診断に役立つことが期待できる。 As described above, in the present embodiment, it can be clearly seen at a glance whether or not each of the curing radar chart and the stenosis / occlusion radar chart is in the normal range, and it can be expected to be useful for appropriate diagnosis.
なお、上記の実施形態では、生体情報表示装置がセンサを有し、このセンサにより得られた生体情報を用いてリアルタイムで処理を行ったが、これに限定されない。例えば、予め測定した生体情報用いて処理を行っても良い。また、他の装置などにより得られた生体情報を当該生体情報表示装置へ入力或いは転送などしてこの生体情報を処理するようにしても良い。 In the above embodiment, the biological information display apparatus has a sensor, and processing is performed in real time using the biological information obtained by the sensor. However, the present invention is not limited to this. For example, the processing may be performed using biological information measured in advance. Further, the biological information obtained by another device or the like may be processed by inputting or transferring the biological information to the biological information display device.
図7から図9の実施形態では、レーダチャートに人体図を重ねて表示したが、これに限定されない。人体図の代わりに、心臓図などの生体図を重ねて表示してもよい。 In the embodiment of FIGS. 7 to 9, the human body chart is displayed superimposed on the radar chart, but the present invention is not limited to this. Instead of a human body diagram, a biological diagram such as a heart diagram may be displayed in an overlapping manner.
図7から図9の実施形態では、硬化系レーダチャートと狭窄/閉塞系レーダチャートを並べて表示しているが、更に心機能に関するレーダチャートに心臓図を重ねた図を追加してもよい。 In the embodiment of FIGS. 7 to 9, the curing radar chart and the stenosis / occlusion radar chart are displayed side by side, but a figure in which a heart chart is superimposed on a radar chart related to cardiac function may be added.
11、21、31、41 カフ
12、22、32、42 圧力検出部
13、23、33、43 脈波検出部
14、24、34、44 脈波演算部
15、25、35、45 圧力制御部
51、52、53 心電図電極
54 心電位検出部
55 心電図演算部
61 心音マイクロフォン
62 心音検出部
63 心音図演算部
70 各波形・血圧記憶部
80 各種パラメータ演算部
90 計測結果処理部
100 表示部
110 記憶部
120 入力部11, 21, 31, 41
Claims (13)
Translated fromJapanese情報を表示するための表示部と、
動脈の硬化に関する硬化パラメータと動脈の狭窄/閉塞に関する狭窄/閉塞パラメータの異なるレーダチャートを作成すると共に、前記パラメータの計測値をレーダチャート上に、中心から放射状に延びる異なるそれぞれの線分上に臨床上の値が悪くなるに連れて中心から遠方の位置にプロットして、前記異なるレーダチャートを前記表示部の同一画面または異なる画面に表示する表示制御手段と
を具備する生体情報表示装置。A computing means for calculating a measured value of the parameter based on the biological signal obtained from the obtaining means for obtaining a plurality of biological signals;
A display for displaying information;
Create radar charts with different stiffness parameters for arterial stiffness and stenosis / occlusion parameters for arterial stenosis / occlusion, and measure the measured values of the parameters on the radar chart and on different line segments extending radially from the center. A biological information display device comprising: display control means for plotting at a position far from the center as the upper value becomes worseand displaying thedifferent radar charts onthe same screen or different screens of the display unit.
表示制御手段は、前記入力手段により指示入力されたパラメータについてのみレーダチャートに表示する請求項1乃至3のいずれか1項に記載の生体情報表示装置。An input means for indicating and inputting parameters is provided.
The biological information display apparatus according toclaim 1 , wherein the display control means displays only the parameter input by the input means on the radar chart.
生体に関する動脈の硬化に関する硬化パラメータと動脈の狭窄/閉塞に関する狭窄/閉塞パラメータの異なるレーダチャートを作成する作成手段、
前記パラメータの計測値を前記レーダチャート上に、中心から放射状に延びる異なるそれぞれの線分上に臨床上の値が悪くなるに連れて中心から遠方の位置にプロットして、前記異なるレーダチャートを表示部の同一画面または異なる画面に表示する表示制御手段
として機能させる生体情報表示用プログラム。A computer provided in the biological information display device,
Creating means for creating different radar charts of sclerosis parameters related to arterial stiffness related to living body and stenosis / occlusion parameters related to arterial stenosis / occlusion;
The measured values of the parameters are plotted on the radar chart on different line segments extending radially from the center, and thedifferent radar charts are displayed by plotting them at positions far from the center as clinical values deteriorate. A biological information display program that functions as a display control means for displayingon the same screen or different screens of a part.
各パラメータにおける正常範囲が対応するそれぞれの線分上において、等距離となるようにスケール調整して表示する請求項7乃至8のいずれか1項に記載の生体情報表示用プログラム。The display control means
The biological information display program accordingto any one of claims 7 to 8, wherein the program is displayed by adjusting a scale so as to be equidistant on each line segment corresponding to a normal range in each parameter.
各パラメータに対して、少なくとも正常範囲と異常範囲とに範囲分けし、範囲毎に色またはテクスチャを変えて表示する請求項7乃至9のいずれか1項に記載の生体情報表示用プログラム。The display control means
The biological information display program accordingto any one of claims 7 to 9, wherein each parameter is divided into at least a normal range and an abnormal range, and the color or texture is changed for each range and displayed.
生体情報表示装置に備えられたパラメータを指示入力する入力手段により指示入力されたパラメータについてのみレーダチャートに表示する請求項7乃至10のいずれか1項に記載の生体情報表示用プログラム。The display control means
The biological information display program accordingto any one of claims 7 to 10, wherein only a parameter that is instructed and input by an input means that inputs and inputs a parameter provided in the biological information display device is displayed on the radar chart.
レーダチャートに重ねて生体図を表示し、パラメータの測定部位に対応する前記表示した生体図の位置に当該パラメータの線分を表示する請求項7乃至11のいずれか1項に記載の生体情報表示用プログラム。The display control means
The biological information display accordingto any one of claims 7 to 11, wherein a biological chart is displayed over the radar chart, and a line segment of the parameter is displayed at a position of the displayed biological chart corresponding to a measurement site of the parameter. Program.
レーダチャートにおける線分上のプロット点を結ぶ線分を表示する請求項7乃至12のいずれか1項に記載の生体情報表示用プログラム。The display control means
The biological information display program accordingto any one of claims 7 to 12, wherein a line segment connecting plot points on the line segment in the radar chart is displayed.
Priority Applications (4)
| Application Number | Priority Date | Filing Date | Title |
|---|---|---|---|
| JP2013214509AJP6208526B2 (en) | 2013-10-15 | 2013-10-15 | Biological information display device and biological information display program |
| EP20140187764EP2862506A1 (en) | 2013-10-15 | 2014-10-06 | Biological information displaying apparatus and biological information displaying method |
| US14/508,443US9710941B2 (en) | 2013-10-15 | 2014-10-07 | Biological information displaying apparatus and biological information displaying method |
| CN201410525109.7ACN104545802B (en) | 2013-10-15 | 2014-10-08 | Biological information display device and biological information display methods |
Applications Claiming Priority (1)
| Application Number | Priority Date | Filing Date | Title |
|---|---|---|---|
| JP2013214509AJP6208526B2 (en) | 2013-10-15 | 2013-10-15 | Biological information display device and biological information display program |
Publications (2)
| Publication Number | Publication Date |
|---|---|
| JP2015077165A JP2015077165A (en) | 2015-04-23 |
| JP6208526B2true JP6208526B2 (en) | 2017-10-04 |
Family
ID=51687844
Family Applications (1)
| Application Number | Title | Priority Date | Filing Date |
|---|---|---|---|
| JP2013214509AExpired - Fee RelatedJP6208526B2 (en) | 2013-10-15 | 2013-10-15 | Biological information display device and biological information display program |
Country Status (4)
| Country | Link |
|---|---|
| US (1) | US9710941B2 (en) |
| EP (1) | EP2862506A1 (en) |
| JP (1) | JP6208526B2 (en) |
| CN (1) | CN104545802B (en) |
Families Citing this family (7)
| Publication number | Priority date | Publication date | Assignee | Title |
|---|---|---|---|---|
| JP6760736B2 (en)* | 2016-02-23 | 2020-09-23 | 日本光電工業株式会社 | Index output device, operation method of index output device and index output program |
| JP6707372B2 (en)* | 2016-03-16 | 2020-06-10 | フクダ電子株式会社 | Blood pressure pulse wave measuring device and program |
| JP6945828B2 (en)* | 2016-12-20 | 2021-10-06 | 株式会社志成データム | Health management system, health management method and health management program |
| CN108694998A (en)* | 2017-04-07 | 2018-10-23 | 深圳市理邦精密仪器股份有限公司 | The methods of exhibiting and device of medical score data |
| WO2019131811A1 (en) | 2017-12-27 | 2019-07-04 | キヤノンメディカルシステムズ株式会社 | Analysis device |
| CN110442849A (en)* | 2019-06-14 | 2019-11-12 | 平安科技(深圳)有限公司 | Method for exhibiting data, device, computer equipment and storage medium |
| US20240335169A1 (en)* | 2023-03-31 | 2024-10-10 | Biosense Webster (Israel) Ltd. | Methods and systems for displaying quality profiles points in an electro-anatomical map |
Family Cites Families (13)
| Publication number | Priority date | Publication date | Assignee | Title |
|---|---|---|---|---|
| JPH06215011A (en)* | 1992-11-26 | 1994-08-05 | Chuo Computer Syst Kk | Method and device for opening and reading information by individual classifications |
| JPH0838437A (en)* | 1994-05-25 | 1996-02-13 | Hiroshi Motoyama | Living body surface potential measuring device and diagnostic device |
| JPH11318841A (en)* | 1998-03-09 | 1999-11-24 | Nippon Colin Co Ltd | Blood pressure monitoring device |
| JP2002230174A (en)* | 2001-02-01 | 2002-08-16 | Ajinomoto Co Inc | Method and device for evaluating nutrition and nutrition evaluation system |
| JP3675764B2 (en)* | 2002-01-18 | 2005-07-27 | コーリンメディカルテクノロジー株式会社 | Atherosclerosis inspection device |
| CN100350874C (en)* | 2002-03-05 | 2007-11-28 | 大日本住友制药株式会社 | Electrocardiography chart apparatus and method thereof |
| JP2004016746A (en)* | 2002-06-20 | 2004-01-22 | Nippon Colin Co Ltd | Circulatory dynamics evaluation device |
| JP4101589B2 (en) | 2002-08-27 | 2008-06-18 | 株式会社タニタ | Physique physical strength determination method and physique physical fitness determination device |
| JP5399602B2 (en)* | 2005-04-22 | 2014-01-29 | フクダ電子株式会社 | Biological information output device and method, and biological information report |
| JP4444893B2 (en)* | 2005-08-31 | 2010-03-31 | 富士通株式会社 | Extended portfolio chart drawing device |
| JP5049137B2 (en)* | 2005-11-30 | 2012-10-17 | 日本カーバイド工業株式会社 | Retroreflective article |
| JP5185785B2 (en)* | 2008-11-19 | 2013-04-17 | オムロンヘルスケア株式会社 | Health condition judgment device |
| JP5287668B2 (en)* | 2009-10-30 | 2013-09-11 | オムロンヘルスケア株式会社 | Pulse wave analyzer and pulse wave analysis program |
- 2013
- 2013-10-15JPJP2013214509Apatent/JP6208526B2/ennot_activeExpired - Fee Related
- 2014
- 2014-10-06EPEP20140187764patent/EP2862506A1/ennot_activeWithdrawn
- 2014-10-07USUS14/508,443patent/US9710941B2/ennot_activeExpired - Fee Related
- 2014-10-08CNCN201410525109.7Apatent/CN104545802B/ennot_activeExpired - Fee Related
Also Published As
| Publication number | Publication date |
|---|---|
| US9710941B2 (en) | 2017-07-18 |
| CN104545802A (en) | 2015-04-29 |
| US20150103095A1 (en) | 2015-04-16 |
| CN104545802B (en) | 2019-06-28 |
| JP2015077165A (en) | 2015-04-23 |
| EP2862506A1 (en) | 2015-04-22 |
Similar Documents
| Publication | Publication Date | Title |
|---|---|---|
| JP6208526B2 (en) | Biological information display device and biological information display program | |
| US12105947B2 (en) | Electronic electrocardiogram calipers | |
| US8583222B2 (en) | ECG data display method for rapid detection of myocardial ischemia | |
| EP2633809B1 (en) | Electrocardiogram analysis apparatus, and electrocardiogram analysis program | |
| JP5536582B2 (en) | Biological parameter display device | |
| CN107660132A (en) | For the visual equipment, system and method to patient-related data | |
| JP6645190B2 (en) | Diagnosis support device, diagnosis support method, and diagnosis support program | |
| JP5659271B2 (en) | Biological information processing apparatus, exercise electrocardiogram inspection system, and biological information processing program | |
| JP3724511B2 (en) | Myocardial viability evaluation method and myocardial tomographic image processing apparatus | |
| US20060293594A1 (en) | Device for carrying out intravascular examinations | |
| CN109414201A (en) | Biological information measures auxiliary device, vital information measurement device, biological information measurement householder method and auxiliary program | |
| JP6440796B2 (en) | ECG analysis apparatus and electrocardiogram analysis program | |
| CN104720793A (en) | Bio-information display device and bio-information display method | |
| JP2021065451A (en) | Hemodynamic measuring apparatus | |
| US20160070876A1 (en) | Methods and systems for informatics data visualization and alerts | |
| JP4839427B2 (en) | Heart disease diagnosis system | |
| EP4461223A2 (en) | Systems for comparative analysis of cardiac information | |
| US20150342485A1 (en) | System and method for visually determining a physiological signal threshold | |
| US20240350120A1 (en) | Systems for comparative analysis of cardiac information | |
| JP2008125728A (en) | Medical image diagnosis supporting apparatus and program | |
| WO2004084735A1 (en) | Deriving parameter information from blood flow signal | |
| WO2017175617A1 (en) | Diagnostic assistance device, vital signs information measuring device, diagnostic assistance method, and diagnostic assistance program | |
| CN106562779B (en) | Device and method for graphically displaying ventricular ejection fraction change and monitoring system |
Legal Events
| Date | Code | Title | Description |
|---|---|---|---|
| A621 | Written request for application examination | Free format text:JAPANESE INTERMEDIATE CODE: A621 Effective date:20160325 | |
| A131 | Notification of reasons for refusal | Free format text:JAPANESE INTERMEDIATE CODE: A131 Effective date:20170124 | |
| A977 | Report on retrieval | Free format text:JAPANESE INTERMEDIATE CODE: A971007 Effective date:20170120 | |
| A521 | Request for written amendment filed | Free format text:JAPANESE INTERMEDIATE CODE: A523 Effective date:20170323 | |
| TRDD | Decision of grant or rejection written | ||
| A01 | Written decision to grant a patent or to grant a registration (utility model) | Free format text:JAPANESE INTERMEDIATE CODE: A01 Effective date:20170822 | |
| A61 | First payment of annual fees (during grant procedure) | Free format text:JAPANESE INTERMEDIATE CODE: A61 Effective date:20170907 | |
| R150 | Certificate of patent or registration of utility model | Ref document number:6208526 Country of ref document:JP Free format text:JAPANESE INTERMEDIATE CODE: R150 | |
| R250 | Receipt of annual fees | Free format text:JAPANESE INTERMEDIATE CODE: R250 | |
| LAPS | Cancellation because of no payment of annual fees |