JP5884515B2 - Chart generation program, chart generation method, and chart generation apparatus - Google Patents
Chart generation program, chart generation method, and chart generation apparatusDownload PDFInfo
- Publication number
- JP5884515B2 JP5884515B2JP2012015691AJP2012015691AJP5884515B2JP 5884515 B2JP5884515 B2JP 5884515B2JP 2012015691 AJP2012015691 AJP 2012015691AJP 2012015691 AJP2012015691 AJP 2012015691AJP 5884515 B2JP5884515 B2JP 5884515B2
- Authority
- JP
- Japan
- Prior art keywords
- date
- day
- production
- week
- unit
- Prior art date
- Legal status (The legal status is an assumption and is not a legal conclusion. Google has not performed a legal analysis and makes no representation as to the accuracy of the status listed.)
- Expired - Fee Related
Links
Images


Classifications
- G—PHYSICS
- G06—COMPUTING OR CALCULATING; COUNTING
- G06Q—INFORMATION AND COMMUNICATION TECHNOLOGY [ICT] SPECIALLY ADAPTED FOR ADMINISTRATIVE, COMMERCIAL, FINANCIAL, MANAGERIAL OR SUPERVISORY PURPOSES; SYSTEMS OR METHODS SPECIALLY ADAPTED FOR ADMINISTRATIVE, COMMERCIAL, FINANCIAL, MANAGERIAL OR SUPERVISORY PURPOSES, NOT OTHERWISE PROVIDED FOR
- G06Q10/00—Administration; Management
- G06Q10/06—Resources, workflows, human or project management; Enterprise or organisation planning; Enterprise or organisation modelling
- G06Q10/063—Operations research, analysis or management
- G06Q10/0631—Resource planning, allocation, distributing or scheduling for enterprises or organisations
Landscapes
- Business, Economics & Management (AREA)
- Human Resources & Organizations (AREA)
- Engineering & Computer Science (AREA)
- Strategic Management (AREA)
- Entrepreneurship & Innovation (AREA)
- Economics (AREA)
- Operations Research (AREA)
- Game Theory and Decision Science (AREA)
- Development Economics (AREA)
- Marketing (AREA)
- Educational Administration (AREA)
- Quality & Reliability (AREA)
- Tourism & Hospitality (AREA)
- Physics & Mathematics (AREA)
- General Business, Economics & Management (AREA)
- General Physics & Mathematics (AREA)
- Theoretical Computer Science (AREA)
- Management, Administration, Business Operations System, And Electronic Commerce (AREA)
- General Factory Administration (AREA)
Description
Translated fromJapanese本発明は、図表生成プログラム、図表生成方法及び図表生成装置に関する。 The present invention relates to a chart generation program, a chart generation method, and a chart generation apparatus.
製品を生産する場合には、四半期、半期や年度などの一定の期間にわたって日単位の生産予定量が立案された生産計画にしたがって拠点に製品を生産させる生産管理が行われる。かかる生産計画は、製品の需要に合わせて販売量が立案された販売計画をもとに、製品の需給バランスが取れた生産予定量が立案される。このため、生産計画は、計画が立案された時点から近い将来であるほど確度が高く、遠い将来ほど確度が低くなるという特性を有する。 In the case of producing a product, production management is performed so that the base produces the product in accordance with a production plan in which a daily production amount is planned over a certain period such as quarter, half year, or fiscal year. Such a production plan is based on a sales plan in which the sales volume is planned in accordance with the demand for the product, and a planned production volume in which the supply and demand balance of the product is balanced. For this reason, the production plan has a characteristic that the accuracy is higher in the near future from the time when the plan is drawn, and the accuracy is lower in the far future.
このことから、生産予定量のトレンドを可視化する技術として、期間の単位が異なる複数のタイムバケットを用いて、各タイムバケットの生産予定量を表示する表示方法が提案されている。この表示方法では、時間経過を表す時間軸の起点とする日から一定の期間にわたって日単位の生産予定量を登載するとともにそれ以降に週単位の生産予定量を登載した生産計画表を表示する。これによって、生産計画者は、近い将来については正確なトレンドを把握するとともに、遠い将来については大局的なトレンドを把握できるので、製品の生産を拠点へ配分する場合に生産の配分を平準化することができる。 For this reason, as a technique for visualizing the trend of the production schedule quantity, a display method for displaying the production production quantity of each time bucket using a plurality of time buckets having different time units has been proposed. In this display method, a production schedule table in which daily production schedule quantities are listed for a certain period from the day starting from the time axis representing the passage of time and weekly production schedule quantities are displayed is displayed. This enables production planners to grasp accurate trends for the near future and global trends for the distant future, thus leveling production distribution when allocating product production to locations. be able to.
しかしながら、上記の従来技術では、以下に説明するように、生産管理に有用な図表を提供するのにおのずから限界があるという問題がある。 However, the above-described conventional technology has a problem that there is a limit in providing a chart useful for production management as described below.
すなわち、上記の生産計画表には、生産計画表の時間軸の起点とする日がいずれの曜日であるかによって週単位の生産予定量の表示が始まる曜日が変わる。このため、上記の生産計画表では、工場等を擁する拠点や拠点を統括する本社などの稼働が開始される曜日から週単位の生産予定量の表示が始まらない場合がある。例えば、上記の生産計画表の場合には、拠点や本社が1週間を月曜から金曜までのサイクルで稼働し、土日が休日と定められているとしたとき、週末の金曜などの曜日から週単位の生産予定量の表示が開始される場合もある。この場合に、上記の生産計画表には、週の稼働が始まって金曜になるまでの生産予定量が表示されず、金曜の生産予定量が唐突に表示されることになる。この結果、生産部門の担当者等は、上記の生産計画表から1週間の生産予定量を俯瞰できず、生産管理を行うのに不便が生じてしまう。 That is, in the above production plan table, the day of the week on which the display of the scheduled production quantity in units of weeks changes depending on which day of the week is the starting day of the time axis of the production plan table. For this reason, in the above production plan table, the display of the scheduled production amount in units of weeks may not start from the day of the week when the operation of the base having a factory or the head office that supervises the base is started. For example, in the case of the above production schedule, if the base or headquarters operates in a cycle from Monday to Friday and the weekend is defined as a holiday, then the weekly unit from the day of the week such as a weekend Friday In some cases, the display of the scheduled production amount of the product is started. In this case, the production schedule table does not display the scheduled production quantity until the start of the week and starts Friday, but the production schedule quantity on Friday is displayed suddenly. As a result, the person in charge of the production department cannot see the planned production amount for one week from the above production plan table, which causes inconvenience in performing production management.
なお、上記の問題は、生産計画表を表示する場合に限って生じるものではなく、生産予定量と時間推移の関係とを表すグラフを生成する場合にも同様の問題が生じる。 Note that the above problem does not occur only when the production plan table is displayed, and the same problem occurs when a graph representing the relationship between the scheduled production amount and the time transition is generated.
開示の技術は、上記に鑑みてなされたものであって、生産管理に有用な図表を提供できる図表生成プログラム、図表生成方法及び図表生成装置を提供することを目的とする。 The disclosed technique has been made in view of the above, and an object thereof is to provide a chart generation program, a chart generation method, and a chart generation apparatus that can provide a chart useful for production management.
本願の開示する図表生成プログラムは、コンピュータに、製品の生産量に関する図表の生成要求を受け付ける処理を実行させる。さらに、前記コンピュータに、前記生成要求が受け付けられた日以降の日付のうち、曜日を記憶する曜日記憶部に記憶された曜日に対応する日付の選択を誘導する選択画面を要求元の装置に表示させる処理を実行する。さらに、前記コンピュータに、日単位に製品の生産量を記憶する生産量記憶部に記憶された生産量を用いて、前記選択画面を介して選択された日付を境界に前記生産量のタイムバケットを日単位から週単位へ変更して図表を生成する処理を実行させる。 The chart generation program disclosed in the present application causes a computer to execute a process of receiving a chart generation request relating to the production amount of a product. Further, a selection screen for instructing selection of a date corresponding to a day of the week stored in a day-of-week storage unit that stores the day of the week after the date when the generation request is accepted is displayed on the requesting device on the computer. Execute the process. Furthermore, using the production amount stored in the production amount storage unit that stores the production amount of the product on a daily basis in the computer, a time bucket of the production amount is bounded on the date selected via the selection screen. Change the daily unit to the weekly unit and execute the process to generate the chart.
本願の開示する図表生成プログラムの一つの態様によれば、生産管理に有用な図表を提供できるという効果を奏する。 According to one aspect of the chart generation program disclosed in the present application, it is possible to provide a chart useful for production management.
以下に、本願の開示する図表生成プログラム、図表生成方法及び図表生成装置の実施例を図面に基づいて詳細に説明する。なお、この実施例は開示の技術を限定するものではない。そして、各実施例は、処理内容を矛盾させない範囲で適宜組み合わせることが可能である。 Hereinafter, embodiments of a chart generation program, a chart generation method, and a chart generation apparatus disclosed in the present application will be described in detail with reference to the drawings. Note that this embodiment does not limit the disclosed technology. Each embodiment can be appropriately combined within a range in which processing contents are not contradictory.
[システム構成]
まず、本実施例に係る生産管理システムの構成について説明する。図1は、実施例1に係る生産管理システムの構成を示す図である。図1に示す生産管理システム1は、一定の期間にわたって日次の生産予定量が立案された生産計画にしたがって拠点3A〜3Cによる製品の生産を管理するシステムである。かかる生産管理の一環として、生産管理システム1は、拠点3や本社5の生産計画者に提供する生産予定量を含む生販在計画に関する図表を生成する図表生成サービスを提供する。[System configuration]
First, the configuration of the production management system according to the present embodiment will be described. FIG. 1 is a diagram illustrating the configuration of the production management system according to the first embodiment. A production management system 1 shown in FIG. 1 is a system that manages the production of products by the bases 3A to 3C in accordance with a production plan in which a daily production schedule is planned over a certain period. As a part of such production management, the production management system 1 provides a chart generation service for generating a chart relating to a live sales plan including a planned production amount to be provided to production planners at the base 3 and the
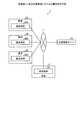
図1に示すように、生産管理システム1には、生産管理サーバ10と、拠点端末30A〜30Cと、本社端末50とが収容される。なお、図1の例では、3つの拠点端末、1つの本社端末をそれぞれ図示したが、開示のシステムは図示の構成に限定されない。すなわち、生産管理システム1は、任意の数の拠点端末および本社端末を収容できる。以下では、拠点3A〜拠点3Cの各拠点を区別なく総称する場合には「拠点3」と記載し、また、拠点端末30A〜30Cの各装置を区別なく総称する場合には、「拠点端末30」と記載する場合がある。 As shown in FIG. 1, the production management system 1 accommodates a production management server 10,
これら生産管理サーバ10と拠点端末30と本社端末50との間は、ネットワーク7を介して相互に通信可能に接続される。かかるネットワーク7には、有線または無線を問わず、インターネット(Internet)、LAN(Local Area Network)やVPN(Virtual Private Network)などの任意の種類の通信網を採用できる。 The production management server 10, the
このうち、拠点端末30は、製品を生産する工場や製品を販売する販売店等の拠点3に配設される端末装置である。例えば、拠点端末30の一例としては、パーソナルコンピュータ(PC:personal computer)を始めとする固定端末の他、携帯電話機、PHS(Personal Handyphone System)やPDA(Personal Digital Assistant)などの移動体端末も採用できる。なお、拠点端末30は、拠点3の所属員、例えば生産部門の担当者や販売部門の担当者等によって利用される。 Among these, the
かかる拠点端末30は、拠点3の生産(Production)計画、販売(Sales)計画及び在庫(Inventory)の生販在に関する計画データ、すなわちPSI計画データを記憶管理する。ここで言う拠点3のPSI計画は、各拠点3A〜3Cに閉じたローカル(local)なPSI計画であるので、以下では「L−PSI計画」と記載する場合がある。一方、生産管理サーバ10によって記憶管理されるPSI計画は、全拠点3を統括するグローバル(global)なPSI計画であるので、以下では「G−PSI計画」と記載する場合がある。 The
本社端末50は、拠点3A〜3Cを統括する本社5に配設される端末装置である。かかる本社端末50の一例としては、パーソナルコンピュータを始めとする固定端末の他、携帯電話機、PHSやPDAなどの移動体端末も採用できる。なお、ここでは、本社端末50は、本社5の所属員、例えば生産部門の担当者や販売部門の担当者等によって利用される。また、ここでは、本社端末50がクライアントとして機能する場合を例示するが、本社端末50を生産管理サーバ10として機能させることもできる。 The
これら拠点端末30及び本社端末50は、L−PSI計画及びG−PSI計画のマスタ管理を行う生産管理サーバ10を介して各種データの授受を行う。一態様としては、拠点端末30は、L−PSI計画データを生産管理サーバ10へアップロードする。かかるL−PSI計画データには、各製品に関する日次の生産量、受注量及び在庫量が含まれる。他の一態様としては、本社端末50は、L−PSI計画データに含まれる生産計画データに拠点3の生産予定量を設定した上で当該生産予定量を拠点端末30にダウンロードさせる。かかる拠点3の生産予定量は、本社5の生産部門の担当者によって製品の拠点全体の生産予定量、製品の受注状況や在庫状況、各拠点3の工場の生産能力や設備の負荷状態などをもとに製品の拠点全体の生産予定量から一定の量が拠点3へ配分されたものである。 The
生産管理サーバ10は、製品の生産管理を行うサーバ装置である。かかる生産管理サーバ10は、Webサーバとして実装することとしてもよいし、また、クラウドとして実装することもできる。一態様としては、生産管理サーバ10は、本社端末50から生産計画表の生成指示を受け付けた場合に、G−PSI計画データを用いて、生産計画表を生成した上で本社端末50へ提供する。他の一態様としては、生産管理サーバ10は、拠点端末30から生産計画表の生成指示を受け付けた場合に、L−PSI計画データを用いて、生産計画表を生成した上で拠点端末30へ提供する。 The production management server 10 is a server device that performs product production management. Such a production management server 10 may be implemented as a Web server, or may be implemented as a cloud. As an aspect, when the production management server 10 receives a production plan table generation instruction from the
ここで、本実施例に係る生産管理サーバ10は、製品の生産予定量に関する生産計画表の生成要求を受け付ける。さらに、本実施例に係る生産管理サーバ10は、生成要求が受け付けられた日以降の日付のうち、所定の曜日に対応する日付の選択を誘導する選択画面を拠点端末30や本社端末50に表示させる。さらに、本実施例に係る生産管理サーバ10は、日単位に製品の生産予定量を含むG−PSI計画データやL−PSI計画データを用いて、選択画面を介して選択された日付を境界に生産予定量のタイムバケットを日単位から週単位へ変更して生産計画表を生成する。 Here, the production management server 10 according to the present embodiment accepts a production plan table generation request relating to a production schedule amount of a product. Furthermore, the production management server 10 according to the present embodiment displays a selection screen for guiding selection of a date corresponding to a predetermined day of the week after the date when the generation request is received, on the
このように、本実施例に係る生産管理サーバ10は、企業等の組織が稼働を開始する曜日に対応する日付の選択を誘導する画面を介して選択させた日付を境界に、製品の生産予定量のタイムバケットを日単位から週単位へ変更して生産計画表を生成する。このため、本実施例に係る生産管理サーバ10では、生産予定量を含む図表が拠点3や本社5などの稼働が開始される曜日以外から週単位の生産予定量の表示が始まる事態を抑制できる。それゆえ、本実施例に係る生産管理サーバ10では、生産計画表から1週間の生産予定量を俯瞰できる。したがって、本実施例に係る生産管理サーバ10によれば、生産管理に有用な生産計画表を提供できる。 As described above, the production management server 10 according to the present embodiment schedules the production of products on the boundary of the date selected via the screen for guiding the selection of the date corresponding to the day of the week when the organization such as a company starts operation. Change the production time bucket from daily to weekly and generate a production schedule. For this reason, in the production management server 10 according to the present embodiment, it is possible to suppress a situation in which the display of the scheduled production quantity starts on a weekly basis other than the day on which the chart including the production schedule quantity starts operation of the base 3 or the
したがって、本実施例に係る生産管理サーバ10によれば、生産管理に有用な生産計画表を提供できる。例えば、本社5の生産部門の担当者が生産計画表を閲覧する場合には、拠点3全体の1週間の生産予定量を俯瞰できるので、本社5の生産部門の担当者が製品の生産を拠点へ配分するにあたって生産の配分を平準化するのに有用な生産計画表を提供できる。また、拠点3の生産部門の担当者が生産計画表を閲覧する場合には、各拠点の1週間の生産予定量を俯瞰できるので、拠点3の工場を操業するにあたって有用な生産計画表を提供できる。 Therefore, according to the production management server 10 according to the present embodiment, a production plan table useful for production management can be provided. For example, when a person in charge of the production department at
[生産管理サーバ10の構成]
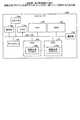
続いて、本実施例に係る生産管理サーバ10の機能的構成について説明する。図2は、実施例1に係る生産管理サーバ10の機能的構成を示すブロック図である。図2に示すように、生産管理サーバ10は、通信I/F(interface)部11と、記憶部13と、制御部15とを有する。なお、生産管理サーバ10は、図2に示した機能部以外にも既知のサーバ装置が有する各種の機能部、例えば各種の入力デバイスや音声出力デバイスなどの機能部を有することとしてもかまわない。[Configuration of Production Management Server 10]
Subsequently, a functional configuration of the production management server 10 according to the present embodiment will be described. FIG. 2 is a block diagram illustrating a functional configuration of the production management server 10 according to the first embodiment. As shown in FIG. 2, the production management server 10 includes a communication I / F (interface)
通信I/F部11は、他の装置、例えば拠点端末30A〜30Cや本社端末50との間で通信制御を行うインタフェースである。かかる通信I/F部11の一態様としては、LANカードなどのネットワークインタフェースカードを採用できる。例えば、通信I/F部11は、本社端末50や拠点端末30からPSI表の生成指示を受信したり、また、生産管理サーバ10が生成したPSI表を本社端末50や拠点端末30へ送信したりする。 The communication I /
記憶部13は、制御部15で実行されるOS(Operating System)や図表生成サービスを提供するグラフ生成プログラムなどの各種プログラムを記憶する記憶デバイスである。かかる記憶部13の一態様としては、フラッシュメモリなどの半導体メモリ素子、ハードディスク、光ディスクなどの記憶装置が挙げられる。なお、記憶部13は、上記の種類の記憶装置に限定されるものではなく、RAM(Random Access Memory)、ROM(Read Only Memory)であってもよい。 The storage unit 13 is a storage device that stores various programs such as an OS (Operating System) executed by the
記憶部13は、制御部15で実行されるプログラムの実行に必要なデータの一例として、図2に示すように、曜日データ13aと、G−PSI計画データ13bと、L−PSI計画データ13cとを記憶する。 As an example of data necessary for execution of the program executed by the
このうち、曜日データ13aは、曜日に関する各種設定が定義されたデータである。一例として、曜日データ13aには、拠点3や本社5の生産部門の担当者によって企業等の組織が稼働を開始する曜日が設定される。ここで、以下では、組織が稼働を開始する曜日のことを「稼働開始曜日」と記載する場合がある。他の一例として、曜日データ13aには、拠点3や本社5の生産部門の担当者によって企業等の組織が稼働を休止する曜日が設定される場合もある。更なる一例としては、曜日データ13aは、製品のPSIのタイムバケットを日単位から週単位へ変更する第1の境界日及び週単位から月単位へ変更する第2の境界日として稼働開始曜日を選択するよう誘導するために、後述の画面表示部15bによって参照される。 Of these, the day of the
かかる曜日データ13aの一態様としては、稼働開始曜日が定義されたデータを採用できる。図3は、曜日データ13aの一例を示す図である。図3に示す例では、拠点3及び本社5の稼働が月曜日から開始されることを示す。なお、図3に示す曜日は、あくまでも一例であり、他の曜日が稼働開始曜日として設定されることを妨げない。 As an example of the day of the
G−PSI計画データ13bは、拠点3A〜3Cの全体で予定される製品の生販在の数量が定義されたデータである。一例として、G−PSI計画データ13bは、本社5の生産部門の担当者によって需要バランスに基づいて販売予定量および在庫予定量が設定された上で販売予定量および在庫予定量をもとに設定された生産予定量と併せて登録される。ここで、以下では、生産予定量、販売予定量および在庫予定量を併せて総称する場合に「PSI」と総称する場合がある。他の一例として、G−PSI計画データ13bは、本社端末50からG−PSI表の生成指示が受け付けられた場合に、後述の生成部17によって参照される。 The G-
かかるG−PSI計画データ13bの一態様としては、「品目」、「日付」、「販売予定量」、「在庫予定量」および「生産予定量」が対応付けられたデータを採用できる。図4は、G−PSI計画データ13bの一例を示す図である。図4に示すように、2011年8月11日には、製品の品目「A」を80個販売するとともに在庫を30個残すことが計画されている。このとき、初期在庫がゼロであるとしたとき、在庫が30個残るように、販売予定量と在庫予定量とが合算された110個が生産予定量として計画されている。また、2011年8月12日には、製品の品目「A」を60個販売するとともに在庫を50個残すことが計画されている。この場合、前日の在庫が30個残っているので、2011年8月12日の分と併せて在庫が50個残るように、80個の生産が予定されている。 As an aspect of the G-
ここで、上記の図4の例では、PSIが品目と対応付けられた生産計画データを例示したが、必ずしもPSIに対応付けられる製品の識別情報は品目である必要はない。例えば、開示の装置は、品目の代わりに品種、いわゆるシリーズ品目をPSIに対応付けたPSI計画データを記憶することとしてもかまわない。ここで言う「品種」とは、一定の共通性を持つ品目をシリーズにまとめた品目のグループを指す。例えば、生産管理サーバ10がG−PSI計画データとして管理する製品の単位を品種としておき、各拠点3にPSIを配分する場合には品種を構成する各品目を単位としてL−PSI計画データを配信することもできる。 Here, in the example of FIG. 4 described above, the production plan data in which the PSI is associated with the item is illustrated, but the product identification information associated with the PSI is not necessarily the item. For example, the disclosed apparatus may store PSI plan data in which a product type, a so-called series item, is associated with a PSI instead of an item. The term “variety” as used herein refers to a group of items in which items having a certain commonality are grouped into a series. For example, when the product management server 10 manages the product unit managed as G-PSI plan data as a product type and distributes PSI to each base 3, the L-PSI plan data is distributed in units of each product constituting the product type. You can also
L−PSI計画データ13cは、各拠点3A〜3Cで予定される製品の生販在の数量が定義されたデータである。一例として、L−PSI計画データ13cは、本社5の生産部門の担当者によって拠点3に配分された販売予定量、在庫予定量および生産予定量が設定される。他の一例として、L−PSI計画データ13cは、拠点端末30からL−PSI表の生成指示が受け付けられた場合に、後述の生成部17によって参照される。なお、L−PSI計画データ13cのスキームは、上述のG−PSI計画データ13bと同様であるので、その説明を省略する。 The L-PSI plan data 13c is data in which the quantity of live sales of products planned at the respective bases 3A to 3C is defined. As an example, in the L-PSI plan data 13c, a planned sales amount, a planned inventory amount, and a planned production amount allocated to the base 3 by a person in charge of the production department of the
制御部15は、各種の処理手順を規定したプログラムや制御データを格納するための内部メモリを有し、これらによって種々の処理を実行する。制御部15は、図2に示すように、受付部15aと、画面表示部15bと、生成部17とを有する。 The
このうち、受付部15aは、製品の生産予定量を含むPSI表の生成要求を受け付ける処理部である。一態様としては、受付部15aは、拠点端末30または本社端末50から受け付けたログインの認証情報をもとにログイン認証を行った上で、製品の品目が指定されたPSI表の生成要求を受け付ける。このとき、受付部15aは、ログイン認証に成功した所属員がG−PSI計画データ13bやL−PSI計画データ13cへのアクセス権限を有するか否かの権限認証を併せて実行することもできる。 Among these, the
画面表示部15bは、PSI表の生成要求が受け付けられた日以降の日付のうち、曜日データ13aに設定された曜日に対応する日付の選択を誘導する選択画面を拠点端末30または本社端末50に表示させる処理部である。 The
一態様としては、画面表示部15bは、受付部15aによってPSI表の生成要求が受け付けられた日付をPSI表の時間軸の起点日に設定した上で、記憶部13に記憶された曜日データ13aを読み出す。かかるPSI表の時間軸の起点日は、必ずしもPSI表の生成要求が受け付けられた日付である必要はなく、当該日付の以前であっても以後であってもかまわない。そして、画面表示部15bは、年月日と曜日との対応関係が定義された図示しないカレンダデータから、上記の起点日以降の日付であり、かつ曜日データ13aに設定された曜日である日付を第1の境界日の選択候補として抽出する。その上で、画面表示部15bは、シークバーのスライダバー上に表示されるスライダであって第1の境界日の選択候補として抽出した日付の位置に停止可能なスライダを含む選択画面を拠点端末30または本社端末50へ送信する。 As one aspect, the
図5は、シークバーの一例を示す図である。図5に示す符号200は、第1の境界日を選択する選択画面に含まれるシークバーを指し、符号210はスライダバーを指し、また、符号220はスライダを指す。また、図5に示す点線は、第1の境界日の選択候補の日付を表している。図5に示すシークバー200は、スライダバー210によって時間軸が表現される。かかるシークバー200では、必ずしもスライダ220をスライダバー210上の任意の位置に停止することが許容されない場合がある。例えば、シークバー200は、スライダバー210上の第1の境界日の選択候補である月曜日の8月15、8月22日や8月29日の位置に限ってスライダ220が停止することを許容する。したがって、拠点端末30や本社端末50に表示された選択画面上でスライダ220が8月15、8月22日や8月29日以外の位置にマウスのポインタがドラッグされたり、矢印キーが操作されたりしてもそのスライダバー210の位置にスライダ220は停止されない。これによって、第1の境界日の選択候補以外の日付が選択されることによって拠点3や本社5の稼働開始曜日以外から週単位のPSIの表示が始まる事態を抑制する。なお、開示の装置では、必ずしもシークバー220において第1の境界日の選択候補の日付を表す補助線(点線)を表示させる必要はない。 FIG. 5 is a diagram illustrating an example of a seek bar.
その後、画面表示部15bは、拠点端末30または本社端末50によって選択画面を介して選択された第1の境界日を受け付ける。そして、画面表示部15bは、第1の境界日以降の日付であり、かつ曜日データ13aに設定された曜日もしくは月の初日のいずれかに該当する日付を第2の境界日の選択候補として抽出する。その上で、画面表示部15bは、シークバーのスライダバー上に表示されるスライダであって第2の境界日の選択候補として抽出した日付の位置に停止可能なスライダを含む選択画面を拠点端末30または本社端末50へ送信する。 Thereafter, the
図6は、シークバーの一例を示す図である。図6に示す符号250は、第2の境界日を選択する選択画面に含まれるシークバーを指し、符号260はスライダバーを指し、また、符号270はスライダを指す。また、図6に示す点線及び実線は、第2の境界日の選択候補の日付を指し、このうち、点線は、曜日データ13aに設定された曜日に対応する日付を表し、実線は、月の初日の日付を表す。 FIG. 6 is a diagram illustrating an example of a seek bar. A
図6に示すシークバー250は、スライダバー260によって時間軸が表現される。かかるシークバー250では、必ずしもスライダ270をスライダバー260上の任意の位置に停止することが許容されない場合がある。例えば、シークバー250は、スライダバー270上の第2の境界日の選択候補である月曜日の8月29、9月5日、9月12日や9月19日と月の初日の9月1日の位置に限ってスライダ270が停止することを許容する。したがって、拠点端末30や本社端末50に表示された選択画面上でスライダ270が上記の第2の境界日の選択候補以外の位置にマウスのポインタがドラッグされたり、矢印キーが操作されたりしてもそのスライダバー260の位置にスライダ270は停止されない。これによって、第2の境界日の選択候補以外の日付が選択されることによって拠点3や本社5の稼働開始曜日以外から月単位のPSIの表示が始まる事態を抑制したり、あるいは月の初頭以外から月単位のPSIの表示が始まる事態を抑制したりする。なお、開示の装置では、必ずしもシークバー270において第2の境界日の選択候補の日付を表す補助線(点線及び実線)を表示させる必要はない。 In the seek
このように、画面表示部15bは、シークバー200及びシークバー250を含む選択画面を拠点端末30や本社端末50に表示させることによって拠点端末30や本社端末50から第1の境界日および第2の境界日の選択を受け付けることができる。なお、ここでは、製品のPSIのタイムバケットが第1の境界日を境界に日単位から週単位へ変更されるとともに第2の境界日を境界に週単位から月単位に変更されたPSI表を生成する場合を例示するが、必ずしも月単位のPSIをPSI表に含める必要はない。すなわち、開示の装置は、日単位のPSI及び週単位のPSIだけを含むPSI表を生成することもできる。 As described above, the
生成部17は、G−PSI計画データ13bやL−PSI計画データ13cを用いて、選択画面を介して選択された日付を境界に製品のPSIのタイムバケットを日単位から週単位へ変更してPSI表を生成する処理部である。 The
図2に示すように、生成部17は、製品のPSIを日単位、週単位および月単位に集計する集計部17aと、PSI表におけるPSIの表示設定を行う表示設定部17bとを有する。なお、以下では、一例として、本社端末50からG−PSI計画データ13bのPSI表の生成指示を受け付ける場合を想定するが、拠点端末30からL−PSI計画データ13cのPSI表の生成指示を受け付ける場合も同様の処理が実行される。 As shown in FIG. 2, the
これを説明すると、まず、集計部17aは、選択画面を通じて第1の境界日及び第2の境界日が選択されると、記憶部13に記憶されたG−PSI計画データ13bのうちPSI表の時間軸の起点日から第1の境界日の前日までの期間のPSIを読み出す。このようにして読み出したPSIは、元から日単位のものであり、集計の必要がない。よって、以後の処理では、記憶部13から読み出されたPSIがそのまま日単位のPSIとして扱われる。 Explaining this, first, when the first boundary date and the second boundary date are selected through the selection screen, the
続いて、集計部17aは、第1の境界日以降の日付を持ち、かつ第2の境界日の日付よりも前の期間を週単位の集計期間とし、G−PSI計画データ13bのうち当該集計期間におけるPSIを読み出す。そして、集計部17aは、集計期間を週単位のタイムバケットの時間枠に区切った上で各時間枠のPSIを週単位に集計する。さらに、集計部17aは、第2の境界日を開始日とし、PSI表の時間軸の起点日から所定の期間後の日付、例えば半期である6ヶ月後の日付を含む月の末日を終了日とする期間を月単位の集計期間に設定する。かかる月単位の集計期間の終了日は、PSI表を半期単位で表示することを想定したものであるが、上記の例に限定されず、任意の日を終了日とすることができる。その上で、集計部17aは、G−PSI計画データ13bのうち当該集計期間におけるPSIを読み出す。そして、集計部17aは、集計期間を月単位のバケットサイズの時間枠に区切った上で各時間枠のPSIを月単位に集計する。 Subsequently, the totaling
その後、表示設定部17bは、タイムバケットのサイズが週単位または月単位に満たない端数の時間枠が存在するか否かを判定する。例えば、表示設定部17bは、週単位の集計期間に含まれる各時間枠が週の構成日数である7日間と等しいか否かを判定することによって週単位の集計期間に端数の時間枠が存在するか否かを判定する。また、表示設定部17bは、月単位の集計期間に含まれる各時間枠が月の構成日数、例えば28日〜31日と等しいか否かを判定する。 Thereafter, the display setting unit 17b determines whether there is a fractional time frame in which the size of the time bucket is less than a week unit or a month unit. For example, the display setting unit 17b determines whether or not each time frame included in the weekly aggregation period is equal to 7 days, which is the number of days constituting the week, so that there is a fractional time frame in the weekly aggregation period. It is determined whether or not to do. Further, the display setting unit 17b determines whether or not each time frame included in the monthly aggregation period is equal to the number of constituent days of the month, for example, 28th to 31st.
ここで、上記の判定を実施するのは、当該端数の時間枠を他の時間枠を同等に表示したのでは拠点3や本社5の生産部門の担当者にPSIのトレンドを誤認させるおそれがあるからである。上記の端数の時間枠は、月の初日が第2の境界日として選択されており、かつ第1の境界日から月の末日までの期間が週の構成日数である7の倍数でない限り発生する。例えば、月の初日が第2の境界日として選択されなかった場合には、月単位の集計区間を構成する最初の時間枠のタイムバケットのサイズが1ヶ月に満たなくなる。また、月の初日が第2の境界日として選択されたとしても、第1の境界日から月の末日までの期間が週の構成日数である7の倍数でない場合には、週単位の集計期間のうち末尾の時間枠のバケットサイズが1週間に満たず、1日間〜6日間となる。このような端数の時間枠を他の時間枠と同等にPSI表に登載したのでは、端数の時間枠のタイムバケットのサイズは他の時間枠よりも小さいにもかかわらず、同等のバケットサイズであると誤認される結果、PSIの数値が過小評価される場合がある。 Here, the above determination is performed because if the fractional time frame is displayed in the same manner as other time frames, the person in charge of the production department at the base 3 or the
かかるトレンドの誤認を抑制する観点から、表示設定部17bは、端数の時間枠の表示設定を他の時間枠の表示設定と異なる表示設定に変更する。一例として、表示設定部17bは、端数の時間枠が表示されるカラムを塗りつぶしありに設定する一方で、端数のない時間枠が表示されるカラムを塗りつぶしなしに設定する。他の一例として、表示設定部17bは、端数の時間枠が表示されるカラムの表示色を、端数のない時間枠が表示されるカラムの表示色とは異なる表示色に設定する。 From the viewpoint of suppressing such misperception of the trend, the display setting unit 17b changes the display setting of the fractional time frame to a display setting different from the display settings of the other time frames. As an example, the display setting unit 17b sets a column in which a fractional time frame is displayed as filled, while setting a column in which a fractional time frame is displayed as unfilled. As another example, the display setting unit 17b sets the display color of the column in which the fractional time frame is displayed to a display color different from the display color of the column in which the fractional time frame is displayed.
その後、表示設定部17bは、先に設定した表示設定にしたがって、集計部17aによって日単位、週単位および月単位に集計されたPSIからテーブル形式のPSI表を生成する。その上で、表示設定部17bは、生成した製品のPSI表を本社端末50に表示させる。なお、ここでは、生成部17がPSI表を作成する場合を例示したが、開示の装置はこれに限定されず、他の図表を生成することもできる。一例として、開示の装置は、製品のPSIと日単位、週単位、月単位の時間推移との関係を示すグラフ、例えば折れ線グラフや棒グラフを生成できる。 Thereafter, the display setting unit 17b generates a PSI table in a table format from the PSI aggregated by the
図7は、PSI表の一例を示す図である。図7の例では、選択画面を介して8月15日が第1の境界日として設定されるとともに、9月1日が第2の境界日として設定された場合を示す。なお、図7に示す日単位、週単位及び月単位のPSIは、図4に示したG−PSI計画データ13bを用いて生成された値であるものとする。 FIG. 7 is a diagram illustrating an example of the PSI table. The example of FIG. 7 shows a case where August 15 is set as the first boundary date and September 1 is set as the second boundary date via the selection screen. Note that the daily, weekly, and monthly PSI shown in FIG. 7 are values generated using the G-
図7に示すように、PSI表300は、第1の境界日220である8月15日を境界にPSIのタイムバケットのサイズが日単位から週単位へ変更されている。このとき、選択画面に含まれていたスライダ220によって稼働開始曜日が選択されるように誘導されており、本社端末50によって稼働開始曜日である8月15日が選択されている。よって、週単位のPSIの表示が月曜日から始まっており、8月15日からの1週間のPSIが俯瞰できるようになっている。 As shown in FIG. 7, in the PSI table 300, the size of the PSI time bucket is changed from a daily unit to a week unit on August 15, which is the
さらに、PSI表300は、第2の境界日220である9月1日を境界にPSIのタイムバケットのサイズが週単位から月単位へ変更されている。このとき、選択画面に含まれていたスライダ270によって稼働開始曜日もしくは月の初日が選択されるように誘導されており、本社端末50によって月の初日である9月1日が選択されている。よって、月単位のPSIの表示が月の初日から始まっており、9月の1ヶ月間のPSIが俯瞰できるようになっている。加えて、PSI表300では、週単位に表示される時間枠のうちタイムバケットのサイズが1週間に満たず、構成日数が3日間しかない端数の時間枠である8月29日の週のカラムが塗りつぶしありで表示されている。このため、本社5の生産部門の担当者は、前の週のPSIに比べて生産予定量の値が小さくとも、その一因が構成日数の不足にあることを把握できる。したがって、PSIのトレンドが誤認されるリスクを低減できる。 Further, in the PSI table 300, the size of the PSI time bucket is changed from a week unit to a month unit on September 1 as the
このようなPSI表300を閲覧することによって、本社5の生産部門の担当者は、近い将来については正確なトレンドを把握するとともに、遠い将来については大局的なトレンドを把握できる。その上、PSI表300では、週単位のPSIの表示が稼働開始曜日から開始されるとともに月単位のPSIの表示が月の初日から開始されるので、タイムバケットの各サイズのトレンドを正確に把握できる。したがって、PSI表300を閲覧する担当者は、製品の生産を拠点3へ配分する場合に生産の配分を平準化できる。 By viewing such a PSI table 300, the person in charge of the production department of the
なお、制御部15には、各種の集積回路や電子回路を採用できる。また、制御部15が有する機能部の一部を別の集積回路や電子回路とすることもできる。例えば、集積回路としては、ASIC(Application Specific Integrated Circuit)が挙げられる。また、電子回路としては、CPU(Central Processing Unit)やMPU(Micro Processing Unit)などが挙げられる。 Note that various integrated circuits and electronic circuits can be employed for the
[処理の流れ]
図8は、実施例1に係る図表生成処理の手順を示すフローチャートである。この図表生成処理は、一例として、拠点端末30や本社端末50からPSI表の生成指示を受け付けた場合に処理が起動される。[Process flow]
FIG. 8 is a flowchart illustrating the procedure of the chart generation process according to the first embodiment. As an example, this chart generation process is started when a PSI table generation instruction is received from the
図8に示すように、受付部15aによってPSI表の生成指示が受け付けられると(ステップS101)、画面表示部15bは、受付部15aによってPSI表の生成要求が受け付けられた日付をPSI表の時間軸の起点日に設定する(ステップS102)。そして、画面表示部15bは、記憶部13に記憶された曜日データ13aを読み出す(ステップS103)。 As shown in FIG. 8, when an instruction to generate a PSI table is received by the receiving
そして、画面表示部15bは、先の起点日以降の日付であり、かつ曜日データ13aに設定された曜日に該当する日付を抽出した第1の境界日の選択候補の位置に停止可能なスライダを含む選択画面を拠点端末30又は本社端末50へ送信する(ステップS104)。その後、画面表示部15bは、拠点端末30または本社端末50によって選択画面を介して選択された第1の境界日を受け付ける(ステップS105)。 Then, the
続いて、画面表示部15bは、第1の境界日以降の日付であり、かつ曜日データ13aに設定された曜日もしくは月の初日のいずれである日付を抽出した第2の境界日の選択候補の位置に停止可能なスライダを含む選択画面を拠点端末30又は本社端末50へ送信する(ステップS106)。その後、画面表示部15bは、拠点端末30または本社端末50によって選択画面を介して選択された第2の境界日を受け付ける(ステップS107)。 Subsequently, the
そして、集計部17aは、記憶部13に記憶されたG−PSI計画データ13bのうちPSI表の時間軸の起点日から第1の境界日の前日までの期間のPSIを読み出す(ステップS108)。このようにして読み出したPSIは、元から日単位のものであり、集計の必要がない。よって、以後の処理では、記憶部13から読み出されたPSIがそのまま日単位のPSIとして扱われる。 Then, the totaling
続いて、集計部17aは、第1の境界日以降の日付を持ち、かつ第2の境界日の日付よりも前の期間を週単位の集計期間とし、G−PSI計画データ13bのうち当該集計期間におけるPSIを読み出す(ステップS109)。そして、集計部17aは、集計期間を週単位のタイムバケットの時間枠に区切った上で各時間枠のPSIを週単位に集計する(ステップS110)。 Subsequently, the totaling
さらに、集計部17aは、第2の境界日を開始日とし、PSI表の時間軸の起点日から所定の期間後の日付、例えば半期である6ヶ月後の日付を含む月の末日を終了日とする期間を月単位の集計期間に設定した上で集計期間のPSIを読み出す(ステップS111)。そして、集計部17aは、集計期間を月単位のバケットサイズの時間枠に区切った上で各時間枠のPSIを月単位に集計する(ステップS112)。 Further, the
その後、タイムバケットのサイズが週単位または月単位に満たない端数の時間枠が存在する場合(ステップS113肯定)には、表示設定部17bは、端数の時間枠の表示設定を他の時間枠の表示設定を異なる表示設定に変更する(ステップS114)。なお、タイムバケットのサイズが週単位または月単位に満たない端数の時間枠が存在しない場合(ステップS113否定)には、ステップS114をとばしてステップS115へ移行する。 After that, when there is a fractional time frame whose time bucket size is less than weekly or monthly (Yes in step S113), the display setting unit 17b sets the display setting of the fractional time frame to other time frames. The display setting is changed to a different display setting (step S114). If there is no fractional time frame in which the size of the time bucket is less than weekly or monthly (No at step S113), the process skips step S114 and proceeds to step S115.
そして、表示設定部17bは、先に設定した表示設定にしたがって、集計部17aによって日単位、週単位および月単位に集計されたPSIからテーブル形式のPSI表を生成し(ステップS115)、処理を終了する。 Then, the display setting unit 17b generates a PSI table in a table format from the PSI aggregated in units of days, weeks, and months by the
[実施例1の効果]
上述してきたように、本実施例に係る生産管理サーバ10は、企業等の組織が稼働を開始する曜日に対応する日付の選択を誘導する画面を介して選択させた日付を境界に、製品の生産予定量のタイムバケットを日単位から週単位へ変更して生産計画表を生成する。このため、本実施例に係る生産管理サーバ10では、生産予定量を含む図表が拠点3や本社5などの稼働が開始される曜日以外から週単位の生産予定量の表示が始まる事態を抑制できる。それゆえ、本実施例に係る生産管理サーバ10では、生産計画表から1週間の生産予定量を俯瞰できる。したがって、本実施例に係る生産管理サーバ10によれば、生産管理に有用な生産計画表を提供できる。[Effect of Example 1]
As described above, the production management server 10 according to the present embodiment uses the date selected through the screen for guiding the selection of the date corresponding to the day of the week when the organization such as a company starts operation as a boundary. The production schedule is generated by changing the time bucket of the production schedule from daily to weekly. For this reason, in the production management server 10 according to the present embodiment, it is possible to suppress a situation in which the display of the scheduled production quantity starts on a weekly basis other than the day on which the chart including the production schedule quantity starts operation of the base 3 or the
さて、これまで開示の装置に関する実施例について説明したが、本発明は上述した実施例以外にも、種々の異なる形態にて実施されてよいものである。そこで、以下では、本発明に含まれる他の実施例を説明する。 Although the embodiments related to the disclosed apparatus have been described above, the present invention may be implemented in various different forms other than the above-described embodiments. Therefore, another embodiment included in the present invention will be described below.
[シークバーの応用例1]
上記の実施例1では、第1の境界日を選択させるシークバーと第2の境界日を選択させるシークバーとを2つに分けて拠点端末30や本社端末50に表示させる場合を例示したが、開示の装置は、2つのシークバーを1つにまとめて表示させることもできる。[Application example 1 of seek bar]
In the first embodiment, the case where the seek bar for selecting the first boundary date and the seek bar for selecting the second boundary date are divided into two parts and displayed on the
図9は、シークバーの応用例1を示す図である。図9に示すシークバー400においては、スライドバー410上にあるスライダ420Aの位置をスライドさせることによって第1の境界日が選択され、スライダ420Bの位置をスライドさせることによって第2の境界日が選択される。 FIG. 9 is a diagram illustrating a first application example of the seek bar. In the seek
ここで、シークバー400では、PSI表の時間軸の起点日からスライダ420Aまでの区間と、スライダ420A及びスライダ420Bの区間と、スライダ420Bから終端までの区間との間で目盛りの粒度が異なる。すなわち、PSI表の時間軸の起点日からスライダ420Aまでの区間の目盛りの粒度が「日」、スライダ420A及びスライダ420Bの区間の目盛りの粒度が「週」、ライダ420Bから終端までの区間の目盛りの粒度が「月」で表示される。 Here, in the seek
このとき、スライドバー410上でスライダ420Aが左方向にスライドされた場合には、スライダ420A及びスライダ420Bの区間が広がる。この場合には、スライダ420Aがスライドされた分、スライダ420A及びスライダ420Bの区間の目盛りの幅を広げる表示を行うことによってシークバー400上でスケールの矛盾が発生するのを防ぐことができる。また、スライドバー410上でスライダ420Aが右方向にスライドされた場合には、スライダ420A及びスライダ420Bの区間が狭まる。この場合には、スライダ420Aがスライドされた分、スライダ420A及びスライダ420Bの区間の目盛りの幅を狭める表示を実行すればよい。なお、上記の目盛りの調節制御は、スライダ420Bがスライドされた場合にも同様のロジックで実行される。 At this time, when the
このように、スライダバー410上の目盛りの粒度をスライダ420A及びスライダ420Bを区切りとして変更することで、1つのシークバー400上で第1の境界日および第2の境界日の両方を受け付けることができる。 Thus, by changing the granularity of the scale on the
[シークバーの応用例2]
また、開示の装置は、第1の境界日を選択させるシークバーと第2の境界日を選択させるシークバーとの2つのシークバーを用いる場合に、互いのシークバーのスライダをリンクさせて表示させることもできる。[Application example 2 of seek bar]
In addition, in the case of using two seek bars, that is, a seek bar for selecting the first boundary date and a seek bar for selecting the second boundary date, the disclosed apparatus can also display the linked sliders of the seek bars of each other. .
図10A及び図10Bは、シークバーの応用例2を示す図である。図10A及び図10Bに示すシークバー500においては、スライドバー510A上にあるスライダ520Aの位置をスライドさせることによって第1の境界日が選択され、スライドバー510B上にあるスライダ520Bの位置をスライドさせることによって第2の境界日が選択される。なお、上記のシークバー500では、スライドバー510Aの目盛りの幅よりもスライドバー510Bの目盛りの幅を広く表示させるのが好ましい。 10A and 10B are diagrams showing an application example 2 of the seek bar. In the seek
ここで、かかるシークバー500では、スライドバー510A上にあるスライダ520Aの位置と、スライドバー510Bの起点の位置とがリンクされている。すなわち、スライダ520Aの位置に合わせてスライドバー510Bの起点もスライドする。例えば、図10Aに示すように、スライドバー510A上の8月22日の位置にスライダ520Aがある状態から、図10Bに示すように、スライダ520Aがスライドバー510Aの8月15日にスライドされた場合を想定する。この場合には、スライドバー510Bの起点も8月15日の位置までスライドされる。 Here, in the seek
このように、スライドバー510A上にあるスライダ520Aの位置とスライドバー510Bの起点の位置とをリンクさせることによって、生産部門の担当者は、1つの選択画面上で第1の境界日および第2の境界日の両方を受け付けることが可能になる。 In this way, by linking the position of the
[分散および統合]
また、図示した各装置の各構成要素は、必ずしも物理的に図示の如く構成されていることを要しない。すなわち、各装置の分散・統合の具体的形態は図示のものに限られず、その全部または一部を、各種の負荷や使用状況などに応じて、任意の単位で機能的または物理的に分散・統合して構成することができる。例えば、受付部15a、画面表示部15bまたは生成部17を生産管理サーバ10の外部装置としてネットワーク経由で接続するようにしてもよい。また、受付部15a、画面表示部15bまたは生成部17を別の装置がそれぞれ有し、ネットワーク接続されて協働することで、上記の生産管理サーバ10の機能を実現するようにしてもよい。[Distribution and integration]
In addition, each component of each illustrated apparatus does not necessarily need to be physically configured as illustrated. In other words, the specific form of distribution / integration of each device is not limited to that shown in the figure, and all or a part thereof may be functionally or physically distributed or arbitrarily distributed in arbitrary units according to various loads or usage conditions. Can be integrated and configured. For example, the
[図表生成プログラム]
また、上記の実施例で説明した各種の処理は、予め用意されたプログラムをパーソナルコンピュータやワークステーションなどのコンピュータで実行することによって実現することができる。そこで、以下では、図11を用いて、上記の実施例と同様の機能を有する図表生成プログラムを実行するコンピュータの一例について説明する。[Chart generation program]
The various processes described in the above embodiments can be realized by executing a prepared program on a computer such as a personal computer or a workstation. Therefore, in the following, an example of a computer that executes a chart generation program having the same function as that of the above embodiment will be described with reference to FIG.
図11は、実施例1及び実施例2に係る図表生成プログラムを実行するコンピュータの一例について説明するための図である。図11に示すように、コンピュータ100は、操作部110aと、スピーカ110bと、カメラ110cと、ディスプレイ120と、通信部130とを有する。さらに、このコンピュータ100は、CPU150と、ROM160と、HDD170と、RAM180と有する。これら110〜180の各部はバス140を介して接続される。 FIG. 11 is a diagram for explaining an example of a computer that executes the chart generation program according to the first embodiment and the second embodiment. As illustrated in FIG. 11, the
HDD170には、図11に示すように、上記の実施例1で示した受付部15aと、画面表示部15bと、生成部17と同様の機能を発揮する図表生成プログラム170aが予め記憶される。この図表生成プログラム170aについては、図2に示した各々の受付部15a、画面表示部15b及び生成部17の各構成要素と同様、適宜統合又は分離しても良い。すなわち、HDD170に格納される各データは、常に全てのデータがHDD170に格納される必要はなく、処理に必要なデータのみがHDD170に格納されれば良い。 As shown in FIG. 11, the HDD 170 stores in advance a
そして、CPU150が、図表生成プログラム170aをHDD170から読み出してRAM180に展開する。これによって、図11に示すように、図表生成プログラム170aは、図表生成プロセス180aとして機能する。この図表生成プロセス180aは、HDD170から読み出した各種データを適宜RAM180上の自身に割り当てられた領域に展開し、この展開した各種データに基づいて各種処理を実行する。なお、図表生成プロセス180aは、図2に示した受付部15a、画面表示部15b及び生成部17にて実行される処理、例えば図8に示す処理を含む。また、CPU150上で仮想的に実現される各処理部は、常に全ての処理部がCPU150上で動作する必要はなく、処理に必要な処理部のみが仮想的に実現されれば良い。 Then, the
なお、上記の図表生成プログラム170aについては、必ずしも最初からHDD170やROM160に記憶させておく必要はない。例えば、コンピュータ100に挿入されるフレキシブルディスク、いわゆるFD、CD−ROM、DVDディスク、光磁気ディスク、ICカードなどの「可搬用の物理媒体」に各プログラムを記憶させる。そして、コンピュータ100がこれらの可搬用の物理媒体から各プログラムを取得して実行するようにしてもよい。また、公衆回線、インターネット、LAN、WANなどを介してコンピュータ100に接続される他のコンピュータまたはサーバ装置などに各プログラムを記憶させておき、コンピュータ100がこれらから各プログラムを取得して実行するようにしてもよい。 Note that the above
1 生産管理システム
3A,3B,3C 拠点
5 本社
7 ネットワーク
10 生産管理サーバ
11 通信I/F部
13 記憶部
13a 曜日データ
13b G−PSI計画データ
13c L−PSI計画データ
15 制御部
15a 受付部
15b 画面表示部
17 生成部
17a 集計部
17b 表示設定部
30A,30B,30C 拠点端末
50 本社端末DESCRIPTION OF SYMBOLS 1
Claims (7)
Translated fromJapanese製品の生産量に関する図表の生成要求を受け付け、
前記生成要求が受け付けられた日以降の日付のうち、曜日を記憶する曜日記憶部に記憶された曜日に対応する日付の選択を誘導する選択画面を要求元の装置に表示させ、
日単位に製品の生産量を記憶する生産量記憶部に記憶された生産量を用いて、前記選択画面を介して選択された日付を境界に前記生産量のタイムバケットを日単位から週単位へ変更すると共に、タイムバケットが週単位に満たない時間枠の生産量を週単位と同一のタイムバケットを持つ時間枠の生産量の表示態様とは異なる表示態様にして図表を生成する
処理を実行させることを特徴とする図表生成プログラム。On the computer,
Accepts a request to generate a chart related to product production volume,
Of the dates after the date when the generation request is accepted, a selection screen for guiding the selection of the date corresponding to the day of the week stored in the day of the week storage unit that stores the day of the week is displayed on the request source device,
Using the production quantity stored in the production quantity storage unit that stores the production quantity of the product on a daily basis, the production time bucket is changed from the daily unit to the weekly unit on the date selected via the selection screen. Execute the process to generate a chart witha display mode that is different from the display mode of the production volume of the time frame that has the same time bucket as the weekly unit. A program for generating a chart.
シークバーのスライダバー上に表示されるスライダであって前記曜日に対応する日付の位置に停止可能なスライダを含む選択画面を前記要求元の装置に表示させることを特徴とする請求項1に記載の図表生成プログラム。As a process for displaying the selection screen,
The selection screen including a slider that is displayed on a slider bar of a seek bar and can be stopped at a date position corresponding to the day of the week is displayed on the request source device. Chart generator.
前記生成要求が受け付けられた日以降の日付のうち、前記選択画面を介して選択される日付以降であって前記曜日に対応する日付または月の初日の日付のいずれかの選択を誘導する選択画面を要求元の装置にさらに表示させ、
前記図表を生成する処理として、
前記要求元の装置によって選択された日付を境界に、前記生産量のタイムバケットを週単位から月単位へさらに変更して図表を生成することを特徴とする請求項1または2に記載の図表生成プログラム。As a process for displaying the selection screen,
A selection screen that guides selection of either the date corresponding to the day of the week or the date of the first day of the month after the date selected via the selection screen from the date after the date when the generation request is accepted On the requesting device,
As a process of generating the chart,
3. The chart generation according to claim 1, wherein the chart is generated by further changing the time bucket of the production volume from a week unit to a month unit on the date selected by the requesting device. program.
シークバーのスライダバー上に表示されるスライダであって前記曜日に対応する日付または前記月の初日の日付のいずれかの位置に停止可能なスライダを含む選択画面を前記要求元の装置に表示させることを特徴とする請求項3に記載の図表生成プログラム。As a process for displaying the selection screen,
Causing the requesting device to display a selection screen including a slider displayed on a seek bar slider bar that can be stopped at either the date corresponding to the day of the week or the date of the first day of the month. The diagram generation program according to claim 3.
前記曜日に対応する日付または前記月の初日の日付のいずれかが選択された場合に、タイムバケットが前記月単位に満たない時間枠の生産量を前記月単位と同一のタイムバケットを持つ時間枠の生産量とは異なる表示態様にして図表を生成することを特徴とする請求項3または4に記載の図表生成プログラム。As a process of generating the chart,
If any date on the first day of the date or the month corresponding to the days of the week is selected, having the same time bucketbefore Kitsukiunits production time frame which time bucketis less thanbefore Kitsuki unit The diagram generation program according to claim 3 or 4, wherein the diagram is generated in a display mode different from the production amount of the time frame.
製品の生産量に関する図表の生成要求を受け付け、
前記生成要求が受け付けられた日以降の日付のうち、曜日を記憶する曜日記憶部に記憶された曜日に対応する日付の選択を誘導する選択画面を要求元の装置に表示させ、
日単位に製品の生産量を記憶する生産量記憶部に記憶された生産量を用いて、前記選択画面を介して選択された日付を境界に前記生産量のタイムバケットを日単位から週単位へ変更すると共に、タイムバケットが週単位に満たない時間枠の生産量を週単位と同一のタイムバケットを持つ時間枠の生産量の表示態様とは異なる表示態様にして図表を生成する
処理を実行することを特徴とする図表生成方法。Computer
Accepts a request to generate a chart related to product production volume,
Of the dates after the date when the generation request is accepted, a selection screen for guiding the selection of the date corresponding to the day of the week stored in the day of the week storage unit that stores the day of the week is displayed on the request source device,
Using the production quantity stored in the production quantity storage unit that stores the production quantity of the product on a daily basis, the production time bucket is changed from the daily unit to the weekly unit on the date selected via the selection screen. Execute the process to generate a chart witha display mode that is different from the display mode of the production volume of the time frame that has the same time bucket as the weekly unit. A diagram generation method characterized by:
日単位に製品の生産量を記憶する生産量記憶部と、
製品の生産量に関する図表の生成要求を受け付ける受付部と、
前記生成要求が受け付けられた日以降の日付のうち、前記曜日記憶部に記憶された曜日に対応する日付の選択を誘導する選択画面を要求元の装置に表示させる画面表示部と、
前記生産量記憶部に記憶された生産量を用いて、前記選択画面を介して選択された日付を境界に前記生産量のタイムバケットを日単位から週単位へ変更すると共に、タイムバケットが週単位に満たない時間枠の生産量を週単位と同一のタイムバケットを持つ時間枠の生産量の表示態様とは異なる表示態様にして図表を生成する生成部と
を有することを特徴とする図表生成装置。A day of the week storage section for storing the day of the week;
A production volume storage unit for storing the production volume of products in units of days;
A reception unit that accepts a request to generate a chart relating to the production volume of the product;
A screen display unit for displaying a selection screen for guiding selection of a date corresponding to a day of the week stored in the day of week storage unit among dates after the date when the generation request is received;
Using the production volume stored in the production volume storage unit, the time bucket of the production volume is changed from daily to weekly on the date selected via the selection screen, and the time bucket is changedto weekly. A generation unit that generates a chart with adisplay mode different from the display mode of the production volume of a time frame having the same time bucket as a weekly unit. apparatus.
Priority Applications (3)
| Application Number | Priority Date | Filing Date | Title |
|---|---|---|---|
| JP2012015691AJP5884515B2 (en) | 2012-01-27 | 2012-01-27 | Chart generation program, chart generation method, and chart generation apparatus |
| US13/735,167US20130197685A1 (en) | 2012-01-27 | 2013-01-07 | Medium storing diagram generation program, diagram generation method, and diagram generation apparatus |
| CN201310026176XACN103226747A (en) | 2012-01-27 | 2013-01-18 | Diagram generation method, and diagram generation apparatus |
Applications Claiming Priority (1)
| Application Number | Priority Date | Filing Date | Title |
|---|---|---|---|
| JP2012015691AJP5884515B2 (en) | 2012-01-27 | 2012-01-27 | Chart generation program, chart generation method, and chart generation apparatus |
Publications (2)
| Publication Number | Publication Date |
|---|---|
| JP2013156763A JP2013156763A (en) | 2013-08-15 |
| JP5884515B2true JP5884515B2 (en) | 2016-03-15 |
Family
ID=48837187
Family Applications (1)
| Application Number | Title | Priority Date | Filing Date |
|---|---|---|---|
| JP2012015691AExpired - Fee RelatedJP5884515B2 (en) | 2012-01-27 | 2012-01-27 | Chart generation program, chart generation method, and chart generation apparatus |
Country Status (3)
| Country | Link |
|---|---|
| US (1) | US20130197685A1 (en) |
| JP (1) | JP5884515B2 (en) |
| CN (1) | CN103226747A (en) |
Families Citing this family (33)
| Publication number | Priority date | Publication date | Assignee | Title |
|---|---|---|---|---|
| JP2015197691A (en)* | 2014-03-31 | 2015-11-09 | 富士通株式会社 | Production plan display program, production plan support program, production plan display method, production plan support method, production plan display device and production plan support device |
| US10433112B2 (en) | 2017-02-22 | 2019-10-01 | Middle Chart, LLC | Methods and apparatus for orienteering |
| US12400048B2 (en) | 2020-01-28 | 2025-08-26 | Middle Chart, LLC | Methods and apparatus for two dimensional location based digital content |
| US11468209B2 (en) | 2017-02-22 | 2022-10-11 | Middle Chart, LLC | Method and apparatus for display of digital content associated with a location in a wireless communications area |
| US11900021B2 (en) | 2017-02-22 | 2024-02-13 | Middle Chart, LLC | Provision of digital content via a wearable eye covering |
| US10740502B2 (en) | 2017-02-22 | 2020-08-11 | Middle Chart, LLC | Method and apparatus for position based query with augmented reality headgear |
| US11436389B2 (en) | 2017-02-22 | 2022-09-06 | Middle Chart, LLC | Artificial intelligence based exchange of geospatial related digital content |
| US10733334B2 (en) | 2017-02-22 | 2020-08-04 | Middle Chart, LLC | Building vital conditions monitoring |
| US10984146B2 (en) | 2017-02-22 | 2021-04-20 | Middle Chart, LLC | Tracking safety conditions of an area |
| US11475177B2 (en) | 2017-02-22 | 2022-10-18 | Middle Chart, LLC | Method and apparatus for improved position and orientation based information display |
| US11900023B2 (en) | 2017-02-22 | 2024-02-13 | Middle Chart, LLC | Agent supportable device for pointing towards an item of interest |
| US10740503B1 (en) | 2019-01-17 | 2020-08-11 | Middle Chart, LLC | Spatial self-verifying array of nodes |
| US11481527B2 (en) | 2017-02-22 | 2022-10-25 | Middle Chart, LLC | Apparatus for displaying information about an item of equipment in a direction of interest |
| US10467353B2 (en)* | 2017-02-22 | 2019-11-05 | Middle Chart, LLC | Building model with capture of as built features and experiential data |
| US11507714B2 (en) | 2020-01-28 | 2022-11-22 | Middle Chart, LLC | Methods and apparatus for secure persistent location based digital content |
| US10628617B1 (en) | 2017-02-22 | 2020-04-21 | Middle Chart, LLC | Method and apparatus for wireless determination of position and orientation of a smart device |
| US10824774B2 (en) | 2019-01-17 | 2020-11-03 | Middle Chart, LLC | Methods and apparatus for healthcare facility optimization |
| US10872179B2 (en) | 2017-02-22 | 2020-12-22 | Middle Chart, LLC | Method and apparatus for automated site augmentation |
| US11194938B2 (en) | 2020-01-28 | 2021-12-07 | Middle Chart, LLC | Methods and apparatus for persistent location based digital content |
| US10949579B2 (en) | 2017-02-22 | 2021-03-16 | Middle Chart, LLC | Method and apparatus for enhanced position and orientation determination |
| US10268782B1 (en) | 2017-02-22 | 2019-04-23 | Middle Chart, LLC | System for conducting a service call with orienteering |
| US10902160B2 (en) | 2017-02-22 | 2021-01-26 | Middle Chart, LLC | Cold storage environmental control and product tracking |
| US12086507B2 (en) | 2017-02-22 | 2024-09-10 | Middle Chart, LLC | Method and apparatus for construction and operation of connected infrastructure |
| US12314638B2 (en) | 2017-02-22 | 2025-05-27 | Middle Chart, LLC | Methods and apparatus for secure persistent location based digital content associated with a three-dimensional reference |
| US11625510B2 (en) | 2017-02-22 | 2023-04-11 | Middle Chart, LLC | Method and apparatus for presentation of digital content |
| US10620084B2 (en) | 2017-02-22 | 2020-04-14 | Middle Chart, LLC | System for hierarchical actions based upon monitored building conditions |
| US10831945B2 (en) | 2017-02-22 | 2020-11-10 | Middle Chart, LLC | Apparatus for operation of connected infrastructure |
| US11054335B2 (en) | 2017-02-22 | 2021-07-06 | Middle Chart, LLC | Method and apparatus for augmented virtual models and orienteering |
| US10671767B2 (en) | 2017-02-22 | 2020-06-02 | Middle Chart, LLC | Smart construction with automated detection of adverse structure conditions and remediation |
| US10776529B2 (en) | 2017-02-22 | 2020-09-15 | Middle Chart, LLC | Method and apparatus for enhanced automated wireless orienteering |
| US10762251B2 (en) | 2017-02-22 | 2020-09-01 | Middle Chart, LLC | System for conducting a service call with orienteering |
| CN109284277B (en)* | 2018-07-16 | 2023-11-28 | 广东省土地调查规划院 | Data leveling method for summary form, electronic equipment and storage medium |
| US11640486B2 (en) | 2021-03-01 | 2023-05-02 | Middle Chart, LLC | Architectural drawing based exchange of geospatial related digital content |
Family Cites Families (12)
| Publication number | Priority date | Publication date | Assignee | Title |
|---|---|---|---|---|
| US5128860A (en)* | 1989-04-25 | 1992-07-07 | Motorola, Inc. | Manufacturing or service system allocating resources to associated demands by comparing time ordered arrays of data |
| EP0770967A3 (en)* | 1995-10-26 | 1998-12-30 | Koninklijke Philips Electronics N.V. | Decision support system for the management of an agile supply chain |
| US6012051A (en)* | 1997-02-06 | 2000-01-04 | America Online, Inc. | Consumer profiling system with analytic decision processor |
| JP2000047712A (en)* | 1998-07-31 | 2000-02-18 | Nec Corp | Demand display method enabling multiple buckets |
| US7225040B2 (en)* | 2001-11-14 | 2007-05-29 | Exxon Mobil Oil Corporation | Method and system for reducing lead-time in the packaging industry |
| US7831971B2 (en)* | 2005-10-24 | 2010-11-09 | International Business Machines Corporation | Method and apparatus for presenting a visualization of processor capacity and network availability based on a grid computing system simulation |
| US7921030B1 (en)* | 2006-04-04 | 2011-04-05 | SignalDemand, Inc. | Profit optimization system for supply chains with limited parts availability |
| EP2076874A4 (en)* | 2006-05-13 | 2011-03-09 | Sap Ag | DERIVED CONSISTENT SET OF INTERFACES DERIVED FROM A BUSINESS OBJECT MODEL |
| US7921061B2 (en)* | 2007-09-05 | 2011-04-05 | Oracle International Corporation | System and method for simultaneous price optimization and asset allocation to maximize manufacturing profits |
| US20100088153A1 (en)* | 2008-04-08 | 2010-04-08 | Plan4Demand Solutions, Inc. | Demand curve analysis method for demand planning |
| US7970728B2 (en)* | 2008-10-23 | 2011-06-28 | International Business Machines Corporation | Dynamically building and populating data marts with data stored in repositories |
| JP2011096108A (en)* | 2009-10-30 | 2011-05-12 | Hitachi Ltd | System and program for supporting decision making for change of production plan |
- 2012
- 2012-01-27JPJP2012015691Apatent/JP5884515B2/ennot_activeExpired - Fee Related
- 2013
- 2013-01-07USUS13/735,167patent/US20130197685A1/ennot_activeAbandoned
- 2013-01-18CNCN201310026176XApatent/CN103226747A/enactivePending
Also Published As
| Publication number | Publication date |
|---|---|
| CN103226747A (en) | 2013-07-31 |
| JP2013156763A (en) | 2013-08-15 |
| US20130197685A1 (en) | 2013-08-01 |
Similar Documents
| Publication | Publication Date | Title |
|---|---|---|
| JP5884515B2 (en) | Chart generation program, chart generation method, and chart generation apparatus | |
| US20160232461A1 (en) | System and method for determining forecast errors for merchandise in retail | |
| CN105488177A (en) | Visual presentation method and system of data | |
| US20160196532A1 (en) | System and method for project status staleness, correlation, and rollup | |
| JP2020077212A (en) | Area usage planning system, area usage planning method, and area usage planning device | |
| JP2019113965A (en) | Financing management device, financing management method, and financing management program | |
| JP5811867B2 (en) | Graph generation program, graph generation method, and production management apparatus | |
| Çelebi et al. | Γ-Robust electricity market equilibrium models with transmission and generation investments | |
| CN118657472B (en) | Material procurement plan information adjustment method and device | |
| CN106560850B (en) | Plan generation device and plan generation method | |
| JP2011237923A (en) | Information processor, cost forecast calculation method and cost forecast calculation program | |
| CN107391533A (en) | Generate the method and device of graphic data base Query Result | |
| JP4810890B2 (en) | Measure decision support device, method and program | |
| CN117439727A (en) | Resource processing method based on block chain and related equipment | |
| CN117874384A (en) | Site content publishing management method, device, computer equipment and storage medium | |
| CN116974445A (en) | Information display method, information display device, electronic equipment and storage medium | |
| US20160140585A1 (en) | System and method for managing extra calendar periods in retail | |
| CN110413597A (en) | Digital engineering cost inventory constructs the method, system and medium of main material list automatically | |
| Cai et al. | Production planning and scheduling: Interaction and coordination | |
| CN109300043A (en) | The generation method and device of line chart | |
| JP6147766B2 (en) | Equipment investment scenario providing apparatus and method | |
| JP2013178669A (en) | Tabulation device and tabulation program | |
| JP5037449B2 (en) | Production plan support device, production plan support program, production plan support method | |
| JP6409888B2 (en) | Aggregation device and aggregation program | |
| JP6680500B2 (en) | Fund management support apparatus and fund management support method |
Legal Events
| Date | Code | Title | Description |
|---|---|---|---|
| A621 | Written request for application examination | Free format text:JAPANESE INTERMEDIATE CODE: A621 Effective date:20141007 | |
| A131 | Notification of reasons for refusal | Free format text:JAPANESE INTERMEDIATE CODE: A131 Effective date:20150707 | |
| A977 | Report on retrieval | Free format text:JAPANESE INTERMEDIATE CODE: A971007 Effective date:20150709 | |
| A521 | Request for written amendment filed | Free format text:JAPANESE INTERMEDIATE CODE: A523 Effective date:20150907 | |
| TRDD | Decision of grant or rejection written | ||
| A01 | Written decision to grant a patent or to grant a registration (utility model) | Free format text:JAPANESE INTERMEDIATE CODE: A01 Effective date:20160112 | |
| A61 | First payment of annual fees (during grant procedure) | Free format text:JAPANESE INTERMEDIATE CODE: A61 Effective date:20160125 | |
| R150 | Certificate of patent or registration of utility model | Ref document number:5884515 Country of ref document:JP Free format text:JAPANESE INTERMEDIATE CODE: R150 | |
| LAPS | Cancellation because of no payment of annual fees |