JP5704651B2 - Biological state estimation device, biological state estimation system, and computer program - Google Patents
Biological state estimation device, biological state estimation system, and computer programDownload PDFInfo
- Publication number
- JP5704651B2 JP5704651B2JP2011536174AJP2011536174AJP5704651B2JP 5704651 B2JP5704651 B2JP 5704651B2JP 2011536174 AJP2011536174 AJP 2011536174AJP 2011536174 AJP2011536174 AJP 2011536174AJP 5704651 B2JP5704651 B2JP 5704651B2
- Authority
- JP
- Japan
- Prior art keywords
- frequency
- state
- time series
- biological signal
- time
- Prior art date
- Legal status (The legal status is an assumption and is not a legal conclusion. Google has not performed a legal analysis and makes no representation as to the accuracy of the status listed.)
- Active
Links
Images


Classifications
- A—HUMAN NECESSITIES
- A61—MEDICAL OR VETERINARY SCIENCE; HYGIENE
- A61B—DIAGNOSIS; SURGERY; IDENTIFICATION
- A61B5/00—Measuring for diagnostic purposes; Identification of persons
- A61B5/16—Devices for psychotechnics; Testing reaction times ; Devices for evaluating the psychological state
- A61B5/18—Devices for psychotechnics; Testing reaction times ; Devices for evaluating the psychological state for vehicle drivers or machine operators
- A—HUMAN NECESSITIES
- A61—MEDICAL OR VETERINARY SCIENCE; HYGIENE
- A61B—DIAGNOSIS; SURGERY; IDENTIFICATION
- A61B5/00—Measuring for diagnostic purposes; Identification of persons
- A61B5/40—Detecting, measuring or recording for evaluating the nervous system
- A61B5/4029—Detecting, measuring or recording for evaluating the nervous system for evaluating the peripheral nervous systems
- A61B5/4035—Evaluating the autonomic nervous system
- A—HUMAN NECESSITIES
- A61—MEDICAL OR VETERINARY SCIENCE; HYGIENE
- A61B—DIAGNOSIS; SURGERY; IDENTIFICATION
- A61B5/00—Measuring for diagnostic purposes; Identification of persons
- A61B5/48—Other medical applications
- A61B5/4806—Sleep evaluation
- A61B5/4809—Sleep detection, i.e. determining whether a subject is asleep or not
- A—HUMAN NECESSITIES
- A61—MEDICAL OR VETERINARY SCIENCE; HYGIENE
- A61B—DIAGNOSIS; SURGERY; IDENTIFICATION
- A61B5/00—Measuring for diagnostic purposes; Identification of persons
- A61B5/72—Signal processing specially adapted for physiological signals or for diagnostic purposes
- A61B5/7235—Details of waveform analysis
- A61B5/7239—Details of waveform analysis using differentiation including higher order derivatives
- A—HUMAN NECESSITIES
- A61—MEDICAL OR VETERINARY SCIENCE; HYGIENE
- A61B—DIAGNOSIS; SURGERY; IDENTIFICATION
- A61B5/00—Measuring for diagnostic purposes; Identification of persons
- A61B5/68—Arrangements of detecting, measuring or recording means, e.g. sensors, in relation to patient
- A61B5/6887—Arrangements of detecting, measuring or recording means, e.g. sensors, in relation to patient mounted on external non-worn devices, e.g. non-medical devices
- A61B5/6893—Cars
- A—HUMAN NECESSITIES
- A61—MEDICAL OR VETERINARY SCIENCE; HYGIENE
- A61B—DIAGNOSIS; SURGERY; IDENTIFICATION
- A61B5/00—Measuring for diagnostic purposes; Identification of persons
- A61B5/72—Signal processing specially adapted for physiological signals or for diagnostic purposes
- A61B5/7235—Details of waveform analysis
- A61B5/7242—Details of waveform analysis using integration
- A—HUMAN NECESSITIES
- A61—MEDICAL OR VETERINARY SCIENCE; HYGIENE
- A61B—DIAGNOSIS; SURGERY; IDENTIFICATION
- A61B5/00—Measuring for diagnostic purposes; Identification of persons
- A61B5/74—Details of notification to user or communication with user or patient; User input means
- A61B5/742—Details of notification to user or communication with user or patient; User input means using visual displays
- A61B5/744—Displaying an avatar, e.g. an animated cartoon character
- B—PERFORMING OPERATIONS; TRANSPORTING
- B60—VEHICLES IN GENERAL
- B60W—CONJOINT CONTROL OF VEHICLE SUB-UNITS OF DIFFERENT TYPE OR DIFFERENT FUNCTION; CONTROL SYSTEMS SPECIALLY ADAPTED FOR HYBRID VEHICLES; ROAD VEHICLE DRIVE CONTROL SYSTEMS FOR PURPOSES NOT RELATED TO THE CONTROL OF A PARTICULAR SUB-UNIT
- B60W40/00—Estimation or calculation of non-directly measurable driving parameters for road vehicle drive control systems not related to the control of a particular sub unit, e.g. by using mathematical models
- B60W40/08—Estimation or calculation of non-directly measurable driving parameters for road vehicle drive control systems not related to the control of a particular sub unit, e.g. by using mathematical models related to drivers or passengers
- B60W2040/0872—Driver physiology
Landscapes
- Health & Medical Sciences (AREA)
- Life Sciences & Earth Sciences (AREA)
- Engineering & Computer Science (AREA)
- Animal Behavior & Ethology (AREA)
- Pathology (AREA)
- General Health & Medical Sciences (AREA)
- Surgery (AREA)
- Physics & Mathematics (AREA)
- Public Health (AREA)
- Biophysics (AREA)
- Veterinary Medicine (AREA)
- Biomedical Technology (AREA)
- Heart & Thoracic Surgery (AREA)
- Medical Informatics (AREA)
- Molecular Biology (AREA)
- Neurology (AREA)
- Psychiatry (AREA)
- Physiology (AREA)
- Educational Technology (AREA)
- Social Psychology (AREA)
- Child & Adolescent Psychology (AREA)
- Developmental Disabilities (AREA)
- Computer Vision & Pattern Recognition (AREA)
- Hospice & Palliative Care (AREA)
- Psychology (AREA)
- Artificial Intelligence (AREA)
- Neurosurgery (AREA)
- Signal Processing (AREA)
- Anesthesiology (AREA)
- Measurement Of The Respiration, Hearing Ability, Form, And Blood Characteristics Of Living Organisms (AREA)
- Measuring Pulse, Heart Rate, Blood Pressure Or Blood Flow (AREA)
- Auxiliary Drives, Propulsion Controls, And Safety Devices (AREA)
Description
Translated fromJapanese本発明は、人の上体から得られる生体信号の時系列波形を用いて生体の状態を推定する技術に関する。 The present invention relates to a technique for estimating a state of a living body using a time-series waveform of a biological signal obtained from a human upper body.
運転中の運転者の生体状態を監視することは、近年、事故予防策等として注目されている。本出願人は、特許文献1〜3において、シートクッション部に圧力センサを配置し、臀部脈波を採取して分析し、入眠予兆現象を判定する手法を開示している。 In recent years, monitoring the biological state of a driver during driving has attracted attention as an accident prevention measure or the like. In
具体的には、脈波の時系列波形を、それぞれ、SavitzkyとGolayによる平滑化微分法により、極大値と極小値を求める。そして、5秒ごとに極大値と極小値を切り分け、それぞれの平均値を求める。求めた極大値と極小値のそれぞれの平均値の差の二乗をパワー値とし、このパワー値を5秒ごとにプロットし、パワー値の時系列波形を作る。この時系列波形からパワー値の大域的な変化を読み取るために、ある時間窓Tw(180秒)について最小二乗法でパワー値の傾きを求める。次に、オーバーラップ時間Tl(162秒)で次の時間窓Twを同様に計算して結果をプロットする。この計算(移動計算)を順次繰り返してパワー値の傾きの時系列波形を得る。一方、脈波の時系列波形をカオス解析して最大リアプノフ指数を求め、上記と同様に、平滑化微分によって極大値を求め、移動計算することにより最大リアプノフ指数の傾きの時系列波形を得る。 Specifically, the maximum value and the minimum value of the time series waveform of the pulse wave are obtained by the smoothing differential method using Savitzky and Golay, respectively. Then, the maximum value and the minimum value are divided every 5 seconds, and the average value of each is obtained. The square of the difference between the average values of the obtained local maximum and local minimum is used as a power value, and this power value is plotted every 5 seconds to create a time series waveform of the power value. In order to read the global change of the power value from this time series waveform, the gradient of the power value is obtained by the least square method for a certain time window Tw (180 seconds). Next, the next time window Tw is similarly calculated at the overlap time Tl (162 seconds), and the result is plotted. This calculation (movement calculation) is sequentially repeated to obtain a time series waveform of the gradient of the power value. On the other hand, the maximum Lyapunov exponent is obtained by chaos analysis of the time series waveform of the pulse wave, the maximum value is obtained by smoothing differentiation, and the time series waveform of the gradient of the maximum Lyapunov exponent is obtained by moving calculation.
そして、パワー値の傾きの時系列波形と最大リアプノフ指数の傾きの時系列波形が逆位相となっており、さらには、パワー値の傾きの時系列波形で低周波、大振幅の波形が生じている波形を、入眠予兆を示す特徴的な信号と判定し、その後に振幅が小さくなったポイントを入眠点と判定している。 The time series waveform of the power value slope and the time series waveform of the maximum Lyapunov exponent slope are in opposite phase, and furthermore, the time series waveform of the power value slope has a low frequency and large amplitude waveform. The waveform is determined as a characteristic signal indicating a sleep onset sign, and the point at which the amplitude subsequently decreases is determined as the sleep onset point.
また、特許文献4として、内部に三次元立体編物を挿入した空気袋(エアパック)を備え、このエアパックを人の背部に対応する部位に配置し、エアパックの空気圧変動を測定し、得られた空気圧変動の時系列データから人の生体信号を検出し、人の生体の状態を分析するシステムを開示している。また、非特許文献1及び2においても、腰腸肋筋に沿うようにエアパックセンサを配置して人の生体信号を検出する試みを報告している。このエアパックの空気圧変動は、心臓の動きに伴う下行大動脈の揺れによるものであり、特許文献1及び2の臀部脈波を利用する場合よりも、心臓の動きにより近い状態変化を捉えることができる。 Further, as
また、出願人は、特許文献5として、パワー値の傾きの時系列信号を絶対値処理して積分値を算出し、その積分値を疲労度として求める技術を提案している。さらに、出願人は、特許文献6として、パワー値の時系列データを用いて主として肉体的な疲労度を求める手法にプラスして、最大リアプノフ指数の時系列データを用いた交感神経活動による疲労の代償作用を考慮することで、精神的疲労も加味した、より官能評価に近い疲労度を求める技術を提案している。 In addition, as a
特許文献1〜4及び非特許文献1〜2の技術は、上記したように、パワー値の傾きの時系列波形と最大リアプノフ指数の傾きの時系列波形が逆位相となり、かつ、パワー値の傾きの時系列波形で低周波、大振幅の波形が生じた時点をもって入眠予兆現象と捉えている。この手法によれば、人がシートに着席すれば、入眠予兆現象を捉えることができる。また、特許文献5,6によれば、人の疲労度を求めることができる。 As described above, the techniques of
しかし、入眠予兆現象が生じたか否かを波形の変化から判断するには熟練を要し、一般のドライバが波形変化を見て入眠予兆を判断することは困難である。このため、上記特許文献では、時系列波形の逆位相等が生じた時点で、何らかの警告装置(例えば、ブザー音、シートバックの振動など)を作動させて覚知させる手段を採用している。また、特許文献5,6の疲労度は、時間と共に疲労度が右肩上がりに増加していくグラフで判断するものである。従って、この場合も、例えば、このグラフを自動車に搭載したモニタに表示させたとして、各ドライバがそのグラフを見て自らの疲労の程度を把握するのは容易ではない。このグラフによる判定に慣れた者が見て判断すれば別であるが、そうでなければ、疲労度がある数値以上に至った時点等、何らかの変曲点において、音等の警告によりドライバに覚知させるしかない。 However, skill is required to determine whether or not the sleep onset phenomenon has occurred from the change in waveform, and it is difficult for a general driver to determine a sleep onset sign by looking at the waveform change. For this reason, the above-mentioned patent document employs a means for operating a warning device (for example, a buzzer sound, vibration of a seat back, etc.) to make a notice when an antiphase of a time series waveform occurs. Further, the fatigue levels of
また、従来の手法は、いずれも人の代謝変化に起因する状態を主として判定するものであった。つまり、時間経過と共に一方的に肉体が疲れていく過程を主として見ているものであった。しかし、緊張状態では、精神疲労の寄与率が高く、リラックス状態では肉体疲労が疲労の進行を支配すると考えられる。ところが、従来の手法では、脳機能の活性化による疲労の抑制が考慮されていない。一般的な運転環境下では、疲労の進行度合いに拘わらず、脳機能の活性化が生じる。この脳機能の活性化には創造性や好奇心などがあり、これらは覚醒誘導をもたらす。特許文献6のように、肉体的な疲労度を求める手法にプラスして、最大リアプノフ指数の時系列データを用いた交感神経活動による疲労の代償作用を考慮し、精神的疲労も加味した疲労度を求めているが、この場合でも、あくまで、一方的に増加していく疲労の過程、交感神経の代償作用を出力しているに過ぎず、脳機能が活性化しているか否かまでは捉えていない。 In addition, any of the conventional methods mainly determines a state caused by a human metabolic change. In other words, it was mainly looking at the process of unilaterally tiring the body over time. However, the contribution rate of mental fatigue is high in the tension state, and physical fatigue is considered to dominate the progress of fatigue in the relaxed state. However, in the conventional method, suppression of fatigue due to activation of brain function is not considered. Under a general driving environment, brain function is activated regardless of the degree of progress of fatigue. This activation of brain function includes creativity and curiosity, which lead to arousal induction. In addition to the method for obtaining physical fatigue level as in
本発明は上記に鑑みなされたものであり、自律神経の活動だけでなく脳機能の活性化状態も捉えることができると共に、表示手段を見るだけで人の恒常性維持機能レベルを視覚的に容易に把握でき、それにより疲労の進行度合いも把握できる生体状態推定装置、生体状態推定システム及びコンピュータプログラムを提供することを課題とする。 The present invention has been made in view of the above, and can capture not only the activity of the autonomic nerve but also the activation state of the brain function, and the human homeostasis maintenance function level can be easily visually recognized only by looking at the display means. It is an object of the present invention to provide a biological state estimation device, a biological state estimation system, and a computer program that can be grasped at the same time and thereby understand the degree of progress of fatigue.
上記課題を解決するため、本発明の生体状態推定装置は、生体信号測定手段により人の上体から採取した生体信号を用いて、人の状態を推定する生体状態推定装置であって、前記生体信号を分析して所定時点における人の恒常性維持機能レベルを複数の段階に区分して求める恒常性維持機能レベル演算手段と、前記恒常性維持機能レベルの各段階を縦軸に時間を横軸にとり、前記恒常性維持機能レベル演算手段により求められる恒常性維持機能レベルを時系列にプロットし、恒常性維持機能レベルのゆらぎ度合いを表示手段にグラフとして表示させる出力手段とを具備することを特徴とする。 In order to solve the above-described problem, the biological state estimation apparatus of the present invention is a biological state estimation device that estimates a human state using a biological signal collected from a human upper body by a biological signal measuring unit, A homeostasis maintenance function level calculation means for analyzing a signal and determining a person's homeostasis maintenance function level at a predetermined time by dividing into a plurality of stages, and each stage of the homeostasis function level is plotted on the vertical axis and time is plotted on the horizontal axis In addition, there is provided output means for plotting the homeostasis maintenance function level obtained by the homeostasis maintenance function level calculating means in time series and displaying the degree of fluctuation of the homeostasis maintenance function level as a graph on the display means. And
前記恒常性維持機能レベル演算手段は、恒常性維持機能レベルを高活性状態から機能低下状態まで3〜10段階の範囲で区分して求め、前記出力手段は、高活性状態を最上部とし、機能低下状態を最下部として縦軸に3〜10段階の範囲に区分して表示させることが好ましい。前記恒常性維持機能レベル演算手段は、恒常性維持機能レベルを高活性状態から機能低下状態まで5段階に区分して求め、前記出力手段は、高活性状態を最上部とし、機能低下状態を最下部として縦軸に5段階に区分して表示させることが好ましい。 The homeostasis maintenance function level calculation means obtains the homeostasis maintenance function level by dividing it in a range of 3 to 10 steps from the high activity state to the function decline state, and the output means has the high activity state as the top, It is preferable that the lowered state is displayed in the lowermost part by dividing it into a range of 3 to 10 steps on the vertical axis. The homeostasis maintenance function level calculation means obtains the homeostasis maintenance function level by dividing it into five stages from a high activity state to a function decline state, and the output means takes the high activity state as the top and the function decline state is the highest. The lower part is preferably displayed in five stages on the vertical axis.
前記出力手段により表示手段に表示されるグラフから、人の状態の変遷を判定する判定手段をさらに有することが好ましい。前記判定手段は、前記出力手段により表示手段に表示されるグラフに、恒常性維持機能レベルの2段階以上の急低下が所定回数以上生じた場合に異常状態と判定する異常状態判定手段を有することが好ましい。 It is preferable to further include a determination unit that determines a change in the state of the person from the graph displayed on the display unit by the output unit. The determination unit includes an abnormal state determination unit that determines an abnormal state when the graph displayed on the display unit by the output unit causes a sudden decrease of two or more levels of the homeostasis maintenance function to occur for a predetermined number of times. Is preferred.
前記恒常性維持機能レベル演算手段は、前記生体信号測定手段により得られる生体信号の周波数を求める周波数演算手段と、前記周波数演算手段により得られた前記生体信号の周波数から、所定のオーバーラップ時間で設定した所定の時間窓毎に前記周波数の傾きを求める移動計算を行い、時間窓毎に得られる前記周波数の傾きの時系列波形を求める周波数傾き時系列解析演算手段と、前記周波数傾き時系列解析演算手段により求めた前記周波数傾きの時系列波形を微分する微分手段と、前記周波数傾き時系列解析演算手段により求めた前記周波数傾きの時系列波形を積分する積分手段と、前記周波数傾き時系列解析演算手段により求めた前記周波数傾きの時系列波形の増減から方形波を求める方形波算出手段と、任意に設定した第1時間帯における前記周波数傾き時系列波形と前記第1時間帯よりも後の第2時間帯における前記周波数傾き時系列波形と間の記述関数及び記述関数振幅値を求める記述関数算出手段と、前記周波数演算手段により得られる、前記生体信号の時系列波形の極大値を用いた生体信号の周波数の時系列波形と、前記生体信号の時系列波形の正負が切り替わるゼロクロス地点を用いた生体信号の周波数の時系列波形とを用いて、前記周波数傾き時系列解析演算手段により求めた、それぞれの周波数傾きの時系列波形を絶対値処理する絶対値処理手段と、前記周波数傾き時系列解析演算手段により求めた前記周波数傾き、前記微分手段により求めた微分値、前記積分手段により求めた積分値、前記方形波算出手段により求めた方形波の正負、前記記述関数算出手段により求めた記述関数振幅値、及び前記絶対値処理手段により求めた周波数傾き時系列波形の2つの絶対値のうち、少なくとも1つ以上を用いて恒常性維持機能レベルの段階を求める恒常性維持機能段階算出手段とを具備してなることが好ましい。 The homeostasis maintenance function level calculation means includes a frequency calculation means for obtaining a frequency of the biological signal obtained by the biological signal measurement means, and a frequency of the biological signal obtained by the frequency calculation means with a predetermined overlap time. Frequency gradient time series analysis calculating means for calculating a time series waveform of the frequency gradient obtained for each time window, performing a movement calculation for obtaining the frequency gradient for each predetermined time window set, and the frequency gradient time series analysis Differentiating means for differentiating the time series waveform of the frequency slope obtained by the computing means, integrating means for integrating the time series waveform of the frequency slope obtained by the frequency slope time series analyzing means, and the frequency slope time series analysis A square wave calculating means for obtaining a square wave from the increase / decrease of the time-series waveform of the frequency gradient obtained by the computing means, and an arbitrarily set first time zone A description function calculating means for obtaining a description function and a description function amplitude value between the frequency slope time-series waveform and the frequency slope time-series waveform in a second time zone after the first time zone; and the frequency computing means The time series waveform of the frequency of the biological signal using the maximum value of the time series waveform of the biological signal obtained by the above, and the time series of the frequency of the biological signal using the zero cross point where the positive / negative of the time series waveform of the biological signal switches Using the waveform, the absolute value processing means for performing absolute value processing on the time series waveform of each frequency slope obtained by the frequency slope time series analysis computing means, and the frequency obtained by the frequency slope time series analysis computing means Slope, differential value obtained by the differentiating means, integral value obtained by the integrating means, positive / negative of the square wave obtained by the square wave calculating means, calculation of the description function Maintaining homeostasis for determining the level of the homeostasis function level using at least one of the two absolute values of the description function amplitude value obtained by the step and the frequency gradient time series waveform obtained by the absolute value processing means. It is preferable to comprise functional stage calculation means.
前記恒常性維持機能レベル演算手段により処理される前に、前記生体信号測定手段により得られる生体信号を、所定の周波数帯域でフィルタリングするフィルタリング手段をさらに有し、前記フィルタリング手段が、前記生体信号測定手段により測定した静的環境下における生体信号の平均周波数を求め、該平均周波数を基準値として、フィルタリングする周波数帯域を設定する構成であることが好ましい。 Before being processed by the homeostasis maintenance function level calculating means, it further has a filtering means for filtering the biological signal obtained by the biological signal measuring means in a predetermined frequency band, and the filtering means comprises the biological signal measurement. It is preferable that the average frequency of the biological signal in a static environment measured by the means is obtained, and the frequency band to be filtered is set using the average frequency as a reference value.
前記生体信号測定手段は、人の背部に当接され、心臓の動きによる大動脈の揺れに伴って圧力が変動するエアパックを備えてなり、前記恒常性維持機能レベル演算手段は、前記エアパックの圧力変動を分析対象の前記生体信号として用いることが好ましい。乗物に適用する場合、前記エアパックが、乗物用シートのシートバック部に装着されていることが好ましく、前記表示手段として車載用モニタを用いることができる。 The biological signal measuring means is provided with an air pack that is brought into contact with the back of a person and whose pressure fluctuates as the aorta shakes due to the movement of the heart. The homeostasis maintenance function level calculating means includes the air pack. It is preferable to use pressure fluctuation as the biological signal to be analyzed. When applied to a vehicle, the air pack is preferably attached to a seat back portion of a vehicle seat, and an in-vehicle monitor can be used as the display means.
また、本発明の生体状態推定システムは、人の上体から生体信号を採取する生体信号測定手段と、前記生体信号測定手段により採取した生体信号を用いて、人の状態を推定する生体状態推定装置とを備えた生体状態推定システムであって、前記生体状態推定装置は、前記生体信号を分析して所定時点における人の恒常性維持機能レベルを複数の段階に区分して求める恒常性維持機能レベル演算手段と、前記恒常性維持機能レベルの各段階を縦軸に時間を横軸にとり、前記恒常性維持機能レベル演算手段により求められる恒常性維持機能レベルを時系列にプロットし、恒常性維持機能レベルのゆらぎ度合いを表示手段にグラフとして表示させる出力手段とを具備することを特徴とする。 The biological state estimation system according to the present invention includes a biological signal measurement unit that collects a biological signal from a human upper body, and a biological state estimation that estimates a human state using the biological signal collected by the biological signal measurement unit. A living body state estimating system comprising: a homeostasis maintaining function for analyzing a living body signal and classifying a person's homeostasis maintaining function level at a predetermined time into a plurality of stages. The level calculation means and each stage of the homeostasis maintenance function level are plotted on the vertical axis and time is plotted on the horizontal axis, and the homeostasis maintenance function level obtained by the homeostasis maintenance function level calculation means is plotted in time series to maintain the homeostasis. And an output means for displaying the degree of fluctuation of the function level as a graph on the display means.
前記生体信号測定手段は、人の背部に当接され、心臓の動きによる大動脈の揺れに伴って圧力が変動するエアパックを備えてなり、前記恒常性維持機能レベル演算手段は、前記エアパックの圧力変動を分析対象の前記生体信号として用いることが好ましい。乗物に適用する場合、前記エアパックが、乗物用シートのシートバック部に装着されていることが好ましく、前記表示手段として車載用モニタを用いることができる。 The biological signal measuring means is provided with an air pack that is brought into contact with the back of a person and whose pressure fluctuates as the aorta shakes due to the movement of the heart. The homeostasis maintenance function level calculating means includes the air pack. It is preferable to use pressure fluctuation as the biological signal to be analyzed. When applied to a vehicle, the air pack is preferably attached to a seat back portion of a vehicle seat, and an in-vehicle monitor can be used as the display means.
また、本発明のコンピュータプログラムは、生体信号測定手段により人の上体から採取した生体信号を用いて、人の状態を推定する生体状態推定装置に、前記生体信号を分析して所定時点における人の恒常性維持機能レベルを複数の段階に区分して求める恒常性維持機能レベル演算ステップと、前記恒常性維持機能レベルの各段階を縦軸に時間を横軸にとり、前記恒常性維持機能レベル演算ステップにより求められる恒常性維持機能レベルを時系列にプロットして表示手段にグラフとして表示させる出力ステップとを実行させることを特徴とする。
The computer program of the present invention, by using the biological signal taken from human body by the biological signal measurement section,the biological condition estimating apparatus for estimating the state of aperson, a human at a given time point by analyzing the biological signal A homeostasis maintenance function level calculation step for dividing the homeostasis maintenance function level into a plurality of stages, and each stage of the homeostasis maintenance function level is plotted on the vertical axis and time is plotted on the horizontal axis. An output step isexecuted in which the constancy maintaining function level obtained by the step is plotted in time series and displayed on the display means as a graph.
前記出力ステップにより表示手段に表示されるグラフが折れ線グラフであることが好ましい。前記恒常性維持機能レベル演算ステップは、恒常性維持機能レベルを高活性状態から機能低下状態まで5段階に区分して求め、前記出力ステップは、高活性状態を最上部とし、機能低下状態を最下部として縦軸に5段階に区分して表示させることが好ましい。 It is preferable that the graph displayed on the display means by the output step is a line graph. The homeostasis maintenance function level calculating step is obtained by classifying the homeostasis maintenance function level into five stages from a highly active state to a reduced function state, and the output step includes the high active state as the top and the reduced function state at the highest. The lower part is preferably displayed in five stages on the vertical axis.
前記出力ステップにより表示手段に表示されるグラフから、人の状態の変遷を判定する判定ステップをさらに実行させることが好ましい。前記判定ステップにおいて、前記出力ステップにより表示手段に表示されるグラフに、恒常性維持機能レベルの2段階以上の低下が所定回数以上生じた場合に異常状態と判定する異常状態判定ステップを実行させることが好ましい。
It is preferable to furtherexecute a determination step of determining a change in the state of the person from the graph displayed on the display means by the output step. In the determination step, an abnormal state determination step isperformed in which a graph displayed on the display unit by the output step determines an abnormal state when a decrease of two or more levels of the continuity maintenance function level occurs a predetermined number of times or more. Is preferred.
前記恒常性維持機能レベル演算ステップとして、前記生体信号測定手段により得られる生体信号の周波数を求める周波数演算ステップと、前記周波数演算ステップにより得られた前記生体信号の周波数から、所定のオーバーラップ時間で設定した所定の時間窓毎に前記周波数の傾きを求める移動計算を行い、時間窓毎に得られる前記周波数の傾きの時系列波形を求める周波数傾き時系列解析演算ステップと、前記周波数傾き時系列解析演算ステップにより求めた前記周波数傾きの時系列波形を微分する微分ステップと、前記周波数傾き時系列解析演算ステップにより求めた前記周波数傾きの時系列波形を積分する積分ステップと、前記周波数傾き時系列解析演算ステップにより求めた前記周波数傾きの時系列波形の増減から方形波を求める方形波算出ステップと、任意に設定した第1時間帯における前記周波数傾き時系列波形と前記第1時間帯よりも後の第2時間帯における前記周波数傾き時系列波形と間の記述関数及び記述関数振幅値を求める記述関数算出ステップと、前記周波数演算ステップにより得られる、前記生体信号の時系列波形の極大値を用いた生体信号の周波数の時系列波形と、前記生体信号の時系列波形の正負が切り替わるゼロクロス地点を用いた生体信号の周波数の時系列波形とを用いて、前記周波数傾き時系列解析演算ステップにより求めた、それぞれの周波数傾きの時系列波形を絶対値処理する絶対値処理ステップと、前記周波数傾き時系列解析演算ステップにより求めた前記周波数傾き、前記微分手段により求めた微分値、前記積分手段により求めた積分値、前記方形波算出手段により求めた方形波の正負、前記記述関数算出ステップにより求めた記述関数振幅値、及び前記絶対値処理ステップにより求めた周波数傾き時系列波形の2つの絶対値のうち、少なくとも1つ以上を用いて恒常性維持機能レベルの段階を求める恒常性維持機能段階算出ステップとを実行させることが好ましい。As the homeostatic functional levels calculation step, the frequency calculating step of determining the frequency of the resulting biological signal by the biological signal measurement means, the frequency of the bio-signal obtained by said frequency calculating step, a predetermined overlap time A frequency gradient time series analysis step for calculating a time series waveform of the frequency gradient obtained for each time window by performing a movement calculation for obtaining the frequency gradient for each predetermined time window set, and the frequency gradient time series analysis. A differentiation step for differentiating the time-series waveform of the frequency gradient obtained by the calculation step; an integration step for integrating the time-series waveform of the frequency gradient obtained by the frequency gradient time-series analysis calculation step; and the frequency gradient time-series analysis. A method of obtaining a square wave from the increase / decrease of the time-series waveform of the frequency slope obtained in the calculation step Description function and description function amplitude between the wave calculation step and the frequency gradient time-series waveform in the arbitrarily set first time zone and the frequency gradient time-series waveform in the second time zone after the first time zone A description function calculating step for obtaining a value, a time series waveform of the frequency of the biological signal using the maximum value of the time series waveform of the biological signal, and the positive / negative of the time series waveform of the biological signal obtained by the frequency calculating step. Using the time series waveform of the frequency of the biological signal using the zero-crossing point to be switched, the absolute value processing step of performing absolute value processing on the time series waveform of each frequency slope obtained by the frequency slope time series analysis calculation step; The frequency slope obtained by the frequency slope time series analysis calculation step, the differential value obtained by the differentiating means, and the integral obtained by the integrating means Of the square wave obtained by the square wave calculating means, the description function amplitude value obtained by the description function calculating step, and two absolute values of the frequency gradient time series waveform obtained by the absolute value processing step. It is preferable toexecute a homeostasis function stage calculation step for obtaining a homeostasis function level stage using one or more.
本発明は、人の上体から採取した生体信号を用いて、恒常性維持機能レベルを複数の段階に区分して求め、恒常性維持機能レベルの各段階を時間軸に従って時系列にプロットして表示手段にグラフとして表示させる構成であり、好ましくは、グラフの縦軸の最上部を高活性状態として最下部を機能低下状態として表示する。これにより、自律神経による恒常性を維持しようとするゆらぎの様子と、脳による刺激が加えら得た様子を周期関数として捉えることができる。 The present invention uses a biological signal collected from a human upper body to obtain a homeostatic function level by dividing it into a plurality of stages, and plots each stage of the homeostasis function level in time series according to a time axis. The display means is configured to display the graph as a graph. Preferably, the uppermost portion of the vertical axis of the graph is displayed as a highly active state, and the lowermost portion is displayed as a reduced function state. As a result, it is possible to grasp the state of fluctuation to maintain homeostasis by the autonomic nerve and the state in which stimulation by the brain is applied as a periodic function.
また、このように恒常性維持機能レベルをグラフで時系列に表示した場合、人はそれを視認すると、恒常性維持機能の劣化状態(疲労の進行過程)を熟練を要することなく容易に把握することができる。恒常性維持機能の変化であるこのグラフを見るという行為は、自分では主観的及び客観的に把握できない状態を知りたいという高次の欲求を満たす行為であるため、それにより脳の活性化が生じ、入眠に入りにくくすることができる。いわば、このグラフを見るそのこと自体が、覚醒誘導をもたらすものである。従って、本発明は脳の活性化を促す効果が高く、従来のブザー音などにより聴覚を刺激する方法や、シートバックの振動などのような触覚・圧覚を刺激する方法等と比較して高い覚醒誘導効果が期待できる。 In addition, when the homeostasis maintenance function level is displayed in a time series in a graph in this way, when the person visually recognizes it, the deterioration state of the homeostasis maintenance function (the progress of fatigue) can be easily grasped without requiring skill. be able to. The act of looking at this graph, which is a change in the homeostasis maintenance function, is an act of satisfying a higher level desire to know a state that cannot be grasped subjectively and objectively, and this causes brain activation. , Can be difficult to fall asleep. In other words, seeing this graph itself leads to wakefulness induction. Therefore, the present invention has a high effect of promoting the activation of the brain, and has a high arousal compared with a conventional method of stimulating hearing by a buzzer sound or a method of stimulating tactile sensation / pressure sense such as vibration of a seat back. An induction effect can be expected.
また、本発明において恒常性維持機能レベルを求める生体信号は、人の上体の生体反応を利用して検出されるものであるため、心臓の動きに伴う大動脈の揺れを捕捉することができる。これにより、生命維持機能である恒常性維持機能を見ることができ、外乱に対する適応力を見ている指尖容積脈波を用いて人の状態を推定する技術と比較し、より正確に人の状態を把握することができる。 Further, in the present invention, the biological signal for obtaining the homeostasis maintenance function level is detected by utilizing the biological reaction of the upper body of the person, so that the aorta swaying accompanying the movement of the heart can be captured. This makes it possible to see the homeostasis maintenance function, which is a life support function, and more accurately compared to the technique that estimates the human condition using the fingertip plethysmogram, which is adapting to disturbances. The state can be grasped.
人の状態変化のサイクルには、覚醒と睡眠の各状態とその二つの状態への遷移状態に大別される。人は、高活性状態から睡眠への遷移状態いわゆる疲労代償期を経由して、疲労している状態すなわち機能低下状態に遷移する。その後、回復期の遷移状態を経由して高活性状態に戻る。これらの遷移状態において入眠予兆信号、覚醒予兆信号が発現する。また、人体は、恒常性を維持するために、血液の循環を利用して代謝で使われるエネルギーの変化を最小限にする。人体は血液の循環動態を変えるために、心拍の周波数(心拍数)と血管径を変える。従って、心拍の周波数変動と血管径の変化を検出することで、代謝で使われるエネルギーの遷移を同定できる。この遷移の様子が捉えられると、高活性状態から機能低下状態への遷移が捉えられ、入眠への移行を予測できる。この状態変化は、自律神経系によって引き起こされる。この変化を末梢系の反応を通して捉えると外的刺激への適応状態が分かるが、中枢系の反応すなわち心臓の動きに伴う大動脈の揺れを捕捉すれば疲労の質と量の同定が可能となる。 The human state change cycle is roughly divided into awakening and sleep states and transition states to the two states. A person transitions from a highly active state to a sleep state, a so-called fatigue compensation period, to a tired state, that is, a reduced function state. Then, it returns to a highly active state via the transition state in the recovery period. In these transition states, the sleep onset signal and the awakening signal are expressed. In order to maintain homeostasis, the human body uses blood circulation to minimize changes in energy used in metabolism. The human body changes the heartbeat frequency (heart rate) and blood vessel diameter to change blood circulation. Therefore, the transition of energy used in metabolism can be identified by detecting the frequency fluctuation of the heartbeat and the change of the blood vessel diameter. When the state of this transition is captured, the transition from the highly active state to the function-decreasing state is captured, and the transition to sleep can be predicted. This state change is caused by the autonomic nervous system. If this change is captured through the reaction of the peripheral system, the adaptation state to the external stimulus can be understood, but if the central system reaction, that is, the shaking of the aorta accompanying the movement of the heart, is captured, the quality and amount of fatigue can be identified.
また、グラフの進行過程の中で、恒常性維持機能レベルの2段階以上の低下が生じるということは、エネルギーレベルの急激な変化を示すものである。本発明のようなグラフを用いることにより、そのような急低下を視認できるため、人は急激な体調変化を意識し、自ら高活性状態に誘導しようと意識したり、積極的に休息をとることを意識したりすることができる。また、上記のような急激な変化が所定回数以上生じた場合には異常状態(入眠予兆信号の出現)であると自動的に判定する手段を設けることがより好ましい。異常状態と判定された場合には、警告音を鳴らすなど、聴覚や圧覚の刺激等と併用することができる。 In addition, a decrease in two or more levels of the homeostasis maintenance function level during the progression of the graph indicates a rapid change in energy level. By using such a graph as in the present invention, such a sudden drop can be visually recognized, so that a person is aware of a sudden change in physical condition, is conscious of inducing himself to a highly active state, or actively takes a rest. Can be conscious. In addition, it is more preferable to provide means for automatically determining that an abnormal state (appearance of a sleep onset sign signal) occurs when a sudden change as described above occurs a predetermined number of times or more. When it is determined that the state is abnormal, it can be used in combination with auditory or pressure stimulation, such as sounding a warning sound.
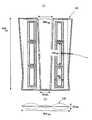
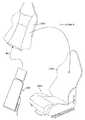
以下、図面に示した本発明の実施形態に基づき、本発明をさらに詳細に説明する。図1は、本実施形態に係る生体状態推定装置60の分析対象である生体信号、ここでは心臓の動きに伴う背部の大動脈の揺れによる圧力変動を採取する生体信号測定手段1を組み込んだ自動車用のシート500の外観を示した図である。なお、生体信号測定手段1と生体状態推定装置60とにより、生体状態推定システムが構成される。生体信号測定手段1は、シートバック部510に組み込まれて用いられる。ここで、生体信号測定手段1によって採取される圧力変動の検知信号には、ノイズ信号がより少ないことが望ましい。そこで、本実施形態の生体信号測定手段1は、以下に説明するように、自動車の走行中等の振動環境下においても、センサの出力信号自体に含まれるノイズ信号を少なくできるような工夫がなされている。 Hereinafter, the present invention will be described in more detail based on the embodiments of the present invention shown in the drawings. FIG. 1 shows a biological signal that is an analysis target of the biological
生体信号測定手段1は、エアパックユニット100と、ビーズ発泡樹脂弾性部材20とを有して構成されている。エアパックユニット100は、収容体15と、該収容体15に収容した2つのエアパック10を備えて構成される。各エアパック10は、3つの小空気袋111が縦方向に連接されている一方、そのそれぞれは空気の流通がないように形成されている。各小空気袋111内には、復元力付与部材としての三次元立体編物112が配置されている。 The biological signal measuring means 1 includes an
本実施形態では、このようなエアパック10が左右に配置される。左右に配置することにより、着座者の背への当たりが左右均等になり、違和感を感じにくくなる。また、左右のエアパック10,10のいずれか一方を構成するいずれかの小空気袋111にセンサ取付チューブ111aが設けられ、その内側に空気圧変動を測定するセンサ111bが固定されている。なお、センサ取付チューブ111aは密閉されている。小空気袋111は、このような生体信号による空気圧変動に敏感に反応させるために、大きさは、幅40〜100mm、長さ120〜200mmの範囲が好ましい。小空気袋111の素材は限定されるものではないが、例えば、ポリウレタンエラストマー(例えば、シーダム株式会社製、品番「DUS605−CDR」)からなるシートを用いて形成することができる。センサ111bとしては、小空気袋111内の空気圧を測定できるものであればよく、例えば、コンデンサ型マイクロフォンセンサを用いることができる。 In the present embodiment, such air packs 10 are arranged on the left and right. By arranging them on the left and right, the back of the seated person becomes even on the left and right sides, making it difficult to feel uncomfortable. In addition, a
小空気袋111を3つ連接した場合の全体の大きさとしては、自動車のシート500のシートバック部510に用いる場合、幅40〜100mm、全長400〜600mmの範囲とすることが好ましい。長さが短い場合、シートバック部510において、着座者が、腰部付近の一部分のみに異物感を感じるため、400mm以上の長さとして、できるだけ、着座者の背全体に対応させることが好ましい。 The overall size when three
空気圧変動を検出するセンサ111bは、本実施形態では、着座者の左側に配置されるエアパック10を構成する中央の小空気袋111に設けている。この小空気袋111の位置は、着座者の背部の大動脈(特に、「下行大動脈」)の心臓の動きに伴って生じる揺れを検知可能な領域に相当する。このような背部の大動脈の動きを検知可能な領域は、着座者の体格により一律ではないが、身長158cmの日本人女性から身長185cmの日本人男性までの様々な体格の被験者20名で測定したところ、該小空気袋111(幅60mm、長さ160mm)をシートバック部510の中心寄りの側縁と下縁の交差部P(図2及び図3参照)が、シートクッション部520の上面からシートバック部510の表面に沿った長さL:220mm、シートバック部510の中心からの距離M:80mmとなるように設定したところ、上記全ての被験者において大動脈の動きによる圧力変動を検知できた。小空気袋111の大きさが、幅40〜100mm、長さ120〜200mmの範囲の場合、交差部Pの位置を、シートクッション部520の上面からシートバック部510の表面に沿った長さで150〜280mm、シートバック部510の中心から60〜120mmの範囲に設定することが好ましい。 In the present embodiment, the
上記した2つのエアパック10をシートバック部510において容易に所定の位置に設定できるようにユニット化しておくことが好ましい。従って、図2〜図4に示したような収容体15にエアパック10を装着したエアパックユニット100として構成とすることが好ましい。収容体15は、両側にエアパック10を収容する袋状のエアパック収容部151を有し、2つのエアパック収容部151間に接続部152を有している。 The two air packs 10 are preferably unitized so that the seat back
2つのエアパック収容部151には、それぞれエアパック10が挿入される。また、エアパック収容部151には、エアパック10とほぼ同じ大きさの三次元立体編物40を、エアパック10の裏側エアパック12の背面側に重ねて挿入することが好ましい(図3(d)参照)。三次元立体編物40を配置することにより、エアパック10が該三次元立体編物40によっていわば浮くように支持されるため、シートバック部510からの外部振動がエアパック内部の圧力変動として伝わりにくくなる。すなわち、三次元立体編物40を配置することにより、高周波小振幅の外部振動が入力された場合には、三次元立体編物40のパイルと空気圧の変動から、エアパック内にバネ定数の低い、バネ・マス・ダンパ系が作られる。そして、それが三次元立体編物40を内蔵したエアパック10において、低・高周波入力に対するフィルタ(ローパスフィルタ・ハイパスフィルタ)として作用し、該外部振動を減衰する。 The
接続部152は、2つのエアパック部151を所定間隔をおいて支持できるものであればよく、幅60〜120mm程度で形成される。接続部152も、袋状に形成し、その内部に三次元立体編物45を挿入することが好ましい(図3(d)及び図4参照)。これにより、該接続部152を通じて入力される振動も、該三次元立体編物45を挿入することにより効果的に除振でき、センサ111bを備えたエアパック10への外部振動の伝達を抑制できる。 The
なお、上記したように、小空気袋111は、例えば、ポリウレタンエラストマー(例えば、シーダム株式会社製、品番「DUS605−CDR」)からなるシートを用いて形成されるが、収容体15も同じ素材を用いて形成することが好ましい。また、小空気袋111、エアパック収容部151及び接続部152内に装填される各三次元立体編物は、例えば、特開2002−331603号公報に開示されているように、互いに離間して配置された一対のグランド編地と、該一対のグランド編地間を往復して両者を結合する多数の連結糸とを有する立体的な三次元構造となった編地である。 As described above, the
一方のグランド編地は、例えば、単繊維を撚った糸から、ウェール方向及びコース方向のいずれの方向にも連続したフラットな編地組織(細目)によって形成され、他方のグランド編地は、例えば、短繊維を撚った糸から、ハニカム状(六角形)のメッシュを有する編み目構造に形成されている。もちろん、この編地組織は任意であり、細目組織やハニカム状以外の編地組織を採用することもできるし、両者とも細目組織を採用するなど、その組み合わせも任意である。連結糸は、一方のグランド編地と他方のグランド編地とが所定の間隔を保持するように、2つのグランド編地間に編み込んだものである。 One ground knitted fabric is formed by, for example, a flat knitted fabric structure (fine stitches) that is continuous in both the wale direction and the course direction from a yarn obtained by twisting a single fiber. For example, a knitted structure having a honeycomb-shaped (hexagonal) mesh is formed from a yarn obtained by twisting short fibers. Of course, this knitted fabric structure is arbitrary, and it is also possible to adopt a knitted fabric structure other than a fine structure or a honeycomb shape, and a combination thereof is also arbitrary, such as adopting a fine structure for both. The connecting yarn is knitted between two ground knitted fabrics so that one ground knitted fabric and the other ground knitted fabric maintain a predetermined distance.
ビーズ発泡樹脂弾性部材20は、シートバック部510の表皮部材とエアパック10を収容した収容体15(エアパックユニット100)との間に配設され、2つのエアパック10の全長に相当する長さを有し、2つのエアパック10の頂部間の長さに相当する幅を有している。従って、長さが400〜600mm、幅が250〜350mm程度の大きさのものを用いることが好ましい。これにより、2つのエアパック10が共に覆われるため、2つのエアパック10の凹凸を感じにくくなる。 The bead foamed resin
ビーズ発泡樹脂弾性部材20は、平板状に形成されたビーズ発泡体と、その外面に貼着される被覆材とから構成されている。ビーズ発泡体としては、ポリスチレン、ポリプロピレン及びポリエチレンのいずれか少なくとも一つを含む樹脂のビーズ法による発泡成形体が用いられる。なお、発泡倍率は任意であり限定されるものではない。被覆材は、ビーズ発泡体の外面に接着により貼着され、高い伸度と回復率を有する素材であり、好ましくは、伸度200%以上、100%伸長時の回復率が80%以上である弾性繊維不織布が用いられる。例えば、特開2007−92217号公報に開示された熱可塑性エラストマー弾性繊維が相互に溶融接着された不織布を用いることができる。具体的には、KBセーレン(株)製、商品名「エスパンシオーネ」を用いることができる。 The bead foam resin
また、ビーズ発泡樹脂弾性部材20の外面を覆う被覆材として、例えば、熱可塑性ポリエステルからなる不織布を用いることもできる。具体的には、帝人(株)製のポリエチレンナフタレート(PEN)繊維(1100dtex)から形成した2軸織物(縦:20本/inch、横:20本/inch)を用いることができる。 Further, as the covering material that covers the outer surface of the bead foam resin
ビーズ発泡樹脂弾性部材20を構成するビーズ発泡体としては、厚さ約5〜6mm程度のものを用いることができ、その外面に、厚さ約1mm以下の上記した弾性繊維不織布や熱可塑性ポリエステルからなる不織布を貼着して形成される。なお、本実施形態では、ビーズ発泡樹脂弾性部材20の表皮部材511に対向する面とその反対面に、上記のエスパンシオーネ(商品名)を貼着している。これにより、生体信号の伝達性が向上する。 As the bead foam constituting the bead foam resin
本実施形態において人体支持手段を構成するシート500のシートバック部510は、表皮部材511と該表皮部材511の背面側に配設されるクッション支持部材512とを備えてなり、該表皮部材511とクッション支持部材512との間にエアパック10を保持した収容体15(エアパックユニット100)とビーズ発泡樹脂弾性部材20が組み込まれる。この際、クッション支持部材512側にまずエアパック10を保持した収容体15(エアパックユニット100)が配置され、その表面側にビーズ発泡樹脂弾性部材20が配置された上で、表皮部材511により被覆される。なお、クッション支持部材512は、例えば、三次元立体編物をシートバック部510の左右一対のサイドフレームの後端縁間に張って形成することもできるし、合成樹脂板から形成することもできる。表皮部材511は、例えば、三次元立体編物、合成皮革、皮革、あるいはこれらの積層体などを左右一対のサイドフレームの前縁間に張って設けることができる。 In the present embodiment, the seat back
このように、本実施形態においては、表皮部材511の裏面側に所定の大きさのビーズ発泡樹脂弾性部材20が積層して配置され、さらにその後方に左右一対のエアパック10を保持した収容体15(エアパックユニット100)が配置される構成であるため、着座者が背にエアパック10の凹凸を感じることがなくなり、生体信号を測定するためのエアパック10を有する構成でありながら、座り心地が向上する。なお、上記した説明では、ビーズ発泡樹脂弾性部材20を1枚用いたのみであるが、複数枚重ねて配置することも可能である。 As described above, in the present embodiment, a bead foamed resin
なお、上記した生体信号測定手段1は、エアパックユニット100をシート500のシートバック部510に組み込んでいるが、シートバック部510の表面に後付で取り付けるシート用クッションに組み込むようにしてもよい。また、エアパック10を形成する小空気袋111を3つ連接しているが、2つであってもよいし、1つであってもよい。また、背部の大動脈の揺動を捉えられる位置に配置して用いることができる限り、例えば、1つの空気袋からなるエアパック10のみから生体信号測定手段1を構成することもできる。また、上記したサイズは小空気袋111を3つ連接して用いた場合の適切な例であり、エアパック10のサイズ、エアパックユニット100のサイズは、背部の大動脈の揺動を捉えられる限り全く限定されるものではないことはもちろんである。 Although the above-described biological signal measuring means 1 incorporates the
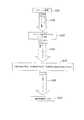
次に、生体状態推定装置60の構成について図6に基づいて説明する。生体状態推定装置60には、ハードディスク等の記憶部に設定されるコンピュータプログラムからなる恒常性維持機能レベル演算手段(恒常性維持機能レベル演算ステップ)61と、出力手段(出力ステップ)62とを有して構成される。なお、コンピュータプログラムは、フレキシブルディスク、ハードディスク、CD−ROM、MO(光磁気ディスク)、DVD−ROM、メモリカードなどの記録媒体へ記憶させて提供することもできるし、通信回線を通じて伝送することも可能である。 Next, the configuration of the biological
恒常性維持機能レベル演算手段(恒常性維持機能レベル演算ステップ)61は、生体信号測定手段1により検出された背部の大動脈の動きによる圧力変動の信号(以下、場合により「エアパック信号」という)の時系列波形から人の状態を分析し、所定時点における人の恒常性維持機能レベルを複数の段階に区分して求める手段である。人の状態は、上記したように、大きく高活性状態と機能低下状態とに分けられると共に、両者間は、さらに定常状態が含まれ、これら各状態間に遷移状態が存在する。但し、本実施形態では、高活性状態から機能低下状態までを5段階の恒常性維持機能レベルとして区分した。つまり、覚醒時における最も元気な疲労を感じていない状態(高活性状態)から、疲労に陥った状態(機能低下状態)までの間を5段階の恒常性維持機能レベルに区分した。本実施形態では5段階に区分したが、これに限定されるものではない。但し、2段階では、異常状態(入眠予兆信号)を検知する恒常性維持機能レベルの2段階以上の急激な低下を示すことができず、10段階を超えると細分過ぎて視覚的に把握しにくくなるため、3〜10段階の範囲で区分することが好ましい。より好ましくは5段階である。なお、恒常性維持機能レベル演算手段61による恒常性維持機能レベルの求め方の詳細については後述する。 The homeostasis maintenance function level calculation means (constancy maintenance function level calculation step) 61 is a signal of pressure fluctuation due to the movement of the back aorta detected by the biological signal measurement means 1 (hereinafter sometimes referred to as “air pack signal”). This is a means for analyzing a person's state from the time-series waveform and determining a person's homeostasis maintenance function level at a predetermined time by dividing it into a plurality of stages. As described above, the human state is largely divided into a highly active state and a function-decreasing state, and a steady state is further included between the two, and a transition state exists between these states. However, in the present embodiment, the high active state to the reduced function state is classified as a five-level homeostasis maintenance function level. That is, the state from the state of not feeling the most vigorous fatigue at the time of awakening (highly active state) to the state of falling into fatigue (function-decreasing state) was divided into five levels of homeostasis maintenance function levels. In this embodiment, although it divided into five steps, it is not limited to this. However, in two stages, it is not possible to show an abrupt decrease in the homeostasis maintenance function level that detects abnormal states (sleeping symptom signal) in two or more stages. Therefore, it is preferable to classify in the range of 3 to 10 steps. More preferably, there are five stages. The details of how to obtain the homeostatic function level by the homeostatic function level calculator 61 will be described later.
出力手段(出力ステップ)62は、恒常性維持機能レベルの各段階を縦軸として、時間を横軸としてなるプロットエリアを表示手段65に表示する。そして、このプロットエリアに、恒常性維持機能レベル演算手段61により求められる恒常性維持機能レベルを算出時間に対応して時系列にプロットし、折れ線グラフとして表示する。恒常性維持機能レベルを時系列にプロットしていくことにより、自律神経による恒常性を維持しようとするゆらぎと脳による賦活化の様子の周期関数が表される。 The output means (output step) 62 displays a plot area on the display means 65 with each stage of the constancy maintaining function level as the vertical axis and time as the horizontal axis. In this plot area, the homeostasis maintenance function level obtained by the homeostasis maintenance function level calculator 61 is plotted in time series corresponding to the calculation time and displayed as a line graph. By plotting the homeostasis maintenance function level in time series, the fluctuation function of maintaining the homeostasis by the autonomic nerve and the periodic function of the activation state by the brain are expressed.
縦軸の恒常性維持機能レベルは、図11に示したように、本実施形態では5段階に区分されて表示される。具体的には、高活性状態(覚醒時の中でも最も元気な疲労を感じていない状態)が最上部に表示され、機能低下状態が最下部に表示され、両者の間に3段階の恒常性維持機能段階が表示される。ここでは、中央部(上から3つ目)を定常状態とし、上から2つ目を高活性状態と定常状態との間の状態、下から2つ目を定常状態と機能低下状態と間の状態とし、そのイメージを人の顔の様子を模した図で表示している。なお、説明の便宜上、最も元気な状態である最上部を恒常性維持機能段階1(高活性状態(調子の良い状態:「イイ調子」等と表示))とし、以下、下方に向かって順に、恒常性維持機能段階2(比較的良い状態:「大丈夫」等と表示)、恒常性維持機能段階3(定常(普通)状態)、恒常性維持機能段階4(やや機能低下状態:「運転注意」等と表示)、恒常性維持機能段階5(機能低下状態:「疲労状態」等と表示))と表現する。 As shown in FIG. 11, the homeostasis maintenance function level on the vertical axis is displayed in five stages in this embodiment. Specifically, the highly active state (the state that feels the most vigorous fatigue even during awakening) is displayed at the top, the reduced function state is displayed at the bottom, and three levels of homeostasis are maintained between the two. The function stage is displayed. Here, the central part (third from the top) is in a steady state, the second from the top is a state between the high active state and the steady state, and the second from the bottom is between the steady state and the reduced function state. The state is displayed, and the image is displayed in a figure that mimics the appearance of a person's face. For convenience of explanation, the uppermost part that is in the most energetic state is designated as homeostasis maintenance function stage 1 (highly active state (in good condition: indicated as “good tone” etc.)). Homeostasis maintenance function stage 2 (relatively good state: indicated as “OK”), homeostasis maintenance function stage 3 (steady state (normal) state), homeostasis maintenance function stage 4 (slightly degraded state: “driving attention”) ), And the homeostasis maintenance function stage 5 (degraded state: indicated as “fatigue state” etc.)).
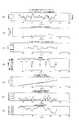
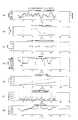
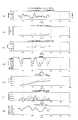
図11(a)〜(e)は、ドライバの恒常性維持機能レベルを求め、出力手段62により表示手段65に折れ線グラフで表示した例を示したものである。これは、複数の被験者の試験データをまとめてその傾向を示したグラフである。なお、表示手段65としては、自動車の運転席から見やすい位置に搭載した車載用モニタを用いることが好ましい。 11A to 11E show examples in which the driver's constancy maintaining function level is obtained and displayed on the display means 65 by the output means 62 as a line graph. This is a graph showing the tendency of test data of a plurality of subjects collectively. As the display means 65, it is preferable to use an in-vehicle monitor mounted at a position that is easy to see from the driver's seat of the automobile.
図11(a)の例は、基本的には、最も元気な状態である恒常性維持機能段階1の範囲でグラフが描かれていく一方で、5〜8分間毎に、恒常性維持機能段階2に一時的に移行し、再び恒常性維持機能段階1に戻ることを繰り返している。仮に人が長時間に亘って恒常性維持機能段階1を維持し続けるとすれば、これは緊張感を伴って元気な状態を維持しているものであるが、緊張して集中力の高い状態、あるいはリラックスして集中力が高く元気で快適な場合には、自律神経の働きによる恒常性維持機能により恒常性維持機能段階1と恒常性維持機能段階2との間をこのように揺らぐ波形となる。この間で、ゆらぎの回数が多いときはリラックス状態を示し、ゆらぎの少ないときは緊張状態を示す。 In the example of FIG. 11A, the graph is drawn basically in the range of the homeostasis
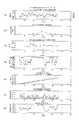
図11(b)の例は、恒常性維持機能段階1から恒常性維持機能段階2に移行し、恒常性維持機能段階3、恒常性維持機能段階2、恒常性維持機能段階3、恒常性維持機能段階4、恒常性維持機能段階3、恒常性維持機能段階2というように各恒常性維持機能段階を順に行き来するゆらぎを伴いながら、徐々に疲労が増していく波形である。つまり、肉体疲労の進行により恒常性維持機能が順次低下し、やがては睡眠を伴う休息が必要となるケースである。いわば、極端な状態変化を伴わない通常の疲労の進行過程を示したものである。 In the example of FIG. 11B, the homeostasis
図11(c)の例は、運転スタート時の恒常性維持機能段階1から、恒常性維持機能段階2、恒常性維持機能段階3、恒常性維持機能段階5と一気に疲労が進行したケースである。恒常性維持機能段階5まで進行したため、交感神経の働き(代償作用)によって強制的に恒常性維持機能段階3まで戻す機能が働くが、その後、恒常性維持機能段階5と恒常性維持機能段階3との間で極めて短時間で変化している。これは、眠気と安静状態との間の漫然とした状態が生じていることを示すものであり、ヒューマンエラーが生じやすく、運転に注意が必要な状態と判定できる。 The example of FIG. 11 (c) is a case where fatigue progressed from the homeostasis
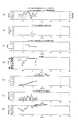
図11(d)の例は、15分過ぎに交感神経代償作用によって恒常性維持機能段階3から恒常性維持機能段階1に戻しているものの、30分過ぎからはゆらぎがほとんど生じず恒常性維持機能段階1から恒常性維持機能段階5へとほぼ一方的に進行している。これは恒常性維持が難しくなっていることを示すものであり、早期の休憩が必要な状態と判定できる。 In the example of FIG. 11 (d), the homeostasis
図11(e)の例は、高活性状態である恒常性維持機能段階1の範囲でグラフが描かれていくが、ほとんどゆらぎがない。これは、過緊張して集中力の高い状態が継続し、ゆらぎが少なくなり、エアパックがゆらぎを検出していない状態、つまり脳の賦活化によって過緊張している状態を示すものである。ところが、図11(e)のグラフ中、25分付近、40分付近、47分付近において、数秒から数十秒で恒常性維持機能レベルが2段階以上(この例では、恒常性維持機能段階1から恒常性維持機能段階4までの3段階)一気に低下して一気に元に戻る尖鋭な突出ラインが生じている。この尖鋭な突出ラインは過緊張の継続に対する反動であり、過緊張状態の中での疲労の進行に通じる。この実験において、尖鋭な突出ラインが複数回生じた後に、ドライバにマイクロスリープが生じているが、これは生体の恒常性維持機能の著しい低下と考えられることから、この尖鋭な突出ラインはマイクロスリープに至る直前の信号である入眠予兆を示すものと定義した。なお、入眠予兆信号のより正確な判定については、この恒常性維持機能レベルの急低下だけでなく、後述するように、方形波の正負、ゼロクロス法により求めた絶対値の優位性を考慮することが好ましい。よって、このような突出ラインが複数回生じた場合には、それを入眠予兆信号と判定し、速やかな休憩が必要な状態と判定する。 In the example of FIG. 11 (e), the graph is drawn in the range of the homeostasis
このように、本実施形態によれば、恒常性維持機能レベルを視覚的に明確に捉えることができる。すなわち、ドライバは、例えば、図11(a)のグラフを視覚的に捉えた場合には、順調に運転できる状態であることを理解し、図11(c)のグラフを視覚的に捉えた場合には、運転に注意しつつ比較的速やかに休憩した方がよい状態であることを理解し、図11(e)のような突出ラインを視認した場合には、入眠予兆信号の可能性があることから、比較的早期に休憩を取る方がよいことを理解できる。つまり、このような表示手段65へのグラフによる表示は、短時間ではあるが、ドライバがそれを見て自らの状態を把握することで、ドライバの脳を刺激し賦活化が生じ、覚醒方向に誘導して、早めの休憩を促すことができるものである。 Thus, according to this embodiment, the homeostasis maintenance function level can be clearly grasped visually. That is, for example, when the driver visually understands the graph of FIG. 11A, the driver understands that the driver can drive smoothly, and visually recognizes the graph of FIG. 11C. When it is understood that it is better to take a break relatively quickly while paying attention to driving, if a protruding line as shown in FIG. Therefore, it can be understood that it is better to take a break relatively early. In other words, the display on the
本実施形態では、ドライバが表示手段65に表示されたグラフを見ることによって自らの状態がどのような状態であるかを容易に把握できるものであり、それにより脳への刺激を促すものであるが、休憩が必要な状態か、入眠予兆信号が出現したかなどを自動的に判定する判定手段(判定ステップ)63を組み込むこともできる。 In the present embodiment, the driver can easily grasp the state of his / her state by looking at the graph displayed on the display means 65, thereby prompting stimulation to the brain. However, a determination means (determination step) 63 for automatically determining whether a break is necessary or whether a sleep onset sign signal has appeared may be incorporated.
判定手段63は、上記した恒常性維持機能段階のグラフにける基線の動きを監視し、例えば、図11(c)、(d)のように、恒常性維持機能段階3〜5の範囲に基線が移動して、疲労の回復が見られないようになった状態に至ったならば、音、振動などによる警告を発するようにすることができる。本実施形態は、恒常性維持機能段階を視覚的に把握することで脳の活性化が生じ覚醒方向に誘導されるものであるが、判定手段63によるいわば監視システムを含めることで、音、振動などの警告を併用することもできる。特に、図11(e)のような入眠予兆信号が出現した場合、例えば、3回出現した段階で、それを異常状態と判定し、より大きな警告音などを発する異常状態判定手段を設けた構成とすると、居眠り運転をより確実に抑制するのに役立つ。 The determination means 63 monitors the movement of the baseline in the above-described graph of the homeostasis maintenance function stage. For example, as shown in FIGS. Can move to a state where recovery from fatigue is not observed, a warning by sound, vibration, etc. can be issued. In this embodiment, the visual activation of the homeostasis maintenance function stage leads to activation of the brain and guidance in the awakening direction. By including a so-called monitoring system by the determination means 63, sound, vibration Such warnings can be used together. In particular, when a sleep onset signal as shown in FIG. 11 (e) appears, for example, when it appears three times, it is determined as an abnormal condition, and an abnormal condition determination means for generating a larger warning sound is provided. Then, it helps to more reliably suppress the drowsiness driving.
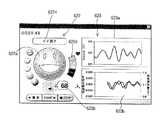
ここで、上記出力手段62は、人の恒常性維持機能レベルを時系列に折れ線グラフで表示させるものであるが、表示手段65に、上記の折れ線グラフとは異なる表示を異なる画面で出力する別画面出力手段621を備える構成とすることができる。図12(a)〜(e)は、この別画面出力手段621により表示手段65に出力された画像を示したものである。 Here, the output means 62 displays the human homeostasis maintenance function level in a time series in a line graph, but the display means 65 outputs a display different from the above line graph on a different screen. A screen output means 621 may be provided. 12A to 12E show images output to the display means 65 by the separate screen output means 621. FIG.
別画面出力手段621により表示される画面には、図13に拡大して示した代表例のように、この実施形態では、恒常性維持機能段階1〜5に対応したイメージを中性的な人の顔の様子(上記折れ線グラフの縦軸の顔のイメージ図と同じ)を示した第1画像部622と時系列のグラフからなる第2画像部623とが表示される。第1画像部622は、中心に顔イメージ表示部622aと、その下部の心拍数表示部622bと、その上部の文字表示部622cと、右側に表示された入眠予兆信号表示部622dとを有している。顔イメージ表示部622aには、恒常性維持機能レベル演算手段61により求められる恒常性維持機能段階に応じて、別画面出力手段621が各恒常性維持機能段階に対応する顔のイメージを表示する。また、文字表示部622cには、別画面出力手段621が各恒常性維持機能段階に応じて設定した文字、例えば、「イイ調子」、「大丈夫」、「普通状態」、「運転注意」、「疲労状態」などを表示する。また、入眠予兆信号表示部622dは、5つの表示ランプを有しており、図11(e)に示したような入眠予兆信号を生じた場合に、その出現個数が各表示ランプに点灯するようになっている。これにより、人は、表示ランプの点灯を見て、休憩が必要なタイミングを自覚することができる。 In the screen displayed by the separate screen output means 621, as in the representative example shown in an enlarged manner in FIG. 13, in this embodiment, an image corresponding to the
第2画像部623には、その上部表示部623aに、生体信号測定手段1により検出された背部の大動脈の動きによる圧力変動の信号(エアパック信号)の時系列波形のグラフが表示され、下部表示部623bに、周波数の傾きの時系列波形のグラフが表示される。 In the
別画面出力手段621により表示される第1画像部622、第2画像部623の各画像部は、これらの表示に限定されるものではないが、特に、第1画像部622の顔イメージ表示部622a、文字表示部622c及び入眠予兆信号表示部622dをドライバが視認することにより、現在の状況を容易に把握できる。但し、第1画像部622の表示は、ある瞬間における状態を示すだけであるため、画面を見て、自らの状態変化を経時的に把握し、将来の自分の状態変化を予測することで、休憩の有無を強く意識しやすいことから、運転中は、図11に示したような折れ線グラフの画面をドライバが視認できるようにすることが好ましい。 The image portions of the
なお、始動時において、図11の折れ線グラフの画面を表示させるか、図12の第1画像部622,第2画像部623の画面を表示させるかは任意に設定できるが、本実施形態では、初期画面として、図12及び図13に示した、第1画像部622,第2画像部623の画面を表示させ、「START」ボタンを押すと、測定が開始され、恒常性維持機能レベル演算手段61による演算が始まるようにしている。そして、「履歴」ボタンを押すと、図11の折れ線グラフの画面が表示されるように設定している。すなわち、その瞬間における変化を図12及び図13に示した第1画像部622,第2画像部623からなる画面により表示し、過去の履歴を含んだ時系列の変化を図11に示した折れ線グラフの画面により表示する。また、本実施形態では、運転中、図11の折れ線グラフの画面が表示されるようにするために、「START」、「履歴」の各ボタンを操作するようにすることで手指の動きによって脳の活性化が図られるという利点もある。また、本実施形態によれば、図11の折れ線グラフの画面、図12の第1画像部622(特に心拍数の部分)、第2画像部623の合計3つの画面を視認することになるが、3つの画面を見ることで、3つの画面から総合的に自らの状態を把握しようとするため、そのことも脳の活性化につながる。3つより少ない場合には脳の活性化効果が低く、3つより多い場合には煩雑になりすぎる。なお、「START」、「履歴」の各ボタン操作は運転の支障にならないように、ハンドル付近に設けておくなどすることが好ましいことはもちろんである。 In addition, at the time of starting, whether to display the screen of the line graph of FIG. 11 or the screen of the
次に、恒常性維持機能レベル演算手段(恒常性維持機能レベル演算ステップ)61に設定した具体的な演算手法について説明する。すなわち、恒常性維持機能レベル演算手段61は、周波数演算手段(周波数演算ステップ)611、周波数傾き時系列解析演算手段(周波数傾き時系列解析演算ステップ)612、周波数変動時系列解析演算手段(周波数変動時系列解析演算ステップ)613、微分手段(微分ステップ)614、積分手段(積分ステップ)615、方形波算出手段(方形波算出ステップ)616、記述関数算出手段(記述関数算出ステップ)617、絶対値処理手段(絶対値処理ステップ)618、恒常性維持機能段階算出手段(恒常性維持機能段階算出ステップ)619とを備えてなる。 Next, a specific calculation method set in the homeostasis maintenance function level calculation means (constancy maintenance function level calculation step) 61 will be described. That is, the constancy maintaining function level calculation means 61 includes a frequency calculation means (frequency calculation step) 611, a frequency gradient time series analysis calculation means (frequency gradient time series analysis calculation step) 612, a frequency fluctuation time series analysis calculation means (frequency fluctuation). Time series analysis calculation step) 613, differentiation means (differentiation step) 614, integration means (integration step) 615, square wave calculation means (square wave calculation step) 616, description function calculation means (description function calculation step) 617, absolute value And processing means (absolute value processing step) 618 and homeostasis maintenance function stage calculation means (constancy maintenance function stage calculation step) 619.
周波数演算手段611は、生体信号測定手段1から得られるエアパック信号の時系列データ(好ましくは後述のようにフィルタリング処理された所定の周波数領域のエアパック信号フィルタ波形)における周波数の時系列波形を求める。この時系列波形の求め方には2種類あり、第1の手法は、副交感神経機能の指標として用いられるHFに関するもので、第2の手法は、交感神経機能の指標として用いられるLF/HF(なお、LFは0.05−0.20Hzの周波数成分、HFは0.20−0.35Hzの周波数成分である)に関するものである。 The frequency calculation means 611 calculates the time series waveform of the frequency in the time series data of the air pack signal obtained from the biological signal measurement means 1 (preferably an air pack signal filter waveform in a predetermined frequency region filtered as described later). Ask. There are two methods for obtaining this time series waveform. The first method relates to HF used as an index of parasympathetic nerve function, and the second method uses LF / HF (used as an index of sympathetic nerve function). Note that LF is a frequency component of 0.05 to 0.20 Hz, and HF is a frequency component of 0.20 to 0.35 Hz).
第1の手法は、エアパック信号の時系列波形を平滑化微分して極大値(ピーク)を用いて時系列波形を求める方法(以下、「ピーク検出法」という)である。ピーク検出法は、基本は、HFの機能に相当する時系列波形であり、LF/HFの代償機能に相当する波形が重畳されることもある時系列波形である。例えば、SavitzkyとGolayによる平滑化微分法により極大値を求める。次に、例えば5秒ごとに極大値を切り分け、その5秒間に含まれる時系列波形の極大値(波形の山側頂部)間の時間間隔の逆数を個別周波数fとして求め、その5秒間における個別周波数fの平均値を当該5秒間の周波数Fの値として採用する(図9の[1]のステップ)。そして、この5秒毎に得られる周波数Fをプロットすることにより、周波数の時系列波形を求める(図9の[2]のステップ)。 The first method is a method of obtaining a time series waveform using a local maximum value (peak) by smoothing and differentiating the time series waveform of the air pack signal (hereinafter referred to as “peak detection method”). The peak detection method is basically a time series waveform corresponding to the function of HF, and a time series waveform in which a waveform corresponding to the compensation function of LF / HF may be superimposed. For example, the maximum value is obtained by a smoothing differential method using Savitzky and Golay. Next, for example, the local maximum value is divided every 5 seconds, and the reciprocal of the time interval between the local maximum values of the time series waveform included in the 5 seconds (the peak on the peak side of the waveform) is obtained as the individual frequency f. The average value of f is adopted as the value of the frequency F for 5 seconds (step [1] in FIG. 9). Then, by plotting the frequency F obtained every 5 seconds, a time-series waveform of the frequency is obtained (step [2] in FIG. 9).
第2の手法は、エアパック信号の時系列波形において、正から負に切り替わる地点(以下、「ゼロクロス地点」という)を用いて時系列波形を求める方法(以下、「ゼロクロス法」という)である。このゼロクロス法は、脈波の周波数の基本成分を捉えるもので、LF/HFに相当するものである。この方法では、まず、ゼロクロス地点を求めたならば、それを例えば5秒毎に切り分け、その5秒間に含まれる時系列波形のゼロクロス地点間の時間間隔の逆数を個別周波数fとして求め、その5秒間における個別周波数fの平均値を当該5秒間の周波数Fの値として採用する(図9の[1]のステップ)。そして、この5秒毎に得られる周波数Fをプロットすることにより、周波数の時系列波形を求める(図9の[2]のステップ)。 The second method is a method (hereinafter, referred to as “zero cross method”) that uses a point (hereinafter referred to as “zero cross point”) that switches from positive to negative in the time series waveform of the air pack signal. . This zero cross method captures the fundamental component of the frequency of the pulse wave and corresponds to LF / HF. In this method, when the zero-cross point is first obtained, it is divided, for example, every 5 seconds, and the reciprocal of the time interval between the zero-cross points of the time-series waveform included in the 5 seconds is obtained as the individual frequency f. The average value of the individual frequencies f in the second is adopted as the value of the frequency F in the five seconds (step [1] in FIG. 9). Then, by plotting the frequency F obtained every 5 seconds, a time-series waveform of the frequency is obtained (step [2] in FIG. 9).
周波数傾き時系列解析演算手段(周波数傾き時系列解析演算ステップ)612は、周波数演算手段611によって、ピーク検出法又はゼロクロス法を用いて得られたエアパック信号の周波数の時系列波形から、所定の時間幅の時間窓を設定し、時間窓毎に最小二乗法により該エアパック信号の周波数の傾きを求め、その時系列波形を出力する構成である。周波数傾き時系列解析演算手段612により得られる周波数傾き時系列波形は、交感神経及び副交感神経の発現のバランスを捉えた生体のゆらぎを示すものとして出力される。具体的には、まず、ある時間窓Tw1における周波数の傾きを最小二乗法により求めてプロットする(図9の[3],[5]のステップ)。次に、オーバーラップ時間Tl(図9の[6]のステップ)で次の時間窓Tw2を設定し、この時間窓Tw2における周波数の傾きを同様に最小二乗法により求めてプロットする。この計算(移動計算)を順次繰り返し、エアパック信号の周波数の傾きの時系列変化を周波数傾き時系列波形として出力する(図9の[8]のステップ)。なお、時間窓Twの時間幅は180秒に設定することが好ましく、オーバーラップ時間Tlは162秒に設定することが好ましい。これは、本出願人による上記特許文献3(WO2005/092193A1公報)において示したように、時間窓Twの時間幅及びオーバーラップ時間Tlを種々変更して行った睡眠実験から、特徴的な信号波形が最も感度よく出現する値として選択されたものである。 The frequency gradient time series analysis calculation means (frequency gradient time series analysis calculation step) 612 uses a frequency calculation means 611 based on a time series waveform of the frequency of the air pack signal obtained by using the peak detection method or the zero cross method. A time window of a time width is set, the slope of the frequency of the air pack signal is obtained for each time window by the least square method, and the time series waveform is output. The frequency gradient time series waveform obtained by the frequency gradient time series analysis calculation means 612 is output as an indication of the fluctuation of the living body that captures the balance of the expression of the sympathetic nerve and the parasympathetic nerve. Specifically, first, the frequency gradient in a certain time window Tw1 is obtained by the least square method and plotted (steps [3] and [5] in FIG. 9). Next, the next time window Tw2 is set at the overlap time Tl (step [6] in FIG. 9), and the frequency gradient in this time window Tw2 is similarly obtained by the least square method and plotted. This calculation (movement calculation) is sequentially repeated, and the time-series change in the frequency gradient of the airpack signal is output as a frequency gradient time-series waveform (step [8] in FIG. 9). The time width of the time window Tw is preferably set to 180 seconds, and the overlap time Tl is preferably set to 162 seconds. As shown in Patent Document 3 (WO2005 / 092193A1) by the present applicant, this is a characteristic signal waveform from a sleep experiment in which the time width of the time window Tw and the overlap time Tl are variously changed. Is selected as the value that appears most sensitively.
周波数変動時系列解析演算手段(周波数変動時系列解析演算ステップ)613は、周波数演算手段611により得られたエアパック信号の周波数の時系列波形(図9の[2]のステップ)に、所定の時間幅の時間窓(好ましくは180秒)を設定し、周波数の平均値を求める(図9の[3],[4]のステップ)。次に、所定のオーバーラップ時間(好ましくは162秒)で設定した所定の時間窓(好ましくは180秒)毎にエアパック信号の周波数の平均値を求める移動計算を行い、プロットする。そして、時間窓毎にプロットされた周波数の平均値の時系列変化を周波数変動時系列波形として出力する(図9の[7]のステップ)。そして、周波数傾き時系列波形と周波数変動時系列波形とを併せて出力すると図9[9]のステップのようになる。なお、周波数変動時系列波形から心拍数が求められる。 The frequency fluctuation time series analysis calculation means (frequency fluctuation time series analysis calculation step) 613 applies a predetermined time series waveform (step [2] in FIG. 9) of the frequency of the air pack signal obtained by the frequency calculation means 611. A time window of time width (preferably 180 seconds) is set, and an average value of frequencies is obtained (steps [3] and [4] in FIG. 9). Next, a movement calculation for obtaining an average value of the frequency of the air pack signal is performed and plotted every predetermined time window (preferably 180 seconds) set with a predetermined overlap time (preferably 162 seconds). Then, the time-series change of the average value of the frequencies plotted for each time window is output as a frequency fluctuation time-series waveform (step [7] in FIG. 9). When the frequency gradient time-series waveform and the frequency fluctuation time-series waveform are output together, a step shown in FIG. 9 [9] is obtained. The heart rate is obtained from the frequency variation time series waveform.
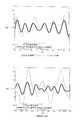
ここで、ピーク検出法は、生体信号の波形の乱れ、波形の状態を検出しているのに対し、ゼロクロス法は周波数成分を検出している。すなわち、両者が一致している時は、周期関数に近似していることを意味し、乖離している時は、波形に複数の成分が重畳されていることを意味している。波形の乱れは、低周波成分に高周波成分が重畳されたり、低周波成分にさらに低周波成分が重畳されたりしている状態を示し、振幅の増大や減少となり、交感神経の亢進や低下に対応し、これが過緊張・我慢、放心、リラックス、慢然、賦活化の各状態に関係する。従って、ピーク検出法及びゼロクロス法のそれぞれにより求めた周波数傾き時系列波形を絶対値処理して両者を比較することにより、交感神経系が亢進した過緊張状態や我慢状態にあるか、副交感神経優位のリラックス状態にあるかの大雑把な状態判定を行うことができる。その一方、周波数傾き時系列波形から記述関数を求める場合、並びに、周波数変動時系列波形から心拍数の増減等を求める場合には、ゼロクロス法により得られる周波数の時系列波形を用いることが好ましい。これは、記述関数の算出目的が、波形の変化度合いを見ることで、活動代謝にあるか、安静代謝の中での変化の状態にあるか、あるいは、各代謝の中での活性度合・機能の低下度合を知ることにあるためである。 Here, the peak detection method detects the disturbance of the waveform of the biological signal and the state of the waveform, while the zero cross method detects the frequency component. That is, when the two coincide with each other, it means that they are approximate to a periodic function, and when they are separated, it means that a plurality of components are superimposed on the waveform. Waveform disturbance indicates a state where a high-frequency component is superimposed on a low-frequency component or a low-frequency component is further superimposed on a low-frequency component, and the amplitude increases or decreases, corresponding to the increase or decrease of the sympathetic nerve However, this is related to each state of over-tension, patience, devotion, relaxation, pride, and activation. Therefore, the absolute value processing of the frequency gradient time series waveforms obtained by the peak detection method and the zero-crossing method and comparing the two values makes it possible to determine whether the sympathetic nervous system is hypertonic or endured, or whether the parasympathetic nerve is dominant. It is possible to make a rough state determination as to whether the user is in a relaxed state. On the other hand, when a description function is obtained from a frequency gradient time series waveform, and when an increase or decrease in heart rate is obtained from a frequency variation time series waveform, it is preferable to use a time series waveform of a frequency obtained by the zero cross method. This is because the purpose of calculating the description function is to see whether it is in active metabolism or in a state of change in resting metabolism by looking at the degree of change in the waveform, or the degree of activity / function in each metabolism This is because it is in knowing the degree of decrease in.
微分手段(微分ステップ)614は、周波数傾き時系列解析演算手段612により求めた周波数傾きの時系列波形を微分し、周波数傾き時系列波形の瞬間的な変動率を見る。 Differentiating means (differentiating step) 614 differentiates the time series waveform of the frequency slope obtained by the frequency slope time series analysis computing means 612 to see the instantaneous variation rate of the frequency slope time series waveform.
積分手段(積分ステップ)615は、周波数傾き時系列解析演算手段612により求めた前記周波数傾きの時系列波形を積分し、周波数傾き時系列波形の時間経過による累積を見る。 The integration means (integration step) 615 integrates the time series waveform of the frequency slope obtained by the frequency slope time series analysis calculation means 612, and sees the accumulation of the frequency slope time series waveform over time.
方形波算出手段(方形波算出ステップ)616は、周波数傾き時系列解析演算手段612により求めた周波数傾きの時系列波形のピークを求め、包絡線を作成し、包絡線の傾きから増減傾向を求めて方形波を描く。すなわち、包絡線の傾きが増加傾向の区間はプラス、減少傾向の区間はマイナスとして方形波を描く。 The square wave calculating means (square wave calculating step) 616 obtains the peak of the time series waveform of the frequency slope obtained by the frequency slope time series analysis computing means 612, creates an envelope, and obtains an increase / decrease tendency from the slope of the envelope. Draw a square wave. That is, a square wave is drawn with an interval in which the slope of the envelope tends to increase being plus and an interval having a decreasing trend being minus.
記述関数算出手段(記述関数算出ステップ)617は、任意に設定した第1時間帯における周波数傾き時系列波形を高速フーリエ変換すると共に、第1時間帯よりも後の第2時間帯における周波数傾き時系列波形を高速フーリエ変換して、「第2時間帯における高速フーリエ変換(a2+i・b2・・・(a2は実数部、b2は虚数部)/第1時間帯における高速フーリエ変換(a1+i・b1・・・(a1は実数部、b1は虚数部)」により両者間の記述関数(等価伝達関数)を求める手段である。つまり、第1時間帯における周波数傾き時系列波形を入力関数とし、第2時間帯における周波数傾き時系列波形を出力関数として、両者間の記述関数を求めることにより、基本の状態が相殺され、変化の様子が残り、第1時間帯と第2時間帯における人の恒常性維持機能の変化を捉えるものである。なお、第1時間帯及び第2時間帯は、各時間帯における周波数傾き時系列波形の関数を求めることができる時間幅であればよく限定されるものではなく、例えば、半周期分から3周期分(例えば約3分間から約20分間)の範囲で設定できる。統計的に所定の範囲に設定してもよいし、個人毎に第1時間帯及び第2時間帯の時間幅を設定できるようにしてもよい。The description function calculation means (description function calculation step) 617 performs fast Fourier transform on the arbitrarily set frequency gradient time series waveform in the first time zone, and at the time of frequency gradient in the second time zone after the first time zone. The series waveform is subjected to fast Fourier transform, “Fast Fourier transform in the second time zone (a2 + i · b2 ... (A2 is a real part, b2 is an imaginary part) / fast Fourier transform in the first time zone. (A1 + i · b1 ... (A1 is a real part, b1 is an imaginary part)) ”is a means for obtaining a description function (equivalent transfer function) between the two. By using the time-series waveform as an input function and the frequency gradient time-series waveform in the second time zone as an output function, a description function between the two is obtained, so that the basic state is canceled and the state of change remains, and the first time zone And second The first time zone and the second time zone should be a time width in which a function of a frequency gradient time series waveform in each time zone can be obtained. For example, it can be set in a range from half a period to three periods (for example, from about 3 minutes to about 20 minutes). You may enable it to set the time width of a 1st time slot | zone and a 2nd time slot | zone.
得られた記述関数は「(a1a2+b1b2)/(a12+b12)+i(a1b2−a2b1)/(a12+b12)」で表される。そして、「(a1a2+b1b2)/(a12+b12)」=A、「i(a1b2−a2b1)/(a12+b12)」=Bとおき、「A2+B2」の平方根を記述関数振幅値として求める。そして、この記述関数振幅値により、2つの時間帯における状態変化を捉える。値の設定は任意であり個人毎に設定することもできるが、統計的に所定の値に設定するようにしてもよい。すなわち、所定の値あるいは値の範囲にある場合に、安静状態、漫然状態、交感神経代償作用の働いている状態等という設定を行うことができる。The obtained description function is represented by “(a1 a2 + b1 b2 ) / (a12 + b12 ) + i (a1 b2 −a2 b1 ) / (a12 + b12 )”. Is done. And, “(a1 a2 + b1 b2 ) / (a12 + b12 )” = A, “i (a1 b2 −a2 b1 ) / (a12 + b12 )” = Let B be the square root of “A2 + B2 ” as the description function amplitude value. And the state change in two time zones is caught by this description function amplitude value. Setting of the value is arbitrary and can be set for each individual, but may be set statistically to a predetermined value. That is, when the value is within a predetermined value or a range of values, settings such as a resting state, a sloppy state, a state in which a sympathetic decompensating action is working, and the like can be performed.
絶対値処理手段(絶対値処理ステップ)618は、周波数傾き時系列解析演算手段612により得られる周波数傾き時系列波形を絶対値処理して出力する。このとき、絶対値処理手段618は、ピーク検出法を用いた場合とゼロクロス法を用いた場合の双方で得られた周波数傾き時系列波形を絶対値処理して出力する。具体的には、周波数演算手段611が、ピーク検出法を用いて生体信号の周波数の時系列波形を求めると共に、ゼロクロス法を用いて生体信号の周波数の時系列波形を求める。そして、周波数傾き時系列解析演算手段612が、ピーク検出法及びゼロクロス法による各周波数の時系列波形のそれぞれについて、周波数傾き時系列波形を求め、各周波数傾き時系列波形について絶対値処理手段618が絶対値処理する(図9[10]のステップ)。 The absolute value processing means (absolute value processing step) 618 performs absolute value processing on the frequency slope time series waveform obtained by the frequency slope time series analysis calculation means 612 and outputs it. At this time, the absolute value processing means 618 performs absolute value processing and outputs the frequency gradient time series waveform obtained by using both the peak detection method and the zero cross method. Specifically, the frequency calculation means 611 obtains the time series waveform of the frequency of the biological signal using the peak detection method, and obtains the time series waveform of the frequency of the biological signal using the zero cross method. Then, the frequency slope time series analysis calculation means 612 obtains a frequency slope time series waveform for each time series waveform of each frequency by the peak detection method and the zero cross method, and the absolute value processing means 618 for each frequency slope time series waveform. Absolute value processing is performed (step of FIG. 9 [10]).
上記のように、ピーク検出法は低周波成分に高周波成分が付加された生体信号の波形の乱れを検出しているのに対し、ゼロクロス法は生体信号の低周波成分を検出しており、波形の乱れは少ない。すなわち、両者が一致している時は、重畳成分が少ないことを意味し、乖離している時は、重畳成分が多く含まれていることを意味している。従って、絶対値処理手段618により得られた2つのデータを比較することで、交感神経系が亢進した過緊張状態あるいは我慢状態にあるか、交感神経の低下により副交感神経優位となるか、交感神経の低下を伴わずに副交感神経が優位となりリラックス状態に誘導されるか、あるいは交感神経・副交感神経共に低下することによる機能低下状態又は休息必要状態にあるかの状態判定を行うことができる。すなわち、絶対値処理手段618により、ゼロクロス法を用いて算出した絶対値がピーク検出法を用いて算出した絶対値よりも高い場合には交感神経亢進の状態であり、逆の場合は副交感神経優位な状態であると判定できる(図8(a)参照)。 As described above, the peak detection method detects a disturbance in the waveform of a biological signal in which a high-frequency component is added to a low-frequency component, whereas the zero-cross method detects a low-frequency component in a biological signal. There is little disturbance. That is, when the two coincide with each other, it means that there are few superimposed components, and when they are separated, it means that many superimposed components are included. Therefore, by comparing the two data obtained by the absolute value processing means 618, whether the sympathetic nervous system is in an overstressed state or endurance state, whether the sympathetic nerve is reduced, the parasympathetic nerve is dominant, or the sympathetic nerve It is possible to determine whether the parasympathetic nerve is dominant without being reduced and induced in a relaxed state, or whether the function is in a reduced function state or a rest required state due to a decrease in both the sympathetic nerve and the parasympathetic nerve. That is, when the absolute value calculated using the zero cross method by the absolute value processing means 618 is higher than the absolute value calculated using the peak detection method, the state is in a state of sympathetic nerve enhancement. It can be determined that the current state is not correct (see FIG. 8A).
恒常性維持機能段階算出手段(恒常性維持機能段階算出ステップ)619は、周波数傾き時系列解析演算手段612により求めた周波数傾き、微分手段614により求めた微分値、積分手段615により求めた積分値、方形波算出手段617により求めた方形波の正負、記述関数算出手段618により求めた記述関数振幅値、及び絶対値処理手段619により求めた周波数傾き時系列波形の2つの絶対値のうち、少なくとも1つ以上を用いて恒常性維持機能レベルの段階を求める。これらの組み合わせにより、上記の恒常性維持機能段階1〜5のいずれに該当するかを求める。例えば、周波数傾きと積分値を用いて、所定以上の場合に「恒常性維持機能段階1」と判定し、あるいは、微分値が所定位置以下であって、方形波が「負」、記述関数振幅値が所定値以上、かつ、2つの絶対値のうちの「ピーク優位」の場合に「恒常性維持機能段階4」と判定するように設定できる。これらの組み合わせ、判定の際の閾値等は限定されるものではなく、複数の被験者のデータを統計処理して決定することもできるし、個人毎に設定することもできる。 The homeostasis maintenance function stage calculation means (constant maintenance function stage calculation step) 619 includes a frequency slope obtained by the frequency slope time series analysis operation means 612, a differential value obtained by the differentiation means 614, and an integral value obtained by the integration means 615. Of the square wave obtained by the square wave calculating means 617, the description function amplitude value obtained by the description function calculating means 618, and the two absolute values of the frequency gradient time series waveform obtained by the absolute value processing means 619, at least. Use one or more to determine the level of the homeostatic function level. Which of the above-described homeostasis maintenance function stages 1 to 5 is determined by these combinations. For example, using a frequency slope and an integral value, if it is above a predetermined value, it is determined as “constancy maintaining
なお、恒常性維持機能段階算出手段619による状態判定は、各指標を次のように組み合わせて行うことが好ましい。 In addition, it is preferable that the state determination by the homeostasis maintenance function
(1)恒常性維持機能段階1の判定:
・ゼロクロス法による周波数傾き時系列波形が正の場合、
又は、
・ゼロクロス法による周波数傾き時系列波形の積分波形が正の場合
これらの波形が正の場合、人の交感神経活動が優位となっているため、高活性状態と判定するのに適しているからである。(1) Determination of homeostasis maintenance function stage 1:
・ When the frequency slope time series waveform by the zero cross method is positive,
Or
・ When the integrated waveform of the time-series waveform of the frequency gradient by the zero cross method is positive If these waveforms are positive, human sympathetic nerve activity is dominant, so it is suitable for determining a highly active state. is there.
(2)恒常性維持機能段階2の判定:
・ゼロクロス法による周波数傾き時系列波形が負の場合において、今回の傾きと前回の傾きとの比が所定値以上で、この比の出現が所定回数以下の場合、
又は、
・積分波形が所定の値の範囲の場合
周波数傾き時系列波形が負の場合であっても、所定値以上であればあるいは積分波形が所定の値の範囲内であれば、ある程度の活性状態が維持されているからである。(2) Determination of homeostasis maintenance function stage 2:
When the frequency slope time series waveform by the zero cross method is negative, if the ratio of the current slope to the previous slope is greater than or equal to a predetermined value and the occurrence of this ratio is less than or equal to the predetermined number of times,
Or
・ When the integral waveform is in the range of the predetermined value Even if the frequency gradient time-series waveform is negative, if the integral waveform is within the predetermined value range, there is a certain degree of active state. It is because it is maintained.
(3)恒常性維持機能段階3の判定:
・ゼロクロス法による周波数傾き時系列波形が負の場合において、今回の傾きと前回の傾きとの比が所定値以上で、この比の出現が所定回数以上の場合、
又は、
・積分波形が所定の値の範囲(恒常性維持機能段階2の場合よりも低い範囲)の場合、
又は、
・微分波形が所定の値以下の場合
これらの範囲で交感神経と副交感神経のバランスが良い状態を示すからである。(3) Determination of homeostasis maintenance function stage 3:
When the frequency slope time series waveform by the zero cross method is negative, if the ratio of the current slope to the previous slope is greater than or equal to a predetermined value and this ratio appears more than a predetermined number of times,
Or
・ When the integral waveform is within the range of the predetermined value (range lower than the case of the homeostasis function stage 2),
Or
This is because when the differential waveform is less than or equal to a predetermined value, the sympathetic nerve and the parasympathetic nerve are well balanced in these ranges.
(4)恒常性維持機能段階4の判定:
・微分波形が所定の値以下(恒常性維持機能段階3の場合よりも低い値)の場合、
又は、
・積分波形が所定の値の範囲(恒常性維持機能段階3の場合よりも低い範囲)の場合、
又は、
・傾き時系列波形の記述関数振幅値が所定値以上であって、方形波が負、かつ、ピーク検出法で算出した絶対値がゼロクロス法による絶対値よりも優位の場合
これらの範囲で、副交感神経活動が徐々に優位になる傾向を示すからである。(4) Determination of homeostasis maintenance function stage 4:
・ If the differential waveform is less than or equal to the specified value (lower than the value in the homeostasis function stage 3),
Or
-If the integral waveform is within the range of the predetermined value (range lower than the case of the homeostasis function stage 3),
Or
・ When the amplitude value of the description function of the slope time series waveform is greater than or equal to the specified value, the square wave is negative, and the absolute value calculated by the peak detection method is superior to the absolute value by the zero-cross method. This is because neural activity tends to gradually become dominant.
(5)恒常性維持機能段階5の判定:
・微分波形が所定の値以下(恒常性維持機能段階4の場合よりも低い値)の場合、
又は、
・積分波形が所定の値以下(恒常性維持機能段階4の場合の下限値よりも低い値)の場合、
又は、
・傾き時系列波形の記述関数振幅値が所定値以上(恒常性維持機能段階4の場合よりも高い値)であって、方形波が負、かつ、ピーク検出法で算出した絶対値がゼロクロス法による絶対値よりも優位の場合
これらの範囲で、副交感神経活動が優位となり、機能低下によって疲労を感じるからである。(5) Determination of homeostasis maintenance function stage 5:
・ If the differential waveform is below the specified value (lower than the value in the homeostasis maintenance function stage 4),
Or
-If the integral waveform is below a predetermined value (a value lower than the lower limit in the case of the homeostasis function stage 4),
Or
・ The description function amplitude value of the slope time series waveform is greater than or equal to a predetermined value (a higher value than in the case of the homeostasis function stage 4), the square wave is negative, and the absolute value calculated by the peak detection method is the zero cross method. This is because the parasympathetic nerve activity is dominant in these ranges, and fatigue is felt due to functional decline.
(6)入眠予兆の判定:
・ゼロクロス法で算出した絶対値がピーク検出法による絶対値よりも優位の場合であって、方形波が正、かつ、恒常性維持機能段階を示すグラフが2段階以上下がる場合
ゆらぎの範囲を逸脱する大きな動きであり、このような現象が生じた後にマイクロスリープが出現するからである。(6) Determination of sleep onset sign:
・ When the absolute value calculated by the zero cross method is superior to the absolute value by the peak detection method, the square wave is positive, and the graph indicating the homeostasis function function level falls by two or more levels. This is because the micro sleep appears after such a phenomenon occurs.
ここで、本出願人が従来行っている周波数傾き時系列波形と周波数変動時系列波形とを用いた判定は、入眠予兆信号という人の代謝変化に起因する状態を主として判定するものであった。つまり、時間経過と共に一方的に肉体が疲れていく過程を主として見ているものであった。しかしながら、本実施形態の恒常性維持機能段階算出手段619により表示される図11(a)〜(e)のような折れ線グラフによる表示は、上記したように、周波数傾き、微分値、積分値、方形波の正負、記述関数振幅値、及び絶対値の各指標を複数組み合わせて行われるため、代謝作用による人の状態変化だけでなく、各状態における恒常性維持機能の復元性能、減衰性能が示唆され、かつ、脳の刺激に伴う賦活化及び状態変化も併せて見ることができる。そのメカニズムを説明すると次の通りである。 Here, the determination using the frequency gradient time-series waveform and the frequency fluctuation time-series waveform that the applicant of the present invention has conventionally performed is mainly to determine a state caused by a person's metabolic change, a sleep-onset signal. In other words, it was mainly looking at the process of unilaterally tiring the body over time. However, the display by the line graph as shown in FIGS. 11A to 11E displayed by the homeostasis function
まず、睡眠状態は代謝のエネルギーが最少レベルにあり、平常・運動状態ではエネルギーレベルが高位の状態にあり、安静状態はその中間に位置する。リラックス状態での定常運転状態では安静状態に近いエネルギーレベルになる。一方、睡眠との戦い、周辺状況への配慮・注意、危険運転などでは心拍数が上昇し、平常・運動状態に近いものとなる。各状態における恒常性の維持は、個人の身体・精神能力によって決まるゆらぎ幅を逸脱しないように調整が行われている。 First, the sleep state has the lowest level of metabolic energy, the normal / exercise state has a high energy level, and the resting state is in the middle. In a steady operation state in a relaxed state, the energy level is close to a rest state. On the other hand, in the fight against sleep, consideration and attention to surrounding conditions, dangerous driving, etc., the heart rate rises, and it becomes close to normal / exercise state. The maintenance of homeostasis in each state is adjusted so as not to deviate from the fluctuation range determined by the individual's physical and mental ability.
人の状態変化は、低次元カオスによって、特徴抽出が可能であることが知られている。睡眠状態での恒常性維持機能のゆらぎはカオティックに変動し、平常・活動状態ではランダムあるいは周期的(以下、非カオス的と呼ぶ)に変動する。この非カオス的な変動を示している状態では、外的ストレスなどの環境変化への適用性が乏しくなる。ドライバーが車を運転している状態で、カオティックな変動を示している状況の下では、ドライバーは外部振動を知覚し難くなり、呼吸や心拍のゆらぎに影響を受け難い。すなわちカオティックな変動は恒常性維持のためのエネルギー消費量を最少限にし、疲労の進行を抑制する。この状態のドライバーはリラックス状態に誘導され、交感神経の過度な緊張が軽減される。一方、非カオス的な変動状態ではドライバーに外部振動が伝わりやすく、呼吸や心拍に影響を与え、各器官に無駄な力が入り、の抵抗疲労感を生む。この疲労感がエネルギー消費量を増大させ、疲労の進行の勾配が大きくなる。ここで人は、交感神経優位な状態となる。 It is known that human state changes can be extracted by low-dimensional chaos. The fluctuation of the homeostasis maintenance function in the sleep state fluctuates chaotically, and in the normal / active state, it fluctuates randomly or periodically (hereinafter referred to as non-chaotic). In a state showing this non-chaotic fluctuation, applicability to environmental changes such as external stress becomes poor. Under conditions where the driver is driving a car and showing chaotic fluctuations, the driver is less likely to perceive external vibrations and is less susceptible to breathing and heart rate fluctuations. That is, chaotic fluctuations minimize the energy consumption for maintaining homeostasis and suppress the progress of fatigue. The driver in this state is guided to a relaxed state, and excessive sympathetic nerve tension is reduced. On the other hand, in a non-chaotic fluctuation state, external vibrations are easily transmitted to the driver, which affects breathing and heartbeat, and wasteful force enters each organ, creating a feeling of resistance fatigue. This feeling of fatigue increases energy consumption, and the gradient of progress of fatigue increases. Here, the person is in a sympathetic dominant state.
人体の恒常性維持機能をばね−マス−ダッシュポット系で置き換えて考えてみた。ばね系はエネルギーを蓄え力に変換する機能で、これを交感神経系とした。一方、ダッシュポット系はエネルギーを減衰させる機能で、これを副交感神経系とした。マスは、生命維持機能である心循環器系とした。生命維持機能の恒常性維持を受け持つ中枢系と、外界からの刺激を緩和する末梢系の恒常性維持機能の2つの機能で生体の制御を行うこととした。これら2つの機能の特性は非線形性を含むため、記述関数として表される。背部に置かれたエアパックセンサは、主に中枢系に近いところの状態を捕捉する。エアパックセンサで捉えられた信号は、心臓の動きによる大動脈の揺れである。 I thought about replacing the homeostasis maintenance function with a spring-mass-dashpot system. The spring system is a function that stores energy and converts it into force, and this is the sympathetic nervous system. On the other hand, the dashpot system is a function of attenuating energy, and this is a parasympathetic nervous system. The mass is the cardiovascular system, which is a life support function. It was decided to control the living body with two functions: a central system responsible for maintaining homeostasis of life support functions and a peripheral homeostasis maintenance function that relieves stimuli from the outside world. Since the characteristics of these two functions include nonlinearity, they are expressed as description functions. The air pack sensor placed on the back mainly captures the state close to the central system. The signal captured by the air pack sensor is a shake of the aorta due to the movement of the heart.
人は恒常性の維持を自律神経系で制御する。副交感神経は、大きな変動は起こさない。従って、副交感神経優位は、交感神経の機能低下で生じる。つまり、心拍数の安定性は交感神経と副交感神経のバランスで制御される。心拍数の過度の上昇は副交感神経で抑制される(結果として迷走迷走神経反射が起こり、徐脈になる。)。人は交感神経と副交感神経のバランスのとれた自然体の状態、交感神経が亢進した緊張状態、交感神経も副交感神経も機能低下する疲労状態、副交感神経優位な回復期にあたるリラックス状態があり、これらの組み合わせが変化に対応する柔軟性を産み、恒常性を維持する助けとなる。 Humans control homeostasis with the autonomic nervous system. The parasympathetic nerve does not cause major fluctuations. Therefore, parasympathetic nerve predominance occurs due to a decrease in sympathetic nerve function. That is, heart rate stability is controlled by the balance between sympathetic and parasympathetic nerves. An excessive increase in heart rate is suppressed by the parasympathetic nerve (resulting in vagus vagal reflexes and bradycardia). Humans have a natural body state that balances sympathetic and parasympathetic nerves, a tension state with increased sympathetic nerves, a fatigued state in which both the sympathetic nerve and parasympathetic nerve function decline, and a relaxed state that is in a period of parasympathetic dominant recovery. Combinations provide flexibility to respond to changes and help maintain homeostasis.
これらのことから、人の状態を推定していくには、自律神経系の変化を逆問題として解いていくことであり、生体のゆらぎの微分情報、交感神経と副交感神経のゆらぎの出現度合いから、まず緊張状態かリラックス状態かを判定する(図8(a))、次にゆらぎ波形の特徴のある変化を見て、活性状態、安静状態、機能低下状態あるいはそれらの遷移状態にあるかを判断する(図8(b))。次いで、過去の状態の組み合わせから、その後の状態を推定する(図8(c))。過去の状態の組み合わせとは、交感神経の亢進を表すゆらぎ波形の突出の状態とその出現回数、疲労の急激な進行(恒常性維持機能の急激な変化)の状態、その急激変化の回数、心拍の周波数の変動の傾向を表す方形波の情報である。これが入眠予兆現象などの推定に役立つ。 From these facts, to estimate the human state, it is necessary to solve changes in the autonomic nervous system as an inverse problem, from the differential information of biological fluctuations, the degree of appearance of fluctuations of sympathetic and parasympathetic nerves First, it is determined whether it is in a tension state or a relaxed state (FIG. 8 (a)). Next, by looking at the characteristic change of the fluctuation waveform, it is determined whether it is in an active state, a rest state, a reduced function state or a transition state thereof. Judgment is made (FIG. 8B). Next, the subsequent state is estimated from the combination of the past states (FIG. 8C). The combination of past states is the state of the protrusion of the fluctuation waveform representing the increase in sympathetic nerves and the number of appearances thereof, the state of rapid progression of fatigue (the rapid change in homeostasis maintenance function), the number of rapid changes, the heart rate It is the information of the square wave showing the tendency of the fluctuation | variation of the frequency. This is useful for estimating a sleep onset symptom phenomenon.
一方、精神疲労と肉体疲労の寄与率に応じた疲労の仕方を考えた場合、従来、疲労の自然な進行として、疲労感を感じていない段階、疲労感を交感神経の代償作用で補い疲労感を感じていない状態、疲労感を覚え、ヒューマンエラーが発生する段階の3つの段階があると言われている。 On the other hand, when considering the way of fatigue according to the contribution rate of mental fatigue and physical fatigue, conventionally, as a natural progression of fatigue, the feeling of fatigue is not compensated, and the feeling of fatigue is compensated by the compensation of sympathetic nerves. It is said that there are three stages: a state in which the user does not feel fatigue, a feeling of fatigue, and a stage in which human error occurs.
しかし、緊張状態では、精神疲労の寄与率が高く、リラックス状態では肉体疲労が疲労の進行を支配すると考えられる。ところが、従来の疲労の進行の考え方では、脳機能の活性化による疲労の抑制が考慮されていない。一般的な運転環境下では、疲労の進行度合いに拘わらず、脳機能の活性化が生じる。この脳機能の活性化には創造性や好奇心などがあり、これらは覚醒誘導をもたらす。 However, the contribution rate of mental fatigue is high in the tension state, and physical fatigue is considered to dominate the progress of fatigue in the relaxed state. However, the conventional concept of fatigue progression does not consider the suppression of fatigue due to the activation of brain function. Under a general driving environment, brain function is activated regardless of the degree of progress of fatigue. This activation of brain function includes creativity and curiosity, which lead to arousal induction.
このことは、図11(a)〜(e)に示したように、生体ゆらぎ(代謝作用)による増減だけでなく、恒常性維持機能段階が急に元に戻る過程が生じたり、時間経過によっても恒常性維持機能段階がほとんど進行しない過程が見られることがわかる。つまり、単に、人の肉体が疲れている様を示しているのではなく、疲労に対する許容量の拡大過程をも示すグラフになっていると考えられる。疲労に対する許容量の拡大は、脳から指令によるもの、つまり脳の賦活化に起因する活性化によるものであり、このグラフは、代謝作用による人の状態変化だけでなく、脳の作用による人の状態(特に、「心のありさま(情態)」)の変化をも捉えているものと言える。従って、本発明において、「人(生体)の状態」の推定には、代謝作用に起因した状態変化だけでなく、恒常性維持機能のゆらぎの状態を通して、その性能劣化の様子から疲労の進行を推断すること、また、脳の賦活化に起因する再活性による状態変化を推定することも含む。 As shown in FIGS. 11 (a) to (e), this is not only an increase / decrease due to biological fluctuations (metabolism), but also a process in which the homeostasis maintenance function suddenly returns to its original state, It can be seen that there is a process in which the homeostasis maintenance function stage hardly progresses. That is, it is considered that the graph does not simply indicate that the human body is tired but also shows the process of expanding the tolerance for fatigue. The expansion of the tolerance for fatigue is due to the command from the brain, that is, the activation due to the activation of the brain, and this graph shows not only the change in the human state due to metabolic action but also the human action due to the action of the brain. It can be said that it also captures changes in the state (especially “the state of the heart (condition))”. Therefore, in the present invention, the estimation of the “human (biological) state” is not limited to the state change caused by metabolic action, but also the progress of fatigue from the state of performance deterioration through the state of fluctuation of homeostasis maintenance function. Inferring and estimating state changes due to reactivation due to brain activation are also included.
上記生体状態推定装置60による状態推定過程を図7のフローチャートに基づき説明すると、まず、生体信号測定手段1により背部の大動脈の動きによるエアパック信号を得る(S101)。なお、S101のエアパック信号は、エアパックの圧力変動の信号そのものではなく、所定のフィルタリング(生体信号以外のノイズ信号を低減するアナログフィルタリング処理)を施した後の信号である。このエアパック信号を周波数演算手段611により処理することもできるが、より精度を高めるために、このエアパック信号にさらにフィルタリング手段を施し(S102)、解析に必要な周波数領域の信号波形(エアパック信号デジタルフィルタ波形)を得ている(S103)。このさらなるフィルタリング手段(以下、「デジタルフィルタリング手段」という)は、自動車の走行時において車体フロアから入力される振動(ノイズ)をできるだけ除去するものである。そのため、このデジタルフィルタリング手段は、静的環境下(なお、本明細書でいう「静的環境下」には、エンジンが始動しておらず全く振動の入力がない測定環境のほか、実質的な静的環境下(すなわち静的相当環境下)と言えるアイドリング状態(走行時のように路面凹凸に起因する振動が入力されない状態)での測定環境下も含む意味である)において、数秒間から数十秒間、生体信号測定手段1により生体信号を測定して、その平均周波数を求め、該平均周波数を基準値としてフィルタリングする周波数帯域(下限周波数と上限周波数)を設定する構成である。これにより、走行時に路面から車体フロアを介して入力される振動波形の混入が少なくなり、人の恒常性維持機能段階が同じとした場合における、上記デジタルフィルタリング手段を適用した静的環境下において得られるエアパック信号フィルタ波形と走行時に得られるエアパック信号デジタルフィルタ波形とがほぼ同じ波形となる。 The state estimation process by the biological
なお、デジタルフィルタリング手段において基準となる平均周波数の求め方は限定されるものではないが、本実施形態では、生体信号測定手段1により得られた生体信号そのものの波形(すなわち圧力波形)を微分(好ましくは2階微分)し、微分波形に全波整流を適用し、さらにローパスフィルターを適用する。ローパスフィルターのフィルタリング周波数は、背部大動脈の動きによる生体信号の一般的な周波数である1〜3Hzの範囲で適宜に設定される。ローパスフィルターを適用した波形からピークを求め、さらにピークの時間間隔から平均周波数を求める。この手法によるフィルタリングを施して得られた波形を図10(a),(b)に示す。図10(a)は静的相当環境下であるアイドリング状態におけるエアパック信号波形とエアパック信号デジタルフィルタ波形との比較であり、図10(b)は運転時(走行時)におけるエアパック信号波形とエアパック信号デジタルフィルタ波形との比較である。この図から、エアパック信号波形は、運転時(走行時)においては静的相当環境下であるアイドリング状態と異なり、上下に突出する乱れた波形を示しているのに対し、エアパック信号デジタルフィルタ波形の場合は、静的アイドリング状態と運転時(走行時)とにおいてほぼ同じ波形となっている。従って、走行前のアイドリング状態(静的相当環境下)で予め生体信号を測定し、それを基準としてフィルタリングすることは高い精度の測定結果を得るために非常に好ましい。 In addition, although the method of calculating | requiring the average frequency used as a reference | standard in a digital filtering means is not limited, In this embodiment, the waveform (namely, pressure waveform) of the biological signal itself obtained by the biological signal measuring means 1 is differentiated ( Preferably, second-order differentiation), full-wave rectification is applied to the differential waveform, and a low-pass filter is applied. The filtering frequency of the low-pass filter is appropriately set within a range of 1 to 3 Hz, which is a general frequency of a biological signal due to movement of the back aorta. The peak is obtained from the waveform to which the low-pass filter is applied, and the average frequency is obtained from the peak time interval. Waveforms obtained by filtering by this method are shown in FIGS. 10 (a) and 10 (b). FIG. 10A is a comparison between an air pack signal waveform and an air pack signal digital filter waveform in an idling state under a static equivalent environment, and FIG. 10B is an air pack signal waveform during operation (running). And the air-pack signal digital filter waveform. From this figure, the air pack signal waveform shows a distorted waveform protruding up and down, unlike the idling state under static equivalent environment during driving (running), whereas the air pack signal digital filter In the case of the waveform, the waveform is substantially the same in the static idling state and during operation (running). Therefore, in order to obtain a highly accurate measurement result, it is very preferable to measure a biological signal in advance in an idling state (under a static equivalent environment) before traveling and perform filtering based on the measured signal.
S103において得られたエアパック信号フィルタ波形は、周波数演算手段611によって処理され、該エアパック信号フィルタ波形の周波数の時系列波形がゼロクロス法及びピーク検出法により求められる(S104)。次に、ゼロクロス法によるエアパック信号フィルタ波形の周波数の時系列波形を用いて、周波数傾き時系列波形、その微分波形(微分値)、積分波形(積分値)、方形波、記述関数(記述関数振幅値)を求めると共に、ゼロクロス法の周波数傾き時系列波形とピーク検出法による周波数傾き時系列波形を絶対値処理した波形を求める(S105)。次に、恒常性維持機能段階算出手段619により恒常性維持機能段階を判定し(S106)、出力手段62により表示手段65に出力する(S107)。 The air pack signal filter waveform obtained in S103 is processed by the frequency calculation means 611, and the time series waveform of the frequency of the air pack signal filter waveform is obtained by the zero cross method and the peak detection method (S104). Next, using the time series waveform of the frequency of the air pack signal filter waveform by the zero cross method, the frequency gradient time series waveform, its differential waveform (differential value), integrated waveform (integrated value), square wave, description function (description function) (Amplitude value) and a waveform obtained by performing absolute value processing on the frequency gradient time-series waveform of the zero cross method and the frequency gradient time-series waveform of the peak detection method (S105). Next, the homeostasis maintenance function stage calculation means 619 determines the homeostasis maintenance function stage (S106), and the output means 62 outputs it to the display means 65 (S107).
(試験例1)
本実施形態に係るエアパック10を備えた生体信号測定手段1により検出された背部の大動脈の動きによる圧力変動の信号(エアパック信号)の有効性を検証する試験として、心電図との比較を行った。(Test Example 1)
As a test for verifying the effectiveness of the pressure fluctuation signal (air pack signal) due to the movement of the back aorta detected by the biological signal measuring means 1 including the
被験者は20歳代〜30歳代の計4名(男性2名、女性2名)である。測定項目は心電図と、人体各部位に当接したエアパックから得られた圧力変動の信号(エアパック信号)である。エアパック信号は、上記実施形態の自動車用シート500とベッド用マットレスを使用して、頸部、上腕、橈骨、大腿から採取した。実験は座位、仰臥位にてそれぞれ3分間計測して行った。 There were a total of 4 subjects (2 men and 2 women) in their 20s and 30s. The measurement items are an electrocardiogram and a pressure fluctuation signal (air pack signal) obtained from the air pack in contact with each part of the human body. The air pack signal was collected from the neck, upper arm, ribs and thigh using the
図14は、30歳代女性被験者の心電図とエアパック信号の比較結果であり、図14(a)はエアパック信号と心電図の原波形の一部を示す。心電図とエアパック信号の原波形を比較すると心電図のピーク値(R波)はエアパック信号の極小値とほぼ一致していることがわかる。図14(b)はエアパック信号と心電図から算出した心拍周波数時系列波形を比較した結果を示す。心拍周波数は座位、仰臥位共に心電図と背部、頸部で波形の一致がみられる。他の3名も同様の結果であり、特に心電図と背部エアパック信号は安定した一致をみせた。また、仰臥位の状態においても、体動により一時的に乱れても、その後心電図との高い相関を示し、乱れたまま崩れていくことはなかった。 FIG. 14 is a comparison result of an electrocardiogram and an air pack signal of a female subject in their thirties, and FIG. 14 (a) shows a part of the original waveform of the air pack signal and the electrocardiogram. Comparing the electrocardiogram and the original waveform of the air pack signal, it can be seen that the peak value (R wave) of the electrocardiogram substantially coincides with the minimum value of the air pack signal. FIG. 14B shows the result of comparing the air-pack signal and the heart rate frequency time-series waveform calculated from the electrocardiogram. As for the heart rate frequency, there is a coincidence of the waveform between the electrocardiogram and the back and neck in both the sitting position and the supine position. The same results were obtained for the other three persons, and in particular, the electrocardiogram and the back air pack signal showed stable agreement. Also, even in the supine position, even if it was temporarily disturbed by body movement, it showed a high correlation with the electrocardiogram and did not collapse.
背部エアパック信号は心臓に最も近い部位から得た生体信号であり、心電図との相関性も高いことから、背部に設けられたエアパックセンサは心臓の動きによる大動脈の揺れを捕捉していると考えられる。また、心電図とエアパック信号の原波形の極性反転は、心臓が収縮している収縮期の動脈血管の拡張と心臓が弛緩して、血液の流入により拡張している拡張期の動脈血管の収縮の関係に相当するものと考えられる。図14(b)上のA,B,C部に示す心電図とエアパック信号の大きなずれは体動によるものである。つまりエアパック信号は、体動による変化も敏感に捉えることができると考えられる。そして、拘束性の高い自動車用シートの被験者の微小な体動は図14(a)のA,B,C部のように捉えることはできないが、大きな運転動作による体動(体を前に大きくせり出した場合など)は図14(b)のA,B,C部のように捉えることができる。これらの体動は、人が通常とは異なる不安定状態、あるいは異常状態になった時に生じることから、エアパックセンサにより信号を検知できなくなった途端に何らかの異常事態であると判定することもできる。 The back air pack signal is a biological signal obtained from the part closest to the heart and has a high correlation with the electrocardiogram, so the air pack sensor provided on the back captures the shaking of the aorta due to the movement of the heart. Conceivable. In addition, the polarity reversal of the original waveforms of the ECG and air pack signals is caused by the expansion of the arterial blood vessels in the systole during which the heart is contracting and the contraction of the arterial blood vessels in the diastole which is expanded by the inflow of blood when the heart is relaxed It is thought that it is equivalent to this relationship. The large deviation between the electrocardiogram and the air pack signal shown in parts A, B, and C in FIG. 14B is due to body movement. In other words, it is considered that the air pack signal can also be sensitive to changes due to body movement. And the minute body movement of the subject of the car seat with high restraint cannot be grasped like the parts A, B, and C in FIG. The case where it protrudes) can be grasped as A, B, C in FIG. 14B. These body movements occur when a person is in an unstable state or abnormal state that is different from the normal state, so it may be determined that there is some abnormal situation as soon as the signal cannot be detected by the air pack sensor. it can.
(試験例2)
−解析例1−
(試験条件)
50歳代の男性被験者A、40歳代の女性被験者B及び40歳代の男性被験者Bの3名を、広島県東広島市から富山県黒部市まで自動車で3日間かけて往復させた。1泊目は黒部市に宿泊し、2泊目は京都市に宿泊した。1日目は、東広島市から黒部市に向かい、2日目は、黒部市から京都市に向かい、3日目は、京都市から大阪市に向かって打ち合わせを行った後に東広島市に向かった。また、3名の被験者は中途で適宜に運転を交代しながら試験した。試験に用いた車両の運転席には、本実施形態のエアパック10をシートバック部510に内蔵させたシート500を搭載した。結果を図15〜図30に示す。各図において(a)は、ゼロクロス法を用いた周波数傾き時系列解析演算手段612から得られた周波数傾き時系列波形(図では「エアパック脈波周波数傾き」と表示)と、周波数変動時系列解析演算手段613から得られた周波数変動波形(図では「エアパック脈波周波数変動」と表示」)を示した。(b)は、(a)の周波数傾き時系列波形を用いて、記述関数算出手段617により得られた記述関数(伝達関数)の推移を示し、(c)は、(a)の周波数傾き時系列波形を用いて、方形波算出手段616から得られた方形波の推移を示す。(d)は、(a)〜(c),(f)の各データ等を用いて、恒常性維持機能段階算出手段619により算出された恒常性維持機能段階の推移(判定結果)を示したものである。(e)は、絶対値処理手段618により得られたピーク検出法による絶対値とゼロクロス法による絶対値とをそれぞれ積分したグラフである。(f)は、絶対値処理手段618により得られたピーク検出法による絶対値とゼロクロス法による絶対値との時系列の推移を示したものでる。(g)は、周波数傾き時系列波形の積分波形を示したものである。(Test Example 2)
-Analysis Example 1
(Test conditions)
Three people, a male subject A in the 50s, a female subject B in the 40s, and a male subject B in the 40s, were reciprocated over three days by car from Higashihiroshima City, Hiroshima Prefecture to Kurobe City, Toyama Prefecture. I stayed in Kurobe City for the first night and stayed in Kyoto for the second night. On the first day, head from Higashihiroshima City to Kurobe City. On the second day, head from Kurobe City to Kyoto City. On the third day, head to Kyoto City from Osaka City and then head for Higashihiroshima City. It was. In addition, three subjects tested while changing driving appropriately in the middle. A
(考察)
主として、各図の(d)に示した判定結果と各被験者の実際の様子とを基に説明する。
(1)男性被験者A 黒部方面1(往路)(図15)
計測開始〜2000秒前後までは疲労感はあるものの、比較的調子の良い状態が続いている。疲労感の軽減は生体ゆらぎによるもので、交感神経の代償作用は生じていないと思われる。その後入眠予兆現象が発現し、疲労が進行して行った。そして、3000秒強で眠気が発生し運転を交代した。(Discussion)
The description will be mainly based on the determination result shown in (d) of each figure and the actual state of each subject.
(1) Male subject A Kurobe area 1 (outward) (FIG. 15)
From the start of measurement to around 2000 seconds, although there is a feeling of fatigue, the state of relatively good condition continues. The reduction of fatigue is due to biological fluctuations, and it seems that the sympathetic nerve does not compensate. After that, the symptoms of sleep onset occurred and fatigue progressed. Then, drowsiness occurred in over 3000 seconds and the driving was changed.
(2)女性被験者B 黒部方面2(往路)(図16)
1800〜3000秒間は調子の良い状態が続いた。それ以外は混雑(追い越し車線をのろのろ走行の車に車線をふさがれて)でイライラ運転であった。4200秒強で眠気の発生が認められる。(2) Female subject B, Kurobe area 2 (outward) (FIG. 16)
A good condition continued for 1800 to 3000 seconds. Other than that, it was crowded (occupying the overtaking lane with a car driving in the lane) and frustrating. Occurrence of drowsiness is observed after 4200 seconds.
(3)男性被験者A 黒部方面3(往路)(図17)
最初の600秒間は調子の良い状態が続いたが、その後渋滞が発生し疲労状態に入った。この間の疲労は精神的なものが大きく、5100秒強で最初の入眠予兆信号が発現した。その後は交感神経の代償作用が機能し、9600秒強で二回目の入眠予兆信号が生じた。渋滞のイライラと夜間運転と緊張による疲労感で、2回の入眠予兆信号の発現で夕食をとった。(3) Male subject A, Kurobe area 3 (outward) (FIG. 17)
The first 600 seconds continued to be in good condition, but then a traffic jam occurred and the tired state was entered. The fatigue during this period was very mental, and the first signal of sleep onset appeared in just over 5100 seconds. After that, the compensatory action of the sympathetic nerve functioned, and a second sleep predictive signal was generated in just over 9600 seconds. We had dinner with the emergence of a sleep symptom signal twice due to the frustration of traffic jams, night driving and feeling of fatigue due to tension.
(4)男性被験者A 黒部方面4(往路)(図18)
夕食後元気が出たが、その元気は長続きせずに1200秒強で眠気に対抗する交感代償作用が発現した。その後は2000秒までは交感神経の亢進で元気な状態が続いた。途中交感神経のレベルが下がって副交感優位な状態になり、1回目の入眠予兆信号が生じた。2300秒以降は緊張感の低下と共に、自然な疲労の進行が認められた。(4) Male subject A Kurobe area 4 (outward) (FIG. 18)
I was fine after dinner, but the energy did not last long, and a sympathetic compensation action against sleepiness occurred for over 1200 seconds. After that, until 2000 seconds, the state of sympathetic nerves increased and continued to be healthy. On the way, the level of sympathetic nerve decreased and the parasympathetic dominant state was reached, and the first sleep predictive signal was generated. After 2300 seconds, natural fatigue progress was observed with a decrease in tension.
(5)女性被験者B 黒部方面5(往路)(図19)
計測開始時から交感代償作用が発現し、緊張を伴った疲労状態にある。1000秒強から1850秒の間で、リラックス状態で脳機能の活性が生じたと思われる区間があり、その後疲労が回復傾向になり、やや疲労感があるものの高活性状態に誘導されている。これは脳機能の活性がリラックス状態に誘導し、疲労の回復を促したと思われる。(5) Female subject B, Kurobe area 5 (outward) (FIG. 19)
The sympathetic compensation effect appears from the start of measurement, and the patient is in a fatigued state with tension. Between a little over 1000 seconds and 1850 seconds, there is a section where brain function activity seems to have occurred in a relaxed state, after which fatigue tends to recover and it is induced to a highly active state although there is a slight feeling of fatigue. This seems to have stimulated the recovery of fatigue by inducing a relaxed state of brain function activity.
(6)男性被験者A 黒部方面6(往路)(図20)
助手席における睡眠の効果があり1200秒強までの間、疲労感を感じていない状態がある。その後自然な覚醒度の低下があるが、これはサーカディアンリズムの低下に連動するものと思われる。(6) Male subject A Kurobe area 6 (outward) (FIG. 20)
There is an effect of sleeping in the passenger seat, and there is a state where the user does not feel tired until just over 1200 seconds. After that, there is a natural decrease in arousal level, which seems to be linked to a decrease in circadian rhythm.
(7)男性被験者A 京都方面1(復路)(図21)
開始より700秒間は、前日の疲れの影響がある。その後は、道に迷ったために色々と考えている。この思慮による効果で脳機能の活性化が生じたものと思われる。脳機能の活性が収まると、反動で疲労が進行していった。(7) Male subject A Kyoto direction 1 (return trip) (Fig. 21)
For 700 seconds from the start, there is the effect of the previous day's fatigue. Since then, I have been thinking a lot because I got lost. It seems that activation of brain function was caused by the effect of this thought. When the activity of the brain function subsided, the reaction progressed and fatigue progressed.
(8)男性被験者A 京都方面2(復路)(図22)
打ち合わせ後の疲労感が生体ゆらぎを大きくし、一気に疲労状態に陥っている。男性被験者Aは空腹感を覚えていたが、1100秒付近でパン屋を発見したことに起因し、一気に覚醒度が上昇している。(8) Male subject A Kyoto direction 2 (return trip) (Fig. 22)
The feeling of fatigue after the meeting increases the fluctuation of the living body and falls into a fatigued state at once. The male subject A felt hungry, but the arousal level increased at a stroke due to the discovery of a bakery around 1100 seconds.
(9)男性被験者A 京都方面3(復路)(図23)
パンを食することで注意散漫になり、運転注意が表示された。その後リラックス状態の中で緩やかに疲労感が軽減されていった。途中交感神経のレベルが下がり、二度ほど眠気が生じた。その後生体ゆらぎが生じ再度覚醒方向に振れていった。(9) Male subject A Kyoto direction 3 (return trip) (FIG. 23)
Eating bread made me distracted and driving attention was displayed. After that, the feeling of fatigue was gradually reduced in a relaxed state. On the way, the level of sympathetic nerve decreased, and drowsiness occurred twice. Later, biological fluctuations occurred, and the patient shook again in the awakening direction.
(10)女性被験者A 京都方面4(復路)(図24)
運転開始直後から疲労感があり、交感神経の亢進が認められる。緊張状態が続き、運転終了間際に眠気が生じた。(10) Female subject A Kyoto direction 4 (return trip) (Fig. 24)
There is a feeling of fatigue immediately after the start of driving, and an increase in sympathetic nerve is observed. He was nervous and drowsy just before the end of driving.
(11)男性被験者A 京都方面5(復路)(図25)
当初から疲れがあり、ゆらぎながら恒常性を維持しようとしている。機能低下が認められ交感代償作用が2400秒前後から発現した。その後、眠気が生じたが、交感代償作用により持ち直した。その後、緊張が解けてリラックス状態になることにより、疲労感が出てきたものと思われる。(11) Male subject A Kyoto direction 5 (return trip) (FIG. 25)
He is tired from the beginning and tries to maintain homeostasis while fluctuating. A decrease in function was observed, and the sympathetic compensation effect was expressed from around 2400 seconds. After that, drowsiness occurred, but it recovered by sympathetic compensation. After that, it seems that the feeling of fatigue has come out as the tension is released and the person becomes relaxed.
(12)男性被験者A 京都方面6(復路)(図26)
休憩後運転を再開したが休憩中仕事上の電話を受けていた。運転開始当初は、休憩前の状態にすばやく戻っていった。その後は、電話内容に起因すると思われるイライラが続いている。4600秒以降は交感神経が亢進したままで、急速な機能低下と眠気が各一回生じた。(12) Male subject A Kyoto direction 6 (return trip) (FIG. 26)
He resumed driving after a break, but received a work call during the break. At the beginning of driving, it quickly returned to the state before the break. After that, the frustration that seems to be caused by the contents of the phone continues. After 4600 seconds, the sympathetic nerve remained elevated, and rapid functional decline and sleepiness occurred once each.
(13)男性被験者A 京都方面7(復路)(図27)
休憩後運転を再開した。休憩後、緊張と交感神経の亢進が解けて、一気に疲労感生じた。その疲労感の解消にリラックス状態の中で栄養ドリンクを飲むことで一時的に回復したが、その後は生体ゆらぎの幅が大きくなり、疲労感を軽減していった。栄養ドリンクはリラックス方向に誘導しながらの生体ゆらぎによる回復を促すと考えられる。(13) Male subject A Kyoto direction 7 (return trip) (Fig. 27)
Driving resumed after a break. After the break, the tension and sympathetic nerves were lifted, and a feeling of fatigue occurred. To relieve the feeling of fatigue, he recovered temporarily by drinking an energy drink in a relaxed state, but after that, the range of fluctuations in the body increased, reducing the feeling of fatigue. It is thought that energy drinks promote recovery by biological fluctuations while guiding in a relaxing direction.
(14)男性被験者B 東広島方面1(復路)(図28)
疲労の蓄積は無い。揺らぎをうまく使いながら、緊張状態の中で疲労感に対処している。2550秒を超えたところで眠気が発生している。その後の機能低下は走行車線をふさぐ低速走行の車にイライラさせられることで生じた。(14) Male subject B direction Higashihiroshima 1 (return trip) (FIG. 28)
There is no accumulation of fatigue. He uses fatigue to cope with fatigue in tension. Drowsiness occurs after 2550 seconds. Subsequent functional degradation was caused by being frustrated by low-speed vehicles that blocked the driving lane.
(15)男性被験者B 東広島方面2(復路)(図29)
食事と休息で疲労感が解消され、元気な状態になった。緊張感の反動で、眠気と大きな揺らぎが生じたが、交感代償作用による緊張状態で疲労感を感じていない状態にもどった。(15) Male subject B Higashihiroshima direction 2 (return trip) (FIG. 29)
The feeling of fatigue was eliminated by eating and resting, and I was in a healthy state. The reaction of tension caused drowsiness and tremendous fluctuations, but it returned to the state of not feeling tired due to tension due to sympathetic compensation.
(16)男性被験者B 東広島方面3(復路)(図30)
1200秒を過ぎたところで急激に疲労感が出てきた。交感代償作用で一時的にもどるが、長続きしない。最後は到着に対する期待感で緊張状態になり、疲労感が小さくなった。(16) Male subject B direction Higashihiroshima 3 (return trip) (FIG. 30)
A feeling of fatigue suddenly appeared after 1200 seconds. It returns temporarily with sympathetic compensation, but it does not last long. Finally, the feeling of expectation for arrival became tense and the feeling of fatigue was reduced.
上記のことから、各被験者の実際の様子と、各図の(d)に示した判定結果から判断できる様子とがよく一致していると言える。 From the above, it can be said that the actual state of each subject and the state that can be judged from the determination results shown in (d) of each figure are in good agreement.
(試験例3)
−解析例2−
(試験条件)
上記実施形態のエアパック10を内蔵したクッションを大型トラックの運転席のシートバック部に取り付けて、夜間の長距離運転によるドライバの状態推定に関する実験を行った。実験は東京−大阪間の約500kmの高速道路の往復路で実施した。午後10時頃東京を出発し、中間地点付近のサービスエリアで、1時間程度の休憩を取り、その後、大阪へ向けて実験を再開した。午前5時頃大阪に到着後、6〜8時間程度の睡眠を取り、午後10頃に東京へ向けて復路の実験を行った。復路も往路同様に、中間地点付近のサービスエリアで、1時間程度の休憩を取った。被験者は30歳代〜40歳代の健康な男性計4名である。計測に使用した生体信号は、背部から採れる圧力波形である。(Test Example 3)
-Analysis example 2-
(Test conditions)
An experiment relating to estimation of the state of the driver by long-distance driving at night was performed by attaching a cushion incorporating the
(考察)
図31(a)〜(d)は、被験者Aの東京−大阪間の往復で行われた疲労実験の結果を示す。縦軸は恒常性維持機能段階1〜5(図では正常(高活性状態)〜異常(機能低下状態))を示し、横軸は時間軸を示す。図31(a)は往路の被験者Aの東京−美合間の恒常性維持機能の変化の様子を示す。ゆらぎの中心軸は、恒常性維持機能段階2ないし3にあり、それを基準にしてゆらぎが生じている。また、恒常性維持機能段階1の占める割合が全行程の52.5%になり、交感神経優位な緊張状態で頑張って運転していることが分かる。(Discussion)
31 (a) to 31 (d) show the results of a fatigue experiment performed by subject A in a round trip between Tokyo and Osaka. The vertical axis represents homeostasis maintenance function stages 1 to 5 (in the figure, normal (highly active state) to abnormal (function-decreasing state)), and the horizontal axis represents the time axis. FIG. 31 (a) shows a change in the homeostasis maintenance function between Tokyo and Miai for the subject A on the outbound path. The central axis of the fluctuation is in the homeostasis maintenance function stages 2 to 3, and fluctuations are generated with reference to that. In addition, the ratio of the
図31(b)は、復路の被験者Aの大阪−小笠間の疲労進行度合を示す。図31(a)と同様に図31(b)の被験者Aは、恒常性維持機能段階2ないし3を基準にしてゆらぎが生じている。異なるのは、恒常性維持機能段階1にある時間帯が少なくなる事である。確実に疲労の進行が早くなっており、長時間睡眠による完全な疲労回復に至っていないものと思われる。 FIG. 31 (b) shows the degree of fatigue progression between Osaka and Ogasa for subject A on the return path. Similar to FIG. 31 (a), the subject A in FIG. 31 (b) has fluctuations based on the homeostasis maintenance function stages 2 to 3. The difference is that the time zone in the homeostasis
図31(c)は往路で休息後の被験者Aの美合−大阪間の疲労進行度合を示す。この行程では、休息前の状態とほぼ同様の様相を示した。したがって、休息は疲労回復に効果があるものと思われる。図31(d)は復路で休息後の被験者Aの小笠−東京間の恒常性維持機能の変化の様子を示す。この行程では、図31(c)の往路とは異なる現象を示すことから、休息は一時的な疲労回復に効果があるものの、蓄積された疲労には改善効果が無いことが伺われる。これら4つの事例から、往路で一時的であるが休息を挟む事によって恒常性維持機能の活性化が期待できることが示唆される。復路の休息は、疲労の蓄積により、改善効果は認められないものの、疲労の抑制効果は有るものと思われる。他の3名についても同様な結果が得られた。 FIG. 31 (c) shows the degree of progress of fatigue between Miai and Osaka of subject A after resting on the outward trip. In this process, the situation was almost the same as before the rest. Therefore, rest seems to have an effect on recovery from fatigue. FIG. 31 (d) shows a change in the homeostasis maintenance function between Ogasa and Tokyo of subject A after resting on the return path. In this process, since a phenomenon different from the outward path of FIG. 31 (c) is shown, it can be inferred that rest has an effect on temporary fatigue recovery, but accumulated fatigue has no improvement effect. From these four cases, it is suggested that activation of the homeostasis maintenance function can be expected by temporarily resting on the way out. Resting on the return trip seems to have an effect of suppressing fatigue, although an improvement effect is not recognized due to accumulation of fatigue. Similar results were obtained for the other three people.
なお、時間経過と共に疲労が進行している場合であっても、恒常性維持機能レベルを時系列にプロットして示されるグラフが、生体のゆらぎに対応したゆらぎの範囲である場合(その時点のゆらぎのほぼ中心位置に対して、恒常性維持機能レベルで1段階から2段階の範囲)には、特に問題はない。そこで、その範囲であるか否かを視覚的に把握することを容易にするため、図32(a),(b)に示したように、ゆらぎの範囲を明示するようにすることが好ましい。図32(a)は中心に対するゆらぎの範囲を上下に伸びる矢印で示したものであり、図32(b)は、上限を示すAラインと下限を示すBラインとにより取り囲んで示したものである。 Even when fatigue progresses over time, the graph in which the homeostasis maintenance function level is plotted in time series is within the fluctuation range corresponding to the fluctuation of the living body (at that time There is no particular problem in the range of 1 to 2 steps in the homeostasis maintenance function level with respect to the approximate center position of fluctuation. Therefore, in order to make it easy to visually grasp whether or not it is within the range, it is preferable to clearly indicate the fluctuation range as shown in FIGS. 32 (a) and (b). FIG. 32A shows the range of fluctuation with respect to the center by arrows extending vertically, and FIG. 32B shows the range surrounded by the A line indicating the upper limit and the B line indicating the lower limit. .
また、図32(c)に示したように、入眠予兆信号が生じたことを時系列のグラフ中に明確に表示するため、恒常性維持機能段階1〜5の下に、「入眠予兆」の段階を表示する構成とすることもできる。グラフの急低下が生じ、判定手段63の異常状態判定手段により入眠予兆と判定された場合、そのときのグラフの下端を最下段に表示された「入眠予兆」段階まで引き延ばして表示する。これにより、入眠予兆信号が生じたタイミングを視覚的に容易に把握することができる。 Also, as shown in FIG. 32 (c), in order to clearly display the occurrence of the sleep onset sign signal in the time-series graph, the “onset sleep sign” is displayed under the homeostasis maintenance function stages 1 to 5. It can also be configured to display the stage. When a sudden drop of the graph occurs and the abnormal state determination unit of the determination unit 63 determines that the sign of sleep onset is displayed, the lower end of the graph at that time is extended to the “sleep predictor” stage displayed at the bottom. Thereby, it is possible to easily grasp the timing when the sleep onset signal is generated visually.
なお、生体信号測定手段としては、上記したエアパック10を用いたものに限らず、図33に示したものを用いることもできる。図33に示した生体信号測定手段200は、三次元立体編物210、三次元立体編物支持部材215、フィルム216、板状発泡体221,222、振動センサ230を有して構成される。 The biological signal measuring means is not limited to the one using the
三次元立体編物210は、図1等に示した生体信号測定手段1と同様のものを用いることができる。三次元立体編物210は、厚み方向の荷重−たわみ特性が、測定板上に載置して直径30mm又は直径98mmの加圧板で加圧した際に、荷重100Nまでの範囲で、人の臀部の筋肉の荷重−たわみ特性に近似したバネ定数を備えることが好ましい。具体的には直径30mmの加圧板で加圧した際の当該バネ定数が0.1〜5N/mmの範囲、又は、直径98mmの加圧板で加圧した際の当該バネ定数が1〜10N/mmであるものを用いることが好ましい。人の臀部の筋肉の荷重−たわみ特性に近似していることにより、三次元立体編物と筋肉とが釣り合い、生体信号が伝播されると、三次元立体編物が人の筋肉と同様の振動を生じることになり、生体信号を大きく減衰させることなく伝播できる。 As the three-dimensional solid knitted
板状発泡体221,222は、ビーズ発泡体により構成することが好ましい。ビーズ発泡体としては、例えば、ポリスチレン、ポリプロピレン及びポリエチレンのいずれか少なくとも一つを含む樹脂のビーズ法による発泡成形体が用いることができる。ビーズ発泡体からなる板状発泡体221,222は、個々の微細なビーズを構成している発泡により形成された球状の樹脂膜の特性により、微小な振幅を伴う生体信号を膜振動(横波)として伝播する。この膜振動(横波)が三次元立体編物に弦振動として伝わり、これらの膜振動(横波)と弦振動が重畳され、生体信号は、膜振動(横波)と弦振動が重畳されることによって増幅された機械振動として、後述する振動センサ230により検出される。従って、生体信号の検出が容易になる。 The plate-
板状発泡体221,222をビーズ発泡体から構成する場合、発泡倍率は25〜50倍の範囲で、厚さがビーズの平均直径以下に形成されていることが好ましい。例えば、30倍発泡のビーズの平均直径が4〜6mm程度の場合では、板状発泡体221,222の厚さは3〜5mm程度にスライスカットする。これにより、板状発泡体221,222に柔らかな弾性が付与され、振幅の小さな振動に共振し、フィルム上を伝わる横波に減衰が生じにくくなる。なお、板状発泡体221,222は、本実施形態のように、三次元立体編物210を挟んで両側に配置されていても良いが、いずれか片側、好ましくは、シートバック側のみに配置した構成とすることもできる。 When the plate-
ここで、三次元立体編物210は、幅40〜100mm、長さ100〜300mmの範囲の短冊状のものが用いられる。この大きさのものだと、三次元立体編物210に予備圧縮(連結糸に張力が発生する状態)を生じやすくなり、人と三次元立体編物210との間で平衡状態が作りやすい。本実施形態では、人が背部が当接した際の違和感軽減のため、脊柱に対応する部位を挟んで対象に2枚配設するようにしている。三次元立体編物210を簡単に所定位置に配置するようにするため、三次元立体編物210は三次元立体編物支持部材215に支持させた構成とすることが好ましい。三次元立体編物支持部材215は、板状に成形され、脊柱に対応する部位を挟んで対称位置に、縦長の配置用貫通孔215a,215aが2つ形成されている。三次元立体編物支持部材215は、上記板状発泡体221,222と同様に、板状に形成されたビーズ発泡体から構成することが好ましい。三次元立体編物支持部材215をビーズ発泡体から構成する場合の好ましい発泡倍率、厚さの範囲は上記板状発泡体221,222と同様である。但し、生体信号により膜振動(横波)をより顕著に起こさせるためには、三次元立体編物210,210の上下に積層される板状発泡体221,222の厚さが、三次元立体編物支持部材215の厚さよりも薄いことが好ましい。 Here, the three-dimensional solid knitted
三次元立体編物支持部材215に形成した配置用貫通孔215a,215aに、2つの三次元立体編物210,210を挿入配置した状態で、三次元立体編物210,210の表側及び裏側にフィルム216,216を積層する。なお、配置用貫通孔215a,215aの形成位置(すなわち、三次元立体編物210,210の配設位置)は、心房と大動脈(特に、「下行大動脈」)の拍出に伴う動きによって生じる揺れ及び大動脈弁の動き(心部揺動波)を検知可能な領域に相当する位置とすることが好ましい。この結果、三次元立体編物210,210は、上下面が板状発泡体221,222によりサンドイッチされ、周縁部が三次元立体編物支持部材215によって取り囲まれており、板状発泡体221,222及び三次元立体編物支持部材215が共振箱(共鳴箱)の機能を果たす。 With the two three-dimensional solid
また、三次元立体編物支持部材215よりも、三次元立体編物210,210の方が厚いものを用いることが好ましい。つまり、三次元立体編物210,210を配置用貫通孔215a,215aに配置した場合には、三次元立体編物210,210の表面及び裏面が、該配置用貫通孔215a,215aよりも突出するような厚さ関係とする。これにより、フィルム216,216の周縁部を配置用貫通孔215a,215aの周縁部に貼着すると、三次元立体編物210,210は厚み方向に押圧されるため、フィルム216,216の反力による張力が発生し、該フィルム216,216に固体振動(膜振動(横波))が生じやすくなる。一方、三次元立体編物210,210にも予備圧縮が生じ、三次元立体編物の厚さ形態を保持する連結糸にも反力による張力が生じて弦振動が生じやすくなる。なお、フィルム216,216は、三次元立体編物210,210の表側及び裏側の両側に設けることが好ましいが、いずれか少なくとも一方に設けた構成とすることも可能である。フィルム216,216としては、例えば、ポリウレタンエラストマーからなるプラスチックフィルム(例えば、シーダム株式会社製、品番「DUS605−CDR」)等を用いることができる。 In addition, it is preferable to use a material in which the three-dimensional solid
振動センサ230は、上記したフィルム216,216を積層する前に、いずれか一方の三次元立体編物210に固着して配設される。三次元立体編物210は一対のグランド編地と連結糸とから構成されるが、各連結糸の弦振動がグランド編地との節点を介してフィルム216,216及び板状発泡体221,222に伝達されるため、振動センサ230は感知部230aを三次元立体編物210の表面(グランド編地の表面)に固着することが好ましい。振動センサ230としては、マイクロフォンセンサ、中でも、コンデンサ型マイクロフォンセンサを用いることが好ましい。本実施形態では、マイクロフォンセンサを配置した部位(すなわち、三次元立体編物210を配置した配置用貫通孔215a)の密閉性を考慮する必要がないため、マイクロフォンセンサのリード線の配線は容易に行うことができる。生体信号によって生じる人の筋肉を介した体表面の振動は、三次元立体編物210だけでなく、板状発泡体221,222、フィルム216にも伝播され、それらが振動(弦振動、膜振動(横波))して減衰を防止しつつ重畳されて増幅する。よって、振動センサ230は、三次元立体編物210に限らず、振動伝達経路を構成する板状発泡体221,222及びフィルム216に、その感知部230aを固定することもできる。 The
生体信号測定手段200としては、図33に示したものに限定されず、例えば、図34(a)に示したように、2つの三次元立体編物210,210の両方を覆うことのできる大きさのフィルム217を少なくとも一方に用いても良い。また、図34(b)に示したように、略長方形の三次元立体編物を両端縁から中央部に向かって折り曲げ、重なり合った部分の中央部を縫い合わせたランバーサポート218を配置するようにしてもよい。ランバーサポート218は、三次元立体編物支持部材215に面ファスナ等を用いて固定される。ランバーサポート218をこのようにして設けることにより、狭いスペース中でストローク感を高めるのに寄与する。 The biological signal measuring means 200 is not limited to the one shown in FIG. 33. For example, as shown in FIG. 34A, the biological signal measuring means 200 can cover both the two three-dimensional solid
上記した生体信号測定手段200は、例えば、図35に示したように、自動車用シート1000のシートバックフレーム1100に被覆される表皮1200の内側に配置される。なお、配置作業を容易にするため、生体信号測定手段200を構成する三次元立体編物210、三次元立体編物支持部材215、フィルム216、板状発泡体221,222、振動センサ230等は予めユニット化しておくことが好ましい。 For example, as shown in FIG. 35, the above-described biological signal measuring means 200 is disposed inside the
上記した生体信号測定手段200によれば、生体信号により、筋肉の荷重−たわみ特性に近似する荷重−たわみ特性をもつ板状発泡体221,222やフィルム216に膜振動(横波)が生じると共に、人の筋肉の荷重−たわみ特性に近似した荷重−たわみ特性を有する三次元立体編物210に弦振動が生じる。そして、三次元立体編物210の弦振動は再びフィルム216等の膜振動(横波)に影響を与え、これらの振動が重畳して作用する。その結果、生体信号に伴って体表面から入力される振動は、減衰することなく弦振動と膜振動(横波)との重畳によって増幅された固体振動として直接振動センサ230により検出されることになる。 According to the biological signal measuring means 200 described above, the biological signal causes membrane vibrations (transverse waves) in the plate-
図1等に示したエアパック10内の空気圧変動を検出する生体信号測定手段1の場合、体積と圧力が反比例関係にあるため、密閉袋の体積を小さくしないと圧力変動を検出しにくい。これに対し、図33〜図35に示した生体信号測定手段200によれば、空気圧変動ではなく、上記のように、機械的増幅デバイス(三次元立体編物210、板状発泡体221,222、フィルム216又はフィルム217)に伝播される増幅された固体振動を検出するものであるため、その容積(体積)が検出感度の観点から制限されることはほとんどなく、心部揺動波という振幅の小さな振動を感度良く検出できる。このため、多様な体格を有する人に対応できる。従って、図33〜図35に示した生体信号測定手段200は、乗物用シートのように、多様な体格を有する人が利用し、さらに多様な外部振動が入力される環境下においても感度良く生体信号を検出できる。 In the case of the biological signal measuring means 1 for detecting the air pressure fluctuation in the
本発明は、ベッドなどの寝具に生体信号測定手段を配置し、背部の大動脈の揺動を捉え、上記した生体状態推定装置により解析して、人の状態推定を行うことに適用することもできる。これにより、寝ている人(特に、病人、介護を要する人)の健康状態を表示手段のモニタに示される画面により容易に把握することができる。同様に、家庭内に配置される椅子、事務用椅子等に生体信号測定手段を配置して状態推定を行うことに適用することもでき、それにより、日常生活における健康状態を容易に把握することができる。 The present invention can also be applied to the estimation of a person's state by arranging biological signal measuring means on bedding such as a bed, capturing the swinging of the aorta in the back, and analyzing it with the above-described biological state estimation device. . Thereby, it is possible to easily grasp the health status of a sleeping person (especially a sick person or a person who needs care) from the screen displayed on the monitor of the display means. Similarly, it can also be applied to state estimation by placing biological signal measuring means on chairs, office chairs, etc. placed in the home, thereby easily grasping the health state in daily life Can do.
1 生体信号測定手段
10 エアパック
15 収容体
100 エアパックユニット
20 ビーズ発泡樹脂弾性部材
40,45 三次元立体編物
500 シート
510 シートバック部
511 表皮部材
512 クッション支持部材
520 シートクッション部
60 生体状態推定装置
61 恒常性維持機能レベル演算手段
611 周波数演算手段(周波数演算ステップ)
612 周波数傾き時系列解析演算手段(周波数傾き時系列解析演算ステップ)
613 周波数変動時系列解析演算手段(周波数変動時系列解析演算ステップ)
614 微分手段(微分ステップ)
615 積分手段(積分ステップ)
616 方形波算出手段(方形波算出ステップ)
617 記述関数算出手段(記述関数算出ステップ)
618 絶対値処理手段(絶対値処理ステップ)
619 恒常性維持機能段階算出手段(恒常性維持機能段階算出ステップ)
62 出力手段
63 判定手段
65 表示手段DESCRIPTION OF
612 Frequency slope time series analysis calculation means (frequency slope time series analysis calculation step)
613 Frequency fluctuation time series analysis calculation means (frequency fluctuation time series analysis calculation step)
614 Differentiation means (differentiation step)
615 Integration means (integration step)
616 Square wave calculating means (square wave calculating step)
617 Description function calculation means (description function calculation step)
618 Absolute value processing means (absolute value processing step)
619 Homeostasis maintenance function stage calculation means (constancy maintenance function stage calculation step)
62 Output means 63 Determination means 65 Display means
Claims (20)
Translated fromJapanese前記生体信号を分析して所定時点における人の恒常性維持機能レベルを複数の段階に区分して求める恒常性維持機能レベル演算手段と、
前記恒常性維持機能レベルの各段階を縦軸に時間を横軸にとり、前記恒常性維持機能レベル演算手段により求められる恒常性維持機能レベルを時系列にプロットし、恒常性維持機能レベルのゆらぎ度合いを表示手段にグラフとして表示させる出力手段と
を具備することを特徴とする生体状態推定装置。A biological state estimation device that estimates a human state using a biological signal collected from a human upper body by a biological signal measuring means,
A homeostasis maintenance function level calculating means for analyzing the biological signal and obtaining a homeostasis maintenance function level of a person at a predetermined time by dividing into a plurality of stages;
Each stage of the homeostasis maintenance function level is plotted on the vertical axis and time is plotted on the horizontal axis, and the homeostasis maintenance function level obtained by the homeostasis maintenance function level calculation means is plotted in time series, and the fluctuation degree of the homeostasis maintenance function level And an output means for displaying as a graph on the display means.
前記生体信号測定手段により得られる生体信号の周波数を求める周波数演算手段と、
前記周波数演算手段により得られた前記生体信号の周波数から、所定のオーバーラップ時間で設定した所定の時間窓毎に前記周波数の傾きを求める移動計算を行い、時間窓毎に得られる前記周波数の傾きの時系列波形を求める周波数傾き時系列解析演算手段と、
前記周波数傾き時系列解析演算手段により求めた前記周波数傾きの時系列波形を微分する微分手段と、
前記周波数傾き時系列解析演算手段により求めた前記周波数傾きの時系列波形を積分する積分手段と、
前記周波数傾き時系列解析演算手段により求めた前記周波数傾きの時系列波形の増減から方形波を求める方形波算出手段と、
任意に設定した第1時間帯における前記周波数傾き時系列波形と前記第1時間帯よりも後の第2時間帯における前記周波数傾き時系列波形と間の記述関数及び記述関数振幅値を求める記述関数算出手段と、
前記周波数演算手段により得られる、前記生体信号の時系列波形の極大値を用いた生体信号の周波数の時系列波形と、前記生体信号の時系列波形の正負が切り替わるゼロクロス地点を用いた生体信号の周波数の時系列波形とを用いて、前記周波数傾き時系列解析演算手段により求めた、それぞれの周波数傾きの時系列波形を絶対値処理する絶対値処理手段と、
前記周波数傾き時系列解析演算手段により求めた前記周波数傾き、前記微分手段により求めた微分値、前記積分手段により求めた積分値、前記方形波算出手段により求めた方形波の正負、前記記述関数算出手段により求めた記述関数振幅値、及び前記絶対値処理手段により求めた周波数傾き時系列波形の2つの絶対値のうち、少なくとも1つ以上を用いて恒常性維持機能レベルの段階を求める恒常性維持機能段階算出手段と
を具備してなる請求項1〜5のいずれか1に記載の生体状態推定装置。The homeostasis maintenance function level calculation means is:
Frequency calculating means for obtaining the frequency of the biological signal obtained by the biological signal measuring means;
From the frequency of the biological signal obtained by the frequency calculation means, a movement calculation is performed for obtaining a slope of the frequency for each predetermined time window set with a predetermined overlap time, and the slope of the frequency obtained for each time window. A frequency gradient time series analysis calculation means for obtaining a time series waveform of
Differentiating means for differentiating the time series waveform of the frequency slope obtained by the frequency slope time series analysis computing means,
Integrating means for integrating the time series waveform of the frequency slope obtained by the frequency slope time series analysis computing means;
A square wave calculating means for obtaining a square wave from the increase / decrease of the time series waveform of the frequency slope obtained by the frequency slope time series analysis calculating means;
Description function for calculating a description function and a description function amplitude value between the frequency gradient time-series waveform in the arbitrarily set first time zone and the frequency gradient time-series waveform in the second time zone after the first time zone A calculation means;
The time series waveform of the frequency of the biological signal using the maximum value of the time series waveform of the biological signal obtained by the frequency calculation means and the biological signal using the zero cross point where the positive / negative of the time series waveform of the biological signal is switched. Absolute value processing means for performing absolute value processing on each time-series waveform of the frequency gradient obtained by the frequency-gradient time-series analysis calculating means using the frequency time-series waveform;
The frequency slope obtained by the frequency slope time series analysis operation means, the differential value obtained by the differentiation means, the integral value obtained by the integration means, the positive / negative of the square wave obtained by the square wave calculation means, and the description function calculation Maintaining homeostasis for determining the level of the homeostasis function level using at least one of the absolute values of the description function amplitude value obtained by the means and the two absolute values of the frequency gradient time series waveform obtained by the absolute value processing means The biological state estimation apparatus according to claim 1, further comprising a functional stage calculation unit.
前記フィルタリング手段が、前記生体信号測定手段により測定した静的環境下における生体信号の平均周波数を求め、該平均周波数を基準値として、フィルタリングする周波数帯域を設定する構成である請求項1〜6のいずれか1に記載の生体状態推定装置。A filtering means for filtering the biological signal obtained by the biological signal measuring means in a predetermined frequency band before being processed by the homeostasis maintenance function level calculating means;
7. The configuration according to claim 1, wherein the filtering means obtains an average frequency of the biological signal in a static environment measured by the biological signal measuring means, and sets a frequency band to be filtered using the average frequency as a reference value. The biological state estimation apparatus of any one.
前記生体信号測定手段により採取した生体信号を用いて、人の状態を推定する生体状態推定装置とを備えた生体状態推定システムであって、
前記生体状態推定装置は、
前記生体信号を分析して所定時点における人の恒常性維持機能レベルを複数の段階に区分して求める恒常性維持機能レベル演算手段と、
前記恒常性維持機能レベルの各段階を縦軸に時間を横軸にとり、前記恒常性維持機能レベル演算手段により求められる恒常性維持機能レベルを時系列にプロットし、恒常性維持機能レベルのゆらぎ度合いを表示手段にグラフとして表示させる出力手段と
を具備することを特徴とする生体状態推定システム。A biological signal measuring means for collecting a biological signal from a human upper body;
A biological state estimation system comprising a biological state estimation device that estimates a human state using a biological signal collected by the biological signal measuring means,
The biological state estimating device
A homeostasis maintenance function level calculating means for analyzing the biological signal and obtaining a homeostasis maintenance function level of a person at a predetermined time by dividing into a plurality of stages;
Each stage of the homeostasis maintenance function level is plotted on the vertical axis and time is plotted on the horizontal axis, and the homeostasis maintenance function level obtained by the homeostasis maintenance function level calculation means is plotted in time series, and the fluctuation degree of the homeostasis maintenance function level The living body state estimation system comprising: output means for displaying a graph on the display means.
前記生体信号を分析して所定時点における人の恒常性維持機能レベルを複数の段階に区分して求める恒常性維持機能レベル演算ステップと、
前記恒常性維持機能レベルの各段階を縦軸に時間を横軸にとり、前記恒常性維持機能レベル演算ステップにより求められる恒常性維持機能レベルを時系列にプロットして表示手段にグラフとして表示させる出力ステップと
を実行させることを特徴とするコンピュータプログラム。Using the biological signal collected from the human upper body by the biological signal measuring means, the biological state estimating device for estimating the human state,
A homeostasis maintenance function level calculation step for analyzing the biosignal and determining a person's homeostasis maintenance function level at a predetermined time by dividing into a plurality of stages,
An output in which each stage of the homeostatic function level is plotted on the vertical axis and time is plotted on the horizontal axis, and the homeostatic function level obtained by the homeostasis function level calculating step is plotted in time series and displayed as a graph on the display means. Step and
A computer programfor executing
前記生体信号測定手段により得られる生体信号の周波数を求める周波数演算ステップと、
前記周波数演算ステップにより得られた前記生体信号の周波数から、所定のオーバーラップ時間で設定した所定の時間窓毎に前記周波数の傾きを求める移動計算を行い、時間窓毎に得られる前記周波数の傾きの時系列波形を求める周波数傾き時系列解析演算ステップと、
前記周波数傾き時系列解析演算ステップにより求めた前記周波数傾きの時系列波形を微分する微分ステップと、
前記周波数傾き時系列解析演算ステップにより求めた前記周波数傾きの時系列波形を積分する積分ステップと、
前記周波数傾き時系列解析演算ステップにより求めた前記周波数傾きの時系列波形の増減から方形波を求める方形波算出ステップと、
任意に設定した第1時間帯における前記周波数傾き時系列波形と前記第1時間帯よりも後の第2時間帯における前記周波数傾き時系列波形と間の記述関数及び記述関数振幅値を求める記述関数算出ステップと、
前記周波数演算ステップにより得られる、前記生体信号の時系列波形の極大値を用いた生体信号の周波数の時系列波形と、前記生体信号の時系列波形の正負が切り替わるゼロクロス地点を用いた生体信号の周波数の時系列波形とを用いて、前記周波数傾き時系列解析演算ステップにより求めた、それぞれの周波数傾きの時系列波形を絶対値処理する絶対値処理ステップと、
前記周波数傾き時系列解析演算ステップにより求めた前記周波数傾き、前記微分手段により求めた微分値、前記積分手段により求めた積分値、前記方形波算出手段により求めた方形波の正負、前記記述関数算出ステップにより求めた記述関数振幅値、及び前記絶対値処理ステップにより求めた周波数傾き時系列波形の2つの絶対値のうち、少なくとも1つ以上を用いて恒常性維持機能レベルの段階を求める恒常性維持機能段階算出ステップと
を実行させる請求項15〜19のいずれか1に記載のコンピュータプログラム。As the homeostatic functional levels calculation step,
A frequency calculating step for obtaining a frequency of the biological signal obtained by the biological signal measuring means;
From the frequency of the biological signal obtained by the frequency calculation step, a movement calculation is performed for obtaining a slope of the frequency for each predetermined time window set with a predetermined overlap time, and the slope of the frequency obtained for each time window. A frequency gradient time series analysis calculation step for obtaining a time series waveform of
Differentiating step for differentiating the time series waveform of the frequency slope obtained by the frequency slope time series analysis calculation step;
An integration step for integrating the time series waveform of the frequency slope obtained by the frequency slope time series analysis operation step;
A square wave calculating step for obtaining a square wave from the increase / decrease of the time series waveform of the frequency gradient obtained by the frequency gradient time series analysis calculation step;
Description function for calculating a description function and a description function amplitude value between the frequency gradient time-series waveform in the arbitrarily set first time zone and the frequency gradient time-series waveform in the second time zone after the first time zone A calculation step;
Obtained by the frequency calculation step is a time-series waveform of the frequency of the biological signal using the maximum value of the time-series waveform of the biological signal, and a biological signal using a zero-cross point where the positive / negative of the time-series waveform of the biological signal is switched. Using the time series waveform of the frequency, an absolute value processing step for performing absolute value processing of the time series waveform of each frequency slope obtained by the frequency slope time series analysis calculation step,
The frequency slope obtained by the frequency slope time series analysis calculation step, the differential value obtained by the differentiating means, the integral value obtained by the integrating means, the positive / negative of the square wave obtained by the square wave calculating means, and the description function calculation Maintaining homeostasis for determining the level of the homeostasis function level using at least one of the two absolute values of the description function amplitude value obtained in the step and the frequency gradient time series waveform obtained in the absolute value processing step. The computer program according to any one of claims 15 to 19, wherein the function stage calculation step isexecuted .
Priority Applications (1)
| Application Number | Priority Date | Filing Date | Title |
|---|---|---|---|
| JP2011536174AJP5704651B2 (en) | 2009-10-14 | 2010-10-14 | Biological state estimation device, biological state estimation system, and computer program |
Applications Claiming Priority (4)
| Application Number | Priority Date | Filing Date | Title |
|---|---|---|---|
| JP2009237802 | 2009-10-14 | ||
| JP2009237802 | 2009-10-14 | ||
| PCT/JP2010/068068WO2011046178A1 (en) | 2009-10-14 | 2010-10-14 | Biological state estimation device, biological state estimation system, and computer program |
| JP2011536174AJP5704651B2 (en) | 2009-10-14 | 2010-10-14 | Biological state estimation device, biological state estimation system, and computer program |
Publications (2)
| Publication Number | Publication Date |
|---|---|
| JPWO2011046178A1 JPWO2011046178A1 (en) | 2013-03-07 |
| JP5704651B2true JP5704651B2 (en) | 2015-04-22 |
Family
ID=43876227
Family Applications (1)
| Application Number | Title | Priority Date | Filing Date |
|---|---|---|---|
| JP2011536174AActiveJP5704651B2 (en) | 2009-10-14 | 2010-10-14 | Biological state estimation device, biological state estimation system, and computer program |
Country Status (4)
| Country | Link |
|---|---|
| US (1) | US10136850B2 (en) |
| EP (1) | EP2489307B1 (en) |
| JP (1) | JP5704651B2 (en) |
| WO (1) | WO2011046178A1 (en) |
Families Citing this family (40)
| Publication number | Priority date | Publication date | Assignee | Title |
|---|---|---|---|---|
| JP5679541B2 (en)* | 2010-01-26 | 2015-03-04 | 株式会社デルタツーリング | Biological signal detection device |
| US8550564B1 (en)* | 2010-04-01 | 2013-10-08 | The Boeing Company | Composite seat pan structure for a lightweight aircraft seat assembly |
| US9292471B2 (en) | 2011-02-18 | 2016-03-22 | Honda Motor Co., Ltd. | Coordinated vehicle response system and method for driver behavior |
| US8698639B2 (en) | 2011-02-18 | 2014-04-15 | Honda Motor Co., Ltd. | System and method for responding to driver behavior |
| US8725311B1 (en) | 2011-03-14 | 2014-05-13 | American Vehicular Sciences, LLC | Driver health and fatigue monitoring system and method |
| CN102319057B (en)* | 2011-08-31 | 2013-11-06 | 深圳市视聆科技开发有限公司 | Wavy physiological signal acquisition device and physiological signal acquisition cushion |
| JP5800357B2 (en)* | 2011-09-04 | 2015-10-28 | 株式会社デルタツーリング | Biological signal detection mechanism |
| USD674404S1 (en) | 2011-10-26 | 2013-01-15 | Mcafee, Inc. | Computer having graphical user interface |
| USD674403S1 (en) | 2011-10-26 | 2013-01-15 | Mcafee, Inc. | Computer having graphical user interface |
| USD673967S1 (en) | 2011-10-26 | 2013-01-08 | Mcafee, Inc. | Computer having graphical user interface |
| USD677687S1 (en) | 2011-10-27 | 2013-03-12 | Mcafee, Inc. | Computer display screen with graphical user interface |
| JP5977938B2 (en)* | 2011-11-25 | 2016-08-24 | 株式会社デルタツーリング | Biological state estimation device and computer program |
| US20130345921A1 (en)* | 2012-06-22 | 2013-12-26 | Masimo Corporation | Physiological monitoring of moving vehicle operators |
| JP6118097B2 (en) | 2012-12-14 | 2017-04-19 | 株式会社デルタツーリング | Biological state determination device during operation and computer program |
| US9398875B2 (en) | 2013-11-07 | 2016-07-26 | Honda Motor Co., Ltd. | Method and system for biological signal analysis |
| US9751534B2 (en) | 2013-03-15 | 2017-09-05 | Honda Motor Co., Ltd. | System and method for responding to driver state |
| US10499856B2 (en) | 2013-04-06 | 2019-12-10 | Honda Motor Co., Ltd. | System and method for biological signal processing with highly auto-correlated carrier sequences |
| DE102013212091B3 (en)* | 2013-06-25 | 2014-10-02 | Conti Temic Microelectronic Gmbh | Filter element for a pneumatic adjusting arrangement, pneumatic adjusting arrangement for a vehicle seat and method for producing a filter element for a pneumatic adjusting arrangement |
| DE102013216682A1 (en)* | 2013-08-22 | 2015-02-26 | Ford Global Technologies, Llc | Sensor for contactless electrocardiographic measurement, sensor array and seat or couch |
| DE102013219026A1 (en)* | 2013-09-23 | 2015-03-26 | Ford Global Technologies, Llc | Sensor for contactless electrocardiographic measurement, sensor array and seat or couch |
| WO2015174963A1 (en)* | 2014-05-13 | 2015-11-19 | American Vehicular Sciences, LLC | Driver health and fatigue monitoring system and method |
| JP6107793B2 (en)* | 2014-11-07 | 2017-04-05 | ダイキン工業株式会社 | Seated person detection device |
| JP6666705B2 (en)* | 2015-09-28 | 2020-03-18 | デルタ工業株式会社 | Biological condition estimation device, biological condition estimation method, and computer program |
| EP3387988B1 (en) | 2015-12-12 | 2024-02-28 | Delta Kogyo Co., Ltd. | Biological state estimation device, biological state estimation method, computer program, and recording medium |
| WO2017099257A1 (en) | 2015-12-12 | 2017-06-15 | デルタ工業株式会社 | Biological state estimation device, biological state estimation method, computer program, and recording medium |
| JP6689214B2 (en)* | 2017-01-19 | 2020-04-28 | 株式会社デンソーアイティーラボラトリ | Driver tension degree display device and driver tension degree display method |
| KR102417606B1 (en)* | 2017-10-16 | 2022-07-07 | 현대자동차주식회사 | Vehicle And Control Method Thereof |
| US10379535B2 (en) | 2017-10-24 | 2019-08-13 | Lear Corporation | Drowsiness sensing system |
| US10836403B2 (en) | 2017-12-04 | 2020-11-17 | Lear Corporation | Distractedness sensing system |
| JP6885545B2 (en) | 2018-01-13 | 2021-06-16 | 株式会社デルタツーリング | Blood pressure estimation device, blood pressure estimation method, computer program and recording medium |
| US10210409B1 (en) | 2018-02-07 | 2019-02-19 | Lear Corporation | Seating system with occupant stimulation and sensing |
| US11273740B2 (en) | 2018-02-17 | 2022-03-15 | Delta Kogyo Co., Ltd. | Vehicle seat ventilation mechanism and vehicle seat |
| US10867218B2 (en) | 2018-04-26 | 2020-12-15 | Lear Corporation | Biometric sensor fusion to classify vehicle passenger state |
| CN109044290A (en)* | 2018-06-29 | 2018-12-21 | 苗铁军 | A kind of physical function check device, physical function inspection method and system |
| DE102018124926A1 (en) | 2018-10-09 | 2020-04-09 | Bayerische Motoren Werke Aktiengesellschaft | Vehicle seat |
| US12059980B2 (en) | 2019-06-21 | 2024-08-13 | Lear Corporation | Seat system and method of control |
| US11524691B2 (en) | 2019-07-29 | 2022-12-13 | Lear Corporation | System and method for controlling an interior environmental condition in a vehicle |
| US20230136560A1 (en)* | 2020-03-11 | 2023-05-04 | Panasonic Intellectual Property Management Co., Ltd. | Signal processing system, sensor system, biometric management system, environmental control system, signal processing method, and program |
| CN113974568B (en)* | 2021-11-09 | 2024-03-26 | 重庆火后草科技有限公司 | Slope interference-free method for calculating metabolic rate of sleep process |
| CN118379768B (en)* | 2024-01-26 | 2024-11-15 | 斯佰特仪(北京)科技有限公司 | Human epidermis and subcutaneous texture image processing system based on image recognition |
Citations (4)
| Publication number | Priority date | Publication date | Assignee | Title |
|---|---|---|---|---|
| WO2005092193A1 (en)* | 2004-03-25 | 2005-10-06 | Delta Tooling Co., Ltd. | Load body state judgment device, vehicle seat, and computer program |
| WO2008143249A1 (en)* | 2007-05-22 | 2008-11-27 | Delta Tooling Co., Ltd. | Seat structure |
| JP2009022610A (en)* | 2007-07-20 | 2009-02-05 | Delta Tooling Co Ltd | Degree of fatigue computing device and computer program |
| WO2009104460A1 (en)* | 2008-02-20 | 2009-08-27 | 株式会社デルタツーリング | Fatigue analysis device and computer program |
Family Cites Families (25)
| Publication number | Priority date | Publication date | Assignee | Title |
|---|---|---|---|---|
| US3187275A (en)* | 1963-04-05 | 1965-06-01 | Ryan Aeronautical Co | Signal tracking filter having tuning reactance automatically controlled by vacuum tube capacitance responsive to phase comparator |
| US5853005A (en)* | 1996-05-02 | 1998-12-29 | The United States Of America As Represented By The Secretary Of The Army | Acoustic monitoring system |
| GB9700090D0 (en)* | 1997-01-04 | 1997-02-19 | Horne James A | Sleepiness detection for vehicle driver |
| DE19983911B4 (en) | 1999-01-27 | 2018-09-06 | Compumedics Sleep Pty. Ltd. | Wachsamkeitsüberwachungssystem |
| US6416483B1 (en)* | 2000-03-24 | 2002-07-09 | Ilife Systems, Inc. | Sensor and method for detecting very low frequency acoustic signals |
| US20060122474A1 (en) | 2000-06-16 | 2006-06-08 | Bodymedia, Inc. | Apparatus for monitoring health, wellness and fitness |
| US20020165694A1 (en)* | 2001-05-07 | 2002-11-07 | George Chene | Vehicle driver data |
| JP4789342B2 (en) | 2001-05-10 | 2011-10-12 | 株式会社デルタツーリング | Cushion material, sheet and method of filing pile yarn |
| JP4252268B2 (en)* | 2002-08-29 | 2009-04-08 | パイオニア株式会社 | Fatigue level determination system, fatigue level determination method, and fatigue level determination program |
| WO2004091378A2 (en)* | 2003-04-03 | 2004-10-28 | University Of Virginia Patent Foundation | System and method for passive monitoring of blood pressure and pulse rate |
| JP4347621B2 (en) | 2003-05-21 | 2009-10-21 | 株式会社デルタツーリング | Biological evaluation system, computer program, and recording medium |
| JP4247055B2 (en)* | 2003-05-21 | 2009-04-02 | 株式会社デルタツーリング | Driver's seat system |
| JP4111062B2 (en)* | 2003-05-27 | 2008-07-02 | 株式会社デンソー | Sleepiness level detection device |
| WO2005023105A1 (en)* | 2003-09-02 | 2005-03-17 | Matsushita Electric Industrial Co., Ltd. | Biological sensor and support system using the same |
| US7470231B2 (en)* | 2003-10-23 | 2008-12-30 | Delta Tooling Co., Ltd. | Fatigue degree measurement device, fatigue detection device and computer program to be used therein |
| US7254439B2 (en)* | 2004-01-06 | 2007-08-07 | Monebo Technologies, Inc. | Method and system for contactless evaluation of fatigue of an operator |
| JP4959178B2 (en) | 2005-02-28 | 2012-06-20 | 株式会社デルタツーリング | Cushion material and pressure fluctuation detection device |
| JP4751683B2 (en) | 2005-09-28 | 2011-08-17 | Kbセーレン株式会社 | Colored elastic fiber nonwoven fabric |
| US7663495B2 (en)* | 2005-10-12 | 2010-02-16 | The Penn State Research Foundation | Vigilance monitoring technique for vehicle operators |
| FR2895228B1 (en)* | 2005-12-23 | 2012-04-20 | Siemens Vdo Automotive | METHOD FOR DETECTING CHARACTERISTIC MOVEMENTS OF A VEHICLE DRIVER FOR VIGILANCE DECLINE DIAGNOSIS OF SAID DRIVER |
| JP4697185B2 (en)* | 2006-12-04 | 2011-06-08 | トヨタ自動車株式会社 | Arousal level determination device and arousal level determination method |
| JP5044230B2 (en)* | 2007-02-14 | 2012-10-10 | 株式会社デルタツーリング | Biological signal analyzing apparatus, sheet, and biological signal analyzing method |
| US20090192364A1 (en)* | 2008-01-29 | 2009-07-30 | Voto Andrew M | Infant monitoring system |
| JP2009295384A (en) | 2008-06-04 | 2009-12-17 | Mitsubishi Electric Corp | Luminaire |
| US8287452B2 (en)* | 2009-01-07 | 2012-10-16 | Bam Labs, Inc. | Apparatus for monitoring vital signs of an emergency victim |
- 2010
- 2010-10-14JPJP2011536174Apatent/JP5704651B2/enactiveActive
- 2010-10-14WOPCT/JP2010/068068patent/WO2011046178A1/enactiveApplication Filing
- 2010-10-14USUS13/501,903patent/US10136850B2/enactiveActive
- 2010-10-14EPEP10823446.9Apatent/EP2489307B1/enactiveActive
Patent Citations (4)
| Publication number | Priority date | Publication date | Assignee | Title |
|---|---|---|---|---|
| WO2005092193A1 (en)* | 2004-03-25 | 2005-10-06 | Delta Tooling Co., Ltd. | Load body state judgment device, vehicle seat, and computer program |
| WO2008143249A1 (en)* | 2007-05-22 | 2008-11-27 | Delta Tooling Co., Ltd. | Seat structure |
| JP2009022610A (en)* | 2007-07-20 | 2009-02-05 | Delta Tooling Co Ltd | Degree of fatigue computing device and computer program |
| WO2009104460A1 (en)* | 2008-02-20 | 2009-08-27 | 株式会社デルタツーリング | Fatigue analysis device and computer program |
Also Published As
| Publication number | Publication date |
|---|---|
| JPWO2011046178A1 (en) | 2013-03-07 |
| EP2489307A4 (en) | 2014-11-19 |
| US20120259181A1 (en) | 2012-10-11 |
| US10136850B2 (en) | 2018-11-27 |
| WO2011046178A1 (en) | 2011-04-21 |
| EP2489307B1 (en) | 2018-10-03 |
| EP2489307A1 (en) | 2012-08-22 |
Similar Documents
| Publication | Publication Date | Title |
|---|---|---|
| JP5704651B2 (en) | Biological state estimation device, biological state estimation system, and computer program | |
| JP5553303B2 (en) | Biological state estimation device and computer program | |
| JP4247055B2 (en) | Driver's seat system | |
| JP5733499B2 (en) | Biological state estimation device and computer program | |
| JP5669287B2 (en) | Drinking detection system and computer program | |
| JP5429946B2 (en) | Biological condition analyzer and computer program | |
| JP6118097B2 (en) | Biological state determination device during operation and computer program | |
| JP5044230B2 (en) | Biological signal analyzing apparatus, sheet, and biological signal analyzing method | |
| JP4611206B2 (en) | Fatigue degree measuring device, fatigue detecting device, and computer program | |
| JP5892678B2 (en) | Biological state estimation device and computer program | |
| JP6209396B2 (en) | Driving support device and computer program | |
| JP5977938B2 (en) | Biological state estimation device and computer program | |
| JP5582478B2 (en) | Biological state estimation device and computer program | |
| JP5561552B2 (en) | Biological signal measuring apparatus and biological state analysis system | |
| JP4347621B2 (en) | Biological evaluation system, computer program, and recording medium | |
| JP5327584B2 (en) | Biological condition analyzer, computer program, and recording medium | |
| JP5751475B2 (en) | Biological state estimation device and computer program | |
| JP2005342188A (en) | System for deciding mental and physical condition | |
| JP5679556B2 (en) | Drinking state detection device, computer program and recording medium |
Legal Events
| Date | Code | Title | Description |
|---|---|---|---|
| A621 | Written request for application examination | Free format text:JAPANESE INTERMEDIATE CODE: A621 Effective date:20131007 | |
| A131 | Notification of reasons for refusal | Free format text:JAPANESE INTERMEDIATE CODE: A131 Effective date:20140710 | |
| A521 | Request for written amendment filed | Free format text:JAPANESE INTERMEDIATE CODE: A523 Effective date:20140904 | |
| TRDD | Decision of grant or rejection written | ||
| A01 | Written decision to grant a patent or to grant a registration (utility model) | Free format text:JAPANESE INTERMEDIATE CODE: A01 Effective date:20150130 | |
| A61 | First payment of annual fees (during grant procedure) | Free format text:JAPANESE INTERMEDIATE CODE: A61 Effective date:20150219 | |
| R150 | Certificate of patent or registration of utility model | Ref document number:5704651 Country of ref document:JP Free format text:JAPANESE INTERMEDIATE CODE: R150 | |
| R250 | Receipt of annual fees | Free format text:JAPANESE INTERMEDIATE CODE: R250 | |
| R250 | Receipt of annual fees | Free format text:JAPANESE INTERMEDIATE CODE: R250 | |
| R250 | Receipt of annual fees | Free format text:JAPANESE INTERMEDIATE CODE: R250 | |
| R250 | Receipt of annual fees | Free format text:JAPANESE INTERMEDIATE CODE: R250 | |
| R250 | Receipt of annual fees | Free format text:JAPANESE INTERMEDIATE CODE: R250 | |
| R250 | Receipt of annual fees | Free format text:JAPANESE INTERMEDIATE CODE: R250 | |
| R250 | Receipt of annual fees | Free format text:JAPANESE INTERMEDIATE CODE: R250 | |
| R250 | Receipt of annual fees | Free format text:JAPANESE INTERMEDIATE CODE: R250 |