JP5349115B2 - Ultrasonic diagnostic apparatus and control program therefor - Google Patents
Ultrasonic diagnostic apparatus and control program thereforDownload PDFInfo
- Publication number
- JP5349115B2 JP5349115B2JP2009085883AJP2009085883AJP5349115B2JP 5349115 B2JP5349115 B2JP 5349115B2JP 2009085883 AJP2009085883 AJP 2009085883AJP 2009085883 AJP2009085883 AJP 2009085883AJP 5349115 B2JP5349115 B2JP 5349115B2
- Authority
- JP
- Japan
- Prior art keywords
- image
- echo signal
- ultrasonic
- attenuation
- subject
- Prior art date
- Legal status (The legal status is an assumption and is not a legal conclusion. Google has not performed a legal analysis and makes no representation as to the accuracy of the status listed.)
- Expired - Fee Related
Links
Images


Classifications
- A—HUMAN NECESSITIES
- A61—MEDICAL OR VETERINARY SCIENCE; HYGIENE
- A61B—DIAGNOSIS; SURGERY; IDENTIFICATION
- A61B8/00—Diagnosis using ultrasonic, sonic or infrasonic waves
- A61B8/13—Tomography
- A61B8/14—Echo-tomography
- G—PHYSICS
- G01—MEASURING; TESTING
- G01S—RADIO DIRECTION-FINDING; RADIO NAVIGATION; DETERMINING DISTANCE OR VELOCITY BY USE OF RADIO WAVES; LOCATING OR PRESENCE-DETECTING BY USE OF THE REFLECTION OR RERADIATION OF RADIO WAVES; ANALOGOUS ARRANGEMENTS USING OTHER WAVES
- G01S15/00—Systems using the reflection or reradiation of acoustic waves, e.g. sonar systems
- G01S15/88—Sonar systems specially adapted for specific applications
- G01S15/89—Sonar systems specially adapted for specific applications for mapping or imaging
- G01S15/8906—Short-range imaging systems; Acoustic microscope systems using pulse-echo techniques
- G01S15/895—Short-range imaging systems; Acoustic microscope systems using pulse-echo techniques characterised by the transmitted frequency spectrum
- G01S15/8952—Short-range imaging systems; Acoustic microscope systems using pulse-echo techniques characterised by the transmitted frequency spectrum using discrete, multiple frequencies
- G—PHYSICS
- G01—MEASURING; TESTING
- G01S—RADIO DIRECTION-FINDING; RADIO NAVIGATION; DETERMINING DISTANCE OR VELOCITY BY USE OF RADIO WAVES; LOCATING OR PRESENCE-DETECTING BY USE OF THE REFLECTION OR RERADIATION OF RADIO WAVES; ANALOGOUS ARRANGEMENTS USING OTHER WAVES
- G01S15/00—Systems using the reflection or reradiation of acoustic waves, e.g. sonar systems
- G01S15/88—Sonar systems specially adapted for specific applications
- G01S15/89—Sonar systems specially adapted for specific applications for mapping or imaging
- G01S15/8906—Short-range imaging systems; Acoustic microscope systems using pulse-echo techniques
- G01S15/8959—Short-range imaging systems; Acoustic microscope systems using pulse-echo techniques using coded signals for correlation purposes
- G01S15/8963—Short-range imaging systems; Acoustic microscope systems using pulse-echo techniques using coded signals for correlation purposes using pulse inversion
- G—PHYSICS
- G01—MEASURING; TESTING
- G01S—RADIO DIRECTION-FINDING; RADIO NAVIGATION; DETERMINING DISTANCE OR VELOCITY BY USE OF RADIO WAVES; LOCATING OR PRESENCE-DETECTING BY USE OF THE REFLECTION OR RERADIATION OF RADIO WAVES; ANALOGOUS ARRANGEMENTS USING OTHER WAVES
- G01S7/00—Details of systems according to groups G01S13/00, G01S15/00, G01S17/00
- G01S7/52—Details of systems according to groups G01S13/00, G01S15/00, G01S17/00 of systems according to group G01S15/00
- G01S7/52017—Details of systems according to groups G01S13/00, G01S15/00, G01S17/00 of systems according to group G01S15/00 particularly adapted to short-range imaging
- G01S7/52023—Details of receivers
- G01S7/52033—Gain control of receivers
- G—PHYSICS
- G01—MEASURING; TESTING
- G01S—RADIO DIRECTION-FINDING; RADIO NAVIGATION; DETERMINING DISTANCE OR VELOCITY BY USE OF RADIO WAVES; LOCATING OR PRESENCE-DETECTING BY USE OF THE REFLECTION OR RERADIATION OF RADIO WAVES; ANALOGOUS ARRANGEMENTS USING OTHER WAVES
- G01S7/00—Details of systems according to groups G01S13/00, G01S15/00, G01S17/00
- G01S7/52—Details of systems according to groups G01S13/00, G01S15/00, G01S17/00 of systems according to group G01S15/00
- G01S7/52017—Details of systems according to groups G01S13/00, G01S15/00, G01S17/00 of systems according to group G01S15/00 particularly adapted to short-range imaging
- G01S7/52053—Display arrangements
- G01S7/52057—Cathode ray tube displays
- G01S7/52071—Multicolour displays; using colour coding; Optimising colour or information content in displays, e.g. parametric imaging
Landscapes
- Engineering & Computer Science (AREA)
- Physics & Mathematics (AREA)
- Remote Sensing (AREA)
- Radar, Positioning & Navigation (AREA)
- Acoustics & Sound (AREA)
- Health & Medical Sciences (AREA)
- Life Sciences & Earth Sciences (AREA)
- General Physics & Mathematics (AREA)
- Computer Networks & Wireless Communication (AREA)
- Medical Informatics (AREA)
- Veterinary Medicine (AREA)
- Molecular Biology (AREA)
- Surgery (AREA)
- Animal Behavior & Ethology (AREA)
- General Health & Medical Sciences (AREA)
- Public Health (AREA)
- Heart & Thoracic Surgery (AREA)
- Biomedical Technology (AREA)
- Radiology & Medical Imaging (AREA)
- Pathology (AREA)
- Nuclear Medicine, Radiotherapy & Molecular Imaging (AREA)
- Biophysics (AREA)
- Ultra Sonic Daignosis Equipment (AREA)
Description
Translated fromJapanese本発明は、生体内をスキャンして臓器の断層像を画像化し、疾患などを診断する超音波診断装置及びその制御プログラムに関する。 The present invention relates to an ultrasonic diagnostic apparatus that scans a living body to form a tomographic image of an organ and diagnoses a disease and the like, and a control program therefor.
超音波診断装置は生体内情報の画像を表示する診断装置であり、X線やCT診断装置などの他の画像診断装置に比べ、安価で被曝が無く、非侵襲性に実時間で観測するための有用な装置として利用されている。超音波診断装置の適用範囲は広く、心臓などの循環器から肝臓、腎臓などの腹部、抹消血管、産婦人科、乳癌の診断などに適用されている。 An ultrasonic diagnostic apparatus is a diagnostic apparatus that displays an image of in-vivo information, and is cheaper and less exposed than other diagnostic imaging apparatuses such as X-rays and CT diagnostic apparatuses, and is non-invasively observed in real time. It is used as a useful device. The application range of the ultrasonic diagnostic apparatus is wide, and it is applied to the diagnosis of circulatory organs such as the heart, abdomen such as the liver and kidney, peripheral blood vessels, obstetrics and gynecology, and breast cancer.
超音波診断の対象とする被検体は生体であり、生体の組織は、固有の減衰特性を持っている。被検体に送信された超音波は、減衰しながら生体内を伝搬するが、この減衰量が大きいと、途中で十分なエコー信号が受信できなくなる現象が起こる。また、一般的には、エコー信号強度は、減衰により深部になるほど小さくなる。このため、現在の超音波診断装置は、深度に応じてゲインを変化させるSTC(Sensitivity Time Control)という機能が多くの場合搭載されている。さらに近年、このSTCを自動で調整するという機能も一般化している。これは受信信号強度の深度ごと(あるいは横方向)に分析し、受信信号が一定になるように深度ごとに係数を計算していくというものである。 A subject to be subjected to ultrasonic diagnosis is a living body, and a tissue of the living body has an inherent attenuation characteristic. The ultrasonic wave transmitted to the subject propagates in the living body while being attenuated. However, if this attenuation is large, a phenomenon that a sufficient echo signal cannot be received occurs halfway. In general, the echo signal intensity decreases as the depth increases due to attenuation. For this reason, current ultrasonic diagnostic apparatuses are often equipped with a function called STC (Sensitivity Time Control) that changes the gain according to the depth. In recent years, the function of automatically adjusting the STC has also become common. This is to analyze the received signal strength for each depth (or lateral direction) and calculate the coefficient for each depth so that the received signal is constant.
生体減衰によるエコー信号の減弱が大きいと、診断情報の獲得のための阻害要因となることが起こりえる。しかしながら、その一方で、エコー信号の減弱の様子を観察することで、生体組織の特徴を観測することもしばしば行われている。例えば肝臓を例に取れば、エコー信号が極端に減少する被検体は、肝臓に脂肪滴が多く含まれており脂肪肝であることが推測される。肝硬変の場合も同様な結果となることがある。 If the attenuation of the echo signal due to the attenuation of the living body is large, it can be an obstacle to obtaining diagnostic information. However, on the other hand, the characteristics of living tissue are often observed by observing how the echo signals are attenuated. For example, taking the liver as an example, a subject whose echo signal is extremely reduced is presumed to be fatty liver because the liver contains many fat droplets. Similar results may occur with cirrhosis.
ところで、減衰特性は周波数にも依存する。このため、異なる送受信周波数を使えば、信号減弱の様相も変化することになる。もちろん、STCを手動や自動で変化させても深度ごとの輝度レベルは変化してしまう。これらの事情から、超音波画像診断において最終的に取得される超音波画像データは、生体減衰及びSTCによる信号処理の影響を受けていると考えられる。このため、超音波診断装置を用いて得られる表示画像を用いた輝度変化のみを用いて、エコー信号の減衰を定量的に評価することは、一般的に困難である。さらに近年の超音波診断装置は、信号受信感度が飛躍的に向上しており、ほとんどの被検体で十分な視野深度が得られている。従って、操作者は、減衰の程度を積極的に察知することができない。 By the way, the attenuation characteristic also depends on the frequency. For this reason, if different transmission / reception frequencies are used, the aspect of signal attenuation also changes. Of course, even if the STC is changed manually or automatically, the luminance level for each depth changes. From these circumstances, it is considered that the ultrasonic image data finally obtained in the ultrasonic image diagnosis is affected by the biological attenuation and the signal processing by STC. For this reason, it is generally difficult to quantitatively evaluate the attenuation of the echo signal using only the luminance change using the display image obtained using the ultrasonic diagnostic apparatus. Furthermore, recent ultrasonic diagnostic apparatuses have dramatically improved signal reception sensitivity, and a sufficient depth of field is obtained for most subjects. Therefore, the operator cannot positively detect the degree of attenuation.
これらの問題を解決するため、いくつかの技術が提案されている。例えば、周波数帯域の異なる超音波パルスを同一方向へ2回に分けて送受信するものがある(特許文献1参照)。この技術は、生体減衰量は周波数によって異なるため、2つのパルスの減衰量を比較することで、媒質の減衰定数を類推しようとするものである。また、同一方向に1回の送受信のみ行い、受信信号に含まれる2つの異なる周波数帯域成分を抽出し、それらの各信号を重みづけ加算することで従来の断層象に減衰情報を付加する技術がある(特許文献1参照)。この技術では、1回の送受信で実現可能な簡便な手法となっている。 Several techniques have been proposed to solve these problems. For example, there is one that transmits and receives ultrasonic pulses having different frequency bands in the same direction twice (see Patent Document 1). In this technique, since the biological attenuation amount varies depending on the frequency, the attenuation constant of the medium is compared by comparing the attenuation amounts of the two pulses. In addition, there is a technique for adding attenuation information to a conventional tomogram by performing only one transmission / reception in the same direction, extracting two different frequency band components included in the received signal, and weighting and adding each of those signals. Yes (see Patent Document 1). This technique is a simple technique that can be realized by one transmission and reception.
以上述べたように、従来の手法は、超音波伝搬による減衰量が周波数が高くなるほど大きくなることを利用している。しかしながら、従来の手法は、伝搬による高調波の発生現象を考慮していないため、超音波の減衰量を有効な診断情報として正確かつ簡単に取得することができない。 As described above, the conventional method uses the fact that the attenuation amount due to ultrasonic wave propagation increases as the frequency increases. However, since the conventional method does not consider the phenomenon of generation of harmonics due to propagation, it is not possible to accurately and easily acquire the attenuation amount of ultrasonic waves as effective diagnostic information.
すなわち、生体内に送信された超音波パルスは、伝搬の過程で波形に歪が生じ、パルス波形の高調波成分は次第に増幅されていく。この生体内にて相当の高調波成分の増幅が起こっている事実から、単純な2つの周波数成分の比較は困難であることが示唆される。なぜなら、ある周波数成分は、生体内伝搬の過程で、生体減衰によって減弱する一方で、その2分の1の周波数成分から発生した組織ハーモニックによって増幅されているからである。これではいくら2つの異なる周波数成分を比較しても、正確な減衰量を推定することは困難である。 That is, the ultrasonic pulse transmitted into the living body is distorted in the waveform during propagation, and the harmonic components of the pulse waveform are gradually amplified. The fact that considerable harmonic components are amplified in the living body suggests that it is difficult to compare two simple frequency components. This is because a certain frequency component is attenuated by the attenuation of the living body in the course of propagation in the living body, while being amplified by the tissue harmonic generated from the half frequency component. This makes it difficult to estimate an accurate amount of attenuation no matter how many different frequency components are compared.
なお、近年、上述の生体伝搬の過程で高調波が発生する現象に着目した映像化手法が開発されている。これは、組織ハーモニックイメージング(THI:Tissue Harmonic Imaging)と呼ばれており、伝搬による高調波成分のみを抽出して映像化し、コントラスト分解能及び空間分解能が優れた超音波画像を取得するものである。 In recent years, imaging methods have been developed that focus on the phenomenon in which harmonics are generated during the above-described biological propagation process. This is called tissue harmonic imaging (THI), which extracts and visualizes only the harmonic components due to propagation, and acquires an ultrasound image with excellent contrast resolution and spatial resolution.
本発明は、上記事情を鑑みてなされたもので、高調波成分の影響を除去し、被検体内を伝搬する超音波の減衰量を好適に評価することができる超音波診断装置及び超音波診断装置制御プログラムを提供することを目的としている。 The present invention has been made in view of the above circumstances, and an ultrasonic diagnostic apparatus and an ultrasonic diagnosis that can remove the influence of harmonic components and can appropriately evaluate the attenuation of ultrasonic waves propagating in the subject. The object is to provide a device control program.
本発明は、上記目的を達成するため、次のような手段を講じている。 In order to achieve the above object, the present invention takes the following measures.
請求項1に記載の発明は、第1の中心周波数を持つる第1の超音波と前記第1の中心周波数とは異なる第2の中心周波数を持つ第2の超音波とが少なくとも合成された合成超音波を、被検体内の複数の方向のそれぞれについて、位相を変調させて少なくとも二回送信し、当該被検体から前記複数の方向のそれぞれについて、前記少なくとも二回の送信のそれぞれに対応するエコー信号を受信する超音波送受信手段と、前記複数の方向のそれぞれにつき、前記少なくとも二回の送信のそれぞれに対応するエコー信号間で減算処理を行うことで高調波を相殺した後、前記第1の超音波に対応する第1のエコー信号と、前記第2の超音波に対応する第2のエコー信号とを抽出する信号抽出手段と、前記第1のエコー信号と前記第2のエコー信号とを用いて、前記被検体内を伝搬する超音波の減衰を表す減衰画像を生成する画像生成手段と、を具備することを特徴とする超音波診断装置である。 According to the first aspect of the present invention, at least a first ultrasonic wave having a first center frequency and a second ultrasonic wave having a second center frequency different from the first center frequency are synthesized. Synthetic ultrasonic waves are transmitted at least twice with the phase being modulated in each of a plurality of directions in the subject, and each of the plurality of directions from the subject corresponds to each of the at least two transmissions. Ultrasonic wave transmitting / receiving means for receiving an echo signal, and canceling higher harmonics by subtracting between the echo signals corresponding to each of the at least two transmissions for each of the plurality of directions, Signal extraction means for extracting a first echo signal corresponding to the ultrasonic wave and a second echo signal corresponding to the second ultrasonic wave, the first echo signal and the second echo signal, The There are, said an ultrasonic diagnostic apparatus characterized by comprising an image generating device which generates an attenuation image representing the attenuation of the ultrasonic wave propagating in an object, the.
請求項6に記載の発明は、超音波診断装置に内蔵されたコンピュータに、第1の中心周波数を持つ第1の超音波と前記第1の中心周波数とは異なる第2の中心周波数を持つ第2の超音波とが少なくとも合成された合成超音波を、被検体内の複数の方向のそれぞれについて、位相を変調させて少なくとも二回送信させ、当該被検体から前記複数の方向のそれぞれについて、前記少なくとも二回の送信のそれぞれに対応するエコー信号を受信させる超音波送受信機能と、前記複数の方向のそれぞれにつき、前記少なくとも二回の送信のそれぞれに対応するエコー信号間で減算処理を実行させることで高調波を相殺した後、前記第1の超音波に対応する第1のエコー信号と、前記第2の超音波に対応する第2のエコー信号とを抽出させる信号抽出機能と、前記第1のエコー信号と前記第2のエコー信号とを用いて、前記被検体内を伝搬する超音波の減衰を表す減衰画像を生成させる画像生成機能と、を実現させることを特徴とする超音波診断装置制御プログラムである。 According to a sixth aspect of the present invention, in a computer built in an ultrasonic diagnostic apparatus, a first ultrasonic wave having a first center frequency and a second center frequency different from the first center frequency are provided. The synthesized ultrasonic wave, which is synthesized with at least two ultrasonic waves, is modulated at least twice with respect to each of a plurality of directions in the subject, and is transmitted from the subject to each of the plurality of directions. An ultrasonic transmission / reception function for receiving echo signals corresponding to at least two transmissions, and a subtraction process between the echo signals corresponding to each of the at least two transmissions for each of the plurality of directions; A signal extractor for extracting the first echo signal corresponding to the first ultrasonic wave and the second echo signal corresponding to the second ultrasonic wave after canceling the harmonics by And an image generation function for generating an attenuation image representing attenuation of an ultrasonic wave propagating in the subject using the first echo signal and the second echo signal, This is an ultrasonic diagnostic apparatus control program.
以上本発明によれば、高調波成分の影響を除去し、被検体内を伝搬する超音波の減衰量を好適に評価することができる超音波診断装置及び超音波診断装置制御プログラムを実現することができる。 As described above, according to the present invention, it is possible to realize an ultrasonic diagnostic apparatus and an ultrasonic diagnostic apparatus control program that can remove the influence of harmonic components and can appropriately evaluate the attenuation amount of ultrasonic waves propagating in the subject. Can do.
以下、本発明の第1実施形態及び第2実施形態を図面に従って説明する。なお、以下の説明において、略同一の機能及び構成を有する構成要素については、同一符号を付し、重複説明は必要な場合にのみ行う。 Hereinafter, first and second embodiments of the present invention will be described with reference to the drawings. In the following description, components having substantially the same function and configuration are denoted by the same reference numerals, and redundant description will be given only when necessary.
(第1実施形態)
図1は、本実施形態に係る超音波診断装置のブロック構成を示した図である。同図に示すように、本超音波診断装置本体11は、超音波プローブ12、入力装置13、モニタ14、超音波送信ユニット21、超音波受信ユニット22、Bモード処理ユニット23、ドプラ処理ユニット24、画像生成ユニット25、画像メモリ26、画像合成ユニット27、制御プロセッサ28、記憶ユニット29、その他インターフェースユニット30を具備している。装置本体11に内蔵される超音波送信ユニット21および受信ユニット22等は、集積回路などのハードウェアで構成されることもあるが、ソフトウェア的にモジュール化されたソフトウェアプログラムである場合もある。以下、個々の構成要素の機能について説明する。(First embodiment)
FIG. 1 is a diagram showing a block configuration of the ultrasonic diagnostic apparatus according to the present embodiment. As shown in the figure, the ultrasonic diagnostic apparatus main body 11 includes an
超音波プローブ12は、超音波受信ユニット21からの駆動信号に基づき超音波を発生し、被検体からの反射波を電気信号に変換する複数の圧電振動子、当該圧電振動子に設けられる整合層、当該圧電振動子から後方への超音波の伝播を防止するバッキング材等を有している。当該超音波プローブ12から被検体Pに超音波が送信されると、当該送信超音波は、体内組織の音響インピーダンスの不連続面で次々と反射され、エコー信号として超音波プローブ12に受信される。このエコー信号の振幅は、反射することになった反射することになった不連続面における音響インピーダンスの差に依存する。また、送信された超音波パルスが、移動している血流や心臓壁等の表面で反射された場合のエコーは、ドプラ効果により移動体の超音波送信方向の速度成分を依存して、周波数偏移を受ける。 The
入力装置13は、装置本体11に接続され、オペレータからの各種指示、条件、関心領域(ROI)の設定指示、種々の画質条件設定指示等を装置本体11にとりこむための各種スイッチ、ボタン、トラックボールの他、マウス、キーボード等を有している。 The
モニタ14は、画像生成ユニット25からのビデオ信号に基づいて、生体内の形態学的情報を示す画像、血流情報を示す画像、後述する減衰画像等を表示する。 Based on the video signal from the
超音波送信ユニット21は、パルス発生器21A、送信遅延部21Bおよびパルサ21Cを有している。パルス発生器21Aでは、所定のレート周波数fr Hz(周期;1/fr秒)で、送信超音波を形成するためのレートパルスが繰り返し発生される。また、送信遅延部21Bでは、チャンネル毎に超音波をビーム状に集束し且つ送信指向性を決定するのに必要な遅延時間が、各レートパルスに与えられる。パルサ21は、このレートパルスに基づくタイミングで、プローブ12に駆動パルスを印加する。 The ultrasonic transmission unit 21 includes a
超音波受信ユニット22は、プリアンプ22A、A/D変換器(図示せず)、受信遅延部22B、加算器22C等を有している。プリアンプ22Aでは、プローブ12を介して取り込まれたエコー信号をチャンネル毎に増幅する。受信遅延部22Bは、増幅されたエコー信号に対し受信指向性を決定するのに必要な遅延時間を与える。その後、加算器22Cにおいて加算処理を行う。この加算により、エコー信号の受信指向性に応じた方向からの反射成分が強調され、受信指向性と送信指向性とにより超音波送受信の総合的なビームが形成される。また、超音波受信ユニット22は、後述する減算処理を実行し、高調波の影響が除去された基本波成分を抽出する。 The ultrasonic reception unit 22 includes a
Bモード処理ユニット23は、受信ユニット22からエコー信号を受け取り、対数増幅、包絡線検波処理などを施し、信号強度が輝度の明るさで表現されるデータを生成する。図示しないが、Bモード処理ユニット23には、エコー信号を一時的に記憶するラインメモリが具備され、任意の2つのエコー信号の加算、減算などの処理を行うことが可能となっている。Bモード処理ユニット23からの出力は、画像生成ユニット25に送信され、反射波の強度を輝度にて表したBモード画像としてモニタ14に表示される。また、Bモード処理ユニット23は、後述する差分処理等を実行し、減衰画像データを生成する。 The B-
ドプラ処理ユニット23は、受信ユニット22から受け取ったエコー信号から速度情報を周波数解析し、ドプラ効果による血流や組織、造影剤エコー成分を抽出し、平均速度、分散、パワー等の血流情報を多点について求める。得られた血流情報は画像生成ユニット25に送られ、平均速度画像、分散画像、パワー画像、これらの組み合わせ画像としてモニタ14にカラー表示される。 The
画像生成ユニット25は、超音波スキャンの走査線信号列を、テレビなどに代表される一般的なビデオフォーマットの走査線信号列に変換し、表示画像としての超音波診断画像を生成する。画像生成ユニット25は、画像データを格納する記憶メモリを搭載しており、例えば診断の後に操作者が検査中に記録された画像を呼び出すことが可能となっている。なお、当該画像生成ユニット25に入る以前のデータは、「生データ」と呼ばれることがある。 The
画像メモリ26は、画像生成ユニット25から受信した画像データを格納する記憶メモリから成る。この画像データは、例えば診断の後に操作者が呼び出すことが可能となっており、静止画的に、あるいは複数枚を使って動画的に再生することが可能でなる。また、画像メモリ26は、超音波受信ユニット22直後の出力信号(RF(Radio Frequency)信号と呼ばれる)、受信ユニット22通過後の画像輝度信号、その他の生データ、ネットワークを介して取得した画像データ等を必要に応じて記憶する。 The
制御プロセッサ28は、情報処理装置(計算機)としての機能を持ち、本超音波診断装置本体の動作を制御する制御手段である。制御プロセッサ28は、記憶ユニット29から後述する減衰画像生成機能等を実行するための制御プログラムを読み出して各種処理に関する演算・制御等を実行する
記憶ユニット29は、後述のスキャンシーケンス、画像生成。表示処理を実行するための制御プログラムや、診断情報(患者ID、医師の所見等)、診断プロトコル、送受信条件、後述する減衰画像生成機能を実現するためのプログラムその他のデータ群が保管されている。また必要に応じて、画像メモリ26中の画像の保管などにも使用される。記憶ユニット29のデータは、インタフェースユニット30を経由して外部周辺装置へ転送することも可能となっている。The
インターフェースユニット30は、入力装置13、ネットワーク、新たな外部記憶装置(図示せず)に関するインタフェースである。当該装置によって得られた超音波画像等のデータや解析結果等は、インターフェースユニット30よって、ネットワークを介して他の装置に転送可能である。 The
(減衰画像生成機能)
次に、本実施形態に係る超音波診断装置1が具備する減衰画像生成機能について説明する。この機能は、中心周波数の異なる少なくとも二つの基本波を合成した合成波を用いて、各走査線について位相変調(フェーズモジュレーション)しながら少なくとも二回以上送信し、各走査線について各送信に対応するエコー信号を受信する。こうして得られた少なくとも二回の送信のそれぞれに対応するエコー信号を用いて、各走査線につきエコー信号間で減算処理を行うことで、高調波成分が相殺されたエコー信号を抽出し、この抽出されたエコー信号を用いて、被検体内を伝搬する超音波の減衰を表す画像(減衰画像)を生成するものである。(Attenuation image generation function)
Next, the attenuation image generation function provided in the ultrasonic
図2は、本実施形態に係る減衰画像生成機能に従う処理(減衰画像生成処理)の流れを示したフローチャートである。各ステップの処理の内容について、以下説明する。 FIG. 2 is a flowchart showing a flow of processing (attenuated image generation processing) according to the attenuated image generation function according to the present embodiment. The contents of the processing at each step will be described below.
[患者情報・送受信条件等の入力受:ステップS1]
まず、制御プロセッサ28は、入力装置13を介して、患者情報、送信条件及び受信条件(送受信条件)等の入力を受ける。ここでは、特に比較的高帯域で複数の周波数成分を含んだ超音波パルスが送信されるような送信条件、各走査線において実行される位相変調しながらの複数回の超音波送受信回数等が入力される。なお、本実施形態においては、説明を具体的にするため、各走査線において実行される位相変調しながらの超音波送受信回数は2回とする。しかしながら、当該例に拘泥されず、操作者は、任意の複数回数を入力することが可能である。[Input of patient information / transmission / reception conditions, etc .: Step S1]
First, the
[位相変調しながらの超音波送受信:ステップS2]
次に、制御プロセッサ28は、ステップS1において入力された送信条件に従う超音波送信が実行されるように、超音波送信ユニット21を制御する。超音波送信ユニット21から送信される超音波パルスは、後述する減衰量の分析を良好とするための、比較的広帯域で複数の周波数成分を含んだパルスである。例えば、図3(a)に示すような従来型の単一周波数を基本とした波形を持つ超音波パルスに比べて、本ステップS2において送信される超音波パルス波形は、図4(a)に示すような、2つの異なる中心周波数f1、f2(f1<f2)の基本波を線形加算(合成)して得られる合成超音波パルスを用いる。この様な波形を持つ超音波パルスにより、送信される超音波パルスの周波数帯域は、広い周波数帯域を有する図4(b)のようなスペクトラムを有するものとなる。一方、従来型のものは、図3(b)に示すように、本ステップS2において用いられるものよりも狭い帯域のスペクトラムを有するものとなる。超音波送信ユニット21は、上述した合成超音波パルスを、波形の極性が1回目と2回目とで反転(正負が逆)となるように位相変調(すなわち、位相を180度変調)しながら、各走査線につき2回の超音波送信を行う。[Ultrasonic wave transmission / reception with phase modulation: Step S2]
Next, the
なお、本実施形態では、2つの異なる中心周波数f1、f2の基本波を線形加算(合成)して得られる合成超音波パルスを用いる場合を例とした。しかしながら、合成超音波パルスは、当該例に拘泥されず、3つ以上の異なる中心周波数の基本波を線形加算して生成してもよい。 In the present embodiment, an example in which a synthesized ultrasonic pulse obtained by linearly adding (synthesizing) fundamental waves of two different center frequencies f1 and f2 is used. However, the synthesized ultrasonic pulse is not limited to this example, and may be generated by linearly adding three or more fundamental waves having different center frequencies.
[減算処理(f1周波数成分、f2周波数成分の抽出):ステップS3]
超音波受信ユニット22は、各走査線につき、1回目の送信超音波に対応するエコー(第1のエコー信号の元となる信号)及び2回目の送信超音波に対応するエコー(第2のエコーの元となる信号)とをそれぞれ所定のタイミングで受信すると共に、一方から他方を減算(例えば第1のエコー信号から第2のエコー信号を減算)する。この減算処理により、高周波が相殺され、且つf1周波数成分、f2周波数成分が減算により強調され抽出されたエコー信号(第3のエコー信号)が生成される。[Subtraction processing (extraction of f1 frequency component, f2 frequency component): Step S3]
For each scanning line, the ultrasonic reception unit 22 has an echo corresponding to the first transmission ultrasonic wave (a signal that is a source of the first echo signal) and an echo corresponding to the second transmission ultrasonic wave (the second echo). Are received at a predetermined timing, and the other is subtracted from one (for example, the second echo signal is subtracted from the first echo signal). By this subtraction process, an echo signal (third echo signal) is generated in which the high frequency is canceled and the f1 frequency component and the f2 frequency component are enhanced and extracted by subtraction.
本実施形態においては、波形が正負反転する2つのパルスによるエコー信号を減算している。これは、特に伝搬中の波形歪による高調波成分の発生による影響を取り除くためである。すなわち、例えば図3(a)に示した従来の超音波の送受信においては、生体内の伝搬中に、中心周波数f1の基本波の高調波成分がf2の周波数帯域に発生する。非線形歪は伝搬に従い蓄積するため、遠距離になるに従い蓄積量が多くなる。そのため、f2周波数成分は、生体減衰による減少と、高調波成分の蓄積による増大が、混在した状況になり、正確な減衰量を反映できなくなる。 In the present embodiment, the echo signal is subtracted from two pulses whose waveforms are inverted. This is in order to remove the influence caused by the generation of harmonic components due to waveform distortion during propagation. That is, for example, in the conventional ultrasonic wave transmission / reception shown in FIG. 3A, the harmonic component of the fundamental wave of the center frequency f1 is generated in the frequency band of f2 during propagation in the living body. Since nonlinear distortion accumulates as it propagates, the accumulation amount increases as the distance increases. For this reason, the f2 frequency component is mixed with a decrease due to bioattenuation and an increase due to accumulation of harmonic components, and an accurate attenuation cannot be reflected.
一方、本ステップS2の減算によって得られる第3のエコー信号は、生体内伝搬による2次高調波成分が相殺され、基本波成分のみが残存するものとなっている。このため、生体減衰による効果を有効に抽出することが可能となる。 On the other hand, in the third echo signal obtained by the subtraction in step S2, the second harmonic component due to the propagation in the living body is canceled and only the fundamental wave component remains. For this reason, it becomes possible to extract effectively the effect by biological attenuation.
本ステップS2の減算に関する具体的な実測例を図5に示す。同図においては、0.5dB/cm/MHzの減衰を持つファントムからのエコー信号について、2MHz帯域成分と4MHz帯域成分を抽出し、観測深度ごとにその比を演算したものである。第3のエコー信号に相当する演算による結果55は、深さによってほぼ均一(直線的)な増加が観測され、減衰量はファントムの公称値から算出される値とほぼ等しい値となっている。一方、従来のエコー信号に相当する結果56は、深部にいくにつれて信号比は増加するものの、その増加の程度は第3のエコー信号の結果55より小さくなっており、高調波の発生が影響していることがわかる。 A specific actual measurement example regarding the subtraction in step S2 is shown in FIG. In this figure, 2 MHz band components and 4 MHz band components are extracted from the echo signal from the phantom having an attenuation of 0.5 dB / cm / MHz, and the ratio is calculated for each observation depth. In the
なお、波形が正負反転する2つのパルスによるエコー信号を加算すると、送信超音波に含まれている基本波信号はキャンセルされ、生体内伝搬中の歪によって生じた非線形成分のみが抽出される。この手法は組織ハーモニックイメージング(THI)法において広く利用されている。 Note that when echo signals of two pulses whose waveforms are inverted are added, the fundamental wave signal included in the transmitted ultrasonic wave is canceled, and only the non-linear component caused by distortion during in vivo propagation is extracted. This technique is widely used in the tissue harmonic imaging (THI) method.
[減衰画像データの生成:ステップS4]
次に、Bモード処理ユニット23は、2種類以上の帯域通過型のフィルタを用いて、第3のエコー信号からf1周波数成分、f2周波数成分を抽出する。また、Bモード処理ユニット23は、抽出されたf1周波数成分、f2周波数成分を用いて、走査断面の各位置につき、信号強度の差(対数圧縮後)又は比(対数圧縮前)を計算する。さらに、計算された信号強度の差を用いて、走査断面の各位置につき当該信号強度の差が輝度によって表された画像データ(減衰画像データ)を生成する。[Generation of Attenuated Image Data: Step S4]
Next, the B-
なお、本実施形態においては、f1周波数成分、f2周波数成分が合成された合成超音波パルスを用いて超音波送信を行う場合を例としている。しかしながら、3種類以上の周波数成分による合成超音波パルスを送信し、これによって受信した各エコー信号から得られた第3のエコー信号を用いる場合には、当該信号差の計算は、異なる組み合わせで得られた信号比の平均値等を利用することができる。また、信号差は、対数変換前のRF信号の割り算で得てもよいし、あるいは対数変換後の差分演算で求めてもよい。 In the present embodiment, an example in which ultrasonic transmission is performed using a synthesized ultrasonic pulse in which the f1 frequency component and the f2 frequency component are combined is taken as an example. However, when a synthesized ultrasonic pulse with three or more types of frequency components is transmitted and the third echo signal obtained from each received echo signal is used, the calculation of the signal difference is obtained in different combinations. The average value of the obtained signal ratio can be used. The signal difference may be obtained by dividing the RF signal before logarithmic conversion, or may be obtained by difference calculation after logarithmic conversion.
[減衰画像の表示:ステップS5]
次に、画像生成ユニット25は、Bモード処理ユニット23から取得した減衰画像データを用いて、減衰画像を生成する。生成された減衰画像は、画像合成ユニット27において所定の情報と合成され、モニタ14に所定の形態で表示される。[Display of attenuation image: Step S5]
Next, the
ここで、減衰画像の特性について説明する。まず基本的な原理として、生体内を伝搬するエコー信号は、高周波ほど減衰する。このことから、例えば図6において近距離領域(すなわち、被検体表面に近い領域)でのある位置でのエコー信号の周波数スペクトラムを51のように示すと、遠距離領域(すなわち、被検体表面から深い領域)でのある位置でのエコー信号の周波数スペクトラムは、52のように象徴的に表すことができる。すなわち、低周波数帯域f1に比べて高周波帯域f2の減衰量は大きいため、f1帯域とf2帯域の信号強度差を演算すれば、近距離部では差が小さく、遠距離部では差が大きくなると予測される。従って、f1周波数成分とf2周波数成分との差である減衰画像データを用いて生成された減衰画像によれば、深さに応じた超音波の減衰状況を、例えば、深くなるに従って暗くなるような形態で視覚化することができる。なお、当然ながら減衰画像は生体減衰の大きさに依存する。従って、もし水のように減衰が小さい媒体の場合は、f1とf2の差は、深度によらずほぼ同一となる。 Here, the characteristics of the attenuated image will be described. First, as a basic principle, the echo signal propagating in the living body is attenuated as the frequency increases. From this, for example, when the frequency spectrum of the echo signal at a certain position in the short distance region (that is, the region close to the subject surface) in FIG. 6 is shown as 51, the long distance region (that is, from the subject surface). The frequency spectrum of the echo signal at a certain position in the deep region can be symbolically expressed as 52. That is, since the attenuation amount of the high frequency band f2 is larger than that of the low frequency band f1, if the signal intensity difference between the f1 band and the f2 band is calculated, the difference is predicted to be small in the short distance portion and large in the long distance portion. Is done. Therefore, according to the attenuation image generated using the attenuation image data that is the difference between the f1 frequency component and the f2 frequency component, the attenuation state of the ultrasonic wave corresponding to the depth becomes darker as the depth increases, for example. It can be visualized in form. Of course, the attenuation image depends on the magnitude of the biological attenuation. Therefore, in the case of a medium with small attenuation such as water, the difference between f1 and f2 is almost the same regardless of the depth.
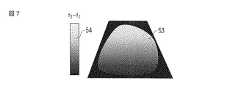
図7は、減衰画像の表示形態の一例を示した図である。同図の例においては、減衰画像53と共に、差の程度を示すスケールバー54が表示されている(ここでは、周波数f1、f2の両方から求められる減衰量が大きければ大きいほど、色が濃くなるように設定されている)。 FIG. 7 is a diagram showing an example of the display form of the attenuation image. In the example shown in the figure, a
また、画像生成ユニット25は、Bもモード処理ユニット23において処理された第1のエコー信号、第2のエコー信号のそれぞれを用いることで、中心周波数f1の基本波に対応する第1の超音波画像、中心周波数f2の基本波に対応する第2の超音波画像を生成することができる。さらに、Bモード処理ユニット23において処理された第1のエコー信号、第2のエコー信号を加算した加算エコー信号を用いて、f1周波数成分、f2周波数成分の双方の成分を含む第3の超音波画像を生成することも可能である。これらの超音波画像は、単独で、或いは減衰画像と共に所定の形態で表示することができる。 The
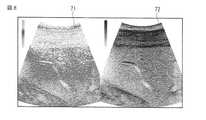
図8は、第1、第2、第3の超音波画像71のいずれかと減衰画像72との並列表示の一例を示した図である。一般的に、減衰を補正したBモード断層像の方が、組織構造を観察するのに適している。従って、図8に示した表示形態によれば、組織構造を通常の超音波画像(Bモード断層像)71で、深度に対応した超音波の減衰状況を減衰画像72で、それぞれ容易且つ迅速に観察することができる。減衰画像72はBモード断層像と重畳表示することは、減衰画像72に不足している組織構造を補償することで非常に効果的である。 FIG. 8 is a diagram illustrating an example of parallel display of any one of the first, second, and third
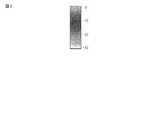
なお、減衰画像は減衰の様子をより強調して表現することが望ましいため、減衰量に依存したカラー表示(すなわち、減衰の度合いに応じて色彩が割り当てられた表示)をすることも可能とする。係る場合には、図9に示すような減衰量と色彩との対応関係を示すカラースケールバーを同時に表示することが好ましい。このカラースケールバーには、より定量的な情報を示すべく、演算結果の数値を表示することも可能である。さらに、当該例に拘泥されず、第1、第2、第3の超音波画像(Bモード断層像)のいずれかと減衰画像とを重畳表示するようにしてもよい。 In addition, since it is desirable that the attenuation image expresses the state of attenuation more emphasized, it is possible to perform color display depending on the attenuation amount (that is, display in which a color is assigned according to the degree of attenuation). . In such a case, it is preferable to simultaneously display a color scale bar indicating the correspondence between attenuation and color as shown in FIG. In this color scale bar, it is also possible to display the numerical value of the calculation result in order to show more quantitative information. Further, without being limited to this example, any one of the first, second, and third ultrasonic images (B-mode tomographic images) and the attenuated image may be superimposed and displayed.
(効果)
以上述べた構成によれば、以下の効果を得ることができる。
本超音波診断装置によれば、中心周波数f1の基本波と中心周波数f2の基本波とを合成した合成波を用いて、各走査線について位相変調しながら少なくとも二回以上送信し、各走査線について各送信に対応するエコー信号を受信する。こうして得られた少なくとも二回の送信のそれぞれに対応するエコー信号を用いて、各走査線につきエコー信号間で減算処理を行うことで、高調波成分が相殺されたエコー信号を抽出し、この抽出されたエコー信号に含まれるf1周波数成分、f2周波数成分を用いて、走査断面の各位置につき、信号強度の差(対数圧縮後)又は比(対数圧縮前)を計算する。さらに、計算された信号強度の差を用いて、走査断面の各位置につき当該信号強度の差が輝度によって表された減衰画像を生成する。従って、高調波の影響が取り除かれた減衰画像を生成することができ、例えば肝臓内脂肪化の程度や乳房脂肪組織と乳腺との比率などの評価を簡便に行うことが可能となる。(effect)
According to the configuration described above, the following effects can be obtained.
According to this ultrasonic diagnostic apparatus, each scanning line is transmitted at least twice while being phase-modulated with respect to each scanning line using a synthesized wave obtained by synthesizing the fundamental wave having the center frequency f1 and the fundamental wave having the center frequency f2. Echo signals corresponding to each transmission are received. Using the echo signals corresponding to each of at least two transmissions obtained in this way, an echo signal in which harmonic components are canceled is extracted by performing subtraction processing between the echo signals for each scanning line, and this extraction A difference (after logarithmic compression) or a ratio (before logarithmic compression) or a ratio (before logarithmic compression) is calculated for each position of the scanning section using the f1 frequency component and the f2 frequency component included in the echo signal. Further, using the calculated signal intensity difference, an attenuated image in which the signal intensity difference is represented by luminance at each position of the scanning section is generated. Therefore, it is possible to generate an attenuated image from which the influence of harmonics has been removed, and it is possible to easily evaluate, for example, the degree of intrahepatic fatification and the ratio between breast adipose tissue and mammary gland.
また、通常の超音波画像と減衰画像とを、並列表示、重畳表示等の所望の形態で表示することができる。従って、画像観察の際には、組織構造を通常の超音波画像で、深度に対応した超音波の減衰状況を減衰画像で、それぞれ容易且つ迅速に観察することができる。さらに、減衰の度合いに応じたカラー表示することができ、視認性の高い減衰画像を提供することができる。 Further, the normal ultrasonic image and the attenuated image can be displayed in a desired form such as parallel display or superimposed display. Accordingly, when observing an image, it is possible to easily and quickly observe the tissue structure with a normal ultrasonic image and the attenuation state of the ultrasonic wave corresponding to the depth with an attenuated image. Furthermore, color display corresponding to the degree of attenuation can be performed, and an attenuated image with high visibility can be provided.
(第2の実施形態)
次に、本発明の第2の実施形態について説明する。本実施形態に係る超音波診断装置では、第1の実施形態と同様の超音波送受信によって取得されたエコー信号を用いて、各走査線につきエコー信号間で減算処理を行うことで、高調波成分が相殺されたエコー信号を抽出する。この抽出されたエコー信号を用いて、例えばf1周波数成分を用いた超音波画像に対して実行する減衰補正を、f2周波数成分を用いた超音波画像についても実行することで(或いは、f2周波数成分を用いた超音波画像に対して実行する減衰補正を、f1周波数成分を用いた超音波画像についても実行することで)、減衰画像を生成するものである。なお、以下においては、説明を具体的にするため、f1周波数成分を用いた超音波画像に対して実行するf1減衰補正を、f2周波数成分を用いた超音波画像についても実行する場合を例として説明する。(Second Embodiment)
Next, a second embodiment of the present invention will be described. In the ultrasonic diagnostic apparatus according to the present embodiment, a harmonic component is obtained by performing a subtraction process between echo signals for each scanning line using an echo signal acquired by ultrasonic transmission / reception similar to that of the first embodiment. The echo signal from which is canceled is extracted. By using this extracted echo signal, for example, attenuation correction performed on an ultrasound image using the f1 frequency component is also performed on the ultrasound image using the f2 frequency component (or the f2 frequency component). Attenuation correction to be performed on the ultrasonic image using the f1 is also performed on the ultrasonic image using the f1 frequency component) to generate an attenuated image. In the following, for the sake of specific explanation, an example in which f1 attenuation correction performed on an ultrasonic image using the f1 frequency component is also performed on an ultrasonic image using the f2 frequency component is taken as an example. explain.
図10は、第2の実施形態に係る減衰画像生成処理の流れを示したフローチャートである。各ステップの処理の内容について、以下説明する。なお、同図におけるステップS11〜ステップS13までの各処理は、図2に示したステップS1〜ステップS3までの各処理と実質的に同じであるため、以下ステップS14〜ステップS16の各処理の内容について説明する。 FIG. 10 is a flowchart showing the flow of the attenuated image generation process according to the second embodiment. The contents of the processing at each step will be described below. In addition, since each process from step S11 to step S13 in the figure is substantially the same as each process from step S1 to step S3 shown in FIG. 2, the contents of each process from step S14 to step S16 are described below. Will be described.
[f1周波数成分に対するf1減衰補正:ステップS14]
次に、Bモード処理ユニット23は、2種類以上の帯域通過型のフィルタを用いて、第3のエコー信号からf1周波数成分、f2周波数成分を抽出する。また、Bモード処理ユニット23は、抽出されたf1周波数成分に対して、f1周波数成分の被検体内における減衰を補正し、f1周波数成分の強度を一定にするための関数(減衰補正関数)g(x,y)を取得し、当減衰補正関数g(x,y)を用いてf1周波数成分の強度を一定にするための処理(f1減衰補正)を実行する。また、Bモード処理ユニット23は、補正後のf1周波数成分を用いて、走査断面の各位置につき当該信号強度の差が輝度によって表された画像データ(補正f1周波数成分画像データ)を生成する。さらに、Bモード処理ユニット23は、抽出されたf2周波数成分に対して衰補正関数g(x,y)を用いてf1減衰補正を実行し、補正後のf2周波数成分を用いて、走査断面の各位置につき信号強度が輝度によって表された画像データ(補正f2周波数成分画像データ)を生成する。[F1 attenuation correction for f1 frequency component: Step S14]
Next, the B-
ここで、補正f2周波数成分画像の特性について説明する。一般的に、生体内を伝搬するエコー信号は高周波ほど減衰するため、高周波数であるf2周波数成分は、被検体内においてf1周波数成分よりも減衰することは、図6に示した通りである。従って、f2周波数成分の強度は、図11(a)上段に示すように深度(距離)が深くなるほどf1周波数成分の強度との差が大きくなる。また、f1周波数成分の強度を一定にするためのf1減衰補正をf2周波数成分に対して行うと、補正後のf2周波数成分は、図11(a)下段に示すように、強度一定の点線として示されたf1周波数成分に対して所定の減衰定数(図の例では0.5×(f1−f2))で減衰することとなる。この様な特性を有する(f1減衰)補正後のf2周波数成分を用いて生成された補正f2周波数成分画像は、走査断面の各位置につき当該信号強度の差が輝度によって表される画像、すなわち減衰画像そのものとなる。 Here, the characteristics of the corrected f2 frequency component image will be described. In general, since the echo signal propagating in the living body is attenuated as the frequency increases, the f2 frequency component, which is a high frequency, attenuates more than the f1 frequency component in the subject as shown in FIG. Therefore, as shown in the upper part of FIG. 11A, the intensity of the f2 frequency component becomes larger as the depth (distance) increases. Further, when f1 attenuation correction for making the intensity of the f1 frequency component constant is performed on the f2 frequency component, the corrected f2 frequency component is shown as a dotted line with constant intensity, as shown in the lower part of FIG. The indicated f1 frequency component is attenuated by a predetermined attenuation constant (0.5 × (f1−f2) in the example in the figure). The corrected f2 frequency component image generated using the corrected f2 frequency component having such characteristics (f1 attenuation) is an image in which the difference in signal intensity is represented by luminance at each position in the scanning section, that is, attenuation. It becomes the image itself.
なお、当然ながら、減衰定数は、生体内の減衰の程度に応じて任意の値に設定可能である。一例として、図11(b)に減衰定数=1.0の場合を示した。図11(b)に示すように、被検体の減衰定数が大きいと、補正後のf2画像の深さ方向に関する輝度変化が、図11(a)の例に比べて、大きくなる。 Of course, the attenuation constant can be set to an arbitrary value according to the degree of attenuation in the living body. As an example, FIG. 11B shows a case where the attenuation constant = 1.0. As shown in FIG. 11B, when the attenuation constant of the subject is large, the luminance change in the depth direction of the corrected f2 image is larger than that in the example of FIG.
[減衰画像の表示:ステップS15]
次に、画像生成ユニット25は、Bモード処理ユニット23から取得した減衰画像データを用いて、減衰画像を生成する。生成された減衰画像は、画像合成ユニット27において所定の情報と合成され、モニタ14に所定の形態で表示される。表示形態については、第1の実施形態と同様である。[Display of attenuation image: Step S15]
Next, the
以上述べた構成によれば、中心周波数がそれぞれf1、f2である二つの超音波波形を合成した合成波を用いて、各走査線について位相変調しながら少なくとも二回以上送信し、各走査線について各送信に対応するエコー信号を受信する。こうして得られた少なくとも二回の送信のそれぞれに対応するエコー信号を用いて、各走査線につきエコー信号間で減算処理を行うことで、高調波成分が相殺されたエコー信号を抽出し、例えばf1周波数成分を用いた超音波画像に対して実行するf1減衰補正を、f2周波数成分を用いた超音波画像についても実行することで減衰画像を生成する。従って、高調波の影響が取り除かれた減衰画像を生成することができ、例えば肝臓内脂肪化の程度や乳房脂肪組織と乳腺との比率などの評価を簡便に行うことが可能となる。 According to the configuration described above, transmission is performed at least twice while phase-modulating each scanning line using a synthesized wave obtained by synthesizing two ultrasonic waveforms whose center frequencies are f1 and f2, respectively. An echo signal corresponding to each transmission is received. By using the echo signals corresponding to each of at least two transmissions thus obtained, subtraction processing is performed between the echo signals for each scanning line to extract an echo signal in which the harmonic component is canceled, for example, f1 The attenuation image is generated by executing the f1 attenuation correction performed on the ultrasonic image using the frequency component also on the ultrasonic image using the f2 frequency component. Therefore, it is possible to generate an attenuated image from which the influence of harmonics has been removed, and it is possible to easily evaluate, for example, the degree of intrahepatic fatification and the ratio between breast adipose tissue and mammary gland.
なお、本発明は上記実施形態そのままに限定されるものではなく、実施段階ではその要旨を逸脱しない範囲で構成要素を変形して具体化できる。例えば、各実施形態に係る各機能は、当該処理を実行するプログラムをワークステーション等のコンピュータにインストールし、これらをメモリ上で展開することによっても実現することができる。このとき、コンピュータに当該手法を実行させることのできるプログラムは、磁気ディスク(フロッピー(登録商標)ディスク、ハードディスクなど)、光ディスク(CD−ROM、DVDなど)、半導体メモリなどの記録媒体に格納して頒布することも可能である。 Note that the present invention is not limited to the above-described embodiment as it is, and can be embodied by modifying the constituent elements without departing from the scope of the invention in the implementation stage. For example, each function according to each embodiment can also be realized by installing a program for executing the processing in a computer such as a workstation and developing the program on a memory. At this time, a program capable of causing the computer to execute the technique is stored in a recording medium such as a magnetic disk (floppy (registered trademark) disk, hard disk, etc.), an optical disk (CD-ROM, DVD, etc.), or a semiconductor memory. It can also be distributed.
また、上記実施形態に開示されている複数の構成要素の適宜な組み合わせにより、種々の発明を形成できる。例えば、実施形態に示される全構成要素から幾つかの構成要素を削除してもよい。さらに、異なる実施形態にわたる構成要素を適宜組み合わせてもよい。 In addition, various inventions can be formed by appropriately combining a plurality of components disclosed in the embodiment. For example, some components may be deleted from all the components shown in the embodiment. Furthermore, constituent elements over different embodiments may be appropriately combined.
以上本発明によれば、高調波成分の影響を除去し、被検体内を伝搬する超音波の減衰量を好適に評価することができる超音波診断装置及び超音波診断装置制御プログラムを実現することができる。 As described above, according to the present invention, it is possible to realize an ultrasonic diagnostic apparatus and an ultrasonic diagnostic apparatus control program that can remove the influence of harmonic components and can appropriately evaluate the attenuation amount of ultrasonic waves propagating in the subject. Can do.
1…超音波診断装置、11…装置本体、12…超音波プローブ、13…入力装置、14…モニター、21…超音波送信ユニット、21A…パルス発生器、21B…送信遅延部、21C…パルサ、22…超音波受信ユニット、22A…プリアンプ、22B…受信遅延部、22C…加算器、23…Bモード処理ユニット、24…ドプラ処理ユニット、25…画像生成ユニット、26…画像メモリ、27…画像合成ユニット、28…制御プロセッサ(CPU)、29…記憶ユニット、30…インターフェースユニットDESCRIPTION OF
Claims (6)
Translated fromJapanese前記複数の方向のそれぞれにつき、前記少なくとも二回の送信のそれぞれに対応するエコー信号間で減算処理を行うことで高調波を相殺した後、前記第1の超音波に対応する第1のエコー信号と、前記第2の超音波に対応する第2のエコー信号とを抽出する信号抽出手段と、
前記第1のエコー信号と前記第2のエコー信号とを用いて、前記被検体内を伝搬する超音波の減衰を表す減衰画像を生成する画像生成手段と、
を具備することを特徴とする超音波診断装置。A plurality of synthesized ultrasounds in which a first ultrasound having a first center frequency and a second ultrasound having a second center frequency different from the first center frequency are synthesized are combined in the subject. Ultrasonic transmission / reception means for modulating the phase at least twice with respect to each of the directions and receiving echo signals corresponding to the at least two transmissions with respect to each of the plurality of directions from the subject. ,
For each of the plurality of directions, after canceling the harmonics by performing subtraction processing between the echo signals corresponding to each of the at least two transmissions, the first echo signal corresponding to the first ultrasonic wave And a signal extraction means for extracting a second echo signal corresponding to the second ultrasonic wave,
Image generating means for generating an attenuation image representing attenuation of an ultrasonic wave propagating in the subject using the first echo signal and the second echo signal;
An ultrasonic diagnostic apparatus comprising:
前記第1のエコー信号と前記第2のエコー信号とを用いた減算処理により、第3のエコー信号を生成し、
前記第3のエコー信号を用いて、前記減衰画像を生成すること、
を特徴とする請求項1記載の超音波診断装置。The image generating means includes
A subtraction process using the first echo signal and the second echo signal generates a third echo signal,
Generating the attenuated image using the third echo signal;
The ultrasonic diagnostic apparatus according to claim 1.
前記第1のエコー信号の前記被検体内での減衰を補正する第1の補正処理を実行し、
前記第2のエコー信号に対して、前記第1の補正処理を行うことで、前記減衰画像を生成すること、
を特徴とする請求項1記載の超音波診断装置。The image generating means includes
Performing a first correction process for correcting the attenuation of the first echo signal in the subject;
Generating the attenuated image by performing the first correction process on the second echo signal;
The ultrasonic diagnostic apparatus according to claim 1.
第1の中心周波数を持つる第1の超音波と前記第1の中心周波数とは異なる第2の中心周波数を持つ第2の超音波とが少なくとも合成された合成超音波を、被検体内の複数の方向のそれぞれについて、位相を変調させて少なくとも二回送信させ、当該被検体から前記複数の方向のそれぞれについて、前記少なくとも二回の送信のそれぞれに対応するエコー信号を受信させる超音波送受信機能と、
前記複数の方向のそれぞれにつき、前記少なくとも二回の送信のそれぞれに対応するエコー信号間で減算処理を実行させることで高調波を相殺した後、前記第1の超音波に対応する第1のエコー信号と、前記第2の超音波に対応する第2のエコー信号とを抽出させる信号抽出機能と、
前記第1のエコー信号と前記第2のエコー信号とを用いて、前記被検体内を伝搬する超音波の減衰を表す減衰画像を生成させる画像生成機能と、
を実現させることを特徴とする超音波診断装置制御プログラム。In the computer built in the ultrasonic diagnostic equipment,
A synthesized ultrasound obtained by synthesizing at least a first ultrasound having a first center frequency and a second ultrasound having a second center frequency different from the first center frequency is generated in the subject. An ultrasonic transmission / reception function that modulates the phase for each of a plurality of directions and transmits at least twice, and receives an echo signal corresponding to each of the at least two transmissions for each of the plurality of directions from the subject. When,
For each of the plurality of directions, after canceling the harmonics by performing subtraction processing between echo signals corresponding to each of the at least two transmissions, the first echo corresponding to the first ultrasonic wave A signal extraction function for extracting a signal and a second echo signal corresponding to the second ultrasonic wave;
An image generation function for generating an attenuation image representing attenuation of an ultrasonic wave propagating in the subject using the first echo signal and the second echo signal;
An ultrasonic diagnostic apparatus control program characterized by realizing the above.
Priority Applications (3)
| Application Number | Priority Date | Filing Date | Title |
|---|---|---|---|
| JP2009085883AJP5349115B2 (en) | 2009-03-31 | 2009-03-31 | Ultrasonic diagnostic apparatus and control program therefor |
| US12/749,918US20100249590A1 (en) | 2009-03-31 | 2010-03-30 | Ultrasonic diagnosis apparatus and ultrasonic image generating method |
| CN2010101581174ACN101849840B (en) | 2009-03-31 | 2010-03-31 | Ultrasonic diagnosis apparatus and ultrasonic image generating method |
Applications Claiming Priority (1)
| Application Number | Priority Date | Filing Date | Title |
|---|---|---|---|
| JP2009085883AJP5349115B2 (en) | 2009-03-31 | 2009-03-31 | Ultrasonic diagnostic apparatus and control program therefor |
Publications (2)
| Publication Number | Publication Date |
|---|---|
| JP2010233859A JP2010233859A (en) | 2010-10-21 |
| JP5349115B2true JP5349115B2 (en) | 2013-11-20 |
Family
ID=42785097
Family Applications (1)
| Application Number | Title | Priority Date | Filing Date |
|---|---|---|---|
| JP2009085883AExpired - Fee RelatedJP5349115B2 (en) | 2009-03-31 | 2009-03-31 | Ultrasonic diagnostic apparatus and control program therefor |
Country Status (3)
| Country | Link |
|---|---|
| US (1) | US20100249590A1 (en) |
| JP (1) | JP5349115B2 (en) |
| CN (1) | CN101849840B (en) |
Cited By (1)
| Publication number | Priority date | Publication date | Assignee | Title |
|---|---|---|---|---|
| WO2017068892A1 (en)* | 2015-10-22 | 2017-04-27 | 株式会社日立製作所 | Ultrasound diagnostic device and attenuation characteristic measurement method |
Families Citing this family (28)
| Publication number | Priority date | Publication date | Assignee | Title |
|---|---|---|---|---|
| US9939413B2 (en) | 2008-01-09 | 2018-04-10 | Surf Technology As | Measurement and imaging of scatterers with memory of scatterer parameters using at least two-frequency elastic wave pulse complexes |
| US20090178483A1 (en)* | 2008-01-09 | 2009-07-16 | Angelsen Bjorn A J | Nonlinear Elastic Imaging With Two-Frequency Elastic Pulse Complexes |
| US20140288427A1 (en)* | 2009-04-03 | 2014-09-25 | James K. Wall | Devices and methods for tissue navigation |
| EP2599440B1 (en)* | 2010-11-11 | 2018-08-22 | Olympus Corporation | Ultrasonic observation device, method for operating ultrasonic observation device, and operation program for ultrasonic observation device |
| CN102802536B (en)* | 2010-11-11 | 2015-01-07 | 奥林巴斯医疗株式会社 | Ultrasonic diagnostic device, method of operating the ultrasonic diagnostic device, and operating program of the ultrasonic diagnostic device |
| US20120136248A1 (en)* | 2010-11-25 | 2012-05-31 | Toshiba Medical Systems Corporation | Ultrasound diagnosis apparatus, image generating method, and image processing apparatus |
| JP5747377B2 (en)* | 2011-02-17 | 2015-07-15 | 国立大学法人 千葉大学 | Ultrasonic diagnostic apparatus and ultrasonic diagnostic program |
| JP5823175B2 (en)* | 2011-06-06 | 2015-11-25 | 株式会社東芝 | Ultrasonic diagnostic apparatus, medical image processing apparatus, and medical image processing program |
| JP5925438B2 (en) | 2011-06-23 | 2016-05-25 | 株式会社東芝 | Ultrasonic diagnostic equipment |
| US9244169B2 (en)* | 2012-06-25 | 2016-01-26 | Siemens Medical Solutions Usa, Inc. | Measuring acoustic absorption or attenuation of ultrasound |
| CN102895001B (en)* | 2012-09-21 | 2014-07-23 | 飞依诺科技(苏州)有限公司 | Ultrasonic color blood flow imaging dynamic range compression processing method and system |
| EP2818117A1 (en)* | 2013-06-26 | 2014-12-31 | Canon Kabushiki Kaisha | Object information obtaining system, signal processing method, and program |
| CN103932735A (en)* | 2014-01-21 | 2014-07-23 | 深圳市一体医疗科技有限公司 | Ultrasound attenuation coefficient compensating system and liver fat detecting system based on ultrasound |
| JP6646926B2 (en)* | 2014-10-20 | 2020-02-14 | ジーイー・メディカル・システムズ・グローバル・テクノロジー・カンパニー・エルエルシー | Ultrasound diagnostic apparatus and program |
| JP6635766B2 (en) | 2015-11-26 | 2020-01-29 | キヤノンメディカルシステムズ株式会社 | Ultrasound diagnostic apparatus, signal processing apparatus, and analysis program |
| JP6734079B2 (en) | 2016-03-11 | 2020-08-05 | キヤノンメディカルシステムズ株式会社 | Medical diagnostic device and medical analysis program |
| FR3054123B1 (en)* | 2016-07-25 | 2021-11-26 | Echosens | METHOD OF MEASURING A VISCOELASTIC PARAMETER OF A HUMAN OR ANIMAL ORGAN |
| CN110785126B (en)* | 2017-06-23 | 2022-09-27 | 梅约医学教育与研究基金会 | Method for Independent Attenuation Coefficient Estimation of Ultrasound Systems |
| JP6855347B2 (en)* | 2017-07-27 | 2021-04-07 | ゼネラル・エレクトリック・カンパニイ | Ultrasonic diagnostic equipment and its control program |
| EP3729133B1 (en)* | 2018-01-25 | 2025-02-19 | Surf Technology AS | Methods and instrumentation for estimation of wave propagation and scattering parameters |
| JP7059503B2 (en)* | 2018-03-29 | 2022-04-26 | つくばテクノロジー株式会社 | Image processing method for ultrasonic propagation video |
| US11275006B2 (en) | 2018-12-17 | 2022-03-15 | Surf Technology As | Ultrasound estimation of nonlinear bulk elasticity of materials |
| US11885917B2 (en) | 2019-01-25 | 2024-01-30 | Surf Technology As | Methods and instrumentation for estimation of wave propagation and scattering parameters |
| EP3999871A1 (en) | 2019-07-19 | 2022-05-25 | Mayo Foundation for Medical Education and Research | Systems and methods for ultrasound attenuation coefficient estimation |
| EP3769690B1 (en) | 2019-07-25 | 2023-01-04 | Esaote S.p.A. | Method for tissue characterization by ultrasound wave attenuation measurements and ultrasound system for tissue characterization |
| US11937975B2 (en)* | 2019-09-30 | 2024-03-26 | Biosense Webster (Israel) Ltd. | Multi-frequency mapping catheter and method of mapping |
| CN112998750B (en)* | 2021-02-22 | 2021-09-14 | 深圳华声医疗技术股份有限公司 | Ultrasonic image synthesis method and device, ultrasonic equipment and storage medium |
| KR20230099334A (en)* | 2021-12-27 | 2023-07-04 | 현대모비스 주식회사 | Dual band ultrasonic sensing apparatus for vehicle and control method thereof |
Family Cites Families (20)
| Publication number | Priority date | Publication date | Assignee | Title |
|---|---|---|---|---|
| JPS59218144A (en)* | 1983-05-26 | 1984-12-08 | 株式会社東芝 | Ultrasonic diagnostic apparatus |
| JPS6031740A (en)* | 1983-07-30 | 1985-02-18 | アロカ株式会社 | Ultrasonic diagnostic apparatus |
| JPS60176629A (en)* | 1984-02-23 | 1985-09-10 | テルモ株式会社 | Ultrasonic measuring method and apparatus |
| JPS63130054A (en)* | 1986-11-19 | 1988-06-02 | アロカ株式会社 | Ultrasonic diagnostic apparatus |
| IL96842A0 (en)* | 1990-12-31 | 1991-09-16 | Ibm Israel | Image processing system for producing an attenuation map of a scanned image |
| JPH10146338A (en)* | 1996-11-19 | 1998-06-02 | Toshiba Iyou Syst Eng Kk | Ultrasound diagnostic equipment |
| JP3432204B2 (en)* | 2000-02-17 | 2003-08-04 | アロカ株式会社 | Ultrasound diagnostic equipment |
| JP4723747B2 (en)* | 2001-04-09 | 2011-07-13 | 株式会社東芝 | Ultrasonic diagnostic equipment |
| JP3908555B2 (en)* | 2002-02-08 | 2007-04-25 | 株式会社東芝 | Ultrasonic diagnostic equipment |
| US6796944B2 (en)* | 2002-05-17 | 2004-09-28 | Ge Medical Systems Global Technology, Llc | Display for subtraction imaging techniques |
| US6783496B2 (en)* | 2002-11-01 | 2004-08-31 | Ge Medical Systems Global Technology Company, Llc | Method and apparatus for improving contrast-to-tissue ratio in ultrasound contrast imaging with subharmonic imaging |
| US7481769B2 (en)* | 2003-09-30 | 2009-01-27 | Fujifilm Corporation | Ultrasonic diagnosing apparatus |
| JP4603323B2 (en)* | 2003-09-30 | 2010-12-22 | 富士フイルム株式会社 | Ultrasonic diagnostic equipment |
| JP2005253827A (en)* | 2004-03-15 | 2005-09-22 | Fuji Photo Film Co Ltd | Ultrasonic imaging method and equipment |
| US7289390B2 (en)* | 2004-07-19 | 2007-10-30 | Furuno Electric Company, Limited | Ultrasonic transmitting/receiving apparatus and scanning sonar employing same |
| US8403852B2 (en)* | 2004-10-20 | 2013-03-26 | Kabushiki Kaisha Toshiba | Ultrasonic diagnostic apparatus and control method thereof |
| US9782146B2 (en)* | 2005-11-25 | 2017-10-10 | Toshiba Medical Systems Corporation | Ultrasonic diagnostic scanner and method for processing ultrasonic signal |
| CN101006932B (en)* | 2006-01-26 | 2010-04-21 | 株式会社东芝 | Ultrasonic diagnostic device and ultrasonic diagnostic method |
| US20090178483A1 (en)* | 2008-01-09 | 2009-07-16 | Angelsen Bjorn A J | Nonlinear Elastic Imaging With Two-Frequency Elastic Pulse Complexes |
| JP2010051553A (en)* | 2008-08-28 | 2010-03-11 | Konica Minolta Medical & Graphic Inc | Ultrasonic diagnostic system and method |
- 2009
- 2009-03-31JPJP2009085883Apatent/JP5349115B2/ennot_activeExpired - Fee Related
- 2010
- 2010-03-30USUS12/749,918patent/US20100249590A1/ennot_activeAbandoned
- 2010-03-31CNCN2010101581174Apatent/CN101849840B/ennot_activeExpired - Fee Related
Cited By (2)
| Publication number | Priority date | Publication date | Assignee | Title |
|---|---|---|---|---|
| WO2017068892A1 (en)* | 2015-10-22 | 2017-04-27 | 株式会社日立製作所 | Ultrasound diagnostic device and attenuation characteristic measurement method |
| JPWO2017068892A1 (en)* | 2015-10-22 | 2018-07-26 | 株式会社日立製作所 | Ultrasonic diagnostic apparatus and attenuation characteristic measuring method |
Also Published As
| Publication number | Publication date |
|---|---|
| CN101849840A (en) | 2010-10-06 |
| US20100249590A1 (en) | 2010-09-30 |
| CN101849840B (en) | 2013-03-13 |
| JP2010233859A (en) | 2010-10-21 |
Similar Documents
| Publication | Publication Date | Title |
|---|---|---|
| JP5349115B2 (en) | Ultrasonic diagnostic apparatus and control program therefor | |
| US11801033B2 (en) | Medical diagnostic apparatus and medical analysis method | |
| JP5925438B2 (en) | Ultrasonic diagnostic equipment | |
| US20230380797A1 (en) | Ultrasound diagnosis apparatus and controlling method | |
| US11123044B2 (en) | Signal processing device, ultrasonic diagnostic apparatus, and method | |
| JP6218400B2 (en) | Ultrasonic diagnostic apparatus and control program for ultrasonic diagnostic apparatus | |
| US10575826B2 (en) | Ultrasound diagnostic apparatus and ultrasound imaging method | |
| JP2014100556A (en) | Ultrasonic diagnostic apparatus and ultrasonic diagnostic apparatus control method | |
| JP5509038B2 (en) | Ultrasonic diagnostic apparatus, ultrasonic image processing apparatus, and ultrasonic image processing program | |
| JP7330705B2 (en) | Image analysis device | |
| CN101467893B (en) | Ultrasonic diagnostic apparatus, ultrasonic image processing apparatus, and ultrasonic image processing method | |
| JP2004298620A (en) | Ultrasonic diagnostic apparatus and ultrasonic image generating method | |
| US20150018677A1 (en) | Ultrasound diagnosis apparatus and control method | |
| JP2009153919A (en) | Ultrasonic diagnostic apparatus, ultrasonic image processing apparatus, and ultrasonic image processing program | |
| JP7490387B2 (en) | Ultrasound diagnostic equipment | |
| JP2019141586A (en) | Analysis apparatus and analysis method | |
| JP6258286B2 (en) | Ultrasonic diagnostic apparatus, image processing apparatus, and control program | |
| JP5773642B2 (en) | Ultrasonic diagnostic apparatus, medical image processing method, and medical image processing program | |
| JP6887767B2 (en) | Analytical equipment, ultrasonic diagnostic equipment and analysis program | |
| JP2011024889A (en) | Ultrasonic diagnosis device, ultrasonic image processor and ultrasonic image processing program | |
| JP2010094288A (en) | Ultrasonic diagnostic apparatus and control program therefor |
Legal Events
| Date | Code | Title | Description |
|---|---|---|---|
| A621 | Written request for application examination | Free format text:JAPANESE INTERMEDIATE CODE: A621 Effective date:20120323 | |
| A977 | Report on retrieval | Free format text:JAPANESE INTERMEDIATE CODE: A971007 Effective date:20130627 | |
| TRDD | Decision of grant or rejection written | ||
| A01 | Written decision to grant a patent or to grant a registration (utility model) | Free format text:JAPANESE INTERMEDIATE CODE: A01 Effective date:20130723 | |
| A61 | First payment of annual fees (during grant procedure) | Free format text:JAPANESE INTERMEDIATE CODE: A61 Effective date:20130820 | |
| R150 | Certificate of patent or registration of utility model | Free format text:JAPANESE INTERMEDIATE CODE: R150 | |
| S111 | Request for change of ownership or part of ownership | Free format text:JAPANESE INTERMEDIATE CODE: R313117 | |
| R350 | Written notification of registration of transfer | Free format text:JAPANESE INTERMEDIATE CODE: R350 | |
| LAPS | Cancellation because of no payment of annual fees |