JP5216051B2 - Automatic analyzer and automatic analysis method - Google Patents
Automatic analyzer and automatic analysis methodDownload PDFInfo
- Publication number
- JP5216051B2 JP5216051B2JP2010142259AJP2010142259AJP5216051B2JP 5216051 B2JP5216051 B2JP 5216051B2JP 2010142259 AJP2010142259 AJP 2010142259AJP 2010142259 AJP2010142259 AJP 2010142259AJP 5216051 B2JP5216051 B2JP 5216051B2
- Authority
- JP
- Japan
- Prior art keywords
- detection element
- detection
- calculated
- measurement signals
- approximate expression
- Prior art date
- Legal status (The legal status is an assumption and is not a legal conclusion. Google has not performed a legal analysis and makes no representation as to the accuracy of the status listed.)
- Active
Links
Images


Classifications
- G—PHYSICS
- G01—MEASURING; TESTING
- G01N—INVESTIGATING OR ANALYSING MATERIALS BY DETERMINING THEIR CHEMICAL OR PHYSICAL PROPERTIES
- G01N21/00—Investigating or analysing materials by the use of optical means, i.e. using sub-millimetre waves, infrared, visible or ultraviolet light
- G01N21/17—Systems in which incident light is modified in accordance with the properties of the material investigated
- G01N21/47—Scattering, i.e. diffuse reflection
- G01N21/49—Scattering, i.e. diffuse reflection within a body or fluid
- G01N21/51—Scattering, i.e. diffuse reflection within a body or fluid inside a container, e.g. in an ampoule
- G—PHYSICS
- G01—MEASURING; TESTING
- G01N—INVESTIGATING OR ANALYSING MATERIALS BY DETERMINING THEIR CHEMICAL OR PHYSICAL PROPERTIES
- G01N15/00—Investigating characteristics of particles; Investigating permeability, pore-volume or surface-area of porous materials
- G01N15/02—Investigating particle size or size distribution
- G01N15/0205—Investigating particle size or size distribution by optical means
- G01N15/0211—Investigating a scatter or diffraction pattern
- G—PHYSICS
- G01—MEASURING; TESTING
- G01N—INVESTIGATING OR ANALYSING MATERIALS BY DETERMINING THEIR CHEMICAL OR PHYSICAL PROPERTIES
- G01N35/00—Automatic analysis not limited to methods or materials provided for in any single one of groups G01N1/00 - G01N33/00; Handling materials therefor
- G01N35/02—Automatic analysis not limited to methods or materials provided for in any single one of groups G01N1/00 - G01N33/00; Handling materials therefor using a plurality of sample containers moved by a conveyor system past one or more treatment or analysis stations
- G01N35/025—Automatic analysis not limited to methods or materials provided for in any single one of groups G01N1/00 - G01N33/00; Handling materials therefor using a plurality of sample containers moved by a conveyor system past one or more treatment or analysis stations having a carousel or turntable for reaction cells or cuvettes
- G—PHYSICS
- G06—COMPUTING OR CALCULATING; COUNTING
- G06F—ELECTRIC DIGITAL DATA PROCESSING
- G06F17/00—Digital computing or data processing equipment or methods, specially adapted for specific functions
Landscapes
- Chemical & Material Sciences (AREA)
- Physics & Mathematics (AREA)
- General Physics & Mathematics (AREA)
- Pathology (AREA)
- Analytical Chemistry (AREA)
- Biochemistry (AREA)
- General Health & Medical Sciences (AREA)
- Health & Medical Sciences (AREA)
- Immunology (AREA)
- Life Sciences & Earth Sciences (AREA)
- Engineering & Computer Science (AREA)
- Theoretical Computer Science (AREA)
- Dispersion Chemistry (AREA)
- Chemical Kinetics & Catalysis (AREA)
- Data Mining & Analysis (AREA)
- Software Systems (AREA)
- General Engineering & Computer Science (AREA)
- Mathematical Physics (AREA)
- Databases & Information Systems (AREA)
- Automatic Analysis And Handling Materials Therefor (AREA)
- Investigating Or Analysing Materials By Optical Means (AREA)
Description
Translated fromJapanese本発明は、測定対象に光を照射して測定対象にて散乱する光を測定する自動分析装置に関する。 The present invention relates to an automatic analyzer that measures light scattered on a measurement object by irradiating the measurement object with light.
サンプルに含まれる成分量を分析する分析装置として、光源からの光を、サンプル、又はサンプルと試薬とが混合した反応液に照射して得られる単一又は複数の波長の透過光量を測定し吸光度を算出して、Lambert-Beerの法則に従い、吸光度と濃度の関係から成分量を割り出す自動分析装置が広く用いられている。 As an analyzer that analyzes the amount of components contained in a sample, it measures the amount of light transmitted through a single or multiple wavelengths obtained by irradiating light from a light source to a sample or a reaction mixture in which a sample and a reagent are mixed. An automatic analyzer that calculates the component amount from the relationship between absorbance and concentration according to Lambert-Beer's law is widely used.
これらの自動分析装置においては、回転と停止を繰り返すセルディスクに、反応液を保持する多数のセルが円周状に並べられ、セルディスク回転中に、予め配置された透過光測定部により、一定の時間間隔で吸光度の経時変化が測定される。 In these automatic analyzers, a large number of cells holding the reaction solution are arranged in a circle on a cell disk that repeatedly rotates and stops, and the cell light is rotated by the transmitted light measurement unit arranged in advance. The change in absorbance over time is measured at the time interval.
自動分析装置は透過光量を測定するシステムを備える一方、反応液の反応には、基質と酵素との呈色反応と、抗原と抗体との凝集反応の大きく2種類の反応が用いられている。前者は生化学分析であり、検査項目としてLDH(乳酸脱水素酵素)、ALP(アルカリホスファターゼ)、AST(アスパラギン酸オキソグルタル酸アミノトンラフェナーゼ)などがある。 While the automatic analyzer includes a system for measuring the amount of transmitted light, two types of reactions are used for reaction of the reaction solution: a color reaction between the substrate and the enzyme and an agglutination reaction between the antigen and the antibody. The former is biochemical analysis, and test items include LDH (lactate dehydrogenase), ALP (alkaline phosphatase), and AST (aspartate oxoglutarate aminoton rafenase).
後者は免疫分析であり、検査項目としてCRP(C反応性蛋白)、IgG(免疫グロブリン)、RF(リウマトイド因子)などがある。後者の免疫分析で測定される測定物質は血中濃度が低く高感度が要求される。これまでも、ラテックス粒子の表面に抗体を感作(結合)させた試薬を用い、サンプル中に含まれる成分を認識し凝集させる際に、反応液に光を投光し、ラテックス凝集塊に散乱されずに透過した光量を測定することでサンプル中に含まれる成分量を定量するラテックス免疫凝集法での高感度化が図られてきた。 The latter is an immunoassay, and test items include CRP (C-reactive protein), IgG (immunoglobulin), RF (rheumatoid factor) and the like. The measurement substance measured by the latter immunoassay is required to have low blood concentration and high sensitivity. Until now, when using reagents that have sensitized (bound) antibodies on the surface of latex particles and recognizing and aggregating components contained in the sample, the reaction solution is irradiated with light and scattered into latex agglomerates. Higher sensitivity has been achieved with the latex immunoaggregation method in which the amount of components contained in a sample is quantified by measuring the amount of light transmitted without being transmitted.
さらに装置としては、透過光量を測定するのではなく、散乱光量を測定することによる高感度化も試みられている。例えば、ダイアフラムを用いて透過光と散乱光とを分離し、吸光度と散乱光を同時に測定するシステム(特許文献1参照)や、凝集反応が進んだ結果形成される大きな凝集塊での反射散乱光計測による高濃度側での精度を高める構成(特許文献2参照)、反応容器前後に積分球を用いて前方散乱光と後方散乱光のそれぞれの平均光量を測定し、セル位置ずれによる濁度変化を補正する方法(特許文献3参照)等が開示されている。 Further, as an apparatus, an attempt has been made to increase the sensitivity by measuring the amount of scattered light instead of measuring the amount of transmitted light. For example, a system that separates transmitted light and scattered light using a diaphragm and simultaneously measures absorbance and scattered light (see Patent Document 1), and reflected scattered light in a large aggregate formed as a result of agglutination. Configuration to improve accuracy on the high concentration side by measurement (see Patent Document 2), measure the average light quantity of forward scattered light and back scattered light using integrating spheres before and after the reaction vessel, and change turbidity due to cell position shift A method of correcting the above (see Patent Document 3) and the like are disclosed.
ところで、散乱光を用いた自動分析装置の場合、測定対象物によって起こる光の散乱と同様に、気泡や異物が測定光路中に存在した場合や反応容器に付いた傷等も散乱光成分として現れ、ノイズ成分として測定値に影響を与える。 By the way, in the case of an automatic analyzer using scattered light, as in the case of light scattering caused by an object to be measured, when bubbles or foreign substances are present in the measurement optical path, scratches on the reaction container, etc. appear as scattered light components. The measured value is affected as a noise component.
また、ラテックス粒子反応を用いた反応では、粒子固有のブラウン運動、あるいは溶液の対流等、溶液中の粒子が介在することによって、散乱光が揺らぎ、同様にノイズ成分として測定値に影響を与えてしまう。 In addition, in the reaction using latex particle reaction, the scattered light fluctuates due to the presence of particles in the solution, such as the inherent Brownian motion of the particle or the convection of the solution, and similarly affects the measured value as a noise component. End up.
ノイズの影響を低減するため、検出器からの出力を一定時間積分することによりS/N比特性を改善する方法があるが、積分時間は測定対象の時間的変化により制約があるだけでなく、反応容器内に気泡などの異物が偶発的に付着した場合はS/N比特性の改善効果を望めない。 In order to reduce the influence of noise, there is a method of improving the S / N ratio characteristics by integrating the output from the detector for a certain period of time, but the integration time is not only limited by the temporal change of the measurement target, If foreign matter such as bubbles accidentally adheres in the reaction vessel, the effect of improving the S / N ratio characteristic cannot be expected.
気泡や異物、反応容器の傷による散乱光や、粒子ゆらぎによって起こる散乱光と、測定対象物の反応によって起こる散乱光とを分離する場合、気泡等による散乱光は、偶発的あるいはランダムに発生するため、これらによる散乱光を事前に予測することや、事象が発生した後に成分を切り分けることは困難である。 When separating scattered light caused by bubbles, foreign objects, scratches on the reaction vessel, or scattered light caused by particle fluctuations, and scattered light caused by the reaction of the measurement object, scattered light caused by bubbles or the like is generated accidentally or randomly. Therefore, it is difficult to predict in advance the scattered light due to these, and to separate components after an event occurs.
本発明の目的は、散乱光を用いる自動分析装置において、測定対象物以外のノイズ成分の散乱光の影響を低減し、受光信号のS/N比特性を改善可能な自動分析装置及び方法を実現することである。 An object of the present invention is to realize an automatic analyzer and method capable of improving the S / N ratio characteristics of a received light signal by reducing the influence of scattered light of noise components other than the measurement target in an automatic analyzer using scattered light. It is to be.
上記目的を達成するために、本発明は以下のように構成される。 In order to achieve the above object, the present invention is configured as follows.
反応容器を通過した光を、光源に対し異なる角度で設置された複数の光検出素子により検出し、複数の検出素子のうちの選択した一つの検出素子の検出信号に基づいて基準データを算出し、算出した基準データに対する上記選択した一つの検出素子の検出信号の変動率を算出し、算出した変動率に基づいて、上記選択した一つの検出素子とは異なる検出素子の検出信号を補正し、補正した検出信号に基づいて、上記試料を分析する。 Light that has passed through the reaction vessel is detected by a plurality of light detection elements installed at different angles with respect to the light source, and reference data is calculated based on detection signals of one detection element selected from the plurality of detection elements. Calculating a variation rate of the detection signal of the selected one detection element with respect to the calculated reference data, and correcting a detection signal of the detection element different from the selected one detection device based on the calculated variation rate, The sample is analyzed based on the corrected detection signal.
散乱光を用いる自動分析装置において、測定対象物以外のノイズ成分の散乱光の影響を低減し、受光信号のS/N比特性を改善可能な自動分析装置及び方法を実現することができる。 In the automatic analyzer using scattered light, it is possible to realize an automatic analyzer and method capable of reducing the influence of scattered light of noise components other than the measurement object and improving the S / N ratio characteristics of the received light signal.
以下、本発明の実施例について添付図面を参照して説明する。 Embodiments of the present invention will be described below with reference to the accompanying drawings.
最初に、図1を用いて、本発明の一実施例が適用される自動分析装置の全体構成について説明する。図1は、本発明の一実施形態による自動分析装置の全体概略構成図である。 First, the overall configuration of an automatic analyzer to which an embodiment of the present invention is applied will be described with reference to FIG. FIG. 1 is an overall schematic configuration diagram of an automatic analyzer according to an embodiment of the present invention.
図1において、間欠回転可能な反応ディスク1には、透光性材料からなる多数の反応容器2が円周状に配列されている。反応ディスク1上の反応容器2は、恒温槽3によって所定の温度(例えば37°C)に維持される。恒温槽3内には流体が収容され、この流体は恒温維持装置4により温度調整される。 In FIG. 1, a
サンプルディスク5上には、血液又は尿のような生体サンプルを収容した多数の検体容器6が配置される。可動アーム7に取り付けられたピペットノズル8は、サンプルディスク5の吸入位置に位置した検体容器6から所定量のサンプルを吸入し、吸入したサンプルを反応ディスク1上の吐出位置にある反応容器2内に吐出する。 On the
試薬保冷庫9A、9B内にそれぞれ配置されている試薬ディスク上には、バーコードのような試薬識別情報を表示したラベルが貼られた複数の試薬ボトル10A、10B が配置される。これらの試薬ボトル10A、10Bには、自動分析装置によって分析され得る分析項目に対応する試薬液が収容されている。 A plurality of
各試薬保冷庫9A、9Bに付属されたバーコード読み取り装置34A、34Bは、試薬登録時に、各試薬ボトル10A、10Bの外壁に表示されているバーコードを読み取る。バーコード読み取り装置34A、34Bにより読み取られた試薬情報は、試薬ディスク上のポジションと共に後述するメモリ11に登録される。 The barcode readers 34A and 34B attached to the
各試薬分注機構12A、12Bにおける試薬用ピペットノズルは、反応ディスク1上の試薬受け入れ位置に位置付けられる検査項目に応じた試薬ボトル10A、10Bから試薬液を吸入し、該当する反応容器2内へ吐出する。 The reagent pipette nozzle in each
反応容器2内に収容されたサンプルと試薬の混合物は、撹拌機構13A、13Bにより撹拌される。反応容器2の列は、光源14と散乱光度計15とによって挟まれた測光位置を通るように回転移動される。散乱光度計15は、光軸上に多波長吸光光度計を備えても良く、散乱光と透過光との両方を使って濃度演算を行っても良い。なお、散乱光度計15内の検出器の配置については図2を使って後述する。 The mixture of the sample and the reagent accommodated in the reaction vessel 2 is stirred by the stirring mechanisms 13A and 13B. The rows of reaction vessels 2 are rotationally moved so as to pass through a photometric position sandwiched between the light source 14 and the
各反応容器2内におけるサンプルと試薬との反応液は、反応ディスク1の回転動作中に検出器15の前を横切る度に測光される。サンプル毎に測定されたアナログ信号は、A/D変換器16に入力される。反応ディスク1の近傍に配置されている反応容器洗浄機構17は、使用済みの反応容器2の内部を洗浄することにより、反応容器の繰り返しの使用を可能にする。 The reaction liquid of the sample and the reagent in each reaction vessel 2 is measured each time it crosses in front of the
次に、図1の自動分析装置における制御系及び信号処理系について簡単に説明する。コンピュータ(演算処理部)18は、インターフェース19を介して、サンプル分注制御部20、試薬分注制御部21、A/D変換器16に接続されている。コンピュータ18は、サンプル分注制御部20に対して指令を送り、サンプルの分注動作を制御する。また、コンピュータ18は、試薬分注制御部21に対して指令を送り、試薬の分注動作を制御する。 Next, a control system and a signal processing system in the automatic analyzer of FIG. 1 will be briefly described. A computer (arithmetic processing unit) 18 is connected to a sample
検出器15から供給され、A/D変換器16によってディジタル信号に変換された測光値は、コンピュータ18に取り込まれる。 The photometric value supplied from the
インターフェース19には、分析結果等を印字するためのプリンタ22、記憶装置であるメモリ11やFD等の外部出力メディア23、操作指令等を入力するためのキーボード24、画面表示するためのCRTディスプレイ25が接続されている。画面表示装置としては、CRTディスプレイの他に液晶ディスプレイなどを採用できる。メモリ11は、例えばハードディスクメモリ又は外部メモリにより構成される。メモリ11には、各操作者のパスワード、各画面の表示レベル、分析パラメータ、分析項目依頼内容、キャリブレーション結果、分析結果等の情報が記憶される。 The
次に、図1に示した自動分析装置におけるサンプルの分析動作を説明する。 Next, a sample analysis operation in the automatic analyzer shown in FIG. 1 will be described.
自動分析装置によって分析可能な項目に関する分析パラメータは、予めキーボード24のような情報入力装置を介して入力されておリ、メモリ11に記憶されている。操作者は、後述する操作機能画面を用いて各サンプルに依頼されている検査項目を選択する。 Analysis parameters relating to items that can be analyzed by the automatic analyzer are previously input via an information input device such as the keyboard 24 and stored in the memory 11. The operator selects an inspection item requested for each sample using an operation function screen described later.
この際に、患者IDなどの情報もキーボード24から入力される。各サンプルに対して指示された検査項目を分析するために、ピペットノズル8は、分析パラメータにしたがって、検体容器6から反応容器2へ所定量のサンプルを分注する。 At this time, information such as a patient ID is also input from the keyboard 24. In order to analyze the inspection item designated for each sample, the pipette nozzle 8 dispenses a predetermined amount of sample from the specimen container 6 to the reaction container 2 in accordance with the analysis parameters.
サンプルを受け入れた反応容器2は、反応ディスク1の回転によって移送され、試薬受け入れ位置に停止する。試薬分注機構12A、12Bのピペットノズル8は、該当する検査項目の分析パラメータにしたがって、反応容器2に所定量の試薬液を分注する。サンプルと試薬の分注順序は、この例とは逆に、サンプルより試薬が先であってもよい。 The reaction container 2 that has received the sample is transferred by the rotation of the
その後、撹拌機構13A、13Bにより、サンプルと試薬との撹拌が行われ、混合される。この反応容器2が、測光位置を横切る時、散乱光度計15により反応液の散乱光が測光される。測光された散乱光は、A/D変換器16により光量に比例した数値に変換され、インターフェース19を経由して、コンピュータ18に取り込まれる。この変換された数値を用い、検査項目毎に指定された分析法により予め測定しておいた検量線に基づき、濃度データに変換される。各検査項目の分析結果としての成分濃度データは、プリンタ22やCRT25の画面に出力される。 Thereafter, the sample and the reagent are stirred and mixed by the stirring mechanisms 13A and 13B. When the reaction vessel 2 crosses the photometric position, the scattered light of the reaction solution is measured by the scattering
以上の測定動作が実行される前に、操作者は、分析測定に必要な種々のパラメータの設定や試料の登録を、CRT25の操作画面を介して行う。また、操作者は、測定後の分析結果をCRT25上の操作画面により確認する。 Before the above measurement operation is executed, the operator sets various parameters necessary for analytical measurement and registers a sample via the operation screen of the
次に、図2を用いて図1中の光源14および散乱光度計15の構成の詳細を説明する。 Next, details of the configuration of the light source 14 and the
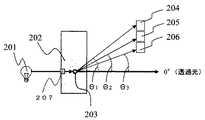
図2は光源14(201)/反応容器2(202)/散乱光度計15(204、205、206)の説明図である。 FIG. 2 is an explanatory diagram of the light source 14 (201) / reaction vessel 2 (202) / scattering photometer 15 (204, 205, 206).
図2において、光源201から発せられた光は、測定対象物203が分注された反応容器202に入射される。反応容器202内で入射した光は測定対象物203に衝突し散乱される。散乱した光は、図2の例では、透過光とθ1の角度をなす位置に検出器(検出素子)204が配置され、透過光とθ2の角度をなす位置に検出器(検出素子)205が配置される。また、透過光とθ3の角度をなす位置に検出器(検出素子)206が配置されている。 In FIG. 2, the light emitted from the
検出器204〜206は、光源201からの入射光に対して、Z軸方向(図2の上下方向)に沿って直列に配しているが、X軸方向(図2の左右方法)、Y軸方向(図2の紙面表側から裏側に向かう方向)に配置しても良い。 The
また、直線上に配置された複数の光検出素子からなる一つの検出器とすることもできる。 Moreover, it can also be set as one detector which consists of several photon detection element arrange | positioned on a straight line.
さらに、検出器204〜206は、離散的に配置する必要は無く、2次元的な位置情報を分解することが可能な一つの検出器301(図3に示す)であっても良い。ここで、検出器301は複数の検出素子を有し、光源に対して異なる角度で設置された2次元的な配置構成とすることができる。この場合、互いに直交する2つの直線上に2次元的に複数の検出素子を配列してもよい。 Furthermore, the
反応容器202から検出器204〜206までの途中経路に気泡や傷207があった場合には、検出器204〜206で受光する光は影響を受けることとなる。 If there are bubbles or
次に、図4は検出器204〜206で受光した判定信号の試料と試薬との反応過程における変化の1例を示すグラフである。図4において、縦軸は、光量に比例して増大する測定信号値を示し、横軸は測定点(測定回数)を示している。反応過程は、反応容器202が、反応ディスク1の円周上に配置され、検出器204〜206の前を一定時間毎に通過し、測定開始から終了までの反応の進み具合を経時的に複数回プロットしたものである。 Next, FIG. 4 is a graph showing an example of a change in the reaction process of the determination signal received by the
図4の(a)は、検出器204の信号変化の過程を示し、図4の(b)は検出器205の信号変化の過程を示している。散乱光量は、透過光からの角度によって異なるため、受光する検出器によって光量も変化するが、図2に示した例では、角度θ1に配置された検出器204の測定信号値である光量が、角度θ2に配置された検出器205の測定信号値である光量より小さくなっている。 4A shows the process of signal change of the
また、測定開始から終了までの反応に関して、単純な直線、あるいは曲線では近似できない程度のノイズ成分が重なっている。前述したように、これらのノイズ成分は、測定光路中に存在する異物や気泡によって偶発的に発生することや、粒子固有のブラウン運動、溶液の対流が影響していることが、これまで発明者らが検証を重ねてきた結果、明らかになってきた。 In addition, regarding the reaction from the start to the end of measurement, noise components that cannot be approximated by simple straight lines or curves overlap. As described above, the inventor has hitherto confirmed that these noise components are accidentally generated by foreign matters and bubbles present in the measurement optical path, and are influenced by the inherent Brownian motion and convection of the solution. As a result of their repeated verification, it became clear.
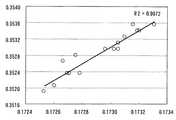
図5は、検出器204の受光信号と検出器205の受光信号との間の相関を示すグラフである。図5に示した例では、検出器204と205との信号の回帰曲線として1次の回帰曲線(直線)を最小二乗法で算出している。 FIG. 5 is a graph showing the correlation between the light reception signal of the
図5に示した回帰曲線(直線)から、両者の信号は非常によい相関を持っており、両者の信号を用いて演算処理することによって、効果的にノイズ低減が図れることが明らかとなった。 From the regression curve (straight line) shown in FIG. 5, it is clear that both signals have a very good correlation, and that noise reduction can be effectively achieved by performing arithmetic processing using both signals. .
次に、図6、図7、図8を参照して、複数の検出器で受光した信号成分を用いてノイズを除去するアルゴリズムについて説明する。図6は動作フローチャートであり、図7は、アルゴリズムを用いて補正したデータを示すグラフ、図8は、アルゴリズムを実行するためのコンピュータ18の内部機能ブロック図である。 Next, an algorithm for removing noise using signal components received by a plurality of detectors will be described with reference to FIG. 6, FIG. 7, and FIG. 6 is an operation flowchart, FIG. 7 is a graph showing data corrected using an algorithm, and FIG. 8 is an internal functional block diagram of a computer 18 for executing the algorithm.
まず、複数の検出器204〜206で複数の角度でデータを取得する(図6のステップ(b))。そして、検出データ選択部18aにより、その中の一つの検出器によって取得した測定信号を基準信号として選択する(図6のステップ(c)、(d))。 First, data is acquired at a plurality of angles by a plurality of
次に、第1選択データ処理部18bの近似式選択部18b1において、適用する近似式を選択し、選択した近似式を用いて近似式計算部18b2により近似式が計算される(図6のステップ(e))。この近似式により、基準信号に対して仮想のベースラインが導かれる。この仮想のベースラインは多項式近似によって実施する。なお、本発明の一実施例では、検出器204(角度θ1)の測定信号を基準信号とした例を示す。また、本発明の一実施例では、反応の時間経過に伴い、16回の測定を実施している。 Next, the approximate expression selection unit 18b1 of the first selection
近似式の計算は、図4の(a)中の、測定ポイント第1の点及び第2の点の平均値を導き、さらに第15の点及び、第16の点の平均値を導く。そして、両値を一次式で結んだ直線を規格化多項式、すなわち仮想のベースラインとする。この仮想のベースラインを、偶発的なノイズや粒子ゆらぎのない理想的な反応曲線(直線)とし、次に、変動率計算部18b3により基準信号の変動率が求められる(図6のステップ(f))。 The calculation of the approximate expression leads to the average value of the first point and the second point of the measurement point in FIG. 4A, and further the average value of the fifteenth point and the sixteenth point. A straight line obtained by connecting the two values with a linear expression is used as a normalized polynomial, that is, a virtual baseline. This virtual baseline is an ideal response curve (straight line) free from accidental noise and particle fluctuations, and then the fluctuation rate of the reference signal is obtained by the fluctuation rate calculator 18b3 (step (f) in FIG. )).
具体的には、各測定点の測定信号値をベースラインの値(基準データ)で除した値を求める。この基準信号の変動率を用いて、濃度計算に用いたい主信号の補正を実施する。本発明の一実施例では検出器205(角度θ2)の測定信号を補正する例を示す。具体的には検出器205(角度θ2)の測定信号は第2選択データ処理部18cにより保持され、データ補正部18dにより、基準信号の変動率で除されることによって行われる(図6のステップ(g))。 Specifically, a value obtained by dividing the measurement signal value at each measurement point by the baseline value (reference data) is obtained. Using the fluctuation rate of the reference signal, the main signal to be used for density calculation is corrected. In one embodiment of the present invention, an example of correcting the measurement signal of the detector 205 (angle θ2) is shown. Specifically, the measurement signal of the detector 205 (angle θ2) is held by the second selection data processing unit 18c, and is divided by the variation rate of the reference signal by the
上述したように、図7は上記アルゴリズムを用いて補正したデータを示す。最後に、この補正した信号データを用いて、濃度演算処理部18eにより濃度演算が行われ(図6のステップ(h))、結果出力部18fにより、CRT25等に結果が出力されて終了する(図6のステップ(i))。 As described above, FIG. 7 shows data corrected using the above algorithm. Finally, density calculation is performed by the density
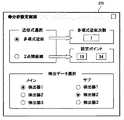
近似式の選択、多項式の近似次数、分析に使用する設定ポイント、ベースラインを設定するための検出器(サブ検出器)及びデータを補正する検出器(メイン検出器)の設定は、CRT25の表示画面(選択手段)を用いて行われる。 Selection of approximate expression, approximate order of polynomial, setting point used for analysis, detector (sub-detector) for setting baseline and detector for correcting data (main detector) are displayed on
図9は、CRT25による分析設定画面の一例を示す図である。図9に示した例においては、近似式選択項目として、多項式近似か、2点間直線近似かのいずれかを選択することができる。また、多項式近似を選択した場合は、近似次数を選択でき、2点間直線近似を選択した場合は、演算する区間である設定ポイントを設定することができる。多項式近似を選択した場合も、演算する区間である設定ポイントを設定することができる。 FIG. 9 is a diagram showing an example of an analysis setting screen by the
なお、規格化多項式、すなわち仮想のベースラインを導くための数式は、上述した例の他、最小二乗法により決定してもよい。 Note that the normalized polynomial, that is, the mathematical formula for deriving the virtual baseline may be determined by the least square method in addition to the above-described example.
また、本発明の一実施例においては、第1点目、第2点目、第15点目、第16点目をそれぞれ用いて規格化多項式を導出したが、この選択は任意に決定することが可能である。ここで注意が必要なのは、多項式近似をする場合、近似式の精度を考慮し、少なくとも5点以上の測定点があることが望ましい。 In one embodiment of the present invention, the normalization polynomial is derived using the first point, the second point, the fifteenth point, and the sixteenth point, but this selection is arbitrarily determined. Is possible. It should be noted here that when performing polynomial approximation, it is desirable that there are at least five measurement points in consideration of the accuracy of the approximate expression.
それぞれのパラメータ設定に関しては、自動分析装置の設定画面上からそれぞれ設定する構成としている。なお分析条件の設定は、装置の設定画面から必ずしも設定する必要は無く、固定の条件であれば予め装置の記憶領域に記憶させた値を使っても良い。 Each parameter is set from the setting screen of the automatic analyzer. Note that the analysis conditions need not be set from the apparatus setting screen. If the conditions are fixed, values stored in advance in the storage area of the apparatus may be used.
また、上述した例においては、3つの検出器204〜206のうちの、検出器204の測定信号を用いてベースラインを算出し、算出したベースラインを用いて、検出器205の測定信号を補正する例であるが、検出器204〜206のうちのいずれの検出器の測定信号をベースライン算出用に用いるか、算出したベースラインを用いていずれの検出器の測定信号を補正するかは、測定項目によって適切な角度の検出器が選択される(複数の検出素子のうちのいずれを近似式算出に使用する検出素子とするか、変動率による補正に使用する検出素子とするかを選択する)。 In the above-described example, the baseline is calculated using the measurement signal of the
以上のように、本発明の一実施例によれば、試料からの散乱光を少なくとも2つの互いに異なる散乱角度で検出し、いずれか一つの散乱光測定信号値を用いて、ベースラインを算出し、算出したベースラインを用いて、ベースライン算出に用いた散乱角度とは異なる散乱角度の散乱側定信号値を補正し、補正した散乱光を用いて、試料の濃度演算を行うように構成したので、散乱光を用いる自動分析装置において、測定対象物以外のノイズ成分の散乱光の影響を低減し、受光信号のS/N比特性を改善可能な自動分析装置及び方法を実現することができる。 As described above, according to one embodiment of the present invention, scattered light from a sample is detected at at least two different scattering angles, and a baseline is calculated using any one scattered light measurement signal value. Using the calculated baseline, the scattering side constant signal value with a scattering angle different from the scattering angle used for the baseline calculation is corrected, and the concentration of the sample is calculated using the corrected scattered light. Therefore, in an automatic analyzer using scattered light, an automatic analyzer and method capable of reducing the influence of scattered light of noise components other than the measurement object and improving the S / N ratio characteristics of the received light signal can be realized. .
1・・・反応ディスク、2・・・反応容器、3・・・恒温槽、4・・・恒温維持装置、5・・・サンプルディスク、6・・・検体容器、7・・・可動アーム、8・・・ピペットノズル、9A、9B・・・試薬保冷庫、11・・・メモリ、12A、12B・・・試薬用ピペットノズル、15・・・フォトダイオード、18・・・コンピュータ、18a・・・検出データ選択部、18b・・・第1選択データ処理部、18b1・・・近似式選択部、18b2・・・近似式計算部、18b3・・・変動率計算部、18c・・・第2選択データ処理部、18d・・・データ補正部、18e・・・濃度演算処理部、18f・・・結果出力部、19・・・インターフェース、25・・・CRT(選択手段)、201・・・光源、202・・・反応容器、203・・・測定対象物、204〜206、301・・・検出器、207・・・気泡や傷 DESCRIPTION OF
Claims (22)
Translated fromJapanese上記検出手段は、光源に対して異なる角度で設置された複数の光検出素子を有し、上記演算処理部は、上記複数の検出素子のうちの選択した一つの検出素子の測定信号に基づいて基準データを算出し、算出した基準データに対する上記選択した一つの検出素子の測定信号の変動率を算出し、算出した変動率に基づいて、上記選択した一つの検出素子とは異なる検出素子の測定信号を補正し、補正した測定信号に基づいて、上記試料を分析することを特徴とする自動分析装置。The light from the light source is irradiated to the reaction container in which the sample is stored, the light that has passed through the reaction container is detected by the light detection means, and the processing unit analyzes the sample in the reaction container based on the detected light In the automatic analyzer
The detection means has a plurality of light detection elements installed at different angles with respect to the light source, and the arithmetic processing unit is based on a measurement signal of one detection element selected from the plurality of detection elements. Calculate reference data, calculate a variation rate of the measurement signal of the selected one detection element with respect to the calculated reference data, and measure a detection element different from the selected one detection device based on the calculated variation rate An automatic analyzer characterized by correcting a signal and analyzing the sample based on the corrected measurement signal.
上記検出素子の複数の測定信号は、検出時刻が互いに異なる複数の測定信号であり、上記演算処理部は、上記選択した一つの検出素子の複数の測定信号に基づいて基準データを算出し、算出した基準データに対する、上記選択した一つの検出素子の複数の測定信号のそれぞれの変動率を算出し、算出した変動率に基づいて、上記選択した一つの検出素子とは異なる検出素子の複数の測定信号を補正し、補正した測定信号に基づいて、上記試料を分析することを特徴とする自動分析装置。The automatic analyzer according to claim 1,
The plurality of measurement signals of the detection element are a plurality of measurement signals having different detection times, and the arithmetic processing unit calculates reference data based on the plurality of measurement signals of the selected one detection element. The variation rate of each of the plurality of measurement signals of the selected one detection element with respect to the selected reference data is calculated, and based on the calculated variation rate, the plurality of measurements of the detection element different from the selected one detection element are calculated. An automatic analyzer characterized by correcting a signal and analyzing the sample based on the corrected measurement signal.
上記反応容器を通過した光を、光源に対して異なる角度で設置された複数の光検出素子により検出し、上記複数の検出素子のうちの選択した一つの検出素子の測定信号に基づいて基準データを算出し、算出した基準データに対する上記選択した一つの検出素子の測定信号の変動率を算出し、算出した変動率に基づいて、上記選択した一つの検出素子とは異なる検出素子の測地信号を補正し、補正した測定信号に基づいて、上記試料を分析することを特徴とする自動分析方法。In an automatic analysis method for irradiating light from a light source to a reaction container containing a sample, detecting light that has passed through the reaction container, and analyzing the sample in the reaction container based on the detected light,
Light that has passed through the reaction vessel is detected by a plurality of light detection elements installed at different angles with respect to the light source, and reference data is based on measurement signals of one detection element selected from the plurality of detection elements. And calculating a variation rate of the measurement signal of the selected one detection element with respect to the calculated reference data, and based on the calculated variation rate, a geodetic signal of the detection element different from the selected one detection element is calculated. An automatic analysis method characterized in that the sample is analyzed based on the corrected measurement signal.
上記複数の検出素子の測定信号は、検出時刻が互いに異なる複数の測定信号であり、上記選択した一つの検出素子の複数の測定信号に基づいて基準データを算出し、算出した基準データに対する、上記選択した一つの検出素子の複数の測定信号のそれぞれの変動率を算出し、算出した変動率に基づいて、上記選択した一つの検出素子とは異なる検出素子の複数の測定信号を補正し、補正した測定信号に基づいて、上記試料を分析することを特徴とする自動分析方法。The automatic analysis method according to claim 12,
The measurement signals of the plurality of detection elements are a plurality of measurement signals whose detection times are different from each other, calculate reference data based on the plurality of measurement signals of the selected one detection element, and Calculates the variation rate of each of the plurality of measurement signals of one selected detection element, corrects the plurality of measurement signals of the detection element different from the selected one detection element based on the calculated variation rate, and corrects And analyzing the sample based on the measured signal.
Priority Applications (5)
| Application Number | Priority Date | Filing Date | Title |
|---|---|---|---|
| JP2010142259AJP5216051B2 (en) | 2010-06-23 | 2010-06-23 | Automatic analyzer and automatic analysis method |
| EP11798025.0AEP2587251B1 (en) | 2010-06-23 | 2011-06-15 | Automated analysis device and automated analysis method |
| CN201180030850.0ACN103003684B (en) | 2010-06-23 | 2011-06-15 | Automatic analysing apparatus and automatic analysis method |
| US13/702,196US20130132022A1 (en) | 2010-06-23 | 2011-06-15 | Automatic analyzer and automatic analysis method |
| PCT/JP2011/063663WO2011162139A1 (en) | 2010-06-23 | 2011-06-15 | Automated analysis device and automated analysis method |
Applications Claiming Priority (1)
| Application Number | Priority Date | Filing Date | Title |
|---|---|---|---|
| JP2010142259AJP5216051B2 (en) | 2010-06-23 | 2010-06-23 | Automatic analyzer and automatic analysis method |
Publications (2)
| Publication Number | Publication Date |
|---|---|
| JP2012007921A JP2012007921A (en) | 2012-01-12 |
| JP5216051B2true JP5216051B2 (en) | 2013-06-19 |
Family
ID=45371332
Family Applications (1)
| Application Number | Title | Priority Date | Filing Date |
|---|---|---|---|
| JP2010142259AActiveJP5216051B2 (en) | 2010-06-23 | 2010-06-23 | Automatic analyzer and automatic analysis method |
Country Status (5)
| Country | Link |
|---|---|
| US (1) | US20130132022A1 (en) |
| EP (1) | EP2587251B1 (en) |
| JP (1) | JP5216051B2 (en) |
| CN (1) | CN103003684B (en) |
| WO (1) | WO2011162139A1 (en) |
Families Citing this family (11)
| Publication number | Priority date | Publication date | Assignee | Title |
|---|---|---|---|---|
| JP5897323B2 (en)* | 2011-12-26 | 2016-03-30 | 株式会社日立ハイテクノロジーズ | Automatic analyzer and measurement value abnormality detection method |
| JP5948173B2 (en)* | 2012-07-20 | 2016-07-06 | 株式会社日立ハイテクノロジーズ | Automatic analyzer and automatic analysis method |
| JP5952180B2 (en)* | 2012-12-19 | 2016-07-13 | 株式会社日立ハイテクノロジーズ | Automatic analyzer, program and recording medium, and sample automatic analysis method |
| JP6110710B2 (en)* | 2013-04-02 | 2017-04-05 | 株式会社日立ハイテクノロジーズ | Analyzer and automatic analyzer |
| EP2837937A1 (en)* | 2013-08-15 | 2015-02-18 | Roche Diagniostics GmbH | Method for the detection of the prozone effect of photometric assays |
| JP6567873B2 (en)* | 2015-05-22 | 2019-08-28 | 株式会社日立ハイテクノロジーズ | Automatic analyzer |
| JP6757964B2 (en)* | 2015-10-06 | 2020-09-23 | 独立行政法人国立高等専門学校機構 | Crystallization analyzer and crystallization analysis method |
| JP6653375B2 (en)* | 2016-03-16 | 2020-02-26 | 株式会社日立ハイテクノロジーズ | Automatic analyzer |
| JP6896459B2 (en)* | 2017-03-07 | 2021-06-30 | 株式会社日立ハイテク | Automatic analyzer and automatic analysis method |
| EP4293361A3 (en)* | 2017-12-26 | 2024-07-03 | Hitachi High-Tech Corporation | Automated analyzer and automated analysis method |
| WO2020250507A1 (en)* | 2019-06-11 | 2020-12-17 | 株式会社日立ハイテク | Automated analysis device, and abnormality detecting method |
Family Cites Families (36)
| Publication number | Priority date | Publication date | Assignee | Title |
|---|---|---|---|---|
| JPS5138523B2 (en)* | 1971-09-20 | 1976-10-22 | ||
| JPS5925460B2 (en)* | 1978-05-19 | 1984-06-18 | 株式会社日立製作所 | Nephelometric immunoassay method and device |
| US4616928A (en)* | 1984-06-20 | 1986-10-14 | Kidde, Inc. | Photoelectric smoke detector with adjustable background signal |
| JPS61173138A (en)* | 1985-01-28 | 1986-08-04 | Olympus Optical Co Ltd | Method for measuring immune reaction by intensity fluctuation of light |
| JPH0750119B2 (en)* | 1986-10-22 | 1995-05-31 | 財団法人電力中央研究所 | Flow visualization information detection method |
| US5100805A (en)* | 1989-01-26 | 1992-03-31 | Seradyn, Inc. | Quantitative immunoassay system and method for agglutination assays |
| KR920005116A (en)* | 1990-08-31 | 1992-03-28 | 정용문 | Noise Canceling Device for Photodetection Signal |
| US5449233A (en)* | 1992-06-16 | 1995-09-12 | Kabushiki Kaisha Toshiba | Temperature distribution measuring apparatus using an optical fiber |
| JP3027061B2 (en)* | 1992-12-24 | 2000-03-27 | 日本電子株式会社 | Reaction measurement method |
| DE69636549T2 (en)* | 1995-04-06 | 2007-01-11 | Delaval Holding Ab | METHOD AND DEVICE FOR THE QUANTITATIVE DETERMINATION OF PARTICLES IN LIQUIDS |
| US5662105A (en)* | 1995-05-17 | 1997-09-02 | Spacelabs Medical, Inc. | System and method for the extractment of physiological signals |
| JPH10332582A (en) | 1997-05-28 | 1998-12-18 | Kyowa Medex Co Ltd | Measuring apparatus for turbidity |
| JP2000230901A (en)* | 1999-02-09 | 2000-08-22 | Mitsubishi Chemicals Corp | Optical unit |
| DE19948587A1 (en) | 1999-10-08 | 2001-04-12 | Dade Behring Marburg Gmbh | Spectrophotometric and nephelometric detection unit |
| JP2001249134A (en)* | 1999-12-28 | 2001-09-14 | Matsushita Electric Ind Co Ltd | Protein concentration measurement reagent, protein concentration measurement method and urine test method using the same |
| US7425309B2 (en)* | 2000-01-31 | 2008-09-16 | Emory University | Immunological assay system and method |
| JP2002250692A (en)* | 2001-02-22 | 2002-09-06 | Fellow Kogyo Co Ltd | Oil concentration measurement device and measurement method for oily water containing contaminants |
| JP3814190B2 (en)* | 2001-11-09 | 2006-08-23 | 株式会社堀場製作所 | Particle size distribution measuring device |
| US6798508B2 (en)* | 2002-08-23 | 2004-09-28 | Coulter International Corp. | Fiber optic apparatus for detecting light scatter to differentiate blood cells and the like |
| JP3991267B2 (en)* | 2002-10-08 | 2007-10-17 | アークレイ株式会社 | Analytical apparatus and manufacturing method thereof |
| WO2004074867A1 (en)* | 2003-02-19 | 2004-09-02 | Mitsubishi Denki Kabushiki Kaisha | Laser radar |
| US6784990B1 (en)* | 2003-04-04 | 2004-08-31 | Pacific Scientific Instruments Company | Particle detection system implemented with a mirrored optical system |
| JP4117253B2 (en)* | 2004-01-23 | 2008-07-16 | 株式会社日立ハイテクノロジーズ | Automatic analyzer |
| JP4616567B2 (en)* | 2004-03-11 | 2011-01-19 | 株式会社堀場製作所 | Measuring method, analyzing method, measuring device, analyzing device, ellipsometer and computer program |
| CA2967430C (en)* | 2005-03-10 | 2018-05-08 | Gen-Probe Incorporated | Systems and methods to perform assays for detecting or quantifying analytes within samples |
| JP2006337125A (en)* | 2005-06-01 | 2006-12-14 | Hitachi High-Technologies Corp | Automatic analyzer, analysis method using automatic analyzer |
| US7518723B2 (en)* | 2005-09-19 | 2009-04-14 | Jmar Technologies, Inc. | Systems and methods for detecting radiation, biotoxin, chemical, and biological warfare agents using a multiple angle light scattering (MALS) instrument |
| EP1939607A1 (en)* | 2005-09-27 | 2008-07-02 | Olympus Corporation | Optical signal analyzing apparatus and optical signal analyzing method |
| JP2008008794A (en) | 2006-06-29 | 2008-01-17 | Olympus Corp | Analyzing device |
| JP4829716B2 (en)* | 2006-08-18 | 2011-12-07 | シスメックス株式会社 | Blood coagulation analyzer |
| ATE473628T1 (en)* | 2008-02-13 | 2010-07-15 | Inve Technologies Nv | METHOD FOR TREATING ARTEMIA CYSTS |
| JP4654256B2 (en)* | 2008-02-28 | 2011-03-16 | 株式会社日立ハイテクノロジーズ | Automatic analyzer |
| DE102008018592A1 (en)* | 2008-04-11 | 2009-10-15 | Endress + Hauser Conducta Gesellschaft für Mess- und Regeltechnik mbH + Co. KG | Method and device for turbidity measurement |
| JP5341440B2 (en)* | 2008-09-10 | 2013-11-13 | 株式会社日立ハイテクノロジーズ | Inspection device |
| JP5124498B2 (en)* | 2009-01-30 | 2013-01-23 | 株式会社日立ハイテクノロジーズ | Automatic analyzer |
| JP5667989B2 (en)* | 2009-12-04 | 2015-02-12 | 株式会社日立ハイテクノロジーズ | Blood coagulation analyzer |
- 2010
- 2010-06-23JPJP2010142259Apatent/JP5216051B2/enactiveActive
- 2011
- 2011-06-15CNCN201180030850.0Apatent/CN103003684B/enactiveActive
- 2011-06-15USUS13/702,196patent/US20130132022A1/ennot_activeAbandoned
- 2011-06-15WOPCT/JP2011/063663patent/WO2011162139A1/enactiveApplication Filing
- 2011-06-15EPEP11798025.0Apatent/EP2587251B1/enactiveActive
Also Published As
| Publication number | Publication date |
|---|---|
| EP2587251B1 (en) | 2019-10-23 |
| WO2011162139A1 (en) | 2011-12-29 |
| EP2587251A4 (en) | 2017-04-05 |
| JP2012007921A (en) | 2012-01-12 |
| EP2587251A1 (en) | 2013-05-01 |
| CN103003684B (en) | 2016-01-20 |
| CN103003684A (en) | 2013-03-27 |
| US20130132022A1 (en) | 2013-05-23 |
Similar Documents
| Publication | Publication Date | Title |
|---|---|---|
| JP5216051B2 (en) | Automatic analyzer and automatic analysis method | |
| JP6013796B2 (en) | Automatic analyzer and sample measurement method | |
| JP5296015B2 (en) | Automatic analyzer | |
| JP5897323B2 (en) | Automatic analyzer and measurement value abnormality detection method | |
| JP5481402B2 (en) | Automatic analyzer | |
| JP5984290B2 (en) | Automatic analyzer | |
| JP5661124B2 (en) | Automatic analyzer | |
| JP5952180B2 (en) | Automatic analyzer, program and recording medium, and sample automatic analysis method | |
| JP6313960B2 (en) | Automatic analyzer |
Legal Events
| Date | Code | Title | Description |
|---|---|---|---|
| A621 | Written request for application examination | Free format text:JAPANESE INTERMEDIATE CODE: A621 Effective date:20120213 | |
| TRDD | Decision of grant or rejection written | ||
| A01 | Written decision to grant a patent or to grant a registration (utility model) | Free format text:JAPANESE INTERMEDIATE CODE: A01 Effective date:20130205 | |
| A61 | First payment of annual fees (during grant procedure) | Free format text:JAPANESE INTERMEDIATE CODE: A61 Effective date:20130301 | |
| R150 | Certificate of patent or registration of utility model | Ref document number:5216051 Country of ref document:JP Free format text:JAPANESE INTERMEDIATE CODE: R150 Free format text:JAPANESE INTERMEDIATE CODE: R150 | |
| FPAY | Renewal fee payment (event date is renewal date of database) | Free format text:PAYMENT UNTIL: 20160308 Year of fee payment:3 | |
| S531 | Written request for registration of change of domicile | Free format text:JAPANESE INTERMEDIATE CODE: R313531 | |
| S533 | Written request for registration of change of name | Free format text:JAPANESE INTERMEDIATE CODE: R313533 | |
| R350 | Written notification of registration of transfer | Free format text:JAPANESE INTERMEDIATE CODE: R350 |