JP5131431B2 - Pathological image evaluation apparatus, pathological image evaluation method, and pathological image evaluation program - Google Patents
Pathological image evaluation apparatus, pathological image evaluation method, and pathological image evaluation programDownload PDFInfo
- Publication number
- JP5131431B2 JP5131431B2JP2007016356AJP2007016356AJP5131431B2JP 5131431 B2JP5131431 B2JP 5131431B2JP 2007016356 AJP2007016356 AJP 2007016356AJP 2007016356 AJP2007016356 AJP 2007016356AJP 5131431 B2JP5131431 B2JP 5131431B2
- Authority
- JP
- Japan
- Prior art keywords
- image
- image evaluation
- data
- stained
- pathological
- Prior art date
- Legal status (The legal status is an assumption and is not a legal conclusion. Google has not performed a legal analysis and makes no representation as to the accuracy of the status listed.)
- Expired - Fee Related
Links
Images


Landscapes
- Investigating Or Analysing Materials By Optical Means (AREA)
- Image Processing (AREA)
- Image Analysis (AREA)
Description
Translated fromJapanese本発明は、染色された組織標本の画像を評価する病理画像評価装置、病理画像評価方法、及び病理画像評価プログラムに関する。 The present invention relates to a pathological image evaluation apparatus, a pathological image evaluation method, and a pathological image evaluation program for evaluating an image of a stained tissue specimen.
病理分野において、組織標本を染色して撮影し、得られた染色画像を評価することが知られている。このように、組織標本の染色画像を評価する方法としては、例えば、特許文献1に記載の方法が挙げられる。 In the pathology field, it is known to stain and photograph a tissue specimen and evaluate the obtained stained image. Thus, as a method for evaluating a stained image of a tissue specimen, for example, the method described in
一般に、染色画像は、まず染色された組織標本の薄片をスライドガラス上に載せカバーグラスで封入し、このスライドを光学装置で撮像し、紙やデジタル化された電子媒体上に出力することで作成される。染色画像は、病理医などが直接見ることで診断に用いられる。しかしながら、染色画像を直接見て診断を行う場合、診断者には画像から組織標本の状態を正確に判断する高度な能力が求められる。従って、限られた者にしか正確な診断を行うことができず、経験の浅い人間でも正確な診断を行うことのできる技術の提供が望まれていた。 In general, a stained image is created by first placing a slice of a stained tissue specimen on a slide glass, enclosing it with a cover glass, imaging the slide with an optical device, and outputting it on paper or a digitized electronic medium. Is done. Stained images are used for diagnosis by being directly viewed by a pathologist or the like. However, when making a diagnosis by directly viewing a stained image, the diagnostician is required to have a high ability to accurately determine the state of the tissue specimen from the image. Therefore, it has been desired to provide a technique that can make an accurate diagnosis only to a limited number of people, and even an inexperienced person can make an accurate diagnosis.
診断を正確に行いやすくする為に、計算機上で画像処理を行うことが考えられる。計算機上における画像処理に関する技術としては、特許文献2に記載された画質評価装置が挙げられる。また、関連して、特許文献3には、入力パターンの標準パターンに対する適合度を求めるパターン認識装置が記載されている。更に、画像処理技術を診断に適用したものとしては、例えば、特許文献4に記載された病理画像検査支援装置、特許文献5に記載された組織学的アセスメント、特許文献6に記載された病理診断支援装置、特許文献7に記載された細胞活性度判定装置が挙げられる。 In order to facilitate accurate diagnosis, it may be possible to perform image processing on a computer. As a technique related to image processing on a computer, an image quality evaluation apparatus described in Patent Document 2 can be cited. Relatedly, Patent Document 3 describes a pattern recognition device that obtains the degree of adaptation of an input pattern to a standard pattern. Further, examples of applying the image processing technique to diagnosis include, for example, a pathological image inspection support device described in Patent Document 4, a histological assessment described in Patent Document 5, and a pathological diagnosis described in Patent Document 6. Examples thereof include a support device and a cell activity determination device described in Patent Document 7.
計算機上で画像を診断する場合、染色画像に対して、コンピュータプログラムに基づいた一律の処理が行われ、診断されることになる。従って、診断用の画像は、染色度合いや画質が、一定の水準範囲内に収まっていることが特に要求される。診断用画像の画質などを一定の水準範囲内に収めるため、予め、画像の変換が行われることもある。 When diagnosing an image on a computer, the dyed image is subjected to uniform processing based on a computer program and diagnosed. Therefore, the diagnostic image is particularly required to have a staining level and image quality within a certain level range. In order to keep the image quality of the diagnostic image within a certain standard range, image conversion may be performed in advance.
画像を変換する技術として、特許文献8には、撮像装置からの映像信号を入力するモニタに再現された画像の色と、画像記録装置により再現される画像の色の差を測色的に改善する事を目的とした画像処理装置が記載されている。 As a technique for converting an image, Patent Document 8 discloses a colorimetric improvement in the difference between the color of an image reproduced on a monitor that inputs a video signal from an imaging device and the color of an image reproduced by an image recording device. An image processing apparatus intended to do this is described.
ところで、染色画像の染色度合いや画質は、上述の組織標本の薄片の染色過程の条件に大きく影響される。染色過程は人により行われるため、作業者の技量に大きく影響される。例えば、ヘマトキシリンによる細胞核の染色等の場合、染色の程度自体が診断での重要な要素になる。このような場合、染色過程の出来によっては正確な診断を行うことができず、再染色を行ったほうが良いこともある。 By the way, the staining degree and image quality of the stained image are greatly influenced by the conditions of the staining process of the slice of the tissue specimen described above. Since the dyeing process is performed by a person, it is greatly influenced by the skill of the operator. For example, in the case of staining of cell nuclei with hematoxylin, the degree of staining itself is an important factor in diagnosis. In such a case, depending on the result of the staining process, an accurate diagnosis cannot be made, and it may be better to perform re-staining.
また、染色画像の状態は、組織標本を撮像してデジタルデータとする際に用いられる、光学機器やアナログデジタルコンバータなどの性能にも依存する。従って、染色過程は良好に行われたとしても、使用する光学機器やアナログデジタルコンバータなどの機器が異なれば、出力される染色画像の状態も異なることがある。このことは、正確な診断の妨げとなりえる。 The state of the stained image also depends on the performance of an optical device, an analog-digital converter, or the like that is used when a tissue specimen is imaged into digital data. Therefore, even if the dyeing process is performed satisfactorily, the state of the dyed image to be output may be different if different devices such as optical devices and analog-digital converters are used. This can hinder accurate diagnosis.
また、診断にあたって事前に画像を変換する場合、その診断に適する様に画像を変換しなければ、逆に正確な診断を行うことが困難となる場合も有り得る。例えば、画像平滑化によるノイズ除去処理の画像変換を行う場合、平滑化は画像詳細変化とのトレードオフになってしまい、画像詳細変化の要求される診断には向かない。また、ノイズが少なく詳細変化に富んだ画像が最良の結果を与えるとも限らず、診断に不要な画像情報はノイズとともに消去されたほうが正確な診断を実施できることもある。 In addition, when an image is converted in advance for diagnosis, it may be difficult to perform an accurate diagnosis unless the image is converted so as to be suitable for the diagnosis. For example, when performing image conversion for noise removal processing by image smoothing, smoothing is a trade-off with image detail change, and is not suitable for diagnosis requiring image detail change. In addition, an image with little noise and rich changes in detail may not give the best result, and image information unnecessary for diagnosis may be more accurately diagnosed if it is deleted together with noise.
従って、本発明の目的は、染色画像が診断に適した画像であるか否かを判断することのできる病理画像評価装置、病理画像評価方法、及び病理画像評価プログラムを提供することにある。 Accordingly, an object of the present invention is to provide a pathological image evaluation apparatus, a pathological image evaluation method, and a pathological image evaluation program capable of determining whether or not a stained image is an image suitable for diagnosis.
また、本発明の別の目的は、画像取得に用いた機器の性能が、診断用の画像に対して与える影響をを排除することできる病理画像評価装置、病理画像評価方法、及び病理画像評価プログラムを提供することにある。 Another object of the present invention is to provide a pathological image evaluation apparatus, a pathological image evaluation method, and a pathological image evaluation program capable of eliminating the influence of the performance of a device used for image acquisition on a diagnostic image. Is to provide.
本発明の更に別の目的は、染色画像を、診断に適した形で変換することのできる病理画像評価装置、病理画像評価方法、及び病理画像評価プログラムを提供することにある。 Still another object of the present invention is to provide a pathological image evaluation apparatus, a pathological image evaluation method, and a pathological image evaluation program capable of converting a stained image in a form suitable for diagnosis.
以下に、[発明を実施するための最良の形態]で使用される番号・符号を用いて、[課題を解決するための手段]を説明する。これらの番号・符号は、[特許請求の範囲]の記載と[発明を実施するための最良の形態]との対応関係を明らかにするために括弧付きで付加されたものである。ただし、それらの番号・符号を、[特許請求の範囲]に記載されている発明の技術的範囲の解釈に用いてはならない。 [Means for Solving the Problems] will be described below using the numbers and symbols used in [Best Mode for Carrying Out the Invention]. These numbers and symbols are added in parentheses in order to clarify the correspondence between the description of [Claims] and [Best Mode for Carrying Out the Invention]. However, these numbers and symbols should not be used for the interpretation of the technical scope of the invention described in [Claims].
本発明にかかる病理画像評価装置(10)は、染色された被検査対象の組織標本を画像取得装置(30)により撮像して得られた被検査画像データ(52)を、予め準備された画像評価用データ(51)と比較して、被検査対象の組織標本の染色が良好に行われたものであるか否かを判断する染色画像評価部(21)と、染色画像評価部(21)の判断結果を出力する出力部(23)と、を具備する。 The pathological image evaluation apparatus (10) according to the present invention is a preliminarily prepared image of inspected image data (52) obtained by imaging a stained tissue sample to be inspected by an image acquisition apparatus (30). Compared with the evaluation data (51), a stained image evaluation unit (21) for determining whether or not the tissue specimen to be examined is stained well, and a stained image evaluation unit (21) And an output unit (23) for outputting the determination result.
上記の病理画像評価装置(10)において、染色画像評価部(21)は、色を表すデータにより、被検査画像データ(52)を画像評価用データ(51)と比較することが好ましい。ここで、一の観点からは、色値に基いて、被検査画像データ(52)を画像評価用データ(51)と比較することが好ましい。また、他の一観点からは、色ヒストグラムを用いて比較することが好ましい。 In the above-described pathological image evaluation apparatus (10), the stained image evaluation unit (21) preferably compares the image data to be examined (52) with the image evaluation data (51) based on data representing color. Here, from one viewpoint, it is preferable to compare the inspected image data (52) with the image evaluation data (51) based on the color value. Further, from another viewpoint, it is preferable to compare using a color histogram.
上記の病理画像評価装置(10)において、更に、テスト用の画像データに基いて画像評価用データ(51)を生成する機械学習アルゴリズム(24)を具備し、染色画像評価部(21)は、被検査画像データ(52)を、機械学習アルゴリズム(24)により生成された画像評価用データ(21)と比較することが好ましい。 The pathological image evaluation apparatus (10) further includes a machine learning algorithm (24) for generating image evaluation data (51) based on the test image data, and the stained image evaluation unit (21) includes: The inspected image data (52) is preferably compared with the image evaluation data (21) generated by the machine learning algorithm (24).
上記の病理画像評価装置(10)において、更に、染色画像評価部(21)により、良好な染色が行われたと判断された被検査画像データ(良好染色画像データ53)を、診断に適した画像データに変換する画像変換部(22)、を具備することが好ましい。 In the above-mentioned pathological image evaluation apparatus (10), the image data to be examined (good stained image data 53) determined to have been satisfactorily stained by the stained image evaluation unit (21) is further suitable for diagnosis. It is preferable to include an image conversion unit (22) that converts data.
この病理画像評価装置(10)において、画像変換部(22)は、その被検査画像データ(52)の色空間と周波数レベルを変更することで、診断に適した画像データに変換することが好ましい。 In this pathological image evaluation apparatus (10), the image conversion unit (22) preferably converts the color space and frequency level of the image data to be inspected (52) into image data suitable for diagnosis. .
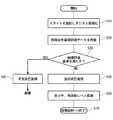
本発明にかかる病理画像評価方法は、染色された被検査対象の組織標本を撮像して生成された被検査画像データ(52)を、予め準備された画像評価用データ(51)と比較して、その被検査対象の組織標本の染色が良好に行われたものであるか否かを判断する画像評価ステップ(ステップS30)と、画像評価ステップ(S30)の判断結果を出力するステップ(ステップS40、50)と、を具備する。 The pathological image evaluation method according to the present invention compares inspected image data (52) generated by imaging a stained tissue sample to be inspected with previously prepared image evaluation data (51). An image evaluation step (step S30) for determining whether or not the tissue specimen to be inspected is satisfactorily stained, and a step of outputting the determination result of the image evaluation step (S30) (step S40) , 50).
この病理画像評価方法において、画像評価ステップ(S30)では、色を表すデータにより、被検査画像データ(52)を画像評価用データ(51)と比較することが好ましい。このとき、一の観点からは、色値に基いて、被検査画像データ(52)を画像評価用データ(51)と比較することが好ましい。また、別の観点からは、色ヒストグラムを用いて比較することが好ましい。 In this pathological image evaluation method, in the image evaluation step (S30), it is preferable to compare the inspected image data (52) with the image evaluation data (51) based on the data representing the color. At this time, from one viewpoint, it is preferable to compare the inspected image data (52) with the image evaluation data (51) based on the color value. From another viewpoint, it is preferable to make a comparison using a color histogram.
上記の病理画像評価方法であって、画像評価用データ(21)は、機械学習アルゴリズムにより生成されたものであることが好ましい。 In the above pathological image evaluation method, the image evaluation data (21) is preferably generated by a machine learning algorithm.
上記の病理画像評価方法において、更に、画像評価ステップ(S30)において良好な染色が行われたと判断された被検査画像データ(良好染色画像データ53)を、診断に適した画像データに変換する画像変換ステップ(ステップS60)を具備することが好ましい。 In the above pathological image evaluation method, further, the image to be inspected (good stained image data 53) determined to have been stained well in the image evaluation step (S30) is converted into image data suitable for diagnosis. A conversion step (step S60) is preferably provided.
この病理画像評価方法において、画像変換ステップ(S60)では、被検査画像データ(52)の色空間と周波数レベルを変更することで、診断に適した画像データに変換することが好ましい。 In this pathological image evaluation method, in the image conversion step (S60), it is preferable to convert the image data suitable for diagnosis by changing the color space and frequency level of the image data to be examined (52).
本発明にかかる病理画像評価プログラムは、上記の病理画像評価方法を、コンピュータによって実現する為のものである。 The pathological image evaluation program according to the present invention is for realizing the above pathological image evaluation method by a computer.
本発明に依れば、染色画像が診断に適した画像であるか否かを判断することのできる病理画像評価装置、病理画像評価方法、及び病理画像評価プログラムが提供される。 According to the present invention, there are provided a pathological image evaluation apparatus, a pathological image evaluation method, and a pathological image evaluation program capable of determining whether a stained image is an image suitable for diagnosis.
また、本発明に依れば、画像取得に用いた機器の性能が画像に対して与える影響をを排除することできる病理画像評価装置、病理画像評価方法、及び病理画像評価プログラムが提供される。 Further, according to the present invention, there are provided a pathological image evaluation apparatus, a pathological image evaluation method, and a pathological image evaluation program that can eliminate the influence of the performance of the device used for image acquisition on the image.
また、本発明に依れば、染色画像を、診断に適した形で変換することのできる病理画像評価装置、病理画像評価方法、及び病理画像評価プログラムが提供される。 Further, according to the present invention, a pathological image evaluation apparatus, a pathological image evaluation method, and a pathological image evaluation program capable of converting a stained image in a form suitable for diagnosis are provided.
(第1の実施形態)
図面を参照しつつ、本発明の第1の実施形態について説明する。図1は、本実施形態に係る病理画像評価システム100の構成を示すブロック図である。図1に示されるように、病理画像評価システム100は、組織標本の画像を撮像しデジタルデータ化する画像取得装置30と、画像取得装置30により生成された被検査画像データ52が診断に適したデータであるか否かを判断する病理画像評価装置10と、病理画像評価装置10により診断に適したデータであると判断された画像データに基いて診断処理を実行する画像診断装置40とを備えている。これらの構成のうち、画像診断装置40は、診断用の画像データが、ガン細胞を写したデータであるのか正常な細胞を写したデータであるのか、などといった診断を行う機能を実現するものであり、公知の技術を用いることができる。従って、本明細書中での画像診断装置40に関する詳細な説明は省略する。(First embodiment)
A first embodiment of the present invention will be described with reference to the drawings. FIG. 1 is a block diagram showing a configuration of a pathological
病理画像取得装置30は、染色された組織標本を撮像し、画像をデジタル化して被検査画像データ52を生成するものである。図2は、この病理画像取得装置30の構成例を示すブロック図である。図3に示される例において、病理画像取得装置30は、光学機器31、アナログデジタルコンバータ32、及び記憶装置(ディスク、メモリ)33を有している。光学機器31は、染色された組織標本の薄片が封入されたスライドを、拡大して撮像するものであり、顕微鏡に取りつけられたカメラや、スキャナーなどに例示される。アナログデジタルコンバータ32は、光学機器31によって撮像された画像をデジタルデータに変換する機能を実現するものであり、例えばCPUやインストールされたプログラムによって構成することができる。記憶装置33は、アナログデジタルコンバータ32によって変換されたデジタルデータを、被検査画像データ52として記憶(取得)するものであり、ハードディスクやメモリ等の電子媒体や、紙等に例示される。取得された被検査画像データ52は、病理画像評価装置10へ通知される。 The pathological
図1に戻り、病理画像評価装置10について説明する。病理画像評価装置10は、画像取得装置30によって取得された被検査画像データ52が、正常に染色の行われた組織標本のデータであるか否かを判断するためのものである。病理画像評価装置10は、記憶部11と、染色画像評価部21と、画像変換部22と、出力部23とを有している。尚、染色評価部21、画像変換部22、及び出力部23は、CPUやインストールされたプログラムが協同的に作動してその機能を実現する病理画像評価プログラム20である。 Returning to FIG. 1, the pathological
病理画像評価装置10は、画像取得装置30に対応して設けられる。すなわち、図2に示されるように、画像取得装置30が複数存在する場合には、画像取得装置(30−1〜30−n)それぞれに対応して、病理画像評価装置(10−1〜10−n)が設けられる。病理画像取得装置30により作成された被検査画像データ52の色合いや周波数レベルは、病理画像取得装置30の構成(光学機器31、アナログデジタルコンバータ32など)に依存する。すなわち、同じスライドから得た被検査画像データ52であっても、光学機器31やアナログデジタルコンバータ32の異なる病理画像取得装置30から得られた画像データ同士では、色合いや周波数レベルが異なることがある。特に、光学機器31のレンズ系が異なる場合、色合いに大きな差異が生じることが多い。従って、画像処理装置30の性能が画像評価に影響を与えない様にする為、病理画像評価装置10を画像処理装置30に対応させて設けることが必要である。 The pathological
記憶部11は、予め画像評価用データ51を記憶しておく為のものであり、メモリやハードディスク等に例示される。画像評価用データ51は、染色画像評価部21が、被検査画像データ52に対して、正常に染色の行われた組織標本のデータであるか否かの判断を行うに際し、基準とするデータである。また、既述のように同じスライドから得た画像でも画像取得装置30により画像の色合い、周波数レベルが異なることがあるので、画像評価用データ51も、画像取得装置30毎に用意される必要が有る。 The
画像評価用データ51としては、正常な染色が行われたか否かの基準とすることができる様なデータであれば、どのようなデータを用いてもよい。本実施形態では、色値の有効範囲が画像評価用データ51として用いられる場合について説明する。 As the
図4は、ヘマトキシリン(青)とエオシン(赤)で染色された組織標本の画像(HE染色画像)を評価するための画像評価用データ51を説明するための概念図である。図4に示されるように、画像評価用データ51として、RGB色値の有効範囲が設定されている。画像評価用データ51を作成するにあたっては、まず、正常な染色の行われたことが既知である組織標本を用意し、対応する病理画像取得装置30によって撮像する。正常な染色が行われた組織標本であるかどうかの判定は、専門の病理医が行うのが望ましい。 FIG. 4 is a conceptual diagram for explaining
HE染色画像は、青色部と赤色部と無色(未染色)部(まれに混入物)に分けることができる。そこで、正常な染色の行われた組織標本画像を、青領域、赤領域、及び無色領域に分割し、青と赤それぞれの色の分布を求める。そして、青領域のRGB値のそれぞれの値の最大値(MaxγH、MaxgH、MaxβH)、最小値(MixγH、MixgH、MixβH)、平均(μγH、μgH、μβH)、標準偏差(σγH、σgH、σβH)を求める。赤領域に関しても、青領域と同様に、(MaxγE、MaxgE、MaxβE)、最小値(MixγE、MixgE、MixβE)、平均(μγE、μgE、μβE)、標準偏差(σγE、σgE、σβE)を求める。そして、青、赤領域の各RGB値について、平均と標準偏差より、有効範囲を設定する。図4の例では、μ±2σが有効範囲として設定されている。この有効範囲の値が、画像評価用データ51である。すなわち、記憶部11には、この青、赤領域のRGBそれぞれの有効範囲を示すデータが記憶されていることになる。The HE-stained image can be divided into a blue part, a red part, and a colorless (unstained) part (rarely a contaminant). Therefore, a tissue sample image that has been normally stained is divided into a blue region, a red region, and a colorless region, and the distribution of each color of blue and red is obtained. Then, the maximum value (MaxγH , MaxgH , MaxβH ), the minimum value (MixγH , MixgH , MixβH ), the average (μγH , μgH , μβH ) of the RGB values of the blue region, Standard deviations (σγH , σgH , σβH ) are determined. Regarding the red region, as in the blue region, (MaxγE , MaxgE , MaxβE ), minimum value (MixγE , MixgE , MixβE ), average (μγE , μgE , μβE ), standard deviation ( (σγE , σgE , σβE ) are obtained. Then, for each RGB value in the blue and red regions, an effective range is set from the average and standard deviation. In the example of FIG. 4, μ ± 2σ is set as the effective range. The value of this effective range is the
尚、当然の事ながら、有効領域範囲の設定マージンは、±2σに限定されず、更に広く又は狭くしてもいい。また、表色系はRGBに限定されず、その補色のシアン、マゼンタ、黄色を要素とするCMY系や色相を考慮したHSV,HSL系であってもよい。また、正常に染色が行われた組織標本の画像データに基いて有効範囲を決定する場合について説明したが、あくまで一例であり、必ずしも実際の組織標本の画像データに基いて決定する必要も無い。例えば、計算値から、有効範囲が決定されてもよい。 As a matter of course, the setting margin of the effective area range is not limited to ± 2σ, and may be wider or narrower. Further, the color system is not limited to RGB, and may be a CMY system having its complementary colors cyan, magenta, and yellow as elements, or an HSV or HSL system in consideration of hue. Further, although the case where the effective range is determined based on the image data of the tissue specimen that has been normally stained has been described, this is merely an example, and it is not always necessary to determine based on the image data of the actual tissue specimen. For example, the effective range may be determined from the calculated value.
続いて、図1に戻り、染色画像評価部21について説明する。染色画像評価部21は、画像取得装置30から被検査画像データ52を取得すると、記憶部11を参照して、被検査画像データ52を画像評価用データ51と比較する。 Next, returning to FIG. 1, the stained
具体的には、被検査画像データ52に対して、色ごとの領域(青領域、赤領域、無色領域)に分離する。そして、青領域と赤領域それぞれについて、RGB値毎の色の分布(例えば平均値)を求める。さらに、求めた分布(平均値)が、画像評価用データ51の有効範囲内であるかどうかを判断する。判断の結果、各領域の各RGB値が有効範囲内であった場合には、正常な染色の行われた組織標本の画像データであり、診断に用いることのできる正常なデータ(以下、良好染色画像データ53と記載する)であると判断し、有効範囲外であった場合には診断に用いるには不適格なデータ(以下、不良染色画像データ54と記載する)であると判断する。 Specifically, the inspected
出力部23は、染色画像評価部21の評価結果に基いて、好染色画像データ53を画像変換部22に通知し、不良染色画像データ54を廃棄(削除)する、等の所定の出力処理を行う。このとき、例えば、表示装置(図示せず)に判断結果を表示したりする、等の出力処理を実行してもいい。 The
画像変換部22は、良好染色画像データ53を画像診断装置40に適する様に変換する。これは、画像データ53が画像診断装置40に入力された際に、画像診断装置40側において、画像の状態に変化が生じたりする場合があるからである。変換にあたっては、色空間と周波数レベルを変換することが好ましい。変換された画像データは、診断用画像データ55として、画像診断装置40に通知される。 The
尚、画像変換部22における変換処理の具体的な内容は、変換の目的を考慮して設定されていることが好ましい。その変換の目的としては、例えば、(1)画像診断装置40において正確な診断結果を出力する、(2)画像診断装置40に入力後の画像が、別の画像診断装置に入力されたときの画像と差違を生じない様にする、といった目的が考えられる。 It should be noted that the specific content of the conversion processing in the
前者(1)の場合、まず、予めテスト用の良好染色画像データを用意しておく。そしてテスト用の良好染色画像データに対して色分布と周波数レベルを変換したサンプルを複数パターン作成する。さらに、これらの各サンプルを画像診断装置40によって診断し、最も正確な診断結果の得られたサンプルの変換条件を求める。画像変換部22の変換処理の内容として、最も正確な診断結果の得られたサンプルの変換条件を採用するようにすればよい。 In the case of the former (1), first, well-stained image data for testing is prepared in advance. Then, a plurality of patterns are created by converting the color distribution and the frequency level of the well-stained image data for testing. Further, each of these samples is diagnosed by the image
また、後者(2)の場合、基準となる画像診断装置を決めておく。また、予めテスト用の良好染色画像データを用意しておく。そして、テスト用の良好染色画像データを、基準となる画像診断装置に入力して、画像診断装置側での画像を基準画像として把握しておく。更に、テスト用の良好染色画像データに対して、色分布と周波数レベルを複数パターンで変換した複数のサンプルを用意する。そして、各サンプルを実際に使用する画像診断装置40に入力し、画像診断装置40側での画像を、把握しておいた基準画像と比較する。比較の結果、両者が最も近くなるようなサンプルの変換条件を、画像変換部22の変換条件とすればよい。 In the latter case (2), a reference image diagnostic apparatus is determined. Also, good stained image data for testing is prepared in advance. Then, the well-stained image data for testing is input to the reference image diagnostic apparatus, and the image on the image diagnostic apparatus side is grasped as the reference image. Further, a plurality of samples obtained by converting the color distribution and the frequency level into a plurality of patterns are prepared for the well-stained image data for testing. Then, each sample is input to the
また、色分布の調整としては、Gamma補正、RGB表色系での色分布空間の平行移動、引き伸ばし、収縮、HSV,HSL表色系での色相変換などが例示される。 Examples of the color distribution adjustment include Gamma correction, parallel movement of the color distribution space in the RGB color system, enlargement, contraction, hue conversion in the HSV, HSL color system, and the like.
周波数レベルの調整としては、例えば、高周波成分を取り除き画像全体をぼかすローパスフィルタ、逆に高周波成分を抽出するハイパスフィルタ、を利用することが挙げられる。ノイズや画像診断に不要な高周波成分が多く、画像をぼかしたほうが診断に適する場合はローパスフィルタを利用することが好ましい。好ましく用いられるローパスフィルタとして、例えば、下記数式1に示されるガウス関数を元にしたガウスフィルタが挙げられる。
続いて、本実施形態に係る病理染色画像評価装置10の動作方法について説明する。図5は、本実施形態に係る病理染色画像評価方法を示すフローチャートである。 Subsequently, an operation method of the pathologically stained
ステップS10;撮影
まず、画像取得装置30を用いて、染色された組織標本の封入されたスライドを撮影し、デジタルデータ化する。デジタルデータ化された画像は、被検査画像データ52として、病理画像評価装置10へ通知される。Step S10: Photography First, the
ステップS20;画像評価用データ51の用意
次に、画像評価用データ51を用意し、病理画像評価装置10内の記憶部11に格納する。画像評価用データ51の作成方法については、既述の通りであるので、ここでは詳述しない。尚、画像評価用データ51は、必ずしもステップS10の後に用意される必要は無く、後述する画像評価の段階より前であればどの段階で用意されてもいい。Step S20: Preparation of
ステップS30;画像評価
次に、病理画像評価装置10が、取得した被検査画像データ52と、記憶部11に格納された画像評価用データ51とに基いて、被検査画像データ52が良好な画像であるか不良画像であるかを判断する。Step S30; Image Evaluation Next, the pathological
ステップS40、50;出力処理
S30の判断結果において、不良画像であると判断された被検査画像データ52は、不良染色画像データ54として出力部23によって廃棄される(ステップS40)。一方、良好な画像であると判断された被検査画像データ52は、良好染色画像データ53として出力部23により画像変換部22へ通知される(ステップS50)。Steps S40 and 50: Output Processing The
ステップS60;画像変換
次に、画像変換部22は、良好染色画像データ53の色分布と周波数レベルを、診断に適する様に変換する。変換された良好染色画像は、診断用画像データ55として画像診断装置40へ送信される。Step S60: Image Conversion Next, the
ステップS70;画像診断
画像診断装置40によって、診断用画像データ55の診断が行われる。これにより、一連の処理が終了する。Step S70: Image Diagnosis The
以上説明した様に、本実施形態に依れば、被検査画像データ52を良好な染色画像(画像評価用データ51)と比較することにより、診断に適した画像であるか否かを判別することができる。これにより、診断に適した画像のみを診断に用いることができる。 As described above, according to the present embodiment, the
ここで、画像取得装置30毎に病理評価装置10を設けているので、病理画像取得装置の性能等が画像へ与える影響を考慮しないで診断を行うことができる。 Here, since the
また、診断に先だって、画像変換部22が、良好染色画像データ53の色分布と周波数レベルを変換するので、診断時においてより正確な診断を行うことができる。 In addition, prior to diagnosis, the
尚、本実施形態では、染色画像評価部21によって不良染色画像データ54と判断された画像は棄却される場合について説明したが、不良染色画像データ54に対して救済処理を行ってもいい。不良染色画像データ54であっても色空間での色値有効領域の平行移動やGamma補正などの変換により、良好染色画像データ53と見なせることがある。このような場合には、不良染色画像データ54に対して、それらの簡単な画像変換を施した後、染色画像評価部21によって再度画像評価を行う。評価の結果、正常な染色の行われた画像であるとみなされれば、変換後の画像を良好染色画像データ53として取り扱うようにしてもよい。 In the present embodiment, the case where the image determined as the defective stained image data 54 by the stained
また、本実施形態では、画像診断装置40が診断を行う場合について説明したが、必ずしも計算機である画像診断装置40を用いて診断が行われる必要はない。染色画像評価部21によって良好染色画像データ53と不良染色画像データ54が判別されれば、例えば表示装置に診断用データを表示して、実際の診断は人間が行ってもよい。このようにしても、良好染色画像データ53と不良染色画像データ54とが選別されることにより、より正確な診断を行いやすくなるという作用を奏することができる。 In this embodiment, the case where the
(第2の実施形態)
本発明の第2の実施形態について説明する。本実施形態は、第1の実施形態と比較して、画像評価用データ51のデータ内容、染色画像評価部21の処理内容が異なっている。その他の点については第1の実施形態と同様であるので、説明を省略する。(Second Embodiment)
A second embodiment of the present invention will be described. The present embodiment differs from the first embodiment in the data content of the
図6は、画像評価用データ51の内容を示す概念図である。本実施の形態における画像評価用データ51は、図6に示されるように、正常な染色の行われたことが既知である画像を色値のヒストグラムとしてあらわしたものである。尚、色値のヒストグラムは、第1の実施形態と同様に、青領域、赤領域のそれぞれについて与えられる。そして各色領域全体でのRGBそれぞれの値が占める割合をベクトルとする(図6の縦軸の値がベクトル値になる)。たとえば、青領域で青値200の画素が青領域の30%を占める場合は、青ベクトルの200の値が0.3になる。尚、第1の実施形態と同様、表色系はRGBに限定されず、その補色のシアン、マゼンタ、黄色を要素とするCMY系や色相を考慮したHSV,HSL系であってもよい。 FIG. 6 is a conceptual diagram showing the contents of the
被検査画像データ52を評価するにあたっては、病理画像評価部21が、被検査画像データ52に対して、上記と同じく青領域と赤領域それぞれの色の分布を調べ、各色領域全体でのRGBそれぞれの値が占める割合をベクトルとして算出する。そして、画像評価用データ51に示されるヒストグラムのベクトルと、被検査画像データ52から得られたベクトル間の距離を算出する。算出した距離が一定以下であれば良好染色画像、そうでなければ不良染色画像と判断する。 In evaluating the inspected
以上説明した様に、本実施形態のように色値のヒストグラムを用いても、被検査画像データ52が診断に適した画像であるか否かを判定することができ、第1の実施形態と同様の作用を奏することができる。 As described above, even if a histogram of color values is used as in the present embodiment, it can be determined whether the
(第3の実施形態)
本発明の第3の実施形態について説明する。本実施形態は、第1の実施形態と比較して、画像評価用データ51、染色画像評価部21の処理内容が異なっている。また、コンピュータプログラムとして、機械学習アルゴリズム24が追加されている。その他の点については、既述の実施形態と同様とすることができるので、説明を省略する。(Third embodiment)
A third embodiment of the present invention will be described. This embodiment is different from the first embodiment in the processing contents of the
図7は、本実施形態に係る染色画像評価装置10の主要部の構成を表すブロック図である。図7に示されるように、機械学習アルゴリズム24は、訓練用に用意された、良好染色画像群と不良染色画像群と、に基いて、画像評価用データ51を生成するものである。尚、良好染色画像群は、正常に染色の行われたことが既知である複数の画像からなり、不良染色画像群は、正常に染色の行われなかったことが既知である複数の画像からなる。機械学習アルゴリズム24によって生成された画像評価用データ51は、染色画像評価部21に通知される。機械学習アルゴリズム24としては、特に限定されず、例えば、線形判別分析、ニューラルネットワーク、サポートベクターマシーンなどを用いることができる。 FIG. 7 is a block diagram illustrating a configuration of a main part of the stained
一方、染色画像評価部21では、被検査画像データ52と、機械学習アルゴリズム24から取得した画像評価用データ51とに基いて、被検査画像データ52が良好染色画像データ53であるか不良染色画像データ54であるかを判定する。 On the other hand, the stained
以上説明した様に、機械学習アルゴリズム24を用いて画像評価用データ51を生成する様にしても、被検査画像データ52が診断に適した画像であるか否かを判定することができ、既述の実施形態と同様の作用を奏することができる。また、第1、2の実施形態と比較すると、機械学習アルゴリズム24の追加により装置の構成が複雑となるものの、画像評価の信頼性を統計的に保証することができる。 As described above, even when the
尚、第1から第3の実施形態について説明したが、これらは必要に応じて矛盾のない範囲で組み合わせて用いることもできる。 In addition, although 1st-3rd embodiment was demonstrated, these can also be used in combination in the range without a contradiction as needed.
10 病理画像評価装置
11 記憶部
20 病理画像評価プログラム
21 染色画像評価部
22 画像変換部
23 出力部
24 機械学習アルゴリズム
30 病理画像取得装置
31 光学機器
32 アナログデジタルコンバータ
33 記憶装置
40 画像診断装置
51 画像評価用データ
52 被検査画像データ
53 良好染色画像データ
54 不良染色画像データ
55 診断用画像データ
100 病理画像評価システムDESCRIPTION OF
Claims (9)
Translated fromJapanese前記染色画像評価部の判断結果を出力する出力部と、
を具備する
病理画像評価装置。The image data to be inspected obtained by imaging the stained tissue specimen to be inspected by the image acquisition device is compared with the image evaluation data prepared in advance, so that the object to be inspected is satisfactorily stained.after separation and the at whether thoseinto a plurality of regions by the color of the stain, the stain image evaluation unit forjudgment in the color distribution histogram vectorof each dyed region,
An output unit for outputting the determination result of the stained image evaluation unit;
A pathological image evaluation apparatus comprising:
更に、
テスト用の画像データに基いて前記画像評価用データを生成する前記機械学習アルゴリズム
を具備し、
前記染色画像評価部は、前記被検査画像データを、前記機械学習アルゴリズムが生成した前記画像評価用データと比較する
病理画像評価装置。The pathological image evaluation apparatus according to claim 1,
Furthermore,
Comprising the machine learning algorithm for generating the image evaluation data based on test image data;
The stained image evaluation unit is a pathological image evaluation device that compares the image data to be examined with the image evaluation data generated by the machine learning algorithm.
更に、
前記染色画像評価部により、良好な染色が行われたと判断された前記被検査画像データを、診断に適した画像データに変換する画像変換部
を具備する
病理画像評価装置。The pathological image evaluation apparatus according to claim 1 or 2,
Furthermore,
A pathological image evaluation apparatus comprising: an image conversion unit that converts the image data to be inspected, which is determined to have been satisfactorily stained by the stained image evaluation unit, into image data suitable for diagnosis.
前記画像変換部は、前記被検査画像データの色空間と周波数レベルを変更することで、診断に適した画像データに変換する
病理画像評価装置。A pathological image evaluation apparatus according to claim 3, wherein
The pathological image evaluation apparatus, wherein the image conversion unit converts image data suitable for diagnosis by changing a color space and a frequency level of the image data to be inspected.
前記画像評価ステップの判断結果を出力するステップと、
を具備する
病理画像評価方法。The inspected image data generated by imaging the stained tissue sample of the inspected object is compared with the image evaluation data prepared in advance, and the inspected object is stained well. An image evaluation step for determining whether or notthe color distribution histogram vector ofeach staining area after separating into a plurality of areas by staining color ;
Outputting a judgment result of the image evaluation step;
A pathological image evaluation method comprising:
画像評価用データは、機械学習アルゴリズムにより生成されたものである
病理画像評価方法。The pathological image evaluation method according to claim 5,
The pathological image evaluation method, wherein the image evaluation data is generated by a machine learning algorithm.
更に、
前記画像評価ステップにおいて良好な染色が行われたと判断された前記被検査画像データを、診断に適した画像データに変換する画像変換ステップ、
を具備する
病理画像評価方法。The pathological image evaluation method according to claim 5 or 6,
Furthermore,
An image conversion step for converting the image data to be inspected, which is determined to have been satisfactorily stained in the image evaluation step, into image data suitable for diagnosis;
A pathological image evaluation method comprising:
前記画像変換ステップにおいて、前記被検査画像データの色空間と周波数レベルを変更することで、診断に適した画像データに変換する
病理画像評価方法。The pathological image evaluation method according to claim 7,
In the image conversion step, a pathological image evaluation method for converting into image data suitable for diagnosis by changing a color space and a frequency level of the image data to be inspected.
Priority Applications (1)
| Application Number | Priority Date | Filing Date | Title |
|---|---|---|---|
| JP2007016356AJP5131431B2 (en) | 2007-01-26 | 2007-01-26 | Pathological image evaluation apparatus, pathological image evaluation method, and pathological image evaluation program |
Applications Claiming Priority (1)
| Application Number | Priority Date | Filing Date | Title |
|---|---|---|---|
| JP2007016356AJP5131431B2 (en) | 2007-01-26 | 2007-01-26 | Pathological image evaluation apparatus, pathological image evaluation method, and pathological image evaluation program |
Publications (2)
| Publication Number | Publication Date |
|---|---|
| JP2008185337A JP2008185337A (en) | 2008-08-14 |
| JP5131431B2true JP5131431B2 (en) | 2013-01-30 |
Family
ID=39728499
Family Applications (1)
| Application Number | Title | Priority Date | Filing Date |
|---|---|---|---|
| JP2007016356AExpired - Fee RelatedJP5131431B2 (en) | 2007-01-26 | 2007-01-26 | Pathological image evaluation apparatus, pathological image evaluation method, and pathological image evaluation program |
Country Status (1)
| Country | Link |
|---|---|
| JP (1) | JP5131431B2 (en) |
Cited By (1)
| Publication number | Priority date | Publication date | Assignee | Title |
|---|---|---|---|---|
| KR102091832B1 (en)* | 2019-08-05 | 2020-03-20 | 주식회사 에프앤디파트너스 | Portable In Vitro Diagnostic Kit Analyzer Using Multimedia Information |
Families Citing this family (7)
| Publication number | Priority date | Publication date | Assignee | Title |
|---|---|---|---|---|
| US8165363B2 (en)* | 2007-05-04 | 2012-04-24 | Aperio Technologies, Inc. | System and method for quality assurance in pathology |
| JP5321145B2 (en)* | 2009-03-04 | 2013-10-23 | 日本電気株式会社 | Image diagnosis support apparatus, image diagnosis support method, image diagnosis support program, and storage medium thereof |
| JP5325620B2 (en)* | 2009-03-18 | 2013-10-23 | オリンパス株式会社 | Image analysis apparatus, image analysis method, and program |
| US8977017B2 (en) | 2011-09-15 | 2015-03-10 | The General Hospital Corporation | System and method for support of medical diagnosis |
| WO2018193635A1 (en)* | 2017-04-21 | 2018-10-25 | オリンパス株式会社 | Image processing system, image processing method, and image processing program |
| JP2024543098A (en)* | 2021-11-23 | 2024-11-19 | アジレント・テクノロジーズ・インク | Digital analysis of pre-analytical factors in tissues used for histological staining |
| JP2024016378A (en)* | 2022-07-26 | 2024-02-07 | 株式会社Screenホールディングス | Analysis support method, program and analysis support device |
Family Cites Families (8)
| Publication number | Priority date | Publication date | Assignee | Title |
|---|---|---|---|---|
| JP2928714B2 (en)* | 1993-12-28 | 1999-08-03 | アサヒビール株式会社 | Cell activity determination method and device |
| JPH0837604A (en)* | 1994-05-17 | 1996-02-06 | Olympus Optical Co Ltd | Image processor |
| US5625706A (en)* | 1995-05-31 | 1997-04-29 | Neopath, Inc. | Method and apparatus for continously monitoring and forecasting slide and specimen preparation for a biological specimen population |
| JP4314822B2 (en)* | 2002-02-13 | 2009-08-19 | 株式会社ニコン | Image processing apparatus, image processing method, and image processing program |
| JP4414640B2 (en)* | 2002-08-30 | 2010-02-10 | 旭化成株式会社 | Cell detection method and apparatus |
| JP2004340738A (en)* | 2003-05-15 | 2004-12-02 | Sysmex Corp | Apparatus, system and method for classifying cells |
| US8185317B2 (en)* | 2003-06-12 | 2012-05-22 | Cytyc Corporation | Method and system of determining the stain quality of slides using scatter plot distribution |
| JP4496943B2 (en)* | 2004-11-30 | 2010-07-07 | 日本電気株式会社 | Pathological diagnosis support apparatus, pathological diagnosis support program, operation method of pathological diagnosis support apparatus, and pathological diagnosis support system |
- 2007
- 2007-01-26JPJP2007016356Apatent/JP5131431B2/ennot_activeExpired - Fee Related
Cited By (2)
| Publication number | Priority date | Publication date | Assignee | Title |
|---|---|---|---|---|
| KR102091832B1 (en)* | 2019-08-05 | 2020-03-20 | 주식회사 에프앤디파트너스 | Portable In Vitro Diagnostic Kit Analyzer Using Multimedia Information |
| WO2021025458A1 (en)* | 2019-08-05 | 2021-02-11 | 주식회사 에프앤디파트너스 | Device for analyzing mobile in-vitro diagnostic kit by using multimedia information |
Also Published As
| Publication number | Publication date |
|---|---|
| JP2008185337A (en) | 2008-08-14 |
Similar Documents
| Publication | Publication Date | Title |
|---|---|---|
| JP5131431B2 (en) | Pathological image evaluation apparatus, pathological image evaluation method, and pathological image evaluation program | |
| US9224193B2 (en) | Focus stacking image processing apparatus, imaging system, and image processing system | |
| JP6900581B1 (en) | Focus-weighted machine learning classifier error prediction for microscope slide images | |
| US9418414B2 (en) | Image measurement apparatus, image measurement method and image measurement system | |
| US8346022B2 (en) | System and method for generating an intrinsic image using tone mapping and log chromaticity | |
| JP2004151101A (en) | Method and system for identifying object of interest in biological specimen | |
| US20120212599A1 (en) | Imaging apparatus and imaging method | |
| EP2040218A1 (en) | Image processing device and image processing program | |
| Hashimoto et al. | Referenceless image quality evaluation for whole slide imaging | |
| WO2018021114A1 (en) | Printed matter inspection apparatus and printed matter inspection method | |
| JPWO2018203514A1 (en) | Image analysis evaluation method, computer program, image analysis evaluation device | |
| US8406514B2 (en) | Image processing device and recording medium storing image processing program | |
| Redondo et al. | Quality evaluation of microscopy and scanned histological images for diagnostic purposes | |
| JP2005331929A (en) | Image analysis method, image analysis program, and pixel evaluation system therewith | |
| WO2019181072A1 (en) | Image processing method, computer program, and recording medium | |
| KR100779312B1 (en) | Defect detection apparatus, image sensor device, image sensor module, image processing apparatus, digital image quality tester, and defect detection method | |
| RU2295297C2 (en) | Method for studying and predicting the state of biological object or its part | |
| JP4244046B2 (en) | Image processing method and image processing apparatus | |
| JP2006067423A (en) | Image quality quantitative evaluation method and its device | |
| CN112949585B (en) | Method, device, electronic device and storage medium for identifying blood vessels in fundus images | |
| JP2007198850A (en) | Unevenness inspection method and unevenness inspection device | |
| KR100754969B1 (en) | Image inspecting apparatus, image inspecting method, and computer-readable storage medium | |
| Williams et al. | Measuring and managing digital image sharpening | |
| JPH0843316A (en) | Method and device for automatic diagnosis of coating film deterioration | |
| JP2006194657A (en) | Pseudo defect image creation method and apparatus using the same |
Legal Events
| Date | Code | Title | Description |
|---|---|---|---|
| A621 | Written request for application examination | Free format text:JAPANESE INTERMEDIATE CODE: A621 Effective date:20091214 | |
| A977 | Report on retrieval | Free format text:JAPANESE INTERMEDIATE CODE: A971007 Effective date:20110817 | |
| A131 | Notification of reasons for refusal | Free format text:JAPANESE INTERMEDIATE CODE: A131 Effective date:20110818 | |
| A521 | Request for written amendment filed | Free format text:JAPANESE INTERMEDIATE CODE: A523 Effective date:20111012 | |
| A131 | Notification of reasons for refusal | Free format text:JAPANESE INTERMEDIATE CODE: A131 Effective date:20120213 | |
| A521 | Request for written amendment filed | Free format text:JAPANESE INTERMEDIATE CODE: A523 Effective date:20120410 | |
| TRDD | Decision of grant or rejection written | ||
| A01 | Written decision to grant a patent or to grant a registration (utility model) | Free format text:JAPANESE INTERMEDIATE CODE: A01 Effective date:20121010 | |
| A01 | Written decision to grant a patent or to grant a registration (utility model) | Free format text:JAPANESE INTERMEDIATE CODE: A01 | |
| A61 | First payment of annual fees (during grant procedure) | Free format text:JAPANESE INTERMEDIATE CODE: A61 Effective date:20121023 | |
| FPAY | Renewal fee payment (event date is renewal date of database) | Free format text:PAYMENT UNTIL: 20151116 Year of fee payment:3 | |
| R150 | Certificate of patent or registration of utility model | Free format text:JAPANESE INTERMEDIATE CODE: R150 Ref document number:5131431 Country of ref document:JP Free format text:JAPANESE INTERMEDIATE CODE: R150 | |
| LAPS | Cancellation because of no payment of annual fees |