JP4647442B2 - Data display device, data display method, and data display program - Google Patents
Data display device, data display method, and data display programDownload PDFInfo
- Publication number
- JP4647442B2 JP4647442B2JP2005266410AJP2005266410AJP4647442B2JP 4647442 B2JP4647442 B2JP 4647442B2JP 2005266410 AJP2005266410 AJP 2005266410AJP 2005266410 AJP2005266410 AJP 2005266410AJP 4647442 B2JP4647442 B2JP 4647442B2
- Authority
- JP
- Japan
- Prior art keywords
- data
- reference value
- display
- item
- sorting
- Prior art date
- Legal status (The legal status is an assumption and is not a legal conclusion. Google has not performed a legal analysis and makes no representation as to the accuracy of the status listed.)
- Expired - Fee Related
Links
Images


Classifications
- G—PHYSICS
- G06—COMPUTING OR CALCULATING; COUNTING
- G06F—ELECTRIC DIGITAL DATA PROCESSING
- G06F16/00—Information retrieval; Database structures therefor; File system structures therefor
- G06F16/30—Information retrieval; Database structures therefor; File system structures therefor of unstructured textual data
- G06F16/34—Browsing; Visualisation therefor
Landscapes
- Engineering & Computer Science (AREA)
- Theoretical Computer Science (AREA)
- Data Mining & Analysis (AREA)
- Databases & Information Systems (AREA)
- Physics & Mathematics (AREA)
- General Engineering & Computer Science (AREA)
- General Physics & Mathematics (AREA)
- Information Retrieval, Db Structures And Fs Structures Therefor (AREA)
Description
Translated fromJapanese本発明は、データ表示技術に関し、特に、順序付けられた項目(例えば、年次)に対応するデータを表示するデータ表示装置、データ表示方法およびデータ表示プログラムに関する。より具体的には、本発明は、発表される文書データに含まれるキーワード毎に、文書データの発表件数の推移を表示する。 The present invention relates to a data display technique, and more particularly to a data display device, a data display method, and a data display program for displaying data corresponding to ordered items (for example, annual). More specifically, the present invention displays the transition of the number of announcements of document data for each keyword included in the document data to be announced.
大学、企業等の各研究機関は、有用な研究について、年次大会や論文誌において毎年発表を行っている。論文誌・年次大会での発表件数の推移を図21に示す。論文誌と年次大会を比較すると、年次大会の方が圧倒的に発表件数が多いことがわかる。また、両方ともに一時期件数が減る時期(論文誌だと8年次、年次大会だと6年次)があったものの、全体的に増加傾向であることがわかる。 Each research institution such as a university or a company presents useful research every year at annual conferences and journals. Figure 21 shows the transition of the number of publications at the journals and annual conferences. Comparing the journals with the annual convention, it can be seen that the annual convention has an overwhelming number of presentations. In both cases, the number of cases decreased for a period of time (8th year for journals and 6th year for annual conventions), but the overall trend is increasing.
年次大会と論文誌は、それぞれ4年次、6年次で一時的なピークを迎え、6年次、8年次で一時的に落ち込んでいる。年次大会のピークと落ち込みの起こった年の丁度2年後に論文誌でピークと落ち込みが生じている。これは、論文誌は投稿から査読、掲載と時間がかかるため、同時期に行なった研究であっても、論文誌の方が年次大会よりも遅れて発表されるために生じたものと思われる。 Annual conferences and journals peaked temporarily in the 4th and 6th years, respectively, and declined temporarily in the 6th and 8th years. Peaks and declines occur in journals just two years after the annual convention peak and year of decline. This seems to have happened because journals were published later than the annual convention, even if the research was conducted at the same time, because journals take time to review and publish. It is.
下記の非特許文献1に記載されている、入力されたデータを表形式で表示する技術を用いれば、各研究機関の各年次の発表件数のデータ(年次発表データ)を表形式で表示することができる(非特許文献1参照)。 If the technology that displays the input data in the table format described in Non-Patent
また、従来から、あるキーワード(例えば、研究機関名、研究分野名等)を含む文書の年次発表データを、例えば発表件数の多いキーワードの順に手作業でソートして表示する技術がある。
しかし、従来技術では、例えば、キーワード毎の発表件数の推移を一目で把握することができるような表示を自動的に行うことは困難である。例えば、キーワードとして研究機関を例にとると、従来技術では、どの研究機関が最近発表件数が増加傾向にあるのか、または減少傾向にあるのか等の、発表件数の動向が一目で把握できるように、各研究機関の発表件数の推移を自動で可視的に表示することはできない。 However, in the conventional technology, for example, it is difficult to automatically display such that the transition of the number of announcements for each keyword can be grasped at a glance. For example, taking a research institution as an example, it is possible to grasp at a glance the trends in the number of presentations, such as which research institution has recently been on an increasing trend or a decreasing trend in the conventional technology. , The transition of the number of presentations at each research institution cannot be automatically and visually displayed.
また、例えば、キーワードとして研究分野を例にとると、従来技術では、例えば、どの研究分野について、最近発表件数が増加傾向にあるのか、または、減少傾向にあるのかを一目で把握できるような表示を行うことはできない。 For example, taking a research field as an example, in the conventional technology, for example, a display that can grasp at a glance which research field the number of recent publications is increasing or decreasing. Can not do.
本発明は、上記従来技術の問題点を解決し、各データ項目(例えば、キーワード)を含む記述データ(例えば、文書)に関する、順序付けられた項目(例えば、年次)に対応するデータ(例えば、数値データ)の推移を自動的に表示するデータ表示装置、データ表示方法およびデータ表示プログラムの提供を目的とする。より具体的には、本発明は、キーワード毎の文書の発表件数の動向が一目で把握できるような形式で、キーワード毎の発表件数の推移を自動的に表示することを目的とする。 The present invention solves the above-mentioned problems of the prior art and relates to ordered data (eg, annual) related to descriptive data (eg, document) including each data item (eg, keyword) (eg, annual). An object of the present invention is to provide a data display device, a data display method, and a data display program for automatically displaying the transition of numerical data. More specifically, an object of the present invention is to automatically display the transition of the number of announcements for each keyword in a format in which the trend of the number of document announcements for each keyword can be grasped at a glance.
上記課題を解決するため、本発明は、順序付けられた項目に対応するデータを表示するデータ表示装置であって、データ項目を含む記述データに関する、前記順序付けられた項目に対応するデータが入力されるデータ入力手段と、前記入力された各データ項目を含む記述データに関するデータに基づいて、前記入力された各データ項目を含む記述データに関するデータをソートする基準となる値である基準値を前記各データ項目毎に算出する基準値算出手段と、前記各データ項目を含む記述データに関するデータを前記算出された基準値について昇順または降順にソートするデータソート手段と、前記ソートされたデータに基づいて、表示データを作成し、作成した表示データを画面表示するデータ表示手段とを備えることを特徴とする。 In order to solve the above-described problems, the present invention is a data display device that displays data corresponding to ordered items, and the data corresponding to the ordered items is input with respect to descriptive data including the data items. Based on the data related to the data related to the description data including the input data items, the data input means sets a reference value as a reference value for sorting the data related to the description data including the input data items. Reference value calculation means for calculating for each item, data sorting means for sorting data relating to the description data including each data item in ascending or descending order with respect to the calculated reference value, and display based on the sorted data It is characterized by comprising data display means for creating data and displaying the created display data on the screen.
また、本発明は、順序付けられた項目に対応する数値データを表示するデータ表示装置であって、各データ項目を含む記述データに関する、前記順序付けられた項目に対応する数値データが入力されるデータ入力手段と、前記入力された数値データに基づいて、前記数値データをソートする基準となる値である基準値を前記各データ項目毎に算出する基準値算出手段と、前記各データ項目を含む記述データに関する数値データを前記算出された基準値について昇順または降順にソートするデータソート手段と、前記ソートされた数値データに基づいて、表示データを作成し、作成した表示データを画面表示するデータ表示手段とを備えることを特徴とする。 The present invention is also a data display device for displaying numerical data corresponding to ordered items, wherein the numerical data corresponding to the ordered items is input with respect to descriptive data including each data item. Means, reference value calculation means for calculating a reference value, which is a reference value for sorting the numerical data, for each of the data items based on the input numerical data, and descriptive data including the data items Data sorting means for sorting numerical data relating to the calculated reference value in ascending or descending order; and data display means for creating display data based on the sorted numerical data and displaying the created display data on a screen; It is characterized by providing.
また、本発明は、前記のデータ表示装置において、前記基準値算出手段は、前記順序付けられた項目の順序の値に基づいて、前記基準値を算出することを特徴とする。 In the data display device according to the present invention, the reference value calculation unit calculates the reference value based on an order value of the ordered items.
また、本発明は、前記のデータ表示装置において、前記基準値算出手段は、前記順序付けられた項目の順序の値の平均値と最頻値と中央値との平均の値を前記基準値として算出することを特徴とする。 In the data display device according to the present invention, the reference value calculation means calculates an average value of the order values of the ordered items, an average value of the mode value, and the median value as the reference value. It is characterized by doing.
また、本発明は、前記のデータ表示装置において、前記基準値算出手段は、前記順序付けられた項目の順序の値の平均値を基準値として算出することを特徴とする。 In the data display device according to the present invention, the reference value calculation unit calculates an average value of the order values of the ordered items as a reference value.
また、本発明は、前記のデータ表示装置において、前記基準値算出手段は、前記順序付けられた項目の順序の値の最頻値を基準値として算出することを特徴とする。 In the data display device according to the present invention, the reference value calculation means calculates a mode value of the order values of the ordered items as a reference value.
また、本発明は、前記のデータ表示装置において、前記基準値算出手段は、前記順序付けられた項目の順序の値の中央値を基準値として算出することを特徴とする。 In the data display device according to the present invention, the reference value calculation unit calculates a median value of the order values of the ordered items as a reference value.
また、本発明は、前記のデータ表示装置において、前記データ表示手段は、前記各データ項目毎に算出された基準値をプロットしたデータを、前記表示データの一部として画面表示することを特徴とする。 Further, the present invention is characterized in that, in the data display device, the data display means displays data plotting a reference value calculated for each data item on a screen as a part of the display data. To do.
また、本発明は、前記のデータ表示装置において、前記データ表示手段は、さらに、前記表示データに前記各データ項目毎に算出された基準値が併記される形式で、前記表示データを画面表示することを特徴とする。 In the data display device according to the present invention, the data display means further displays the display data on a screen in a format in which a reference value calculated for each data item is written in the display data. It is characterized by that.
また、本発明は、前記のデータ表示装置において、前記データ入力手段は、入力された書誌データを蓄積するデータ蓄積手段と、前記蓄積された書誌データからデータ項目を抽出するデータ項目抽出手段と、前記抽出されたデータ項目と前記書誌データとに基づいて、各データ項目を含む記述データに関する、前記順序付けられた項目に対応するデータを作成するデータ作成手段とを備え、前記基準値算出手段は、前記作成された各データ項目を含む記述データに関するデータに基づいて、前記各データ項目を含む記述データに関するデータをソートする基準となる値である基準値を前記各データ項目毎に算出することを特徴とする。 In the data display device according to the present invention, the data input means includes data storage means for storing input bibliographic data, data item extraction means for extracting data items from the stored bibliographic data, Based on the extracted data items and the bibliographic data, the data creation means for creating data corresponding to the ordered items regarding the description data including each data item, the reference value calculation means, A reference value, which is a reference value for sorting data related to description data including each data item, is calculated for each data item based on the data related to description data including each data item created. And
また、本発明は、順序付けられた項目に対応するデータを表示するデータ表示方法であって、データ項目を含む記述データに関する、前記順序付けられた項目に対応するデータを入力するステップと、前記入力された各データ項目を含む記述データに関するデータに基づいて、前記入力された各データ項目を含む記述データに関するデータをソートする基準となる値である基準値を前記各データ項目毎に算出するステップと、前記各データ項目を含む記述データに関するデータを前記算出された基準値について昇順または降順にソートするステップと、前記ソートされたデータに基づいて、表示データを作成し、作成した表示データを画面表示するステップとを有することを特徴とする。 The present invention is also a data display method for displaying data corresponding to ordered items, the step of inputting data corresponding to the ordered items relating to descriptive data including data items, and the input Calculating a reference value for each of the data items, based on data related to the description data including each data item, a reference value that is a value for sorting the data related to the description data including each input data item; Sorting data related to descriptive data including each data item in ascending or descending order with respect to the calculated reference value, creating display data based on the sorted data, and displaying the created display data on the screen And a step.
また、本発明は、順序付けられた項目に対応するデータを表示するデータ表示装置が備えるコンピュータに実行させるためのプログラムであって、前記コンピュータを、データ項目を含む記述データに関する、前記順序付けられた項目に対応するデータが入力されるデータ入力手段と、前記入力された各データ項目を含む記述データに関するデータに基づいて、前記入力された各データ項目を含む記述データに関するデータをソートする基準となる値である基準値を前記各データ項目毎に算出する基準値算出手段と、前記各データ項目を含む記述データに関するデータを前記算出された基準値について昇順または降順にソートするデータソート手段と、前記ソートされたデータに基づいて、表示データを作成し、作成した表示データを画面表示するデータ表示手段として機能させるためのデータ表示プログラムである。 The present invention is also a program for causing a computer included in a data display device that displays data corresponding to ordered items to execute the computer, wherein the computer relates to the description data including the data items. And a data input means to which data corresponding to the data is input, and a value serving as a reference for sorting the data related to the description data including each input data item based on the data related to the description data including each input data item A reference value calculation means for calculating a reference value for each data item; data sorting means for sorting data relating to descriptive data including each data item in ascending or descending order with respect to the calculated reference value; and the sorting Display data is created based on the displayed data, and the created display data is displayed on the screen. A data display program for functioning as a data display means for.
本発明は、各キーワードを含む記述データ(例えば、文書)に関する、前記順序付けられた項目(例えば、年次)に対応するデータ(例えば、数値データ)を、基準値に基づいて自動的にソートした上で、ソート後のデータを画面表示する。 The present invention automatically sorts data (for example, numerical data) corresponding to the ordered items (for example, annual) regarding descriptive data (for example, documents) including each keyword based on a reference value. Above, display the sorted data on the screen.
より具体的には、本発明は、個々のキーワードを含む文書の、各年次の発表件数のデータ(年次発表データ)を、基準値に基づいて自動的にソートした上で、ソート後の複数のキーワードについての発表件数の推移を画面表示する。従って、本発明によれば、例えば、キーワード毎の文書の発表件数の動向が一目で把握できる。 More specifically, the present invention automatically sorts the data (annual announcement data) of the number of publications for each year of documents including individual keywords based on a reference value, The transition of the number of announcements for multiple keywords is displayed on the screen. Therefore, according to the present invention, for example, the trend of the number of documents published for each keyword can be grasped at a glance.
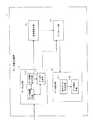
図1は、本発明のデータ表示装置の構成の一例を示す図である。データ表示装置1は、各データ項目(例えば、キーワード)を含む記述データ(例えば、文書)に関する、順序付けられた項目に対応するデータ(例えば、数値データ)を画面表示する。例えば、研究機関や研究分野等といったキーワードについての年次発表データを画面表示する。データ表示装置1は、データ入力部11、基準値算出部12、データソート部13、データ表示部14を備える。 FIG. 1 is a diagram showing an example of the configuration of the data display device of the present invention. The
データ入力部11には、各データ項目(例えば、キーワード)を含む記述データ(例えば、文書)に関する、順序付けられた項目に対応するデータ(例えば、数値データ)が入力される。データ入力部11には、例えば、図2(A)に示すような年次発表データが入力される。図2(A)に示す年次発表データは、例えば、キーワードの一つであるA大学については、第3年次に1件、第4年次に5件、第6年次に10件、第7年次に1件の文書発表があり、B大学については、第1年次に5件、第2年次に3件、第3年次に10件、第8年次に1件の文書発表があり、Cシステムズについては、第4年次に2件、第7年次に4件、第8年次に12件、第9年次に5件、第10年次に13件の文書発表があったことを示している。 The
また、例えば、データ入力部11には、図2(B)に示すようなデータが入力される。図2(B)に示すデータは、例えば、各研究機関の、各年次の文書発表の有無を示しており、例えば、データ「有」が格納された年次には文書発表があり、データ「無」が格納された年次には、文書発表が無かったことを示している。 For example, data as shown in FIG. 2B is input to the
なお、本発明の実施の形態においては、データ入力部11に書誌データが入力され、データ入力部11が、入力された書誌データに基づいて、各データ項目(例えば、キーワード)を含む記述データ(例えば、文書)に関する、順序付けられた項目に対応するデータ(例えば、個々のキーワードを含む文書の各年次の発表件数のデータ(年次発表データ))を作成し、出力する構成を採ることもできる。 In the embodiment of the present invention, bibliographic data is input to the
基準値算出部12は、データ入力部11から出力された、各データ項目を含む記述データ(例えば、文書)に関する、順序付けられた項目に対応するデータに基づいて、出力されたデータをソートする基準となる値である基準値を各データ項目毎に算出する。基準値の算出例については、後述する。 The reference
データソート部13は、基準値算出部12によって算出された基準値に基づいて、各データ項目を含む記述データ(例えば、文書)に関する、順序付けられた項目に対応するデータをソートする。データソート部13は、例えば、基準値について昇順(小さい順)または降順(大きい順)に各データ項目についての、順序付けられた項目に対応するデータ(例えば年次発表データ)をソートする。 Based on the reference value calculated by the reference
データ表示部14は、データソート部13によってソートされたデータに基づいて、表示対象となるデータ(表示データ)を作成し、表示データを表示する。 The
データ入力部11は、例えば、図1に示すように、データ蓄積手段111、データ項目抽出手段112、データ作成手段113を備える構成を採ることができる。データ蓄積手段111は、入力された書誌データを蓄積する。データ項目抽出手段112は、蓄積された書誌データからデータ項目(例えば、キーワード)を抽出する。データ作成手段113は、書誌データと抽出されたデータ項目とに基づいて、各データ項目を含む記述データ(例えば、文書)に関する、順序付けられた項目に対応するデータを作成する。例えば、例えば上述した図2(A)に示すような年次発表データを作成し、出力する。 For example, as shown in FIG. 1, the
なお、本発明の実施の形態においては、データ入力部11は、データ項目抽出手段112及びデータ作成手段113を備えることなく、データ蓄積手段111に入力された、各データ項目(例えば、キーワード)を含む記述データ(例えば、文書)に関する、順序付けられた項目に対応するデータ(例えば年次発表データ)を出力するという構成を採ることもできる。 In the embodiment of the present invention, the
データ表示部14は、表示データ作成手段141とデータ表示手段142とを備える。表示データ作成手段141は、データソート部13によってソートされた各データ項目についての、順序付けられた項目に対応するデータ(例えば年次発表データ)に基づいて、表示対象となる表示データを作成する。データ表示手段142は、表示データ作成手段141によって作成された表示データを画面表示する。 The
図3は、本発明の第1の実施の形態におけるデータ表示処理フローの一例を示す図である。図3では、データ入力部11に、各データ項目を含む記述データに関する、順序付けられた項目に対応するデータとして、例えば、各キーワードについての年次発表データが入力される場合の処理フローを示している。 FIG. 3 is a diagram showing an example of a data display processing flow in the first embodiment of the present invention. FIG. 3 shows a processing flow when, for example, annual announcement data for each keyword is input to the
まず、データ入力部11に年次発表データが入力される(ステップS1)。例えば、図2(A)に示すような各キーワード(図2(A)では各研究機関)についての年次発表データが入力される。 First, annual announcement data is input to the data input unit 11 (step S1). For example, annual presentation data for each keyword (each research institution in FIG. 2A) as shown in FIG. 2A is input.
次に、基準値算出部12が、入力された年次発表データに基づいて、各キーワードについての基準値を算出する(ステップS2)。例えば、発表される年次の平均値と最頻値と中央値を求めてそれらの平均の値を基準値として算出する。ここで、発表される年次の平均値とは、例えば、発表される年次に発表件数を乗じた値の合計値を、発表件数の合計値で割った値である。例えば、図2(A)において、A大学については、第3年次に1件、第4年次に5件、第6年次に10件、第7年次に1件の文書発表があるため、発表される年次の平均値は、(3×1+4×5+6×10+7×1)/17=5.29となる。 Next, the reference
また、発表される年次の最頻値は、発表件数の最も多い年次の値であり、例えば、A大学については、発表件数が最も多い「10」である年次(第6年次)の値「6」である。また、発表される年次の中央値は、発表件数のデータのうち、中央のデータが属する年次の値である。例えば、A大学については、1〜17までの発表件数のデータのうち、中央のデータである第9番目のデータが属する年次(第6年次)の値「6」である。 In addition, the mode value of the year to be announced is the value of the year with the largest number of presentations. For example, for University A, the year with the highest number of presentations of “10” (6th year) The value is “6”. Moreover, the median value of the year to be announced is the year value to which the central data belongs among the data of the number of announcements. For example, for University A, the value (6) of the year (sixth year) to which the ninth data that is the central data among the data of the number of presentations from 1 to 17 belongs.
従って、例えば、A大学についての基準値は、(5.29+6+6)/3=5.76と算出される。 Therefore, for example, the reference value for University A is calculated as (5.29 + 6 + 6) /3=5.76.
もちろん、本発明の実施の形態においては、基準値の算出方法は、上述した方法に限られるものではなく、例えば、算出された、発表される年次の平均値、最頻値、中央値のそれぞれをそのまま基準値として用いてもよいし、発表される年次の平均値、最頻値、中央値を任意に組み合わせて用いて、所定の算出方法に基づいて、基準値を算出してもよい。 Of course, in the embodiment of the present invention, the calculation method of the reference value is not limited to the above-described method. For example, the calculated average value of the published year, the mode value, and the median value are calculated. Each of them may be used as a reference value as it is, or a standard value may be calculated based on a predetermined calculation method using an arbitrary combination of an average value, a mode value, and a median value for each year. Good.
また、本発明の実施の形態においては、データ入力部11に入力される、順序付けられた項目(例えば、年次)に対応するデータは、数値データに限られるものではなく、入力されるデータは、例えば言語表現であってもよい。すなわち上記ステップS1において、データ入力部11に図2(A)に示す年次発表データの代わりに図2(B)に示すデータが入力された場合には、上記ステップS2において、例えば以下のようにして基準値を算出する。すなわち、図2(B)において、言語表現「有」が格納されている年次については、発表件数を「1」とし、言語表現「無」が格納されている年次については、発表件数を「0」として、発表される年次の平均値と最頻値と中央値を求め、それらの平均の値を基準値として算出する。 In the embodiment of the present invention, the data corresponding to the ordered items (for example, annual) input to the
もちろん、本発明の実施の形態においては、順序付けられた項目(例えば、年次)に対応するデータとして入力された各言語表現を、予め決められた、各言語表現に対応付けられた数値に変換し、変換後の数値を用いて基準値を算出する構成を採ることもできる。 Of course, in the embodiment of the present invention, each language expression input as data corresponding to an ordered item (for example, annual) is converted into a predetermined numerical value associated with each language expression. In addition, it is possible to adopt a configuration in which the reference value is calculated using the converted numerical value.
次に、データソート部13が、算出された基準値に基づいて、各キーワードについての年次発表データをソートする(ステップS3)。例えば、データソート部13は、各キーワードについての年次発表データを、基準値について昇順にソートする。なお、データソート部13は、算出された基準値に基づいて、各キーワードについての年次発表データを降順にソートしてもよい。 Next, the
次に、データ表示部14が、ソートされた年次発表データに基づいて、表示データを作成し、作成した表示データを画面表示する(ステップS4)。データ表示部14は、例えば、各研究機関の各年次における発表件数のデータを等高線データに変換し、例えば図4に示すように、各研究機関の各年次における論文誌での発表件数のデータが等高線表示される画面を表示する。発表件数の度合いによって等高線の表示色が異なっている。また、データ表示部14は、例えば図5に示すように、各研究機関の各年次における年次大会での発表件数のデータを等高線表示する。 Next, the
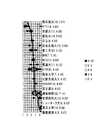
図4に示す画面表示例では、早い年次に多く文献を発表している研究機関ほど上の方に表示される。また、本発明の実施の形態においては、図4に示すように、データ表示部14は、各キーワードについての年次発表データに発表件数の合計値と基準値が併記される形式で、表示データを画面表示してもよい。例えば、図4中の横浜国立大については、発表件数が10で、基準値が3.37であることを示す記述(10,3.37)が、研究機関名「横浜国立大」の横に併記される。 In the screen display example shown in FIG. 4, a research institution that has published many documents in the early years is displayed in the upper part. Further, in the embodiment of the present invention, as shown in FIG. 4, the
図4を見ると、例えば、論文誌ではATR、通信総研が発表件数が多い。また、図5を見ると、年次大会ではNTT、ATR、東工大、通信総研、東京大学の発表件数が多いことがわかる。また、NTT、ATRは早い年次から多くの発表をしているが、通信総研と東京大学は10年の年次の中では比較的後ろの方の年次で多くの発表をしていることがわかる。通信総研と東京大学は、発表件数が増加傾向にあることが読み取れ、今後も発表件数が増加することが予測される。その他の組織についてもどの年次で多く発表しているかは、図4や図5を参照することで容易に知ることができる。 As shown in FIG. 4, for example, ATR and Communications Research Institute have many publications in journals. FIG. 5 shows that there are many presentations from NTT, ATR, Tokyo Institute of Technology, Communications Research Laboratory, and the University of Tokyo at the annual conference. In addition, NTT and ATR have made many announcements from the early years, but the Communications Research Institute and the University of Tokyo have made many announcements in the relatively later years of the 10th year. I understand. Communications Research Institute and the University of Tokyo can be seen that the number of presentations is on the rise, and the number of presentations is expected to increase in the future. It can be easily understood by referring to FIG. 4 and FIG.
本発明の実施の形態においては、上記ステップS4において、データ表示部14が、例えば、各キーワードの各年次における発表件数のデータを等高線データに変換するとともに、各キーワードについての基準値をプロットした折れ線データを作成して、図6に示すように、各キーワードの各年次における発表件数の等高線データと、太い折れ線で示す各キーワードについての基準値についての折れ線データとを、同一画面上に表示するような構成を採ることもできる。 In the embodiment of the present invention, in step S4, the
なお、本発明の実施の形態においては、上記ステップS4において、データ表示部14が、例えば、各キーワードの各年次における発表件数のデータを折れ線データに変換し、図7(A)に示すように、各キーワードの各年次における発表件数が折れ線表示される画面を表示する構成を採ることもできる。もちろん、本発明の実施の形態においては、図7(B)に示すように、各キーワードの各年次における発表件数の折れ線データと、図中の太い折れ線で示す、各キーワードの基準値についての折れ線データとを、同一画面上に表示するような構成を採ることもできる。 In the embodiment of the present invention, in step S4, the
また、本発明の実施の形態においては、例えば、上記ステップS4において、データ表示部14が、例えば、各キーワードの各年次における発表件数のデータを、図7(C)に示すようなバブルチャートとして画面表示する構成を採ることもできる。なお、バブルチャートとは、一般に、ある事象を表す円(バブル)を2つの軸を持つ図上に配置した図のことを言う。図7(C)に示すバブルチャートでは、円の大きさが発表件数の度合いを示している。もちろん、本発明の実施の形態においては、バブルチャート上に、各キーワードの基準値についての折れ線データを、各キーワードの各年次における発表件数のデータとともに画面表示するような構成を採ることもできる。 In the embodiment of the present invention, for example, in step S4, the
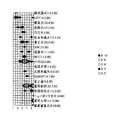
以下に、様々な表示データの画面表示例について説明する。図8は、乱数を生成して、論文誌における年次発表データをランダムに並び替えた場合の、表示データの画面表示例を示す図である。図8に示す画面表示例では、どの研究機関が早い年次に偏って文書を発表しているか、また、どの研究機関が遅い年次に偏って文書を発表しているかについて、一見して把握することは困難である。 Hereinafter, examples of screen display of various display data will be described. FIG. 8 is a diagram illustrating a screen display example of display data when random numbers are generated and the annual publication data in the journal is rearranged randomly. In the screen display example shown in Fig. 8, it is possible to grasp at a glance which research institutes are publishing documents with bias toward early years and which research institutes are publishing documents with bias toward later years. It is difficult to do.
図9は、論文誌についての年次発表データを発表件数の多い順にソートした場合の、表示データの画面表示例を示す図である。図9に示す画面表示例では、どの研究機関の文書の発表が多いかを考察するには便利であるが、どの研究機関が早い年次に偏って文書を発表しているか、また、どの研究機関が遅い年次に偏って文書を発表しているかについて把握することは困難である。 FIG. 9 is a diagram illustrating a screen display example of display data when annual publication data for journals is sorted in descending order of the number of presentations. In the screen display example shown in FIG. 9, it is convenient to consider which research institution's documents are published frequently, but which research institution is publishing documents in an early year, and which research It is difficult to know if an institution is publishing a document that is biased towards a later year.
図10は、論文誌についての年次発表データを研究機関名のEUCコード順にソートした場合の、表示データの画面表示例を示す図である。図10に示す画面表示例では、まず、半角文字の研究機関名、次に、カタカナの研究機関名、そして、漢字の研究機関名の順に上から表示されている。なお、半角文字の研究機関、漢字の研究機関それぞれにおいても、EUCコードの若い順に表示される。図10に示す画面表示例によれば、例えば、特定の研究機関についてどの年次に文書の発表件数が多いかを考察するのには役立つが、それ以外の考察をする際には、見づらい表示となっている。 FIG. 10 is a diagram showing a screen display example of display data when annual publication data on journals is sorted in the order of EUC codes of research institution names. In the screen display example shown in FIG. 10, first, the name of the research institution of single-byte characters, then the name of the research institution of katakana, and the name of the research institution of kanji are displayed from the top. Note that the EUC codes are displayed in ascending order also at the research institutions for half-width characters and the research institutions for kanji. According to the screen display example shown in FIG. 10, for example, it is useful for considering which year the number of documents published for a particular research institution is high, but it is difficult to see when considering other than that. It has become.
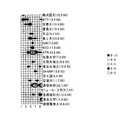
図11は、論文誌についての年次発表データを、発表される年次の平均値に基づいてソートした場合の、表示データの画面表示例を示す図である。図中、各研究機関名の横には、発表件数の合計値と発表される年次の平均値を示す記述が併記されている。例えば、横浜国立大についての発表件数の合計値は10、発表される年次の平均値は、4.60であることがわかる。図11に示す画面表示例は、ある程度、年次の早い時期に多く発表している研究機関はどれであるかについて考察するのに便利である。 FIG. 11 is a diagram illustrating a screen display example of display data when the annual publication data for the journals is sorted based on the average value of the published annual data. In the figure, next to each research institution name, a description indicating the total number of presentations and the average value of the published year is also written. For example, it can be seen that the total number of announcements for Yokohama National University is 10, and the average annual value is 4.60. The screen display example shown in FIG. 11 is useful for considering which research institutes are making many announcements at an early stage of the year.
図12は、論文誌についての年次発表データを、発表される年次の最頻値に基づいてソートした場合の、表示データの画面表示例を示す図である。図中、各研究機関名の横には、発表件数の合計値と発表される年次の最頻値を示す記述が併記されている。例えば、横浜国立大についての発表件数の合計値は10、発表される年次の最頻値は、2.00であることがわかる。図12に示す画面表示例は、ある程度、年次の早い時期に多く発表している研究機関はどれであるかについて考察するのに便利である。 FIG. 12 is a diagram illustrating a screen display example of display data when the annual publication data for the journals is sorted based on the published annual mode values. In the figure, next to each research institution name, a description indicating the total number of presentations and the annual mode value to be announced is also written. For example, it can be seen that the total number of announcements for Yokohama National University is 10, and the annual mode value to be announced is 2.00. The screen display example shown in FIG. 12 is useful for considering which research institutes are making many announcements at an early stage of the year.
図12に示す画面表示例では、各研究機関の最も等高線の高さが高い年次の値について昇順にデータが並べられていることから、図の見た目はよいと言える。しかし、各研究機関についての、発表される年次の最頻値を見てわかるように、同点の研究機関が多い。従って、同点の研究機関については、どの順に並び替えてもよいこととなる。よって、同点を避けようとすると、例えば、発表される年次の最頻値だけを使うのではなく、例えば、図4の画面表示例のように、最頻値と平均値と中央値とに基づいて算出される基準値について年次発表データを並び替えて表示するのがよいと言える。 In the screen display example shown in FIG. 12, since the data is arranged in ascending order for the yearly values with the highest contour lines of each research institution, it can be said that the figure looks good. However, as you can see from the published annual mode values for each research institution, there are many research institutions with the same score. Therefore, research institutions with the same score may be rearranged in any order. Therefore, when trying to avoid the same point, for example, instead of using only the annual mode value to be announced, for example, as shown in the screen display example of FIG. It can be said that it is better to sort and display the annual announcement data for the reference value calculated based on it.
図13は、論文誌についての年次発表データを、発表される年次の中央値に基づいてソートした場合の、表示データの画面表示例を示す図である。図中、各研究機関名の横には、発表件数の合計値と発表される年次の中央値を示す記述が併記されている。例えば、横浜国立大についての発表件数の合計値は10、発表される年次の中央値は、3.50であることがわかる。図13に示す画面表示例は、ある程度、年次の早い時期に多く発表している研究機関はどれであるかについて考察するのに便利である。 FIG. 13 is a diagram illustrating a screen display example of display data when the annual publication data for the journals is sorted based on the median of the published years. In the figure, next to the name of each research institution, a description indicating the total number of presentations and the median of the year of publication is also shown. For example, it can be seen that the total number of announcements for Yokohama National University is 10, and the median of the annual announcement is 3.50. The screen display example shown in FIG. 13 is useful for considering which research institutes are making many announcements at an early stage of the year to some extent.
しかし、各研究機関についての、発表される年次の中央値を見てわかるように、同点の研究機関が多い。従って、同点の研究機関については、どの順に並び替えてもよいこととなる。よって、同点を避けようとすると、例えば、発表される年次の中央値だけを使うのではなく、例えば、図4の画面表示例のように、最頻値と平均値と中央値とに基づいて算出される基準値について年次発表データを並び替えて表示するのがよいと言える。 However, as you can see from the annual median values published for each research institution, there are many research institutions with the same score. Therefore, research institutions with the same score may be rearranged in any order. Therefore, when trying to avoid the tie, for example, instead of using only the published annual median, for example, based on the mode, average, and median, as in the screen display example of FIG. It can be said that it is better to sort and display the annual announcement data for the reference value calculated in this way.
図14は、本発明の第2の実施の形態におけるデータ表示処理フローの一例を示す図である。第2の実施の形態においては、データ入力部11は、例えば、入力された、図15に示すような、発表された文書のタイトル、文書のテキスト内容、発表年次等のデータから構成される書誌データに基づいて、年次発表データを数値データとして作成し、出力する構成を採る。 FIG. 14 is a diagram showing an example of a data display processing flow in the second embodiment of the present invention. In the second embodiment, the
まず、データ入力部11に書誌データが入力される(ステップS11)。例えば、図15に示すような書誌データが入力される。次に、データ項目抽出手段112が、入力された書誌データからキーワードを抽出する(ステップS12)。 First, bibliographic data is input to the data input unit 11 (step S11). For example, bibliographic data as shown in FIG. 15 is input. Next, the data
キーワードの抽出には、例えば、公知の形態素解析ツールであるChasenを用いる。Chasenを用いれば、日本語文を分割し,さらに,各単語の品詞も推定することができる。Chasenを用いた日本語文の分割例を説明する。 For example, Chasen, which is a known morphological analysis tool, is used for keyword extraction. By using Chasen, it is possible to divide a Japanese sentence and further estimate the part of speech of each word. An example of dividing Japanese sentences using Chasen will be described.
例えば,「学校へ行く」を入力すると以下の結果を得る。 For example, the following result is obtained when "going to school" is entered.
学校 ガッコウ 学校 名詞- 一般
へ ヘ へ 助詞- 格助詞- 一般
行く イク 行く 動詞- 自立 五段・カ行促音便 基本形
EOS
各行に一個の単語が入るように分割され,各単語に読みや品詞の情報が付与される。School Gakkou School Noun-General
To He To Particles-Case Particles-General
Go Iku Go Verb-Independence
EOS
Each line is divided so that one word is included, and reading and part-of-speech information are given to each word.
なお、英語の品詞タグつけシステムとしては Brill(Transformation-Based Error-Driven Learning and Natural Language Processing: A Case Study in Part-of-Speech Tagging, Computational Linguistics, Vol. 21, No. 4, p.543-565, 1995.参照)のものが有名であり、英語文の各単語の品詞を推定することができる。 The English part-of-speech tagging system is Brill (Transformation-Based Error-Driven Learning and Natural Language Processing: A Case Study in Part-of-Speech Tagging, Computational Linguistics, Vol. 21, No. 4, p.543- 565, 1995.), and the part of speech of each word in an English sentence can be estimated.
本発明の実施の形態では、例えば、Chasenでタイトルを分割することによって得られる各形態素をキーワードとして抽出する。 In the embodiment of the present invention, for example, each morpheme obtained by dividing a title by Chasen is extracted as a keyword.
なお、例えば、本発明の実施の形態においては、Chasenでタイトルを分割することによって得られる各形態素のうち、書誌データ中に出現する回数が予め定めた閾値以上のものをキーワードとして抽出する構成を採ることもできる。 For example, in the embodiment of the present invention, a configuration is used in which each morpheme obtained by dividing a title with Chasen is extracted as a keyword when the number of appearances in the bibliographic data is equal to or greater than a predetermined threshold. It can also be taken.
次に、データ作成手段113が、抽出されたキーワードと書誌データとに基づいて、年次発表データを作成し、出力する(ステップS13)。ステップS13においては、例えば、タイトルに、ステップS12において抽出されたキーワードを含む文書の各年次の発表件数のデータを、そのキーワードについての年次発表データとして作成する。 Next, the
次に、基準値算出部12が、年次発表データに基づいて、各キーワードについての基準値を算出する(ステップS14)。そして、データソート部13が、算出された基準値に基づいて、各キーワードについての年次発表データをソートする(ステップS15)。 Next, the reference
そして、データ表示部14が、ソートされた年次発表データに基づいて、表示データを作成し、作成した表示データを画面表示する(ステップS16)。 Then, the
図16は、上記ステップS12において抽出したキーワードが各研究分野である場合の、論文誌についての表示データの画面表示例を示している。図17と図18は、年次大会についての画面表示例を示している。表示データの等高線の高さは、図16の画面表示例では発表件数を、図17と図18の画面表示例では、発表件数に1を加えたものの底が2の対数を示す。 FIG. 16 shows a screen display example of display data for a journal in the case where the keyword extracted in step S12 is each research field. 17 and 18 show screen display examples for the annual competition. The height of the contour lines of the display data indicates the number of presentations in the screen display example of FIG. 16, and the logarithm of 2 in the bottom of the number of presentations added by 1 in the screen display examples of FIGS.
図16に示すように、論文誌については、「動詞」、「名詞」、「解消」、「確率」、「コーパス」、「多義」などが上の方に表示され、これらの研究分野についての発表が早い年次に盛んであったことがわかる。「形態素」、「係り」、「対話」、「音声」についての発表は6年次に盛んであること、「要約」、「検索」、「翻訳」などについての発表が遅い年次で盛んになったこともわかる。特に「要約」は6年次と9年次でそれの特集号が出たためそのときに偏って多く出現している。「翻訳」は増加傾向にあることがうかがえ、今後も発表件数が増加することが予測される。 As shown in FIG. 16, for the journals, “verb”, “noun”, “elimination”, “probability”, “corpus”, “ambiguity”, etc. are displayed in the upper part. It can be seen that the announcements were thriving in the early years. Presentations on “morpheme”, “involvement”, “dialogue”, and “speech” are flourishing in the 6th year, and announcements on “summary”, “search”, “translation”, etc. are flourishing in later years You can also see that In particular, “summary” has appeared in particular in the 6th and 9th years, and many of them have appeared in that time. It seems that “translation” is on the rise, and the number of presentations is expected to increase in the future.
また、図17に示すように、年次大会では「対訳」、「形態素」、「確率」、「辞書」、「統計」などについての発表が早い年次で盛んであったことがわかる。また,図18を見ると、「検索」、「要約」、「質問」、「言い換え」などがあり,これらの研究分野についての発表が最近盛んになっていることがわかる。その他の研究分野についても、どの年次で多く研究されているかは、図16〜図18を参照することで容易に知ることができる。 In addition, as shown in FIG. 17, it can be seen that in the annual convention, the presentation of “translation”, “morpheme”, “probability”, “dictionary”, “statistics”, etc. was popular early in the year. Also, FIG. 18 shows that there are “search”, “summary”, “question”, “paraphrase”, and the like. With regard to other research fields, it can be easily understood by referring to FIGS.
また、本発明の実施の形態では、例えば、予め決めたあるキーワードを含む書誌データを用いて、年次発表データを作成する構成を採ることもできる。例として翻訳の研究動向を詳しく調べることとし、年次大会で発表された書誌データのうち、翻訳をタイトルに含むデータのみを用いて、本発明を適用した。その結果を図19と図20に示す。図の標高線の高さは発表件数を意味する。図19に示すように、NTTは過去に、ATRは最近翻訳の研究が多いことがわかる。 Further, in the embodiment of the present invention, for example, it is possible to adopt a configuration in which annual publication data is created using bibliographic data including a predetermined keyword. For example, the research trend of translation was examined in detail, and the present invention was applied using only the data including the translation in the title among the bibliographic data presented at the annual conference. The results are shown in FIG. 19 and FIG. The height of the elevation line in the figure means the number of presentations. As shown in FIG. 19, it can be seen that there are many translation studies in the past for NTT and ATR for translation in recent years.
また、図20から、翻訳の研究は、過去は「意味」、「知識」、「辞書」を扱ったものが多かったが,最近は「支援」、「用例」、「検索」を扱ったものが多いことがわかる。 In addition, from Fig. 20, many translation studies dealt with "meaning", "knowledge", and "dictionary" in the past, but recently dealt with "support", "example", and "search". You can see that there are many.
なお、本発明は、コンピュータにより読み取られ実行されるプログラムとして実施することもできる。本発明を実現するプログラムは、コンピュータが読み取り可能な、可搬媒体メモリ、半導体メモリ、ハードディスクなどの適当な記録媒体に格納することができ、これらの記録媒体に記録して提供され、または、通信インタフェースを介してネットワークを利用した送受信により提供されるものである。 The present invention can also be implemented as a program that is read and executed by a computer. The program for realizing the present invention can be stored in an appropriate recording medium such as a portable medium memory, a semiconductor memory, or a hard disk, which can be read by a computer, provided by being recorded on these recording media, or communication. It is provided by transmission / reception using a network via an interface.
1 データ表示装置
11 データ入力部
12 基準値算出部
13 データソート部
14 データ表示部
111 データ蓄積手段
112 データ項目抽出手段
113 データ作成手段
141 表示データ作成手段
142 データ表示手段
DESCRIPTION OF
Claims (9)
Translated fromJapaneseデータ項目を含む記述データに関する、前記順序付けられた項目に対応するデータが入力されるデータ入力手段と、
前記入力された各データ項目を含む記述データに関するデータに基づいて、前記入力された各データ項目を含む記述データに関するデータをソートする基準となる値である基準値を前記各データ項目毎に算出する基準値算出手段と、
前記各データ項目を含む記述データに関するデータを前記算出された基準値について昇順または降順にソートするデータソート手段と、
前記ソートされたデータに基づいて、表示データを作成し、作成した表示データを画面表示するデータ表示手段とを備え、
前記基準値算出手段は、前記順序付けられた項目の順序の値の平均値と最頻値と中央値との平均の値を前記基準値として算出する
ことを特徴とするデータ表示装置。A data display device for displaying data corresponding to ordered items,
Data input means for inputting data corresponding to the ordered items with respect to descriptive data including data items;
Based on the data related to the description data including each input data item, a reference value, which is a reference value for sorting data related to the description data including each input data item, is calculated for each data item. A reference value calculating means;
Data sorting means for sorting data related to descriptive data including each data item in ascending or descending order with respect to the calculated reference value;
Based on the sorted data, display data is created, and data display means for displaying the created display data on the screen,
The reference value calculation means calculates the average value of the order values of the ordered items, the average value of the mode value, and the median value as the reference value .
データ項目を含む記述データに関する、前記順序付けられた項目に対応するデータが入力されるデータ入力手段と、
前記入力された各データ項目を含む記述データに関するデータに基づいて、前記入力された各データ項目を含む記述データに関するデータをソートする基準となる値である基準値を前記各データ項目毎に算出する基準値算出手段と、
前記各データ項目を含む記述データに関するデータを前記算出された基準値について昇順または降順にソートするデータソート手段と、
前記ソートされたデータに基づいて、表示データを作成し、作成した表示データを画面表示するデータ表示手段とを備え、
前記基準値算出手段は、前記順序付けられた項目の順序の値の平均値を前記基準値として算出する
ことを特徴とするデータ表示装置。A data display device for displaying data corresponding to ordered items,
Data input means for inputting data corresponding to the ordered items with respect to descriptive data including data items;
Based on the data related to the description data including each input data item, a reference value, which is a reference value for sorting the data related to the description data including each input data item, is calculated for each data item. A reference value calculating means;
Data sorting means for sorting data related to descriptive data including each data item in ascending or descending order with respect to the calculated reference value;
Based on the sorted data, display data is created, and data display means for displaying the created display data on the screen,
The data display apparatus accordingto claim 1,wherein the reference value calculation means calculates an average value of the order values of the ordered items as the reference value .
データ項目を含む記述データに関する、前記順序付けられた項目に対応するデータが入力されるデータ入力手段と、
前記入力された各データ項目を含む記述データに関するデータに基づいて、前記入力された各データ項目を含む記述データに関するデータをソートする基準となる値である基準値を前記各データ項目毎に算出する基準値算出手段と、
前記各データ項目を含む記述データに関するデータを前記算出された基準値について昇順または降順にソートするデータソート手段と、
前記ソートされたデータに基づいて、表示データを作成し、作成した表示データを画面表示するデータ表示手段とを備え、
前記基準値算出手段は、前記順序付けられた項目の順序の値の最頻値を前記基準値として算出する
ことを特徴とするデータ表示装置。A data display device for displaying data corresponding to ordered items,
Data input means for inputting data corresponding to the ordered items with respect to descriptive data including data items;
Based on the data related to the description data including each input data item, a reference value, which is a reference value for sorting the data related to the description data including each input data item, is calculated for each data item. A reference value calculating means;
Data sorting means for sorting data related to descriptive data including each data item in ascending or descending order with respect to the calculated reference value;
Based on the sorted data, display data is created, and data display means for displaying the created display data on the screen,
The data display device,wherein the reference value calculation means calculates a mode value of the order values of the ordered items as the reference value .
データ項目を含む記述データに関する、前記順序付けられた項目に対応するデータが入力されるデータ入力手段と、
前記入力された各データ項目を含む記述データに関するデータに基づいて、前記入力された各データ項目を含む記述データに関するデータをソートする基準となる値である基準値を前記各データ項目毎に算出する基準値算出手段と、
前記各データ項目を含む記述データに関するデータを前記算出された基準値について昇順または降順にソートするデータソート手段と、
前記ソートされたデータに基づいて、表示データを作成し、作成した表示データを画面表示するデータ表示手段とを備え、
前記基準値算出手段は、前記順序付けられた項目の順序の値の中央値を前記基準値として算出する
ことを特徴とするデータ表示装置。A data display device for displaying data corresponding to ordered items,
Data input means for inputting data corresponding to the ordered items with respect to descriptive data including data items;
Based on the data related to the description data including each input data item, a reference value, which is a reference value for sorting data related to the description data including each input data item, is calculated for each data item. A reference value calculating means;
Data sorting means for sorting data related to descriptive data including each data item in ascending or descending order with respect to the calculated reference value;
Based on the sorted data, display data is created, and data display means for displaying the created display data on the screen,
The data display device,wherein the reference value calculation means calculates a median value of the order values of the ordered items as the reference value .
前記データ表示手段は、前記各データ項目毎に算出された基準値をプロットしたデータを、前記表示データの一部として画面表示する
ことを特徴とするデータ表示装置。The data display device according to any one of claims 1 to4 ,
The data display device displays the data obtained by plotting the reference value calculated for each data item on the screen as a part of the display data.
前記データ表示手段は、さらに、前記表示データに前記各データ項目毎に算出された基準値が併記される形式で、前記表示データを画面表示する
ことを特徴とするデータ表示装置。The data display device according to any one of claims 1 to5 ,
The data display device further displays the display data on a screen in a format in which a reference value calculated for each data item is written together with the display data.
前記データ入力手段は、
入力された書誌データを蓄積するデータ蓄積手段と、
前記蓄積された書誌データからデータ項目を抽出するデータ項目抽出手段と、
前記抽出されたデータ項目と前記書誌データとに基づいて、各データ項目を含む記述データに関する、前記順序付けられた項目に対応するデータを作成するデータ作成手段とを備え、
前記基準値算出手段は、前記作成された各データ項目を含む記述データに関するデータに基づいて、前記各データ項目を含む記述データに関するデータをソートする基準となる値である基準値を前記各データ項目毎に算出する
ことを特徴とするデータ表示装置。The data display device according to any one of claims 1 to6 ,
The data input means includes
Data storage means for storing the input bibliographic data;
Data item extracting means for extracting data items from the accumulated bibliographic data;
Data creation means for creating data corresponding to the ordered items, with respect to descriptive data including each data item, based on the extracted data items and the bibliographic data;
The reference value calculation means sets a reference value, which is a reference value for sorting data related to the description data including the data items, based on the data related to the description data including the created data items. A data display device characterized by being calculated every time.
データ項目を含む記述データに関する、前記順序付けられた項目に対応するデータを入力するステップと、
前記入力された各データ項目を含む記述データに関するデータに基づいて、前記入力された各データ項目を含む記述データに関するデータをソートする基準となる値である基準値を前記各データ項目毎に算出する場合、前記基準値を前記順序付けられた項目の順序の値の平均値と最頻値と中央値との平均の値を前記基準値として算出するステップと、
前記各データ項目を含む記述データに関するデータを前記算出された基準値について昇順または降順にソートするステップと、
前記ソートされたデータに基づいて、表示データを作成し、作成した表示データを画面表示するステップとを有する
ことを特徴とするデータ表示方法。A data display method for displaying data corresponding to ordered items,
Inputting data corresponding to the ordered items for descriptive data including data items;
Based on the data related to the description data including each input data item, a reference value, which is a reference value for sorting data related to the description data including each input data item, is calculated for each data item.And calculating the average value of the order values of the ordered items, the average value of the mode value, and the median value as the reference value .
Sorting data related to descriptive data including each data item in ascending or descending order with respect to the calculated reference value;
And a step of creating display data based on the sorted data and displaying the created display data on a screen.
前記コンピュータを、
データ項目を含む記述データに関する、前記順序付けられた項目に対応するデータが入力されるデータ入力手段と、
前記入力された各データ項目を含む記述データに関するデータに基づいて、前記入力された各データ項目を含む記述データに関するデータをソートする基準となる値である基準値を前記各データ項目毎に算出する場合、前記基準値を前記順序付けられた項目の順序の値の平均値と最頻値と中央値との平均の値を前記基準値として算出する基準値算出手段と、
前記各データ項目を含む記述データに関するデータを前記算出された基準値について昇順または降順にソートするデータソート手段と、
前記ソートされたデータに基づいて、表示データを作成し、作成した表示データを画面表示するデータ表示手段として機能させるためのデータ表示プログラム。A program for causing a computer included in a data display device to display data corresponding to ordered items to be executed,
The computer,
Data input means for inputting data corresponding to the ordered items with respect to descriptive data including data items;
Based on the data related to the description data including each input data item, a reference value, which is a reference value for sorting the data related to the description data including each input data item, is calculated for each data item.A reference value calculation meansfor calculating an average value of the order value of the ordered items, a mode value, and an average value of the median value as the reference value;
Data sorting means for sorting data related to descriptive data including each data item in ascending or descending order with respect to the calculated reference value;
A data display program for creating display data based on the sorted data and causing the display data thus created to function as data display means for screen display.
Priority Applications (2)
| Application Number | Priority Date | Filing Date | Title |
|---|---|---|---|
| JP2005266410AJP4647442B2 (en) | 2005-09-14 | 2005-09-14 | Data display device, data display method, and data display program |
| US11/373,487US20070061323A1 (en) | 2005-09-14 | 2006-03-13 | Apparatus and method for displaying data, and program thereof |
Applications Claiming Priority (1)
| Application Number | Priority Date | Filing Date | Title |
|---|---|---|---|
| JP2005266410AJP4647442B2 (en) | 2005-09-14 | 2005-09-14 | Data display device, data display method, and data display program |
Publications (2)
| Publication Number | Publication Date |
|---|---|
| JP2007079899A JP2007079899A (en) | 2007-03-29 |
| JP4647442B2true JP4647442B2 (en) | 2011-03-09 |
Family
ID=37856521
Family Applications (1)
| Application Number | Title | Priority Date | Filing Date |
|---|---|---|---|
| JP2005266410AExpired - Fee RelatedJP4647442B2 (en) | 2005-09-14 | 2005-09-14 | Data display device, data display method, and data display program |
Country Status (2)
| Country | Link |
|---|---|
| US (1) | US20070061323A1 (en) |
| JP (1) | JP4647442B2 (en) |
Families Citing this family (1)
| Publication number | Priority date | Publication date | Assignee | Title |
|---|---|---|---|---|
| CN105183805B (en)* | 2015-08-26 | 2018-05-25 | 上海银赛计算机科技有限公司 | Method for displaying image and device |
Family Cites Families (17)
| Publication number | Priority date | Publication date | Assignee | Title |
|---|---|---|---|---|
| US5991751A (en)* | 1997-06-02 | 1999-11-23 | Smartpatents, Inc. | System, method, and computer program product for patent-centric and group-oriented data processing |
| JPH07182356A (en)* | 1993-12-22 | 1995-07-21 | Nippon Steel Corp | Technical information management method |
| JP2729356B2 (en)* | 1994-09-01 | 1998-03-18 | 日本アイ・ビー・エム株式会社 | Information retrieval system and method |
| US5825286A (en)* | 1995-05-08 | 1998-10-20 | Semisystems, Inc. | Vehicular data collection and transmission system and method |
| EP0935206A3 (en)* | 1996-07-18 | 2000-01-19 | Matsushita Electric Industrial Co., Ltd. | Data retrieval support apparatus, data retrieval support method and medium storing data retrieval support program |
| JP3816612B2 (en)* | 1997-01-14 | 2006-08-30 | 富士通株式会社 | Network management device |
| US6003018A (en)* | 1998-03-27 | 1999-12-14 | Michaud Partners Llp | Portfolio optimization by means of resampled efficient frontiers |
| JP2000132553A (en)* | 1998-10-22 | 2000-05-12 | Sharp Corp | Keyword extraction method, keyword extraction device, and computer-readable recording medium recording keyword extraction program |
| US6275229B1 (en)* | 1999-05-11 | 2001-08-14 | Manning & Napier Information Services | Computer user interface for graphical analysis of information using multiple attributes |
| JP2000348041A (en)* | 1999-06-03 | 2000-12-15 | Nec Corp | Document retrieval method, device therefor and mechanically readable recording medium |
| US6611833B1 (en)* | 1999-06-23 | 2003-08-26 | Tissueinformatics, Inc. | Methods for profiling and classifying tissue using a database that includes indices representative of a tissue population |
| US6489968B1 (en)* | 1999-11-18 | 2002-12-03 | Amazon.Com, Inc. | System and method for exposing popular categories of browse tree |
| US6754660B1 (en)* | 1999-11-30 | 2004-06-22 | International Business Machines Corp. | Arrangement of information for display into a continuum ranging from closely related to distantly related to a reference piece of information |
| US7194405B2 (en)* | 2000-04-12 | 2007-03-20 | Activepoint Ltd. | Method for presenting a natural language comparison of items |
| US7130848B2 (en)* | 2000-08-09 | 2006-10-31 | Gary Martin Oosta | Methods for document indexing and analysis |
| US6704742B1 (en)* | 2001-07-03 | 2004-03-09 | Johnson Controls Technology Company | Database management method and apparatus |
| JP4072418B2 (en)* | 2002-10-29 | 2008-04-09 | キヤノン株式会社 | Information input system, mobile terminal, information input method in mobile terminal, information server, method in which information server supports input operation of mobile terminal, computer program |
- 2005
- 2005-09-14JPJP2005266410Apatent/JP4647442B2/ennot_activeExpired - Fee Related
- 2006
- 2006-03-13USUS11/373,487patent/US20070061323A1/ennot_activeAbandoned
Also Published As
| Publication number | Publication date |
|---|---|
| JP2007079899A (en) | 2007-03-29 |
| US20070061323A1 (en) | 2007-03-15 |
Similar Documents
| Publication | Publication Date | Title |
|---|---|---|
| Strobelt et al. | Document cards: A top trumps visualization for documents | |
| JP5587821B2 (en) | Document topic extraction apparatus, method, and program | |
| Mustafa et al. | Kurdish stemmer pre-processing steps for improving information retrieval | |
| Wynne | Searching and concordancing | |
| Shakir et al. | A multidimensional analysis of Pakistani and US English blogs and columns | |
| Viola et al. | From Digitized Sources to Digital Data: Behind the Scences of (Critically) Enriching a Digital Heritage Collection. | |
| Rohimajaya et al. | An Analysis of the Appraisal Framework" What the Pandemic Teaches us" in the Newspaper of the Jakarta Post | |
| WO2010103916A1 (en) | Device for presentation of characteristic words in document and program giving priority of characteristic words | |
| JP4647442B2 (en) | Data display device, data display method, and data display program | |
| JP4831737B2 (en) | Keyword emphasis device and program | |
| JP4719921B2 (en) | Data display device and data display program | |
| Ali et al. | Reporting local cultures in the globalised world: how indigenised can English be in the free world? | |
| Unser-Schutz | Developing a text-based corpus of the language of Japanese comics (manga). | |
| Leidecker-Sandmann et al. | More than humanoid robots and cyborgs? How German print media visualize articles on artificial intelligence | |
| Vela et al. | Querying multi-layer annotation and alignment in translation corpora | |
| Cailliau et al. | Enhanced search and navigation on conversational speech | |
| Thanadechteemapat et al. | Thai word segmentation for visualization of thai web sites | |
| Cheatle | Networked (writing) centers: Utilizing online visualization tools on large multi-institutional data sets | |
| JP7553314B2 (en) | Estimation device, estimation method, and program | |
| Vetter | 3 Comparing Approaches to (Sub-) Register Variation | |
| JP4907927B2 (en) | Data display device, data display method, and data display program | |
| Chen | A Generic Analysis of English Research Article Abstracts and the Use of Modal Verbs for Financial Economics. | |
| Amitay | What lays in the layout | |
| Rusten | From Grimm to Ngrams: English Historical Linguistics in the Digital Age | |
| JP4248828B2 (en) | Document processing apparatus, document processing method, and recording medium |
Legal Events
| Date | Code | Title | Description |
|---|---|---|---|
| A621 | Written request for application examination | Free format text:JAPANESE INTERMEDIATE CODE: A621 Effective date:20080801 | |
| RD03 | Notification of appointment of power of attorney | Free format text:JAPANESE INTERMEDIATE CODE: A7423 Effective date:20090428 | |
| RD04 | Notification of resignation of power of attorney | Free format text:JAPANESE INTERMEDIATE CODE: A7424 Effective date:20090428 | |
| A131 | Notification of reasons for refusal | Free format text:JAPANESE INTERMEDIATE CODE: A131 Effective date:20100824 | |
| A521 | Request for written amendment filed | Free format text:JAPANESE INTERMEDIATE CODE: A523 Effective date:20101015 | |
| TRDD | Decision of grant or rejection written | ||
| A01 | Written decision to grant a patent or to grant a registration (utility model) | Free format text:JAPANESE INTERMEDIATE CODE: A01 Effective date:20101207 | |
| A01 | Written decision to grant a patent or to grant a registration (utility model) | Free format text:JAPANESE INTERMEDIATE CODE: A01 | |
| A61 | First payment of annual fees (during grant procedure) | Free format text:JAPANESE INTERMEDIATE CODE: A61 Effective date:20101208 | |
| FPAY | Renewal fee payment (event date is renewal date of database) | Free format text:PAYMENT UNTIL: 20131217 Year of fee payment:3 | |
| R150 | Certificate of patent or registration of utility model | Free format text:JAPANESE INTERMEDIATE CODE: R150 | |
| R250 | Receipt of annual fees | Free format text:JAPANESE INTERMEDIATE CODE: R250 | |
| R250 | Receipt of annual fees | Free format text:JAPANESE INTERMEDIATE CODE: R250 | |
| S533 | Written request for registration of change of name | Free format text:JAPANESE INTERMEDIATE CODE: R313533 | |
| R350 | Written notification of registration of transfer | Free format text:JAPANESE INTERMEDIATE CODE: R350 | |
| R250 | Receipt of annual fees | Free format text:JAPANESE INTERMEDIATE CODE: R250 | |
| LAPS | Cancellation because of no payment of annual fees |