JP4537152B2 - Method for providing a visualization graph on a computer, and computer, user terminal, computer program and storage medium for providing a visualization graph - Google Patents
Method for providing a visualization graph on a computer, and computer, user terminal, computer program and storage medium for providing a visualization graphDownload PDFInfo
- Publication number
- JP4537152B2 JP4537152B2JP2004246057AJP2004246057AJP4537152B2JP 4537152 B2JP4537152 B2JP 4537152B2JP 2004246057 AJP2004246057 AJP 2004246057AJP 2004246057 AJP2004246057 AJP 2004246057AJP 4537152 B2JP4537152 B2JP 4537152B2
- Authority
- JP
- Japan
- Prior art keywords
- display
- entity
- visualization graph
- entities
- group node
- Prior art date
- Legal status (The legal status is an assumption and is not a legal conclusion. Google has not performed a legal analysis and makes no representation as to the accuracy of the status listed.)
- Expired - Fee Related
Links
Images


Classifications
- G—PHYSICS
- G06—COMPUTING OR CALCULATING; COUNTING
- G06F—ELECTRIC DIGITAL DATA PROCESSING
- G06F16/00—Information retrieval; Database structures therefor; File system structures therefor
- G06F16/90—Details of database functions independent of the retrieved data types
- G06F16/903—Querying
- G06F16/9038—Presentation of query results
Landscapes
- Engineering & Computer Science (AREA)
- Databases & Information Systems (AREA)
- Theoretical Computer Science (AREA)
- Computational Linguistics (AREA)
- Data Mining & Analysis (AREA)
- Physics & Mathematics (AREA)
- General Engineering & Computer Science (AREA)
- General Physics & Mathematics (AREA)
- Information Retrieval, Db Structures And Fs Structures Therefor (AREA)
- User Interface Of Digital Computer (AREA)
- Digital Computer Display Output (AREA)
Description
Translated fromJapanese 本発明は、コンピュータ上で視覚化グラフを提供する方法、および視覚化グラフを提供
するコンピュータなどに関する。
The present invention relates to a method for providing a visualization graph on a computer, a computer for providing a visualization graph, and thelike .
視覚化グラフは、特定の条件に従って、データが処理され、表示装置上で表示されることを可能にするツールである。ナビゲーショングラフの主な目的は、(例えば、データベース内またはワールドワイドウェブ内の)エンティティの間の相互関係が複雑なシステムを表示することである。視覚化グラフは、出現するすべてのエンティティタイプを含む意味ネットに基づいていてもよく、前記意味ネットでは、考慮されるエンティティはさまざまな種類の関係によって相互に結び付けられている。視覚化グラフは、エンティティをボックスとして表し(前記ボックスは、前記グラフの「ノード」と呼ばれることが多い)、関係を、前記ボックス間の線として表す。グラフィカルレイアウトの問題を解決する一般的な方法は、物理的シミュレーションを適用することであり、前記物理的シミュレーションでは、すべてのエンティティが、相互に反発する質量として扱われ、前記関係は、接続されたエンティティを引き合わせようとする弾性線として扱われる。ボックスをダブルクリックすることにより、対応するエンティティに直接関係した(ただし、前記グラフにはまだ入っていない可能性がある)その他のエンティティ、およびそれらのエンティティと、前記グラフ内のその他のエンティティとの関係が含められる。一部の実装では、前記ダブルクリックされたエンティティは、次に、前記グラフの中央に移動し(そのエンティティは、「フォーカス」エンティティとなる)、前記エンティティからの距離(最短経路上の関係の数により測定される)が遠すぎる、その他のノードは、前記グラフから削除される。 A visualization graph is a tool that allows data to be processed and displayed on a display device according to specific conditions. The main purpose of the navigation graph is to display systems with complex interrelationships between entities (eg, in a database or the World Wide Web). The visualization graph may be based on a semantic net that includes all the entity types that appear, in which the considered entities are linked together by various kinds of relationships. A visualization graph represents entities as boxes (the boxes are often referred to as “nodes” of the graph) and relationships as lines between the boxes. A common way to solve the problem of graphical layout is to apply a physical simulation, where all entities are treated as repulsive masses, and the relationship is connected Treated as an elastic line that attempts to bring entities together. By double-clicking the box, other entities that are directly related to the corresponding entity (but may not yet be in the graph), and those entities and other entities in the graph Relationships are included. In some implementations, the double-clicked entity then moves to the center of the graph (the entity becomes the “focus” entity) and the distance from the entity (the number of relationships on the shortest path) Other nodes that are too far (measured by) are removed from the graph.
従来の視覚化グラフには、欠点があることが分かっている。従来の視覚化グラフの1つの問題は、前記グラフの変化が始動された場合(例えば、ノードに関連するさらなるエンティティを前記グラフ内に含めるために、前記ノードがダブルクリックされた場合)、従来の斥力ベースのシミュレーションアプローチでは(前記アプローチは非決定性である)、前記グループのエンティティのための場所を空ける際に問題が発生する。特に、第2のノードのすぐそばに配置されたノードが「展開された」場合、前記エンティティ間の斥力は非常に大きいため、システムは、収束するまでに、許容できないほど長い時間を要する。したがって、ユーザは、ナビゲーションが低速なグラフを使用しなければならなくなる。 Conventional visualization graphs have been found to have drawbacks. One problem with conventional visualization graphs is that when a change in the graph is triggered (eg, when the node is double-clicked to include additional entities associated with the node in the graph) In the repulsion-based simulation approach (the approach is non-deterministic), problems arise when making room for the group of entities. In particular, if a node located in the immediate vicinity of the second node is “deployed”, the repulsion between the entities is so great that the system takes an unacceptably long time to converge. Therefore, the user has to use a graph whose navigation is slow.
本発明の目的は、従来の視覚化グラフで発生するそれらの問題に対処することである。 The purpose of the present invention is to address those problems that occur with conventional visualization graphs.
特に、本発明の目的は、(例えば、グラフ内の、意味ネット内での)複雑な相互関係を、柔軟性のある方法で視覚化することにより、前記表示器が効率的な方法で使用されることを可能にすることである。 In particular, the object of the present invention is to use the indicator in an efficient manner by visualizing in a flexible way complex interrelationships (eg in graphs, in semantic nets). Is to make it possible.
本発明の第1の態様によれば、コンピュータ上で視覚化グラフを提供するための方法が提供され、前記方法は、
複数のエンティティに対応するデータを保存するステップと(ここで、意味ネットが、前記複数のエンティティを含み、そして、前記複数のエンティティは、複数の関係により相互に結び付けられている)、
前記複数のエンティティから選択された1つのエンティティに関するクエリに応答して、前記クエリの結果を表す視覚化グラフを提供するステップと、
共通の関係を有する複数のエンティティを、前記視覚化グラフ上の第1のノードとして表すステップと(所定の刺激に反応して、前記第1のノードにおいて含まれている前記複数のエンティティが表示され、そして、さらなる所定の刺激に反応して、表示されている前記複数のエンティティが前記ノードによって置き換えられるように、前記グラフが再構成される)を含む。ダブルクリックにより、そのようなグループを展開する(つまり、すべてのグループエンティティを、前記グラフ内の独立したノードとして表示する)可能性と、前記グループに再び戻す可能性とを提供することにより、関係を表すノード間のリンクは最小限に維持され、それにより、前記グラフ内のエネルギーは最適化される。さらに、ユーザにとって、前記グラフ内での定位がより容易になるため、前記グラフ内に表される情報のナビゲーションが向上する。According to a first aspect of the present invention there is provided a method for providing a visualization graph on a computer, said method comprising:
Storing data corresponding to a plurality of entities, wherein a semantic net includes the plurality of entities, and the plurality of entities are interconnected by a plurality of relationships;
Providing a visualization graph representing the results of the query in response to a query for one entity selected from the plurality of entities;
Representing a plurality of entities having a common relationship as a first node on the visualization graph (in response to a predetermined stimulus, the plurality of entities contained in the first node are displayed. And in response to further predetermined stimuli, the graph is reconfigured such that the displayed entities are replaced by the node). The relationship by providing the possibility of expanding such a group by double-clicking (ie displaying all group entities as independent nodes in the graph) and the possibility of returning to the group again The links between the nodes representing are kept to a minimum, so that the energy in the graph is optimized. Furthermore, since the localization in the graph becomes easier for the user, the navigation of the information represented in the graph is improved.
本発明の第2の態様によれば、視覚化グラフを提供するためのコンピュータが提供され、前記コンピュータは、
視覚化グラフを提供するために処理可能な、プロセッサ読み取り可能コードが内部に記録された、記憶媒体と、
複数のエンティティに対応するデータを保存するための、データベースと(ここで、意味ネットが、前記複数のエンティティを含み、そして、前記複数のエンティティは、複数の関係により相互に結び付けられている)、
前記複数のエンティティから選択された1つのエンティティに関するクエリに応答して、前記クエリの結果を表す視覚化グラフが提供されるように適合された、クエリインタフェースとを含み、
前記コードは、
共通の関係を有する複数のエンティティを、前記視覚化グラフ上のノードとして表し、所定の刺激に反応して、前記ノードにおいて含まれている前記複数のエンティティが表示されるようにし、そして、さらなる所定の刺激に反応して、表示されている前記複数のエンティティが前記ノードによって置き換えられるように、前記グラフが再構成されるようにするために処理可能な、レプリゼンテーションコードを含む。According to a second aspect of the invention, there is provided a computer for providing a visualization graph, the computer comprising:
A storage medium having processor readable code recorded therein that is processable to provide a visualization graph;
A database for storing data corresponding to a plurality of entities, wherein a semantic net includes the plurality of entities, and the plurality of entities are interconnected by a plurality of relationships;
A query interface adapted to provide a visualization graph representing the results of the query in response to a query for an entity selected from the plurality of entities;
The code is
A plurality of entities having a common relationship are represented as nodes on the visualization graph such that, in response to a predetermined stimulus, the plurality of entities contained in the node are displayed, and a further predetermined A representation code that can be processed to cause the graph to be reconstructed such that the plurality of displayed entities are replaced by the nodes in response to the stimulus.
本発明の第3の態様によれば、本発明の前記第1の態様による方法のうちの、任意の方法を実行するために実施可能な手段を含む、ユーザ端末が提供される。 According to a third aspect of the present invention there is provided a user terminal comprising means which can be implemented to perform any of the methods according to the first aspect of the present invention.
本発明の第4の態様によれば、処理装置によって読み取り可能なプログラム記憶装置が提供され、前記プログラム記憶装置は、本発明の前記第1の態様による方法のうちの、任意の方法を実行するための、前記処理装置により実行可能な命令のプログラムを組み入れている。 According to a fourth aspect of the present invention there is provided a program storage device readable by a processing device, the program storage device performing any method of the methods according to the first aspect of the present invention. Therefore, a program of instructions executable by the processing device is incorporated.
本発明をより完全に理解できるように、本発明の実施形態を、図面を参照して、一例としてのみ説明する。 In order that the present invention may be more fully understood, embodiments of the present invention will now be described by way of example only with reference to the drawings.
図1〜図8は、本発明の実施形態の例による視覚化グラフを示す。図7は、複数のエンティティ2が内部に表示されている、視覚化グラフ1の詳細を示す。各エンティティは、四角いボックスで表されている。図7に示すエンティティ2は、トップレベルのタイプ(以下、タイプと記載する)を表す。図8は、複数のサブエンティティ4が内部に表示されている、視覚化グラフ1の詳細を示す。各サブエンティティ4は、四角いボックスで表されている。図8に示すサブエンティティ4は、第2レベルのエンティティタイプ(以下、サブタイプと記載する)を表す。 1-8 illustrate visualization graphs according to example embodiments of the present invention. FIG. 7 shows the details of the
エンティティ2およびサブエンティティは、通常は、質量としてモデル化される。エンティティの各ペアの間には、リパルサにより引き起こされる斥力が存在する。前記斥力は、距離または距離の二乗に反比例してもよく、そして、前記斥力と、前記距離または距離の二乗との間の関係は、その他の任意の逆の関係であってもよい。エンティティ間の関係8(図7には図示せず)は、ばねとして(通常は、線形ばねとして)モデル化される。前記モデルは、システムが集束することを確実にするために、減衰を提供する。前記システムにエネルギーが入れられる場合(例えば、エンティティ2、4が、グラフに導入されるか、または移動される場合)、前記システムは、最も低いエネルギーレベルを採用するようにモデル化される。各エンティティまたはノード(図1を参照)について、前記距離および斥力は、その他のエンティティおよびノードから計算される。前記力は、力ベクトルが得られるように加算される。加速および減速に関する前記システムの反応は、前記力ベクトルに依存する。
少なくとも1つの関係8を共有するエンティティのグループは、まとめて束ねられて、図1に示すように、ノード9として表示されてもよい。ノードおよびエンティティは、図1に示すように、同じグラフ上に一緒に表示されてもよく、図1では、エンティティおよびノードに共通の関係8は、該当するエンティティおよび/またはノードを結び付ける線として表示されている。 Groups of entities that share at least one
任意の特定のグラフが、特定のエンティティ2、4またはノード9に関する関係8が表示されるように配列されてもよい。この場合、当該のエンティティ2、4またはノード9は、フォーカスエンティティまたはノード10と呼ばれ、通常は、前記グラフの中央領域に表示される。 Any particular graph may be arranged such that the
1.グループ分け
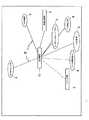
図1は、本発明の実施形態の例による視覚化グラフ内でのグループ分けを示す。特に、図1は、フォーカスエンティティ10を、関連するエンティティ2、およびノード9に含まれている、エンティティタイプにより集められたエンティティとともに示す。点線は、ユーザの嗜好により選択された、間接的に関連する項目(「競合他社」、「市場」)を示す。1. Grouping FIG. 1 illustrates grouping within a visualization graph according to an example embodiment of the present invention. In particular, FIG. 1 shows a
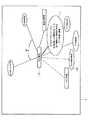
図2は、図1に示す視覚化グラフのさらなる詳細を示す。特に、図2は、マウス、または、コンピュータとともに使用するように適合されたその他のインジケータを、希望するノードの上を通過(マウスオーバー(MouseOver))させた場合に示される、グループの共通の関係8の表示を示す。 FIG. 2 shows further details of the visualization graph shown in FIG. In particular, FIG. 2 shows the common relationships of groups shown when a mouse or other indicator adapted for use with a computer is passed over the desired node (MouseOver). 8 is shown.
図1および図2に示すように、視覚化グラフ1が混雑し、結果として、前記データがナビゲートできないほど複雑になるのを避けるために、共通の関係8を有するエンティティのグループ9が束ねられて、グループノード9として表示される(図1)。特定のグループノードのエンティティの共通の関係8が、前記フォーカスエンティティを定義する。すべての可能なグループ分けのうち、結果としてエンティティ2(要素とも呼ばれる)が最も均等に前記グループに分散され、そして、少なくとも2つの関係8を共通して有するエンティティ2(要素)のグループを形成するものが選択される。 As shown in FIGS. 1 and 2, a
共通の関係8は、グループ内の各エンティティに明示的に割り当てられたものであってもよいが、個々の関係8を抽象化したものであってもよい。この実施形態を、図2に示す。図2では、グループ「サニタリーナプキン」の共通の関係8が表示されている。これらの製品のそれぞれが、関係8「ドイツ市場に関連」および関係8「生分解性という特性を有する」を有する。これらは直接的な関係8である。例えば、前記グループ内の2つの製品は、前記グラフにアクセス可能な企業によって販売され、残りの製品は競合する企業により販売されている。前記意味ネットは、それらはすべて企業であるという情報を含んでいるため、共通の抽象関係8「ある企業により販売されている」が作成され、これも前記グループの要素を特徴付ける。 The
セレクションコードは動的であり、それにより、前記エンティティの動的なグループ分けがもたらされる。つまり、コンテキストなどの特定の条件によっては、前記選択および抽象化は、適用される場合、時が異なれば、異なるグループ分けを提供することがある。 Selection codes are dynamic, which results in a dynamic grouping of the entities. That is, depending on specific conditions such as context, the selection and abstraction, when applied, may provide different groupings at different times.
前記選択の予測可能性をさらに向上するために、ファセットが導入される。特に、グループを形成するための条件として、どのような共通の関係8が選択されるかについての予測可能性を向上するために、ユーザは、各エンティティタイプについてのファセットを定義してもよい。「タイプ」については、図7および図8を参照して、以下でより詳しく説明する。ファセットは、前記ファセットの要素のエンティティタイプによって、または、前記ファセットの要素を前記フォーカスエンティティに結び付ける、関係8の種類によって特徴付けられる、事前定義されたグループである。 In order to further improve the predictability of the selection, facets are introduced. In particular, the user may define a facet for each entity type in order to improve the predictability of what
本例では、次のファセットが、製品の特性のために定義されている。知識、製品、技術、人、ライフサイクル段階、企業、アイディア、洞察、事実、コンセプト、アプローチ、活動。 In this example, the following facets are defined for product characteristics: Knowledge, product, technology, people, life cycle stage, company, idea, insight, fact, concept, approach, activity.
ファセットが定義されている場合、前記フォーカスエンティティに関連するすべてのエンティティが、対応するファセット(グループ)の中に分類され、動的グループ分けアルゴリズムは、(可能な場合に)それらのファセットをより小さなグループに細分するためにのみ使用される。 If facets are defined, all entities associated with the focus entity are classified into corresponding facets (groups) and the dynamic grouping algorithm (if possible) makes those facets smaller Used only to subdivide into groups.
2.グループの展開
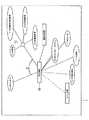
図3〜図6は、本発明の実施形態による視覚化グラフを示す。特に、図3は、グループへのメンバーの関連が可視のままになった、展開しているグループ15を示す。図4は、マウスオーバー機能を使用して表示された、エンティティタイプの表示16を示す。図5は、グループの、サブグループ17への展開を示す。図6は、サブグループ18の展開を示す。2. Group Expansion FIGS. 3-6 illustrate visualization graphs according to embodiments of the present invention. In particular, FIG. 3 shows an expanding
上述のように、従来の視覚化グラフとは異なり、本発明では、2D視覚化グラフ内でのグループの形成を、前記グラフを混雑していない状態に保ったまま行うことが可能である。本発明の一実施形態によれば、これは、前記ノードのために必要とされる空間を最小限に保ち、追加されたノードの起源をたどることを可能なままにすることにより実現される。さらに、前記グラフは、ユーザの混乱を避けるために、円滑な方法で配列し直される。本発明の一実施形態によれば、以下のステップが実行される。
−展開の前に、新しいノードのための場所を空けるために、前記グループノードは、挿入されるべきエンティティの数に比例して、斥力を増加する。隣接ノードが十分遠くに移動したら、実際の挿入が開始される。
−前記グラフに挿入された新しいノードは、「フォーカス」ノード10との直接的な関係8を有するが、この関係8は、間接的にのみ表示される。ラベルのない「バンドラー」として前記グラフ内に残り、「フォーカス」ノード10との関係8を確立する、グループノードに、前記新しいエンティティは接続される。したがって、フォーカスノード10に接続される線の数は、小さいままになる。
−グループの「バンドラー」ノード11は、空間を節約するために、ラベルを有していないが、グループの特徴は、ユーザがマウスポインタを、図2に示すのと同じ方法で「バンドラー」ノード11の上に移動した場合に示される。
−「バンドラー」ノード11をダブルクリックすると、グループは1つのノードに再び折りたたまれる。
−サブグループ18の再帰的な展開および折りたたみも可能である(図5、図6)。As described above, unlike the conventional visualization graph, in the present invention, it is possible to form a group in the 2D visualization graph while keeping the graph in a non-congested state. According to one embodiment of the present invention, this is accomplished by keeping the space required for the node to a minimum and allowing it to follow the origin of the added node. Furthermore, the graph is rearranged in a smooth manner to avoid user confusion. According to one embodiment of the present invention, the following steps are performed.
Prior to deployment, the group node increases repulsion in proportion to the number of entities to be inserted in order to make room for new nodes. When the adjacent node moves far enough, the actual insertion is started.
The new node inserted in the graph has a
The group “bundler”
-Double-clicking on "Bandler"
-Recursive expansion and folding of the
結果として得られる表現の外観および動作は、「ツリー表示コントロール」に似たものとなる。主な違いは、ツリー表示は、既存の階層構造を表すのに対して、前記グラフ内のグループノードは、より混雑していないグラフレイアウトを得るために、階層のような構造を動的に作成するということである。また、2Dグラフレイアウトを発見するという問題は、従来のツリー表示コントロールには存在しない。 The appearance and behavior of the resulting representation is similar to a “tree display control”. The main difference is that the tree view represents an existing hierarchical structure, whereas the group nodes in the graph dynamically create a hierarchy-like structure to get a less crowded graph layout Is to do. Also, the problem of finding a 2D graph layout does not exist in conventional tree display controls.
本発明の一実施形態では、前記第1の所定の刺激(例えば、マウスのダブルクリックにより始動される)に反応して、ノード9は、共通の関係8を表すために、前記グラフ内に存続する。それにより、「展開された」状態においても、前記「グループノード」は前記グラフ内に維持されて、共通の関係8を表し、他方、前記単一のグループメンバー(エンティティ)は、前記グループノードへのリンクを有する。さらなる実施形態では、前記エンティティは、前記第1のノードに結び付けられたすべてのエンティティに共通していなくてもよい、関係8を表すリンクを介して、さらなるエンティティ2またはノード9に結び付けられている。(共通の関係8によって前記第1のノードに結び付けられた)前記グループのすべてのメンバーに共通していなくてもよいリンクを、さらに提供することにより、ユーザは、ナビゲーション可能なさらなる情報にアクセスできるようになる。 In one embodiment of the present invention, in response to the first predetermined stimulus (e.g., triggered by a mouse double click), the
3.間接的な関連
従来の視覚化グラフとは異なり、本発明のさらなる実施形態では、前記視覚化グラフのレイアウトは、関連する可能性のある情報を失うことなく、ノードの数が小さく保たれるようなものである。3. Indirect association Unlike traditional visualization graphs, in a further embodiment of the invention, the layout of the visualization graph is such that the number of nodes is kept small without losing any information that may be relevant. It is a thing.
本発明の一実施形態によれば、これは、以下の方法により実現される。グラフのフォーカスが変化すると、関連する新しいエンティティが挿入され、したがって、その他のエンティティは削除されなければならない。従来の視覚化グラフでは、前記フォーカスノードからの距離d<dmaxを有するノードのみが前記グラフ内に維持される。ここで、前記距離は、ノードと前記フォーカスノードとの間の最短経路上の関係8の数である。ノードの数は、通常、dmaxとともに指数関数的に増加するため、ほとんどの目的のためには、値1または2が適切である。According to one embodiment of the invention, this is achieved by the following method. When the graph focus changes, new related entities are inserted and therefore other entities must be deleted. In a conventional visualization graph, only nodes with a distance d <dmax from the focus node are maintained in the graph. Here, the distance is the number of
前記視覚化グラフのナビゲーションを向上するために、特定のタイプのエンティティは、それらのエンティティタイプにより、または前記フォーカスノードにそれらのエンティティを結び付けている関係8の種類により、現在のコンテキストにおいて特別に関与するものであるとみなされる場合は、前記フォーカスへの距離がはるかに大きくても、前記グラフに含まれてもよい。 In order to improve the navigation of the visualization graph, certain types of entities are specially involved in the current context by their entity type or by the kind of
この場合の前記コンテキスト情報は、以下の構成要素により構成されていてもよいが、これに限定されない。
−現在のユーザの一般的な嗜好
−前記「フォーカス」ノードに付属するコンテキスト情報、および
−現在のユーザの現在の役割および/またはセッション履歴The context information in this case may be configured by the following components, but is not limited thereto.
-Current user's general preferences-contextual information attached to said "focus" node, and-current user's current role and / or session history
図1〜図6で、エンティティ2「ドイツ市場」、および「4つの競合他社」のグループ12は、前記グラフ内で、フォーカスノード10に点線で接続されて表示されている。これらのエンティティ12は、前記製品の特性「生分解性」に、直接の関係8は有していないが、ある製品を介して関係している。この場合、タイプ「製品の特性」のエンティティが前記フォーカス内にあるならば、市場および競合他社は特別に関与するものであると、前記システムに指示されている。したがって、エンティティ「生分解性」への距離が、特定の距離以内(d<4)のすべての市場および競合他社が、選択され、前記グラフに挿入される。 In FIG. 1 to FIG. 6, a
特別に関与するエンティティを発見するために、より洗練されたアルゴリズムが適用されてもよく、そして、ユーザがスクリプティング言語またはマクロレコーダを使用して、コンテキスト固有のアルゴリズムを作成することを、許容することも可能である。 More sophisticated algorithms may be applied to discover entities that are specifically involved, and allow users to create context-specific algorithms using a scripting language or macro recorder Is also possible.
本発明のさらなる実施形態による方法は、さらに、複数のエンティティおよび/またはノード2、9に対応するデータを保存24するステップと(意味ネットが、前記エンティティおよび/またはノード2、9を含み、そして、前記エンティティおよび/またはノード2、9は、複数の関係8によって相互に結び付けられている)、クエリを生成するステップと、前記クエリを前記データに対して実行するステップと、前記複数のデータのうち、少なくとも2つを、前記クエリの結果を表す視覚化グラフ1の形態で出力するステップと(グラフ1は、ユーザまたは前記クエリにより定義されたフォーカスエンティティまたはノード10を有する)、前記フォーカス10に間接的に関連した、前記結果の中に出力されるべき少なくとも1つのエンティティおよび/またはノード2、9を決定するために、コンテキスト情報を使用するステップとを含む。現在のコンテキスト、およびユーザの嗜好に基づいて、「フォーカス」エンティティに間接的に関連したエンティティを表示する可能性を提供することにより、エンティティ間に直接的な関係がない場合でも、ユーザは、追加情報を収集することが可能になる。これにより、ユーザは、前記グラフ内で、コンテキストからコンテキストへ「ジャンプ」することが可能になる。本発明は、大量のデータがどのように関連しているかを、ユーザが発見することを可能にする。ユーザは、視覚的な方法で、知識領域をナビゲートおよび調査することができる。 The method according to a further embodiment of the invention further comprises the step of storing 24 data corresponding to a plurality of entities and / or
4.グラフセクタおよびアトラクタ
図7および図8は、本発明のさらなる実施形態の例を示す。特に、図7は、「タイプ」とも呼ばれる、トップレベルのエンティティタイプのための、アトラクタの位置を示し、図8は、「サブタイプ」とも呼ばれる、第2レベルのエンティティタイプのための、アトラクタの大まかな位置を示す。本発明の一実施形態では、前記複数のエンティティを、それらのエンティティのエンティティタイプによって、前記グラフの所定のセクタに引き寄せる、アトラクタが提供される。複数のエンティティを、それらのエンティティタイプによって、画面の特定のセクタに引き寄せるアトラクタを導入することにより(「360°ナビゲーショングラフ」という名前はこれに由来する)、完全な、したがって、非常に複雑な決定性アプローチを実行する必要なしに、各エンティティの位置を予測することが可能になる。4). Graph Sector and Attractor FIGS. 7 and 8 show examples of further embodiments of the present invention. In particular, FIG. 7 shows attractor positions for top-level entity types, also called “types,” and FIG. 8 shows attractor positions for second-level entity types, also called “subtypes.” Indicates the approximate position. In one embodiment of the present invention, an attractor is provided that attracts the plurality of entities to a predetermined sector of the graph by an entity type of the entities. Complete and therefore very complex determinism by introducing attractors that draw multiple entities by their entity type to a specific sector of the screen (the name “360 ° navigation graph” derives from this) It becomes possible to predict the position of each entity without having to perform an approach.
図7は、複数のエンティティ2が内部に表示されている、視覚化グラフ1の詳細を示す。各エンティティには、アトラクタ3が関連付けられている。前記アトラクタは、グラフ上でユーザに対しては表示されないが、図では、点線による円3で示されている。 FIG. 7 shows the details of the
定位を容易にするために、特定のタイプ(つまり、種類)のエンティティ2が、グラフ1の同じセクタ4に表示されるように配列される。 To facilitate localization, a particular type (ie, kind) of
本発明のさらなる実施形態によれば、360°アプローチが提案される。 According to a further embodiment of the invention, a 360 ° approach is proposed.
第1のさらなる実施形態は、アトラクタおよびリパルサを使用した、非決定性アプローチに基づく。第2のさらなる実施形態は、画面および画面領域の、セクタおよびサブセクタへの、動的な、しかし決定性の、細分割を使用した、決定性アプローチに基づく。ここで、エンティティタイプはセクタに、エンティティサブタイプはサブセクタに、それぞれ割り当てられる。 The first further embodiment is based on a non-deterministic approach using attractors and repulsors. A second further embodiment is based on a deterministic approach using dynamic but deterministic subdivision of screens and screen areas into sectors and sub-sectors. Here, the entity type is assigned to the sector, and the entity subtype is assigned to the subsector.
第1の、非決定性のさらなる実施形態について、ここで説明する。定位を容易にするために、特定の種類(つまり、タイプ)のエンティティ2が、グラフの同じセクタ4に表示されるように配列される。これは、各エンティティタイプについて、不可視の(つまり、前記グラフのユーザにとって見えない)アトラクタ3を、前記グラフに導入することによって行われる。図7に示す例では、前記タイプは、「属性」、「知識」、「特性」、「実際の物」、および「活動」である。これらは、トップレベルのエンティティタイプと呼ばれることもある。基準線を基準とした、各アトラクタ3の角度シータ1〜シータ4は、カスタマイズすることによって設定されてもよく、そして、すべてのサブタイプによって継承される(サブタイプ6を表す図8を参照)。ここで、サブタイプは、トップレベルタイプの範囲に含まれるタイプを有するエンティティ2である。例えば、図8内の「戦略的ビジネスプランニング」は、「活動」のサブタイプである。図7および図8に示すように、各セクタ4、7内で、配置されるべきエンティティは、図7では楕円内に配列されているのに対して、図8では、配列されるべきエンティティがより多く存在し、したがって、力ベクトルはより複雑なため、各セクタ4内で、前記サブタイプエンティティは、楕円内に配列されているのではなく、より不明瞭な配置で配列されている。さらに、図8では、多数のエンティティが比較的小さな領域に配置されており、力ベクトルがより複雑なため、各エンティティの位置は、それぞれのアトラクタの位置に正確には一致していない。これは、エンティティ間の前記斥力も、前記エンティティの位置を決定する役割を果たすためである。したがって、図8は、アトラクタ3の大まかな位置を点線で示している。 A first, non-deterministic further embodiment will now be described. In order to facilitate localization,
セクタサイズの折衝は、エンティティの数およびそれらのエンティティがどのように分散されるかに従って決定されるため、前記グラフは特定のあいまい性を有する、ということが理解される。上述のように、この折衝は、アトラクタ3を提供することにより実現される。これに対して、従来のグラフでは、エンティティがセクタに追加された場合、またはエンティティがセクタから取り去られた場合に、前記セクタを、それぞれ、その境界を超えて拡張するか、またはその境界内に収縮する必要が発生しても、それを行う柔軟性がシステムに存在しない。It is understood that the graph has a particular ambiguity because sector size negotiation is determined according to the number of entities and how they are distributed. As described above, this negotiation is realized by providing the
第2の、決定性のさらなる実施形態について、次に説明する。 A second, further embodiment of determinism will now be described.
第2のさらなる実施形態の原理は、リパルサおよび/またはアトラクタを使用せずに、ナビゲーショングラフ内のノード(図8を参照)を配列するためにも使用されてもよい。 The principle of the second further embodiment may also be used to arrange nodes (see FIG. 8) in the navigation graph without using repulsors and / or attractors.
本発明の第2のさらなる実施形態に従って、以下のステップが実行される。通常はコンピュータ画面である表示器が、個々のトップレベルエンティティタイプ2に割り当てられたセクタ4に分割される。各セクタのサイズは、含まれているエンティティまたはノード(すべての可視のサブタイプ6を含む)の数に依存する。例えば、より多くの数のエンティティが特定のセクタに配置されるべきである場合、そのセクタはより大きくなる。次に、前記セクタは、サブタイプセクタ7に再帰的に分割され、再び、それらのサブタイプセクタの相対的なサイズは、それらのサブタイプセクタが含むエンティティの数に依存する。画面の分割は、グラフ1にエンティティが追加されるか、またはグラフ1からエンティティが削除されるたびに繰り返される。前記エンティティまたはノードから、前記グラフの中心までの距離は、衝突を避けるために、角度により変動する関数となっている(前記シミュレーション的アプローチでは、エンティティ間の前記斥力によって衝突は回避される)。前記第1および第2のさらなる実施形態は、二者択一的に実施されてもよいが、前記第1および第2の実施形態の組み合わせも実施されてもよいことが理解される。 According to a second further embodiment of the present invention, the following steps are performed. A display, usually a computer screen, is divided into
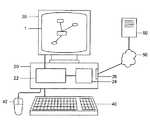
図9は、本発明の実施形態による方法を実行するための、一般的なコンピュータ設備を示す。特に、図9は、中央処理装置(CPU)22を含むコンピュータ20を示す。前記コンピュータは、さらに、記憶媒体も含み、前記記憶媒体は、CPU22内および/またはその他の場所に配置されていてもよい。前記記憶媒体内には、プロセッサ読み取り可能コードが保存され、前記プロセッサ読み取り可能コードは、視覚化グラフを提供するために、CPU22により読み取られてもよい。さまざまなコードが保存されていてもよく、前記コードは、前記複数のエンティティから、共通の関係8を有する複数のエンティティを選択し、前記選択された複数のエンティティを複数のグループとして保存するために処理可能な、セレクションコードと、前記複数のグループを、前記グラフ上で、複数のノードとして表し、前記複数のノードのすべてが共通して有する関係8のみが表されるように処理可能な、レプリゼンテーションコードと、共通の関係8を識別するために、関係8を抽象化するために処理可能な、アブストラクションコードとを含んでいてもよい。前記コードはさらに、共通の関係8を有する複数のエンティティ2を、視覚化グラフ1上のノード9として表し、所定の刺激に反応して、前記ノードにおいて含まれている前記複数のエンティティ2が表示されるようにし、そして、さらなる所定の刺激に反応して、表示されている前記複数のエンティティ2が前記ノード9によって置き換えられるように、前記グラフが再構成されるようにするために処理可能な、レプリゼンテーションコードを含んでいてもよい。また、視覚化グラフ1を表示するための、画面などの、表示装置30も提供される。 FIG. 9 shows a typical computer facility for performing the method according to an embodiment of the present invention. In particular, FIG. 9 shows a
ユーザは、コンピュータ20と通信を行うため、および前記コンピュータにクエリを実行するように指示するために、キーボード40、マウス42、またはその他の操作装置を使用してもよい。前記クエリは、自動的に生成されてもよい。あるいは、前記クエリは、ユーザにより生成されてもよい。コンテキスト情報が、前記クエリの中で定義されてもよい。あるいは、前記コンテキスト情報は、前記クエリの部分を形成していなくてもよく、その他の何らかの方法により(例えば、ユーザの嗜好により)定義されてもよい。 A user may use a
一実施形態では、視覚化グラフ1を提供するためのコンピュータ20が提供され、コンピュータ20は、複数のエンティティおよび/またはノード2、9に対応するデータを保存するためのデータベース24、60と(意味ネットが、前記エンティティおよび/またはノード2、9を含み、そして、前記エンティティおよび/またはノード2、9は、複数の関係8によって相互に結び付けられている)、視覚化グラフ1を提供するために処理可能なプロセッサ読み取り可能コードを内部に記録した、記憶媒体22と(前記コードは、前記データベースに対するクエリを実行するために処理可能なクエリコードを含む)、前記クエリの結果を表す視覚化グラフ1の形態で、前記複数のデータのうちの少なくとも2つを出力するための、出力装置30と(前記グラフ1は、ユーザまたは前記クエリにより定義された、フォーカスエンティティまたはノード10を有する)を含んでいてもよく、前記コードは、さらに、前記フォーカス10に間接的に関連した、前記結果の中に出力されるべき少なくとも1つのエンティティおよび/またはノードを決定するために処理可能な、コンテキスト情報を表現するために処理可能な、コンテキストコードを含む。 In one embodiment, a
さらに、前記コンテキストコードは、3つ以上の関係8によって間接的に関連している、少なくとも1つのエンティティ2および/またはノード9が、前記結果の中に表示されることを可能にするように処理可能であってもよい。前記コンテキストコードは、また、フォーカス10に関して特定の関与を有する、少なくとも1つのエンティティおよび/またはノード2、9の識別を可能にするように処理可能であってもよく、かつ/または、エンティティ2またはノード9のタイプに基づいて、あるいはエンティティおよび/またはノード2、9をフォーカス10に結び付けている関連8によって、特定の関与を識別するように処理可能であってもよい。さらに、前記コンテキストコードは、少なくとも1つの所定のユーザ嗜好、前記フォーカスに関連した情報、あるいはユーザの現在の役割および/またはセッション履歴クエリの、いずれか、または組み合わせによって決定されてもよい。 Further, the context code is processed to allow at least one
本発明のさらなる実施形態では、前記複数のエンティティを、それらのエンティティタイプによって、前記グラフの所定のセクタに割り当てるために処理可能な、アロケータコードや、特定のエンティティタイプの追加エンティティが、保存するステップにおいて保存された場合に、前記割り当てられた複数のエンティティの前記グラフ上での位置が、前記追加エンティティに応じて適合されるように処理可能な、追加エンティティアロケータコードなどの、さらなるコードが保存されてもよい。前記アロケータコードは、前記複数のエンティティを、それらのエンティティタイプによって、前記グラフの所定のセクタにそれぞれ引き寄せるために処理可能な、複数のアトラクタコードと、前記所定のセクタに割り当てられた前記複数のエンティティを、相互に反発させるために処理可能な、複数のリパルサコードとを含んでいてもよい。前記アトラクタコードおよび前記リバルサコードは、グラフ上でのエンティティの位置が、前記アトラクタコードおよび前記リパルサコードによって前記エンティティに及ぼされる影響の合計により決定されるように処理可能である。 In a further embodiment of the invention, the allocator code or additional entities of a particular entity type that can be processed to assign the plurality of entities according to their entity type to a given sector of the graph are stored. Additional code, such as an additional entity allocator code, that can be processed so that the position of the assigned entities on the graph is adapted in response to the additional entity when stored in May be. The allocator code includes a plurality of attractor codes that can be processed to draw the plurality of entities to a predetermined sector of the graph according to their entity types, and the plurality of entities assigned to the predetermined sector. May include a plurality of repulsor codes that can be processed to repel each other. The attractor code and the reversal code can be processed such that the position of the entity on the graph is determined by the sum of the effects exerted on the entity by the attractor code and the repulsor code.
前記アロケータコードは、さらに、前記グラフをセクタに分割するために処理可能な、ディバイディングコードと(エンティティは、そのエンティティタイプに応じて、前記セクタのうちの1つに割り当てられる)、前記セクタをサブセクタにさらに分割するために処理可能な、さらなるディバイディングコードと(エンティティは、そのエンティティサブタイプに応じて、前記サブセクタのうちの1つに割り当てられる)を含んでいてもよく、ここで、前記セクタおよび前記サブセクタのサイズは、それぞれ、前記セクタに割り当てられる特定のタイプのエンティティの数に応じて、および、前記サブセクタに割り当てられる特定のサブタイプのエンティティの数に応じて決定される。 The allocator code further includes a dividing code that can be processed to divide the graph into sectors (an entity is assigned to one of the sectors according to its entity type), And further dividing code (an entity is assigned to one of the sub-sectors depending on its entity sub-type), which can be processed to be further divided into sub-sectors, where The size of the sector and the sub-sector is determined according to the number of specific types of entities assigned to the sector and according to the number of specific sub-type entities assigned to the sub-sector, respectively.
前記アロケータコードは、また、グラフ上に表示されるべきエンティティの数が変化した場合に、前記ディバイディングコードを起動するために処理可能な、リピータコードも含んでいてもよい。 The allocator code may also include a repeater code that can be processed to activate the dividing code when the number of entities to be displayed on the graph changes.
前記処理可能コードは、さらに、前記複数のエンティティから、共通の関係8を有する複数のエンティティを選択し、前記選択された複数のエンティティを複数のグループとして保存するために処理可能な、セレクションコードと、前記複数のグループを、前記グラフ上で、複数のノードとして表し、前記複数のノードのすべてが共通して有する関係8のみが表されるように処理可能な、レプリゼンテーションコードとを含んでいてもよい。 The processable code further includes a selection code that can be processed to select a plurality of entities having a
一実施形態では、前記グラフを構築するためのデータが保存されるデータベース24は、コンピュータ20にローカルに配置されていてもよい。あるいは、またはさらに、データベース60または追加のデータベースが、コンピュータ20から離れた遠隔位置に配置されていてもよい。そのような実施形態では、前記コンピュータには、遠隔データベースに遠隔アクセスするための手段が提供される。例えば、モデム26を使用して、インターネット50、あるいはその他のネットワークまたは通信リンクを介して、遠隔データベース60に接続される。図9に示す実施形態は、一般的なインターネット構成であるが、その他の構成も可能である。上述のように、スタンドアロン構成も考えられる。さらに、前記データベースは、2台以上のコンピュータに分散されていてもよい。前記処理のいくつかの部分は、ユーザのコンピュータ上で実行されてもよく、前記処理のその他の部分は、遠隔コンピュータにおいて遠隔実行されてもよい。 In one embodiment, the
本発明の、上述の実施形態では、前記視覚化グラフは、身体衛生用製品を取り扱う企業の側面に関係している。しかし、本発明は、この点に限定されない。本発明は、データがナビゲーションされるべきあらゆる分野に適用でき、特に、データの複雑な相互関係がナビゲーションされるべき場合に適用できる。さらに、1つまたは複数のデータベース内のデータが、相互に何らかの関連を有している場合にも適用できる。さらに、メタデータがアクセスされ使用される、インターネットアプリケーションにも適用できる。 In the above-described embodiment of the present invention, the visualization graph relates to an aspect of a company handling a product for physical hygiene. However, the present invention is not limited to this point. The present invention can be applied to any field where data is to be navigated, and in particular, where complex interrelationships of data are to be navigated. Further, the present invention can be applied to a case where data in one or more databases have some relation to each other. It can also be applied to Internet applications where metadata is accessed and used.
「視覚化グラフ」という表現は、ナビゲーショングラフや、その他のそのようなツールなどの、視覚的表現を対象として含むことを意図している。 The expression “visualization graph” is intended to include visual representations such as navigation graphs and other such tools.
上記では、本発明の特定の実施形態について説明したが、本発明は、上記の説明以外の方法で実施することも可能であるということが認識される。上記の説明は、本発明を限定することを意図したものではない。 While specific embodiments of the invention have been described above, it will be appreciated that the invention may be practiced otherwise than as described. The above description is not intended to limit the invention.
1 視覚化グラフ
2 エンティティ
3 アトラクタ
4 セクタ、サブエンティティ、エンティティ
6 サブタイプ
7 サブタイプセクタ
8 グループの共通の関係、エンティティ間の関係
9 ノード
10 フォーカスエンティティ
11 グループの「バンドラー」ノード
12 「4つの競合他社」のグループ
15 展開しているグループ
16 エンティティタイプの表示
17 サブグループ
18 サブグループ
20 コンピュータ
22 記憶媒体、中央処理装置(CPU)
24 データベース
26 モデム
30 表示装置、出力装置
40 キーボード
42 マウス
50 インターネット
60 データベース1
24
Claims (17)
Translated fromJapanese意味ネットが複数のエンティティを含み、そして、前記複数のエンティティは、複数の関係により相互に結び付けられている前記複数のエンティティに対応するデータをコンピュータのメモリに格納するステップを有し、
前記複数のエンティティから選択された1つのエンティティに関するクエリに応答して、前記クエリの結果を表す視覚化グラフであって、ユーザまたは前記クエリにより定義されたフォーカスエンティティを含む視覚化グラフを表示装置に提供する方法であって、
それぞれが拡張または折りたたみ可能な、そしてユニークな前記複数のエンティティのセットである、エンティティグループに対応する一つのグループノードを有し、それぞれの前記エンティティグループの中で前記エンティティのセットは、少なくとも2つの共通する関係を共有し、
前記それぞれのエンティティグループを折りたたんでグループノード表示とし、前記フォーカスエンティティと関係づけて表示する第1表示形態と、
前記グループノード表示に代えて、前記グループノードを構成する前記複数のエンティティを、前記フォーカスエンティティと関係づけて前記フォーカスエンティティとの関係を示す関係標識の周囲に分散的に表示する第2表示形態と、を提供可能にするステップを備え
前記フォーカスエンティティに対して少なくとも前記第1表示形態による前記グループノード表示を複数個含んで前記表示装置に第1の視覚化グラフとして提供するステップと、
前記第1の視覚化グラフにおける特定のグループノード表示に、前記第2表示形態に移行させるための拡張刺激を与えることにより、前記拡張刺激を与えられた特定のグループノード表示を、前記第1の視覚化グラフにおいて表示されていたフォーカスエンティティ、他のグループノード表示を覆い隠すことなく前記第2表示形態に移行させて、前記表示装置に第2の視覚化グラフとして提供するステップと、を含むことを特徴とする方法。A method for providing a visualization graph on a computer comprising:
The semantic net includes a plurality of entities, and the plurality of entities includes storing data corresponding to the plurality of entities interconnected by a plurality of relationships in a memory of the computer;
A visualization graph representing a result of the query in response to a query related to one entity selected from the plurality of entities, the visualization graph including a focus entity defined by the user or the query on a display device A method of providing,
One group node corresponding to an entity group, each of which is an expandable or collapsible and unique set of entities, and in each of the entity groups, the set of entities includes at least two Share common relationships,
A first display form in which each entity group is collapsed to be a group node display and displayed in association with the focus entity;
In place of the group node display, a second display form for displaying the plurality of entities constituting the group node in a distributed manner around a relation indicator indicating the relationship with the focus entity in association with the focus entity; A step that makes it possible to provide
Including a plurality of group node displays according to the first display form for the focus entity and providing the display device as a first visualization graph;
By giving an extended stimulus for shifting to the second display form to a specific group node display in the first visualization graph, the specific group node display given the extended stimulus is changed to the first group node display. The focus entity displayed in the visualization graph, and the transition to the second display form without obscuring the display of other group nodes, andproviding the display device as the second visualization graph. A method characterized by.
前記第1の視覚化グラフは、少なくとも前記フォーカスエンティティと、それぞれの前記表示ラベルと、前記フォーカスエンティティとの直接の関係を示す1の関係線または間接の関係を示す2以上の関係線と、前記それぞれの表示ラベルとを含んで提供され、
前記第2の表示形態にあっては、前記拡張刺激を与えられた前記表示ラベルに代え、前記関係線との接続を示す接続記号と、前記接続記号にそれぞれ結びつけられる新たな1の関係線と、前記1の関係線にそれぞれ結び付けられる前記複数のエンティティとを、前記それぞれの複数のエンティティが、前記接続記号の周囲に相互に重なりあわないように分散的に配置された表示形態とされるとともに、
前記第1の視覚化グラフにおける前記表示ラベルに代えて、前記第2の視覚化グラフに挿入される前記第2の表示形態は、前記第1の視覚化グラフにおける前記ラベル以外のグラフ要素を覆い隠さないように、かつ、前記それぞれのグラフ要素の位置を再配置するように前記第2の視覚化グラフとして提供することを特徴とする、請求項1または2に記載の方法。In the first display form, the group node display is provided in the first visualization graph as a display label indicating the semantic content constituting the group node,
The first visualization graph includes at least the focus entity, each of the display labels, one relationship line indicating a direct relationship with the focus entity, or two or more relationship lines indicating an indirect relationship; Including each label and
In the second display form, instead of the display label to which the extended stimulus is applied, a connection symbol indicating connection with the relationship line, and a new one relationship line respectively associated with the connection symbol; The plurality of entities respectively connected to the one relation line are displayed in a distributed form so that the plurality of entities do not overlap each other around the connection symbol. ,
Instead of the display label in the first visualization graph, the second display form inserted into the second visualization graph covers graph elements other than the label in the first visualization graph. 3. A method according to claim 1 or 2, characterizedin that it isprovided as said second visualization graph so as not to hide and to rearrange the position of said respective graph elements .
さらに、前記少なくとも一つのエンティティが前記フォーカスエンティティと間接的に関連している前記少なくとも一つのエンティティを前記結果として出力することを判定するためにコンテキスト情報を用いるステップと、
前記フーカスエンティティに間接的に関係づけられるエンティテイが前記第1の視覚化グラフおよび前記第2の視覚化グラフに前記フォーカスエンティテイとの関係を示して表示されることを含むことを特徴とする請求項1〜6までのいずれかに記載の方法。The first visualization graph and the second visualization graph are output on a display screen of the display device, and each stimulus including the extended stimulus is applied to an image displayed on the display screen. Being
Further, using context information to determine that the at least one entity outputs as a result the at least one entity indirectly associated with the focus entity;
The entity indirectly related to the focus entity includes displaying the relationship with the focus entity on the first visualization graph and the second visualization graph. Item 7. The method according to any one ofItems 1 to 6.
複数のエンティティに対応するデータを保存するためのデータベースと、A database for storing data corresponding to multiple entities;
意味ネットが前記複数のエンティティを含み、前記複数のエンティティは、複数の関係により相互に結び付けられており、A semantic net includes the plurality of entities, the plurality of entities being interconnected by a plurality of relationships;
前記複数のエンティティから選択された1つのエンティティに関するクエリに応答して、前記クエリの結果を表す視覚化グラフであって、ユーザまたは前記クエリにより定義されたフォーカスエンティティを含む視覚化グラフが提供されるように適合された、クエリインタフェースとを含む、視覚化グラフを提供するためのコンピュータであって、In response to a query for one entity selected from the plurality of entities, a visualization graph is provided that represents a result of the query, including a focus entity defined by a user or the query. A computer for providing a visualization graph, including a query interface, adapted to
出力装置を有し、Having an output device,
それぞれが拡張または折りたたみ可能な、そしてユニークな前記複数のエンティティのセットである、エンティティグループに対応する一つのグループノードを有し、それぞれの前記エンティティグループの中で前記エンティティのセットは、少なくとも2つの共通する関係を共有し、One group node corresponding to an entity group, each of which is an expandable or collapsible and unique set of entities, and in each of the entity groups, the set of entities includes at least two Share common relationships,
前記それぞれのエンティティグループを折りたたんでグループノード表示とし、前記フォーカスエンティティと関係づけて表示する第1表示形態と、A first display form in which each entity group is collapsed to be a group node display and displayed in association with the focus entity;
前記グループノード表示に代えて、前記グループノードを構成する前記複数のエンティティを、前記フォーカスエンティティと関係づけて前記フォーカスエンティティとの関係を示す関係標識の周囲に分散的に表示する第2表示形態と、を実現する手段と、In place of the group node display, a second display form for displaying the plurality of entities constituting the group node in a distributed manner around a relation indicator indicating the relationship with the focus entity in association with the focus entity; Means for realizing
前記フォーカスエンティティに対して少なくとも前記第1表示形態による前記グループノード表示を複数個含んで前記表示装置に第1の視覚化グラフとして前記出力装置に出力する手段と、Means for including at least a plurality of the group node displays according to the first display form with respect to the focus entity and outputting to the output device as a first visualization graph;
前記第1の視覚化グラフにおける特定のグループノード表示に、前記第2表示形態に移行させるための拡張刺激を与えることにより、前記拡張刺激を与えられた特定のグループノード表示を、前記第1の視覚化グラフにおいて表示されていたフォーカスエンティティ、他のグループノード表示を覆い隠すことなく前記第2表示形態に移行させて、前記出力装置に第2の視覚化グラフとして出力する手段と、を有することを特徴とするコンピュータ。By giving an extended stimulus for shifting to the second display form to a specific group node display in the first visualization graph, the specific group node display given the extended stimulus is changed to the first group node display. A focus entity displayed in the visualization graph, and a means for shifting to the second display form without covering up other group node displays and outputting to the output device as a second visualization graph. A computer characterized by
前記第1の視覚化グラフは、少なくとも前記フォーカスエンティティと、それぞれの前記表示ラベルと、前記フォーカスエンティティとの直接の関係を示す1の関係線または間接の関係を示す2以上の関係線と、前記それぞれの表示ラベルとを含んで提供され、
前記第2の表示形態にあっては、前記拡張刺激を与えられた前記表示ラベルに代え、前記関係線との接続を示す接続記号と、前記接続記号にそれぞれ結びつけられる新たな1の関係線と、前記1の関係線にそれぞれ結び付けられる前記複数のエンティティとを、前記それぞれのエンティティが、前記接続記号の周囲に相互に重なりあわないように分散的に配置された表示形態とされるとともに、
前記第1の視覚化グラフにおける前記表示ラベルに代えて、前記第2の視覚化グラフに挿入される前記第2の表示形態は、前記第1の視覚化グラフにおける前記表示ラベル以外のグラフ要素を覆い隠さないように、かつ、前記それぞれのグラフ要素の位置を再配置するように前記第2の視覚化グラフとして前記出力装置に出力させることを特徴とする、請求項8または9に記載のコンピュータ。In the first display form, the group node display is provided in the first visualization graph as a display label indicating the semantic content constituting the group node,
The first visualization graph includes at least the focus entity, each of the display labels, one relationship line indicating a direct relationship with the focus entity, or two or more relationship lines indicating an indirect relationship; Including each label and
In the second display form, instead of the display label to which the extended stimulus is applied, a connection symbol indicating connection with the relationship line, and a new one relationship line respectively associated with the connection symbol; The plurality of entities respectively connected to the one relation line are displayed in a distributed form so that the respective entities do not overlap each other around the connection symbol,
In place of the display label in the first visualization graph, the second display form inserted into the second visualization graph may include graph elements other than the display label in the first visualization graph. 10. The computer accordingto claim 8 ,wherein the output device outputs the second visualization graph as the second visualization graph so as not to obscure and to rearrange the positions of the respective graph elements.11. .
さらに、前記少なくとも一つのエンティティが前記フォーカスエンティティと間接的に関連している前記少なくとも一つのエンティティを前記結果として出力することを判定するためにコンテキスト情報を用いる手段を有し、
前記フーカスエンティティに間接的に関係づけられるエンティテイが前記第1の視覚化グラフおよび前記第2の視覚化グラフに前記フォーカスエンティテイとの関係を示して前記出力装置の表示画面上に出力されることを含むことを特徴とする請求項8〜13までのいずれかに記載のコンピュータ。The first visualization graph and the second visualization graph are output on a display screen of the output device, and each stimulus including the extended stimulus is applied to an image displayed on the display screen. Being
And further comprising means for using context information to determine that the at least one entity indirectly outputs the at least one entity indirectly associated with the focus entity.
Entities that are indirectly related to the focus entity are output on the display screen of the output device, showing the relationship with the focus entity in the first visualization graph and the second visualization graph. The computer according to claim 8, comprising:
ザ端末。A user comprising means operable to carry out the method according to any one of claims 1-7.
The terminal .
A computer-readable storage medium storing the computer program according to claim 16 .
Applications Claiming Priority (2)
| Application Number | Priority Date | Filing Date | Title |
|---|---|---|---|
| EP03077697AEP1510937A1 (en) | 2003-08-29 | 2003-08-29 | A method of providing a visualisation graph on a computer and a computer for providing a visualisation graph |
| EP03078583.6AEP1510938B1 (en) | 2003-08-29 | 2003-11-14 | A method of providing a visualisation graph on a computer and a computer for providing a visualisation graph |
Publications (2)
| Publication Number | Publication Date |
|---|---|
| JP2005122703A JP2005122703A (en) | 2005-05-12 |
| JP4537152B2true JP4537152B2 (en) | 2010-09-01 |
Family
ID=34105746
Family Applications (1)
| Application Number | Title | Priority Date | Filing Date |
|---|---|---|---|
| JP2004246057AExpired - Fee RelatedJP4537152B2 (en) | 2003-08-29 | 2004-08-26 | Method for providing a visualization graph on a computer, and computer, user terminal, computer program and storage medium for providing a visualization graph |
Country Status (3)
| Country | Link |
|---|---|
| US (1) | US7853552B2 (en) |
| EP (1) | EP1510938B1 (en) |
| JP (1) | JP4537152B2 (en) |
Cited By (2)
| Publication number | Priority date | Publication date | Assignee | Title |
|---|---|---|---|---|
| KR101753766B1 (en) | 2010-12-30 | 2017-07-19 | 페이스북, 인크. | Distributed cache for graph data |
| KR102085161B1 (en)* | 2019-07-22 | 2020-03-06 | 주식회사 비트나인 | System and method for visualization of graph data and computer program for the same |
Families Citing this family (34)
| Publication number | Priority date | Publication date | Assignee | Title |
|---|---|---|---|---|
| EP1510940A1 (en)* | 2003-08-29 | 2005-03-02 | Sap Ag | A method of providing a visualisation graph on a computer and a computer for providing a visualisation graph |
| US7565627B2 (en)* | 2004-09-30 | 2009-07-21 | Microsoft Corporation | Query graphs indicating related queries |
| US7814427B2 (en)* | 2005-01-05 | 2010-10-12 | Microsoft Corporation | Object model tree diagram |
| US8019752B2 (en)* | 2005-11-10 | 2011-09-13 | Endeca Technologies, Inc. | System and method for information retrieval from object collections with complex interrelationships |
| US7716586B2 (en)* | 2006-02-17 | 2010-05-11 | International Business Machines Corporation | Apparatus, system, and method for progressively disclosing information in support of information technology system visualization and management |
| US8462175B2 (en) | 2006-04-26 | 2013-06-11 | Sony Corporation | Image processing apparatus, image processing method, and computer program |
| US7856437B2 (en)* | 2007-07-31 | 2010-12-21 | Hewlett-Packard Development Company, L.P. | Storing nodes representing respective chunks of files in a data store |
| US20100083184A1 (en)* | 2008-09-30 | 2010-04-01 | Apple Inc. | Selective grouping and manipulation of chart components |
| WO2010043211A2 (en)* | 2008-10-16 | 2010-04-22 | Christian Krois | Navigation device for arranging entities in a data space and method therefor, and computer comprising the navigation device |
| WO2010065623A1 (en)* | 2008-12-02 | 2010-06-10 | Ab Initio Software Llc | Visualizing relationships between data elements and graphical representations of data element attributes |
| US8954893B2 (en)* | 2009-11-06 | 2015-02-10 | Hewlett-Packard Development Company, L.P. | Visually representing a hierarchy of category nodes |
| US10394778B2 (en) | 2010-09-03 | 2019-08-27 | Robert Lewis Jackson, JR. | Minimal representation of connecting walks |
| US8775955B2 (en)* | 2010-12-02 | 2014-07-08 | Sap Ag | Attraction-based data visualization |
| US20150135048A1 (en)* | 2011-04-20 | 2015-05-14 | Panafold | Methods, apparatus, and systems for visually representing a relative relevance of content elements to an attractor |
| US20120272168A1 (en)* | 2011-04-20 | 2012-10-25 | Panafold | Methods, apparatus, and systems for visually representing a relative relevance of content elements to an attractor |
| US9852153B2 (en) | 2012-09-28 | 2017-12-26 | Ab Initio Technology Llc | Graphically representing programming attributes |
| US9449062B2 (en)* | 2012-09-28 | 2016-09-20 | Sap Se | Data exploration combining visual inspection and analytic search |
| CN103809943B (en)* | 2012-11-07 | 2018-06-19 | Sap欧洲公司 | Visualize multi-level computer implemented method and readable media and system |
| US9116603B2 (en) | 2012-12-26 | 2015-08-25 | Ab Initio Technology Llc | Managing interactions with data having membership in multiple groupings |
| US10713261B2 (en) | 2013-03-13 | 2020-07-14 | Google Llc | Generating insightful connections between graph entities |
| US9646062B2 (en) | 2013-06-10 | 2017-05-09 | Microsoft Technology Licensing, Llc | News results through query expansion |
| FR3013862A1 (en)* | 2013-11-26 | 2015-05-29 | Orange | PROCESSING DATA RELATING TO ENTITIES |
| US10191999B2 (en)* | 2014-04-30 | 2019-01-29 | Microsoft Technology Licensing, Llc | Transferring information across language understanding model domains |
| JP6276126B2 (en)* | 2014-07-16 | 2018-02-07 | 株式会社日立製作所 | Problem structure extraction support system, problem structure extraction support method and program |
| US10657178B2 (en)* | 2014-08-22 | 2020-05-19 | Hewlett Packard Enterprise Development Lp | Processing of a generate entity type graph component of a graph analysis system |
| US10565560B2 (en)* | 2014-11-12 | 2020-02-18 | Successfactors, Inc. | Alternative people charting for organizational charts |
| GB2539379A (en)* | 2015-05-20 | 2016-12-21 | Knogno Ltd | A method and system for defining information within a graph-based architecture |
| US10223474B1 (en) | 2015-09-30 | 2019-03-05 | Riivos, Inc. | Traversing a cyclic graph using a modified breadth-first search in complex modeling |
| US10713304B2 (en)* | 2016-01-26 | 2020-07-14 | International Business Machines Corporation | Entity arrangement by shape input |
| US9836183B1 (en)* | 2016-09-14 | 2017-12-05 | Quid, Inc. | Summarized network graph for semantic similarity graphs of large corpora |
| CN118916521A (en) | 2016-12-01 | 2024-11-08 | 起元技术有限责任公司 | Method, system and medium for updating data structure |
| US10657686B2 (en)* | 2018-03-26 | 2020-05-19 | Two Six Labs, LLC | Gragnostics rendering |
| WO2020110239A1 (en)* | 2018-11-28 | 2020-06-04 | 富士通株式会社 | Information processing device and lineage program |
| US11256748B2 (en) | 2018-11-30 | 2022-02-22 | Riivos, Inc. | Complex modeling computational engine optimized to reduce redundant calculations |
Family Cites Families (64)
| Publication number | Priority date | Publication date | Assignee | Title |
|---|---|---|---|---|
| US5323452A (en) | 1990-12-18 | 1994-06-21 | Bell Communications Research, Inc. | Visual programming of telephone network call processing logic |
| CA2097232C (en)* | 1993-05-28 | 1999-01-19 | Phillip J. Beaudet | Displaying partial graphs by expanding and collapsing nodes |
| US5619632A (en)* | 1994-09-14 | 1997-04-08 | Xerox Corporation | Displaying node-link structure with region of greater spacings and peripheral branches |
| US5590250A (en)* | 1994-09-14 | 1996-12-31 | Xerox Corporation | Layout of node-link structures in space with negative curvature |
| US5740440A (en)* | 1995-01-06 | 1998-04-14 | Objective Software Technology | Dynamic object visualization and browsing system |
| US6144962A (en)* | 1996-10-15 | 2000-11-07 | Mercury Interactive Corporation | Visualization of web sites and hierarchical data structures |
| US6154213A (en)* | 1997-05-30 | 2000-11-28 | Rennison; Earl F. | Immersive movement-based interaction with large complex information structures |
| EP0998708B1 (en)* | 1997-07-25 | 2002-01-23 | BRITISH TELECOMMUNICATIONS public limited company | Visualisation in a modular software system |
| US6356285B1 (en)* | 1997-12-17 | 2002-03-12 | Lucent Technologies, Inc | System for visually representing modification information about an characteristic-dependent information processing system |
| US6369819B1 (en)* | 1998-04-17 | 2002-04-09 | Xerox Corporation | Methods for visualizing transformations among related series of graphs |
| US6216134B1 (en)* | 1998-06-25 | 2001-04-10 | Microsoft Corporation | Method and system for visualization of clusters and classifications |
| US6108698A (en)* | 1998-07-29 | 2000-08-22 | Xerox Corporation | Node-link data defining a graph and a tree within the graph |
| US6654761B2 (en)* | 1998-07-29 | 2003-11-25 | Inxight Software, Inc. | Controlling which part of data defining a node-link structure is in memory |
| US6154220A (en)* | 1998-10-19 | 2000-11-28 | Microsoft Corporation | Rectilinear layout |
| US6480843B2 (en)* | 1998-11-03 | 2002-11-12 | Nec Usa, Inc. | Supporting web-query expansion efficiently using multi-granularity indexing and query processing |
| US6373484B1 (en)* | 1999-01-21 | 2002-04-16 | International Business Machines Corporation | Method and system for presenting data structures graphically |
| US6434556B1 (en)* | 1999-04-16 | 2002-08-13 | Board Of Trustees Of The University Of Illinois | Visualization of Internet search information |
| EP1050829A3 (en) | 1999-04-22 | 2005-05-18 | International Business Machines Corporation | Visualization of graph-structured name spaces |
| US6714936B1 (en)* | 1999-05-25 | 2004-03-30 | Nevin, Iii Rocky Harry W. | Method and apparatus for displaying data stored in linked nodes |
| US6583794B1 (en)* | 1999-07-01 | 2003-06-24 | Smart Money | Interface system for information mapping |
| DE60001915T2 (en)* | 1999-07-02 | 2004-02-05 | Pri Automation, Inc., Billerica | DYNAMIC TRANSPORT ALGORITHM |
| JP2003509776A (en)* | 1999-09-14 | 2003-03-11 | エラジェン バイオサイエンシズ インコーポレイテッド | Graphical user interface for displaying and analyzing biological sequence data |
| US6556983B1 (en)* | 2000-01-12 | 2003-04-29 | Microsoft Corporation | Methods and apparatus for finding semantic information, such as usage logs, similar to a query using a pattern lattice data space |
| US6868525B1 (en)* | 2000-02-01 | 2005-03-15 | Alberti Anemometer Llc | Computer graphic display visualization system and method |
| US6446083B1 (en) | 2000-05-12 | 2002-09-03 | Vastvideo, Inc. | System and method for classifying media items |
| WO2002011048A2 (en)* | 2000-07-31 | 2002-02-07 | Agilix Corporation | Visualization and manipulation of biomolecular relationships using graph operators |
| US6795825B2 (en)* | 2000-09-12 | 2004-09-21 | Naphtali David Rishe | Database querying system and method |
| US6981228B1 (en)* | 2000-09-29 | 2005-12-27 | Sbc Technology Resources, Inc. | Interactive topology graphs for visualization and characterization of SONET consumption patterns |
| US6792400B2 (en)* | 2000-12-18 | 2004-09-14 | General Motors Corporation | Visualization of complex system interactions |
| US6646652B2 (en)* | 2000-12-21 | 2003-11-11 | Xerox Corporation | System and method for browsing node-link structures based on an estimated degree of interest |
| US6944830B2 (en)* | 2000-12-21 | 2005-09-13 | Xerox Corporation | System and method for browsing hierarchically based node-link structures based on an estimated degree of interest |
| US6781599B2 (en)* | 2001-01-04 | 2004-08-24 | At&T | System and method for visualizing massive multi-digraphs |
| US20020133392A1 (en)* | 2001-02-22 | 2002-09-19 | Angel Mark A. | Distributed customer relationship management systems and methods |
| WO2002069192A1 (en)* | 2001-02-26 | 2002-09-06 | Compudigm International Limited | Data visualisation system and method |
| US7043702B2 (en)* | 2001-03-15 | 2006-05-09 | Xerox Corporation | Method for visualizing user path through a web site and a path's associated information scent |
| US20020158918A1 (en)* | 2001-03-28 | 2002-10-31 | Sarnoff Corporation | Method and apparatus for visualizing correlations among and between objects and events |
| US20040030741A1 (en)* | 2001-04-02 | 2004-02-12 | Wolton Richard Ernest | Method and apparatus for search, visual navigation, analysis and retrieval of information from networks with remote notification and content delivery |
| JP3790679B2 (en)* | 2001-04-06 | 2006-06-28 | インターナショナル・ビジネス・マシーンズ・コーポレーション | Graph data visualization device, graphics creation method, program, and storage medium |
| JP3747404B2 (en)* | 2001-06-19 | 2006-02-22 | インターナショナル・ビジネス・マシーンズ・コーポレーション | Graphics image creating apparatus, method and program thereof |
| US6901555B2 (en)* | 2001-07-09 | 2005-05-31 | Inxight Software, Inc. | Tree visualization system and method based upon a compressed half-plane model of hyperbolic geometry |
| KR100436356B1 (en)* | 2001-08-01 | 2004-06-18 | (주) 위즈도메인 | A method for analyzing and providing inter-citation relationship between patents related to a subject patent |
| US6888548B1 (en)* | 2001-08-31 | 2005-05-03 | Attenex Corporation | System and method for generating a visualized data representation preserving independent variable geometric relationships |
| US6996774B2 (en) | 2002-02-12 | 2006-02-07 | Accenture Global Services Gmbh | Display of data element indicia based on data types |
| US7167910B2 (en)* | 2002-02-20 | 2007-01-23 | Microsoft Corporation | Social mapping of contacts from computer communication information |
| US7203701B1 (en)* | 2002-02-20 | 2007-04-10 | Trilogy Development Group, Inc. | System and method for an interface to provide visualization and navigation of a directed graph |
| US20030220928A1 (en)* | 2002-05-21 | 2003-11-27 | Patrick Durand | Method for organizing and querying a genomic and proteomic databases |
| JP2004069417A (en)* | 2002-08-05 | 2004-03-04 | Hitachi Ltd | Node coordinate determination method, network display method, and screening method |
| KR100470977B1 (en)* | 2002-09-23 | 2005-03-10 | 학교법인 인하학원 | A fast algorithm for visualizing large-scale protein-protein interactions |
| US8302019B2 (en)* | 2002-11-05 | 2012-10-30 | International Business Machines Corporation | System and method for visualizing process flows |
| US20040111255A1 (en)* | 2002-12-10 | 2004-06-10 | International Business Machines Corporation | Graph-based method for design, representation, and manipulation of NLU parser domains |
| US7111253B2 (en)* | 2002-12-16 | 2006-09-19 | Palo Alto Research Center Incorporated | Method and apparatus for displaying hierarchical information |
| US7224362B2 (en)* | 2003-01-30 | 2007-05-29 | Agilent Technologies, Inc. | Systems and methods for providing visualization and network diagrams |
| US7188308B2 (en)* | 2003-04-08 | 2007-03-06 | Thomas Weise | Interface and method for exploring a collection of data |
| US7089266B2 (en)* | 2003-06-02 | 2006-08-08 | The Board Of Trustees Of The Leland Stanford Jr. University | Computer systems and methods for the query and visualization of multidimensional databases |
| US7167865B1 (en)* | 2003-06-30 | 2007-01-23 | Mvalent, Inc. | Collaborative environment for producing software products |
| EP1510941A1 (en)* | 2003-08-29 | 2005-03-02 | Sap Ag | A method of providing a visualisation graph on a computer and a computer for providing a visualisation graph |
| EP1510940A1 (en)* | 2003-08-29 | 2005-03-02 | Sap Ag | A method of providing a visualisation graph on a computer and a computer for providing a visualisation graph |
| EP1510939A1 (en)* | 2003-08-29 | 2005-03-02 | Sap Ag | A method of providing a visualisation graph on a computer and a computer for providing a visualisation graph |
| EP2487599A1 (en)* | 2004-05-04 | 2012-08-15 | Boston Consulting Group, Inc. | Method and apparatus for selecting, analyzing and visualizing related database records as a network |
| US7877737B2 (en)* | 2004-07-23 | 2011-01-25 | University Of Maryland | Tree-to-graph folding procedure for systems engineering requirements |
| US7421665B2 (en)* | 2004-08-31 | 2008-09-02 | Oracle International Corporation | Node scrollers |
| US7456840B2 (en)* | 2004-08-31 | 2008-11-25 | Oracle International Corporation | Displaying information using nodes in a graph |
| US7468727B2 (en)* | 2005-04-19 | 2008-12-23 | Wong Pak C | Methods of visualizing graphs |
| CN101305366B (en)* | 2005-11-29 | 2013-02-06 | 国际商业机器公司 | Method and system for extracting and visualizing graph-structured relations from unstructured text |
- 2003
- 2003-11-14EPEP03078583.6Apatent/EP1510938B1/ennot_activeExpired - Lifetime
- 2004
- 2004-08-26JPJP2004246057Apatent/JP4537152B2/ennot_activeExpired - Fee Related
- 2004-08-27USUS10/927,313patent/US7853552B2/enactiveActive
Cited By (2)
| Publication number | Priority date | Publication date | Assignee | Title |
|---|---|---|---|---|
| KR101753766B1 (en) | 2010-12-30 | 2017-07-19 | 페이스북, 인크. | Distributed cache for graph data |
| KR102085161B1 (en)* | 2019-07-22 | 2020-03-06 | 주식회사 비트나인 | System and method for visualization of graph data and computer program for the same |
Also Published As
| Publication number | Publication date |
|---|---|
| US7853552B2 (en) | 2010-12-14 |
| EP1510938B1 (en) | 2014-06-18 |
| EP1510938A1 (en) | 2005-03-02 |
| JP2005122703A (en) | 2005-05-12 |
| US20050114802A1 (en) | 2005-05-26 |
Similar Documents
| Publication | Publication Date | Title |
|---|---|---|
| JP4537152B2 (en) | Method for providing a visualization graph on a computer, and computer, user terminal, computer program and storage medium for providing a visualization graph | |
| JP4651329B2 (en) | Method for providing visualization graph on display screen, computer providing the same, computer program thereof, and storage medium thereof | |
| JP4672310B2 (en) | Method for providing visualization graph on display screen, computer providing the same, computer program thereof, and storage medium thereof | |
| JP2005100375A (en) | Method for providing a visualization graph on a computer and computer providing a visualization graph | |
| Huang et al. | On-line animated visualization of huge graphs using a modified spring algorithm | |
| RU2314559C2 (en) | Method for representing user interface elements in simplified form | |
| WO2011142720A1 (en) | A self-organizing and contextual graphical user interface | |
| Hop et al. | Using Hierarchical Edge Bundles to visualize complex ontologies in GLOW | |
| EP1510937A1 (en) | A method of providing a visualisation graph on a computer and a computer for providing a visualisation graph | |
| JP2007026210A (en) | Tree structure display program, tree structure display method and tree structure display device | |
| JP2010262469A (en) | Apparatus and method for processing information, and program | |
| KR101490697B1 (en) | Visualizing apparatus and method for providing dynamic menu based on simulation data | |
| CN112541033A (en) | Demonstration method and system of VBA stack structure, storage medium and computer equipment | |
| Freire et al. | A graph-based interface to complex hypermedia structure visualization | |
| Sellier et al. | Visualising product line requirement selection decision inter-dependencies | |
| Kay et al. | How can users edit and control their models in ubicomp environments | |
| Shihab et al. | Angur: A visualization system for XML documents | |
| Cawley et al. | A discussion of three visualisation approaches to providing cognitive support in variability management | |
| CN119721877A (en) | Architecture diagram generation method and architecture diagram construction system | |
| WO2025004302A1 (en) | Information processing device, display control method, and display control program | |
| Darakapalli | Visualization of Knowledge Representation & Distributed Activation Spreading in Long-Term Memory | |
| JP6188367B2 (en) | Information processing apparatus, control method for information processing apparatus, and program | |
| Ishikawa et al. | Polymorphic cataloguing and viewing system for using digital archives: MoSaIC-II | |
| Calciati | A hierarchical layout for helping depicting software systems in a comprehensible visualization | |
| Ommen et al. | Visualization of Variability in Complex Development Structures |
Legal Events
| Date | Code | Title | Description |
|---|---|---|---|
| A621 | Written request for application examination | Free format text:JAPANESE INTERMEDIATE CODE: A621 Effective date:20070118 | |
| A131 | Notification of reasons for refusal | Free format text:JAPANESE INTERMEDIATE CODE: A131 Effective date:20081031 | |
| A601 | Written request for extension of time | Free format text:JAPANESE INTERMEDIATE CODE: A601 Effective date:20090130 | |
| A602 | Written permission of extension of time | Free format text:JAPANESE INTERMEDIATE CODE: A602 Effective date:20090204 | |
| A601 | Written request for extension of time | Free format text:JAPANESE INTERMEDIATE CODE: A601 Effective date:20090225 | |
| A602 | Written permission of extension of time | Free format text:JAPANESE INTERMEDIATE CODE: A602 Effective date:20090304 | |
| A601 | Written request for extension of time | Free format text:JAPANESE INTERMEDIATE CODE: A601 Effective date:20090326 | |
| A602 | Written permission of extension of time | Free format text:JAPANESE INTERMEDIATE CODE: A602 Effective date:20090331 | |
| A521 | Request for written amendment filed | Free format text:JAPANESE INTERMEDIATE CODE: A523 Effective date:20090430 | |
| TRDD | Decision of grant or rejection written | ||
| A01 | Written decision to grant a patent or to grant a registration (utility model) | Free format text:JAPANESE INTERMEDIATE CODE: A01 Effective date:20100604 | |
| A01 | Written decision to grant a patent or to grant a registration (utility model) | Free format text:JAPANESE INTERMEDIATE CODE: A01 | |
| A61 | First payment of annual fees (during grant procedure) | Free format text:JAPANESE INTERMEDIATE CODE: A61 Effective date:20100617 | |
| FPAY | Renewal fee payment (event date is renewal date of database) | Free format text:PAYMENT UNTIL: 20130625 Year of fee payment:3 | |
| R150 | Certificate of patent or registration of utility model | Ref document number:4537152 Country of ref document:JP Free format text:JAPANESE INTERMEDIATE CODE: R150 Free format text:JAPANESE INTERMEDIATE CODE: R150 | |
| FPAY | Renewal fee payment (event date is renewal date of database) | Free format text:PAYMENT UNTIL: 20130625 Year of fee payment:3 | |
| RD02 | Notification of acceptance of power of attorney | Free format text:JAPANESE INTERMEDIATE CODE: R3D02 | |
| R250 | Receipt of annual fees | Free format text:JAPANESE INTERMEDIATE CODE: R250 | |
| R250 | Receipt of annual fees | Free format text:JAPANESE INTERMEDIATE CODE: R250 | |
| R250 | Receipt of annual fees | Free format text:JAPANESE INTERMEDIATE CODE: R250 | |
| R250 | Receipt of annual fees | Free format text:JAPANESE INTERMEDIATE CODE: R250 | |
| R250 | Receipt of annual fees | Free format text:JAPANESE INTERMEDIATE CODE: R250 | |
| R250 | Receipt of annual fees | Free format text:JAPANESE INTERMEDIATE CODE: R250 | |
| R250 | Receipt of annual fees | Free format text:JAPANESE INTERMEDIATE CODE: R250 | |
| R250 | Receipt of annual fees | Free format text:JAPANESE INTERMEDIATE CODE: R250 | |
| R250 | Receipt of annual fees | Free format text:JAPANESE INTERMEDIATE CODE: R250 | |
| R250 | Receipt of annual fees | Free format text:JAPANESE INTERMEDIATE CODE: R250 | |
| R250 | Receipt of annual fees | Free format text:JAPANESE INTERMEDIATE CODE: R250 | |
| LAPS | Cancellation because of no payment of annual fees |