JP4528528B2 - Navigation server, navigation display method - Google Patents
Navigation server, navigation display methodDownload PDFInfo
- Publication number
- JP4528528B2 JP4528528B2JP2004003576AJP2004003576AJP4528528B2JP 4528528 B2JP4528528 B2JP 4528528B2JP 2004003576 AJP2004003576 AJP 2004003576AJP 2004003576 AJP2004003576 AJP 2004003576AJP 4528528 B2JP4528528 B2JP 4528528B2
- Authority
- JP
- Japan
- Prior art keywords
- information
- traffic
- traffic jam
- data
- user
- Prior art date
- Legal status (The legal status is an assumption and is not a legal conclusion. Google has not performed a legal analysis and makes no representation as to the accuracy of the status listed.)
- Expired - Fee Related
Links
Images


Landscapes
- Traffic Control Systems (AREA)
- Mobile Radio Communication Systems (AREA)
- Instructional Devices (AREA)
- Navigation (AREA)
Description
Translated fromJapanese本発明は、サーバと車載端末から成るナビゲーションシステムに係り、特に交通情報を管理するナビサーバと、及び該ナビサーバとデータ通信することによって交通情報を出力するナビゲーション装置に関する。 The present invention relates to a navigation system including a server and an in-vehicle terminal, and more particularly, to a navigation server that manages traffic information, and a navigation device that outputs traffic information by data communication with the navigation server.
従来のナビゲーション装置では、FM多重放送や電波/光ビーコン,電話網などを介して交通情報センタから提供される渋滞や交通規制などの情報を文字や簡易図形で表示したり、地図上に重畳表示することでドライバへ通知している。一般的に前記交通情報は、道路の脇に渋滞している道路と平行な線を描画し、その線の色で渋滞度を、線の長さで渋滞長を表現している。また、前記交通情報を加味した動的な経路探索を行い、ユーザに最短時間の経路を提供することにより、ドライバは自車位置中心の交通情報を知ることができ、円滑なドライブを行うことができる。 In conventional navigation devices, information such as traffic congestion and traffic regulations provided by the traffic information center via FM multiplex broadcasting, radio / optical beacons, telephone networks, etc. are displayed in text or simple graphics, or superimposed on a map. To notify the driver. In general, the traffic information draws a line parallel to a congested road on the side of the road, expresses the degree of congestion with the color of the line, and expresses the congestion length with the length of the line. In addition, by performing a dynamic route search that takes into account the traffic information and providing the user with the shortest time route, the driver can know the traffic information centered on the vehicle position and perform a smooth drive. it can.
ところで前記交通情報は、近い過去のある時刻における交通情報であり、渋滞などが今後解消されるのか、それとも益々渋滞が悪化するのかドライバは判断できない。そこで、特開2001−124577号公報では、今後渋滞が改善される方向か、或いは酷くなる方向かをアニメーション表示する方法や、渋滞の増加傾向及び減少傾向を示す図形を地図上に表示する方法が提案されている。例えば、渋滞の伸長傾向は矢印の後端を太くすることで示し、縮小傾向は矢印の後端を細くすることで示すことが提案されている。 By the way, the traffic information is traffic information at a certain time in the near past, and the driver cannot determine whether the traffic congestion will be resolved in the future or whether the traffic congestion will become worse. Therefore, in Japanese Patent Application Laid-Open No. 2001-124577, there is a method of displaying an animation indicating whether the traffic jam will be improved or worsening in the future, and a method of displaying a graphic showing an increasing tendency and a decreasing tendency of the traffic jam on the map. Proposed. For example, it has been proposed that the tendency of traffic congestion to be extended is indicated by making the rear end of the arrow thicker, and the tendency of reduction is indicated by making the rear end of the arrow thinner.
しかしながら上記従来技術では、提供された渋滞情報が、頻繁に発生する渋滞なのか、それとも事故や工事などによる突発的な渋滞なのか判断することができない。また、頻繁に発生する渋滞であれば、通常どの程度の時間で解消される渋滞か判断することが難しい。 However, the conventional technology cannot determine whether the provided traffic jam information is a frequently occurring traffic jam or an unexpected traffic jam due to an accident or construction. In addition, if the traffic frequently occurs, it is difficult to determine how long the traffic is normally cleared.
ところで、車載端末に用いられる小さなディスプレイ上で、ユーザが図形形状の微妙な違いにより渋滞傾向を認識することは困難である。そして、アニメーション表示のようなものではドライバの注意を引くためアイズ・フリーの観点からは好ましくない。さらに、渋滞の伸長・縮小傾向を矢印などの図形を変形して表示すると、テクスチャマッピングなどのグラフィックス処理を行う専用のグラフィックLSIなどが必要となり端末のコストアップとなる。 By the way, it is difficult for a user to recognize a traffic jam tendency on a small display used in an in-vehicle terminal due to a subtle difference in figure shape. An animation display is not preferable from the viewpoint of eyes-free because it draws the driver's attention. Furthermore, if the trend of congestion expansion / reduction is displayed by deforming a figure such as an arrow, a dedicated graphic LSI that performs graphics processing such as texture mapping is required, which increases the cost of the terminal.
そこで、本発明の第一の目的は、渋滞が頻繁に発生する地点、乃至道路区間、さらには渋滞発生時間帯等をもユーザに通知する手段を持つナビゲーションシステムを提供することにある。 Accordingly, a first object of the present invention is to provide a navigation system having means for notifying a user of a point where a traffic jam frequently occurs, a road section, a traffic jam occurrence time zone, and the like.
また、第二の目的は、簡易な表示方法でわかり易く渋滞地点等を表示するナビゲーションシステムを提供することにある。 A second object is to provide a navigation system that displays a congested spot and the like in an easy-to-understand manner with a simple display method.
上記目的を達成する本発明のナビゲーションシステムを構成するナビサーバは、蓄積した過去の交通情報を元に、交差点などの所定地点または交差点の間の道路区間における渋滞の発生頻度や平均渋滞度などの渋滞情報、及び該渋滞情報の信頼度で構成される渋滞統計情報を作成する渋滞統計情報作成手段を備えたことを特徴としている。 The navigation server that constitutes the navigation system of the present invention that achieves the above object is based on accumulated past traffic information, such as the occurrence frequency of traffic jams and average traffic jams at predetermined points such as intersections or road sections between intersections. The present invention is characterized by comprising a traffic jam statistical information creating means for creating traffic jam statistical information including traffic jam information and reliability of the traffic jam information.
地図上に統計的な渋滞情報を表示することで、日常的,慢性的に渋滞する交差点や道路区間をユーザが容易に把握することができる。 By displaying statistical traffic information on the map, the user can easily grasp intersections and road sections where traffic congestion occurs on a daily and chronic basis.
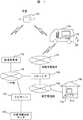
次に、本発明を用いたナビゲーションシステムの詳細について、図を用いて説明する。図1はナビゲーションシステムの全体構成を示す図である。システムは衛星101,ユーザ車両102,ユーザ端末122,移動体電話網103,インターネットとの接続を行うプロバイダ104,衛星から送信されるデータを受信し、その受信したデータをIP網
106経由でユーザに配信する放送事業者105,放送事業者105とプロバイダ104との間で配信されたデータの送受信に用いられるIP網106に接続されたナビサーバ
107,プロバイダ104に接続されてIP網106、あるいは移動体電話網103を通じてデータの送受信を行うための固定電話網108,各ユーザの自宅109にあるパーソナルコンピュータ110,VICSセンタ,日本道路交通情報センタ(JARTIC)、あるいはATISなど交通情報を提供する交通情報提供センタ100からなる。なお、ユーザ車両102は必ずしも車両である必要はなく、ユーザ端末122が携帯電話,PHS,Bluetooth ,無線LAN、あるいはETC端末等の無線通信機能を備えた携帯端末である場合には人(歩行者)であってもよい。Next, details of the navigation system using the present invention will be described with reference to the drawings. FIG. 1 is a diagram showing the overall configuration of the navigation system. The system receives the data transmitted from the
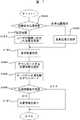
次に図2において、前記したナビサーバ107の構成について説明する。ナビサーバ
107は、ユーザ車両102に搭載されたユーザ端末122からIP網106を通じて送られてきた、該ユーザ端末の緯度・経度,ユーザ端末の移動速度,移動方向,ユーザID番号,認証パスワード,エンジンの回転数やその他車両状態を表すパラメータと、ユーザが望む要求サービスID等に関するデータを受信する。その後、CGI(Common Gate
Interface )115にてユーザ認証を行った後に、ユーザの要求するサービスに応じて、ユーザ管理ユニット111,地図編集ユニット114,経路探索ユニット116,交通情報管理ユニット112のいずれかの機能ユニットに対して前記の送られてきたデータを送信する。Next, the configuration of the
Interface) 115, after performing user authentication, depending on the service requested by the user, one of the functional units of the user management unit 111, the
それぞれの機能ユニットで受け取られたデータは、ユーザの要求に応じたサービスに関する情報をCGI115,IP網106,プロバイダ104,移動体電話網103を通じて(この経路を以下「通信網」と呼ぶ)ユーザ車両102のユーザ端末122に送られる。或いは前記サービスに関する情報送信するにあたって、放送を用いる場合には、CGI115,IP網106,放送事業者105,衛星101の経路を通じて(この経路を以下「放送網」と呼ぶ)ユーザ端末122に送信する。或いは、各ユーザの自宅109にあるパーソナルコンピュータ110に前記情報を送信する場合には、固定電話網を用いることになり、CGI115,IP網106,プロバイダ104,固定電話網108を通じて各ユーザの自宅109にあるパーソナルコンピュータ110に送られる。 The data received by each functional unit is the information about the service according to the user's request through the
次に前記した各機能ユニットの構成について説明する。 Next, the configuration of each functional unit will be described.
ユーザ管理ユニット111は、ユーザ情報データベース118,ユーザ情報登録・編集部117を備えている。ここではユーザから送られてきたデータ中に、ユーザ情報登録・編集要求があった場合には、該当するユーザのIDをもとにユーザ情報データベース118と照合して、該当する項目の登録・編集を行う。 The user management unit 111 includes a
地図編集ユニット114は、地図データベース125と、地図切出部124から構成される。これは、ユーザから現在地など指定地付近の地図データのダウンロード要求が送られてきた場合に、該指定地を含む予め決められた範囲の地図データを地図切出部124で地図データベース125から読み出して、ユーザに送信する。また、後述する経路探索ユニット116が呼ばれた際に、探索経路上の地図データが端末側にダウンロードされていない場合は、自動的に地図編集ユニット114が呼び出され、該当する地域の地図データを切出してユーザ側にダウンロードする。 The
経路探索ユニット116は、オプション情報データベース126,経路探索エンジン
127,オプション情報設定・変更部128,誘導点作成部129からなる。経路探索ユニット116では、CGI115でのユーザ認証後、ユーザから送られてきた出発地(現在地)及び目的地、或いは経由地の情報に基づき、さらにオプション情報(たとえば、一般道/高速道を優先して利用したり、最短時間で到着できるなど)があれば該情報をもとに、オプション情報設定・変更部128が前記オプション情報を設定・変更し、その後経路探索エンジン127がダイクストラ法などの経路探索手法を用いて自車位置から目的地までの経路を演算する。誘導点作成部129では、経路探索エンジン127で求めた経路上で、右左折する交差点や車線変更を指示する地点を抽出し、抽出した各地点における交差点拡大図や車線などの簡易図形,誘導のための音声データなどをオプション情報データベース126から読み出し、誘導点情報を作成する。The
交通情報管理ユニット112は、交通情報DB(交通情報データベース)113,渋滞予測部120、及び渋滞統計処理部121からなる。交通情報提供センタ100から定期的に送られてくる交通量,渋滞,旅行時間,事故・規制情報などの交通情報を交通情報
DB113に蓄積する。また、プローブカーによる収集情報(プローブ情報)から得られる渋滞情報等も交通情報DB113に蓄積してもよい。蓄積した交通情報を用いて、渋滞統計処理部121では、交差点や道路区間毎の渋滞の発生頻度を演算し、渋滞多発地点及び該地点の発生頻度等から成る渋滞統計データを作成する。渋滞予測部120では、蓄積した渋滞情報とリアルタイムの渋滞情報から、各渋滞が今後伸長傾向にあるか、それとも縮小傾向にあるか、或いは渋滞状況が変化しないか、といった渋滞傾向に関する予測データ(以下ではこれを「渋滞予測データ」と呼ぶ)を作成する。そして、作成した渋滞統計データ及び渋滞予測データを交通情報DB113に格納する。The traffic
ナビサーバ107に対して、ユーザから現在地など指定地付近の交通情報のダウンロード要求が送られてきた場合には、該ユーザ要求に応じて、交通情報提供センタ100から配信されたリアルタイムの交通情報や、交通情報管理ユニット112で加工・作成された渋滞予測データ,渋滞統計データを交通情報DB113から読み出し、ユーザに送信する。また、経路上の交通情報が要求された場合には、ユーザ管理ユニット111から経路データを取得し、経路上の交通情報(指定地付近と同様の情報)を抽出してユーザに送信する。 When a download request for traffic information near a specified location such as the current location is sent from the user to the
料金計算ユニット119は、車載端末に対するサービス料金の課金処理を行う部分である。地図データや経路データ,交通情報データなどのコンテンツに対する課金と、通信データのパケットをカウントして通信料金をそれぞれ車載端末に通知する機能を持つ。なお、コンテンツ料金及び通信料金のいずれかが月額固定の契約を行っているユーザに対しては、ユーザがサービスを利用する度に車載端末に通知する必要はなく、車載機への該通知に関わる通信量を減らすため月に1回程度に抑えるか、或いは一切通知を行わなくてもよい。 The
図3にて、ユーザ車両102に搭載されたユーザ端末122の一例であるカーナビゲーション(ナビ)端末の構成について説明する。ナビ端末は、本体132に表示装置130,GPS受信機131,携帯電話134,マイク137,スピーカ138が接続され、また本体132にはメモリカードスロット133を備えている。そして本体132を操作するためのリモコン135を備えている。 A configuration of a car navigation (navigation) terminal, which is an example of the
表示装置130は液晶画面等のグラフィクスを表示可能なデバイスである。GPS受信機131は複数のGPS衛星136からの測位信号を受信し、端末の位置を正確に算出する装置である。本体132は内部にCPU,メモリ,電源,グラフィクス表示用デバイスなどが搭載された装置である。この詳細については後に図4を用いて説明する。携帯電話134は外部との通信、すなわち前記したナビサーバ107とのデータ送受信を行う装置である。リモコン135はユーザが行いたい操作をボタンでナビ端末に伝達する装置である。また、マイク137を用いて音声でコマンドを送ることもできる。スピーカ138はナビサーバ137から受信した情報,ナビ操作時のユーザ補助,注意・警告時のビープ音などの音声出力を行うデバイスである。 The
メモリカードスロット133は、不揮発性メモリや小型のハードディスクなどを用いたメモリカードに代表される外部記憶媒体を接続して、ナビサーバ107からの受信データを蓄積したり、過去にナビサーバ107からダウンロードした情報をナビ端末にロードするために利用されるものである。メモリカードスロット133は単なる記憶装置として用いることも可能であるし、通信インタフェース、あるいは放送を受信するためのユーザ情報の認証に用いることも可能である。例えば本ナビ端末を搭載した車両が、レンタカーなどの不特定多数のユーザが使用する車両(及びナビ端末)である場合は、認証情報を書き込んだメモリカードをメモリカードスロット133に挿入することで、前記ユーザがサービスを利用できるようになる。すなわち、他人のナビ端末を使う場合の課金を、端末所有者ではなく端末利用者に課すことができるようになり、利便性が向上する。この時、ナビ端末でサービスを受ける上限金額をメモリカードに設定しておけば、ユーザの予算に合わせた利用も可能となる。また、メモリカードなどに予め出発地点の地図データをダウンロードしておくことにより、ユーザが初期状態で地図データをナビサーバ107からダウンロードする手間も省けることになる。また、ユーザが利用したサービスをメモリカードに書き込み、一定周期ごとにナビサーバ107にアップロードし、それをナビサーバ107側で分析することによりユーザが必要とする頻度の高い情報の配信が可能となる。 The
図3の構成では、通信機器として携帯電話134の例を示したが、他の通信機器として、PHS(Personal Handyphone System),Bluetooth ,無線LAN、あるいはETC等のDSRC(Dedicated Short Range Communication) 端末等の無線通信機能を備えたもの、或いは衛星からの放送電波,地上波デジタルを用いた放送電波,AM/FM電波を用いた放送電波を受信できる受信機、並びに受信したデータをデコードする装置を本体132に付加してもよい。また、GPS受信機131の代わりに、PHSや携帯電話を用いた位置同定サービスを用いてもよい。また、図3はユーザ端末122の一例としてナビ端末の例を示したものであるが、そのうち特にナビ本体132や表示装置130等は、PDA,ノート型パソコン,携帯電話等ある程度の表示手段を持つ端末で代用することも可能である。 In the configuration of FIG. 3, an example of the
図4はナビ端末における本体132のハード構成の一例を示した図である。本例では、CPU141、前記したリモコン135からの信号を解釈するリモコンドラバ142,
RS−232Cドライバ143,携帯電話ドライバ144,メモリカードスロット133とのメモリカードインタフェース145,フラッシュメモリ146,DRAM147,グラフィクスプロセッサ148,グラフィクスメモリ149,NTSCエンコーダ150からなる。オーディオ入出力は、音声認識用のマイク137からの入力と、スピーカ138への音声ガイド出力に用いる。FIG. 4 is a diagram showing an example of a hardware configuration of the
It consists of an RS-
以上に示した構成はナビサーバ107とのデータ授受を通信で行う場合の構成であるが、前記したように、放送メディアを用いる場合の構成としては、放送を受信するためのアンテナとのインタフェース,デコーダなどを必要とする。また、一般的に表示装置130への信号はNTSCが使われるものの、放送でPAL方式を用いている地域、あるいは表示装置130がPAL方式対応の場合は、もちろんNTSCエンコーダ150の部分は
PAL方式に対応したエンコーダとなる。The configuration shown above is a configuration in the case of performing data exchange with the
次に、ナビゲーションシステムで行う交通情報提供サービスの一例について説明する。まず、図1のナビゲーションシステムを用いて、ユーザ車両102のユーザ端末122に渋滞・旅行時間情報,事故・規制情報,SA(サービスエリア)/PA(パーキングエリア)情報,駐車場情報等のリアルタイム情報、あるいは渋滞予測情報や渋滞統計情報など加工された情報を含む各種交通情報をダウンロードする場合の例について述べる。 Next, an example of a traffic information providing service performed by the navigation system will be described. First, real-time information such as traffic jam / travel time information, accident / regulation information, SA (service area) / PA (parking area) information, parking lot information, etc. is transmitted to the
ユーザがリモコン135などの操作部を介して交通情報の要求を入力すると、車両102に搭載されたユーザ端末122は、移動体電話網103,プロバイダ104,IP網106を介して交通情報のダウンロード要求をナビサーバ107に送信する。ここで、ダウンロードしたい要求データのほかに、例えば緯度・経度等で記述された現在位置などの指定位置情報、或いは地図データや交通情報をダウンロードする範囲(エリア)のいずれか、ならびにユーザのID情報,ナビサーバ107のIP網上の位置を示すIPアドレスを送信する。これらの情報を、移動体電話網103を通じてプロバイダ104に伝送する。 When a user inputs a traffic information request via an operation unit such as the
プロバイダ104は、ユーザ端末122から送信された前記情報から、ユーザ端末が指定したナビサーバ107のIPアドレスを認識して、IP網106を通じてナビサーバ
107にアクセスする。The
ナビサーバ107では、交通情報提供センタ100(複数存在してもよい)から送られてくる交通情報を蓄積し、各道路区間及び交差点の渋滞発生頻度や平均渋滞度などの渋滞統計情報と、これまでの渋滞の変化を分析し、近未来における渋滞の増減傾向を予測した渋滞予測情報を、それぞれ渋滞統計処理部121と渋滞予測部120で随時作成する。ユーザ端末122から交通情報ダウンロードの要求が送られてくると、ナビサーバ107では受信したデータ要求範囲(エリア)の渋滞・旅行時間情報,事故・規制情報,SA(サービスエリア)/PA(パーキングエリア)情報,駐車場情報等のリアルタイム情報、あるいは渋滞予測情報や渋滞統計情報など加工された情報を含む各種交通情報を交通情報データベース113から読み出す。 The
次に、前記読み出された交通情報を放送事業者105に送信し、そこで交通情報をエンコード,パケタイズした後に衛星101に向けて送信する。ユーザ車両102に搭載されたユーザ端末122は、衛星101から送られてきたデータを受信した後、デコードして得られた交通情報を表示装置130やスピーカ138に出力する。 Next, the read traffic information is transmitted to the
前記した実施例では放送事業者105を介して交通情報をナビ端末にダウンロードしたが、次の実施例では通信のみで交通情報を取得する方法について示す。ユーザが交通情報のダウンロードを要求すると、ナビ端末から移動体電話網103に対して、先の例と同様にダウンロードしたい要求データのほかに、データを要求する範囲,指定位置情報,ユーザID,ナビサーバ107のIPアドレス等を送信し、プロバイダ104,IP網106を通じて、ナビサーバ107に前記データを送信する。ナビサーバ107では先に示した例と同様に、ダウンロード要求のあった交通情報を読み出す。そして読み出した交通情報を、車両102のユーザ端末122のIPアドレス情報を付与し、パケットに分割して
IP網106,プロバイダ104,移動体電話網103を通じて車両102のユーザ端末122に送信し、ユーザ端末122では受信した交通情報を表示装置130やスピーカ
138に出力する。In the above-described embodiment, the traffic information is downloaded to the navigation terminal via the
なお、渋滞統計情報のように頻繁にデータの更新を行う必要のない情報は、予めハードディスクやメモリカードなどの記憶媒体に格納してもよい。ユーザが該情報をダウンロード要求した場合に、ナビサーバ107からデータをダウンロードして記憶媒体に格納されているデータを上書きすることにより更新してもよいし、あるいは別データとして保存してもよい。これによりユーザ端末122は、記憶媒体から該データを適宜読み出すことにより、データ通信を行うことなくいつでも交通情報を出力することができるようになる。 Information that does not need to be frequently updated, such as traffic jam statistics information, may be stored in advance in a storage medium such as a hard disk or a memory card. When the user requests to download the information, the data may be updated by downloading the data from the
以下、交通情報のダウンロード処理について詳細を説明する。図5は、ユーザ端末122側でユーザがダウンロードしたい交通情報を選択する画面構成の一例である。本画面は、現在の渋滞状況を示す渋滞情報201,通行止めや車線規制,事故などの情報を示す事故・規制情報202,駐車場の空・満情報を示す駐車場情報203,各道路区間の渋滞が伸張傾向であるか、縮小傾向であるかを示す渋滞予測情報204,渋滞発生頻度や平均渋滞度などの統計情報を示す渋滞統計情報205のそれぞれについて、ユーザがリモコン135やマイク13を介した音声入力、あるいはナビ本体132や表示装置130に備えられたハードスイッチなどの操作部を介して各項目の脇に配置されているONボタン210あるいはOFFボタン211を操作することにより、ダウンロードしたい交通情報を選択するものである。交通情報ダウンロード要求時には、本画面でONボタン210が選択された交通情報をナビサーバ107へ要求する。例えば、図5に示す画面のように設定した場合、渋滞情報201,事故・規制情報202,渋滞予測情報204,渋滞統計情報205に該当する各交通情報をナビサーバ107側へ要求することとなる。 Details of the traffic information download process will be described below. FIG. 5 is an example of a screen configuration for selecting traffic information that the user wants to download on the
図6は、ユーザが画面上で位置を指定し、その地点周辺の交通情報をダウンロードする画面遷移の一例である。まず、現在位置を表示している画面300から、リモコンなどの操作部を介して、ユーザが交通情報の欲しい地点まで地図をスクロール301させる。目的の地点に到着するとリモコンなどの操作部を操作し、「メニュー」ボタンを押下することによりメニュー画面302を表示させる。次に、ユーザがメニュー内の交通情報ボタン304を選択すると、交通情報をダウンロードするかを確認するメニュー画面303を表示する。“はい”ボタンが選択されると、図5のような交通情報ダウンロード選択画面で予め設定された項目のデータのダウンロードを開始する。“いいえ”ボタンが選択された場合は、メニュー画面302に遷移する。なお、ユーザが現在地周辺の交通情報をダウンロードしたい場合には、現在地及び現在地周辺の地図が表示されている状況において地図をスクロール(301)することなくメニュー画面302を表示させ、先に記述した操作を行うことで現在地周辺の交通情報をダウンロードすることができる。 FIG. 6 is an example of screen transition in which the user designates a position on the screen and downloads traffic information around the point. First, the map is scrolled 301 from the
図7は、交通情報をダウンロードする際の端末側処理フローの一例である。まず、情報要求位置判定では、ダウンロードする範囲が現在位置周辺か、それともユーザが画面上で要求位置を設定した地点周辺かを判定する(S1000)。現在位置周辺の交通情報を要求された場合には、GPSやジャイロなどの位置検出手段から自車位置の緯度・経度情報を取得する(S1001)。ユーザが指定した位置周辺の交通情報を要求された場合には、画面上で選択された位置を取得し、これを緯度・経度情報に変換する(S1002)。そして得られた緯度・経度情報を中心に、予め定められた矩形サイズの領域をデータ要求範囲として設定する(S1003)。次に、図5に示すような交通情報ダウンロード設定画面で予め選択された交通情報の種別をメモリから読み出して、要求データ種別に設定する(S1004)。前記したデータ要求範囲と、要求データ種別を含む交通情報要求コマンドを、モデムなどを介してナビサーバ107に送信する。ユーザ端末122は、前記交通情報要求コマンドに対してナビサーバ107から送られてくる交通情報を受信すると、メモリカードやハードディスクなどの記憶媒体にデータを格納し、回線を切断する
(S1005)。そして交通情報を表示装置130の地図画面上に表示するように予め設定されていれば(S1006)、ダウンロードした交通情報を記憶媒体から読み出し、格納した交通情報を地図上に重畳表示する(S1007)。なお、目的地までの経路が設定されており、前記経路に対する経路誘導画面(例えばデフォルメ地図のような簡易図形,概略地図など)が表示されている場合には、交通情報を地図上に重畳表示するだけでなく、前記誘導画面にもダウンロードした交通情報を表示してもよい。FIG. 7 is an example of a terminal-side processing flow when downloading traffic information. First, in the information request position determination, it is determined whether the range to be downloaded is around the current position or around the point where the user has set the requested position on the screen (S1000). When traffic information around the current position is requested, latitude / longitude information of the vehicle position is acquired from position detecting means such as GPS or gyro (S1001). When traffic information around the position specified by the user is requested, the position selected on the screen is acquired and converted into latitude / longitude information (S1002). Then, centering on the obtained latitude / longitude information, a predetermined rectangular size area is set as a data request range (S1003). Next, the traffic information type selected in advance on the traffic information download setting screen as shown in FIG. 5 is read from the memory and set as the requested data type (S1004). The traffic information request command including the data request range and the request data type is transmitted to the
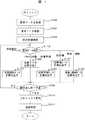
次に、交通情報管理ユニット112における処理の流れについて説明する。該ユニットにおいては、渋滞統計情報と渋滞予測情報の作成処理を行う。まず、渋滞統計情報作成処理について図14のフローチャートに従って説明する。 Next, the flow of processing in the traffic
交通情報管理ユニット112では、交通情報提供センタ100から定期的に送られてくる各リンクID毎の渋滞情報を受信し所定期間蓄積された渋滞情報のうち、指定した期間(例えば現在から過去1ヶ月分など)における渋滞情報を読み出す(S1200)。ここで、渋滞統計情報を作成する際に使う元データである交通情報提供センタ100からの渋滞情報は、車両感知器の感知異常や故障等により異常値(特異値)が混在していることが考えられるため、渋滞統計情報をより高精度なものにするためには次に示す統計的手法を用いた二段階での異常値検出・除去処理を行ってもよい。第一の異常値検出・除去処理は、一日の内の所定時間以上(例えば24時間中夜間を含む20時間以上)が渋滞を示しているリンクIDのデータは、車両感知器の故障やイベント(例えば、東京モーターショー)等による特殊事情が考えられるため該当リンクIDに関するその日一日のデータが異常であるとみなし(S1201)、該当する一日のデータ全体を渋滞統計情報作成に使用しないように除去する(S1202)ものである。次に、第一の異常値検出・除去処理がなされた残りのデータに対して第二の異常値検出・除去処理を行う。第二の異常値検出・除去処理は、同じ時間帯の渋滞情報を複数日に関して比較し、偏差の大きいデータを異常であるとみなし(S1203)、該データを除去する(S1204)ものである。例えば、あるリンクIDの道路に関して平日の5日間における午前10時〜午前11時までの1時間当たりの渋滞発生時間が、それぞれ0分,15分,20分,20分,50分であった場合、平均値(21分)からの差が大きい0分、及び50分のデータを異常とみなして除去する。この偏差の大きいデータを検出する別の方法として、トリム平均による方法のようにデータ母数のうち、所定割合(例えば10%)の最上位及び最下位データを無条件に除去する方法でもよい。上記のような二段階での異常値検出・除去処理が行われた後に、残ったデータを平均化することにより渋滞統計情報を作成する(S1205)。上記S1201〜S1205の処理を全リンクに対して行う(S1206)。そして、作成された各リンクの渋滞統計情報をユーザ端末や家庭のPC等に配信するためのフォーマットにし、さらに後に詳述するメッシュ単位に該データを分割するなどの配信フォーマット編集を行う
(S1207)。The traffic
以上のようにして渋滞統計情報が作成されるが、該情報は、例えば1ヶ月に1度など定期的にナビサーバのカレンダー・時計機能を用いて自動的に作成されるようにしてもよいし、或いはナビサーバのオペレータが必要に応じて該情報を作成するコマンドを入力することにより作成されるようにしてもよい。 As described above, the traffic statistics information is created. However, the information may be automatically created by using a calendar / clock function of the navigation server periodically, for example, once a month. Alternatively, it may be created by inputting a command for creating the information as required by the operator of the navigation server.
ここで、上記の渋滞統計情報作成に関してさらに具体的に説明する。 Here, the above-described traffic jam statistical information creation will be described more specifically.
S1207の配信フォーマット編集処理において、ナビサーバ107における交通情報データの管理のしやすさを考慮した管理単位について例を挙げつつ説明する。蓄積する渋滞情報は、緯度・経度で地表面を等間隔に区切ったメッシュと呼ばれる領域単位で管理し、該メッシュ毎に渋滞の統計情報を作成する。メッシュ以外の管理方法として、都道府県や市区町村単位、あるいは町丁目字単位等ごとの管理、あるいは高速道,国道,県道といった道路種別ごと、あるいは上記の複数の管理単位による組み合わせで管理してもよい。 In the distribution format editing process of S1207, a management unit considering the ease of management of traffic information data in the
S1200の交通情報DBから指定期間のデータ読み出し機能において、例えば、一ヶ月毎の交通情報を蓄積し、交差点等で区切られる各道路区間(リンク)に関する渋滞発生時間の総和や渋滞長時間など渋滞の程度や頻度に関する指標を対象に読み出す。なお、読み出す渋滞情報を曜日ごととすることにより曜日毎の渋滞統計情報を作成してもよいし、或いは平日・日祝日毎に作成してもよい。また、ゴールデンウィークや盆,年末年始など交通状況が特殊な期間においては、それ毎に作成してもよい。さらには、先に述べた渋滞の統計情報を午前・午後、あるいは一時間単位など時間帯を加味して作成してもよい。さらには、図15に示すように、晴,雨,雪などの天候や、乾燥,湿潤,凍結などの路面状況に関する情報を気象情報提供センタ123から取得し、該情報を加味して作成してもよい。 In the data reading function for the specified period from the traffic information DB in S1200, for example, traffic information for each month is accumulated, and the total time of traffic jams for each road section (link) divided by intersections, etc. Read out indicators about degree and frequency. Note that the traffic jam statistics information for each day of the week may be created by setting the traffic jam information to be read for each day of the week, or may be created for each weekday / day / holiday. In addition, during periods with special traffic conditions such as Golden Week, Bon Festival, and New Year's holidays, it may be created for each period. Further, the above-described traffic jam statistical information may be created in consideration of time zones such as morning, afternoon, or hourly units. Further, as shown in FIG. 15, information on weather conditions such as clear, rainy, and snow, and road surface conditions such as dry, wet, and frozen are acquired from the weather
S1205の渋滞統計情報作成において、平均化された渋滞情報(渋滞発生時間)に応じて渋滞発生頻度等のランクを分けてもよい。例えば、1時間中の平均渋滞発生時間が0〜10分は渋滞ランク1(順調)、10〜30分は渋滞ランク2(混雑)、30〜60分は渋滞ランク3(渋滞)と3段階に分ける。また、データが取得できていないか、或いはデータ異常が多くて有意な平均渋滞情報が得られなかったリンクに関しては、渋滞ランク0(渋滞統計情報未取得)としてもよい。 In the traffic jam statistical information creation in S1205, ranks such as traffic jam occurrence frequency may be divided according to the average traffic jam information (traffic jam occurrence time). For example, the average traffic occurrence time during one hour is 0 to 10 minutes, traffic rank 1 (smooth), 10 to 30 minutes is traffic jam rank 2 (congested), 30 to 60 minutes is traffic jam rank 3 (traffic) Divide. In addition, regarding a link for which data has not been acquired or a significant average traffic jam information has not been obtained due to many data abnormalities, the traffic jam rank 0 (traffic jam statistics information may not be obtained) may be used.
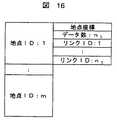
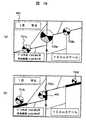
図14のフローチャートに示した例では、渋滞統計情報を道路区間であるリンク単位に作成することを示したが、次に渋滞統計情報を交差点などの地点単位に作成する場合の例を述べる。処理手順としては、図14のフローチャートにおけるS1200〜S1206までは同様で、S1206の処理が終了した後に次のような地点編集処理(S1208)が追加される。S1208においては、図16のような予め作成された地点DBに基づき、リンクの渋滞統計情報から地点の渋滞統計情報を作成する。地点DBは、図17に示すように地点601に対して流入するリンク600を対象として作成され(601から流出するリンクは対象としない)、地点の座標,構成リンク数、及び各構成リンクIDから成る。そして、リンクの渋滞統計情報から地点の渋滞統計情報を作成するには、地点DBに基づき該地点に流入する全リンクを対象として、各リンクIDにおける平均渋滞発生時間のうち最大のものを採用する。あるいは、各リンクIDにおける平均渋滞発生時間の平均値など、地点としての渋滞ポテンシャルを示すものを採用して、渋滞統計情報を作成する。そして、各地点の平均渋滞発生時間に応じて前述の渋滞ランクを作成する。S1207の配信フォーマット編集処理においては、上記リンク単位の場合と同様の処理が行われる
。In the example shown in the flowchart of FIG. 14, it is shown that the traffic congestion statistical information is created in units of links that are road sections. Next, an example in which the traffic congestion statistical information is created in units of points such as intersections will be described. The processing procedure is the same from S1200 to S1206 in the flowchart of FIG. 14, and the following point editing process (S1208) is added after the process of S1206 is completed. In S1208, the traffic jam statistical information of the point is created from the traffic jam statistical information of the link based on the point DB created in advance as shown in FIG. The point DB is created for the link 600 that flows into the
以上のようにすれば、地点単位の渋滞統計情報を作成することができる。図16に示したように、地点単位の渋滞統計情報は、該当地点に流入するリンクの渋滞統計情報を集約したものであるため、リンク単位の渋滞統計情報に比べてデータ量を削減することができ、広域地図上に表示する場合において乱雑な表示を避け視認性が向上する点でも有効である。この地点単位の渋滞統計情報は、具体的には交差点毎の渋滞情報を意味するため、各交差点がどれほどの混雑/渋滞状況にあるかが容易に把握できるようになる。 If it does in the above way, the traffic statistics information of a point unit can be created. As shown in FIG. 16, the traffic congestion statistics information for each point is a collection of the traffic congestion statistics information for the links flowing into the corresponding points, and therefore the data amount can be reduced compared to the traffic congestion statistics information for each link. This is also effective in improving visibility by avoiding messy display when displaying on a wide area map. This traffic statistics information for each point specifically means traffic information for each intersection, so that it is possible to easily understand how crowded / congested each intersection is.
次に渋滞予測情報作成処理について説明する。所定時間前から現在まで(直近過去)の渋滞指標の変化を蓄積・分析し、近未来における渋滞の増減傾向情報である渋滞予測情報を作成する。例えば、渋滞指標の変化を分析した結果が渋滞増加方向であれば渋滞がこれから伸張すると判断し、減少傾向であれば該渋滞は縮小方向であると判断する。前記渋滞傾向の判断においては、現在から所定時間前までの直近過去における渋滞情報のみを用いて判断してもよいし、あるいは前記の直近過去における渋滞情報に加えて1ヶ月など所定期間蓄積したデータの平均値など統計処理された渋滞統計データを用いて判断してもよい。また、渋滞指標の分析結果において、その変化率の大小によって渋滞の増減傾向をランク分けしてもよく、例えば、渋滞増加傾向大,渋滞増加傾向小,渋滞減少傾向大,渋滞減少傾向小などと表現する。これにより、渋滞,混雑,順調の3段階等でしか提供されなかった現渋滞情報に対して、該渋滞が今後どう変化するのかが容易に分かり、ユーザは走行経路選択をする上でより柔軟に対応することができるようになる。例えば、走行経路の前方1kmの道路区間が同じ“渋滞”という情報でも、渋滞減少傾向であるならば経路を変更せずにそのまま渋滞している道路を走行しても、そこへ到達する頃には渋滞が解消していると判断することができ、逆に渋滞増加傾向であるならば経路を変更するようにナビサーバ107に要求することによって渋滞を未然に回避することができる。 Next, the traffic jam prediction information creation process will be described. Accumulate and analyze changes in traffic congestion index from a predetermined time before to the present (most recent past), and create traffic congestion prediction information that is information on the trend of traffic congestion in the near future. For example, if the result of analyzing the change in the traffic jam index indicates that the traffic jam is increasing, it is determined that the traffic jam will be extended, and if it is decreasing, it is determined that the traffic jam is in the reduction direction. In the determination of the traffic jam tendency, it may be determined using only traffic information in the latest past from the present to a predetermined time ago, or data accumulated for a predetermined period such as one month in addition to the traffic jam information in the latest past. Judgment may also be made using traffic statistics data that has been statistically processed, such as the average value of. In addition, in the analysis result of the traffic jam index, the increase / decrease trend of the traffic jam may be ranked according to the magnitude of the rate of change. For example, the traffic jam increase tendency, the traffic congestion increase tendency, the traffic congestion decrease tendency, the traffic congestion decrease tendency, etc. Express. This makes it easy to see how the traffic will change in the future with respect to the current traffic information that was provided only in three stages, such as traffic jam, congestion, and smoothness, so that the user can be more flexible in selecting a travel route. It will be possible to respond. For example, even if it is information that the
次に、ユーザが交通情報ダウンロードを要求した時のナビサーバ107の処理について説明する。図8は、交通情報をダウンロードする際のナビサーバ側処理フローの一例である。ナビサーバ107において、CGI115にてユーザ認証を行った後、交通情報管理ユニット112に要求コマンドを含むデータが送信される。交通情報管理ユニット112はナビ端末からの交通情報要求コマンドを受信すると(S1100)、該要求コマンドを解析して、該要求コマンドの中から交通情報をダウンロードする矩形範囲,ダウンロードするデータ種別(リアルタイムの渋滞情報,事故・規制情報,駐車場情報、及び渋滞統計情報,渋滞予測情報等)などを抽出する(S1101)。 Next, processing of the
要求範囲変換S1102では、前記矩形範囲を含むメッシュを探し出し、該当するメッシュの交通情報を読み出し対象に設定する処理を行う。要求データ判定S1103では、要求されたデータ種別を判定し、該当データ種別のデータ読出処理(S1104〜S1108)に分岐させ、要求されたデータ種別が渋滞統計であれば渋滞統計データを読み出し、要求されたデータ種別がリアルタイム渋滞情報であればリアルタイム渋滞データを読み出し、要求されたデータ種別が事故・規制であれば事故・規制情報データを読み出し、要求されたデータ種別が渋滞予測情報であれば渋滞予測データを読み出し、要求されたデータ種別が駐車場であれば駐車場データを読み出す。 In the required range conversion S1102, a mesh including the rectangular range is searched and the traffic information of the corresponding mesh is set as a read target. In the requested data determination S1103, the requested data type is determined and branched to the data reading process (S1104 to S1108) of the corresponding data type. If the requested data type is traffic jam statistics, the traffic statistics data is read and requested. If the data type is real-time traffic jam information, the real-time traffic jam data is read. If the requested data type is accident / regulation, the accident / regulation information data is read. If the requested data type is traffic jam forecast information, traffic jam prediction is performed. Data is read, and if the requested data type is a parking lot, the parking lot data is read.
読出終了判定S1109では、要求された全てのデータ種別の交通情報を読み出しが終了したか判定する。複数のデータ種別の情報がダウンロード要求されている場合には、ダウンロードするデータ種別を更新し、要求データ判定S1103へ遷移する。全ての交通情報を読み出すと、フォーマット変換S1110の処理で読み出した交通情報に各情報種別やデータサイズなどのヘッダ情報が付加された通信フォーマット形式に変換する。送信処理S1111では、通信フォーマット形式に変換済みの交通情報をCGI115,IP網等を介してユーザ端末122や家庭のPC110へ送信する。 In reading end determination S1109, it is determined whether reading of traffic information of all requested data types has been completed. When information on a plurality of data types is requested to be downloaded, the data type to be downloaded is updated, and the process proceeds to request data determination S1103. When all the traffic information is read out, it is converted into a communication format in which header information such as each information type and data size is added to the traffic information read in the process of format conversion S1110. In the transmission process S1111, the traffic information converted into the communication format is transmitted to the
図9は、交通情報に関する通信フォーマットの一例である。管理ヘッダ部は、通信データの総データサイズと、通信データに含まれる対象領域のメッシュ枚数を表すデータ数,各メッシュ単位のデータへのデータ先頭からのオフセットと前記データサイズ等で構成される交通情報管理データである。 FIG. 9 is an example of a communication format related to traffic information. The management header portion includes the total data size of the communication data, the number of data representing the number of meshes of the target area included in the communication data, the offset from the data head to the data of each mesh unit, the data size, etc. Information management data.
メッシュ単位に管理される交通情報は、データヘッダ部とリアルタイム渋滞データや渋滞予測データ,事故・規制データ,渋滞統計データ,駐車場データなど、ダウンロード要求されたデータ種別のデータ部で構成される。 The traffic information managed in mesh units includes a data header part and a data part of the data type requested to be downloaded, such as real-time traffic jam data, traffic jam prediction data, accident / regulation data, traffic jam statistics data, and parking lot data.
データヘッダ部は、地表面を緯度・経度座標系で等間隔に区切った領域ごとに付加されるユニークな値であるメッシュIDと、本データに格納されているデータ種別を表す格納データ種別と、各データ種別のデータ先頭までのオフセット,格納データ数,データサイズ等から成る管理データで構成される。リアルタイム渋滞データは、道路区間ごとに付けられ前記メッシュ内でユニークな値であるリンクIDと、前記リンクIDに対する道路区間の渋滞度や渋滞長等から成る渋滞情報、前記リンクIDに対する緯度・経度の道路形状で1つの渋滞情報が構成され、これらが管理部のデータ数分格納されている。渋滞予測データは、リンクIDと、渋滞が伸張傾向にあるか、縮小傾向にあるかを表す渋滞傾向情報から構成され、これらが管理部に記載されているデータ数分格納されている。事故・規制データは、事故や規制が発生している場所を表す緯度・経度の地点座標と、事故・規制が発生した道路区間を表すリンクID,車線規制,通行止めなど事故・規制の種類及びその原因を表す事故・規制種別から構成され、これらが管理部に記載されているデータ数分格納されている。渋滞統計データは、渋滞が多発する場所を表す緯度・経度の地点座標、あるいは渋滞が多発する道路区間を表すリンクIDと、該渋滞多発地点が有効な季節,月,曜日,午前・午後,時間帯などを表す統計時間帯,渋滞の発生頻度を表す渋滞発生頻度
(または渋滞ランク),渋滞が発生した場合の平均的な渋滞度を表す平均渋滞度,データの信頼度などの情報から構成され、これらが管理部に記載されているデータ数分格納されている。駐車場データは、駐車場の場所を示す経度の地点座標と、該駐車場の識別コードである駐車場IDと、該駐車場の満空状況や運営状況(営業中か閉鎖中か)等の情報から成る駐車場状態等から構成され、これらが管理部に記載されているデータ数分格納されている。The data header part includes a mesh ID, which is a unique value added for each region obtained by dividing the ground surface at equal intervals in the latitude / longitude coordinate system, a stored data type indicating the data type stored in the data, It consists of management data consisting of the offset to the beginning of each data type, the number of stored data, the data size, and the like. The real-time traffic jam data includes a link ID that is assigned to each road segment and is a unique value in the mesh, traffic jam information including a traffic jam degree and a traffic jam length of the road segment with respect to the link ID, and latitude / longitude of the link ID. One traffic jam information is constituted by the road shape, and these are stored for the number of data of the management unit. The traffic jam prediction data is composed of a link ID and traffic jam trend information indicating whether the traffic jam is expanding or contracting, and these are stored for the number of data described in the management unit. Accident / regulation data includes latitude / longitude coordinates indicating the location where the accident / regulation occurs, the link ID indicating the road section where the accident / regulation occurred, the lane regulation, the type of accident / regulation such as traffic closure, etc. It consists of accident / regulation types that indicate the cause, and these are stored for the number of data described in the management department. Congestion statistical data includes latitude / longitude point coordinates that indicate where traffic jams frequently occur, or link IDs that indicate road segments where traffic jams occur frequently, and the season, month, day of the week, morning / afternoon, and time when the traffic jams occur frequently It consists of information such as the statistical time zone that represents the time zone, the frequency of occurrence of traffic jams (or traffic jam rank) that represents the frequency of traffic jams, the average traffic jam level that represents the average level of traffic jams, and the reliability of data. These are stored for the number of data described in the management unit. The parking lot data includes the coordinates of the longitude indicating the location of the parking lot, the parking lot ID that is the identification code of the parking lot, and the parking lot availability and operating status (whether it is open or closed). It consists of a parking lot state or the like consisting of information, and these are stored for the number of data described in the management section.
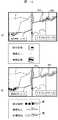
次に、車両のユーザ端末や家庭のPC等の端末での渋滞統計情報の表示例を図10に示す。図10(a)は、渋滞多発地点を中心として渋滞発生頻度等に応じた半径の円により、渋滞多発地点及びその程度を表す円図形400を地図上に重畳表示していることを示している。画面左上に表示している有効時間401は、地図に重畳表示されている統計情報が有効である日時及び時間帯を示している。画面左下に表示しているデータ作成時間及び有効期限404は、表示している渋滞統計情報が作成された日時、及び該渋滞統計情報が有効な期限を表示している。例えば、有効時間401で地図上に重畳表示している渋滞統計情報が1月の平日,AM9時〜10時の間の統計情報であり、この時間帯での有効性が高いことを示している。また、データ作成及び有効期限404では、本データが2002年の6月に作成され、2003年の6月まで有効であることを示している。 Next, FIG. 10 shows a display example of traffic jam statistical information on a terminal such as a user terminal of a vehicle or a home PC. FIG. 10 (a) shows that a circle figure 400 representing a heavy traffic congestion point and its degree is superimposed on the map by a circle with a radius corresponding to the frequency of traffic congestion centering on the heavy traffic congestion point. . The
本実施例では図10(a)と(b)に示すように地図の表示スケールを変更した場合には、渋滞統計情報400の表示形態を変更している。例えば、図10(a)のように地図が拡大(詳細)表示されている場合には、渋滞発生頻度により円の大きさを変更して渋滞の程度の把握を助け、地図が縮小(広域)表示された場合には、図10(b)のように、所定の渋滞度以上の交差点について、予め定められた一定の大きさの円で渋滞発生頻度
410を表示して、渋滞発生箇所の識別を助けている。即ち、地図を拡大表示している際には、各交差点における詳細な渋滞度の情報を提供するが、地図を表示する際には、交差点における渋滞度の際を把握することが次第に難しくなるため、渋滞の発生している交差点を表示することに重点を置いた表示とする。そして、軽度の渋滞までも同じ大きさの円で表示した場合、かえって地図の視認性を低下させることになるため、所定の渋滞度以上の交差点に限って渋滞発生を表す円を表示する。なお、表示対象となる渋滞度は、地図の縮尺に伴い変化させても良く、この場合、地図の縮尺毎に基準となる渋滞度と表示する際の円の大きさが定められている。さらに、表示する円の大きさを可変とするか固定とするかについての情報も地図の縮尺毎に定められている。これらの情報を用いて地図上に交差点の渋滞度を表す円を表示することにより、地図の視認性を損なわずに交差点の渋滞状況を表すことができる。In this embodiment, when the map display scale is changed as shown in FIGS. 10A and 10B, the display form of the traffic
上記の例の場合、表示する地図の縮尺を変更する場合、渋滞度の大小により交差点と対応付けて表示する渋滞度を選別したが、後述する渋滞状況の信頼度に基づいて選別しても良い。この場合、一定値以上の信頼度を有する交通情報に限って地図上に渋滞状況を表示することにより、地図を縮小表示した際に、渋滞状況に関して信頼度の高い概要を把握することができる。 In the case of the above example, when changing the scale of the map to be displayed, the congestion level displayed in association with the intersection is selected according to the size of the congestion level, but may be selected based on the reliability of the congestion situation described later. . In this case, by displaying the traffic situation on the map only for traffic information having a certain level of reliability or higher, it is possible to grasp a high-reliability outline regarding the traffic situation when the map is displayed in a reduced size.
前記した実施例では円の大きさを渋滞の発生頻度で選択した例を示したが、該地点における平均渋滞度で円の大きさを決定してもよい。あるいは、渋滞状況に関する情報(発生頻度または平均渋滞度)に応じて変化させる表示は、円の大きさの代わりに、円の色であってもよいし、またその組み合わせであってもよい。さらには、上記渋滞状況に関する情報に加えてデータ信頼度を加味し、表示する円の円周部を実線または破線で表示してもよい。例えば、実線400はデータの信頼度が比較的高く、破線406は信頼度が比較的低いことを意味する。ここで、データ信頼度とは、渋滞統計情報の再現性に相当し、再現性が高く日によって大きく変化する確率が少ない場合には信頼度が高くなる。 In the above-described embodiment, an example in which the size of the circle is selected based on the occurrence frequency of the traffic jam has been shown. However, the size of the circle may be determined based on the average congestion level at the point. Or the display changed according to the information (occurrence frequency or average congestion degree) regarding the traffic situation may be the color of the circle instead of the size of the circle, or a combination thereof. Furthermore, in addition to the information on the traffic jam situation, the data reliability may be taken into account, and the circumference of the circle to be displayed may be displayed as a solid line or a broken line. For example, the
この信頼度は、各日における渋滞発生時間,平均渋滞ランク、または旅行時間などの値の分散(または標準偏差)によって決められる。例えば、あるリンクIDの道路に関して平日の5日間における午前10時〜午前11時までの1時間当たりの渋滞発生時間が、それぞれ0分,15分,20分,20分,50分であった場合の標準偏差は18.1659 分であり、これを所定の閾値と比較することにより信頼度について複数のランク分けをすることができる。閾値の例としては、標準偏差0〜10分未満でランク1(信頼度高)、10〜20分未満でランク2(信頼度中)、30分以上でランク3(信頼度低)などとすればよい。 This reliability is determined by the variance (or standard deviation) of values such as the congestion occurrence time, average congestion rank, or travel time on each day. For example, when the traffic occurrence time per hour from 10:00 am to 11:00 am on 5 days on weekdays for a road with a certain link ID is 0 minutes, 15 minutes, 20 minutes, 20 minutes, and 50 minutes, respectively. The standard deviation of is 18.1659 minutes, and by comparing this with a predetermined threshold, multiple ranks can be classified for reliability. Examples of threshold values include rank 1 (high reliability) with standard deviation of 0 to less than 10 minutes, rank 2 (medium reliability) with less than 10 to 20 minutes, rank 3 (low reliability) with more than 30 minutes. That's fine.
なお、信頼度に応じて線種を点線,破線,一点鎖線,二点鎖線等と変更しても良い。また、時間帯毎の渋滞統計情報が提供されている場合には、端末で持っているカレンダー、GPSから受信した時刻データ,車両が管理している時刻データを用い、端末側で現在の時間帯等に最も有効な渋滞統計情報を自動的に選択して表示してもよいし、あるいは渋滞情報の有効時間401を手動操作する手段を設け、ユーザの好みに応じて現在の時間帯等と異なる時間帯の渋滞統計情報を表示してもよい。 The line type may be changed to a dotted line, a broken line, a one-dot chain line, a two-dot chain line, or the like according to the reliability. In addition, if traffic statistics for each time zone are provided, the current time zone on the terminal side using the calendar held by the terminal, the time data received from the GPS, and the time data managed by the vehicle The most effective traffic statistics information may be automatically selected and displayed, or a means for manually operating the traffic information
また、本実施例では渋滞統計情報のデータ作成時間及び有効期限404を文字列で表示しているが、現在の日時が有効期限を過ぎると有効時間401のプレートの色を変更したり、渋滞多発地点400の表示色などを変更することにより、ユーザに本渋滞統計情報のデータが有効期限切れであることを通知してもよい。例えば、渋滞統計データが有効期限内であれば、有効時間401のプレートの色を灰色で表示し、有効期限を過ぎると、有効時間401のプレートの色を赤色で表示する。また、渋滞統計データが有効期限内の場合は前記したように渋滞多発地点を表示し、有効期限を過ぎると渋滞多発地点を示す図形の透過率や輝度,色彩を変更して表示したり、図形の大きさを小さくするなど情報の質に問題があることがわかるように表示する。 In this embodiment, the data creation time of the traffic jam statistical information and the
ところで、渋滞統計情報が提供されていないエリアが存在する場合には、渋滞統計情報が提供されているエリアと、提供されていないエリアを異なる地図背景色で表示してもよい。例えば、渋滞統計情報が存在しないエリアは通常の地図背景色で描画し、渋滞統計情報が存在するエリアは通常の地図背景色と異なる色で描画する。 By the way, when there is an area where the traffic statistics information is not provided, the area where the traffic statistics information is provided and the area where the traffic statistics information is not provided may be displayed in different map background colors. For example, an area where the traffic statistics information does not exist is drawn with a normal map background color, and an area where the traffic statistics information exists is drawn with a color different from the normal map background color.
ユーザ端末や家庭のPCでの渋滞統計情報の別な表示例を図11に示す。図11(a)は渋滞多発地点の座標をイメージの中心位置に合わせ、渋滞発生頻度等によりアイコン
402を選択して表示している。図11(b)は、渋滞統計情報が交差点などの地点型ではなく、区間(リンク)単位に表示する場合の例である。渋滞の多発する道路区間に、道路の形状の背面により太い線を描くいわゆる座布団で渋滞区間を表示した例である。FIG. 11 shows another display example of the traffic congestion statistical information on the user terminal or home PC. In FIG. 11A, the coordinates of a heavy traffic jam point are aligned with the center position of the image, and an
まず、海や河川,緑地などの背景データを描画し、次に渋滞多発区間の道路を渋滞発生頻度により線の色を選択し、道路より太い線で描画する。この場合、渋滞区間403は赤で、渋滞区間406は黄色で、渋滞区間408は橙で描画される。その後、道路や名称などの情報を重ねて描画することにより、図11(b)のような画面が表示される。なお、図10及び図11で示した渋滞統計情報の表示方法を組み合わせ、詳細な地図を表示している場合には、円形状で渋滞発生頻度400を表示し、広域の地図を表示する場合には、渋滞多発地点を示すアイコン402を表示してもよい。また、地点単位の渋滞統計情報と区間単位の渋滞統計情報を併用し、詳細な地図を表示している場合には、図11(b)に示すように道路区間ごとの渋滞統計情報403を表示し、広域の地図を表示する場合には、渋滞多発地点を示すアイコン402を表示してもよい。さらに、図11(c)に示すように目的地までの経路405が設定されている場合には、経路405上の渋滞統計情報
411を抽出して表示してもよい。また、区間単位の渋滞統計情報表示に際して、該区間に進行方向が識別できる場合には、図11(b)のような太線で描画する代わりに、道路に沿いつつ左側へ若干ずらして描画してもよい。First, background data such as seas, rivers, and green areas is drawn, and then the color of a road in a heavy traffic jam section is selected based on the frequency of occurrence of traffic jams and drawn with a thicker line than the road. In this case, the
さらに、図10のような地点単位の表示だけでは具体的な渋滞発生道路の方向がわからないため、図11(d)のように地点単位と区間単位を併用表示してもよいし、区間単位のみの表示としてもよい。地点単位の表示形態は、図16に示したように複数リンクを集約した渋滞統計情報に相当するため広域道路ネットワークの渋滞状況を概観する際に特に有効であり、リンク単位の表示形態は、進行方向別の詳細な渋滞統計情報であるため詳細な渋滞状況を把握する際に特に有効である。このことから、地図の表示スケールに応じて表示形態を自動的に切り替えてもよい。この場合、前述の例と同様にして、表示する地図の縮尺毎に地点単位表示と区間単位表示の表示の有無を定めた情報を持つか、あるいは、地点単位表示と区間単位表示を両方行う下限の縮尺を設定し、この縮尺より詳細表示を行う場合には地点単位と区間単位の表示を行い、逆にこの縮尺より広域表示を行う場合には、地点単位表示に限って渋滞状況の表示を行う。 Further, since the specific direction of the traffic jam occurrence road is not known only by the point unit display as shown in FIG. 10, the point unit and the section unit may be displayed together as shown in FIG. May be displayed. As shown in FIG. 16, the point-by-point display form corresponds to the traffic congestion statistical information in which a plurality of links are aggregated, and is particularly effective when overviewing the traffic situation of the wide area road network. Since it is detailed traffic statistics by direction, it is particularly effective when grasping detailed traffic conditions. Therefore, the display form may be automatically switched according to the map display scale. In this case, in the same manner as in the above example, there is information that determines whether or not to display point unit display and section unit display for each scale of the map to be displayed, or the lower limit for performing both point unit display and section unit display When the detailed scale is displayed from this scale, the point unit and the section unit are displayed. Conversely, when the wide area display is performed from this scale, the traffic congestion status is displayed only in the point unit display. Do.
図11(d)において、400,406は交差点(地点)単位、407,408は方向付き区間(リンク)単位それぞれの渋滞統計情報を地図上に重畳表示した例を示している。また、それぞれに対して渋滞発生頻度等の渋滞度合いに応じて色や長さ,線の太さ等を区別してもよい。さらには、407は実線、408は破線で表示しているように、前記のデータ信頼度の高低に応じて表示を変えてもよい。 In FIG. 11 (d), 400 and 406 show the traffic congestion statistical information on the map, and 407 and 408 show the traffic congestion statistical information on the map. Further, the color, length, line thickness, and the like may be distinguished from each other according to the degree of traffic congestion such as the frequency of occurrence of traffic congestion. Furthermore, the display may be changed according to the level of the data reliability, as indicated by a solid line 407 and a
ユーザ端末や家庭のPCでの渋滞統計情報のさらに別な表示例を図18に示す。図18(a)は、渋滞多発地点(交差点)を中心として渋滞発生頻度または平均渋滞度等に応じた半径の円により、渋滞多発地点及びその渋滞発生頻度または平均渋滞度と発生時間帯を表す円グラフ700及び701を地図上に重畳表示していることを示している。発生時間帯を表す円グラフがあるため渋滞統計情報の有効時間401については時間帯に関する記述はない。円グラフは、真北(真上)方向が午前0時を意味し、時計回りに1時間単位に24時間分の渋滞統計情報に関する時間帯が刻まれており、グラフの色によって対応する時間帯の渋滞発生頻度等が表される。例えば図の700aは、0時から6時(台)までは順調、9時(台)までは渋滞、16時(台)までは混雑、20時台までは渋滞、23時
(台)までは順調を意味している。また、図18(b)は、渋滞多発道路区間(リンク)の位置を示し、さらに各渋滞多発道路区間に関する渋滞程度と発生時間帯を表す円グラフを地図上の該当リンク付近に重畳表示していることを示している。前者のような地点単位の表示形態は、図16に示したように複数リンクを集約した渋滞統計情報に相当するため広域道路ネットワークの渋滞状況を概観する際に特に有効であり、後者のようなリンク単位の表示形態は、進行方向別の詳細な渋滞統計情報であるため詳細な渋滞状況を把握する際に特に有効である。このことから、地図の表示スケールに応じて表示形態を自動的に切り替えてもよい。なお、図において、700の円グラフの円周が実線であるのに対し、
701が破線となっているのは、すでに述べたように渋滞統計情報の信頼度を表している
。FIG. 18 shows still another display example of the traffic jam statistics information on the user terminal or the home PC. FIG. 18A shows a heavy traffic jam point and its traffic frequency or average traffic level and time zone by a circle with a radius corresponding to the traffic frequency or average traffic level, etc. centering on the traffic jam point (intersection). It shows that the pie charts 700 and 701 are superimposed on the map. Since there is a pie chart representing the occurrence time zone, there is no description regarding the time zone for the
The broken line 701 represents the reliability of the traffic congestion statistical information as described above.
次に、ユーザ端末または家庭のPCでの渋滞予測情報の表示例を図12に示す。図12(a)は、縁取りの矢印線500で現在の渋滞と渋滞傾向を表示した場合の例である。矢印線の長さで渋滞区間を表し、矢印線の内側の色で現在の渋滞度を、矢印線縁取り色で渋滞傾向を表している。例えば矢印線の内側の色を、順調を緑色,混雑を黄色,渋滞を赤色で表現する。また矢印線縁取り色を、渋滞縮小傾向を青色,渋滞伸張傾向を紫色で表現すると、現在混雑の道路が伸張傾向にあるデータは、紫色で縁取りされた中心が黄色の矢印線500が表示される。このように、渋滞区間が縮小傾向を示す矢印線504は青色で縁取られ、増減なしを示す矢印線505は白で縁取られ、伸長傾向を表す矢印線506は紫色で縁取られて描画される。本実施例では、地図の表示スケールにより渋滞予測情報を表示するか選択している。例えば、図12(a)のように地図が拡大(詳細)表示されている場合は、渋滞情報と共に渋滞予測情報を示す矢印線500を表示し、地図が縮小(広域)表示された場合には、図12(b)のように渋滞情報を示す線501を地図上に重畳表示している。 Next, a display example of traffic jam prediction information on a user terminal or a home PC is shown in FIG. FIG. 12A shows an example in which the current traffic jam and the traffic jam trend are displayed by the
前記した例では、地図を拡大表示した場合のみ渋滞予測情報を表示したが、地図の表示スケールによって後述するような別の表示形態を用いて渋滞予測情報を表示してもよい。図13(a)は、矢印線501とアイコン502により、現在の渋滞状況と渋滞傾向を表示した場合の例である。現在の渋滞区間を矢印線501の長さで、矢印線501の色で渋滞度を表し、渋滞傾向を表すアイコン502を矢印線501上に重畳表示している。尚、本実施例では、渋滞区間の中間点にアイコン502を表示しているが、渋滞末尾にアイコン502を表示してもよい。さらに、渋滞区間の距離が長い時など距離によっては複数箇所にアイコン502を表示してもよい。 In the above-described example, the traffic jam prediction information is displayed only when the map is enlarged, but the traffic jam prediction information may be displayed using another display form as described later according to the map display scale. FIG. 13A shows an example in which the current traffic jam situation and traffic jam trend are displayed by the
図13(b)は、現在の渋滞状況を矢印線501の長さで渋滞区間、矢印線501の色で渋滞度を表し、矢印線501上に、渋滞傾向を表す別の線パターン、又は等間隔にアイコンを表示した線503を表示している。例えば矢印線の色を、順調を緑色,混雑を黄色,渋滞を赤色で表現し、渋滞縮小傾向を青色の円,渋滞伸張傾向を紫色の円で表現すると、現在混雑の道路が伸張傾向にあるデータは、黄色の矢印線501の上に渋滞先頭から等間隔で紫色の円503が表示される。従って、渋滞区間が縮小傾向を示す矢印線507には青色の円が並んで描画され、伸長傾向を表す矢印線508は紫色の円が並んで描画される。 FIG. 13B shows the current traffic jam situation with the length of the
この他に、渋滞傾向を矢印線501の線幅で表現したり、線のスタイルで表現してもよい。例えば、渋滞傾向が、伸張傾向であれば通常より太い線で矢印線を描画し、縮小傾向であれば通常より細く矢印線を描画したり、伸張傾向であれば、二重線で矢印線を描画し、縮小傾向であれば、破線で描画してもよい。また、渋滞統計情報と同様に、渋滞予測情報に関する信頼度に応じて線を実線,破線と使い分けてもよい。 In addition, the traffic jam tendency may be expressed by the line width of the
なお、図10等の地図は、現在地周辺地図を拡大(詳細)表示し、現在地から遠方の地図を縮小(広域)表示するような形式の地図、即ち、鳥瞰図的に表示する地図,三次元的に表示する地図でも構わない。 Note that the map in FIG. 10 and the like is a map in a format in which a map around the current location is enlarged (detailed) and a map far from the current location is displayed (wide), that is, a bird's eye view map, three-dimensional It does not matter if the map is displayed on the screen.
以上によれば、地図上に統計的な渋滞情報を表示することで、日常的,慢性的に渋滞する交差点や道路区間をユーザが容易に把握することができる。また、季節や、天候,路面状況、あるいは日祝日・平日,時間帯毎に渋滞の統計情報を提供することで、より詳細に渋滞の多発する地点や平均的な渋滞の度合いも把握することができる。また、該統計情報の信頼度を付加することにより、ユーザは提供された情報をどの程度信頼できるかの判断の目安とすることができる。また、現在の渋滞が今後伸長するか、それとも縮小するかの渋滞増減傾向情報をサーバ側で分析し、該情報をユーザに提供することで、ユーザが渋滞を回避するか否かの判断を容易にすることが可能となる。 According to the above, by displaying statistical traffic jam information on a map, the user can easily grasp intersections and road sections that are routinely and chronically jammed. In addition, by providing statistical information on traffic jams by season, weather, road surface conditions, or on public holidays, weekdays, and time zones, it is possible to grasp the points where traffic jams occur frequently and the average level of traffic jams in more detail. it can. Further, by adding the reliability of the statistical information, the user can use it as a guide for determining how reliable the provided information is. In addition, it is easy for the user to determine whether or not to avoid traffic congestion by analyzing the traffic increase / decrease trend information on whether the current traffic congestion will increase or decrease in the future, and providing this information to the user. It becomes possible to.
100…交通情報提供センタ、101…衛星、102…ユーザ車両、103…移動体電話網、104…プロバイダ、105…放送事業者、106…IP網、107…ナビサーバ、108…固定電話網、109…ユーザの自宅、110…パーソナルコンピュータ、111…ユーザ管理ユニット、112…交通情報管理ユニット、113…交通情報データベース、114…地図編集ユニット、115…CGI、116…経路探索ユニット、117…ユーザ情報登録・編集部、118…ユーザ情報データベース、119…料金計算ユニット、120…渋滞予測部、121…渋滞統計処理部、122…ユーザ端末、124…地図切出部、125…地図データベース、126…オプション情報データベース、127…経路探索エンジン、128…オプション情報設定・変更部、129…誘導点作成部。 DESCRIPTION OF
Claims (3)
Translated fromJapanese前記交通情報提供センタから提供を受けた情報を蓄積する第一の蓄積手段と、
該第一の蓄積手段に蓄積した過去の渋滞情報を基に、異常値を検出する第一の検出手段と第二の検出手段により、前記第一の検出手段では一日の内の所定時間以上が渋滞を示した場合には当該一日全体のデータを異常と判定し、前記第二の検出手段では同じ時間帯の渋滞情報を複数日に関して比較し偏差の大きいデータを異常と判定し、異常値が検出された場合にはこれを除去した上で交差点などの所定地点又は交差点の間の道路区間における渋滞情報並びに該渋滞情報の標準偏差に基づき該渋滞情報の再現性を評価した信頼度を含む渋滞統計情報を作成する渋滞統計情報作成手段と、
該渋滞統計情報作成手段で作成された情報を蓄積する第二の蓄積手段と、を備え、
前記渋滞情報は渋滞の発生頻度又は平均渋滞度の少なくとも一方を含む情報であり、
前記端末からの要求に基づいて、又は、所定のタイミングで、前記第二の蓄積手段に蓄積された情報を前記端末へ提示又は提供するナビサーバ。A navigation server that receives information from a traffic information providing center and presents or provides information created based on the information toa terminalthat is an in-vehicle navigation device ,
First storage means for storing information received from the traffic information providing center;
Based on thepast traffic jam information accumulated in the first accumulation means,the first detection means for detecting an abnormal value and the second detection means allow the first detection means to perform at least a predetermined time of the day. Indicates that the data for the entire day is abnormal, the second detection means compares the traffic information for the same time period for multiple days and determines that data with a large deviation is abnormal. When the value is detected, the reliability is evaluated afterremoving this and evaluating the reproducibility of the traffic jam information based on the traffic jam informationat a predetermined point such as an intersection or a road section between the intersections and the standard deviation of the traffic jam information. Congestion statistics information creation means to create congestion statistics information including,
Second storage means for storing the information created by the traffic jam statistical information creation means,
The traffic jam information is information including at least one of the occurrence frequency of traffic jams or the average traffic jam degree,
A navigation server that presents or provides information stored in the second storage means to the terminal based on a request from the terminal or at a predetermined timing.
前記渋滞統計情報作成手段は、前記第一の蓄積手段に蓄積した過去の交通情報及び気象情報提供センタからの天候又は路面状況に関する情報を基に、天候又は路面状況単位毎に前記渋滞統計情報を作成することを特徴とするナビサーバ。In claim1 ,
The traffic jam statistics information creating means generates the traffic jam statistics information for each unit of weather or road surface condition based on past traffic information accumulated in the first accumulation means and information on weather or road surface status from a weather information providing center. A navigation server characterized by creating.
前記渋滞統計情報作成手段は、前記第一の蓄積手段に蓄積した情報と前記交通情報提供センタから提供を受けたリアルタイムの情報から、各渋滞の今後の渋滞傾向に関する渋滞予測情報を作成する渋滞予測情報作成手段を備えたことを特徴とするナビサーバ。The navigation server according to claim 1,
The traffic jam statistical information creating means creates traffic jam prediction information related to a future traffic jam trend of each traffic jam from the information accumulated in the first accumulating means and real-time information provided from the traffic information providing center. A navigation server comprising an information creating means.
Priority Applications (1)
| Application Number | Priority Date | Filing Date | Title |
|---|---|---|---|
| JP2004003576AJP4528528B2 (en) | 2003-01-10 | 2004-01-09 | Navigation server, navigation display method |
Applications Claiming Priority (2)
| Application Number | Priority Date | Filing Date | Title |
|---|---|---|---|
| JP2003003832 | 2003-01-10 | ||
| JP2004003576AJP4528528B2 (en) | 2003-01-10 | 2004-01-09 | Navigation server, navigation display method |
Publications (2)
| Publication Number | Publication Date |
|---|---|
| JP2004234649A JP2004234649A (en) | 2004-08-19 |
| JP4528528B2true JP4528528B2 (en) | 2010-08-18 |
Family
ID=32964658
Family Applications (1)
| Application Number | Title | Priority Date | Filing Date |
|---|---|---|---|
| JP2004003576AExpired - Fee RelatedJP4528528B2 (en) | 2003-01-10 | 2004-01-09 | Navigation server, navigation display method |
Country Status (1)
| Country | Link |
|---|---|
| JP (1) | JP4528528B2 (en) |
Cited By (1)
| Publication number | Priority date | Publication date | Assignee | Title |
|---|---|---|---|---|
| JP2013130013A (en)* | 2011-12-21 | 2013-07-04 | Tokai Rika Co Ltd | Electronic key system for vehicle |
Families Citing this family (49)
| Publication number | Priority date | Publication date | Assignee | Title |
|---|---|---|---|---|
| JP4295180B2 (en)* | 2004-09-01 | 2009-07-15 | 株式会社ナビタイムジャパン | Navigation system, route search server and program |
| JP4295181B2 (en)* | 2004-09-03 | 2009-07-15 | 株式会社ナビタイムジャパン | Navigation system, route search server and program |
| US7797100B2 (en) | 2004-09-24 | 2010-09-14 | Aisin Aw Co., Ltd. | Navigation systems, methods, and programs |
| JP4576955B2 (en)* | 2004-09-24 | 2010-11-10 | アイシン・エィ・ダブリュ株式会社 | Navigation system |
| JP4510575B2 (en)* | 2004-09-30 | 2010-07-28 | パナソニック株式会社 | Traffic information display device and traffic information providing device |
| US7610560B2 (en) | 2004-11-16 | 2009-10-27 | Microsoft Corporation | Methods for automated and semiautomated composition of visual sequences, flows, and flyovers based on content and context |
| US7698055B2 (en)* | 2004-11-16 | 2010-04-13 | Microsoft Corporation | Traffic forecasting employing modeling and analysis of probabilistic interdependencies and contextual data |
| US7519564B2 (en) | 2004-11-16 | 2009-04-14 | Microsoft Corporation | Building and using predictive models of current and future surprises |
| JP4628070B2 (en)* | 2004-11-24 | 2011-02-09 | クラリオン株式会社 | Navigation device |
| JP4609886B2 (en)* | 2005-02-22 | 2011-01-12 | アルパイン株式会社 | Navigation device |
| JP4715285B2 (en)* | 2005-04-27 | 2011-07-06 | アイシン・エィ・ダブリュ株式会社 | Navigation system |
| US7565239B2 (en)* | 2005-05-06 | 2009-07-21 | Alpine Electronics, Inc. | Method and apparatus for navigation system for searching selected type of information along route to destination |
| JP4536606B2 (en)* | 2005-06-13 | 2010-09-01 | 三菱電機株式会社 | Wireless communication method, control station, and mobile station |
| JP2007011558A (en)* | 2005-06-29 | 2007-01-18 | Nissan Motor Co Ltd | Traffic jam prediction apparatus and method |
| JP4730961B2 (en)* | 2006-03-24 | 2011-07-20 | 富士重工業株式会社 | Waste collection vehicle, garbage collection vehicle operation management system, center device, and waste collection vehicle operation management method |
| WO2008084554A1 (en)* | 2007-01-12 | 2008-07-17 | Pioneer Corporation | Map drawing device, map drawing method, map drawing program, and computer-readable recording medium |
| JP4345842B2 (en) | 2007-04-26 | 2009-10-14 | アイシン・エィ・ダブリュ株式会社 | VEHICLE POSITION INFORMATION PROVIDING DEVICE, VEHICLE POSITION INFORMATION PROVIDING METHOD, AND COMPUTER PROGRAM |
| JP4360419B2 (en) | 2007-04-26 | 2009-11-11 | アイシン・エィ・ダブリュ株式会社 | Traffic situation judgment system |
| JP5128339B2 (en)* | 2007-09-11 | 2013-01-23 | 株式会社日立製作所 | Traffic flow measurement system |
| WO2009037772A1 (en)* | 2007-09-20 | 2009-03-26 | Pioneer Corporation | Driving support apparatus, driving support method, driving support program, and storage medium |
| JP2011070238A (en)* | 2008-01-17 | 2011-04-07 | Mitsubishi Electric Corp | Traffic information monitoring device and method for the same |
| US8855899B2 (en)* | 2008-05-15 | 2014-10-07 | Garmin Switzerland Gmbh | Virtual traffic sensors |
| JP5092998B2 (en)* | 2008-08-27 | 2012-12-05 | 株式会社Jvcケンウッド | Distribution system, center device, and vehicle-mounted device |
| JP5083264B2 (en)* | 2009-03-30 | 2012-11-28 | 株式会社デンソー | Traffic information distribution system |
| JP2010237178A (en)* | 2009-03-31 | 2010-10-21 | Hitachi Software Eng Co Ltd | Expert route generation server and navigation device |
| JP2011021997A (en)* | 2009-07-15 | 2011-02-03 | Denso Corp | Navigation system, information center, and guide system |
| JP5310461B2 (en)* | 2009-10-09 | 2013-10-09 | トヨタ自動車株式会社 | Inter-vehicle information communication device |
| JP5362526B2 (en)* | 2009-11-26 | 2013-12-11 | 株式会社京三製作所 | Map generating apparatus and map generating method |
| JP5316806B2 (en)* | 2009-12-25 | 2013-10-16 | 株式会社エクォス・リサーチ | Vehicle traffic information collection system |
| JP4812908B1 (en)* | 2010-03-17 | 2011-11-09 | 株式会社トヨタマップマスター | Intersection stop ratio identification device and navigation apparatus, computer program for identifying intersection stop ratio, and computer program for navigation |
| CN102175252B (en)* | 2011-01-27 | 2012-12-05 | 中国人民解放军信息工程大学 | Method for planning dynamic merging and united path of distributed multi-stage road network |
| GB201113122D0 (en)* | 2011-02-03 | 2011-09-14 | Tom Tom Dev Germany Gmbh | Generating segment data |
| CN102110375B (en)* | 2011-03-02 | 2013-09-11 | 北京世纪高通科技有限公司 | Dynamic traffic information section display method and navigation display |
| JP5599505B2 (en)* | 2011-03-15 | 2014-10-01 | 三菱電機株式会社 | Traffic information presentation device and navigation device |
| US9552372B2 (en)* | 2012-10-08 | 2017-01-24 | International Business Machines Corporation | Mapping infrastructure layout between non-corresponding datasets |
| JP6119387B2 (en)* | 2013-04-09 | 2017-04-26 | 株式会社デンソー | Navigation system, navigation device, and data distribution server |
| JP6098419B2 (en)* | 2013-07-29 | 2017-03-22 | アイシン・エィ・ダブリュ株式会社 | Traffic information guidance system, traffic information guidance device, traffic information guidance method, and computer program |
| JP6102814B2 (en)* | 2014-03-31 | 2017-03-29 | 株式会社Jvcケンウッド | Information display device, information display method, and information display program |
| JP6451282B2 (en)* | 2014-12-12 | 2019-01-16 | 富士通株式会社 | Analysis data generation program for driving operation, analysis data generation method, poster, and information processing apparatus |
| CN109074737B (en)* | 2016-04-28 | 2021-04-02 | 住友电气工业株式会社 | Safe driving assistance systems, servers, vehicles, and programs |
| JP6694789B2 (en)* | 2016-09-27 | 2020-05-20 | 本田技研工業株式会社 | Traffic obstacle risk display device |
| CN106781569B (en)* | 2016-11-18 | 2017-10-13 | 姜正 | The method that intelligent transportation instruction device based on radio communication monitors road traffic state |
| JP7147712B2 (en)* | 2018-08-31 | 2022-10-05 | 株式会社デンソー | VEHICLE-SIDE DEVICE, METHOD AND STORAGE MEDIUM |
| JP7265334B2 (en)* | 2018-10-16 | 2023-04-26 | 株式会社デンソーテン | Data collection device, data collection system and data collection method |
| JP7342382B2 (en)* | 2019-03-11 | 2023-09-12 | 株式会社Ihi | Traffic accident recording system and method of providing traffic accident information |
| JP7342383B2 (en)* | 2019-03-11 | 2023-09-12 | 株式会社Ihi | Traffic accident recording system and method of providing traffic accident information |
| JP7342384B2 (en)* | 2019-03-11 | 2023-09-12 | 株式会社Ihi | Traffic accident recording system and method of providing traffic accident information |
| CN114283606A (en)* | 2020-09-27 | 2022-04-05 | 阿波罗智联(北京)科技有限公司 | Method, device, equipment and system for vehicle navigation and cloud control platform |
| JP2022108034A (en)* | 2021-01-12 | 2022-07-25 | 本田技研工業株式会社 | Vehicle control system and server device |
Family Cites Families (7)
| Publication number | Priority date | Publication date | Assignee | Title |
|---|---|---|---|---|
| JPH09180094A (en)* | 1995-12-22 | 1997-07-11 | Matsushita Electric Ind Co Ltd | Navigation equipment and information provision system |
| JP2000235562A (en)* | 1999-02-16 | 2000-08-29 | Nippon Telegr & Teleph Corp <Ntt> | Method and apparatus for quantifying non-quantification factor, and recording medium recording non-quantification factor quantification program |
| JP3399401B2 (en)* | 1999-04-16 | 2003-04-21 | 住友電気工業株式会社 | Traffic information management device and traffic information management method |
| JP2002260145A (en)* | 2000-12-27 | 2002-09-13 | Aisin Aw Co Ltd | Traffic information management system, traffic information management method and program thereof |
| JP2002277265A (en)* | 2000-12-27 | 2002-09-25 | Aisin Aw Co Ltd | Information display apparatus and method, program therefor, and record medium for storing the same |
| JP3849435B2 (en)* | 2001-02-23 | 2006-11-22 | 株式会社日立製作所 | Traffic situation estimation method and traffic situation estimation / provision system using probe information |
| JP2002162239A (en)* | 2001-10-01 | 2002-06-07 | Matsushita Electric Ind Co Ltd | Vehicle navigation device |
- 2004
- 2004-01-09JPJP2004003576Apatent/JP4528528B2/ennot_activeExpired - Fee Related
Cited By (1)
| Publication number | Priority date | Publication date | Assignee | Title |
|---|---|---|---|---|
| JP2013130013A (en)* | 2011-12-21 | 2013-07-04 | Tokai Rika Co Ltd | Electronic key system for vehicle |
Also Published As
| Publication number | Publication date |
|---|---|
| JP2004234649A (en) | 2004-08-19 |
Similar Documents
| Publication | Publication Date | Title |
|---|---|---|
| JP4528528B2 (en) | Navigation server, navigation display method | |
| US7983837B2 (en) | Display method of navi-server and navigation | |
| US9547984B2 (en) | System for providing traffic data and driving efficiency data | |
| KR101920479B1 (en) | Generating jam related segment data | |
| JP4346472B2 (en) | Traffic information prediction device | |
| TWI428249B (en) | Telematics apparatus for driving assistance, system of the same, and method of the same | |
| JP4539666B2 (en) | Traffic condition calculation system | |
| US10255807B1 (en) | Method and apparatus for providing a map data update based on region-specific data turbulence | |
| JP2003061149A (en) | Vehicle use communication controller | |
| JP2003302229A (en) | Navigation device | |
| JP2004220574A (en) | Method for expressing road-related information, and apparatus and system for implementing the method | |
| WO2011046185A1 (en) | Vehicle-mounted device, travel characteristic data generation device, and vehicle-mounted information system | |
| JP3960158B2 (en) | Road traffic jam prediction device and program | |
| JP2002507808A (en) | Navigation system | |
| JP4458927B2 (en) | Automotive electronic devices | |
| JP2006138742A (en) | Information acquisition system, and program of information acquisition method | |
| JP3903785B2 (en) | NAVIGATION SYSTEM AND INFORMATION DISPLAY METHOD PROGRAM | |
| JP4755491B2 (en) | Facility congestion information prediction apparatus, facility congestion information prediction method, and car navigation system | |
| JP5067353B2 (en) | Information distribution system, information distribution terminal, information distribution method, information distribution program | |
| JP2001147120A (en) | Navigation system | |
| JP4466362B2 (en) | Traffic condition providing system and traffic condition providing method | |
| JP2003247846A (en) | In-vehicle device and congestion information management device | |
| JP2007086087A (en) | Information display system | |
| JP4241214B2 (en) | Navigation system and program | |
| JP4424168B2 (en) | Information collection system and program |
Legal Events
| Date | Code | Title | Description |
|---|---|---|---|
| RD02 | Notification of acceptance of power of attorney | Free format text:JAPANESE INTERMEDIATE CODE: A7422 Effective date:20060512 | |
| RD04 | Notification of resignation of power of attorney | Free format text:JAPANESE INTERMEDIATE CODE: A7424 Effective date:20060512 | |
| A621 | Written request for application examination | Free format text:JAPANESE INTERMEDIATE CODE: A621 Effective date:20060801 | |
| A977 | Report on retrieval | Free format text:JAPANESE INTERMEDIATE CODE: A971007 Effective date:20090515 | |
| A131 | Notification of reasons for refusal | Free format text:JAPANESE INTERMEDIATE CODE: A131 Effective date:20090519 | |
| A521 | Request for written amendment filed | Free format text:JAPANESE INTERMEDIATE CODE: A523 Effective date:20090714 | |
| A131 | Notification of reasons for refusal | Free format text:JAPANESE INTERMEDIATE CODE: A131 Effective date:20091124 | |
| A521 | Request for written amendment filed | Free format text:JAPANESE INTERMEDIATE CODE: A523 Effective date:20100121 | |
| A711 | Notification of change in applicant | Free format text:JAPANESE INTERMEDIATE CODE: A712 Effective date:20100212 | |
| TRDD | Decision of grant or rejection written | ||
| A01 | Written decision to grant a patent or to grant a registration (utility model) | Free format text:JAPANESE INTERMEDIATE CODE: A01 Effective date:20100525 | |
| A01 | Written decision to grant a patent or to grant a registration (utility model) | Free format text:JAPANESE INTERMEDIATE CODE: A01 | |
| A61 | First payment of annual fees (during grant procedure) | Free format text:JAPANESE INTERMEDIATE CODE: A61 Effective date:20100607 | |
| FPAY | Renewal fee payment (event date is renewal date of database) | Free format text:PAYMENT UNTIL: 20130611 Year of fee payment:3 | |
| R150 | Certificate of patent or registration of utility model | Free format text:JAPANESE INTERMEDIATE CODE: R150 | |
| LAPS | Cancellation because of no payment of annual fees |