JP3992064B2 - Optical analyzer - Google Patents
Optical analyzerDownload PDFInfo
- Publication number
- JP3992064B2 JP3992064B2JP2006013010AJP2006013010AJP3992064B2JP 3992064 B2JP3992064 B2JP 3992064B2JP 2006013010 AJP2006013010 AJP 2006013010AJP 2006013010 AJP2006013010 AJP 2006013010AJP 3992064 B2JP3992064 B2JP 3992064B2
- Authority
- JP
- Japan
- Prior art keywords
- light
- spectrum
- diagnostic
- optical
- light source
- Prior art date
- Legal status (The legal status is an assumption and is not a legal conclusion. Google has not performed a legal analysis and makes no representation as to the accuracy of the status listed.)
- Expired - Fee Related
Links
- 230000003287optical effectEffects0.000titleclaimsabstractdescription144
- 238000001228spectrumMethods0.000claimsabstractdescription141
- 238000005259measurementMethods0.000claimsabstractdescription114
- 239000013307optical fiberSubstances0.000claimsabstractdescription68
- 239000000126substanceSubstances0.000claimsabstractdescription44
- 238000003860storageMethods0.000claimsabstractdescription28
- 238000004364calculation methodMethods0.000claimsabstractdescription22
- VYPSYNLAJGMNEJ-UHFFFAOYSA-NSilicium dioxideChemical compoundO=[Si]=OVYPSYNLAJGMNEJ-UHFFFAOYSA-N0.000claimsabstractdescription6
- 238000004458analytical methodMethods0.000claimsabstractdescription6
- 239000000377silicon dioxideSubstances0.000claimsabstract2
- 230000005284excitationEffects0.000claimsdescription69
- 238000001069Raman spectroscopyMethods0.000claimsdescription34
- 238000009826distributionMethods0.000claimsdescription24
- 239000003814drugSubstances0.000claimsdescription23
- 229940079593drugDrugs0.000claimsdescription15
- 238000005086pumpingMethods0.000claimsdescription11
- 210000001671embryonic stem cellAnatomy0.000claimsdescription9
- 238000012765tissue examination methodMethods0.000claimsdescription9
- 238000003745diagnosisMethods0.000claimsdescription5
- 238000000034methodMethods0.000claimsdescription5
- 230000001678irradiating effectEffects0.000abstractdescription4
- 230000009545invasionEffects0.000abstract1
- 238000010586diagramMethods0.000description8
- 230000006870functionEffects0.000description7
- 239000002612dispersion mediumSubstances0.000description6
- 230000005684electric fieldEffects0.000description6
- 238000010187selection methodMethods0.000description6
- 238000001237Raman spectrumMethods0.000description5
- 239000006185dispersionSubstances0.000description4
- 239000013543active substanceSubstances0.000description3
- 230000005540biological transmissionEffects0.000description3
- 238000009615fourier-transform spectroscopyMethods0.000description3
- 230000003595spectral effectEffects0.000description3
- 238000000862absorption spectrumMethods0.000description2
- 230000001902propagating effectEffects0.000description2
- 239000010453quartzSubstances0.000description2
- 230000001360synchronised effectEffects0.000description2
- 238000002834transmittanceMethods0.000description2
- 238000002054transplantationMethods0.000description2
- XLYOFNOQVPJJNP-UHFFFAOYSA-NwaterSubstancesOXLYOFNOQVPJJNP-UHFFFAOYSA-N0.000description2
- 108091032973(ribonucleotides)n+mProteins0.000description1
- 208000005623CarcinogenesisDiseases0.000description1
- 102000004190EnzymesHuman genes0.000description1
- 108090000790EnzymesProteins0.000description1
- 102000004108Neurotransmitter ReceptorsHuman genes0.000description1
- 108090000590Neurotransmitter ReceptorsProteins0.000description1
- 238000003841Raman measurementMethods0.000description1
- 230000003321amplificationEffects0.000description1
- 230000000975bioactive effectEffects0.000description1
- 230000036952cancer formationEffects0.000description1
- 231100000504carcinogenesisToxicity0.000description1
- 238000001514detection methodMethods0.000description1
- 201000010099diseaseDiseases0.000description1
- 208000037265diseases, disorders, signs and symptomsDiseases0.000description1
- 238000001125extrusionMethods0.000description1
- 239000000835fiberSubstances0.000description1
- 238000007689inspectionMethods0.000description1
- 238000004519manufacturing processMethods0.000description1
- 238000003199nucleic acid amplification methodMethods0.000description1
- 230000035515penetrationEffects0.000description1
- 230000001225therapeutic effectEffects0.000description1
Images


Classifications
- G—PHYSICS
- G01—MEASURING; TESTING
- G01N—INVESTIGATING OR ANALYSING MATERIALS BY DETERMINING THEIR CHEMICAL OR PHYSICAL PROPERTIES
- G01N21/00—Investigating or analysing materials by the use of optical means, i.e. using sub-millimetre waves, infrared, visible or ultraviolet light
- G01N21/62—Systems in which the material investigated is excited whereby it emits light or causes a change in wavelength of the incident light
- G01N21/63—Systems in which the material investigated is excited whereby it emits light or causes a change in wavelength of the incident light optically excited
- G01N21/65—Raman scattering
- A—HUMAN NECESSITIES
- A61—MEDICAL OR VETERINARY SCIENCE; HYGIENE
- A61B—DIAGNOSIS; SURGERY; IDENTIFICATION
- A61B5/00—Measuring for diagnostic purposes; Identification of persons
- A61B5/0059—Measuring for diagnostic purposes; Identification of persons using light, e.g. diagnosis by transillumination, diascopy, fluorescence
- B—PERFORMING OPERATIONS; TRANSPORTING
- B07—SEPARATING SOLIDS FROM SOLIDS; SORTING
- B07C—POSTAL SORTING; SORTING INDIVIDUAL ARTICLES, OR BULK MATERIAL FIT TO BE SORTED PIECE-MEAL, e.g. BY PICKING
- B07C5/00—Sorting according to a characteristic or feature of the articles or material being sorted, e.g. by control effected by devices which detect or measure such characteristic or feature; Sorting by manually actuated devices, e.g. switches
- B07C5/34—Sorting according to other particular properties
- B07C5/342—Sorting according to other particular properties according to optical properties, e.g. colour
- B07C5/3425—Sorting according to other particular properties according to optical properties, e.g. colour of granular material, e.g. ore particles, grain
- G—PHYSICS
- G01—MEASURING; TESTING
- G01N—INVESTIGATING OR ANALYSING MATERIALS BY DETERMINING THEIR CHEMICAL OR PHYSICAL PROPERTIES
- G01N21/00—Investigating or analysing materials by the use of optical means, i.e. using sub-millimetre waves, infrared, visible or ultraviolet light
- G01N21/17—Systems in which incident light is modified in accordance with the properties of the material investigated
- G01N21/25—Colour; Spectral properties, i.e. comparison of effect of material on the light at two or more different wavelengths or wavelength bands
- G01N21/31—Investigating relative effect of material at wavelengths characteristic of specific elements or molecules, e.g. atomic absorption spectrometry
- G01N21/35—Investigating relative effect of material at wavelengths characteristic of specific elements or molecules, e.g. atomic absorption spectrometry using infrared light
- G01N21/359—Investigating relative effect of material at wavelengths characteristic of specific elements or molecules, e.g. atomic absorption spectrometry using infrared light using near infrared light
Landscapes
- Health & Medical Sciences (AREA)
- Life Sciences & Earth Sciences (AREA)
- Physics & Mathematics (AREA)
- General Health & Medical Sciences (AREA)
- Pathology (AREA)
- Biochemistry (AREA)
- Spectroscopy & Molecular Physics (AREA)
- Immunology (AREA)
- General Physics & Mathematics (AREA)
- Analytical Chemistry (AREA)
- Chemical & Material Sciences (AREA)
- Veterinary Medicine (AREA)
- Engineering & Computer Science (AREA)
- Public Health (AREA)
- Biomedical Technology (AREA)
- Animal Behavior & Ethology (AREA)
- Surgery (AREA)
- Molecular Biology (AREA)
- Biophysics (AREA)
- Medical Informatics (AREA)
- Heart & Thoracic Surgery (AREA)
- Nuclear Medicine, Radiotherapy & Molecular Imaging (AREA)
- Investigating, Analyzing Materials By Fluorescence Or Luminescence (AREA)
- Investigating Or Analysing Materials By Optical Means (AREA)
Abstract
Description
Translated fromJapanese本発明は、光スペクトルの測定によって測定対象物の同定や物質の状態の評価を行うことが可能で、薬剤選別や生体組織検査などに用いるのに好適な光学分析装置に関するものである。 The present invention relates to an optical analyzer that can be used to identify an object to be measured and evaluate the state of a substance by measuring an optical spectrum, and is suitable for use in drug selection, biological tissue examination, and the like.
光スペクトルの測定によって測定対象物の同定や物質の状態の評価を行うことが可能な光学分析装置として、特許文献1や特許文献2に開示されたものが知られている。特許文献1に開示された光学分析装置は、測定対象物としての脂肪組織に近赤外光を照射して吸収スペクトルを測定し、その吸収スペクトルに基づいて脂肪組織中の脂肪の種類を判定することにより、組織の性質を測定して分類するものである。特許文献2に開示された光学分析装置は、Nd:YAGパルスレーザ光源から出力される波長1.06μmのパルス光を測定対象物に照射してラマン散乱を励起し、そのラマン散乱光をフォトディテクタで同期検出するものである。
しかしながら、特許文献1に開示された光学分析装置を用いた分析は、SN比が低く、空間分解能が低い問題があった。また、特許文献2に開示された光学分析装置は、弾性散乱が強い測定対象物を測定した際、深達度が低い問題があった。本発明は、上記問題点を解消する為になされたものであり、空間分解能および深達度が優れた分析を行うことができる光学分析装置を提供することを目的とする。 However, the analysis using the optical analyzer disclosed in Patent Document 1 has a problem that the SN ratio is low and the spatial resolution is low. Moreover, the optical analyzer disclosed in
本発明に係る光学分析装置は、(1) 診断光を発生して出力する診断光光源部と、(2) 診断光光源部から出力された診断光を集光して測定対象物に照射する照射光学系と、(3) 照射光学系による測定対象物への診断光の照射に伴い測定対象物で発生する物体光を捕捉する捕捉光学系と、(4) 捕捉光学系により捕捉された物体光を受光して該物体光の周波数スペクトルを測定するスペクトル測定部と、(5) 既知物質の周波数スペクトルの情報を記憶する記憶部と、(6) スペクトル測定部により測定された物体光の周波数スペクトルと、記憶部により記憶された既知物質の周波数スペクトルとの一致度を計算し、この計算結果に基づいて測定対象物を分析する演算部と、を備えることを特徴とする。さらに、本発明に係る光学分析装置に含まれる診断光光源部は、種光を出力する種光源と、この種光源から出力された種光を入力して非線形光学現象により診断光をHE11モードとして発生し出力する石英系の光ファイバと、を含むことを特徴とする。また、診断光光源部は、光ファイバの少なくとも一部において光パワーの空間密度が1mW/μm2以上であり、0.8μm〜3.0μmの波長帯の少なくとも一部において1μW/nm以上の光パワーを有する診断光を出力することを特徴とする。The optical analyzer according to the present invention includes (1) a diagnostic light source unit that generates and outputs diagnostic light, and (2) collects the diagnostic light output from the diagnostic light source unit and irradiates the measurement object. Irradiation optical system, (3) Capture optical system that captures object light generated by the measurement object as the measurement object is irradiated by the irradiation optical system, and (4) Object captured by the capture optical system A spectrum measurement unit that receives light and measures the frequency spectrum of the object light; (5) a storage unit that stores information on the frequency spectrum of a known substance; and (6) the frequency of the object light measured by the spectrum measurement unit. And a calculation unit that calculates a degree of coincidence between the spectrum and the frequency spectrum of the known substance stored in the storage unit, and analyzes the measurement object based on the calculation result. Furthermore, the diagnostic light source unit included in the optical analyzer according to the present invention inputs the seed light that outputs the seed light and the seed light output from the seed light source, and converts the diagnostic light into the HE11 mode by a nonlinear optical phenomenon. And a quartz-based optical fiber that generates and outputs.The diagnostic light source unit has a light power spatial density of 1 mW / μm2 or more in at least a part of the optical fiber, and light of 1 μW / nm or more in at least a part of the wavelength band of 0.8 μm to 3.0 μm.and outputs the diagnostic light having a power.
本発明に係る光学分析装置の第1の好適な態様として、診断光光源部は、種光源として励起パルス光源を含み、励起パルス光源から出力された励起パルス光を光ファイバに入力させて、その励起パルス光が光ファイバを伝搬する間に生じる非線型光学現象により該励起パルス光のスペクトルを広げ、そのスペクトルが広げられた励起パルス光を診断光として出力する。捕捉光学系は、測定対象物への診断光の照射に伴い測定対象物で損失を被った診断光を物体光として捕捉する。既知物質の周波数スペクトルは損失スペクトルである。そして、演算部は、スペクトル測定部により測定された物体光の周波数スペクトルと、記憶部により記憶された既知物質の損失スペクトルとの一致度を計算し、この計算結果に基づいて測定対象物を分析する。 As a first preferred aspect of the optical analyzer according to the present invention, the diagnostic light source unit includes an excitation pulse light source as a seed light source, and the excitation pulse light output from the excitation pulse light source is input to an optical fiber, The spectrum of the excitation pulse light is broadened by a non-linear optical phenomenon that occurs while the excitation pulse light propagates through the optical fiber, and the excitation pulse light having the broadened spectrum is output as diagnostic light. The capturing optical system captures, as object light, diagnostic light that has suffered a loss on the measuring object as the measuring object is irradiated with the diagnostic light. The frequency spectrum of the known substance is a loss spectrum. The calculation unit calculates the degree of coincidence between the frequency spectrum of the object light measured by the spectrum measurement unit and the loss spectrum of the known substance stored by the storage unit, and analyzes the measurement object based on the calculation result To do.
本発明に係る光学分析装置の第2の好適な態様として、診断光光源部は、種光源として種パルス光源および励起光源を含み、励起光源から出力された励起光を光ファイバに入力させて、光ファイバにおいて光パラメトリックゲインを発生させ、種パルス光源から出力された種パルス光を光ファイバに入力させて、光ファイバにおいて光パラメトリックゲインによって該種パルス光を光増幅し、その光増幅された種パルス光を診断光として出力し、診断光の中心波長が1400nm〜1800nmの波長範囲に含まれる。捕捉光学系は、測定対象物への診断光の照射に伴い測定対象物で発生するラマン散乱光を物体光として捕捉する。既知物質の周波数スペクトルはラマン散乱スペクトルである。そして、演算部は、スペクトル測定部により測定された物体光の周波数スペクトルと、記憶部により記憶された既知物質のラマン散乱スペクトルとの一致度を計算し、この計算結果に基づいて測定対象物を分析する。 As a second preferred aspect of the optical analyzer according to the present invention, the diagnostic light source unit includes a seed pulse light source and an excitation light source as a seed light source, and inputs the excitation light output from the excitation light source to the optical fiber, An optical parametric gain is generated in the optical fiber, the seed pulse light output from the seed pulse light source is input to the optical fiber, the seed pulse light is optically amplified by the optical parametric gain in the optical fiber, and the optically amplified seed Pulse light is output as diagnostic light, and the central wavelength of diagnostic light is included in the wavelength range of 1400 nm to 1800 nm. The capture optical system captures, as object light, Raman scattered light generated in the measurement target as the measurement target is irradiated with the diagnostic light. The frequency spectrum of the known substance is a Raman scattering spectrum. Then, the calculation unit calculates the degree of coincidence between the frequency spectrum of the object light measured by the spectrum measurement unit and the Raman scattering spectrum of the known substance stored by the storage unit, and based on the calculation result, calculates the measurement object. analyse.
また、本発明に係る光学分析装置の第3の好適な態様として、診断光光源部は、種光源として種パルス光源,第1励起光源および第2励起パルス光源を含み、第1励起光源から出力された励起光を光ファイバに入力させて、光ファイバにおいて光パラメトリックゲインを発生させ、種パルス光源から出力された種パルス光を光ファイバに入力させて、光ファイバにおいて光パラメトリックゲインによって該種パルス光を光増幅し、その光増幅された種パルス光を第1診断光として出力するとともに、第2励起パルス光源から出力された励起パルス光を光ファイバに入力させて、その励起パルス光が光ファイバを伝搬する間に生じる非線型光学現象により該励起パルス光のスペクトルを広げ、そのスペクトルが広げられた励起パルス光を第2診断光として出力し、第1診断光の中心波長が1400nm〜1800nmの波長範囲に含まれる。捕捉光学系は、測定対象物への第1診断光の照射に伴い測定対象物で発生するラマン散乱光を第1物体光として捕捉するとともに、測定対象物への第2診断光の照射に伴い測定対象物で損失を被った第2診断光を第2物体光として捕捉する。既知物質の周波数スペクトルはラマン散乱スペクトルおよび損失スペクトルである。そして、演算部は、スペクトル測定部により測定された第1物体光の周波数スペクトルと、記憶部により記憶された既知物質のラマン散乱スペクトルとの一致度を計算するとともに、スペクトル測定部により測定された第2物体光の周波数スペクトルと、記憶部により記憶された既知物質の損失スペクトルとの一致度を計算し、これらの計算結果に基づいて測定対象物を分析する。 As a third preferred aspect of the optical analyzer according to the present invention, the diagnostic light source unit includes a seed pulse light source, a first excitation light source, and a second excitation pulse light source as a seed light source, and is output from the first excitation light source. The pumping light is input to the optical fiber, an optical parametric gain is generated in the optical fiber, the seed pulse light output from the seed pulse light source is input to the optical fiber, and the seed pulse is generated by the optical parametric gain in the optical fiber. The light is optically amplified, and the optically amplified seed pulse light is output as the first diagnostic light, and the excitation pulse light output from the second excitation pulse light source is input to the optical fiber so that the excitation pulse light is light. The spectrum of the excitation pulse light is broadened by the nonlinear optical phenomenon that occurs while propagating through the fiber, and the excitation pulse light whose spectrum is broadened is subjected to the second diagnosis. And outputs as the light, the center wavelength of the first diagnostic light is included in the wavelength range of 1400Nm~1800nm. The capture optical system captures the Raman scattered light generated in the measurement object as the first object light as the measurement object is irradiated with the first diagnosis light, and accompanies the irradiation of the second diagnosis light to the measurement object. The second diagnostic light that has lost the measurement object is captured as the second object light. The frequency spectrum of the known substance is a Raman scattering spectrum and a loss spectrum. The computing unit calculates the degree of coincidence between the frequency spectrum of the first object light measured by the spectrum measuring unit and the Raman scattering spectrum of the known substance stored by the storage unit, and is measured by the spectrum measuring unit. The degree of coincidence between the frequency spectrum of the second object light and the loss spectrum of the known substance stored in the storage unit is calculated, and the measurement object is analyzed based on these calculation results.
本発明に係る薬剤選別方法は、上記の本発明に係る光学分析装置を用い、測定対象物である薬剤中の生理活性分子の空間分布を測定し、その空間分布が所定の規定を満たしているかどうかを判定する、ことを特徴とする。 The drug selection method according to the present invention uses the above-described optical analyzer according to the present invention to measure the spatial distribution of physiologically active molecules in the drug as the measurement target, and whether the spatial distribution satisfies a predetermined rule. It is characterized by determining whether or not.
本発明に係る組織検査方法は、上記の本発明に係る光学分析装置を用い、波長範囲1.6〜1.8μmに含まれる波長の診断光を測定対象物としての生体組織に照射して、その測定対象物中の生理活性分子の空間分布を測定する、ことを特徴とする。また、光学分析装置に含まれる記憶部に未分化胚性幹細胞のスペクトル情報を記憶させ、測定対象物中の未分化胚性幹細胞の検出を行うのも好適である。 The tissue examination method according to the present invention uses the optical analyzer according to the present invention described above, irradiates a biological tissue as a measurement object with diagnostic light having a wavelength included in a wavelength range of 1.6 to 1.8 μm, The spatial distribution of the physiologically active molecule in the measurement object is measured. It is also preferable to store spectrum information of undifferentiated embryonic stem cells in a storage unit included in the optical analyzer and detect undifferentiated embryonic stem cells in the measurement target.
本発明によれば、空間分解能および深達度が優れた分析を行うことができる。 According to the present invention, it is possible to perform analysis with excellent spatial resolution and depth.
以下、添付図面を参照して、本発明を実施するための最良の形態を詳細に説明する。なお、図面の説明において同一または同種の要素には同一の符号を付し、重複する説明を省略する。 The best mode for carrying out the present invention will be described below in detail with reference to the accompanying drawings. In the description of the drawings, the same or similar elements are denoted by the same reference numerals, and redundant description is omitted.
(光学分析装置の第1実施形態)
先ず、本発明に係る光学分析装置の第1実施形態について説明する。図1は、第1実施形態に係る光学分析装置1の構成図である。この図に示される光学分析装置1は、損失スペクトルの測定によって測定対象物9の同定や物質の状態の評価を行うことが可能な装置であって、診断光光源部10、光学系20、スペクトル測定部30、記憶部40、演算部50および表示部60を備える。(First embodiment of optical analyzer)
First, a first embodiment of an optical analyzer according to the present invention will be described. FIG. 1 is a configuration diagram of an optical analyzer 1 according to the first embodiment. The optical analyzer 1 shown in this figure is an apparatus capable of identifying the
診断光光源部10は、励起パルス光源11、光ファイバ14、レンズ16および半透ミラー17を含む。診断光光源部10は、光ファイバ14の少なくとも一部において光パワーの空間密度が1mW/μm2以上であり、0.8μm〜3.0μmの波長帯の少なくとも一部において1μW/nm以上の光パワーを有する診断光を出力する。The diagnostic
励起パルス光源11は、波長範囲1530nm〜1620nm(より好ましくは波長範囲1530nm〜1560nm)に中心波長λpを有する励起パルス光を発生し出力する。石英系の光ファイバ14は、波長λpにおいて、20[W-1km-1]以上の非線形係数γと、0.04[ps/nm/km]以下の絶対値の波長分散スロープとを有する。種光源としての励起パルス光源11から出力された励起パルス光は、光ファイバ14の一方の端面に入射して、光ファイバ14のHE11モードに結合される。The excitation
光ファイバ14に入力された励起パルス光は、光ファイバ14中での非線形光学効果によりスペクトルが広がって、スーパーコンティニューム光(SC光)として知られている広帯域光が光ファイバ14において発生する。SC光は、800nm〜3000nmの波長範囲において1[μW/nm]以上のパワースペクトル密度を有する。光ファイバ14において発生するSC光の波長範囲およびスペクトル密度は、光ファイバ14に入力される励起パルス光のパワーや波長によって可変である。このSC光は、1000nm〜2000nmの波長範囲で10[μW/nm]のパワースペクトル密度を実現することもできる。SC光は、光ファイバのHE11モードの電界分布を有する。 The spectrum of the excitation pulse light input to the
レンズ16は、光ファイバ14の他方の端面から発散して出力されたSC光を入力し、これをコリメートする。そして、半透ミラー17は、レンズ16によりコリメートされたSC光を2分岐して、分岐した一方のSC光を光学系20へ出力し、他方のSC光をスペクトル測定部30へ出力する。このようにして診断光光源部10から出力されるSC光は、測定対象物9に照射されるべき診断光となる。この診断光のパワーは、励起パルス光源11から出力される励起パルス光のパワー変動に同期した時間変化を有する。 The
光学系20は、診断光光源部10から出力された診断光を集光して測定対象物9に照射する照射光学系として作用するとともに、測定対象物9への診断光の照射に伴い測定対象物9で発生する物体光を捕捉する捕捉光学系としても作用する。光学系20は、半透ミラー21a、固定ミラー22、可動ミラー23およびレンズ24を含む。診断光光源部10から出力された診断光は、半透ミラー21aを透過し、固定ミラー22および可動ミラー23により順次に反射され、レンズ24により集光されて、測定対象物9の一部分に照射される。測定対象物9における診断光の照射領域は、可動ミラー23によって光軸に垂直な方向に2次元で可変であり、レンズ24の位置を通じて光軸方向にも可変である。測定対象物9における診断光の照射領域の径は、レンズ24の種類および位置を適当に選択することにより、1μm〜1mmの範囲で実現される。 The
診断光光源部10から出力された診断光の一部は、半透ミラー17によって取り出され、スペクトル測定部30に入力される。また、測定対象物9を出射した物体光の一部は、レンズ24、可動ミラー23、固定ミラー22および半透ミラー21aを経て、スペクトル測定部30に入力される。 A part of the diagnostic light output from the diagnostic
スペクトル測定部30は、光学系20により捕捉された物体光を受光して該物体光の周波数スペクトルを測定するものであり、分光器31a,31bおよび減算器32を含む。分光器31aは、診断光光源部10の半透ミラー17によって取り出された診断光を受光し、この診断光のパワースペクトルを測定する。また、分光器31bは、半透ミラー21aから到達した物体光を受光し、この物体光のパワースペクトルを測定する。 The
分光器31a,31bとして、モノクロメータ、可変フィルタ、分散媒質とディテクタアレイ、フーリエ変換分光などの装置を用いることができる。特に分散媒質とディテクタアレイを用いた構成は、フィルタを用いる方式に比べて、光利用効率が高く、それぞれの周波数成分を同時計測できるといった利点がある。分光器31a,31bは、物体光のパワースペクトルおよび診断光のパワースペクトルを同時計測する。そして、減算器32は、ログスケールで物体光のパワースペクトルから診断光のパワースペクトルを減算することにより、測定対象物9の損失スペクトルAを得る。 As the
記憶部40は、様々な既知物質の損失スペクトルBの情報を記憶するものである。演算部50は、記憶部40から損失スペクトルBの情報を一つずつ読み出して、スペクトル測定部30により得られた損失スペクトルAと損失スペクトルBとの一致度を計算し、物質と一致度との表Cを作成して、最も一致度の高い物質を選択することにより、測定対象物9に含まれる物質を同定することができる。さらに、表示部60は、物質毎に異なる色を割り当てて測定対象物9の画像に重ねて表示させる。これにより、使用者は測定対象物9中の物質分布を把握することができる。 The memory |
本実施形態では、診断光(SC光)は、光ファイバ14のHE11モードの電界分布を有するため、測定対象物9において最小で1μmの小さな集光径を実現できる。また、診断光(SC光)の波長が800nm以上と長いことにより、測定対象物9が高い散乱係数を有する場合も深部の情報を得ることができる。 In the present embodiment, the diagnostic light (SC light) has a HE11 mode electric field distribution of the
(光学分析装置の第2実施形態)
次に、本発明に係る光学分析装置の第2実施形態について説明する。図2は、第2実施形態に係る光学分析装置2の構成図である。この図に示される光学分析装置2は、ラマン散乱スペクトルの測定によって測定対象物9の同定や物質の状態の評価を行うことが可能な装置であって、診断光光源部10、光学系20、スペクトル測定部30、記憶部40、演算部50および表示部60を備える。(Second Embodiment of Optical Analyzer)
Next, a second embodiment of the optical analyzer according to the present invention will be described. FIG. 2 is a configuration diagram of the
診断光光源部10は、診断光を発生して出力するものであり、種パルス光源12、励起光源13、光ファイバ14、半透ミラー15aおよびレンズ16を含む。種パルス光源12は、波長範囲1400nm〜1800nm(より好ましくは波長範囲1580nm〜1650nm)に中心波長λsを有する種パルス光を発生する。励起光源13は、波長範囲1530nm〜1580nm(より好ましくは波長範囲1580nm)に中心波長λpを有する励起光を発生する。 The diagnostic
励起光源13から出力される励起光はCWまたはパルスである。励起光源13から出力される励起光がパルスの場合は、種パルス光と励起パルス光とを時間的に同期させることにより、高いピークパワーを利用して大きなパラメトリックゲインを得られるという利点がある。一方、励起光源13から出力される励起光がCWの場合は、種パルス光との同期が不要で装置が簡略化されるという利点がある。 The excitation light output from the
光ファイバ14は、波長λpにおいて、20[W-1km-1]以上の非線形係数γと、0.04[ps/nm/km]以下の絶対値の波長分散スロープと、1×10−55[s2/m]以下のβ(4)(角周波数による伝搬定数の4階微分値)とを有する。The
励起光源13から出力される励起光の波長λpは、光ファイバ14中で種パルス光と励起CW光の群速度とが一致するよう選ばれる。種パルス光および励起CW光は、半透ミラー15aによって結合された後、光ファイバ14のHE11モードに結合される。光ファイバ14中での非線形光学効果により、光パラメトリック増幅(OPA)のゲインによって種パルス光を増幅し、波長λsで約10mWのパワーを持つパルス光を発生することができる。光ファイバ14から出射したパルス光は、レンズ16によりコリメートされ、診断光光源部10から診断光として出力される。この診断光は、光ファイバ14のHE11モードの電界分布を有する。 The wavelength λp of the pumping light output from the pumping
光学系20は、診断光光源部10から出力された診断光を集光して測定対象物9に照射する照射光学系として作用するとともに、測定対象物9への診断光の照射に伴い測定対象物9で発生する物体光を捕捉する捕捉光学系としても作用する。光学系20は、半透ミラー21b、固定ミラー22、可動ミラー23およびレンズ24を含む。診断光光源部10から出力された診断光は、半透ミラー21aを透過し、固定ミラー22および可動ミラー23により順次に反射され、レンズ24により集光されて、測定対象物9の一部分に照射される。測定対象物9における診断光の照射領域は、可動ミラー23によって光軸に垂直な方向に2次元で可変であり、レンズ24の位置を通じて光軸方向にも可変である。測定対象物9における診断光の照射領域の径は、レンズ24の種類および位置を適当に選択することにより、1μm〜1mmの範囲で実現される。 The
測定対象物9を出射した物体光(ラマン散乱光)は、レンズ24、固定ミラー23、可動ミラー22および半透ミラー21aを経て、スペクトル測定部30に入力される。スペクトル測定部30は、光学系20により捕捉された物体光を受光して該物体光のラマン散乱スペクトルを測定するものであり、分光器31cを含む。分光器31cは、半透ミラー21aから到達した物体光(ラマン散乱光)を受光し、この物体光のパワースペクトル(ラマン散乱スペクトル)を測定する。分光器31cとして、モノクロメータ、可変フィルタ、分散媒質とディテクタアレイ、フーリエ変換分光などの装置を用いることができる。特に分散媒質とディテクタアレイを用いた構成は、フィルタを用いる方式に比べて、光利用効率が高く、それぞれの周波数成分を同時計測できるといった利点がある。 Object light (Raman scattered light) emitted from the
記憶部40は、様々な既知物質のラマン散乱スペクトルBの情報を記憶するものである。演算部50は、記憶部40からラマン散乱スペクトルBの情報を一つずつ読み出して、スペクトル測定部30により得られたラマン散乱スペクトルAとラマン散乱スペクトルBとの一致度を計算し、物質と一致度との表Cを作成して、最も一致度の高い物質を選択することにより、測定対象物9に含まれる物質を同定することができる。さらに、表示部60は、物質毎に異なる色を割り当てて測定対象物9の画像に重ねて表示させる。これにより、使用者は測定対象物9中の物質分布を把握することができる。 The memory |
本実施形態では、光ファイバ14は、20[W-1km-1]以上の高い非線形係数と、0.04[ps/nm/km]以下の絶対値の小さな波長分散スロープと、1×10−55[s2/m]以下の絶対値の小さなβ(4) とを有することにより、帯域幅が100nm〜300nmと広いパラメトリックゲインを発生させることができる。その結果、高パワーが得やすい波長1550nm近傍の励起光を用いて、水に対する透過率が近傍の他の波長よりも高い波長1600nm〜1700nmの診断光を発生させることができる。In the present embodiment, the
また、診断光は、光ファイバ14のHE11モードの電界分布を有するため、測定対象物9において最小で1μmの小さな集光径を実現できる。また、診断光の波長が1400nm以上と長いことにより、測定対象物9が高い散乱係数を有する場合も、深部の情報を得ることができる。その際、波長1200nmよりも短い波長での励起光を用いる従来技術に比べ、蛍光の発生を抑制し、ラマン散乱測定の信号対雑音比を向上することができる。 Further, since the diagnostic light has a HE11 mode electric field distribution of the
(光学分析装置の第3実施形態)
次に、本発明に係る光学分析装置の第3実施形態について説明する。図3は、第3実施形態に係る光学分析装置3の構成図である。この図に示される光学分析装置3は、損失スペクトルおよびラマン散乱スペクトルの測定によって測定対象物9の同定や物質の状態の評価を行うことが可能な装置であって、診断光光源部10、光学系20、スペクトル測定部30、記憶部40、演算部50および表示部60を備える。(Third embodiment of optical analyzer)
Next, a third embodiment of the optical analyzer according to the present invention will be described. FIG. 3 is a configuration diagram of the optical analyzer 3 according to the third embodiment. The optical analyzer 3 shown in this figure is an apparatus capable of identifying the
診断光光源部10は、第1診断光および第2診断光を発生して出力するものであり、励起パルス光源11、種パルス光源12、励起光源13、光ファイバ14、半透ミラー15a,15b、レンズ16および半透ミラー17を含む。これらの要素のうち、励起パルス光源11は第1実施形態におけるものと同様のものであり、種パルス光源12および励起光源13は第2実施形態におけるものと同様のものである。光ファイバ14は第2実施形態におけるものと同様のものであり、レンズ16および半透ミラー17は第1実施形態におけるものと同様のものである。 The diagnostic
半透ミラー15a,15bは、励起パルス光源11から出力された励起パルス光、種パルス光源12から出力された種パルス光、および、励起光源13から出力された励起光、を合波して、光ファイバ14の一方の端面に入射させ、光ファイバ14のHE11モードに結合させる。 The semi-transmissive mirrors 15a and 15b combine the excitation pulse light output from the excitation
励起光源13から出力された励起光は光ファイバ14に入力されて、光ファイバ14において光パラメトリックゲインを発生させる。種パルス光源12から出力された種パルス光も光ファイバ14に入力されて、光ファイバ14において光パラメトリックゲインによって該種パルス光が光増幅され、その光増幅された種パルス光が第1診断光として出力される。また、励起パルス光源11から出力された励起パルス光も光ファイバ14に入力されて、その励起パルス光が光ファイバ14を伝搬する間に生じる非線型光学現象により該励起パルス光のスペクトルが広げられ、そのスペクトルが広げられた励起パルス光(SC光)が第2診断光として出力される。 The pumping light output from the pumping
光学系20は、診断光光源部10から出力された診断光を集光して測定対象物9に照射する照射光学系として作用するとともに、測定対象物9への診断光の照射に伴い測定対象物9で発生する物体光を捕捉する捕捉光学系としても作用する。光学系20は、半透ミラー21a,21b、固定ミラー22、可動ミラー23およびレンズ24を含む。診断光光源部10から出力された第1診断光および第2診断光は、半透ミラー21a,21bを透過し、固定ミラー22および可動ミラー23により順次に反射され、レンズ24により集光されて、測定対象物9の一部分に照射される。測定対象物9における第1診断光および第2診断光の照射領域は、可動ミラー23によって光軸に垂直な方向に2次元で可変であり、レンズ24の位置を通じて光軸方向にも可変である。測定対象物9における第1診断光および第2診断光の照射領域の径は、レンズ24の種類および位置を適当に選択することにより、1μm〜1mmの範囲で実現される。 The
測定対象物9では、第1診断光の照射に伴いラマン散乱光が発生するとともに、第2診断光の照射に伴い測定対象物9で損失を被った第2診断光が第2物体光として発生する。測定対象物9を出射した第1物体光(ラマン散乱光)は、レンズ24、可動ミラー23、固定ミラー22および半透ミラー21bを経て、スペクトル測定部30に入力される。測定対象物9を出射した第2物体光(損失を被った第2診断光)は、レンズ24、可動ミラー23、固定ミラー22および半透ミラー21b,21aを経て、スペクトル測定部30に入力される。 In the
スペクトル測定部30は、光学系20により捕捉された第1物体光および第2物体光を受光して該物体光の周波数スペクトルを測定するものであり、分光器31a,31b,31c、減算器32および処理器33を含む。分光器31aは、診断光光源部10の半透ミラー17によって取り出された診断光を受光し、この診断光のパワースペクトルを測定する。分光器31bは、半透ミラー21aから到達した第2物体光(損失を被った第2診断光を受光し、この第2物体光のパワースペクトルを測定する。また、分光器31cは、半透ミラー21bから到達した第1物体光(ラマン散乱光)を受光し、この第1物体光のパワースペクトル(ラマン散乱スペクトル)を測定する。 The
分光器31a,31b,13cとして、モノクロメータ、可変フィルタ、分散媒質とディテクタアレイ、フーリエ変換分光などの装置を用いることができる。特に分散媒質とディテクタアレイを用いた構成は、フィルタを用いる方式に比べて、光利用効率が高く、それぞれの周波数成分を同時計測できるといった利点がある。分光器31a,31bは、第2物体光のパワースペクトルおよび第2診断光のパワースペクトルを同時計測する。そして、減算器32は、ログスケールで第2物体光のパワースペクトルから第2診断光のパワースペクトルを減算することにより、測定対象物9の損失スペクトルを得る。 As the
分光器31cにより得られたラマン散乱スペクトルと、減算器32により得られた損失スペクトルとは、同時計測され、1組のデータセットを構成するものとして処理器33から出力される。 The Raman scattering spectrum obtained by the
記憶部40は、様々な既知物質の損失スペクトルおよびラマン散乱スペクトルの組の情報を記憶する。演算部50は、記憶部40から損失スペクトルおよびラマン散乱スペクトルの組の情報を一つずつ読み出して、スペクトル測定部30により測定された第1物体光の周波数スペクトルと、記憶部30から読み出した既知物質のラマン散乱スペクトルとの一致度を計算するとともに、スペクトル測定部30により測定された第2物体光の周波数スペクトルと、記憶部30から読み出した既知物質の損失スペクトルとの一致度を計算する。そして、演算部50は、物質と一致度との表を作成して、最も一致度の高い物質を選択することにより、測定対象物9に含まれる物質を同定することができる。さらに、表示部60は、物質毎に異なる色を割り当てて測定対象物9の画像に重ねて表示させる。これにより、使用者は測定対象物9中の物質分布を把握することができる。 The
本実施形態では、光ファイバ14は、20[W-1km-1]以上の高い非線形係数と、0.04[ps/nm/km]以下の絶対値の小さな波長分散スロープと、1×10−55[s2/m]以下の絶対値の小さなβ(4)とを有することにより、損失スペクトル測定のための第2診断光(SC光)とラマン測定のための第1診断光(励起パルス)とを同時に発生させることができる。その結果、測定対象物9に関する情報を多角的に収集して同定精度を高めることができる。その際、損失スペクトルとラマンスペクトルとを別々に測定するのに比べて、測定系や測定対象の時間揺らぎ、診断光の集光位置のふらつき、などの誤差要因を抑圧することができる。In this embodiment, the
また、損失スペクトルの測定に関しては、第2診断光(SC光)が光ファイバ14のHE11モードの電界分布を有するため、測定対象物9において最小で1μmの小さな集光径を実現できる。また、第2診断光(SC光)の波長が800nm以上と長いことにより、測定対象物9が高い散乱係数を有する場合も、深部の情報を得ることができる。 Regarding the measurement of the loss spectrum, since the second diagnostic light (SC light) has the HE11 mode electric field distribution of the
また、ラマンスペクトルの測定に関しては、高パワーが得やすい1550nm近傍の励起光を用いて、水に対する透過率が近傍の他の波長よりも高い波長1600nm〜1700nmの第1診断光を発生させることができる。また、第1診断光が光ファイバ14のHE11モードの電界分布を有するため、測定対象物9において最小で1μmの小さな集光径を実現できる。また、第1診断光の波長が1400nm以上と長いことにより、測定対象物9が高い散乱係数を有する場合も、深部の情報を得ることができる。その際、1200nmよりも短い波長での励起を用いる従来技術に比べ、蛍光の発生を抑制し、ラマン散乱測定の信号対雑音比を向上することができる。 For the measurement of the Raman spectrum, the first diagnostic light having a wavelength of 1600 nm to 1700 nm having a higher transmittance for water than other wavelengths in the vicinity may be generated using excitation light in the vicinity of 1550 nm where high power is easily obtained. it can. In addition, since the first diagnostic light has the HE11 mode electric field distribution of the
(光学分析装置の第4実施形態)
次に、本発明に係る光学分析装置の第4実施形態について説明する。図4は、第4実施形態に係る光学分析装置4の構成図である。図1に示された第1実施形態に係る光学分析装置1の構成と比較すると、この図4に示される第4実施形態に係る光学分析装置4は、診断光光源部10が可変光フィルタ18を更に含む点で相違する。(Fourth Embodiment of Optical Analyzer)
Next, a fourth embodiment of the optical analyzer according to the present invention will be described. FIG. 4 is a configuration diagram of the optical analyzer 4 according to the fourth embodiment. Compared with the configuration of the optical analyzer 1 according to the first embodiment shown in FIG. 1, the optical analyzer 4 according to the fourth embodiment shown in FIG. Is further different.
可変光フィルタ18は、レンズ16と半透ミラー17との間に設けられ、透過帯域が可変であり、透過帯域幅が例えば1nmである。このような可変光フィルタ18を含む診断光光源部10は、光ファイバ14から出力される広帯域のSC光のうち特定の波長域の光を可変光フィルタ18により透過させて、この透過光を診断光として出力することができる。また、このとき、スペクトル測定部30に含まれる分光器31a,31bは、可変光フィルタ18における透過波長毎に受光パワーを検出すればよい。したがって、本実施形態に係る光学分析装置4は構成を簡略化することができる。 The variable
(薬剤選別方法の実施形態)
次に、本発明に係る薬剤選別方法の実施形態について説明する。本実施形態に係る薬剤選別方法は、上述した実施形態に係る光学分析装置と同様の構成を有する光学分析装置5A,5Bを用いて、測定対象物である薬剤中の生理活性分子の空間分布を測定し、その空間分布が所定の規定を満たしているかどうかを判定する。(Embodiment of drug selection method)
Next, an embodiment of a medicine selection method according to the present invention will be described. The drug selection method according to the present embodiment uses the
図5は、本実施形態に係る薬剤選別方法の一例を説明する斜視図である。光学分析装置5A,5Bそれぞれは、上述した第1〜第4実施形態の光学分析装置と同様の構成のものであり、特に第3実施形態の光学分析装置と同様の構成のものであるのが好適である。光学分析装置5A,5Bは、z方向およびy方向から診断光を薬剤9に照射する。錠剤の形状を持つ測定対象物としての薬剤9は、ベルトコンベア71によって供給される。ここで、xはコンベア71の進行方向であり、zはコンベア71の面に垂直な方向であり、yはxおよびzに垂直な方向である。 FIG. 5 is a perspective view for explaining an example of the medicine selection method according to the present embodiment. Each of the
一方の光学分析装置5Aは、x方向に長細いビーム形状を持つ診断光をz方向に出射し、レンズ70Aによって薬剤9上にy方向に長細いスポットを結ぶ。他方の光学分析装置5Bは、x方向に長細いビーム形状を持つ診断光をy方向に出射し、レンズ70Bによって薬剤9上にz方向に長細いスポットを結ぶ。ベルトコンベア71の移動に従い、薬剤9上のスポット位置はx方向に移動する。 One
光学分析装置5A,5Bそれぞれのスペクトル測定部30に含まれる分光器31b,31cは、図6に示されるような構成を有する。この図に示される分光器は、x'方向に長細いビーム形状を持ちy'方向に伝搬する物体光Dを入力し、この物体光Dを回折格子311により波長毎に分散させて2次元のアレイディテクタ312で受光することにより、x'方向の位置および波長の関数として物体光DのパワースペクトルEを測定する。その結果、光学分析装置5A,5Bそれぞれは、薬剤9のxy面およびxz面に投影した成分分布を測定する。これらの測定結果により、成分分布が予め定められた規格に適合しているかどうかを判定し、不適合な薬剤は押し出し装置73によって別のコンベア72へ分別される。 The
第3実施形態に係る光学分析装置のように損失スペクトルおよびラマンスペクトルを併用することにより、多種類の成分を含有する薬剤の特定の成分を分離して測定することが可能となる。ただし、成分の種類が少ない薬剤の場合は、損失スペクトルおよびラマンスペクトルのうち何れか一方のみでもよい。 By using a loss spectrum and a Raman spectrum together as in the optical analyzer according to the third embodiment, it is possible to separate and measure specific components of a drug containing many types of components. However, in the case of a drug with few types of components, only one of the loss spectrum and the Raman spectrum may be used.
本実施形態では、800nmより長波長の第2診断光と1400nmより長波長の第1診断光を用いるため、散乱の影響を低減して薬剤9の深部の情報を得ることができ、蛍光の影響も排除して高い信号対雑音比を実現することができる。さらに、診断光が光ファイバ14のHE11モードから出射されるため、薬剤9上に最小で1μm径のスポットを形成し、高い空間分解能で成分分布を分析することができる。また、損失スペクトルおよびラマンスペクトルを同時測定できるため、多種類の成分を含有する薬剤をも対象とすることができる。 In this embodiment, since the second diagnostic light having a wavelength longer than 800 nm and the first diagnostic light having a wavelength longer than 1400 nm are used, the influence of scattering can be reduced and information on the deep part of the
(組織検査方法の実施形態)
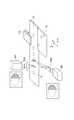
次に、本発明に係る組織検査方法の実施形態について説明する。本実施形態に係る組織検査方法は、上述した実施形態に係る光学分析装置と同様の構成を有する光学分析装置6A,6Bを用いて、波長範囲1.6〜1.8μmに含まれる波長の診断光を測定対象物としての生体組織に照射して、その測定対象物中の生理活性分子の空間分布を測定する。(Embodiment of tissue inspection method)
Next, an embodiment of the tissue examination method according to the present invention will be described. The tissue examination method according to the present embodiment uses the
図7は、本実施形態に係る組織検査方法の一例を説明する斜視図である。光学分析装置6Aから出力された診断光は、レンズ81によって、測定対象物としての生体組織9の表面または内部に集光される。光学分析装置6Aは、上述した第1〜第4実施形態の光学分析装置と同様の構成のものであり、特に第3実施形態の光学分析装置と同様の構成のものであるのが好適である。光学分析装置6Aは、生体組織9内の酵素、受容体、神経伝達物質、RNAなどの生理活性物質の分布を測定して、画像表示器60上に表示する。 FIG. 7 is a perspective view for explaining an example of the tissue examination method according to the present embodiment. The diagnostic light output from the
また、光学分析装置6Bから出力された診断光をレンズ82によって光ファイバ83の一端に集光し、光ファイバ83を切開部9aから生体組織9内部に挿入して経内視鏡的に組織内部に診断光を照射することによって、組織内部の生理活性物質の分布を測定してもよい。このように組織内の生理活性物質の分布を測定することにより、疾患の診断や治療効果の評価を行うことができる。 In addition, the diagnostic light output from the
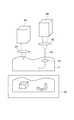
図8は、本実施形態に係る組織検査方法の他の例を説明する斜視図である。ここでも、上述した実施形態に係る光学分析装置と同様の構成を有する光学分析装置7を用いる。光学分析装置7から出力された診断光は、レンズ91によって、測定対象物としての生体組織9の内部に集光される。組織9は未分化胚性幹細胞9bから培養されたものである。 FIG. 8 is a perspective view for explaining another example of the tissue examination method according to the present embodiment. Also here, the
未分化胚性幹細胞9bの周波数スペクトルは、光学分析装置7に含まれる記憶部40により記憶されている。光学分析装置7は、未分化胚性幹細胞9bのスペクトルと一致する部位を表示器60に表示する。未分化胚性幹細胞9bを含む組織9の移植は発癌リスクがあることが知られているため、このようにして未分化胚性幹細胞9bの有無を判定することは再生組織の移植の安全性を確保する上で重要である。 The frequency spectrum of the undifferentiated
1〜4,5A,5B,6A,6B,7…光学分析装置、9…測定対象物、10…診断光光源部、11…励起パルス光源、12…種パルス光源、13…励起光源、14…光ファイバ、15a,15b…半透ミラー、16…レンズ、17…半透ミラー、18…光フィルタ、20…光学系、21a,21b…半透ミラー、22…固定ミラー、23…可動ミラー、24…レンズ、30…スペクトル測定部、31a,31b,31c…分光器、32…減算器、33…処理器、40…記憶部、50…演算部、60…表示部。 1 to 4, 5A, 5B, 6A, 6B, 7 ... optical analyzer, 9 ... measurement object, 10 ... diagnostic light source, 11 ... excitation pulse light source, 12 ... seed pulse light source, 13 ... excitation light source, 14 ... Optical fiber, 15a, 15b ... semi-transparent mirror, 16 ... lens, 17 ... semi-transparent mirror, 18 ... optical filter, 20 ... optical system, 21a, 21b ... semi-transparent mirror, 22 ... fixed mirror, 23 ... movable mirror, 24 DESCRIPTION OF SYMBOLS ... Lens, 30 ... Spectrum measurement part, 31a, 31b, 31c ... Spectroscope, 32 ... Subtractor, 33 ... Processor, 40 ... Memory | storage part, 50 ... Calculation part, 60 ... Display part.
Claims (7)
Translated fromJapanese前記診断光光源部から出力された診断光を集光して測定対象物に照射する照射光学系と、
前記照射光学系による前記測定対象物への診断光の照射に伴い前記測定対象物で発生する物体光を捕捉する捕捉光学系と、
前記捕捉光学系により捕捉された物体光を受光して該物体光の周波数スペクトルを測定するスペクトル測定部と、
既知物質の周波数スペクトルの情報を記憶する記憶部と、
前記スペクトル測定部により測定された物体光の周波数スペクトルと、前記記憶部により記憶された既知物質の周波数スペクトルとの一致度を計算し、この計算結果に基づいて前記測定対象物を分析する演算部と、
を備え、
前記診断光光源部が、
種光を出力する種光源と、この種光源から出力された種光を入力して非線形光学現象により前記診断光をHE11モードとして発生し出力する石英系の光ファイバと、を含み、
前記光ファイバの少なくとも一部において光パワーの空間密度が1mW/μm2以上であり、
0.8μm〜3.0μmの波長帯の少なくとも一部において1μW/nm以上の光パワーを有する前記診断光を出力する、
ことを特徴とする光学分析装置。A diagnostic light source unit that generates and outputs diagnostic light; and
An irradiation optical system that collects the diagnostic light output from the diagnostic light source unit and irradiates the measurement object;
A capture optical system that captures object light generated in the measurement object as the measurement object is irradiated with diagnostic light by the irradiation optical system;
A spectrum measuring unit that receives the object light captured by the capturing optical system and measures the frequency spectrum of the object light; and
A storage unit for storing information of a frequency spectrum of a known substance;
An arithmetic unit that calculates the degree of coincidence between the frequency spectrum of the object light measured by the spectrum measuring unit and the frequency spectrum of the known substance stored by the storage unit, and analyzes the measurement object based on the calculation result When,
With
The diagnostic light source unit is
Seen including a seed light source which outputs seed light, the optical fiber of the silica-based outputs to generate said diagnostic light as HE11 mode by a nonlinear optical phenomenon by inputting the seed light outputted from the seed light source,the,
In at least a part of the optical fiber, the spatial density of optical power is 1 mW / μm2or more,
Outputting the diagnostic light having an optical power of 1 μW / nm or more in at least a part of a wavelength band of 0.8 μm to 3.0 μm;
An optical analyzer characterized by that.
前記種光源として励起パルス光源を含み、
前記励起パルス光源から出力された励起パルス光を前記光ファイバに入力させて、その励起パルス光が前記光ファイバを伝搬する間に生じる非線型光学現象により該励起パルス光のスペクトルを広げ、そのスペクトルが広げられた励起パルス光を前記診断光として出力し、
前記捕捉光学系は、前記測定対象物への診断光の照射に伴い前記測定対象物で損失を被った診断光を前記物体光として捕捉し、
前記既知物質の周波数スペクトルは損失スペクトルであり、
演算部は、前記スペクトル測定部により測定された物体光の周波数スペクトルと、前記記憶部により記憶された既知物質の損失スペクトルとの一致度を計算し、この計算結果に基づいて前記測定対象物を分析する、
ことを特徴とする請求項1記載の光学分析装置。The diagnostic light source unit is
Including an excitation pulse light source as the seed light source,
The excitation pulse light output from the excitation pulse light source is input to the optical fiber, and the spectrum of the excitation pulse light is broadened by a nonlinear optical phenomenon that occurs while the excitation pulse light propagates through the optical fiber. Is output as the diagnostic light, the excitation pulse light is spread,
The capture optical system captures, as the object light, diagnostic light that has suffered a loss in the measurement object as the measurement object is irradiated with diagnostic light.
The frequency spectrum of the known substance is a loss spectrum,
The calculation unit calculates the degree of coincidence between the frequency spectrum of the object light measured by the spectrum measurement unit and the loss spectrum of the known substance stored by the storage unit, and based on the calculation result, calculates the measurement object. analyse,
The optical analyzer according to claim1 .
前記種光源として種パルス光源および励起光源を含み、
前記励起光源から出力された励起光を前記光ファイバに入力させて、前記光ファイバにおいて光パラメトリックゲインを発生させ、
前記種パルス光源から出力された種パルス光を前記光ファイバに入力させて、前記光ファイバにおいて光パラメトリックゲインによって該種パルス光を光増幅し、その光増幅された種パルス光を前記診断光として出力し、
前記診断光の中心波長が1400nm〜1800nmの波長範囲に含まれ、
前記捕捉光学系は、前記測定対象物への診断光の照射に伴い前記測定対象物で発生するラマン散乱光を前記物体光として捕捉し、
前記既知物質の周波数スペクトルはラマン散乱スペクトルであり、
演算部は、前記スペクトル測定部により測定された物体光の周波数スペクトルと、前記記憶部により記憶された既知物質のラマン散乱スペクトルとの一致度を計算し、この計算結果に基づいて前記測定対象物を分析する、
ことを特徴とする請求項1記載の光学分析装置。The diagnostic light source unit is
Including a seed pulse light source and an excitation light source as the seed light source,
The pumping light output from the pumping light source is input to the optical fiber to generate an optical parametric gain in the optical fiber,
The seed pulse light output from the seed pulse light source is input to the optical fiber, the seed pulse light is optically amplified by optical parametric gain in the optical fiber, and the optically amplified seed pulse light is used as the diagnostic light. Output,
A central wavelength of the diagnostic light is included in a wavelength range of 1400 nm to 1800 nm;
The capture optical system captures, as the object light, Raman scattered light generated in the measurement object as the measurement object is irradiated with diagnostic light,
The frequency spectrum of the known substance is a Raman scattering spectrum,
The calculation unit calculates the degree of coincidence between the frequency spectrum of the object light measured by the spectrum measurement unit and the Raman scattering spectrum of the known substance stored by the storage unit, and based on the calculation result, the measurement object Analyze
The optical analyzer according to claim1 .
前記種光源として種パルス光源,第1励起光源および第2励起パルス光源を含み、
前記第1励起光源から出力された励起光を前記光ファイバに入力させて、前記光ファイバにおいて光パラメトリックゲインを発生させ、
前記種パルス光源から出力された種パルス光を前記光ファイバに入力させて、前記光ファイバにおいて光パラメトリックゲインによって該種パルス光を光増幅し、その光増幅された種パルス光を第1診断光として出力するとともに、
前記第2励起パルス光源から出力された励起パルス光を前記光ファイバに入力させて、その励起パルス光が前記光ファイバを伝搬する間に生じる非線型光学現象により該励起パルス光のスペクトルを広げ、そのスペクトルが広げられた励起パルス光を第2診断光として出力し、
前記第1診断光の中心波長が1400nm〜1800nmの波長範囲に含まれ、
前記捕捉光学系は、前記測定対象物への第1診断光の照射に伴い前記測定対象物で発生するラマン散乱光を第1物体光として捕捉するとともに、前記測定対象物への第2診断光の照射に伴い前記測定対象物で損失を被った第2診断光を第2物体光として捕捉し、
前記既知物質の周波数スペクトルはラマン散乱スペクトルおよび損失スペクトルであり、
演算部は、前記スペクトル測定部により測定された第1物体光の周波数スペクトルと、前記記憶部により記憶された既知物質のラマン散乱スペクトルとの一致度を計算するとともに、前記スペクトル測定部により測定された第2物体光の周波数スペクトルと、前記記憶部により記憶された既知物質の損失スペクトルとの一致度を計算し、これらの計算結果に基づいて前記測定対象物を分析する、
ことを特徴とする請求項1記載の光学分析装置。The diagnostic light source unit is
The seed light source includes a seed pulse light source, a first excitation light source, and a second excitation pulse light source,
Pumping light output from the first pumping light source is input to the optical fiber to generate an optical parametric gain in the optical fiber;
The seed pulse light output from the seed pulse light source is input to the optical fiber, the seed pulse light is optically amplified by the optical parametric gain in the optical fiber, and the optically amplified seed pulse light is the first diagnostic light. Output as
The excitation pulse light output from the second excitation pulse light source is input to the optical fiber, and the spectrum of the excitation pulse light is broadened by a nonlinear optical phenomenon that occurs while the excitation pulse light propagates through the optical fiber. The excitation pulse light whose spectrum is expanded is output as the second diagnostic light,
A central wavelength of the first diagnostic light is included in a wavelength range of 1400 nm to 1800 nm;
The capture optical system captures, as first object light, Raman scattered light generated in the measurement object as the measurement object is irradiated with first diagnosis light, and second diagnosis light to the measurement object. Capturing the second diagnostic light, which has been lost in the measurement object as a result of irradiation, as the second object light,
The frequency spectrum of the known substance is a Raman scattering spectrum and a loss spectrum,
The calculation unit calculates the degree of coincidence between the frequency spectrum of the first object light measured by the spectrum measurement unit and the Raman scattering spectrum of the known substance stored by the storage unit, and is measured by the spectrum measurement unit. The degree of coincidence between the frequency spectrum of the second object light and the loss spectrum of the known substance stored in the storage unit is calculated, and the measurement object is analyzed based on these calculation results.
The optical analyzer according to claim1 .
The tissue examination method according to claim6 , wherein spectrum information of undifferentiated embryonic stem cells is stored in a storage unit included in the optical analyzer, and undifferentiated embryonic stem cells in a measurement target are detected. .
Priority Applications (6)
| Application Number | Priority Date | Filing Date | Title |
|---|---|---|---|
| JP2006013010AJP3992064B2 (en) | 2006-01-20 | 2006-01-20 | Optical analyzer |
| EP07706976.3AEP1975602B1 (en) | 2006-01-20 | 2007-01-18 | Optical analyzer |
| PCT/JP2007/050672WO2007083691A1 (en) | 2006-01-20 | 2007-01-18 | Optical analyzer |
| US11/921,577US20090209865A1 (en) | 2006-01-20 | 2007-01-18 | Optical analyzer |
| CN200780002668.8ACN101371130B (en) | 2006-01-20 | 2007-01-18 | optical analyzer |
| US12/858,087US8868158B2 (en) | 2006-01-20 | 2010-08-17 | Optical analyzer |
Applications Claiming Priority (1)
| Application Number | Priority Date | Filing Date | Title |
|---|---|---|---|
| JP2006013010AJP3992064B2 (en) | 2006-01-20 | 2006-01-20 | Optical analyzer |
Publications (2)
| Publication Number | Publication Date |
|---|---|
| JP2007192751A JP2007192751A (en) | 2007-08-02 |
| JP3992064B2true JP3992064B2 (en) | 2007-10-17 |
Family
ID=38287643
Family Applications (1)
| Application Number | Title | Priority Date | Filing Date |
|---|---|---|---|
| JP2006013010AExpired - Fee RelatedJP3992064B2 (en) | 2006-01-20 | 2006-01-20 | Optical analyzer |
Country Status (5)
| Country | Link |
|---|---|
| US (2) | US20090209865A1 (en) |
| EP (1) | EP1975602B1 (en) |
| JP (1) | JP3992064B2 (en) |
| CN (1) | CN101371130B (en) |
| WO (1) | WO2007083691A1 (en) |
Families Citing this family (7)
| Publication number | Priority date | Publication date | Assignee | Title |
|---|---|---|---|---|
| JP3992064B2 (en)* | 2006-01-20 | 2007-10-17 | 住友電気工業株式会社 | Optical analyzer |
| EP2155048B1 (en)* | 2007-04-25 | 2014-10-15 | Ruder Boskovic Institute | Method for real time tumour visualisation and demarcation by means of photodynamic diagnosis |
| CA3194784A1 (en) | 2008-05-20 | 2009-11-26 | University Health Network | Device and method for fluorescence-based imaging and monitoring |
| EP2694933B1 (en)* | 2011-04-06 | 2019-08-28 | Klein Medical Limited | Spectroscopic analyser |
| JP6769949B2 (en) | 2014-07-24 | 2020-10-14 | ユニバーシティー ヘルス ネットワーク | Data collection and analysis for diagnostic purposes |
| JP7257182B2 (en)* | 2019-02-27 | 2023-04-13 | 京セラ株式会社 | Inspection device and inspection method |
| JP7265908B2 (en) | 2019-03-27 | 2023-04-27 | ウシオ電機株式会社 | Tablet inspection method and tablet inspection device |
Family Cites Families (44)
| Publication number | Priority date | Publication date | Assignee | Title |
|---|---|---|---|---|
| US6111645A (en)* | 1991-04-29 | 2000-08-29 | Massachusetts Institute Of Technology | Grating based phase control optical delay line |
| US6485413B1 (en)* | 1991-04-29 | 2002-11-26 | The General Hospital Corporation | Methods and apparatus for forward-directed optical scanning instruments |
| US5553615A (en)* | 1994-01-31 | 1996-09-10 | Minnesota Mining And Manufacturing Company | Method and apparatus for noninvasive prediction of hematocrit |
| US5960146A (en)* | 1996-07-24 | 1999-09-28 | Sumitomo Electric Industries, Ltd. | Optical fiber and light source apparatus |
| US6043927A (en)* | 1997-06-26 | 2000-03-28 | University Of Michigan | Modulation instability wavelength converter |
| EP0938018B1 (en)* | 1997-08-27 | 2010-09-15 | Sumitomo Electric Industries, Ltd. | Non-linear optical fiber, optical fiber coil, and wavelength converter |
| US6352502B1 (en)* | 1998-12-03 | 2002-03-05 | Lightouch Medical, Inc. | Methods for obtaining enhanced spectroscopic information from living tissue, noninvasive assessment of skin condition and detection of skin abnormalities |
| US6587702B1 (en) | 1999-01-22 | 2003-07-01 | Instrumentation Metrics, Inc | Classification and characterization of tissue through features related to adipose tissue |
| US7123359B2 (en)* | 1999-05-17 | 2006-10-17 | Arrowhead Center, Inc. | Optical devices and methods employing nanoparticles, microcavities, and semicontinuous metal films |
| WO2001002904A1 (en)* | 1999-06-30 | 2001-01-11 | The Furukawa Electric Co., Ltd. | Optical fiber |
| US6577884B1 (en)* | 2000-06-19 | 2003-06-10 | The General Hospital Corporation | Detection of stroke events using diffuse optical tomagraphy |
| JP2002005835A (en) | 2000-06-23 | 2002-01-09 | 宏夫 ▲浜▼口 | Raman spectroscopic measuring apparatus and analytical method for living body sample using the same |
| US6961599B2 (en)* | 2001-01-09 | 2005-11-01 | Childrens Hospital Los Angeles | Identifying or measuring selected substances or toxins in a subject using resonant raman signals |
| GB0106553D0 (en)* | 2001-03-16 | 2001-05-02 | Univ Southampton | Timing jitter tolerant all-optical modulator and demultiplexing systems incorporating pulse-shaping fiber bragg gratings |
| JP3895560B2 (en)* | 2001-06-29 | 2007-03-22 | 富士通株式会社 | Method and apparatus for measuring waveform of optical signal |
| US6731967B1 (en)* | 2001-07-16 | 2004-05-04 | Pacesetter, Inc. | Methods and devices for vascular plethysmography via modulation of source intensity |
| AU2002324775A1 (en)* | 2001-08-23 | 2003-03-10 | Sciperio, Inc. | Architecture tool and methods of use |
| US6980299B1 (en)* | 2001-10-16 | 2005-12-27 | General Hospital Corporation | Systems and methods for imaging a sample |
| EP1463926A4 (en)* | 2002-01-10 | 2010-09-08 | Chemimage Corp | Method for detection of pathogenic microorganisms |
| US7355716B2 (en)* | 2002-01-24 | 2008-04-08 | The General Hospital Corporation | Apparatus and method for ranging and noise reduction of low coherence interferometry LCI and optical coherence tomography OCT signals by parallel detection of spectral bands |
| US6762875B2 (en)* | 2002-02-07 | 2004-07-13 | Corning Incorporated | Creating refractive index changes in glass by up-conversion of rare earth ions |
| EP1335199A1 (en)* | 2002-02-11 | 2003-08-13 | Bayer Corporation | Non-invasive system for the determination of analytes in body fluids |
| GB0215769D0 (en)* | 2002-07-08 | 2002-08-14 | Ic Innovations Ltd | A method of studying living cells |
| US6775447B2 (en)* | 2002-09-20 | 2004-08-10 | Fitel Usa Corp. | All fiber low noise supercontinuum source |
| US6958855B2 (en)* | 2002-09-27 | 2005-10-25 | Northwestern University | Microstructure fiber optical parametric oscillator |
| US7720526B1 (en)* | 2003-02-04 | 2010-05-18 | Modell Mark D | Self-interfering tomography system |
| EP2436307B1 (en)* | 2003-03-31 | 2015-10-21 | The General Hospital Corporation | Speckle reduction in optical coherence tomography by path length encoded angular compounding |
| US7023545B2 (en)* | 2003-06-12 | 2006-04-04 | Textron Systems Corporation | Chemical identification by flash spectroscopy |
| WO2005015303A1 (en)* | 2003-08-07 | 2005-02-17 | The Furukawa Electric Co., Ltd. | Nonlinear optical fiber and optical signal processing device using the optical fiber |
| GB2405466B (en)* | 2003-08-27 | 2006-01-25 | Teraview Ltd | Method and apparatus for investigating a non-planner sample |
| US6856737B1 (en)* | 2003-08-27 | 2005-02-15 | Mesophotonics Limited | Nonlinear optical device |
| EP1550854A2 (en)* | 2003-12-30 | 2005-07-06 | Rohm And Haas Company | Method for diagnosing and identifying contaminants |
| JP4579710B2 (en)* | 2004-02-20 | 2010-11-10 | フルカワ エレクトリック ノース アメリカ インコーポレーテッド | Modification, enhancement and adjustment of light generation in highly nonlinear fibers by post-processing |
| JP2005294806A (en)* | 2004-03-10 | 2005-10-20 | Sun Tec Kk | Wide-band light source |
| JP4819383B2 (en) | 2004-03-26 | 2011-11-24 | オリンパス株式会社 | Optical microscope and optical observation method |
| DE102004026931B3 (en) | 2004-06-01 | 2005-12-22 | Schott Ag | Broadband light source having a broadband spectrum, and a short coherence meter having such a light source |
| JP2006013010A (en) | 2004-06-23 | 2006-01-12 | Aica Kogyo Co Ltd | Multilayer printed board |
| JP2005140794A (en)* | 2005-01-13 | 2005-06-02 | E Graw An | Raman opto load process and device for detecting chemical substance and microorganism |
| WO2006078964A2 (en)* | 2005-01-21 | 2006-07-27 | Omni Sciences, Inc. | System and method for generating supercontinuum light |
| WO2007034802A1 (en)* | 2005-09-20 | 2007-03-29 | Sumitomo Electric Industries, Ltd. | Elasticity/viscosity measuring device |
| US7519253B2 (en)* | 2005-11-18 | 2009-04-14 | Omni Sciences, Inc. | Broadband or mid-infrared fiber light sources |
| KR100749910B1 (en)* | 2006-01-11 | 2007-08-21 | 한국과학기술연구원 | Continuous Waveform Ultra Wide Band Laser Light Source Resonator and Medical Diagnostic Device Using the Same |
| JP3992064B2 (en)* | 2006-01-20 | 2007-10-17 | 住友電気工業株式会社 | Optical analyzer |
| JP4904241B2 (en)* | 2007-10-11 | 2012-03-28 | 古河電気工業株式会社 | Holey fiber |
- 2006
- 2006-01-20JPJP2006013010Apatent/JP3992064B2/ennot_activeExpired - Fee Related
- 2007
- 2007-01-18WOPCT/JP2007/050672patent/WO2007083691A1/enactiveApplication Filing
- 2007-01-18CNCN200780002668.8Apatent/CN101371130B/ennot_activeExpired - Fee Related
- 2007-01-18USUS11/921,577patent/US20090209865A1/ennot_activeAbandoned
- 2007-01-18EPEP07706976.3Apatent/EP1975602B1/ennot_activeExpired - Fee Related
- 2010
- 2010-08-17USUS12/858,087patent/US8868158B2/ennot_activeExpired - Fee Related
Also Published As
| Publication number | Publication date |
|---|---|
| US8868158B2 (en) | 2014-10-21 |
| JP2007192751A (en) | 2007-08-02 |
| EP1975602B1 (en) | 2014-06-18 |
| US20090209865A1 (en) | 2009-08-20 |
| EP1975602A4 (en) | 2013-12-04 |
| US20100331706A1 (en) | 2010-12-30 |
| EP1975602A1 (en) | 2008-10-01 |
| CN101371130B (en) | 2012-07-11 |
| WO2007083691A1 (en) | 2007-07-26 |
| CN101371130A (en) | 2009-02-18 |
Similar Documents
| Publication | Publication Date | Title |
|---|---|---|
| JP7138050B2 (en) | Systems and methods for label-free cytometry based on Brillouin light scattering | |
| CN109124649B (en) | Device for non-invasive in vivo measurements by raman spectroscopy | |
| CA2550390C (en) | Method and system for measuring sub-surface composition of a sample | |
| JP3992064B2 (en) | Optical analyzer | |
| US6794670B1 (en) | Method and apparatus for spectrometric analysis of turbid, pharmaceutical samples | |
| US9658440B2 (en) | Optical probe for measuring light signals in vivo | |
| JP2013511718A (en) | Multiple pulse impulsive stimulated Raman spectroscopy apparatus and measurement method | |
| JP2017532541A (en) | Transdermal in vivo measurement method and apparatus by Raman spectroscopy | |
| KR20170107429A (en) | Method and apparatus for measuring a spectral sample response | |
| CN116209884A (en) | Methods and devices for fiber optic photothermal imaging and spectroscopy | |
| CN110763671A (en) | Small Frequency Shift Excited Raman Detection Device | |
| JP2015536467A (en) | Detection system and method using coherent anti-Stokes Raman spectroscopy | |
| US20040149914A1 (en) | Measuring technique | |
| US11406267B2 (en) | Cartilage-tissue analysis device | |
| US6353476B1 (en) | Apparatus and method for substantially simultaneous measurement of emissions | |
| JP2010133842A (en) | Nonlinear raman scattering light measurement device, endoscopic device using it, and microscope device | |
| CN100437195C (en) | Aberration correction for spectroscopic analysis | |
| EP3290984A1 (en) | Microscope device | |
| US7544503B2 (en) | Apparatus for the pH determination of blood and method therefor | |
| JP3422725B2 (en) | An analyzer that simultaneously performs Raman spectroscopy and particle size distribution measurement | |
| JPH09145619A (en) | Method and instrument for spectroscopic measurement of scattered light and so on | |
| JP2007093427A (en) | Analysis equipment | |
| RU196595U1 (en) | Device for spectroscopic optical coherence tomography with an endoscopic probe | |
| JP7099324B2 (en) | Cancer testing methods, cancer testing equipment, testing programs and cancer testing systems | |
| JP2006300611A (en) | Sample analyzer and sample analyzing method using it |
Legal Events
| Date | Code | Title | Description |
|---|---|---|---|
| A521 | Written amendment | Free format text:JAPANESE INTERMEDIATE CODE: A523 Effective date:20070531 | |
| TRDD | Decision of grant or rejection written | ||
| A01 | Written decision to grant a patent or to grant a registration (utility model) | Free format text:JAPANESE INTERMEDIATE CODE: A01 Effective date:20070703 | |
| A61 | First payment of annual fees (during grant procedure) | Free format text:JAPANESE INTERMEDIATE CODE: A61 Effective date:20070716 | |
| R150 | Certificate of patent or registration of utility model | Free format text:JAPANESE INTERMEDIATE CODE: R150 | |
| FPAY | Renewal fee payment (event date is renewal date of database) | Free format text:PAYMENT UNTIL: 20100803 Year of fee payment:3 | |
| FPAY | Renewal fee payment (event date is renewal date of database) | Free format text:PAYMENT UNTIL: 20110803 Year of fee payment:4 | |
| FPAY | Renewal fee payment (event date is renewal date of database) | Free format text:PAYMENT UNTIL: 20120803 Year of fee payment:5 | |
| FPAY | Renewal fee payment (event date is renewal date of database) | Free format text:PAYMENT UNTIL: 20130803 Year of fee payment:6 | |
| R250 | Receipt of annual fees | Free format text:JAPANESE INTERMEDIATE CODE: R250 | |
| R250 | Receipt of annual fees | Free format text:JAPANESE INTERMEDIATE CODE: R250 | |
| LAPS | Cancellation because of no payment of annual fees |