JP3820728B2 - Substrate measuring device - Google Patents
Substrate measuring deviceDownload PDFInfo
- Publication number
- JP3820728B2 JP3820728B2JP02312998AJP2312998AJP3820728B2JP 3820728 B2JP3820728 B2JP 3820728B2JP 02312998 AJP02312998 AJP 02312998AJP 2312998 AJP2312998 AJP 2312998AJP 3820728 B2JP3820728 B2JP 3820728B2
- Authority
- JP
- Japan
- Prior art keywords
- height
- measurement
- measuring
- window
- color filter
- Prior art date
- Legal status (The legal status is an assumption and is not a legal conclusion. Google has not performed a legal analysis and makes no representation as to the accuracy of the status listed.)
- Expired - Lifetime
Links
- 239000000758substrateSubstances0.000titleclaimsdescription33
- 238000005259measurementMethods0.000claimsdescription89
- 125000006850spacer groupChemical group0.000claimsdescription84
- 238000000034methodMethods0.000claimsdescription34
- 238000009826distributionMethods0.000claimsdescription11
- 238000004519manufacturing processMethods0.000claimsdescription9
- 239000011159matrix materialSubstances0.000claimsdescription6
- 239000004973liquid crystal related substanceSubstances0.000claimsdescription4
- 239000000203mixtureSubstances0.000claimsdescription2
- 238000000691measurement methodMethods0.000claims2
- 238000012545processingMethods0.000description33
- 238000010586diagramMethods0.000description27
- 238000003384imaging methodMethods0.000description10
- 239000000047productSubstances0.000description9
- 230000002950deficientEffects0.000description8
- 239000011347resinSubstances0.000description8
- 229920005989resinPolymers0.000description8
- 230000000694effectsEffects0.000description6
- 238000005286illuminationMethods0.000description5
- 238000007796conventional methodMethods0.000description4
- 238000013461designMethods0.000description4
- 230000004069differentiationEffects0.000description4
- 238000009434installationMethods0.000description4
- 230000006641stabilisationEffects0.000description4
- 238000011105stabilizationMethods0.000description4
- 230000005484gravityEffects0.000description3
- 230000003287optical effectEffects0.000description3
- 230000005856abnormalityEffects0.000description2
- 238000011161developmentMethods0.000description2
- 230000018109developmental processEffects0.000description2
- 238000005530etchingMethods0.000description2
- 239000012467final productSubstances0.000description2
- 230000012447hatchingEffects0.000description2
- 230000002265preventionEffects0.000description2
- 238000005520cutting processMethods0.000description1
- 230000001066destructive effectEffects0.000description1
- 239000011521glassSubstances0.000description1
- 239000004065semiconductorSubstances0.000description1
Images


Landscapes
- Length Measuring Devices By Optical Means (AREA)
- Testing Of Optical Devices Or Fibers (AREA)
- Liquid Crystal (AREA)
- Testing Or Measuring Of Semiconductors Or The Like (AREA)
Description
Translated fromJapanese【0001】
【発明の属する技術分野】
本発明は、カラーフィルタ、TFTアレイ基板、半導体などの積層膜構造体の各層または全体の高さまたは断面積または位置等の表面形状を測定するLCD用透明基板などの基板の測定装置およびカラーフィルタまたは透明電極基板の製造方法に関する。
【0002】
【従来の技術】
カラーフィルタ上にスペーサーを成形する方法としては種々の方法が知られている。たとえば、特開平9−43425号公報に記載されているように、BM上に各着色層を積層しスペーサとする技術がある。このスペーサーの測定技術として、スペーサーの高さ測定については触針式高さ計を使用し、スペーサーの面積、長さ、位置、数、あるいは画素開口部幅、画素開口部間の距離、ストライプ幅、ストライプ間の距離は光学顕微鏡を用いて測定を実施していた。しかしながら、そのような測定には、以下に述べるような問題があった。
【0003】
すなわち、スペーサーの高さ測定については、触針式高さ計を使用していたが、ある直線上の高さを測定するために、測定線上にスペーサーをとらえるのが困難であり、このため、測定する直線をわずかに移動させながらある範囲内について複数回測定していた。しかも破壊測定のため、測定したカラーフィルターは廃棄しなければならず、また、得られたチャートより検査員が高さを読み取っていたため、読み取り誤差が大きく、測定時間も長かった。
【0004】
また、スペーサーの面積および位置、画素開口部幅、画素開口部間の距離、ストライプ幅、ストライプ間の距離については、光学顕微鏡で拡大した画像に対し測定員が測長器にて測定を行っていたが、手動による測定のため読み取り誤差が大きく、測定時間も長かった。
【0005】
【発明が解決しようとする課題】
本発明は、従来の技術における上述した問題点を解決するもので、測定時間を短縮し、精度・再現性の良い基板の測定装置およびカラーフィルタまたは透明電極基板の製造方法を提供することを目的とする。
【0006】
【課題を解決するための手段】
上記目的を達成するための本発明の基板の測定装置は、以下の構成を有する。
すなわち、予め設計された凸部を複数有する基板の凸部の相対高さを測定する基板の測定方法であって、基板が対向する一対の基板の間に液晶組成物を挟持してなる液晶表示素子を構成する少なくとも一方の基板であり、高さ測定手段が該凸部を1つ以上含む測定領域内を均等に画素分割し、分割された画素単位毎に高さを測定する手段であり、
凸部の相対高さを、
(1)高さ測定手段で得られた高さ情報から高さのしきい値を設定し、
(2)しきい値を超える高さを持つ画素の塊の特徴量を測定し、
(3)特徴量が予め設定している範囲に入っている塊を凸部として認識し、
(4)凸部の位置を基準に、予め設定された相対位置にウインドウを設定してウィンドウ内の平均高さを測定し、
(5)凸部の高さと前記ウインドウ内の平均高さとの差をとることにより算出する、
ことを特徴とする基板の測定方法である。
【0007】
また、カラーフィルタまたは透明電極基板の製造方法であって、前記カラーフィルタまたは透明電極基板上の凸部を複数有する基板の1つ以上の凸部の高さを測定し、前記カラーフィルタまたは透明電極基板の良否判定を行うことを特徴とするものである。
【0008】
【発明の実施の形態】
[実施例1]
以下、本発明における高さ情報を用いた測定の一実施例を図面に基づいて説明する。
【0009】
図1は、本発明の測定対象であるカラーフィルタ1の上面図である。図2はカラーフィルタの断面図である。次に測定対象であるスペーサーの高さ、断面積、位置、画素開口部幅、画素開口部間の距離、ストライプ幅、ストライプ間の距離を説明する。
【0010】
スペーサー高さは図2のHS に示すように、画素開口部109からスペーサー110の最上部までの距離である。
【0011】
スペーサー断面積は、図2のAA’での着色層(赤色層)の断面積である。
【0012】
スペーサー位置は、図1のストライプ端部112からの距離P1 ,画素開口部109の端部からの距離P2 ,P3 を測定する。
【0013】
画素開口部間の距離を図1のL1 、L5 、画素開口部幅を図1のL2 、ストライプ幅を図1のL3 、ストライプ間の距離を図1のL4 にそれぞれ示す。
【0014】
図3は、本発明の測定装置の模式図で、ステージ2、高さ測定装置3、データ処理装置5、制御装置6、表示装置6から構成されている。
【0015】
ステージ2は、カラーフィルタを表面に載置、固定し、カラーフィルタの任意の点が測定できるようにするもので、XY方向に移動する。
【0016】
高さ測定装置3は、カラーフィルタ上のある範囲を画素に分割して、その画素ごとの高さを測定するもので、制御装置6より高さ測定開始信号を与えられると高さ測定を開始し、測定を終了すると高さ測定終了信号を制御部6に出力し、高さデータをデータ処理装置5に転送する。高さ測定装置3は、ある範囲を画素に分割して、その画素ごとの高さを測定するものであれば、どのようなものでもかまわない。
【0017】
データ処理装置5は、高さ測定装置3で測定した高さ情報から、スペーサーの高さ、断面積、長さ、位置、数およびカラーフィルタ画素開口部幅、画素開口部間の距離、ストライプ幅、ストライプ間の距離を測定するものである。制御装置6からデータ処理開始信号を与えられるとデータ処理を開始し、データ処理を終了するとデータ処理終了信号を制御装置6に出力する。
【0018】
制御装置6は、決められた手順に基づいて、前記ステージと高さ測定装置とデータ処理装置に操作指令を与えるためのものである。
【0019】
表示装置7は、データ処理装置で測定したスペーサーの高さ、断面積、長さ、位置、数を表示するためのものである。
【0020】
次に本発明の測定装置の作用を図7のフローチャートを用いて説明する。
【0021】
まず、サンプルをステージに設置し測定開始ボタンを押す。(ステップ1)
サンプルの設置は、手動でも、ロボットアーム等で自動で行ってもかまわない。測定開始ボタンが押されると、制御装置6は測定するスペーサーが高さ測定装置の測定範囲内にくるように予め設定した移動量と、移動開始信号をステージ2に与える。この時、サンプル設置位置にバラツキがある場合は、アライメントをかけ設置誤差を測定しステージの移動量を補正するのが望ましい。移動開始信号を与えられたステージ2は移動を開始し、移動終了後に移動終了信号を制御装置6に与える(ステップ2)。
【0022】
移動終了信号が与えられた制御装置6は、高さ測定装置3に高さ測定開始信号を与える。測定開始信号を与えられた高さ測定装置3は高さ測定を開始し、測定終了後にデータ処理装置5に高さデータを送り、高さ測定終了信号を制御装置6に与える(ステップ3)。高さ測定装置3はカラーフィルタ表面の最も低い位置よりさらに数μm低い位置を高さの原点として測定を開始する。測定範囲は、測定対象であるカラーフィルタの表面の凹凸をすべて測定できるように設定する。
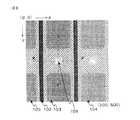
図4は高さ測定装置3で測定されたカラーフィルタの高さデータで、高い部分を108に示すように薄いハッチングで、低い部分を102に示すように濃いハッチングで表示している。図5は図4のXX’間の高さを、図6は図4のYY’間の高さを示しており、横軸が位置、縦軸が高さである。
【0023】
高さ測定終了信号を与えられた制御装置6は、データ処理装置5にデータ処理開始信号を与える。データ処理開始信号を与えられたデータ処理装置5は、以下の手順でスペーサーの高さ、断面積、位置を測定する。
【0024】
まず、与えられた高さデータの最大値Hmax、最小値Hminを求め、HmaxとHminの差を高さ範囲Rとし、予め設定した値Hと比較する。R≧Hの場合は、そのまま処理を継続するが、R<Hの場合は画面内にスペーサーが存在しないかスペーサーの高さが極端に低いとして処理を終了し、表示装置7に高さ範囲Rを表示する(ステップ4)。Hはカラーフィルタの着色層の膜厚等から決定する。
【0025】
次にスペーサー部分を切り出すために高さによる2値化を行なう。(ステップ5)。2値化のしきい値THは前記HmaxとHminからスペーサー部分をうまく切り出すように設定する。2値化は、高さ測定装置3で得られた各画素の高さとしきい値THを比較して、高い場合は1、低い場合は0とした。スペーサー部分を切り出した2値化画像を図8に示す。白い部分がしきい値より高いスペーサー部分である。
【0026】
次に図8の白い塊に対して面積、長さ、幅、重心位置等の特徴量を測定する(ステップ6)。これらの特徴量が予め設定している範囲内に入っているものをスペーサーとして認識する。特徴量が設定した範囲内に入っている前記塊が1つも存在しなかった場合は、スペーサーが存在しないものとして処理を終了し、表示装置7にその旨を表示する(ステップ7)。
【0027】
前記塊が1つの場合は、重心位置Xc,Ycを記憶する(ステップ8)。前記塊が2つ存在した場合は、1画面に複数のスペーサーがあるものとし、ステップ8〜ステップ18を各スペーサーごとに繰り返す。
【0028】
次に前記重心位置を基準にして、図9に示すW1 〜W6 のウインドウを設定する(ステップ9)。これらのウインドウの大きさとXc ,Yc との相対位置は測定するカラーフィルタに応じて予め設定している。W1 はスペーサー部分の高さおよび各層の膜厚を測定するためのウインドウである。W2 は開口部の高さを測定するためのウインドウである。W3 、W4 は開口部エッジを測定するウインドウである。W5 、W6 は開口部エッジおよびストライプエッジおよび隣接するストライプエッジを測定するためのウインドウである。
【0029】
次にウインドウW2 内の平均高さを求めて、開口部高さWH とする(ステップ10)。
【0030】
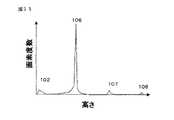
次にウインドウW1 について高さデータの分布図を作成する(ステップ11)。図10は図9のウインドウW1 部分を拡大した図である。図11は高さデータの分布図であり、横軸が高さ分割値、縦軸が画素数である。高さ分割値は実際の高さを整数に変換したものである。この図11の102部分のピークは、図10で示す樹脂ブラックマトリクス102部分であり、以下同様に106〜108は対応している。
【0031】
次に図11の高さ分布図のピークを認識し、各着色層の高さを測定する。(ステップ12)。ピーク認識は、どのような手法を用いてもかまわない。
【0032】
次に、スペーサー高さHS を求める(ステップ13)。スペーサー高さはカラーフィルタをセル組みした後、セルギャップを決定する重要な要素である。スペーサー高さはW1 の最大値をHT としても良いが、測定精度を向上させるためスペーサーの断面積がある面積になる高さをHT とし、高さ測定装置3でのスパイクノイズなどの影響をなくすのが望ましい。
【0033】
次に、得られた各層の高さから、各層の膜厚を計算する(ステップ14)。
【0034】
次に、スペーサの断面積、スペーサーの位置を測定する(ステップ15)。ステップ5で行った2値化では、スペーサーのどの部分で2値化したか正確にはわからない。そこで、ステップ12で求めた各着色層の高さからしきい値THSを求め、再度2値化を行なう。
【0035】
しきい値THSで2値化した画像について特徴量を測定し、スペーサー断面積 As 、スペーサー位置X軸最大値Xmax 、最小値Xmin 、Y軸最大値Ymax 、Ymin を求める(ステップ16)。
【0036】
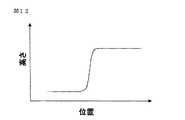
次にウインドウ内のエッジ位置を測定する(ステップ17)。開口部エッジの測定について、W3 のウインドウについて説明する。まず、測定するエッジと平行方向にウインドウ内で高さデータの平均を取りノイズを除去する。図12に平均後の高さデータを示す。このデータにさらに移動平均をかけノイズを除去し、微分をかけたデータを図13に示す。この図13の微分値のピーク位置をエッジ位置E3 として認識する。ピークの認識にはどのような手法を用いてもかまわない。以下同様にW4 について開口部エッジを測定しE4 を求める。
【0037】
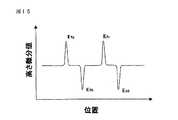
次にストライプ部分のエッジ測定について、W5 のウインドウについて説明する。まず、測定するエッジと平行方向にウインドウ内で高さデータの平均をとりノイズを除去する。図14に平均後の高さデータを示す。このデータにさらに移動平均をかけノイズを除去し、微分をかけたデータを図15に示す。この図15の微分値のピーク位置をエッジとして認識する。ピーク○1は開口部エッジ、ピーク○2はストライプエッジ、ピーク○3は隣のストライプエッジ、ピーク○4は隣の画素の開口部エッジである。ピーク認識はウインドウW3と同様に行い、開口部エッジE5a、ストライプエッジ位置E5b、隣のストライプエッジ位置E5c、隣の画素の開口部エッジ位置E5dを測定する。
【0038】
以下同様にW6 について、開口部エッジE6d、ストライプエッジ位置E6c、隣のストライプエッジ位置E6b、隣の画素の開口部エッジ位置E6aを測定した。また、W1 〜W6 以外にウインドウを設定してエッジを測定し、他の項目について測定を行ってもかまわない。
【0039】
次にスペーサー位置、エッジ位置から、ストライプ端部からの距離P1 、窓開口部端部からの距離P2 ,P3 、画素開口部間の距離L1 、画素開口部幅L2 、ストライプ幅L3 、ストライプ間の距離L4 、L5 をそれぞれ求める(ステップ18)。
【0040】
最後に測定結果を表示装置7に表示する。(ステップ19)
以下、実際の測定結果の一例を説明する。測定は図1に示すカラーフィルタにおいて、製造時のエッチング時間および着色層膜厚の水準を変化させた複数のサンプルについて行った。以下にある水準のサンプル中央付近のスペーサーの測定について説明する。
【0041】
まず、手動でサンプルをステージ2に設置して測定開始すると、ステージ2は高さ測定装置の測定範囲内に前記スペーサーがくるようにサンプルを移動させる。
【0042】
次に、高さ測定装置3は高さ測定を開始し、データ処理装置5に高さデータを送る。高さ測定装置3は、光干渉式高さ計を用い、□200μmの範囲について、1画素□0.4μmで500×500画素について、高さ精度±0.05μmの精度で測定した。データ処理装置5で高さデータの最大値Hmax 、最小値Hmin 、高さ範囲Rを求めたところ以下のようになった。なお、H=4.00とした。
【0043】
Hmax = 8.90[μm]
Hmin = 1.00[μm]
R = 7.90[μm]
次にスペーサー部分を切り出すために高さによる2値化を実施した。2値化のしきい値THを下記[式1]により決めたところ、TH=7.32となった。
[式1]
TH = Hmin + 0.8×R
2値化した画像の白い塊に対して面積、長さ、幅、重心位置等の特徴量を測定したところ、予め設定した面積、長さ、幅の範囲内に入っている塊が1つ存在したため、これをスペーサーとして認識し、重心位置Xc,Ycを記憶した。
【0044】
次に前記重心位置Xc,Ycを基準にして、W1 〜W6 のウインドウを設定した。
【0045】
次にウインドウW2 内の平均高さを求めたところ、開口部高さWH は以下のようになった。
【0046】
WH = 2.50[μm]
次にウインドウW1 について高さデータの分布図を作成した。本実施例では、分布の刻み間隔Hdiv をHdiv =0.02[μm]として下記[式2]より分割数DIVを求めところ、DIV=395となった。
[式2]
DIV=(Hmax −Hmin )/Hdiv (DIVは整数)
高さデータの分布図横軸の高さ分割値Dと実際の高さHには、下記[式3]の関係がある。
[式3]
H=Hmin +Hdiv ・D
次に高さ分布図のピーク位置を認識した。ピーク位置の認識は、まず高さ最小値からBM膜厚設計値の範囲で、画素数が最大となる高さ分割値をBM高さの分割値HDBMと認識し、上記[式3]によってBM高さHBMを求める。以下同様に、このBM高さを基準として、青色層膜厚設計値の60%から140%の範囲で画素数が最大となる高さ分割値から青色層高さHB を求める。次に青色層高さを基準に緑色層膜厚設計値の60%から140%の範囲で画素数が最大となる高さ分割値から緑色層高さHG を求める。次に緑色層高さを基準に赤色層膜厚設計値の60%から140%の範囲で画素数が最大となる高さ分割値から赤色層高さHB を求める。今回は、前述のようなピーク認識手法を使用したが、微分等を利用してピークを認識してもかまわない。それぞれのピーク位置、着色層高さは以下のようになった。
【0047】
HDBM = 15
HDB = 140
HDG = 265
HBM = 1.30 [μm]
HB = 3.80 [μm]
HG = 6.30 [μm]
次に、スペーサー頂上部の高さHT を求める(ステップ13)。高さ測定装置3でのスパイクノイズなどの影響をなくし測定精度を向上させるため、ある断面積Sになる分割値HDT を求める。高さ分布図のある分割値HDT でのスペーサー断面積Sは、下記[式4]になる。
[式4]
DIV
S =Σ f(x)× P2
x= HD T
x :高さ分割値
f(x):高さ分割値xでの画素数
DIV :高さ分布図の分割数
P :1画素の幅[μm]
そこで、以下の[式5]を満たす分割値HDT を求めることで、スペーサーの断面積Aになる分割値が得られる。
[式5]
DIV DIV
Σ f(x) ≦ A/P < Σ f(x)
x= HD T +1 x= HD T
本実施例では、A=2.00としたところ、HD T =345を得た。この高さ分割値HDT を[式3]代入して、スペーサー頂上部の高さHT は以下のようになった。
【0048】
HT = 7.90 [μm]
これよりスペーサー高さHS は次のようになる。
【0049】
HS = HT − HW
= 6.30 [μm]
次に、得られた各層の高さから、各層の膜厚を計算する。BM膜厚TBM、青色層膜厚TB 、緑色層膜厚TG 、赤色層膜厚TR を[式6][式7][式8][式9]より計算。
[式6]
TBM = HB −HW
[式7]
TB = HB −HBM
[式8]
TG = HG −HB
[式9]
TR = HT −HG
得られた各層の膜厚は以下のようになった。
【0050】
TBM = 1.30 [μm]
TB = 2.50 [μm]
TG = 2.50 [μm]
TR = 2.50 [μm]
次に、スペーサの断面積、スペーサーの位置を測定した。本実施例では、赤色層の中央での柱断面の面積をスペーサー断面積としたので、2値化のしきい値THSは[式10]で求めた。その結果、THS =7.55を得た。
[式10]
THS = ( HT + HG )/2
しきい値THS で2値化した画像について特徴量を測定し、スペーサー断面積As 、スペーサー位置X軸最大値Xmax 、最小値Xmin 、Y軸最大値Ymax 、Ymin を求めたところ、以下のようになった。
【0051】
As = 140 [μm2 ]
Xmax = 125
Xmin = 200
Ymax = 230
Ymin = 270
次にウインドウW3 、W4 、W5 、W6 のエッジ位置を測定したところ、エッジ位置は以下のようになった。
【0052】
E3 = 200.0
E4 = 300.0
E5a = 50.0
E5b = 57.5
E5c = 67.5
E5d = 75.0
E6a = 250.0
E6b = 257.5
E6c = 267.5
E6d = 275.0
次にスペーサー位置、エッジ位置から、ストライプ端部からの距離P1 を[式11]で、窓開口部端部からの距離P2 ,P3 を[式12]、[式13]で、画素開口部間の距離L1 を[式14]で、画素開口部幅L2 を[式13]で、ストライプ幅L3 を[式16]で、ストライプ間の距離L4 、L5 を[式17][式18]でそれぞれ求めた。
[式11]
P1 =( Xmin − E5b )× P
[式12]
P2 =( Ymin − E3 )× P
[式13]
P3 =( E4 − Ymax )× P
[式14]
L1 =( E4 − E3 )× P
[式15]
L2 =( E6a − E5d )× P
[式16]
L3 =( E6b − E5c )× P
[式17]
L4 =( E5c − E5b )× P
[式18]
L5 =( E5d − E5a )× P
計算結果は以下のようになった。
【0053】
P1 = 27.0 [μm]
P2 = 12.0 [μm]
P3 = 12.0 [μm]
L1 = 40.0 [μm]
L2 = 70.0 [μm]
L3 = 76.0 [μm]
L4 = 4.0 [μm]
L5 = 10.0 [μm]
他の着色層上のスペーサーおよび、他の水準のサンプルについても同様にして測定を行った。得られた測定結果と、従来の方法で得られた結果には高い相関があった。また、同じサンプルを繰り返し測定した場合の繰り返し精度は、いずれの測定項目も従来の方法より向上した。測定時間については大幅に短縮できた。
【0054】
本実施例では高さ測定装置として、ある範囲を画素に分割してその画素ごとの高さを測定する装置を用いたが、予め設定したある直線もしくは、ある点について高さを測定することで、突起状物の有無を判定してもかまわない。
【0055】
本実施例では、図2に示すカラーフィルタについて測定を実施したが、図16に示すカラーフィルタについても測定可能である。図16は、3色の着色層以外に樹脂層111を積層し、パターン加工してスペーサーを設置したカラーフィルタである。
【0056】
また、この測定装置を製造工程で使用したところ、工程の安定化、不良品の流出防止等の効果をあげることができた。工程の安定化については、最終製品のスペーサーを測定することで各着色層の膜厚および現像状態がわかるため、これをフィードバックすることで工程状態の変動を問題のない範囲内に管理できた。今回は常に測定結果を監視していたが、ある設定枚数の不良品がでた場合に警報をならして作業員に工程の異常を知らせてもかまわない。また、全ての基板について測定をおこない良否判定し、不良品を抜き出すことで不良品の流出防止がはかれた。
[実施例2]
以下、本発明における輝度情報を用いた測定の実施の一例を図面に基づいて説明する。
【0057】
測定対象は実施例1と同様のため説明は省略する。
【0058】
図17は、本発明の測定装置の模式図で、ステージ2、照明装置8、撮像装置4、データ処理装置5、制御装置6、表示装置7から構成されている。
【0059】
ステージ2は、カラーフィルタを表面に載置、固定し、カラーフィルタの任意の点が測定できるようにするもので、XY方向に移動する。
【0060】
照明装置8は測定対象に光を照射する。今回は同軸落射照明を用いたが、暗視野照明を用いても構わない。また、透過照明を併用してもかまわない。
【0061】
撮像装置4は、カラーフィルタ上のある範囲を画素に分割して、その画素ごとの輝度を測定するもので、制御装置6より輝度測定開始信号を与えられると輝度測定を開始し、測定を終了すると輝度測定終了信号を制御部6に出力し、輝度データをデータ処理装置5に転送する。撮像装置として、本実施例ではエリアセンサCCDカメラを用いたが、ある範囲を画素に分割して、その画素ごとの輝度を測定するものであれば、ラインセンサCCDカメラ等を用いても構わない。
【0062】
データ処理装置5は、撮像装置4で測定した輝度データから、スペーサーの断面積、長さ、位置、数およびカラーフィルタ画素開口部幅、画素開口部間の距離、ストライプ幅、ストライプ間の距離を測定するものである。制御装置6からデータ処理開始信号を与えられるとデータ処理を開始し、データ処理を終了するとデータ処理終了信号を制御装置6に出力する。
【0063】
制御装置6は、決められた手順に基づいて、前記ステージと輝度測定装置とデータ処理装置に操作指令を与えるためのものである。
【0064】
表示装置7は、データ処理装置で測定したスペーサーの断面積、長さ、位置、数を表示するためのものである。
【0065】
次に本発明の測定装置の作用を図21のフローチャートを用いて説明する。
【0066】
まず、サンプルをステージに設置し測定開始ボタンを押す。(ステップ1)
サンプルの設置は、手動でも、ロボットアーム等で自動で行ってももかまわない。測定開始ボタンが押されると、制御装置6は測定するスペーサーが撮像装置の測定範囲内にくるように予め設定した移動量と、移動開始信号をステージ2に与える。この時、サンプル設置位置にバラツキがある場合は、アライメントをかけ設置誤差を測定しステージの移動量を補正するのが望ましい。移動開始信号を与えられたステージ2は移動を開始し、移動終了後に移動終了信号を制御装置6に与える(ステップ2)。
【0067】
移動終了信号が与えられた制御装置6は、撮像装置4に輝度測定開始信号を与える。測定開始信号を与えられた撮像装置4は輝度測定を開始し、測定終了後にデータ処理装置5に輝度データを送り、輝度測定終了信号を制御装置6に与える(ステップ3)。図18は撮像装置4で測定されたカラーフィルタの輝度データの模式図で、輝度が高い部分を白く、低い部分を黒く表示している。図19は図18のXX’間の輝度を、図20は図18のYY’間の輝度を示しており、横軸が位置、縦軸が輝度である。
【0068】
輝度測定終了信号を与えられた制御装置6は、データ処理装置5にデータ処理開始信号を与える。データ処理開始信号を与えられたデータ処理装置5は、以下の手順でスペーサーの長さ、断面積、位置、数を測定する。
【0069】
まず、図22に示すように予め設定されたスペーサー部分の輝度データをマスターパターンとして図18の輝度データに対してパターンマッチングをかけてスペーサーの概略位置、数を測定する。スペーサーの数が1つ以上の場合は、そのまま処理を継続するが、存在しないときは画面内にスペーサーが存在しないかスペーサーの形が極端に異なるとして処理を終了し、表示装置7にその旨を表示する(ステップ4)。
【0070】
スペーサーが1つの場合は、マスターパタン中心位置Xc,Ycを記憶する(ステップ5)。スペーサーが2つ存在した場合は、ステップ6〜ステップ11を各スペーサーごとに繰り返す。
【0071】
次に前記中心位置を基準にして、図23に示すW1 〜W6 のウインドウを設定する(ステップ6)。これらのウインドウの大きさとXc ,Yc との相対位置は測定するカラーフィルタに応じて予め設定している。W1 はスペーサーの長さを測定するためのウインドウである。W2 はスペーサーの幅を測定するためのウインドウである。W3 、W4 は開口部エッジを測定するウインドウである。W5 、W6 は開口部エッジおよびストライプエッジおよび隣接するストライプエッジを測定するためのウインドウである。
【0072】
次にウインドウW1 およびW2 内のエッジ個数から設計どおりに着色層が積層されているかを判定する(ステップ7)。エッジの測定について、W1 のウインドウについて説明する。ます、測定するエッジと平行方向にウインドウ内で輝度データの平均を取りノイズを除去する。図24に平均後の輝度データを示す。
【0073】
図24のaおよびdは図1の5の着色層のエッジであり、bおよびcは図1の4の着色層のエッジである。このデータにさらに移動平均をかけノイズを除去し、2回微分をかけたデータを図25に示す。この図25の2回微分値のピーク位置をエッジ位置E1a、E1b、E1c、E1dとして認識する。ピークの認識にはどのような手法を用いてもかまわない。以下同様にW2 についてエッジ位置E2a、E2b、E2c、E2dを測定する。
【0074】
次にウインドウW1 およびW2 内のエッジ位置からスペーサーの長さ、幅、断面積、位置を測定する(ステップ8)。
【0075】
次にストライプ部分のエッジ測定を行う(ステップ9)。W3 〜W6 のウインドウについて、ステップ7と同様にエッジ位置の認識を行う。
【0076】
次にスペーサー位置、エッジ位置から、ストライプ端部からの距離P1 、窓開口部端部からの距離P2 ,P3 、画素開口部間の距離L1 、画素開口部幅L2 、ストライプ幅L3 、ストライプ間の距離L4 、L5 をそれぞれ求める(ステップ10)。
【0077】
最後に測定結果を表示装置7に表示する。(ステップ11)
以下、実際の測定結果の一例を説明する。測定は図1に示すカラーフィルタにおいて、製造時のエッチング時間および着色層膜厚の水準を変化させた複数のサンプルについて行った。以下にある水準のサンプル中央付近のスペーサーの測定について説明する。
【0078】
まず、手動でサンプルをステージ2に設置して測定開始すると、ステージ2は輝度測定装置の測定範囲内に前記スペーサーがくるようにサンプルを移動させる。
【0079】
次に、撮像装置4は輝度測定を開始し、データ処理装置5に輝度データを送る。撮像装置4は、エリアセンサCCDカメラを用い、□200μmの範囲について、1画素□0.4μmで500×500画素について輝度を測定した。
【0080】
次に、パターンマッチングをかけてスペーサーの数を測定したところ、スペーサーの数は2つであった。まずこのうちの1つについての測定を説明する。
【0081】
このスペーサーの中心座標Xc 、Yc は以下のようになった。
【0082】
Xc =160
Yc =250
この中心座標を基準にウインドウW1 〜W6 を設定しエッジ位置を測定したところ、エッジ位置は以下のようになった。
【0083】
E1a = 115.0
E1b = 125.0
E1c = 200.0
E1d = 210.0
E2a = 220.0
E2b = 230.0
E2c = 270.0
E2d = 280.0
E3 = 200.0
E4 = 300.0
E5a = 50.0
E5b = 57.5
E5c = 67.5
E5d = 75.0
E6a = 250.0
E6b = 257.5
E6c = 267.5
E6d = 275.0
次にスペーサー位置、エッジ位置から、ストライプ端部からの距離P1 を[式11]で、窓開口部端部からの距離P2 ,P3 を[式12]、[式13]で、スペーサーの長さK1 、幅K2 、断面積Aを[式14]、[式15]、[式16]で、画素開口部間の距離L1 を[式17]で、画素開口部幅L2 を[式18]で、ストライプ幅L3 を[式19]で、ストライプ間の距離L4 、L5 を[式20][式21]でそれぞれ求めた。
[式11]
P1 =( E1b − E5b )× P
[式12]
P2 =( E2b − E3 )× P
[式13]
P3 =( E4 − E2c )× P
[式14]
K1 =( E1c − E1b )× P
[式15]
K2 =( E2c − E2b )× P
[式16]
A =( K1 − K2 )× K2 + 0.785 × K2 2
[式17]
L1 =( E4 − E3 )× P
[式18]
L2 =( E6a − E5d )× P
[式19]
L3 =( E6b − E5c )× P
[式20]
L4 =( E5c − E5b )× P
[式21]
L5 =( E5d − E5a )× P
計算結果は以下のようになった。
【0084】
P1 = 27.0 [μm]
P2 = 12.0 [μm]
P3 = 12.0 [μm]
K1 = 30.0 [μm]
K2 = 16.0 [μm]
A =425.0 [μm2 ]
L1 = 40.0 [μm]
L2 = 70.0 [μm]
L3 = 76.0 [μm]
L4 = 4.0 [μm]
L5 = 10.0 [μm]
他の着色層上のスペーサーおよび、他の水準のサンプルについても同様にして測定を行った。得られた測定結果と、従来の方法で得られた結果には高い相関があった。また、同じサンプルを繰り返し測定した場合の繰り返し精度は、いずれの測定項目も従来の方法より向上した。測定時間については大幅に短縮できた。
【0085】
本実施例ではスペーサーの認識としてパターンマッチングを用いたが、周波数フィルタ等を用いてスペーサー部分のみを強調し認識しても構わない。
【0086】
本実施例では、図2に示すカラーフィルタについて測定を実施したが、図16に示すように3色の着色層以外に樹脂層を使用してスペーサーを設置したカラーフィルタについても測定可能である。
【0087】
また、この測定装置を製造工程で使用したところ、工程の安定化、不良品の流出防止等の効果をあげることができた。工程の安定化については、最終製品のスペーサーを測定することで各着色層の膜厚および現像状態がわかるため、これをフィードバックすることで工程状態の変動を問題のない範囲内に管理できた。今回は常に測定結果を監視していたが、ある設定枚数の不良品がでた場合に警報をならして作業員に工程の異常を知らせてもかまわない。また、全ての基板について測定をおこない良否判定し不良品を抜き出すことで不良品の流出防止がはかれた。
【0088】
【発明の効果】
本発明の測定装置によれば、短時間で精度・再現性の良い判定が可能になるという優れた効果が得られる。
【図面の簡単な説明】
【図1】本発明の測定対象であるカラーフィルタの上面図である。
【図2】本発明の測定対象であるカラーフィルタの断面図である。
【図3】本発明の一例である測定装置の全体模式図である。
【図4】高さ測定結果を濃淡に変換した図である。
【図5】図4のXX’の高さデータを示す図である。
【図6】図4のYY’の高さデータを示す図である。
【図7】本発明の測定の手順の一例を示す図である。
【図8】高さ測定結果をある高さで2値化したときの図である。
【図9】ウインドウの位置関係を示す図である。
【図10】ウインドウW1を拡大した図である。
【図11】ウインドウW1の高さデータの分布図である。
【図12】ウインドウW3の高さデータを示す図である。
【図13】ウインドウW3の高さデータの微分値を示す図である。
【図14】ウインドウW5を高さデータを示す図である。
【図15】ウインドウW5を高さデータの微分値を示す図である。
【図16】本発明で測定可能なカラーフィルタの断面図の一例である。
【図17】本発明の一例である測定装置の全体模式図である。
【図18】輝度測定結果を濃淡に変換した図である。
【図19】図18のXX’の輝度データを示す図である。
【図20】図18のYY’の輝度データを示す図である。
【図21】本発明の測定の手順の一例を示す図である。
【図22】パターンマッチングで使用したマスタパターンを示す図である。
【図23】ウインドウの位置関係を示す図である。
【図24】ウインドウW1の輝度データを示す図である。
【図25】ウインドウW1の輝度データの微分値を示す図である。
【符号の説明】
1……カラーフィルタ
2……ステージ
3……高さ測定装置
4……撮像装置
5……データ処理装置
6……制御装置
7……表示装置
8……照明装置
101……透明基板(ガラス基板)
102……樹脂ブラックマトリクス
103……着色層(青色層)
104……着色層(緑色層)
105……着色層(赤色層)
106……樹脂ブラックマトリクス上に積層された青色層
107……樹脂ブラックマトリクス上に積層された緑色層
108……樹脂ブラックマトリクス上に積層された赤色層
109……画素開口部
110……スペーサー
111……樹脂層
112……ストライプ端部[0001]
BACKGROUND OF THE INVENTION
The present invention relates to a measuring device for a substrate such as a transparent substrate for LCD and a color filter for measuring the surface shape such as each layer of the laminated film structure such as a color filter, a TFT array substrate, a semiconductor, or the total height, cross-sectional area, or position. Or it is related with the manufacturing method of a transparent electrode substrate.
[0002]
[Prior art]
Various methods are known as a method for forming a spacer on a color filter. For example, as described in JP-A-9-43425, there is a technique in which each colored layer is stacked on a BM to form a spacer. As a measuring technique of this spacer, a stylus type height meter is used for measuring the height of the spacer, and the area, length, position, number of spacers, pixel opening width, distance between pixel openings, stripe width The distance between the stripes was measured using an optical microscope. However, such measurement has the following problems.
[0003]
That is, for measuring the height of the spacer, a stylus type height meter was used, but in order to measure the height on a certain straight line, it is difficult to capture the spacer on the measurement line. The measurement was performed several times within a certain range while slightly moving the straight line to be measured. Moreover, the measured color filter had to be discarded for destructive measurement, and since the inspector read the height from the obtained chart, the reading error was large and the measurement time was long.
[0004]
In addition, with regard to the area and position of the spacer, the pixel opening width, the distance between the pixel openings, the stripe width, and the distance between the stripes, a measurer measures a magnified image with an optical microscope using a length measuring device. However, due to manual measurement, the reading error was large and the measurement time was long.
[0005]
[Problems to be solved by the invention]
An object of the present invention is to solve the above-described problems in the prior art, and to provide a substrate measuring apparatus and a color filter or a transparent electrode substrate manufacturing method that reduce measurement time and have high accuracy and reproducibility. And
[0006]
[Means for Solving the Problems]
In order to achieve the above object, a substrate measuring apparatus of the present invention has the following configuration.
That is, the convex portion of the substrate having a plurality of pre-designed convex portions.relativeMeasuring the board to measure the heightMethodBecauseIt is at least one substrate constituting a liquid crystal display element in which a liquid crystal composition is sandwiched between a pair of substrates opposed to each other, and the height measuring means is uniformly within a measurement region including one or more of the convex portions. A means for dividing the pixel and measuring the height of each divided pixel unit,
The relative height of the convex
(1) Set a height threshold from the height information obtained by the height measuring means,
(2) Measure the feature amount of a block of pixels having a height exceeding the threshold,
(3) Recognizing a lump whose feature amount falls within a preset range as a convex portion,
(4) Based on the position of the convex portion, set the window at a preset relative position and measure the average height in the window,
(5) Calculate by taking the difference between the height of the convex portion and the average height in the window,
This is a method for measuring a substrate.
[0007]
A method for producing a color filter or a transparent electrode substrate, comprising: a protrusion on the color filter or the transparent electrode substrate;PartOne or more protrusions of a plurality of substratesPartThe height is measured, and the quality of the color filter or the transparent electrode substrate is determined.
[0008]
DETAILED DESCRIPTION OF THE INVENTION
[Example 1]
Hereinafter, an example of measurement using height information in the present invention will be described with reference to the drawings.
[0009]
FIG. 1 is a top view of a color filter 1 which is a measurement target of the present invention. FIG. 2 is a sectional view of the color filter. Next, the height, cross-sectional area, position, pixel opening width, distance between pixel openings, stripe width, and distance between stripes will be described.
[0010]
The spacer height is the distance from the pixel opening 109 to the top of the
[0011]
The spacer cross-sectional area is the cross-sectional area of the colored layer (red layer) at AA ′ in FIG. 2.
[0012]
As the spacer position, the distance P1 from the
[0013]
The distances between the pixel openings are indicated by L1 and L5 in FIG. 1, the pixel opening width is indicated by L2 in FIG. 1, the stripe width is indicated by L3 in FIG. 1, and the distance between the stripes is indicated by L4 in FIG.
[0014]
FIG. 3 is a schematic diagram of the measuring apparatus according to the present invention, which includes a
[0015]
The
[0016]
The height measurement device 3 divides a certain range on the color filter into pixels and measures the height of each pixel. When the height measurement start signal is given from the control device 6, the height measurement starts. When the measurement is completed, a height measurement end signal is output to the control unit 6, and the height data is transferred to the
[0017]
The
[0018]
The control device 6 is for giving an operation command to the stage, the height measuring device, and the data processing device based on a determined procedure.
[0019]
The display device 7 is for displaying the height, cross-sectional area, length, position, and number of spacers measured by the data processing device.
[0020]
Next, the operation of the measuring apparatus of the present invention will be described using the flowchart of FIG.
[0021]
First, place the sample on the stage and press the measurement start button. (Step 1)
Samples can be installed manually or automatically using a robot arm.MokaIt does n’t turn. When the measurement start button is pressed, the control device 6 gives the stage 2 a movement amount set in advance so that the spacer to be measured is within the measurement range of the height measurement device and a movement start signal. At this time, if there is variation in the sample installation position, it is desirable to correct the movement amount of the stage by performing alignment and measuring the installation error. The
[0022]
The control device 6 to which the movement end signal is given gives a height measurement start signal to the height measuring device 3. The height measuring device 3 given the measurement start signal starts the height measurement, sends the height data to the
FIG. 4 shows the height data of the color filter measured by the height measuring device 3, where the high part is displayed with thin hatching as indicated by 108 and the low part is displayed with dark hatching as indicated by 102. 5 shows the height between XX 'in FIG. 4, and FIG. 6 shows the height between YY' in FIG. 4. The horizontal axis is the position, and the vertical axis is the height.
[0023]
The control device 6 given the height measurement end signal gives the data processing start signal to the
[0024]
First, the maximum value Hmax and the minimum value Hmin of the given height data are obtained, and the difference between Hmax and Hmin is set as a height range R and compared with a preset value H. If R ≧ H, the process is continued as it is, but if R <H, the process is terminated because there is no spacer in the screen or the height of the spacer is extremely low, and the display device 7 has a height range R. Is displayed (step 4). H is determined from the thickness of the colored layer of the color filter.
[0025]
Next, in order to cut out the spacer portion, binarization by height is performed. (Step 5). The binarization threshold value TH is set so that the spacer portion can be well cut out from Hmax and Hmin. In the binarization, the height of each pixel obtained by the height measuring device 3 is compared with the threshold value TH, and is set to 1 when it is high and 0 when it is low. A binarized image obtained by cutting out the spacer portion is shown in FIG. A white part is a spacer part higher than a threshold value.
[0026]
Next, feature quantities such as area, length, width, and barycentric position are measured for the white block in FIG. 8 (step 6). Those in which these feature amounts fall within a preset range are recognized as spacers. If none of the chunks whose feature amounts are within the set range are present, the processing is terminated as if there is no spacer, and that effect is displayed on the display device 7 (step 7).
[0027]
If there is one lump, the barycentric positions Xc and Yc are stored (step 8). When there are two lumps, it is assumed that there are a plurality of spacers on one screen, and step 8 to step 18 are repeated for each spacer.
[0028]
Next, windows W1 to W6 shown in FIG. 9 are set based on the position of the center of gravity (step 9). The relative positions of these window sizes and Xc and Yc are preset in accordance with the color filter to be measured. W1 is a window for measuring the height of the spacer portion and the film thickness of each layer. W2 is a window for measuring the height of the opening. W3 and W4 are windows for measuring the opening edge. W5 and W6 are windows for measuring the opening edge, the stripe edge, and the adjacent stripe edge.
[0029]
Next, the average height in the window W2 is obtained and set as the opening height WH (step 10).
[0030]
Next, a distribution map of height data is created for the window W1 (step 11). FIG. 10 is an enlarged view of the window W1 portion of FIG. FIG. 11 is a distribution diagram of height data, where the horizontal axis represents the height division value and the vertical axis represents the number of pixels. The height division value is the actual height converted to an integer. The peak of the 102 portion in FIG. 11 is the resin
[0031]
Next, the peak of the height distribution diagram of FIG. 11 is recognized, and the height of each colored layer is measured. (Step 12). Any method may be used for peak recognition.
[0032]
Next, the spacer height HS is obtained (step 13). The spacer height is an important factor for determining the cell gap after assembling the color filter into the cell. The spacer height may be the maximum value of W1 HT, but to improve the measurement accuracy, the height at which the spacer has a cross-sectional area is HT, eliminating the effects of spike noise in the height measuring device 3. Is desirable.
[0033]
Next, the film thickness of each layer is calculated from the obtained height of each layer (step 14).
[0034]
Next, the cross-sectional area of the spacer and the position of the spacer are measured (step 15). In the binarization performed in
[0035]
A feature value is measured for an image binarized with the threshold value THS, and a spacer cross-sectional area As, a spacer position X-axis maximum value Xmax, a minimum value Xmin, a Y-axis maximum value Ymax, and Ymin are obtained (step 16).
[0036]
Next, the edge position in the window is measured (step 17). The measurement of the opening edge will be described with respect to the W3 window. First, the height data is averaged in the window in the direction parallel to the edge to be measured, and noise is removed. FIG. 12 shows the average height data. FIG. 13 shows data obtained by further applying a moving average to this data to remove noise and applying differentiation. The peak position of the differential value in FIG. 13 is recognized as the edge position E3. Any method may be used for peak recognition. Similarly, the opening edge is measured for W4 to obtain E4.
[0037]
Next, the W5 window will be described for measuring the edge of the stripe portion. First, the height data is averaged in the window in the direction parallel to the edge to be measured, and noise is removed. FIG. 14 shows the average height data. FIG. 15 shows data obtained by further applying a moving average to this data to remove noise and performing differentiation. The peak position of the differential value in FIG. 15 is recognized as an edge. Peak ○ 1 is the opening edge, peak ○ 2 is the stripe edge, peak ○ 3 is the adjacent stripe edge, and peak ○ 4 is the opening edge of the adjacent pixel. The peak recognition is performed in the same manner as in the window W3, and the opening edge E5a, the stripe edge position E5b, the adjacent stripe edge position E5c, and the opening edge position E5d of the adjacent pixel are measured.
[0038]
Similarly, for W6, the opening edge E6d, the stripe edge position E6c, the adjacent stripe edge position E6b, and the opening edge position E6a of the adjacent pixel were measured. It is also possible to set a window other than W1 to W6, measure the edge, and measure other items.
[0039]
Next, from the spacer position and the edge position, the distance P1 from the stripe edge, the distances P2, P3 from the window opening edge, the distance L1 between the pixel openings, the pixel opening width L2, the stripe width L3, and between the stripes Distances L4 and L5 are obtained (step 18).
[0040]
Finally, the measurement result is displayed on the display device 7. (Step 19)
Hereinafter, an example of an actual measurement result will be described. The measurement was performed on a plurality of samples in the color filter shown in FIG. 1 in which the etching time at the time of manufacture and the level of the color layer thickness were changed. The measurement of the spacer near the center of the sample at a certain level will be described below.
[0041]
First, when a sample is manually placed on the
[0042]
Next, the height measuring device 3 starts height measurement and sends the height data to the
[0043]
Hmax = 8.90 [μm]
Hmin = 1.00 [μm]
R = 7.90 [μm]
Next, in order to cut out the spacer portion, binarization by height was performed. When the threshold value TH for binarization was determined by the following [Formula 1], TH = 7.32.
[Formula 1]
TH = Hmin + 0.8 x R
When features such as area, length, width, and barycentric position were measured for a white block in the binarized image, there was one block that was within the preset area, length, and width. Therefore, this was recognized as a spacer, and the gravity center positions Xc and Yc were stored.
[0044]
Next, windows of W1 to W6 were set based on the center of gravity positions Xc and Yc.
[0045]
Next, when the average height in the window W2 was determined, the opening height WH was as follows.
[0046]
WH = 2.50 [μm]
Next, a distribution map of height data was created for the window W1. In this example, the division number DIV was obtained from the following [Equation 2] with the step interval Hdiv of the distribution being Hdiv = 0.02 [μm], and DIV = 395 was obtained.
[Formula 2]
DIV = (Hmax−Hmin) / Hdiv (DIV is an integer)
Distribution of height data The height division value D on the horizontal axis and the actual height H have the following [Equation 3] relationship.
[Formula 3]
H = Hmin + Hdiv ・ D
Next, the peak position of the height distribution map was recognized. For the recognition of the peak position, first, the height division value in which the number of pixels is the maximum in the range from the minimum height value to the BM film thickness design value is recognized as the division value HDBM of the BM height, Find the height HBM. Similarly, based on this BM height, the blue layer height HB is obtained from the height division value that maximizes the number of pixels in the range of 60% to 140% of the blue layer thickness design value. Next, the green layer height HG is determined from the height division value that maximizes the number of pixels in the range of 60% to 140% of the green layer thickness design value based on the blue layer height. Next, the red layer height HB is obtained from the height division value that maximizes the number of pixels in the range of 60% to 140% of the red layer film thickness design value based on the green layer height. Although the peak recognition method as described above is used this time, the peak may be recognized using differentiation or the like. Each peak position and colored layer height were as follows.
[0047]
HDBM = 15
HDB = 140
HDG = 265
HBM = 1.30 [μm]
HB = 3.80 [μm]
HG = 6.30 [μm]
Next, the height HT at the top of the spacer is obtained (step 13). In order to eliminate the influence of spike noise and the like in the height measuring device 3 and improve the measurement accuracy, a division value HDT that obtains a certain sectional area S is obtained. The spacer cross-sectional area S at a certain division value HDT in the height distribution diagram is expressed by the following [Formula 4].
[Formula 4]
DIV
S = Σf (x) × P2
x = HD T
x: Height division value
f (x): number of pixels at the height division value x
DIV: Number of divisions in the height distribution map
P: width of 1 pixel [μm]
Therefore, by obtaining a division value HDT satisfying the following [Equation 5], a division value that becomes the cross-sectional area A of the spacer is obtained.
[Formula 5]
DIV DIV
Σf (x) ≦ A / P <Σf (x)
x = HD T +1 x = HD T
In this example, when A = 2.00, HD T = 345 was obtained. By substituting this height division value HDT for [Equation 3], the height HT of the top of the spacer is as follows.
[0048]
HT = 7.90 [μm]
Accordingly, the spacer height HS is as follows.
[0049]
HS = HT -HW
= 6.30 [μm]
Next, the film thickness of each layer is calculated from the obtained height of each layer. BM film thickness TBM, blue layer film thickness TB, green layer film thickness TG, and red layer film thickness TR are calculated from [Formula 6] [Formula 7] [Formula 8] [Formula 9].
[Formula 6]
TBM = HB-HW
[Formula 7]
TB = HB-HBM
[Formula 8]
TG = HG-HB
[Formula 9]
TR = HT -HG
The film thickness of each layer obtained was as follows.
[0050]
TBM = 1.30 [μm]
TB = 2.50 [μm]
TG = 2.50 [μm]
TR = 2.50 [μm]
Next, the cross-sectional area of the spacer and the position of the spacer were measured. In this example, since the area of the column cross-section at the center of the red layer was the spacer cross-sectional area, the binarization threshold value THS was obtained by [Equation 10]. As a result, THS = 7.55 was obtained.
[Formula 10]
THS = (HT + HG) / 2
The characteristic values of the image binarized with the threshold THS were measured, and the spacer cross-sectional area As, spacer position X-axis maximum value Xmax, minimum value Xmin, Y-axis maximum value Ymax, Ymin were obtained. became.
[0051]
As = 140 [μm 2]
Xmax = 125
Xmin = 200
Ymax = 230
Ymin = 270
Next, when the edge positions of the windows W3, W4, W5 and W6 were measured, the edge positions were as follows.
[0052]
E3 = 200.0
E4 = 300.0
E5a = 50.0
E5b = 57.5
E5c = 67.5
E5d = 75.0
E6a = 250.0
E6b = 257.5
E6c = 267.5
E6d = 275.0
Next, from the spacer position and the edge position, the distance P1 from the stripe end is expressed by [Expression 11], and the distances P2 and P3 from the window opening end are expressed by [Expression 12] and [Expression 13]. The distance L1 is expressed by [Expression 14], the pixel opening width L2 is expressed by [Expression 13], the stripe width L3 is determined by [Expression 16], and the distances L4 and L5 between the stripes are expressed by [Expression 17] and [Expression 18]. Asked.
[Formula 11]
P1 = (Xmin-E5b) x P
[Formula 12]
P2 = (Ymin-E3) x P
[Formula 13]
P3 = (E4-Ymax) x P
[Formula 14]
L1 = (E4-E3) x P
[Formula 15]
L2 = (E6a-E5d) x P
[Formula 16]
L3 = (E6b-E5c) x P
[Formula 17]
L4 = (E5c-E5b) x P
[Formula 18]
L5 = (E5d-E5a) x P
The calculation results are as follows.
[0053]
P1 = 27.0 [μm]
P2 = 12.0 [μm]
P3 = 12.0 [μm]
L1 = 40.0 [μm]
L2 = 70.0 [μm]
L3 = 76.0 [μm]
L4 = 4.0 [μm]
L5 = 10.0 [μm]
The same measurement was performed for spacers on other colored layers and other levels of samples. There was a high correlation between the obtained measurement result and the result obtained by the conventional method. In addition, the repeatability when the same sample was repeatedly measured was improved over the conventional method for all measurement items. The measurement time was greatly reduced.
[0054]
In this embodiment, as a height measuring device, a device that divides a certain range into pixels and measures the height of each pixel is used. However, by measuring the height of a certain straight line or a certain point, The presence or absence of protrusions may be determined.
[0055]
In this example, the measurement was performed for the color filter shown in FIG. 2, but the measurement can also be made for the color filter shown in FIG. FIG. 16 shows a color filter in which a
[0056]
Moreover, when this measuring apparatus was used in the manufacturing process, effects such as process stabilization and prevention of outflow of defective products could be achieved. Regarding the stabilization of the process, the film thickness and the development state of each colored layer can be known by measuring the spacer of the final product. By feeding back this, the fluctuation of the process state could be managed within the range without problems. Although the measurement results were always monitored this time, it is also possible to alert a worker of a process abnormality by raising an alarm when a certain number of defective products are found. In addition, all substrates were measured to determine whether they were good or bad, and defective products were extracted to prevent outflow of defective products.
[Example 2]
Hereinafter, an example of measurement using luminance information in the present invention will be described with reference to the drawings.
[0057]
Since the measurement target is the same as in Example 1, the description thereof is omitted.
[0058]
FIG. 17 is a schematic diagram of a measuring apparatus according to the present invention, which includes a
[0059]
The
[0060]
The illumination device 8 irradiates the measurement target with light. Although coaxial epi-illumination was used this time, dark field illumination may be used. Further, transmitted illumination may be used in combination.
[0061]
The imaging device 4 divides a certain range on the color filter into pixels and measures the luminance for each pixel. When a luminance measurement start signal is given from the control device 6, the imaging device 4 starts the luminance measurement and ends the measurement. Then, a luminance measurement end signal is output to the control unit 6 and the luminance data is transferred to the
[0062]
The
[0063]
The control device 6 is for giving an operation command to the stage, the luminance measuring device, and the data processing device based on a determined procedure.
[0064]
The display device 7 is for displaying the cross-sectional area, length, position, and number of spacers measured by the data processing device.
[0065]
Next, the operation of the measuring apparatus of the present invention will be described using the flowchart of FIG.
[0066]
First, place the sample on the stage and press the measurement start button. (Step 1)
The sample may be set manually or automatically by a robot arm or the like. When the measurement start button is pressed, the control device 6 gives to the stage 2 a movement amount set in advance so that the spacer to be measured is within the measurement range of the imaging device and a movement start signal. At this time, if there is variation in the sample installation position, it is desirable to correct the movement amount of the stage by performing alignment and measuring the installation error. The
[0067]
The control device 6 to which the movement end signal is given gives a luminance measurement start signal to the imaging device 4. The imaging device 4 given the measurement start signal starts luminance measurement, sends luminance data to the
[0068]
The control device 6 given the luminance measurement end signal gives a data processing start signal to the
[0069]
First, as shown in FIG. 22, the brightness data of the spacer portion set in advance is used as a master pattern, pattern matching is performed on the brightness data of FIG. 18, and the approximate position and number of spacers are measured. If the number of spacers is one or more, the process is continued as it is. However, if there is no spacer, the process is terminated with no spacer in the screen or the shape of the spacer is extremely different. Display (step 4).
[0070]
If there is one spacer, the master pattern center positions Xc and Yc are stored (step 5). If there are two spacers, repeat step 6 to step 11 for each spacer.
[0071]
Next, windows W1 to W6 shown in FIG. 23 are set with reference to the center position (step 6). The relative positions of these window sizes and Xc and Yc are preset in accordance with the color filter to be measured. W1 is a window for measuring the length of the spacer. W2 is a window for measuring the width of the spacer. W3 and W4 are windows for measuring the opening edge. W5 and W6 are windows for measuring the opening edge, the stripe edge, and the adjacent stripe edge.
[0072]
Next, it is determined from the number of edges in the windows W1 and W2 whether the colored layer is laminated as designed (step 7). Regarding the edge measurement, the W1 window will be described. First, the luminance data is averaged in the window in the direction parallel to the edge to be measured, and noise is removed. FIG. 24 shows averaged luminance data.
[0073]
24, a and d are the edges of the
[0074]
Next, the length, width, cross-sectional area and position of the spacer are measured from the edge positions in the windows W1 and W2 (step 8).
[0075]
Next, the edge measurement of the stripe part is performed (step 9). The edge positions of the windows W3 to W6 are recognized in the same manner as in step 7.
[0076]
Next, from the spacer position and the edge position, the distance P1 from the stripe edge, the distances P2, P3 from the window opening edge, the distance L1 between the pixel openings, the pixel opening width L2, the stripe width L3, and between the stripes Distances L4 and L5 are obtained (step 10).
[0077]
Finally, the measurement result is displayed on the display device 7. (Step 11)
Hereinafter, an example of an actual measurement result will be described. The measurement was performed on a plurality of samples in the color filter shown in FIG. 1 in which the etching time at the time of manufacture and the level of the color layer thickness were changed. The measurement of the spacer near the center of the sample at a certain level will be described below.
[0078]
First, when a sample is manually placed on the
[0079]
Next, the imaging device 4 starts luminance measurement and sends luminance data to the
[0080]
Next, when the number of spacers was measured by applying pattern matching, the number of spacers was two. First, the measurement for one of these will be described.
[0081]
The center coordinates Xc and Yc of this spacer are as follows.
[0082]
Xc = 160
Yc = 250
When the window positions W1 to W6 were set based on the center coordinates and the edge positions were measured, the edge positions were as follows.
[0083]
E1a = 115.0
E1b = 125.0
E1c = 200.0
E1d = 210.0
E2a = 220.0
E2b = 230.0
E2c = 270.0
E2d = 280.0
E3 = 200.0
E4 = 300.0
E5a = 50.0
E5b = 57.5
E5c = 67.5
E5d = 75.0
E6a = 250.0
E6b = 257.5
E6c = 267.5
E6d = 275.0
Next, from the spacer position and edge position, the distance P1 from the stripe end is [Expression 11], and the distances P2 and P3 from the window opening end are [Expression 12] and [Expression 13]. K1, width K2, cross-sectional area A is expressed by [Expression 14], [Expression 15], and [Expression 16], the distance L1 between pixel openings is expressed by [Expression 17], and the pixel opening width L2 is expressed by [Expression 18]. The stripe width L3 was obtained by [Equation 19], and the distances L4 and L5 between the stripes were obtained by [Equation 20] and [Equation 21], respectively.
[Formula 11]
P1 = (E1b-E5b) x P
[Formula 12]
P2 = (E2b-E3) x P
[Formula 13]
P3 = (E4-E2c) x P
[Formula 14]
K1 = (E1c-E1b) x P
[Formula 15]
K2 = (E2c-E2b) x P
[Formula 16]
A = (K1-K2) x K2 + 0.785 x
[Formula 17]
L1 = (E4-E3) x P
[Formula 18]
L2 = (E6a-E5d) x P
[Formula 19]
L3 = (E6b-E5c) x P
[Formula 20]
L4 = (E5c-E5b) x P
[Formula 21]
L5 = (E5d-E5a) x P
The calculation results are as follows.
[0084]
P1 = 27.0 [μm]
P2 = 12.0 [μm]
P3 = 12.0 [μm]
K1 = 30.0 [μm]
K2 = 16.0 [μm]
A = 425.0 [μm 2]
L1 = 40.0 [μm]
L2 = 70.0 [μm]
L3 = 76.0 [μm]
L4 = 4.0 [μm]
L5 = 10.0 [μm]
The same measurement was performed for spacers on other colored layers and other levels of samples. There was a high correlation between the obtained measurement result and the result obtained by the conventional method. In addition, the repeatability when the same sample was repeatedly measured was improved over the conventional method for all measurement items. The measurement time was greatly reduced.
[0085]
In this embodiment, pattern matching is used for spacer recognition. However, only the spacer portion may be emphasized and recognized using a frequency filter or the like.
[0086]
In this example, the measurement was performed for the color filter shown in FIG. 2, but the measurement can also be made for a color filter in which spacers are provided using resin layers in addition to the three colored layers as shown in FIG.
[0087]
Moreover, when this measuring apparatus was used in the manufacturing process, effects such as process stabilization and prevention of outflow of defective products could be achieved. Regarding the stabilization of the process, the film thickness and the development state of each colored layer can be known by measuring the spacer of the final product. By feeding back this, the fluctuation of the process state could be managed within the range without problems. Although the measurement results were always monitored this time, it is also possible to alert a worker of a process abnormality by raising an alarm when a certain number of defective products are found. In addition, the measurement of all the substrates was performed to judge whether the product was good or bad, and the defective product was extracted to prevent outflow of the defective product.
[0088]
【The invention's effect]
BookAccording to the measuring apparatus of the invention, an excellent effect is obtained that determination with good accuracy and reproducibility is possible in a short time..
[Brief Description of Drawings]
FIG. 1 is a top view of a color filter that is a measurement target of the present invention.
FIG. 2 is a cross-sectional view of a color filter that is a measurement target of the present invention.
FIG. 3 is an overall schematic diagram of a measuring apparatus which is an example of the present invention.
FIG. 4 is a diagram obtained by converting a height measurement result into light and shade.
FIG. 5 is a diagram showing height data of XX ′ in FIG. 4;
6 is a diagram showing height data of YY ′ in FIG. 4; FIG.
FIG. 7 is a diagram showing an example of a measurement procedure according to the present invention.
FIG. 8 is a diagram when the height measurement result is binarized at a certain height.
FIG. 9 is a diagram illustrating a positional relationship of windows.
FIG. 10 is an enlarged view of a window W1.
FIG. 11 is a distribution diagram of height data in a window W1.
FIG. 12 is a diagram showing height data of a window W3.
FIG. 13 is a diagram showing a differential value of height data in a window W3.
FIG. 14 is a diagram showing height data in a window W5.
FIG. 15 is a diagram showing a differential value of height data in a window W5.
FIG. 16 is an example of a cross-sectional view of a color filter that can be measured by the present invention.
FIG. 17 is an overall schematic diagram of a measuring apparatus which is an example of the present invention.
FIG. 18 is a diagram in which luminance measurement results are converted into shades.
19 is a diagram showing luminance data of XX ′ in FIG.
FIG. 20 is a diagram showing luminance data of YY ′ in FIG. 18;
FIG. 21 is a diagram showing an example of a measurement procedure according to the present invention.
FIG. 22 is a diagram showing a master pattern used in pattern matching.
FIG. 23 is a diagram illustrating a positional relationship of windows.
FIG. 24 is a diagram showing luminance data of a window W1.
FIG. 25 is a diagram showing a differential value of luminance data in a window W1.
[Explanation of symbols]
1. Color filter
2 …… Stage
3 ... Height measuring device
4. Imaging device
5. Data processing device
6. Control device
7 …… Display device
8 …… Lighting device
101 …… Transparent substrate (glass substrate)
102 …… Resin black matrix
103 …… Colored layer (blue layer)
104 …… Colored layer (green layer)
105 …… Colored layer (red layer)
106 …… Blue layer laminated on resin black matrix
107 …… Green layer laminated on resin black matrix
108 …… Red layer laminated on resin black matrix
109 …… Pixel opening
110 …… Spacer
111 …… Resin layer
112 …… Stripe edge
Claims (4)
Translated fromJapanese凸部の相対高さを、
(1)高さ測定手段で得られた高さ情報から高さのしきい値を設定し、
(2)しきい値を超える高さを持つ画素の塊の特徴量を測定し、
(3)特徴量が予め設定している範囲に入っている塊を凸部として認識し、
(4)凸部の位置を基準に、予め設定された相対位置にウインドウを設定してウィンドウ内の平均高さを測定し、
(5)凸部の高さと前記ウインドウ内の平均高さとの差をとることにより算出する、
ことを特徴とする基板の測定方法。A substrate measuring method for measuring a relative height of a convex portion of a substrate having a plurality of pre-designed convex portions, wherein a liquid crystal display element is formed by sandwiching a liquid crystal composition between a pair of substrates opposed to each other. It is at least one of the substrates to be configured, and the height measuring means divides the inside of the measurement region including one or more of the convex portions equally, and measures the height for each divided pixel unit,
The relative height of the convex
(1) Set a height threshold from the height information obtained by the height measuring means,
(2) Measure the feature amount of a block of pixels having a height exceeding the threshold,
(3) Recognizing a lump whose feature amount falls within a preset range as a convex portion,
(4) Based on the position of the convex portion, set the window at a preset relative position and measure the average height in the window,
(5) Calculate by taking the difference between the height of the convex portion and the average height in the window,
A method for measuring a substrate, comprising:
(1)前記高さ測定方法で得られた高さ情報の分布図から高さのしきい値を設定し、
(2)前記しきい値を越える高さを持つ画素から突起状物の位置を測定し、
(3)窓部の位置を測定し、突起状物の窓部からの相対的な位置を測定する、
ことを特徴とする基板の測定方法。In the measuring method of the substrate according to claim 1, the position of the convex part is as follows.
(1) Set a threshold of height from the distribution map of height information obtained by the height measurement method,
(2) measuring the position of the protrusion from a pixel having a height exceeding the threshold,
(3) Measure the position of the window, and measure the relative position of the protrusion from the window.
Measurement method of a substrate, characterized inthat.
Priority Applications (1)
| Application Number | Priority Date | Filing Date | Title |
|---|---|---|---|
| JP02312998AJP3820728B2 (en) | 1998-02-04 | 1998-02-04 | Substrate measuring device |
Applications Claiming Priority (1)
| Application Number | Priority Date | Filing Date | Title |
|---|---|---|---|
| JP02312998AJP3820728B2 (en) | 1998-02-04 | 1998-02-04 | Substrate measuring device |
Publications (3)
| Publication Number | Publication Date |
|---|---|
| JPH11218466A JPH11218466A (en) | 1999-08-10 |
| JPH11218466A5 JPH11218466A5 (en) | 2005-02-10 |
| JP3820728B2true JP3820728B2 (en) | 2006-09-13 |
Family
ID=12101924
Family Applications (1)
| Application Number | Title | Priority Date | Filing Date |
|---|---|---|---|
| JP02312998AExpired - LifetimeJP3820728B2 (en) | 1998-02-04 | 1998-02-04 | Substrate measuring device |
Country Status (1)
| Country | Link |
|---|---|
| JP (1) | JP3820728B2 (en) |
Families Citing this family (15)
| Publication number | Priority date | Publication date | Assignee | Title |
|---|---|---|---|---|
| US6684097B1 (en) | 1999-04-22 | 2004-01-27 | University Of Miami | Intraoperative monitoring of temperature-induced tissue changes with a high-resolution digital x-ray system during thermotherapy |
| KR101547077B1 (en) | 2003-04-09 | 2015-08-25 | 가부시키가이샤 니콘 | Exposure method and apparatus, and device manufacturing method |
| TWI573175B (en) | 2003-10-28 | 2017-03-01 | 尼康股份有限公司 | Optical illumination device, exposure device, exposure method and device manufacturing method |
| TWI385414B (en) | 2003-11-20 | 2013-02-11 | 尼康股份有限公司 | Optical illuminating apparatus, illuminating method, exposure apparatus, exposure method and device fabricating method |
| TWI389174B (en) | 2004-02-06 | 2013-03-11 | 尼康股份有限公司 | Polarization changing device, optical illumination apparatus, light-exposure apparatus and light-exposure method |
| JP2006105702A (en)* | 2004-10-01 | 2006-04-20 | Keyence Corp | Optical displacement gauge, method for measuring application cross-sectional area of viscous liquid using this gauge, program of measuring optical displacement gauge and recording medium readable by computer |
| JP4696574B2 (en)* | 2005-02-02 | 2011-06-08 | 株式会社ニコン | Semiconductor inspection equipment |
| KR20180128526A (en) | 2005-05-12 | 2018-12-03 | 가부시키가이샤 니콘 | Projection optical system, exposure apparatus and device manufacturing method |
| JP4123271B2 (en) | 2005-11-28 | 2008-07-23 | 船井電機株式会社 | LCD module brightness measuring device |
| JP5040227B2 (en)* | 2006-09-11 | 2012-10-03 | 大日本印刷株式会社 | Color filter inspection apparatus and color filter inspection method |
| KR101530734B1 (en) | 2007-10-05 | 2015-06-22 | 가부시키가이샤 니콘 | Display device defect detecting method and display device defect detecting device |
| JP5267029B2 (en) | 2007-10-12 | 2013-08-21 | 株式会社ニコン | Illumination optical apparatus, exposure apparatus, and device manufacturing method |
| US8379187B2 (en) | 2007-10-24 | 2013-02-19 | Nikon Corporation | Optical unit, illumination optical apparatus, exposure apparatus, and device manufacturing method |
| US9116346B2 (en) | 2007-11-06 | 2015-08-25 | Nikon Corporation | Illumination apparatus, illumination method, exposure apparatus, and device manufacturing method |
| JP7602713B2 (en)* | 2021-03-02 | 2024-12-19 | 株式会社東京精密 | Particle measurement device, three-dimensional shape measuring device, prober device, particle measurement system, and particle measurement method |
- 1998
- 1998-02-04JPJP02312998Apatent/JP3820728B2/ennot_activeExpired - Lifetime
Also Published As
| Publication number | Publication date |
|---|---|
| JPH11218466A (en) | 1999-08-10 |
Similar Documents
| Publication | Publication Date | Title |
|---|---|---|
| JP3820728B2 (en) | Substrate measuring device | |
| JP3343444B2 (en) | LCD panel image quality inspection apparatus and LCD image presampling method | |
| US10274762B2 (en) | Display substrate motherboard, manufacturing and detecting methods thereof and display panel motherboard | |
| KR100397080B1 (en) | Flat Display Inspection System | |
| CN114453280B (en) | Display panel defect detection method | |
| CN114152413A (en) | Method and device for testing dynamic speckles in laser display | |
| JPH11218466A5 (en) | ||
| JP4288901B2 (en) | Height measurement method | |
| CN102116978A (en) | TFT-LCD array substrate, and method and equipment for detecting size of multi-layer pattern | |
| CN215931247U (en) | Optical measurement equipment | |
| KR100507887B1 (en) | Inspection apparatus and method for an illuminating optical element | |
| CN113624457B (en) | Thin film uniformity detection system based on optical diffraction | |
| JP3943819B2 (en) | Thin film thickness measuring method and apparatus using the same | |
| KR20090094529A (en) | Uneri Detecting Device using Standard Cell and the Detecting Method | |
| CN106707392A (en) | Color filter and film thickness measurement method | |
| JP2000039599A (en) | Inspection method and apparatus for liquid crystal display substrate and liquid crystal display substrate | |
| US11164498B1 (en) | Display panel and test method thereof | |
| TWI424394B (en) | A display device and method of sufacial structure measurement thereof | |
| JP3062711B2 (en) | How to measure the brightness of the LCD panel | |
| CN101900909B (en) | Display device and method for measuring surface structure thereof | |
| JP3229823B2 (en) | Liquid crystal display device and manufacturing method thereof | |
| JP4720287B2 (en) | Coating unevenness inspection method and program thereof | |
| JP2010008066A (en) | Va (vertical alignment) pattern deficiency inspection method and inspection device | |
| CN205374928U (en) | Display substrates mother board and contain display panel mother board of this display substrates mother board | |
| CN109827759A (en) | Defect detection method and detection device applied to optical module |
Legal Events
| Date | Code | Title | Description |
|---|---|---|---|
| A521 | Written amendment | Free format text:JAPANESE INTERMEDIATE CODE: A523 Effective date:20040308 | |
| A621 | Written request for application examination | Free format text:JAPANESE INTERMEDIATE CODE: A621 Effective date:20040308 | |
| A977 | Report on retrieval | Free format text:JAPANESE INTERMEDIATE CODE: A971007 Effective date:20051118 | |
| A131 | Notification of reasons for refusal | Free format text:JAPANESE INTERMEDIATE CODE: A131 Effective date:20051129 | |
| A521 | Written amendment | Free format text:JAPANESE INTERMEDIATE CODE: A523 Effective date:20060130 | |
| A131 | Notification of reasons for refusal | Free format text:JAPANESE INTERMEDIATE CODE: A131 Effective date:20060228 | |
| A521 | Written amendment | Free format text:JAPANESE INTERMEDIATE CODE: A523 Effective date:20060427 | |
| TRDD | Decision of grant or rejection written | ||
| A01 | Written decision to grant a patent or to grant a registration (utility model) | Free format text:JAPANESE INTERMEDIATE CODE: A01 Effective date:20060530 | |
| A61 | First payment of annual fees (during grant procedure) | Free format text:JAPANESE INTERMEDIATE CODE: A61 Effective date:20060612 | |
| FPAY | Renewal fee payment (event date is renewal date of database) | Free format text:PAYMENT UNTIL: 20090630 Year of fee payment:3 | |
| FPAY | Renewal fee payment (event date is renewal date of database) | Free format text:PAYMENT UNTIL: 20100630 Year of fee payment:4 | |
| FPAY | Renewal fee payment (event date is renewal date of database) | Free format text:PAYMENT UNTIL: 20110630 Year of fee payment:5 | |
| FPAY | Renewal fee payment (event date is renewal date of database) | Free format text:PAYMENT UNTIL: 20110630 Year of fee payment:5 | |
| FPAY | Renewal fee payment (event date is renewal date of database) | Free format text:PAYMENT UNTIL: 20120630 Year of fee payment:6 | |
| FPAY | Renewal fee payment (event date is renewal date of database) | Free format text:PAYMENT UNTIL: 20130630 Year of fee payment:7 | |
| FPAY | Renewal fee payment (event date is renewal date of database) | Free format text:PAYMENT UNTIL: 20130630 Year of fee payment:7 | |
| FPAY | Renewal fee payment (event date is renewal date of database) | Free format text:PAYMENT UNTIL: 20140630 Year of fee payment:8 | |
| EXPY | Cancellation because of completion of term |