JP3776843B2 - Data analysis method and apparatus - Google Patents
Data analysis method and apparatusDownload PDFInfo
- Publication number
- JP3776843B2 JP3776843B2JP2002190201AJP2002190201AJP3776843B2JP 3776843 B2JP3776843 B2JP 3776843B2JP 2002190201 AJP2002190201 AJP 2002190201AJP 2002190201 AJP2002190201 AJP 2002190201AJP 3776843 B2JP3776843 B2JP 3776843B2
- Authority
- JP
- Japan
- Prior art keywords
- data
- array
- cell
- spreadsheet
- display
- Prior art date
- Legal status (The legal status is an assumption and is not a legal conclusion. Google has not performed a legal analysis and makes no representation as to the accuracy of the status listed.)
- Expired - Fee Related
Links
Images


Classifications
- G—PHYSICS
- G06—COMPUTING OR CALCULATING; COUNTING
- G06F—ELECTRIC DIGITAL DATA PROCESSING
- G06F40/00—Handling natural language data
- G06F40/10—Text processing
- G06F40/166—Editing, e.g. inserting or deleting
- G06F40/177—Editing, e.g. inserting or deleting of tables; using ruled lines
- G06F40/18—Editing, e.g. inserting or deleting of tables; using ruled lines of spreadsheets
Landscapes
- Engineering & Computer Science (AREA)
- Theoretical Computer Science (AREA)
- Audiology, Speech & Language Pathology (AREA)
- Health & Medical Sciences (AREA)
- Computational Linguistics (AREA)
- General Health & Medical Sciences (AREA)
- Physics & Mathematics (AREA)
- General Engineering & Computer Science (AREA)
- General Physics & Mathematics (AREA)
- Artificial Intelligence (AREA)
- User Interface Of Digital Computer (AREA)
- Tests Of Electronic Circuits (AREA)
- Management, Administration, Business Operations System, And Electronic Commerce (AREA)
Description
Translated fromJapanese【0001】
【産業上の利用分野】
本発明は、半導体試験におけるデータ解析に関し、特に、測定器から配列の組み合わせとして取得した測定結果と、測定器からスカラー表現データとして取得した測定結果とを組み合わせて解析する技術に関する。
【0002】
【従来の技術】
ウエハ上のダイあるいはパッケージされたIC(集積回路)(以降被測定素子(DUT)と呼ぶ)、の測定を行う場合には、様々なパラメータを設定してデータが収集される。例えば、特開平11−163063号公報に示される半導体測定システムでは、様々なパラメータをテストスペック7dに与えて、大量の測定データを取得し、評価することが記載されている。このような測定は、例えば、アジレント・テクノロジー社製Agilent 4072半導体パラメータテスターと同社製Semiconductor Process Evaluation Core Software (SPECS) テストシェルソフトウエアとの組み合わせ、あるいは同社製Agilent 4155半導体パラメータアナライザなどを使って行うことができる。
【0003】
これらの測定装置を用いて、各DUTに対し、所定の条件での電圧−電流特性(I−V特性)を測定をする場合、得られるデータは、各DUT毎に1つまたは複数の条件における電圧値対電流値を表す配列の複数の組み合わせとして取得され、ユーザ所望の形式でファイルに格納される。ファイルに格納されたデータは、専用のデータ解析プログラムあるいはマイクロソフト社製Excel(登録商標)などの汎用スプレッドシートプログラムによって演算処理される。その結果、それぞれの配列データからVTHなどの特徴値が抽出されていた。
【0004】
ところで、専用のデータ解析プログラムでこれらの演算処理をする場合、複数の配列データを取り扱って複雑な演算を行うが、演算対象のデータの大きさに合わせてプログラムを常に修正しなければならなかった。あるいは、このような修正をしないで済むように、配列の大きさやその組み合わせの数に左右されないように柔軟に取り扱うことのできる専用のデータ解析プログラムを用意すると、プログラムのコストが高くなるという欠点があった。また、解析の際に特徴値を抽出するアルゴリズムを修正する必要が後ででできたときには、再コンパイルが必要となり、柔軟に修正できなかった。
【0005】
他方、汎用スプレッドシートプログラムで演算処理をする場合は、上述のI−V特性のような複数の配列データからの特徴値抽出を、個別のスプレッドシート毎に行う。さらに、抽出された特徴値は、他の測定項目の結果と共にDUT毎に表示された2次元の表、すなわちメインのスプレッドシートに挿入されて評価される。しかし、上述の個別のスプレッドシート毎に得られた特徴値を、メインのスプレッドシートのセルに挿入するのは手作業となり、手間と時間のかかる作業となる。さらに、メインのスプレッドシートと特徴値抽出用の各スプレッドシートとの間のデバッグは、十分な知識がないと容易ではない。また、従来の汎用スプレッドシートプログラムでは、配列を一旦別のスプレッドシートに展開して取り込むことなく、容易に配列を表示あるいは演算する機能はなかった。
【0006】
【発明が解決しようとする課題】
本発明の目的は、上記の従来技術の問題点を解決し、データ解析において、測定項目として単一の測定値で表現される項目(スカラー表現データ)と、測定項目として測定値の配列で表現される項目(配列表現データ)を、統合して取り扱い、表現及び処理できるデータ解析環境を提供することである。
【0007】
本発明の別の目的は、測定項目として測定値の配列で表現される項目からの特徴値の抽出及び表示及び検証及び評価及びを、測定項目として単一の測定値で表現される項目が表現されるスプレッドシート上で行うことができるデータ解析環境を提供することである。
【0008】
本発明のさらに別の目的は、配列データを一旦スプレッドシートの別の部分に展開して取り込むことなく、容易に取り扱える機構を上記のデータ解析環境において提供することである。
【0009】
【課題を解決するための手段】
本発明では、データ解析において、測定項目として単一の測定値で表現される項目(スカラー表現データ)と、測定項目として測定値の配列で表現される項目(配列表現データ)を、統合して取り扱い、表現及び処理できる解析方法を提供する。
具体的には、スプレッドシートにおいて、第1のセルに配列表現データの定義を割り当てるステップと、前記第1のセルに配列表示ボタンを表示するステップと、前記配列表示ボタンが選択された場合には、配列データ表示手段により、前記配列表現データをグラフまたは表として表示するステップとを含むスプレッドシートにおけるデータ解析方法を提供する。
ここで、第2のセルに、前記第1のセルに割り当てられた配列表現データを対象とする特徴値抽出関数を含む式を割り当てるステップと、前記第2のセルに前記特徴値抽出関数を含む式の演算結果を表示または割り当てるステップとを含んでいる態様も含む。
【0010】
さらに本発明の別の実施態様では、スプレッドシート上の第1のセルに配列表現データの定義を割り当てるスプレッドシート定義手段と、前記第1のセルに配列表示ボタンを表示し、該配列表示ボタンが選択された場合には、前記配列表現データを表あるいはグラフとして表示する配列データ表示手段とを有するデータ解析装置も提供される。
ここで、前記スプレッドシート定義手段は、前記スプレッドシート上の第2のセルに、前記第1のセルに割り当てられた配列表現データを対象とする特徴値抽出関数を含む式を割り当てる機能を有し、前記データ解析装置は、前記第2のセルに前記特徴値抽出関数を含む式の演算をする配列データ演算手段をさらに備え、前記配列データ表示手段は、前記第2のセルに割り当てられた式の演算結果が配列表現データの場合には、新たな配列表示ボタンを表示し、該演算結果がスカラー表現データなら、数値を表示する機能を有することを特徴とする態様も含む。
【0011】
本発明のさらに別の実施態様では、スプレッドシート上の第1のセルにデータを表示する際に、前記第1のセルに割り当てられたデータがスカラー表現データの場合には数値を表示し、前記第1のセルに割り当てられたデータが配列表現データの場合には配列表示ボタンを表示するデータ解析方法が提供される。
ここで、前記スカラー表現データには、測定項目として単一の測定値で表現される項目のデータを含み、前記配列表現データには、測定項目として測定値の一つまたは複数の配列で表現される項目のデータを含んでいる態様や、前記配列表現データが選択されたら、別のウインドウに前記第1のセルに割り当てられた配列表現データを表あるいはグラフとして表示する態様や、第2のセルに、前記第1のセルに割り当てられた配列表現データを対象とした特徴値抽出関数を含む式が記述されていた場合には、該関数を計算し、その計算結果がスカラー表現データならば数値として表示し、前記計算結果が配列表現データならば配列表示ボタンを表示する態様も含まれる。
【0012】
さらに、本発明は、上記のいずれかのデータ解析方法あるいはデータ解析装置をコンピュータに実行させることができるコンピュータプログラムを提供する。
【0013】
【発明の実施の形態】
本発明では、各DUT毎のデータ解析には、大きく分けて、DUTのロット/ウエハ/ダイ情報あるいは測定項目として単一の測定値(例えば特定の端子間の開放時の抵抗値)しか持たないようなスカラー表現のデータ(以下スカラーデータと記す場合もある)と、測定項目として、一つあるいは複数の配列として表現される配列表現データ(以下配列データと記す場合もある)とがあることに注目し、2次元の表すなわちスプレッドシートとしてこれらの結果を整理および表現する際に、統合的に表示及び演算処理できる環境を提供する。さらに説明するならば、この配列表現データは、一つまたは複数の設定値の組み合わせに対して得られた一つまたは複数の測定値を、データの組とすることで測定項目の特徴を保持し、取り扱う場合に用いられ、結果を整理して表示することを容易にする。
【0014】
すなわち、本発明では、メインのスプレッドシートにおいて、配列表現データがスプレッドシートの一つのセルとして代表される。すなわち、そのセルには割り当てられた配列表現データの定義が記憶されている。そのセルを選択することにより、ユーザは配列のデータ表示あるいは配列のグラフ表示を得ることができる。これにより、メインスプレッドシート上のDUT毎のスカラー表現データを考慮しながら、直感的な操作で関連する配列表現データを参照し、解析をすることができる。
【0015】
次に、本発明による解析環境では、スプレッドシートの各セルの定義をする際に、指定セルに代表される配列表現データを対象として、統計などの各種演算を行う特徴値抽出関数を用意した。これにより、該関数を目的のセルの定義中の式に利用することにより、指定された配列表現データから特徴値を計算した値を目的のセルに表示することができる。そのため、メインのスプレッドシートから、配列表現データとその特徴値を容易に参照/評価できるため、オペレータの解析操作を著しく容易にするものである。
【0016】
なお、本明細書では、例示のために、配列表現データを抽象化してセルに割り当てられたスプレッドシートを、解析時におけるメインのスプレッドシートと呼んで理解を容易にしている場合があるが、これは、必ずしも本発明において、解析時のメインのスプレッドシートだけが配列表現データをセルに抽象化して割り当てられると限定するものではない。
【0017】
本発明による好適な実施形態であるデータ解析装置100について、図1ないし図3を用いて説明する。図1に示すように、データ解析装置100は、コンピュータ101と表示部103と入力部103とを備える。コンピュータ101は、各種プログラムやデータを格納するメモリやハードディスクを含む記憶部108と、システム制御プログラムやユーザのテストプログラムなどの各種プログラムを実行したり、表示部や入力部を制御する機能を含む制御部107とを備える。表示部102はCRTあるいは液晶ディスプレイなどを含み、それらに表示をする機能を備える。コンピュータ101は、測定器104から取得したデータをデータベース105あるいはファイル106として格納したものから受け取る機能を備える。矢印120,122,124はデータの流れを示す。
【0018】
制御部107には、図2に示すように、スプレッドシート定義部210と、スカラーデータ表示制御部202と、配列データ表示制御部204と、スカラーデータ演算部206と、配列データ演算部208とを備える。スプレッドシート定義部210はスプレッドシート上のセルの定義の入力をつかさどる機能を備える。スカラーデータ表示制御部202はスカラーデータをスプレッドシート上に表示制御する機能を備え、配列データ表示制御部204は、配列データをボタンあるいは表あるいはグラフとして表示制御する機能を備える。スカラーデータ演算部206は、スカラーデータのセルやそのようなセルを記述した式に対する演算制御をする機能を備え、配列データ演算部208は、セルに定義された配列表現データを対象として数式がセルに記述されたときに、演算制御する機能を備える。
【0019】
制御部107は、スプレッドシートのセルの取り扱いに関して、図3に示すフローチャートに従って動作する。すなわち、ステップ302において、スプレッドシート定義部210により、表示するスプレッドシートの各セルの定義を取得し、各セルに割り当てる。ここで、スプレッドシート定義部210によるセルからの定義の取得形態は、ユーザがセルの定義を入力する形態及び記憶部に格納されたセルの定義を読込む形態を含む。さらに、セルに配列表現データを割り当てる場合には、当該セルに割り当てられるべき配列表現データの定義を対応付けて記憶する。表示されるセルがスカラーデータの項目の場合には、数値データを当該セルに表示する(ステップ304)。表示されるセルが配列データの項目の場合、配列表示ボタンをセルに表示する(ステップ306)。表示されるセルに定義された式が配列データの特徴値抽出関数を含むなら、計算の対象となる配列データに対して該関数の演算を行い、結果をセルに表示する(ステップ308)。ここで、該結果のセルへの表示形態としては、該結果がスカラーデータか配列データかにより、数値あるいは配列表示ボタンが表示される。次に、表示されるセルがスカラーデータだけの演算を含む場合なら、該演算を行い結果をセルに表示する(ステップ310)。以上のセルへの表示の後、制御部107はキー入力待ちをし、ステップ306で表示した配列表示ボタンが押されたら、別のウインドウに配列データを表示する(ステップ312)。なお、この時の配列データの表示形態は、表あるいはグラフ、またはその双方を表示する表示手段と、一旦表示された表あるいはグラフの一方から、さらに残りの他方を表示する追加表示手段を含む。
【0020】
次に具体的な表示を図4ないし図6を用いて説明する。図4に本発明によるデータ解析装置100によって表示されるメインのスプレッドシートの例を示す。400がこのスプレッドシートの表示ウインドウであり、ここに表示される表は、表示される項目名を列ごとに表示したタイトル行部分401と、データ表示行部分402を備える。列については、ロットIDなどの測定対象物を特定する情報(403)、端子間抵抗値などのスカラーデータの測定結果(404)、配列表現データの列の例として、一つの2次元配列を含むIDVG特性405および複数の2次元配列データを含むIDVD特性などの測定データ407、一つの2次元配列データ405を対象として特徴値抽出の結果としてスカラーデータを表示する電圧VTH406、複数の2次元配列データ407を対象として特徴値抽出の結果として特徴値の配列表現データである、電圧VGごとの飽和領域でのドレイン電流IDS408が表示されている。ここで、図には示していないが、配列表現データが特徴値であっても、その配列データを示すセルを指定して、スカラーデータの特徴値を抽出して、別のセルに表示する形態も含まれる。
【0021】
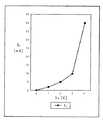
さらに、IDVG特性405の列の各セルには配列表示ボタンが表示されており、例えば、ロットIDがL01、ウエハIDがW05,ダイのX座標が9、ダイのY座標が9のDUTのIDVG特性セルの配列表示ボタン410をクリックすると、別ウインドウに表1に示されるデータ表示、あるいは、図5に示されるグラフ表示が表示される。
【0022】
【表1】
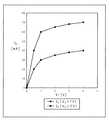
同様に、複数の2次元配列データを含むIDVD特性の配列表示ボタン412を押すと、別ウインドウに表2に示されるデータ表示、あるいは、図6に示されるグラフ表示が表示される。
【0024】
【表2】
配列表現データを持つ特徴値抽出結果を持つ列IDS408の配列表示ボタン414を押した場合も、上記同様に配列データのデータ表示あるいはグラフ表示が行われる。
【0026】
以上のように本発明の好適実施形態を説明したが、これらは説明のための例示に過ぎず、当業者には明らかなように、様々な変形が考えられよう。例えば、セルの内容が配列表現データを含む場合には、ボタンの代わりにセルに文字や記号を表示する変形や、セルに特別な色を表示する変形など、様々な表示の変形が考えられる。また、このようなセルから配列表現データの内容を表示する方法についても、マウスによるクリック以外にも様々な形態が考えられよう。さらに、上記の説明では、IDVG特性405を一つの2次元配列、IDVD特性407を複数の2次元配列データと表現したが、装置内部の取り扱いにおいて、これらの配列データを分解または統合して1次元または多次元のデータとして扱う変形も、本発明には含まれるものである。
【0027】
【発明の効果】
以上のように、本発明を用いると、データ解析において、測定項目として単一の測定値で表現される項目と、測定項目として測定値の配列で表現される項目を、統合して取り扱い、表現及び処理できる解析環境を提供することができる。また、測定項目として測定値の配列で表現される項目からの特徴値の抽出及び表示及び検証及び評価を、測定項目として単一の測定値で表現される項目が表示されるスプレッドシート上で行うことができる。そのため、ユーザは効率よく配列表現を含むデータの解析及び評価を行うことができる。 さらに、配列表現データを一旦スプレッドシートの別の部分に展開して取り込む必要がないので、ユーザは容易に配列表現データを含んだ解析及び評価をすることができる。
【図面の簡単な説明】
【図1】本発明の好適実施形態に関するブロック図である。
【図2】図1の制御部107に関するブロック図である。
【図3】本発明による実施形態の動作を示すフローチャートである。
【図4】本発明によるスプレッドシートの表示例である。
【図5】図4のボタン410を押したときに表示されるグラフ表示の例である。
【図6】図4のボタン412を押したときに表示されるグラフ表示の例である。
【符号の説明】
100:データ解析装置
101:コンピュータ
102:表示部
103:入力部
104:測定器
105:データベース
106:ファイル
107:制御部
108:記憶部
202:スカラーデータ表示制御部
204:配列データ表示制御部
206:スカラーデータ演算部
208:配列データ演算部
210:スプレッドシート定義部[0001]
[Industrial application fields]
The present invention relates to data analysis in a semiconductor test, and more particularly, to a technique for combining and analyzing a measurement result acquired as a combination of arrays from a measuring instrument and a measurement result acquired as scalar expression data from a measuring instrument.
[0002]
[Prior art]
When measuring a die on a wafer or a packaged IC (integrated circuit) (hereinafter referred to as a device under test (DUT)), various parameters are set and data is collected. For example, in the semiconductor measurement system disclosed in Japanese Patent Application Laid-Open No. 11-163063, it is described that various parameters are given to the test specification 7d to acquire and evaluate a large amount of measurement data. Such measurements are performed, for example, using a combination of Agilent Technology's Agilent 4072 semiconductor parameter tester and its Semiconductor Process Evaluation Core Software (SPECS) test shell software, or an Agilent 4155 semiconductor parameter analyzer. be able to.
[0003]
When measuring voltage-current characteristics (IV characteristics) under a predetermined condition for each DUT using these measuring devices, the obtained data is based on one or more conditions for each DUT. Acquired as a plurality of combinations of arrays representing voltage values versus current values, and stored in a file in a format desired by the user. The data stored in the file is processed by a dedicated data analysis program or a general-purpose spreadsheet program such as Microsoft Excel (registered trademark). As a result, feature values such asVTH were extracted from each sequence data.
[0004]
By the way, when performing these computations with a dedicated data analysis program, it handles complex array data and performs complex computations, but the program must always be modified to match the size of the data to be computed. . Alternatively, if a dedicated data analysis program that can be handled flexibly without depending on the size of the array or the number of combinations thereof is prepared so that such a modification is not necessary, there is a disadvantage that the cost of the program increases. there were. In addition, when it was necessary to modify the algorithm for extracting feature values at the time of analysis, recompilation was required, and it was not possible to flexibly modify the algorithm.
[0005]
On the other hand, when performing arithmetic processing with a general-purpose spreadsheet program, feature value extraction from a plurality of array data such as the above-described IV characteristics is performed for each individual spreadsheet. Further, the extracted feature values are inserted into a two-dimensional table displayed for each DUT together with the results of other measurement items, that is, inserted into a main spreadsheet and evaluated. However, inserting the characteristic values obtained for each individual spreadsheet described above into the cells of the main spreadsheet is a manual operation, which is a laborious and time-consuming operation. Furthermore, debugging between the main spreadsheet and each spreadsheet for feature value extraction is not easy without sufficient knowledge. Further, in the conventional general-purpose spreadsheet program, there is no function for easily displaying or calculating the array without once expanding and loading the array into another spreadsheet.
[0006]
[Problems to be solved by the invention]
The object of the present invention is to solve the above-mentioned problems of the prior art, and in data analysis, an item expressed as a single measurement value (scalar expression data) as a measurement item and an array of measurement values as a measurement item It is to provide a data analysis environment capable of integrating, handling, expressing and processing items (sequence expression data).
[0007]
Another object of the present invention is to extract, display, verify, and evaluate feature values from items expressed as an array of measurement values as measurement items, and to express items expressed as a single measurement value as measurement items. It is to provide a data analysis environment that can be performed on a spreadsheet.
[0008]
Still another object of the present invention is to provide a mechanism in the above-mentioned data analysis environment that can easily handle sequence data without expanding it into another part of a spreadsheet and fetching it.
[0009]
[Means for Solving the Problems]
In the present invention, in data analysis, an item expressed by a single measurement value (scalar expression data) as a measurement item and an item (array expression data) expressed by an array of measurement values as a measurement item are integrated. Provide analysis methods that can be handled, expressed and processed.
Specifically, in the spreadsheet, when assigning the definition of the array representation data to the first cell, displaying the array display button in the first cell, and when the array display button is selected And a method for analyzing data in a spreadsheet, including displaying the sequence expression data as a graph or a table by sequence data display means.
Here, assigning an expression including a feature value extraction function for the array expression data assigned to the first cell to the second cell, and including the feature value extraction function to the second cell Including a step of displaying or assigning the calculation result of the expression.
[0010]
Furthermore, in another embodiment of the present invention, spreadsheet definition means for assigning a definition of array expression data to a first cell on a spreadsheet, an array display button is displayed on the first cell, and the array display button includes When selected, there is also provided a data analysis device having sequence data display means for displaying the sequence expression data as a table or a graph.
Here, the spreadsheet definition unit has a function of assigning, to the second cell on the spreadsheet, an expression including a feature value extraction function for the array expression data assigned to the first cell. The data analysis apparatus further includes array data calculation means for calculating an expression including the feature value extraction function in the second cell, and the array data display means includes an expression assigned to the second cell. When the calculation result is array expression data, a new array display button is displayed, and if the calculation result is scalar expression data, an aspect is also included in which a numerical value is displayed.
[0011]
In still another embodiment of the present invention, when displaying data in a first cell on a spreadsheet, if the data assigned to the first cell is scalar expression data, a numerical value is displayed, and A data analysis method for displaying an array display button when the data assigned to the first cell is array expression data is provided.
Here, the scalar expression data includes data of items expressed as single measurement values as measurement items, and the array expression data is expressed as one or a plurality of arrays of measurement values as measurement items. A mode that includes data of items to be displayed, a mode in which the sequence representation data assigned to the first cell is displayed as a table or graph in another window when the sequence representation data is selected, or a second cell If a formula including a feature value extraction function for the array representation data assigned to the first cell is described, the function is calculated, and if the calculation result is scalar representation data, And an array display button is included if the calculation result is array expression data.
[0012]
Furthermore, the present invention provides a computer program capable of causing a computer to execute any one of the above data analysis methods or data analysis apparatuses.
[0013]
DETAILED DESCRIPTION OF THE INVENTION
In the present invention, the data analysis for each DUT has only a single measurement value (for example, a resistance value when a specific terminal is opened) as a lot / wafer / die information or measurement item of the DUT. There are such scalar representation data (hereinafter also referred to as scalar data) and measurement expression items as array representation data (hereinafter also referred to as array data) expressed as one or more arrays. Paying attention, it provides an environment that can display and compute in an integrated manner when organizing and expressing these results as a two-dimensional table or spreadsheet. To explain further, this array representation data retains the characteristics of the measurement item by making one or a plurality of measurement values obtained for one or a plurality of set value combinations into a data set. Used when handling, it makes it easy to organize and display the results.
[0014]
That is, in the present invention, in the main spreadsheet, the array representation data is represented as one cell of thespreadsheet . That is, the definition of the assigned array expression data is stored in the cell. By selecting the cell, the user can obtain an array data display or an array graph display. Thereby, it is possible to perform analysis by referring to related sequence expression data by intuitive operation while considering scalar expression data for each DUT on the main spreadsheet.
[0015]
Next, in the analysis environment according to the present invention, when defining each cell of the spreadsheet, a feature value extraction function for performing various calculations such as statistics is prepared for the array representation data represented by the designated cell. Thus, by using the function in an expression in the definition of the target cell, the value obtained by calculating the feature value from the specified array expression data can be displayed in the target cell. Therefore, it is possible to easily refer / evaluate the array expression data and the feature value thereof from the main spreadsheet, which greatly facilitates the operator's analysis operation.
[0016]
In this specification, for the sake of illustration, a spreadsheet assigned to cells by abstracting array representation data may be called a main spreadsheet at the time of analysis to facilitate understanding. However, in the present invention, it is not necessarily limited that only the main spreadsheet at the time of analysis can be assigned with the array representation data abstracted into cells.
[0017]
A
[0018]
As shown in FIG. 2, the
[0019]
The
[0020]
Next, specific display will be described with reference to FIGS. FIG. 4 shows an example of a main spreadsheet displayed by the
[0021]
Furthermore, an array display button is displayed in each cell in the column of the ID VG characteristics 405. For example, the lot ID is L01, the wafer ID is W05, the die X coordinate is 9, and the die Y coordinate is 9. When the
[0022]
[Table 1]
Similarly, when an
[0024]
[Table 2]
Even when the array display button 414 of the
[0026]
The preferred embodiments of the present invention have been described above. However, these are merely examples for description, and various modifications may be considered as will be apparent to those skilled in the art. For example, when the contents of the cell include array expression data, various display modifications such as a modification of displaying characters and symbols in the cell instead of a button and a modification of displaying a special color in the cell are conceivable. In addition to the click with the mouse, various forms of displaying the contents of the array representation data from such cells may be considered. Furthermore, in the above description, the ID VG characteristics 405 are expressed as one two-dimensional array, and the ID VD characteristics 407 are expressed as a plurality of two-dimensional array data. Alternatively, modifications that are integrated and handled as one-dimensional or multi-dimensional data are also included in the present invention.
[0027]
【The invention's effect】
As described above, according to the present invention, in data analysis, an item expressed by a single measurement value as a measurement item and an item expressed by an array of measurement values as a measurement item are handled and expressed in an integrated manner. In addition, an analysis environment that can be processed can be provided. In addition, extraction, display, verification, and evaluation of feature values from items expressed as an array of measurement values as measurement items are performed on a spreadsheet that displays items expressed as single measurement values as measurement items. be able to. Therefore, the user can efficiently analyze and evaluate data including sequence representation. Furthermore, since it is not necessary to once extract sequence representation data into another part of the spreadsheet, the user can easily analyze and evaluate the sequence representation data.
[Brief description of the drawings]
FIG. 1 is a block diagram of a preferred embodiment of the present invention.
FIG. 2 is a block diagram relating to a
FIG. 3 is a flowchart showing the operation of the embodiment according to the present invention.
FIG. 4 is a display example of a spreadsheet according to the present invention.
5 is an example of a graph displayed when a
6 is an example of a graph displayed when the
[Explanation of symbols]
100: Data analysis device 101: Computer 102: Display unit 103: Input unit 104: Measuring device 105: Database 106: File 107: Control unit 108: Storage unit 202: Scalar data display control unit 204: Array data display control unit 206: Scalar data calculation unit 208: array data calculation unit 210: spreadsheet definition unit
Claims (2)
Translated fromJapanese前記表示画面上に表示されたスプレッドシートの第1のセルに、配列表現された前記測定値データの定義を割り当てるスプレッドシート定義手段と、 Spreadsheet definition means for assigning the definition of the measurement value data expressed in an array to the first cell of the spreadsheet displayed on the display screen;
前記第1のセルに配列表示ボタンを表示し、前記配列表示ボタンが選択されるとき、前記配列表現された測定値データを表あるいはグラフとして前記表示画面に表示する配列データ解析手段と An array data analysis means for displaying an array display button in the first cell and displaying the measured value data represented by the array as a table or a graph on the display screen when the array display button is selected;
を有するデータ解析装置。 A data analysis apparatus.
前記データ解析装置が、前記式の演算を行う配列データ演算手段をさらに備え、 The data analysis device further includes array data calculation means for calculating the expression,
前記配列データ解析手段が、前記演算の結果が配列表現されたデータであれば新たな配列表示ボタンを表示し、前記演算の結果がスカラー表現されたデータであれば数値を表示する機能を有する The array data analyzing means has a function of displaying a new array display button if the result of the operation is data expressed in an array, and displaying a numerical value if the result of the operation is data expressed in a scalar.
ことを特徴とする請求項1に記載のデータ解析装置。 The data analysis apparatus according to claim 1.
Priority Applications (4)
| Application Number | Priority Date | Filing Date | Title |
|---|---|---|---|
| JP2002190201AJP3776843B2 (en) | 2002-06-28 | 2002-06-28 | Data analysis method and apparatus |
| US10/464,624US7053897B2 (en) | 2002-06-28 | 2003-06-18 | Data analysis method and apparatus therefor |
| EP03254100AEP1376393A3 (en) | 2002-06-28 | 2003-06-27 | Method and apparatus for data analysis |
| TW092117606ATW200401205A (en) | 2002-06-28 | 2003-06-27 | Data analysis method and apparatus therefor |
Applications Claiming Priority (1)
| Application Number | Priority Date | Filing Date | Title |
|---|---|---|---|
| JP2002190201AJP3776843B2 (en) | 2002-06-28 | 2002-06-28 | Data analysis method and apparatus |
Publications (2)
| Publication Number | Publication Date |
|---|---|
| JP2004037086A JP2004037086A (en) | 2004-02-05 |
| JP3776843B2true JP3776843B2 (en) | 2006-05-17 |
Family
ID=29717689
Family Applications (1)
| Application Number | Title | Priority Date | Filing Date |
|---|---|---|---|
| JP2002190201AExpired - Fee RelatedJP3776843B2 (en) | 2002-06-28 | 2002-06-28 | Data analysis method and apparatus |
Country Status (4)
| Country | Link |
|---|---|
| US (1) | US7053897B2 (en) |
| EP (1) | EP1376393A3 (en) |
| JP (1) | JP3776843B2 (en) |
| TW (1) | TW200401205A (en) |
Families Citing this family (17)
| Publication number | Priority date | Publication date | Assignee | Title |
|---|---|---|---|---|
| US7926024B2 (en)* | 2004-06-14 | 2011-04-12 | Hyperformix, Inc. | Method and apparatus for managing complex processes |
| US7739305B1 (en)* | 2005-07-28 | 2010-06-15 | Xilinx, Inc. | Network appliance for data collection and processing from multiple locations and data schema therefor |
| US8095866B2 (en) | 2005-09-09 | 2012-01-10 | Microsoft Corporation | Filtering user interface for a data summary table |
| US8601383B2 (en) | 2005-09-09 | 2013-12-03 | Microsoft Corporation | User interface for creating a spreadsheet data summary table |
| US7627812B2 (en)* | 2005-10-27 | 2009-12-01 | Microsoft Corporation | Variable formatting of cells |
| US7770100B2 (en)* | 2006-02-27 | 2010-08-03 | Microsoft Corporation | Dynamic thresholds for conditional formats |
| TWI490722B (en)* | 2009-11-25 | 2015-07-01 | Ind Tech Res Inst | Information processing device and information prcoessing system using tehreof |
| JP2013250252A (en)* | 2012-06-04 | 2013-12-12 | Advantest Corp | Test program |
| JP5833500B2 (en)* | 2012-06-04 | 2015-12-16 | 株式会社アドバンテスト | Test system |
| JP2013250250A (en) | 2012-06-04 | 2013-12-12 | Advantest Corp | Tester hardware and test system using the same |
| JP5833501B2 (en)* | 2012-06-04 | 2015-12-16 | 株式会社アドバンテスト | Test system |
| JP5833502B2 (en)* | 2012-06-04 | 2015-12-16 | 株式会社アドバンテスト | Test program |
| JP5816144B2 (en)* | 2012-08-30 | 2015-11-18 | 株式会社アドバンテスト | Test program and test system |
| JP2014235127A (en)* | 2013-06-04 | 2014-12-15 | 株式会社アドバンテスト | Test system, control program, and configuration data write method |
| JP6378867B2 (en)* | 2013-09-03 | 2018-08-22 | 株式会社島津製作所 | Graph display method for measurement data and auxiliary program for data selection |
| KR101522200B1 (en)* | 2013-10-29 | 2015-05-21 | 주식회사 인프라웨어 | Method and apparatus for dispalying electronic documents displaying calculation results in one or more calculation result region |
| US20170289404A1 (en)* | 2016-03-31 | 2017-10-05 | Intel Corporation | Joint edge enhance dynamic |
Family Cites Families (7)
| Publication number | Priority date | Publication date | Assignee | Title |
|---|---|---|---|---|
| US5416895A (en)* | 1992-04-08 | 1995-05-16 | Borland International, Inc. | System and methods for improved spreadsheet interface with user-familiar objects |
| US6138130A (en)* | 1995-12-08 | 2000-10-24 | Inventure Technologies, Inc. | System and method for processing data in an electronic spreadsheet in accordance with a data type |
| US5819293A (en)* | 1996-06-06 | 1998-10-06 | Microsoft Corporation | Automatic Spreadsheet forms |
| JP4022297B2 (en) | 1997-12-02 | 2007-12-12 | アジレント・テクノロジーズ・インク | Semiconductor measurement equipment that can dynamically change criteria |
| US6112209A (en)* | 1998-06-17 | 2000-08-29 | Gusack; Mark David | Associative database model for electronic-based informational assemblies |
| US6626736B2 (en)* | 2000-06-30 | 2003-09-30 | Ebara Corporation | Polishing apparatus |
| GB0028434D0 (en) | 2000-11-22 | 2001-01-10 | Decision Curve Ltd | Methods and apparatus for automatically producing spreadsheet-based models |
- 2002
- 2002-06-28JPJP2002190201Apatent/JP3776843B2/ennot_activeExpired - Fee Related
- 2003
- 2003-06-18USUS10/464,624patent/US7053897B2/ennot_activeExpired - Fee Related
- 2003-06-27EPEP03254100Apatent/EP1376393A3/ennot_activeWithdrawn
- 2003-06-27TWTW092117606Apatent/TW200401205A/enunknown
Also Published As
| Publication number | Publication date |
|---|---|
| TW200401205A (en) | 2004-01-16 |
| US7053897B2 (en) | 2006-05-30 |
| US20040002827A1 (en) | 2004-01-01 |
| EP1376393A2 (en) | 2004-01-02 |
| JP2004037086A (en) | 2004-02-05 |
| EP1376393A3 (en) | 2005-07-13 |
Similar Documents
| Publication | Publication Date | Title |
|---|---|---|
| JP3776843B2 (en) | Data analysis method and apparatus | |
| US7558712B1 (en) | System and method for programmatically abstracting model components | |
| US11036777B2 (en) | Analysis information management system | |
| CN102667831A (en) | Analysis display method of defective factors and analysis display device of defective factors | |
| JP7027022B2 (en) | Manufacturing process statistical processing system, manufacturing process statistical processing method and program | |
| US20160320432A1 (en) | Method of evaluating an electronic device involving display of a characteristic parameter item or a characteristic graph item in a data sheet format, apparatus therefor, and recording medium therefor | |
| US20190056361A1 (en) | Analysis information management system | |
| JP4853342B2 (en) | Control device for instrument analysis and control program | |
| JP2011141298A (en) | Processing device and method of nmr data | |
| JP2001033281A (en) | Multi-channel electron capture measurement equipment | |
| Škvorc et al. | A comprehensive analysis of the invariance of exploratory landscape analysis features to function transformations | |
| JP5020491B2 (en) | NMR data processing apparatus and method | |
| JP6515548B2 (en) | Chromatographic data processing system and method for searching chromatograms | |
| JP2014032466A (en) | Complexity calculation device, complexity calculation method, and complexity calculation program | |
| CN109710369B (en) | full-graphical user interface display method and device | |
| US7020572B2 (en) | Method for receiving and associating conditional dependent test results | |
| JP2008129700A (en) | Data processing system and program thereof | |
| CN114816990B (en) | Method for evaluating automatic test application level and related equipment | |
| JP5885030B2 (en) | Data analysis apparatus, program, and data analysis method | |
| JP5490982B2 (en) | Analyzer control system and analyzer control program | |
| JP2002189738A (en) | Method and device for analyzing keyword of patent information or the like | |
| JP6876427B2 (en) | Report creation device, program, information storage medium, and report creation method | |
| Nodzenski et al. | An Introduction Mixture Model Normalization with the metabomxtr Package | |
| CN107430513B (en) | Existing system processing specification extraction device | |
| Rauterberg | A concept to quantify different measures of user interface attributes: a meta analysis of empirical studies |
Legal Events
| Date | Code | Title | Description |
|---|---|---|---|
| A711 | Notification of change in applicant | Free format text:JAPANESE INTERMEDIATE CODE: A711 Effective date:20040217 | |
| A131 | Notification of reasons for refusal | Free format text:JAPANESE INTERMEDIATE CODE: A131 Effective date:20050614 | |
| A521 | Request for written amendment filed | Free format text:JAPANESE INTERMEDIATE CODE: A523 Effective date:20050913 | |
| A02 | Decision of refusal | Free format text:JAPANESE INTERMEDIATE CODE: A02 Effective date:20051021 | |
| A521 | Request for written amendment filed | Free format text:JAPANESE INTERMEDIATE CODE: A523 Effective date:20051215 | |
| A911 | Transfer to examiner for re-examination before appeal (zenchi) | Free format text:JAPANESE INTERMEDIATE CODE: A911 Effective date:20060126 | |
| TRDD | Decision of grant or rejection written | ||
| A01 | Written decision to grant a patent or to grant a registration (utility model) | Free format text:JAPANESE INTERMEDIATE CODE: A01 Effective date:20060216 | |
| A61 | First payment of annual fees (during grant procedure) | Free format text:JAPANESE INTERMEDIATE CODE: A61 Effective date:20060223 | |
| R150 | Certificate of patent or registration of utility model | Free format text:JAPANESE INTERMEDIATE CODE: R150 | |
| FPAY | Renewal fee payment (event date is renewal date of database) | Free format text:PAYMENT UNTIL: 20100303 Year of fee payment:4 | |
| FPAY | Renewal fee payment (event date is renewal date of database) | Free format text:PAYMENT UNTIL: 20110303 Year of fee payment:5 | |
| LAPS | Cancellation because of no payment of annual fees |