JP3648140B2 - Radio wave monitoring method and apparatus - Google Patents
Radio wave monitoring method and apparatusDownload PDFInfo
- Publication number
- JP3648140B2 JP3648140B2JP2000250028AJP2000250028AJP3648140B2JP 3648140 B2JP3648140 B2JP 3648140B2JP 2000250028 AJP2000250028 AJP 2000250028AJP 2000250028 AJP2000250028 AJP 2000250028AJP 3648140 B2JP3648140 B2JP 3648140B2
- Authority
- JP
- Japan
- Prior art keywords
- radio wave
- point
- emission source
- radio
- monitoring method
- Prior art date
- Legal status (The legal status is an assumption and is not a legal conclusion. Google has not performed a legal analysis and makes no representation as to the accuracy of the status listed.)
- Expired - Fee Related
Links
Images


Classifications
- G—PHYSICS
- G01—MEASURING; TESTING
- G01S—RADIO DIRECTION-FINDING; RADIO NAVIGATION; DETERMINING DISTANCE OR VELOCITY BY USE OF RADIO WAVES; LOCATING OR PRESENCE-DETECTING BY USE OF THE REFLECTION OR RERADIATION OF RADIO WAVES; ANALOGOUS ARRANGEMENTS USING OTHER WAVES
- G01S3/00—Direction-finders for determining the direction from which infrasonic, sonic, ultrasonic, or electromagnetic waves, or particle emission, not having a directional significance, are being received
- G01S3/02—Direction-finders for determining the direction from which infrasonic, sonic, ultrasonic, or electromagnetic waves, or particle emission, not having a directional significance, are being received using radio waves
- G01S3/14—Systems for determining direction or deviation from predetermined direction
Landscapes
- Physics & Mathematics (AREA)
- Engineering & Computer Science (AREA)
- General Physics & Mathematics (AREA)
- Radar, Positioning & Navigation (AREA)
- Remote Sensing (AREA)
- Monitoring And Testing Of Transmission In General (AREA)
- Radar Systems Or Details Thereof (AREA)
Description
Translated fromJapanese【0001】
【発明の属する技術分野】
本発明は、一定の地域内で不法無線局などの電波発射源の位置を特定し、電波利用環境を監視しうる電波監視方法及び装置に関する。
【0002】
【従来の技術】
従来、ある地域内にある不法無線局などの電波発射源の位置を特定する際には、複数の地点にセンサ局(監視局)を配置して、各センサ局において八木・宇田アンテナやゴニオメータなどを用いてその電波発射源からの電波の到来方向を観測し、それぞれのセンサ局での到来方向を地図上にプロットしてその交点の位置からその電波発射源の位置を推定していた。
【0003】
上述した従来の方法は、監視対象の電波発射源からの電波がセンサ局まで単一の経路で直進して伝搬することを仮定している。しかしながら、電波発射源からの電波は、実際には、地形やビルなどの地物による回折や反射を経て、センサ局に伝搬してくることがある。また、電波発射源からの電波は、地形や地物の影響で複数の伝搬経路(マルチパス)を通って、センサ局に到来することがある。従来の方法によって監視対象の電波発射源の位置を推定した場合、電波が回折や反射を経て伝搬することや複数の経路で伝搬することにより、電波発射源の位置の推定精度が悪くなるという問題点を生じる。
【0004】
そこで、本願発明者は、上記従来の方法における問題点を解決する広域電波監視方法及び装置をすでに提案している(例えば、特開平11−326482号公報を参照)。
【0005】
特開平11−326482号公報に記載の広域電波監視方法では、一定の地域内に1以上のセンサ局を配置し、地域内の複数の地点の各々について、当該地点に電波発射源があるとしたときのセンサ局での電波の到来方向を、地図情報を利用する計算機シミュレーションによって算出する。一方、センサ局において、伝搬経路ごとに分離して電波発射源からの電波の到来方向を観測する。センサ局によって観測した電波の到来方向と計算機シミュレーションの結果とを比較し、計算機シミュレーションの結果の中から、観測した電波の到来方向と最も類似性が高い到来方向を示すものを探索して対応する地点を候補位置として判別する。更に、候補位置の周辺に電波発射源があるとして電波発射源の位置を調整しながら計算機シミュレーションを実行して電波発射源の位置を決定する。
【0006】
上記の方法によれば、回折や反射が存在するような場合であっても、電波発射源の位置を正確に決定することが可能となる。
【0007】
【発明が解決しようとする課題】
しかしながら、特開平11−326482号公報に記載の広域電波監視方法及び装置では、地域内の複数の地点の各々について、当該地点に電波発射源があるとしたときのセンサ局での電波の到来方向を計算機シミュレーションによって算出するため、不特定な電波発射源に対して、電波伝搬の計算機シミュレーションによるデータベースを複数組用意する必要があった。更に、これらのデータベースを作成するのに時間を要してしまっていた。
【0008】
本発明の目的は、電波伝搬シミュレーションによるデータベースの作成時間を短縮し、電波監視の効率を向上する電波監視方法及び装置を提供することにある。
【0009】
【課題を解決するための手段】
上記目的は、一の地点において電波の到来方向及び強度のパターンを観測し、前記一の地点における観測結果を、前記一の地点から電波を発射したときに他の複数の地点において観測される電波の到来方向及び強度のパターンのシミュレーション結果と比較し、前記複数の地点のうち前記一の地点における前記観測結果と最も相関の強い電波の到来方向及び強度のパターンを与える地点を電波発射源と特定することを特徴とする電波監視方法により達成される。
【0010】
また、上記の電波監視方法において、前記一の地点から電波を発射したときの電波の到来方向及び強度のパターンをシミュレーションする際には、観測地域を2次元的に複数の領域に分割し、分割した各領域において観測される電界強度を計算するようにしてもよい。
【0011】
また、上記の電波監視方法において、前記一の地点から電波を発射したときの電波の到来方向及び強度のパターンをシミュレーションする際には、観測地域を3次元的に複数の空間に分割し、分割した各空間において観測される電界強度を計算するようにしてもよい。
【0012】
また、上記の電波監視方法において、前記一の地点から電波を発射したときの電波の到来方向及び強度のパターンをシミュレーションする際には、前記一の地点から発射される電波の発射方向を変えて前記各領域又は前記各空間において観測される電界強度をそれぞれ計算し、電波の発射方向毎に電界強度分布を求めるようにしてもよい。
【0013】
また、上記の電波監視方法において、前記一の地点から電波を発射したときの電波の到来方向及び強度のパターンをシミュレーションする際には、前記観測地域の地形や地物を考慮して電波の到来経路を計算するようにしてもよい。
【0014】
また、上記の電波監視方法において、特定された前記電波発射源の位置と前記シミュレーション結果に基づいて、前記一の地点から前記電波発射源までの電波の伝搬経路をトレースするようにしてもよい。
【0015】
また、上記の電波監視方法において、前記伝搬経路のトレース結果に基づき、前記電波発射源のアンテナ指向性を推定するようにしてもよい。
【0016】
また、上記の電波監視方法において、推定された前記電波発射源のアンテナ指向性に基づき、前記電波発射源から発せられた電波の電界強度分布を求めるようにしてもよい。
【0017】
また、上記目的は、一の地点に設けられ、電波の到来方向及び強度のパターンを観測する電波観測手段と、前記一の地点から電波を発射したときに他の複数の地点において観測される電波の到来方向及び強度のパターンのシミュレーション結果を記憶する記憶手段と、前記電波観測手段における観測結果と、前記記憶手段に記憶されているシミュレーション結果とを比較し、前記複数の地点のうち前記電波観測手段における前記観測結果と最も相関の強い電波の到来方向及び強度のパターンを与える地点を電波発射源と特定する電波発射源特定手段とを有することを特徴とする電波監視装置により達成される。
【0018】
また、上記の電波監視装置において、前記記憶手段は、観測地域を2次元的に複数の領域に分割し、前記一の地点から電波を発射したときに、分割した各領域において観測される電界強度を計算するようにしてもよい。
【0019】
また、上記の電波監視装置において、前記記憶手段は、観測地域を3次元的に複数の空間に分割し、前記一の地点から電波を発射したときに、分割した各空間において観測される電界強度を計算するようにしてもよい。
【0020】
また、上記の電波監視装置において、前記記憶手段は、前記一の地点から発射される電波の発射方向を変えたときに前記各領域又は前記各空間において観測される電界強度を、電波の発射方向毎に記憶するようにしてもよい。
【0021】
また、上記の電波監視装置において、前記電波発射源特定手段により特定された前記電波発射源の位置と前記シミュレーション結果に基づいて前記一の地点から前記電波発射源までの電波の伝搬経路をトレースする伝搬経路トレース手段を更に有するようにしてもよい。
【0022】
また、上記の電波監視装置において、前記伝播経路トレース手段による前記伝搬経路のトレース結果に基づいて前記電波発射源のアンテナ指向性を推定するアンテナ指向性推定手段を更に有するようにしてもよい。
【0023】
また、上記の電波監視装置において、前記アンテナ指向性推定手段により推定された前記電波発射源のアンテナ指向性に基づいて前記電波発射源から発せられた電波の電界強度分布を求める電界強度分布算出手段を更に有するようにしてもよい。
【0024】
【発明の実施の形態】
本発明の一実施形態による電波監視方法及び装置について図1乃至図6を用いて説明する。図1は、本実施形態による電波監視方法を示す概略図、図2は、電波監視装置の構成を示すブロック図、図3は、電波伝搬シミュレーションモデルを示す概略図、図4は、回折係数を計算するための座標系を示す概略図、図5は、電波発射源の送信アンテナの指向性の推定を説明する図、図6は、電波監視方法の手順を示すフローチャートである。
【0025】
(電波監視装置)
まず、本実施形態による電波監視装置の概要について図1を用いて説明する。
【0026】
電波発射源10は特定すべき電波を発射する発射源であり、周波数f1の電波を発射するものとする。このような電波発射源10から発射された電波の電波監視を行うために、監視区域内には、発射された電波の電波ホログラム観測を行うセンサ局12a、12b、12cが配置されている。センサ局12a、12b、12cは、回線14を介して、電波伝搬シミュレーションを行い、観測結果と比比較し電波発射源の位置10を特定するセンタ局16に接続されている。
【0027】
各センサ局12a、12b、12cには、電波ホログラム観測を行って電波再生像を出力する電波ホログラム観測再生装置18が設けられている。電波ホログラム観測再生装置18は、例えば、固定アンテナと走査観測面内を走査する走査アンテナとを備えている。所定の観測周波数において固定アンテナでの受信信号と走査アンテナでの受信信号を相関させることによって走査観測面の各点での相関値(2次元複素インタフェログラム)を求め、この2次元複素インタフェログラムを再生することによって、電波再生像を得る。
【0028】
各センサ局12a、12b、12cには、電波発射源10からの電波が伝搬するが、山岳やその他の地物の影響により、電波発射源10からセンサ局へ直接伝搬する成分(直接波)の他、回折して伝搬する成分(回折波)や反射して伝搬する成分(反射波)が存在する。そこで、本実施形態では、各センサ局12a、12b、12cにおいて、伝搬経路ごとの成分を分離してその到来方向や強度を求めるために、電波ホログラム観測を行い、電波像を再生することとしている。電波も波動の一種であるから、光のホログラムの場合と同様にホログラム観測を行うことができ、ホログラムを再生することによって電波再生像が得られ、この電波再生像から波源分布や強度などを調べることができる。なお、伝搬経路ごとの成分を分離して観測できるのであれば、電波ホログラム観測によらずに従来の方向探知技術を用いてもよい。
【0029】
センタ局16には、電波伝搬を計算機シミュレーションするためのシミュレーション装置20と、シミュレーション装置20によって予めシミュレーションを行った結果を格納しておくデータベース26と、各センサ局12a、12b、12cで観測された電波再生像とシミュレーションによる電界強度分布とを比較する比較部28とが設けられている。また、比較部27による比較結果から電波発射源10の位置を特定するとともに方向探知トレース図を作成、出力する方向探知トレース図作成部30と、位置が特定された電波発射源10からの電波の電界強度分布を電波勢力地図として作成、出力する電波勢力地図作成部32が設けられている。
【0030】
シミュレーション装置20は、地図、地形、地物等に関する情報(地図情報)を格納した地図情報格納部22と、地図情報を参照し、地図上のセンサ局12から仮想的な電波発射を行い電波伝搬のシミュレーションを行う電波伝搬シミュレータ24とを備えている。電波伝搬シミュレータ24は、例えば、レイトレース法(Ray Tracing)(例えば、IEEE Network Magazine, pp.27-30, November, 1991 を参照)やモーメント法(Moment Method)(例えば、R. F. Harrington, "Field Computation by Moment Methods", IEEE Press, 1993 を参照)などを用い、地図データ上のセンサ局12から仮想的に電波を発射したときに生じる電界強度分布を計算機シミュレーションする。
【0031】
データベース26は、シミュレーション装置20によって計算された電界強度分布の行列を格納する。データベース26に格納された電界強度分布の行列は、電波発射源10の位置の特定の際に、比較部28によって参照される。
【0032】
比較部28は、シミュレーション装置20によって計算されデータベース26に格納されている、センサ局12aから仮想的な電波を発射したときの電界強度分布の計算機シミュレーションの結果と、実際のセンサ局12aでの電波ホログラム観測の結果とを比較する。この比較結果より、電波発射源10の位置を特定する。
【0033】
方向探知トレース図作成部30は、比較部28によって特定された電波発射源10位置から各センサ局12a、12b、12cまでの電波伝搬路のトレースを行って方向探知トレース図34を作成、出力し、さらに、トレース結果をもとに、電波発射源10でのアンテナ指向性を推定する。
【0034】
電波勢力地図作成部32は、比較部28によって特定された電波発射源10の位置と、方向探知トレース図作成部30による電波発射源10のアンテナ指向性の推定結果とに基づき、シミュレーション装置20に電波伝搬の計算機シミュレーションを実行させ、地図上でのその電波発射源10からの電波の電界強度分布を計算させる。この計算結果を、その電波発射源10の電波勢力地図36として表示、印刷する。
【0035】
本実施形態による電波監視装置は、上記の構成をもとに、地形データや地物データに基づき、センサ局12a側から仮想的な電波発射をしたときの電波発射方向に対する各エリアの電界強度分布を、予め計算機シミュレーションによって算出する。そして、実際にセンサ局12aで観測された電波再生像から得られる電波の到来方向及びそれらの強度と、計算機シミュレーションによる電界強度分布とを比較することにより、電波発射源10の位置を特定することに特徴がある。
【0036】
(電波監視方法)
次に、本実施形態による電波監視方法について図1乃至図6を用いて詳述する電波監視に先立ち、地図データ上のセンサ局12aから仮想的な電波発射を行ったときの2次元モデルの電界強度分布のシミュレーションを行う。以下に、電界強度分布の計算機シミュレーションについて図3及び図4を用いて詳述する。以下に述べる計算機シミュレーションはレイトレース法を用いたものである。レイトレース法とは、電波源から無数のレイ(光線)が発射されているものとして、そのレイを一定角度ごとに逐次奇跡の追跡を行う手法である。従って、そのレイが地面や建物にぶつかった場合にはその点を反射点として反射方向へのレイを更に追跡し、建物のエッジ部分にぶつかった場合はその点を回折点としてそこから再び複数のレイを発生させる方法である。
【0037】
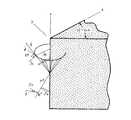
まず、電波伝搬シミュレータ24によって、地図情報格納部22から、シミュレーションを行う地域の地図データを参照し、図3に示すように、シミュレーションの対象とする地域を格子状にM×N個のエリアに分割する。分割した各エリアにはエリア番号1、2、…、MN−1、MNを付与する。地図データには、地形や地物に関する情報がマッピングされている。図3では、建物13a、建物13bがある場合を考える。
【0038】
続いて、図3に示すように、地図データ上のセンサ局12aからLk方向に一本のレイ( Ray )を発射し、このレイの伝搬経路と各エリアを通過したときの電界強度を計算する。計算されたレイの電界強度を、行番号に発射したレイのレイ番号Lkを有し、列番号にエリア番号を有する行列の要素として記録する。この電界強度の分布を記録する行列を次の表1に示す。
【0039】
【表1】
このとき、センサ局12aを起点として、レイの移動距離に比例した太さをレイにもたせるものとし、太さを有するレイが各エリアの一部にかかった場合も、そのレイがそのエリアを通過したものとみなす。また、一つのエリアに複数のレイが通過した場合は、そのうちの最大強度を与えるレイの電界強度を表1の行列に記録するものとする。
【0041】
上記のシミュレーションの手順を、図3に示すように、センサ局12aを起点としてLk方向に発射されたレイが、建物13aのp点で反射し、建物13bのq点に到達する場合を用いて具体的に説明する。ここで、センサ局とp点との間を結ぶ線分を線分aとし、p点とq点との間を結ぶ線分を線分bとする。
【0042】
まず、レイがセンサ局12aから発射され、レイが建物13aのp点に到達する間の線分aが通過したエリアについて、対応する行列の要素(Lk,エリア番号)に次の数1により計算される電界強度を記録する。
【0043】
【数1】
ただし、E0はセンサ局12a発射時の電波の電界強度、rはセンサ局12aから各エリアの中心までの距離、kは電波の波数である。
【0045】
続いて、レイが建物13aのp点で反射し、反射波が建物13bのq点に到達する間の線分bが通過したエリアについて、対応する行列の要素(Lk,エリア番号)に次の数2により計算される電界強度を記録する。
【0046】
【数2】
ただし、aは線分aの長さであり、r′はp点を基点とした各エリアの中心までの距離である。
【0048】
Rは反射係数であり、以下のようにして求められる。
【0049】
まず、スネルの法則より媒質1から媒質2に平面波が入射するときの複素屈折率nは次の数3で表される。
【0050】
【数3】
ここで、ε1、μ1、σ1は、それぞれ媒質1の誘電率、透磁率、導電率である。ε2、μ2、σ2は、それぞれ媒質2の誘電率、透磁率、導電率である。求めようとする反射係数Rは、複素屈折率nを用いて、入射電界が入射面内にあるとき、すなわちTM(Transverse Magnetic)入射の場合は次の数4で表される。
【0052】
【数4】
一方、入射電界が入射面に垂直であるとき、すなわちTE(Transverse Electric)入射の場合は次の数5で表される。
【0054】
【数5】
続いて、建物13aのp点で反射したレイが建物13bのq点に到達し、q点で回折したときの回折波の線分c1、c2、c3、…を求める。ここで、レイが建物13bの角に入射した場合、すなわちq点が建物13bの角に位置する場合には、その角から複数のレイを面放射するものとする。
【0056】
線分c1、c2、c3、…が通過したエリアについて、対応する行列の要素(Lk,エリア番号)に次の数6を記録する。
【0057】
【数6】
ただし、bは線分bの長さであり、r″はq点を基点とした各エリアの中心までの距離、Dは回折係数であり、図4に示す座標系を用いて次の数7から計算される。
【0059】
【数7】
ただし、β0、β0′φ、φ′、ρd、sdは、それぞれ図4に示すような位置関係を表す物理的なパラメータであり、図4でE0は入射波、Edは回折波である。また、Ds及びDhは、UTD法(R. G. Kouyoumjian, P. H. Pathak, Proceeding of the IEEE, no.11, pp.1448-1461, December, 1974 を参照)によりフレネル積分関数Fを用いて次の数8のように表される。
【0061】
【数8】
ここで、L、a+(x)、a-(x)はそれぞれ次の数9のように表される。
【0063】
【数9】
ただし、N+、N-は次の数10で表される。
【0065】
【数10】
上述の操作を、センサ局12aから発射するレイの方向Lkを変化しながら繰り返し、表1に示すLkに対する電界強度分布の行列を完成する。得られた電界強度分布の行列をデータベース26に記録しておく。こうして、電波伝搬のシミュレーションを終了する。
【0067】
図1に示すように複数のセンサ局12a、12b、12cを配置した場合は、センサ局12a以外についても上述のシミュレーションを行い、複数センサ局による同時監視を行えるようにしてもよい。センサ局を複数用いることによって不感地域をなくすることができるほか、測定データを多くすることで電波発射源の位置の推定精度を向上させることができる。
【0068】
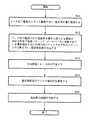
以上のように、予め電波伝搬のシミュレーションを行ったうえで、電波監視を開始する。電波監視は、図6に示すフローチャートの手順に従って行われる。
【0069】
まず、センサ局12aにより電波ホログラム観測を行い、電波再生像を取得する(ステップS11)。電波ホログラム観測により、電波の到来方向と強度とを関連づけて測定することができる。
【0070】
続いて、比較部28によって、センサ局12aで観測された電波再生像から得られる電波の到来方向及び強度パターンと、データベース26に格納されている電界強度分布の行列の列ベクトルそれぞれのパターンとの比較を行う(ステップS12)。
【0071】
電波伝搬では、一般に、送信と受信について電波伝搬経路の可逆性が成立し、また、伝搬減衰量の可逆性、すなわち送信と受信を入れ換えても伝搬減衰量は同じであるということが成立する。
【0072】
したがって、電界強度分布の行列の列ベクトルのうち、最も一致度の高い列ベクトルのエリア番号を有するエリアを電波発射源10の位置とすることができる。
【0073】
このようにして電波発射源10を特定する方法を採用することにより、電波監視を行う地域内の複数の地点の各々について、当該地点に電波発射源があるとしたときのセンサ局で観測される電波再生像を、地図情報を利用する計算機シミュレーションによって算出する必要がなく、電波監視の効率を向上することができる。
【0074】
上述の一致度の比較では、通常のパターンマッチングの手法を用いることができる。例えば、電波再生像における電波の最大レベルが0dBであるとすれば、電波レベルが−40dB以上の部分のパターンを比較し、図形としての相関係数を求めるといった手法を用いる。電波発射源10のアンテナ指向性が分からないので、電波の到来方向に主に着目して一致性の高いものを探索するようにする。
【0075】
センサ局12aだけでなく、センサ局12b、センサ局12cを用いて同時監視を行う場合は、センサ局12aの場合と同様に、予め仮想的な電波発射を行ったときの電界強度分布のシミュレーションの結果をデータベース26に格納しておき、実際に電波ホログラム観測によって得られた結果との比較を行う。
【0076】
次いで、電波発射源10の位置を特定した後、方向探知トレース図作成部30により、比較部28によって特定された電波発射源10位置から各センサ局12a、12b、12cまでの電波伝搬路のトレースを行って方向探知トレース図34を作成、出力する(ステップS13)。
【0077】
なお、地図データ上のセンサ局12aから仮想的な電波発射を行ったときの電界強度分布のシミュレーションの際に、得られた電界強度分布の行列に対応してレイの経路情報をデータベース26に記録しておくことにより、方向探知トレース図作成部30を用いることなく、電波発射源10の位置の特定と同時に、電波伝搬経路のトレース結果を得ることができる。
【0078】
さらに、上述のトレース結果をもとに、電波発射源10でのアンテナ指向性を以下のようにして推定する(ステップS14)。
【0079】
まず、各センサ局12a、12b、12cによって電波ホログラム観測を行い、電波再生像を取得する。各センサ局12a、12b、12cで得られた電波再生像から、伝搬経路ごとの電波の到来方向とその強度を抽出する。
【0080】
図5(a)〜(c)は、それぞれセンサ局12a、12b、12cでの観測による電波の振幅を示している。太線の矢印の向きがその伝搬経路の電波の到来方向を示し、その矢印の長さが電波の振幅を示している。図示した例では、伝搬経路ごとの振幅が、a1、a2、b1、b2、c1、c2となっている。一方、シミュレータ装置23によって、すでに求めた電波発射源10の位置に無指向性の送信アンテナがあってそこから電波が発射されているものとして、電波伝搬シミュレーションを行い、伝搬経路ごとに、各センサ局12a、12b、12cでの電波の振幅を求める。
【0081】
図5(d)〜(f)は、各センサ局12a、12b、12cでのシミュレーションによる電波の振幅を示しており、伝搬経路ごとの振幅は、a1’、a2’、b1’、b2’、c1’、c2’となっている。そして、伝搬経路P1、P2、P3、P4、P5、P6ごとに観測による振幅をシミュレーションによる振幅で除算することによって、電波発射源の位置での各伝搬経路の方向への、送信アンテナの指向性を求めることができる。
【0082】
図5(g)において黒丸は各伝搬経路の方向への指向性を示している。そして、想定されるアンテナの種類などを考慮して補間計算を行えば、任意の方向に対する指向特性を算出することができる。図5(g)の破線はこのようにして算出した指向特性を示している。
【0083】
また、電波勢力地図作成部32によって、方向探知トレース図作成部30による電波発射源10のアンテナ指向性の推定結果とともに、シミュレーション装置20に電波伝搬の計算機シミュレーションを実行させ、地図上でのその電波発射源10からの電波の電界強度分布を計算させる。この計算結果を、その電波発射源10の電波勢力地図36として表示、印刷する(ステップS15)。
【0084】
こうして特定地域内の電波発射源10の位置を特定し、同時に、方向探知トレース図の作成、電波発射源10の送信アンテナの指向性の推定、電波勢力地図の作成を行い、電波監視を終了する。
【0085】
このように、本実施形態によれば、地域内の複数の地点の各々について、当該地点に電波発射源があるとしたときのセンサ局で観測される電波再生像を計算機シミュレーションによって算出する必要がないので、電波伝搬シミュレーションによるデータベースの作成時間を短縮し、電波監視の効率を向上することができる。
【0086】
次に、本発明の他の実施形態による電波監視方法及び装置について図7を用いて説明する。図7は、3次元の電波伝搬シミュレーションモデルを示す概略図である。
【0087】
本実施形態による電波監視方法及び装置は、地図データ上のセンサ局12aから仮想的な電波発射を行ったときの電界強度分布のシミュレーションを3次元モデルを用いて行うことに特徴がある。電界強度分布のシミュレーションを3次元モデルを用いて行う点を除いては、上記実施形態と同様である。以下に本実施形態における電界強度分布のシミュレーションについて説明する。
【0088】
まず、図7に示すように、監視区域をx×y×z個の単位空間に分割し、各単位空間に空間番号1、2、3、…、xyz−1、xyzを付与する。
【0089】
続いて、地図データ上のセンサ局12aからLk方向に一本のレイを発射し、このレイの伝搬経路と各単位空間を通過したときの電界強度を、上記実施形態における2次元モデルでの場合と同様に計算する。計算されたレイの電界強度を、行番号に発射したレイのレイ番号Lkを有し、列番号に単位空間番号を有する行列の要素として記録する。
【0090】
このとき、センサ局12aを起点として、レイの移動距離に比例した太さをレイにもたせるものとし、太さを有するレイが各エリアの一部にかかった場合も、そのレイがそのエリアを通過したものとみなす。また、一つのエリアに複数のレイが通過した場合は、そのうちの最大強度を与えるレイの電界強度を上述の行列に記録する。
【0091】
センサ局12aを起点としてLk方向に発射されたレイが、建物13aのp点で反射する場合や、建物13bのq点で回折する場合についても、上記実施形態と同様にレイの電界強度を計算する。この際、建物13a、13bの3次元情報を考慮して反射や回折の方向を決定する。
【0092】
上述の操作を、センサ局12aから発射するレイの方向Lkを3次元的に変化しながら繰り返し、2次元モデルでの場合と同様に、Lkに対する電界強度分布の行列を完成する。得られた電界強度分布の行列をデータベース26に記録しておく。こうして、電波伝搬のシミュレーションを終了する。
【0093】
上述の電波伝搬のシミュレーションの結果を用いて、以後、図6に示すフローチャートに従って、上記実施形態と同様に電波監視を行うことができる。
【0094】
このように、本実施形態によれば、地域内の複数の地点の各々について、当該地点に電波発射源があるとしたときのセンサ局で観測される電波再生像を計算機シミュレーションによって算出する必要がないので、電波伝搬シミュレーションによるデータベースの作成時間を短縮し、電波監視の効率を向上することができる。
【0095】
【発明の効果】
以上の通り、本発明によれば、一の地点における観測結果を、一の地点から電波を発射したときに他の複数の地点において観測される電波の到来方向及び強度のパターンのシミュレーション結果と比較し、複数の地点のうち一の地点における観測結果と最も相関の強い電波の到来方向及び強度のパターンを与える地点を電波発射源と特定するので、電波伝搬シミュレーションによるデータベースの作成時間を短縮し、電波監視の効率を向上することができる。
【図面の簡単な説明】
【図1】本発明の一実施形態による電波監視方法を示す概略図である。
【図2】本発明の一実施形態による電波監視装置の構成を示すブロック図である。
【図3】電波伝搬シミュレーションモデルを示す概略図である。
【図4】回折係数を求めるための座標系を示す概略図である。
【図5】電波発射源の送信アンテナの指向性の推定を説明する図である。
【図6】本発明の一実施形態による電波監視方法の手順を示すフローチャートである。
【図7】3次元の電波伝搬シミュレーションモデルを示す概略図である。
【符号の説明】
10…電波発射源
12a、12b、12c…センサ局
13a、13b…建物
14…回線
16…センタ局
18…電波ホログラム観測再生装置
20…シミュレーション装置
22…地図情報格納部
24…電波伝搬シミュレータ
26…データベース
28…比較部
30…方向探知トレース図作成部
32…電波勢力地図作成部
34…方向探知トレース図
36…電波勢力地図
S11、S12、S13、S14、S15…ステップ[0001]
BACKGROUND OF THE INVENTION
The present invention relates to a radio wave monitoring method and apparatus capable of specifying a position of a radio wave emission source such as an illegal radio station in a certain area and monitoring a radio wave use environment.
[0002]
[Prior art]
Conventionally, when locating radio emission sources such as illegal radio stations in a certain area, sensor stations (monitoring stations) are arranged at multiple points, and each sensor station has a Yagi / Uda antenna, goniometer, etc. The direction of arrival of radio waves from the radio wave emission source was observed, and the direction of arrival at each sensor station was plotted on a map, and the position of the radio wave emission source was estimated from the position of the intersection.
[0003]
The conventional method described above assumes that the radio wave from the radio wave emission source to be monitored propagates straight through the single path to the sensor station. However, radio waves from a radio wave emission source may actually propagate to the sensor station via diffraction and reflection by features such as topography and buildings. In addition, radio waves from a radio wave emission source may arrive at the sensor station through a plurality of propagation paths (multipaths) due to the influence of topography and features. When the position of the radio wave emission source to be monitored is estimated by the conventional method, the radio wave propagation source propagates through diffraction or reflection, or propagates in multiple paths, resulting in poor estimation accuracy of the radio wave emission source position. Create a point.
[0004]
Therefore, the inventor of the present application has already proposed a wide-area radio wave monitoring method and apparatus for solving the problems in the conventional method (see, for example, JP-A-11-326482).
[0005]
In the wide area radio wave monitoring method described in Japanese Patent Application Laid-Open No. 11-326482, it is assumed that one or more sensor stations are arranged in a certain area, and each of a plurality of points in the area has a radio wave emission source. The arrival direction of the radio wave at the sensor station is calculated by computer simulation using map information. On the other hand, in the sensor station, the direction of arrival of radio waves from the radio wave emission source is observed separately for each propagation path. Compare the direction of arrival of radio waves observed by the sensor station with the result of computer simulation, and search for the one that shows the arrival direction with the highest similarity to the direction of arrival of the observed radio wave from the results of computer simulation A point is determined as a candidate position. Further, assuming that there is a radio wave emission source around the candidate position, a computer simulation is executed while adjusting the position of the radio wave emission source to determine the position of the radio wave emission source.
[0006]
According to the above method, the position of the radio wave emission source can be accurately determined even when there is diffraction or reflection.
[0007]
[Problems to be solved by the invention]
However, in the wide area radio wave monitoring method and apparatus described in Japanese Patent Application Laid-Open No. 11-326482, the arrival direction of radio waves at a sensor station when there is a radio wave emission source at each of a plurality of points in the area. Therefore, it is necessary to prepare a plurality of sets of databases by computer simulation of radio wave propagation for unspecified radio wave emission sources. Furthermore, it took time to create these databases.
[0008]
An object of the present invention is to provide a radio wave monitoring method and apparatus that shortens the database creation time by radio wave propagation simulation and improves the efficiency of radio wave monitoring.
[0009]
[Means for Solving the Problems]
The purpose is to observe the arrival direction and intensity pattern of radio waves at one point, and to observe the observation results at the one point as radio waves observed at other points when the radio wave is emitted from the one point. Compared with the simulation result of the arrival direction and intensity pattern of the radio wave, the point giving the pattern of the arrival direction and intensity of the radio wave having the strongest correlation with the observation result at the one point is identified as the radio wave emission source. This is achieved by a radio wave monitoring method characterized by:
[0010]
In the radio wave monitoring method described above, when simulating the arrival direction and intensity pattern of radio waves emitted from the one point, the observation area is divided into a plurality of areas in a two-dimensional manner. The electric field intensity observed in each region may be calculated.
[0011]
In the radio wave monitoring method described above, when simulating the arrival direction and intensity pattern of the radio wave when the radio wave is emitted from the one point, the observation area is three-dimensionally divided into a plurality of spaces. The electric field strength observed in each space may be calculated.
[0012]
In the radio wave monitoring method, when simulating the arrival direction and intensity pattern of the radio wave when the radio wave is emitted from the one point, the emission direction of the radio wave emitted from the one point is changed. The electric field intensity observed in each region or each space may be calculated, and the electric field intensity distribution may be obtained for each radio wave emission direction.
[0013]
In the radio wave monitoring method described above, when simulating the arrival direction and intensity pattern of the radio wave when the radio wave is emitted from the one point, the radio wave arrival takes into account the topography and features of the observation area. A route may be calculated.
[0014]
In the radio wave monitoring method, a radio wave propagation path from the one point to the radio wave emission source may be traced based on the specified position of the radio wave emission source and the simulation result.
[0015]
In the radio wave monitoring method, the antenna directivity of the radio wave emission source may be estimated based on a trace result of the propagation path.
[0016]
In the radio wave monitoring method, the electric field intensity distribution of the radio wave emitted from the radio wave emission source may be obtained based on the estimated antenna directivity of the radio wave emission source.
[0017]
Also, the above object is to provide radio wave observation means for observing the arrival direction and intensity pattern of a radio wave provided at one point, and radio waves observed at a plurality of other points when the radio wave is emitted from the one point. The storage means for storing the simulation result of the direction of arrival and the pattern of the intensity, the observation result in the radio wave observation means, and the simulation result stored in the storage means are compared, and the radio wave observation among the plurality of points is compared. It is achieved by a radio wave monitoring apparatus characterized by comprising radio wave emission source specifying means for specifying a point giving a pattern of the arrival direction and intensity of the radio wave having the strongest correlation with the observation result in the means.
[0018]
In the radio wave monitoring apparatus, the storage means divides the observation area into a plurality of areas two-dimensionally, and when the radio wave is emitted from the one point, the electric field intensity observed in each divided area May be calculated.
[0019]
In the radio wave monitoring apparatus, the storage means divides the observation area into a plurality of spaces three-dimensionally, and the electric field intensity observed in each divided space when the radio waves are emitted from the one point. May be calculated.
[0020]
Further, in the radio wave monitoring apparatus, the storage means may calculate the electric field intensity observed in each area or each space when the emission direction of the radio wave emitted from the one point is changed. You may make it memorize | store for every.
[0021]
In the radio wave monitoring device, the radio wave propagation path from the one point to the radio wave emission source is traced based on the position of the radio wave emission source specified by the radio wave emission source specifying unit and the simulation result. You may make it further have a propagation path trace means.
[0022]
The radio wave monitoring apparatus may further include an antenna directivity estimating unit that estimates an antenna directivity of the radio wave emission source based on a result of tracing the propagation path by the propagation path tracing unit.
[0023]
Further, in the radio wave monitoring apparatus, the electric field intensity distribution calculating means for obtaining the electric field intensity distribution of the radio wave emitted from the radio wave emission source based on the antenna directivity of the radio wave emission source estimated by the antenna directivity estimation means. You may make it have further.
[0024]
DETAILED DESCRIPTION OF THE INVENTION
A radio wave monitoring method and apparatus according to an embodiment of the present invention will be described with reference to FIGS. 1 is a schematic diagram illustrating a radio wave monitoring method according to the present embodiment, FIG. 2 is a block diagram illustrating a configuration of a radio wave monitoring apparatus, FIG. 3 is a schematic diagram illustrating a radio wave propagation simulation model, and FIG. FIG. 5 is a schematic diagram illustrating a coordinate system for calculation, FIG. 5 is a diagram illustrating estimation of directivity of a transmission antenna of a radio wave emission source, and FIG. 6 is a flowchart illustrating a procedure of a radio wave monitoring method.
[0025]
(Radio wave monitoring device)
First, the outline of the radio wave monitoring apparatus according to the present embodiment will be described with reference to FIG.
[0026]
The radio
[0027]
Each of the
[0028]
Radio waves from the radio
[0029]
The
[0030]
The simulation apparatus 20 refers to the map
[0031]
The
[0032]
The
[0033]
The direction detection trace
[0034]
Based on the position of the radio
[0035]
The radio wave monitoring apparatus according to the present embodiment is based on the above-described configuration, and the electric field intensity distribution of each area with respect to the radio wave emission direction when virtual radio wave emission is performed from the
[0036]
(Radio wave monitoring method)
Next, prior to the radio wave monitoring described in detail with reference to FIGS. 1 to 6 for the radio wave monitoring method according to the present embodiment, the electric field of the two-dimensional model when a virtual radio wave is emitted from the
[0037]
First, the radio
[0038]
Subsequently, as shown in FIG.k One ray (Ray) is fired in the direction, and the propagation path of this ray and the electric field strength when passing through each area are calculated. The ray number L of the ray fired at the row number is calculated as the electric field strength of the ray.k And is recorded as an element of a matrix having an area number in the column number. A matrix for recording the distribution of the electric field strength is shown in Table 1 below.
[0039]
[Table 1]
At this time, the
[0041]
As shown in FIG. 3, the procedure of the above simulation is described with reference to the
[0042]
First, a ray is fired from the
[0043]
[Expression 1]
However, E0 Is the electric field strength of the radio wave when the
[0045]
Subsequently, for the area where the line b passes while the ray is reflected at the point p of the
[0046]
[Expression 2]
Here, a is the length of the line segment a, and r ′ is the distance from the point p to the center of each area.
[0048]
R is a reflection coefficient and is determined as follows.
[0049]
First, according to Snell's law, the complex refractive index n when a plane wave enters the medium 2 from the
[0050]
[Equation 3]
Where ε1 , Μ1 , Σ1 Are the dielectric constant, permeability and conductivity of the
[0052]
[Expression 4]
On the other hand, when the incident electric field is perpendicular to the incident surface, that is, in the case of TE (Transverse Electric) incidence, it is expressed by the following equation (5).
[0054]
[Equation 5]
Subsequently, the ray reflected at the point p of the
[0056]
Line c1 , C2 , CThree ,... For the area through which the corresponding matrix element (Lk , Area number), the following number 6 is recorded.
[0057]
[Formula 6]
Where b is the length of the line segment b, r ″ is the distance from the q point to the center of each area, D is the diffraction coefficient, and using the coordinate system shown in FIG. Calculated from
[0059]
[Expression 7]
However, β0 , Β0 'Φ, φ', ρd , Sd Are physical parameters representing the positional relationship as shown in FIG.0 Is the incident wave, Ed Is a diffracted wave. Ds And Dh Is expressed as follows using the Fresnel integral function F by the UTF method (see RG Kouyoumjian, PH Pathak, Proceeding of the IEEE, no. 11, pp. 1448-1461, December, 1974). .
[0061]
[Equation 8]
Where L, a+ (X), a- (X) is expressed as the following equation (9).
[0063]
[Equation 9]
However, N+ , N- Is expressed by the following equation (10).
[0065]
[Expression 10]
The direction L of the ray fired from the
[0067]
When a plurality of
[0068]
As described above, radio wave monitoring is started after a radio wave propagation simulation is performed in advance. Radio wave monitoring is performed according to the procedure of the flowchart shown in FIG.
[0069]
First, radio hologram observation is performed by the
[0070]
Subsequently, the
[0071]
In radio wave propagation, generally, reversibility of a radio wave propagation path is established for transmission and reception, and reversibility of propagation attenuation amount, that is, the propagation attenuation amount is the same even if transmission and reception are interchanged.
[0072]
Therefore, the area having the area number of the column vector having the highest degree of coincidence among the column vectors of the field intensity distribution matrix can be set as the position of the radio
[0073]
By adopting the method of identifying the radio
[0074]
In the above-described comparison of matching degrees, a normal pattern matching method can be used. For example, if the maximum radio wave level in the radio wave reproduction image is 0 dB, a method is used in which patterns of portions where the radio wave level is −40 dB or more are compared to obtain a correlation coefficient as a figure. Since the antenna directivity of the radio
[0075]
When simultaneous monitoring is performed using not only the
[0076]
Next, after the position of the radio
[0077]
Note that ray path information is recorded in the
[0078]
Further, based on the above trace result, the antenna directivity at the radio
[0079]
First, radio wave hologram observation is performed by the
[0080]
FIGS. 5A to 5C show the amplitudes of radio waves observed by the
[0081]
FIGS. 5D to 5F show the amplitudes of radio waves by simulations at the
[0082]
In FIG. 5G, the black circles indicate the directivity in the direction of each propagation path. Then, if the interpolation calculation is performed in consideration of the assumed antenna type and the like, the directivity characteristic in an arbitrary direction can be calculated. The broken line in FIG. 5G shows the directivity characteristics calculated in this way.
[0083]
In addition, the radio wave influence
[0084]
In this way, the position of the radio
[0085]
Thus, according to the present embodiment, it is necessary to calculate the radio wave reproduction image observed at the sensor station when there is a radio wave emission source at each point in the area by computer simulation. Therefore, it is possible to shorten the database creation time by radio wave propagation simulation and improve the efficiency of radio wave monitoring.
[0086]
Next, a radio wave monitoring method and apparatus according to another embodiment of the present invention will be described with reference to FIG. FIG. 7 is a schematic diagram showing a three-dimensional radio wave propagation simulation model.
[0087]
The radio wave monitoring method and apparatus according to the present embodiment is characterized in that a simulation of an electric field intensity distribution when a virtual radio wave is emitted from the
[0088]
First, as shown in FIG. 7, the monitoring area is divided into x × y × z unit spaces, and
[0089]
Subsequently, from the
[0090]
At this time, the
[0091]
L starting from the
[0092]
The direction L of the ray fired from the
[0093]
By using the result of the radio wave propagation simulation described above, radio wave monitoring can be performed in the same manner as in the above embodiment, according to the flowchart shown in FIG.
[0094]
Thus, according to the present embodiment, it is necessary to calculate the radio wave reproduction image observed at the sensor station when there is a radio wave emission source at each point in the area by computer simulation. Therefore, it is possible to shorten the database creation time by radio wave propagation simulation and improve the efficiency of radio wave monitoring.
[0095]
【The invention's effect】
As described above, according to the present invention, the observation result at one point is compared with the simulation result of the arrival direction and intensity pattern of the radio wave observed at other points when the radio wave is emitted from the one point. And, since the point that gives the pattern of arrival direction and intensity of the radio wave that has the strongest correlation with the observation results at one of the multiple points is identified as the radio wave emission source, the database creation time by radio wave propagation simulation is shortened, The efficiency of radio wave monitoring can be improved.
[Brief description of the drawings]
FIG. 1 is a schematic view showing a radio wave monitoring method according to an embodiment of the present invention.
FIG. 2 is a block diagram showing a configuration of a radio wave monitoring apparatus according to an embodiment of the present invention.
FIG. 3 is a schematic diagram showing a radio wave propagation simulation model.
FIG. 4 is a schematic diagram showing a coordinate system for obtaining a diffraction coefficient.
FIG. 5 is a diagram illustrating estimation of directivity of a transmission antenna of a radio wave emission source.
FIG. 6 is a flowchart showing a procedure of a radio wave monitoring method according to an embodiment of the present invention.
FIG. 7 is a schematic diagram showing a three-dimensional radio wave propagation simulation model.
[Explanation of symbols]
10 ... Radio emission source
12a, 12b, 12c ... Sensor station
13a, 13b ... Building
14 ... line
16 ... Center station
18 ... Radio hologram observation and reproduction device
20 ... Simulation device
22 ... Map information storage
24 ... Radio wave propagation simulator
26 ... Database
28. Comparison part
30 ... Direction detection trace map creation part
32 ... Radio power map creation part
34 ... Trace of direction detection
36 ... Radio power map
S11, S12, S13, S14, S15 ... step
Claims (15)
Translated fromJapanese前記一の地点における観測結果を、前記一の地点から電波を発射したときに他の複数の地点において観測される電波の到来方向及び強度のパターンのシミュレーション結果と比較し、
前記複数の地点のうち前記一の地点における前記観測結果と最も相関の強い電波の到来方向及び強度のパターンを与える地点を電波発射源と特定する
ことを特徴とする電波監視方法。Observe the direction and intensity pattern of radio waves at one point,
Compare the observation result at the one point with the simulation result of the arrival direction and intensity pattern of the radio wave observed at other points when the radio wave is emitted from the one point,
A radio wave monitoring method, wherein a point giving a pattern of arrival direction and intensity of a radio wave having the strongest correlation with the observation result at the one point among the plurality of points is specified as a radio wave emission source.
前記一の地点から電波を発射したときの電波の到来方向及び強度のパターンをシミュレーションする際には、観測地域を2次元的に複数の領域に分割し、分割した各領域において観測される電界強度を計算する
ことを特徴とする電波監視方法。The radio wave monitoring method according to claim 1,
When simulating the arrival direction and intensity pattern of a radio wave when the radio wave is emitted from the one point, the observation area is divided into a plurality of areas two-dimensionally, and the electric field intensity observed in each divided area Radio wave monitoring method characterized by calculating
前記一の地点から電波を発射したときの電波の到来方向及び強度のパターンをシミュレーションする際には、観測地域を3次元的に複数の空間に分割し、分割した各空間において観測される電界強度を計算する
ことを特徴とする電波監視方法。The radio wave monitoring method according to claim 1,
When simulating the arrival direction and intensity pattern of a radio wave when the radio wave is emitted from the one point, the observation area is divided into a plurality of spaces three-dimensionally, and the electric field intensity observed in each divided space Radio wave monitoring method characterized by calculating
前記一の地点から電波を発射したときの電波の到来方向及び強度のパターンをシミュレーションする際には、前記一の地点から発射される電波の発射方向を変えて前記各領域又は前記各空間において観測される電界強度をそれぞれ計算し、電波の発射方向毎に電界強度分布を求める
ことを特徴とする電波監視方法。In the radio wave monitoring method according to claim 2 or 3,
When simulating the arrival direction and intensity pattern of a radio wave when the radio wave is emitted from the one point, observation is performed in each region or each space by changing the emission direction of the radio wave emitted from the one point. A radio wave monitoring method characterized by calculating each electric field intensity to be calculated and obtaining an electric field intensity distribution for each radio wave emission direction.
前記一の地点から電波を発射したときの電波の到来方向及び強度のパターンをシミュレーションする際には、前記観測地域の地形や地物を考慮して電波の到来経路を計算する
ことを特徴とする電波監視方法。In the radio wave monitoring method according to any one of claims 2 to 4,
When simulating the arrival direction and intensity pattern of a radio wave emitted from the one point, the radio wave arrival path is calculated in consideration of the topography and features of the observation area. Radio monitoring method.
特定された前記電波発射源の位置と前記シミュレーション結果に基づいて、前記一の地点から前記電波発射源までの電波の伝搬経路をトレースする
ことを特徴とする電波監視方法。The radio wave monitoring method according to any one of claims 1 to 5,
A radio wave monitoring method, wherein a radio wave propagation path from the one point to the radio wave emission source is traced based on the specified position of the radio wave emission source and the simulation result.
前記伝搬経路のトレース結果に基づき、前記電波発射源のアンテナ指向性を推定する
ことを特徴とする電波監視方法。The radio wave monitoring method according to claim 6, wherein
A radio wave monitoring method, wherein an antenna directivity of the radio wave emission source is estimated based on a trace result of the propagation path.
推定された前記電波発射源のアンテナ指向性に基づき、前記電波発射源から発せられた電波の電界強度分布を求める
ことを特徴とする電波監視方法。The radio wave monitoring method according to claim 7,
A radio wave monitoring method, comprising: obtaining an electric field intensity distribution of a radio wave emitted from the radio wave emission source based on the estimated antenna directivity of the radio wave emission source.
前記一の地点から電波を発射したときに他の複数の地点において観測される電波の到来方向及び強度のパターンのシミュレーション結果を記憶する記憶手段と、
前記電波観測手段における観測結果と、前記記憶手段に記憶されているシミュレーション結果とを比較し、前記複数の地点のうち前記電波観測手段における前記観測結果と最も相関の強い電波の到来方向及び強度のパターンを与える地点を電波発射源と特定する電波発射源特定手段と
を有することを特徴とする電波監視装置。A radio wave observation means for observing the arrival direction and intensity pattern of the radio wave provided at one point;
Storage means for storing a simulation result of the arrival direction and intensity pattern of radio waves observed at other points when the radio waves are emitted from the one point;
The observation result in the radio wave observation means is compared with the simulation result stored in the storage means, and the arrival direction and intensity of the radio wave having the strongest correlation with the observation result in the radio wave observation means among the plurality of points. A radio wave monitoring apparatus comprising radio wave emission source specifying means for specifying a point to which a pattern is applied as a radio wave emission source.
前記記憶手段は、観測地域を2次元的に複数の領域に分割し、前記一の地点から電波を発射したときに、分割した各領域において観測される電界強度を計算する
ことを特徴とする電波監視装置。The radio wave monitoring device according to claim 9, wherein
The storage means divides the observation area into a plurality of areas two-dimensionally, and calculates the electric field strength observed in each divided area when the radio waves are emitted from the one point. Monitoring device.
前記記憶手段は、観測地域を3次元的に複数の空間に分割し、前記一の地点から電波を発射したときに、分割した各空間において観測される電界強度を計算する
ことを特徴とする電波監視装置。The radio wave monitoring device according to claim 9, wherein
The storage means divides the observation area into a plurality of spaces three-dimensionally, and calculates the electric field intensity observed in each divided space when the radio waves are emitted from the one point. Monitoring device.
前記記憶手段は、前記一の地点から発射される電波の発射方向を変えたときに前記各領域又は前記各空間において観測される電界強度を、電波の発射方向毎に記憶する
ことを特徴とする電波監視装置。The radio wave monitoring device according to claim 10 or 11,
The storage means stores, for each emission direction of radio waves, the electric field strength observed in each area or each space when the emission direction of radio waves emitted from the one point is changed. Radio monitoring device.
前記電波発射源特定手段により特定された前記電波発射源の位置と前記シミュレーション結果に基づいて前記一の地点から前記電波発射源までの電波の伝搬経路をトレースする伝搬経路トレース手段を更に有する
ことを特徴とする電波監視装置。The radio wave monitoring apparatus according to any one of claims 9 to 12,
Propagation path tracing means for tracing a radio wave propagation path from the one point to the radio wave emission source based on the position of the radio wave emission source specified by the radio wave emission source specifying means and the simulation result. A radio wave monitoring device.
前記伝播経路トレース手段による前記伝搬経路のトレース結果に基づいて前記電波発射源のアンテナ指向性を推定するアンテナ指向性推定手段を更に有する
ことを特徴とする電波監視装置。The radio wave monitoring device according to claim 13,
The radio wave monitoring apparatus further comprising an antenna directivity estimating unit that estimates an antenna directivity of the radio wave emission source based on a result of tracing the propagation path by the propagation path tracing unit.
前記アンテナ指向性推定手段により推定された前記電波発射源のアンテナ指向性に基づいて前記電波発射源から発せられた電波の電界強度分布を求める電界強度分布算出手段を更に有する
ことを特徴とする電波監視装置。The radio wave monitoring apparatus according to claim 14,
An electric wave intensity distribution calculating means for obtaining an electric field intensity distribution of the radio wave emitted from the radio wave emission source based on the antenna directivity of the radio wave emission source estimated by the antenna directivity estimation means. Monitoring device.
Priority Applications (3)
| Application Number | Priority Date | Filing Date | Title |
|---|---|---|---|
| JP2000250028AJP3648140B2 (en) | 2000-08-21 | 2000-08-21 | Radio wave monitoring method and apparatus |
| US09/924,235US7187324B2 (en) | 2000-08-21 | 2001-08-08 | Radiowave monitoring method and apparatus |
| DE10140813ADE10140813A1 (en) | 2000-08-21 | 2001-08-20 | Radio wave monitoring method and arrangement |
Applications Claiming Priority (1)
| Application Number | Priority Date | Filing Date | Title |
|---|---|---|---|
| JP2000250028AJP3648140B2 (en) | 2000-08-21 | 2000-08-21 | Radio wave monitoring method and apparatus |
Publications (2)
| Publication Number | Publication Date |
|---|---|
| JP2002064440A JP2002064440A (en) | 2002-02-28 |
| JP3648140B2true JP3648140B2 (en) | 2005-05-18 |
Family
ID=18739676
Family Applications (1)
| Application Number | Title | Priority Date | Filing Date |
|---|---|---|---|
| JP2000250028AExpired - Fee RelatedJP3648140B2 (en) | 2000-08-21 | 2000-08-21 | Radio wave monitoring method and apparatus |
Country Status (3)
| Country | Link |
|---|---|
| US (1) | US7187324B2 (en) |
| JP (1) | JP3648140B2 (en) |
| DE (1) | DE10140813A1 (en) |
Families Citing this family (14)
| Publication number | Priority date | Publication date | Assignee | Title |
|---|---|---|---|---|
| US6580393B2 (en)* | 2001-06-25 | 2003-06-17 | Harris Corporation | System and method for determining the location of a transmitter using passive reflectors or refractors as proxy receivers and using database querying |
| US7715850B2 (en) | 2002-10-22 | 2010-05-11 | Qualcomm Incorporated | Method and apparatus for identifying transmitters in a wireless communication system using power predictions |
| GB0304861D0 (en)* | 2003-03-04 | 2003-04-09 | Koninkl Philips Electronics Nv | Object location |
| JP4544869B2 (en)* | 2004-01-22 | 2010-09-15 | 総務大臣 | Radio monitoring device used for radio wave source identification using radio holography method and MUSIC method |
| JP5170389B2 (en)* | 2005-11-21 | 2013-03-27 | 日本電気株式会社 | Identification target / position estimation system, method and program thereof |
| DE102006014546B4 (en)* | 2006-03-21 | 2010-08-19 | Universität Tübingen | Method and device for sensor-based monitoring of an environment |
| WO2008011712A1 (en)* | 2006-07-28 | 2008-01-31 | Michael Tin Yau Chan | Wide-area wireless network topology |
| US7764230B2 (en)* | 2007-03-13 | 2010-07-27 | Alcatel-Lucent Usa Inc. | Methods for locating transmitters using backward ray tracing |
| JP4940106B2 (en)* | 2007-11-01 | 2012-05-30 | クラリオン株式会社 | Broadcast signal receiver test equipment |
| DE102008002892B3 (en)* | 2008-06-18 | 2009-12-31 | Forschungszentrum Karlsruhe Gmbh | Method of determining soil properties using free radio waves |
| JP5301521B2 (en)* | 2010-12-03 | 2013-09-25 | ブラザー工業株式会社 | Radio wave estimation method, radio wave estimation program, and radio wave estimation apparatus |
| JP5605712B2 (en)* | 2011-05-24 | 2014-10-15 | 日本電信電話株式会社 | Arrival direction estimation apparatus, arrival direction estimation method, and arrival direction estimation program |
| CN117580081B (en)* | 2024-01-15 | 2024-03-19 | 成都大公博创信息技术有限公司 | Major activity guarantee command control system |
| CN118624999B (en)* | 2024-08-13 | 2024-11-08 | 中国电子工程设计院股份有限公司 | A GIS-based electromagnetic map drawing system and its control method |
Family Cites Families (9)
| Publication number | Priority date | Publication date | Assignee | Title |
|---|---|---|---|---|
| JP3256085B2 (en)* | 1994-06-21 | 2002-02-12 | 株式会社日立製作所 | Radio reception strength simulation method |
| GB2311697B (en)* | 1996-03-22 | 1999-07-28 | Matsushita Electric Industrial Co Ltd | Wireless communication system and method and system for detection of position of radio mobile station |
| US6249680B1 (en)* | 1997-01-08 | 2001-06-19 | U.S. Wireless Corporation | Radio transmitter location finding in CDMA wireless communication systems |
| US6026304A (en)* | 1997-01-08 | 2000-02-15 | U.S. Wireless Corporation | Radio transmitter location finding for wireless communication network services and management |
| JP3718342B2 (en) | 1998-05-12 | 2005-11-24 | 株式会社アドバンテスト | Wide area radio wave monitoring method and apparatus |
| US6496701B1 (en)* | 1998-08-25 | 2002-12-17 | Lucent Technologies Inc. | Pattern-recognition-based geolocation |
| US6393294B1 (en)* | 1998-09-22 | 2002-05-21 | Polaris Wireless, Inc. | Location determination using RF fingerprinting |
| FI107366B (en)* | 1998-10-29 | 2001-07-13 | Nokia Networks Oy | Method and apparatus for implementing networks |
| US6487417B1 (en)* | 1999-11-24 | 2002-11-26 | Verizon Laboratories Inc. | Method and system for characterizing propagation of radiofrequency signal |
- 2000
- 2000-08-21JPJP2000250028Apatent/JP3648140B2/ennot_activeExpired - Fee Related
- 2001
- 2001-08-08USUS09/924,235patent/US7187324B2/ennot_activeExpired - Fee Related
- 2001-08-20DEDE10140813Apatent/DE10140813A1/ennot_activeWithdrawn
Also Published As
| Publication number | Publication date |
|---|---|
| US7187324B2 (en) | 2007-03-06 |
| JP2002064440A (en) | 2002-02-28 |
| US20020115411A1 (en) | 2002-08-22 |
| DE10140813A1 (en) | 2002-04-25 |
Similar Documents
| Publication | Publication Date | Title |
|---|---|---|
| JP3648140B2 (en) | Radio wave monitoring method and apparatus | |
| Porter | Beam tracing for two-and three-dimensional problems in ocean acoustics | |
| CN102239426B (en) | Provision of image data | |
| Bell et al. | Simulation and analysis of synthetic sidescan sonar images | |
| US20150294041A1 (en) | Methods, systems, and computer readable media for simulating sound propagation using wave-ray coupling | |
| Potokar et al. | HoloOcean: Realistic sonar simulation | |
| CN105388478A (en) | Method and arrangement for detecting acoustic and optical information as well as a corresponding computer program and a corresponding computer-readable storage medium | |
| Fernandez Comesana | Scan-based sound visualisation methods using sound pressure and particle velocity | |
| CN102901950B (en) | Method for recognizing three-dimensional coordinates of sound sources via planar arrays | |
| JP3718342B2 (en) | Wide area radio wave monitoring method and apparatus | |
| MX2013015016A (en) | A 4d repeatability indicator based on shot illumination for seismic acquisition. | |
| Åström et al. | Extension of time-difference-of-arrival self calibration solutions using robust multilateration | |
| KR100948186B1 (en) | Apparatus, method and computer-executable recording medium for generating propagation model using 3D ray tracing method | |
| Zhao et al. | Efficient prediction of individual head-related transfer functions based on 3D meshes | |
| Bell | Application of optical ray tracking techniques to the simulation of sonar images | |
| Mo et al. | Outdoor sound propagation with analytic ray curve tracer and Gaussian beam | |
| Garcia-Requejo et al. | Ultrasonic device-free localisation system modelling for performance analysis | |
| Dockery | Development and use of electromagnetic parabolic equation propagation models for U. S. Navy applications | |
| Mock et al. | Radarays: Real-time simulation of rotating FMCW radar for mobile robotics via hardware-accelerated ray tracing | |
| Bai et al. | Modeling early reflections of room impulse responses using a radiance transfer method | |
| Li et al. | A high-precision method for extracting polarization angle under the condition of subsurface wavefield aliasing | |
| Sevgi | Teaching electromagnetics via virtual tools | |
| Demontis et al. | 3D identification of acoustic sources in rooms using a large-scale microphone array | |
| US7130243B2 (en) | Location finding system, using reflected radio frequency or acoustic signals in a crowded reflector environment | |
| Guériot et al. | Sonar data simulation |
Legal Events
| Date | Code | Title | Description |
|---|---|---|---|
| A621 | Written request for application examination | Free format text:JAPANESE INTERMEDIATE CODE: A621 Effective date:20040318 | |
| A977 | Report on retrieval | Free format text:JAPANESE INTERMEDIATE CODE: A971007 Effective date:20041228 | |
| TRDD | Decision of grant or rejection written | ||
| A01 | Written decision to grant a patent or to grant a registration (utility model) | Free format text:JAPANESE INTERMEDIATE CODE: A01 Effective date:20050208 | |
| A61 | First payment of annual fees (during grant procedure) | Free format text:JAPANESE INTERMEDIATE CODE: A61 Effective date:20050210 | |
| R150 | Certificate of patent or registration of utility model | Free format text:JAPANESE INTERMEDIATE CODE: R150 | |
| FPAY | Renewal fee payment (event date is renewal date of database) | Free format text:PAYMENT UNTIL: 20090218 Year of fee payment:4 | |
| FPAY | Renewal fee payment (event date is renewal date of database) | Free format text:PAYMENT UNTIL: 20090218 Year of fee payment:4 | |
| FPAY | Renewal fee payment (event date is renewal date of database) | Free format text:PAYMENT UNTIL: 20100218 Year of fee payment:5 | |
| FPAY | Renewal fee payment (event date is renewal date of database) | Free format text:PAYMENT UNTIL: 20110218 Year of fee payment:6 | |
| FPAY | Renewal fee payment (event date is renewal date of database) | Free format text:PAYMENT UNTIL: 20120218 Year of fee payment:7 | |
| FPAY | Renewal fee payment (event date is renewal date of database) | Free format text:PAYMENT UNTIL: 20120218 Year of fee payment:7 | |
| FPAY | Renewal fee payment (event date is renewal date of database) | Free format text:PAYMENT UNTIL: 20130218 Year of fee payment:8 | |
| FPAY | Renewal fee payment (event date is renewal date of database) | Free format text:PAYMENT UNTIL: 20140218 Year of fee payment:9 | |
| LAPS | Cancellation because of no payment of annual fees |