JP3619969B2 - Light sensor with multiple light sources - Google Patents
Light sensor with multiple light sourcesDownload PDFInfo
- Publication number
- JP3619969B2 JP3619969B2JP33254294AJP33254294AJP3619969B2JP 3619969 B2JP3619969 B2JP 3619969B2JP 33254294 AJP33254294 AJP 33254294AJP 33254294 AJP33254294 AJP 33254294AJP 3619969 B2JP3619969 B2JP 3619969B2
- Authority
- JP
- Japan
- Prior art keywords
- light
- frequency
- sensor
- light source
- tissue
- Prior art date
- Legal status (The legal status is an assumption and is not a legal conclusion. Google has not performed a legal analysis and makes no representation as to the accuracy of the status listed.)
- Expired - Fee Related
Links
- INGWEZCOABYORO-UHFFFAOYSA-N2-(furan-2-yl)-7-methyl-1h-1,8-naphthyridin-4-oneChemical compoundN=1C2=NC(C)=CC=C2C(O)=CC=1C1=CC=CO1INGWEZCOABYORO-UHFFFAOYSA-N0.000claimsabstractdescription16
- 108010064719OxyhemoglobinsProteins0.000claimsabstractdescription16
- 108010002255deoxyhemoglobinProteins0.000claimsabstractdescription16
- 230000003287optical effectEffects0.000claimsdescription22
- 238000010521absorption reactionMethods0.000claimsdescription17
- 230000010363phase shiftEffects0.000claimsdescription11
- 230000001427coherent effectEffects0.000claimsdescription6
- 238000000034methodMethods0.000abstractdescription30
- WQZGKKKJIJFFOK-GASJEMHNSA-NGlucoseNatural productsOC[C@H]1OC(O)[C@H](O)[C@@H](O)[C@@H]1OWQZGKKKJIJFFOK-GASJEMHNSA-N0.000abstractdescription28
- 239000008103glucoseSubstances0.000abstractdescription28
- 239000000463materialSubstances0.000abstractdescription21
- 238000005558fluorometryMethods0.000abstract1
- 238000005539phosphorimetryMethods0.000abstract1
- 210000001519tissueAnatomy0.000description53
- 238000005259measurementMethods0.000description19
- 239000002609mediumSubstances0.000description19
- 239000000126substanceSubstances0.000description11
- 239000000839emulsionSubstances0.000description10
- 230000008859changeEffects0.000description9
- 239000008280bloodSubstances0.000description8
- 210000004369bloodAnatomy0.000description8
- 239000002207metaboliteSubstances0.000description8
- 108010054147HemoglobinsProteins0.000description7
- 102000001554HemoglobinsHuman genes0.000description7
- 238000012544monitoring processMethods0.000description7
- 239000012071phaseSubstances0.000description7
- QVGXLLKOCUKJST-UHFFFAOYSA-Natomic oxygenChemical compound[O]QVGXLLKOCUKJST-UHFFFAOYSA-N0.000description6
- 230000008033biological extinctionEffects0.000description6
- 239000013307optical fiberSubstances0.000description6
- 229910052760oxygenInorganic materials0.000description6
- 239000001301oxygenSubstances0.000description6
- 239000002960lipid emulsionSubstances0.000description5
- 238000005375photometryMethods0.000description4
- 230000008569processEffects0.000description4
- 210000000689upper legAnatomy0.000description4
- 238000002835absorbanceMethods0.000description3
- 239000008346aqueous phaseSubstances0.000description3
- 239000004020conductorSubstances0.000description3
- 206010012601diabetes mellitusDiseases0.000description3
- 239000002245particleSubstances0.000description3
- 230000000287tissue oxygenationEffects0.000description3
- XLYOFNOQVPJJNP-UHFFFAOYSA-NwaterSubstancesOXLYOFNOQVPJJNP-UHFFFAOYSA-N0.000description3
- 230000002238attenuated effectEffects0.000description2
- 230000004888barrier functionEffects0.000description2
- WQZGKKKJIJFFOK-VFUOTHLCSA-Nbeta-D-glucoseChemical compoundOC[C@H]1O[C@@H](O)[C@H](O)[C@@H](O)[C@@H]1OWQZGKKKJIJFFOK-VFUOTHLCSA-N0.000description2
- 230000000875corresponding effectEffects0.000description2
- 230000007423decreaseEffects0.000description2
- 238000001514detection methodMethods0.000description2
- 238000010586diagramMethods0.000description2
- 238000009792diffusion processMethods0.000description2
- 210000000245forearmAnatomy0.000description2
- 238000001990intravenous administrationMethods0.000description2
- 125000001820oxy groupChemical group[*:1]O[*:2]0.000description2
- 238000011002quantificationMethods0.000description2
- 230000035945sensitivityEffects0.000description2
- 239000007787solidSubstances0.000description2
- 238000012360testing methodMethods0.000description2
- BMUDPLZKKRQECS-UHFFFAOYSA-K3-[18-(2-carboxyethyl)-8,13-bis(ethenyl)-3,7,12,17-tetramethylporphyrin-21,24-diid-2-yl]propanoic acid iron(3+) hydroxideChemical class[OH-].[Fe+3].[N-]1C2=C(C)C(CCC(O)=O)=C1C=C([N-]1)C(CCC(O)=O)=C(C)C1=CC(C(C)=C1C=C)=NC1=CC(C(C)=C1C=C)=NC1=C2BMUDPLZKKRQECS-UHFFFAOYSA-K0.000description1
- 210000001015abdomenAnatomy0.000description1
- 238000000862absorption spectrumMethods0.000description1
- 230000004913activationEffects0.000description1
- 239000012736aqueous mediumSubstances0.000description1
- 238000000149argon plasma sinteringMethods0.000description1
- 239000003809bile pigmentSubstances0.000description1
- 230000005540biological transmissionEffects0.000description1
- 230000017531blood circulationEffects0.000description1
- 230000037396body weightEffects0.000description1
- 238000005282brighteningMethods0.000description1
- 239000013626chemical specieSubstances0.000description1
- 238000012937correctionMethods0.000description1
- 230000002596correlated effectEffects0.000description1
- 238000013480data collectionMethods0.000description1
- 239000003814drugSubstances0.000description1
- 230000000694effectsEffects0.000description1
- 230000005670electromagnetic radiationEffects0.000description1
- 239000000835fiberSubstances0.000description1
- 230000037406food intakeEffects0.000description1
- 238000003384imaging methodMethods0.000description1
- 229940028435intralipidDrugs0.000description1
- 230000031700light absorptionEffects0.000description1
- 150000002632lipidsChemical class0.000description1
- 238000012986modificationMethods0.000description1
- 230000004048modificationEffects0.000description1
- 210000003205muscleAnatomy0.000description1
- 230000001019normoglycemic effectEffects0.000description1
- 230000036284oxygen consumptionEffects0.000description1
- 230000006461physiological responseEffects0.000description1
- 230000002035prolonged effectEffects0.000description1
- 238000002310reflectometryMethods0.000description1
- 230000000241respiratory effectEffects0.000description1
- 230000033764rhythmic processEffects0.000description1
- 238000005070samplingMethods0.000description1
- 239000000243solutionSubstances0.000description1
- 235000012424soybean oilNutrition0.000description1
- 239000003549soybean oilSubstances0.000description1
- 241000894007speciesSpecies0.000description1
- 238000007619statistical methodMethods0.000description1
Images


Classifications
- G—PHYSICS
- G01—MEASURING; TESTING
- G01N—INVESTIGATING OR ANALYSING MATERIALS BY DETERMINING THEIR CHEMICAL OR PHYSICAL PROPERTIES
- G01N21/00—Investigating or analysing materials by the use of optical means, i.e. using sub-millimetre waves, infrared, visible or ultraviolet light
- G01N21/17—Systems in which incident light is modified in accordance with the properties of the material investigated
- G01N21/25—Colour; Spectral properties, i.e. comparison of effect of material on the light at two or more different wavelengths or wavelength bands
- G01N21/31—Investigating relative effect of material at wavelengths characteristic of specific elements or molecules, e.g. atomic absorption spectrometry
- G01N21/314—Investigating relative effect of material at wavelengths characteristic of specific elements or molecules, e.g. atomic absorption spectrometry with comparison of measurements at specific and non-specific wavelengths
- A—HUMAN NECESSITIES
- A61—MEDICAL OR VETERINARY SCIENCE; HYGIENE
- A61B—DIAGNOSIS; SURGERY; IDENTIFICATION
- A61B5/00—Measuring for diagnostic purposes; Identification of persons
- A61B5/0059—Measuring for diagnostic purposes; Identification of persons using light, e.g. diagnosis by transillumination, diascopy, fluorescence
- A—HUMAN NECESSITIES
- A61—MEDICAL OR VETERINARY SCIENCE; HYGIENE
- A61B—DIAGNOSIS; SURGERY; IDENTIFICATION
- A61B5/00—Measuring for diagnostic purposes; Identification of persons
- A61B5/145—Measuring characteristics of blood in vivo, e.g. gas concentration or pH-value ; Measuring characteristics of body fluids or tissues, e.g. interstitial fluid or cerebral tissue
- A61B5/14532—Measuring characteristics of blood in vivo, e.g. gas concentration or pH-value ; Measuring characteristics of body fluids or tissues, e.g. interstitial fluid or cerebral tissue for measuring glucose, e.g. by tissue impedance measurement
- A—HUMAN NECESSITIES
- A61—MEDICAL OR VETERINARY SCIENCE; HYGIENE
- A61B—DIAGNOSIS; SURGERY; IDENTIFICATION
- A61B5/00—Measuring for diagnostic purposes; Identification of persons
- A61B5/145—Measuring characteristics of blood in vivo, e.g. gas concentration or pH-value ; Measuring characteristics of body fluids or tissues, e.g. interstitial fluid or cerebral tissue
- A61B5/1455—Measuring characteristics of blood in vivo, e.g. gas concentration or pH-value ; Measuring characteristics of body fluids or tissues, e.g. interstitial fluid or cerebral tissue using optical sensors, e.g. spectral photometrical oximeters
- A61B5/14551—Measuring characteristics of blood in vivo, e.g. gas concentration or pH-value ; Measuring characteristics of body fluids or tissues, e.g. interstitial fluid or cerebral tissue using optical sensors, e.g. spectral photometrical oximeters for measuring blood gases
- A61B5/14552—Details of sensors specially adapted therefor
- G—PHYSICS
- G01—MEASURING; TESTING
- G01N—INVESTIGATING OR ANALYSING MATERIALS BY DETERMINING THEIR CHEMICAL OR PHYSICAL PROPERTIES
- G01N21/00—Investigating or analysing materials by the use of optical means, i.e. using sub-millimetre waves, infrared, visible or ultraviolet light
- G01N21/17—Systems in which incident light is modified in accordance with the properties of the material investigated
- G01N21/47—Scattering, i.e. diffuse reflection
- G01N21/49—Scattering, i.e. diffuse reflection within a body or fluid
- A—HUMAN NECESSITIES
- A61—MEDICAL OR VETERINARY SCIENCE; HYGIENE
- A61B—DIAGNOSIS; SURGERY; IDENTIFICATION
- A61B2562/00—Details of sensors; Constructional details of sensor housings or probes; Accessories for sensors
- A61B2562/02—Details of sensors specially adapted for in-vivo measurements
- A61B2562/0233—Special features of optical sensors or probes classified in A61B5/00
- A—HUMAN NECESSITIES
- A61—MEDICAL OR VETERINARY SCIENCE; HYGIENE
- A61B—DIAGNOSIS; SURGERY; IDENTIFICATION
- A61B2562/00—Details of sensors; Constructional details of sensor housings or probes; Accessories for sensors
- A61B2562/04—Arrangements of multiple sensors of the same type
- A61B2562/046—Arrangements of multiple sensors of the same type in a matrix array
- A—HUMAN NECESSITIES
- A61—MEDICAL OR VETERINARY SCIENCE; HYGIENE
- A61B—DIAGNOSIS; SURGERY; IDENTIFICATION
- A61B5/00—Measuring for diagnostic purposes; Identification of persons
- A61B5/68—Arrangements of detecting, measuring or recording means, e.g. sensors, in relation to patient
- A61B5/6801—Arrangements of detecting, measuring or recording means, e.g. sensors, in relation to patient specially adapted to be attached to or worn on the body surface
- A61B5/6813—Specially adapted to be attached to a specific body part
- A61B5/6824—Arm or wrist
Landscapes
- Health & Medical Sciences (AREA)
- Physics & Mathematics (AREA)
- Life Sciences & Earth Sciences (AREA)
- Pathology (AREA)
- General Health & Medical Sciences (AREA)
- Spectroscopy & Molecular Physics (AREA)
- Biomedical Technology (AREA)
- Biophysics (AREA)
- Medical Informatics (AREA)
- Molecular Biology (AREA)
- Surgery (AREA)
- Animal Behavior & Ethology (AREA)
- Engineering & Computer Science (AREA)
- Public Health (AREA)
- Veterinary Medicine (AREA)
- Heart & Thoracic Surgery (AREA)
- Optics & Photonics (AREA)
- Chemical & Material Sciences (AREA)
- Analytical Chemistry (AREA)
- Biochemistry (AREA)
- General Physics & Mathematics (AREA)
- Immunology (AREA)
- Emergency Medicine (AREA)
- Measurement Of The Respiration, Hearing Ability, Form, And Blood Characteristics Of Living Organisms (AREA)
- Investigating Or Analysing Materials By Optical Means (AREA)
- Investigating Or Analysing Biological Materials (AREA)
Abstract
Description
Translated fromJapanese【0001】
【産業上の利用分野】
組織の光学的性質の判定は、医療の多くの分野において、診断及びモニタリング目的での基本的重要性を有している。種々の組織において異なった波長の光が異なった浸透性を有するということはよく知られている。例えば近赤外領域(約650 nm乃至約1000nm)においては、この波長の光は組織に数センチメート浸透する。本明細書において、術語「光」は、赤外線及び紫外線のようなヒトの目には見えない他の電磁放射をも包含する。
【0002】
【従来の技術】
様々な光が有する、組織内へに数センチメートル浸透する能力のため、1つ又はより多くの波長において光の吸収を測定することによって測光法又は分光光度法をヘモグロビンのような組織の代謝物の濃度を測定するために用いることができる。臨床目的で組織の光学的性質を測定する装置は、所望のパラメーター、例えばオキシヘモグロビン若しくはデオキシヘモグロビン、グルコースその他の代謝物の量的情報を提供することが望ましく且つ重要である。
【0003】
通常の手技においては、既知の厚みのサンプルを透過した光の測定によって、ある物質の濃度の絶対的測定を行うことができる。そのような透過光の測定は、吸光係数を決定することを可能にする。これを用いて、測定された物質の濃度をBeer−Lambert則によってその物質の分子消衰係数を用いて計算することができる。
【0004】
媒質中に存在している1つより多い物質による妨害のある場合には、それらの物質が異なった吸収スペクトルを有すると仮定すれば、異なった波長での測定を用いて、媒質中に存在している1つ又はより多くの化学種の濃度を定量するための方法を提供することができる。この方法の成功の如何は、測定の精度と存在している異なった物質の数とに依存している。
【0005】
組織や、例えばエマルジョン等のような他の混濁度の高い材料の測光法においては、更なる問題が生ずる。この開示の目的のためには、術語「組織」は、生きた材料を包含するが、更には、例えばエマルジョンから、組織について本発明によって行われるのと類似のデータを得たい場合には、そのようなエマルジョン等の生きていない材料をも含み得るものと理解しなければならない。光が完全に組織を通過して反対側で検出できるような特別な身体の薄い領域を除いては、先行技術においては、組織の平板を透過した光の測定は、非侵襲的方法を用いては実際的ではなかった。この一例は、臨床的に用いられている測光法的血中酸素センサーであり、それは、指先に密着して直接それに光を通過させてリアルタイムの酸素濃度データを与える。
【0006】
組織測光法においては、透過光の量は、分析対象たる媒質の吸収のみでなく、その散乱的性質にも依存している。この光散乱は、組織、エマルジョン及び同様の材料の測光法分析の複雑さを非常に大きくする。それは、散乱光は、透過光の量に対し、組織その他の種々のサンプル間で相当に変動し得る予測できない変動を与えるからである。
【0007】
多くの異なった方法が、この測光法的方法における散乱の問題を処理するために提案されてきた。例えば、測定すべき組織のタイプに基づいた経験的補正が、吸収特性に対する散乱の影響を処理するために用いられてきた。反射光測定のためには、表面の反射能の計算をするために理論的モデルが使用されてきた。これらの原理に基づく市販の機器はあるものの、これら全てのモデルは余り成功していない。主たる問題点は、組織中の一物質の濃度の適正な予測を得るためには、対応する組織サンプルの大きな数の統計的分析に基づいて何らかの先験的な較正を実施しなければならないことである。しかしながら、種々の個体から得られた組織内における散乱の変動の幅は、測光法結果が皮膚の色、筋肉中の脂質量のような諸因子によって強く影響されることで、基本的に予測不能の結果をもたらす。
【0008】
1990年に日本の浜松社は、新生児モニタリングのための組織の酸素化及び全血量の測定用に、NIRO 500と呼ばれる簡単な組織分光光度計を導入した。この装置の原理は、Copeの米国特許第5,032,024 号に開示されている。この機器は、定常状態機器であり、近赤外領域において発光する4つの異なったレーザーダイオードに基づいている。その光は、光ファイバーシステムを用いて組織へ誘導される。その測定は純粋に定常状態のものであり、組織中の光路の長さは測定できない。従って、本発明とは逆に、オキシ及びデオキシヘモグロビンの絶対量ではなしに、単に相対量が得られるのみである。
【0009】
【発明が解決しようとする課題】
本発明により、高度に混濁した媒質中に混ざり合っている材料の絶対量の濃度が、定量的な仕方で測定できる。特に、本発明によって、オキシ及びデオキシヘモグロビン、グルコースその他のような組織の代謝物が、連続的にリアルタイムで定量的に測定できる。これは、組織の狭い部分、例えば指のような末端に光を通す必要なしに達成できる。寧ろ、代謝物の濃度その他のパラメーターの定量のために、センサーを、身体の一層中心の領域に配置することができる。これは非侵襲的方法によって、本質的に即時に達成できる。また、存在している種々の代謝物を、選択的に且つ定量的に、本質的に即時に測定することができる。
【0010】
グルコースのようなある種の物質は、組織を通した光の測光法的定量のために使用することのできる便利な光の波長においては、強い吸収線を欠いている。この情況において、組織中又はエマルジョン材料中のグルコースその他の代謝物の濃度を測光法的に定量するという問題は、非常に困難なものになる。
【0011】
本発明により、高度に散乱性の媒質の成分(例えば組織中のグルコースの濃度)を、モニターされる材料によって強く吸収される光のバンドがない場合において、測光法の技術によって相対濃度ベースでリアルタイムに定量しモニターすることのできる方法が提供される。
【0012】
【課題を解決するための手段】
本発明により、患者の組織のような高度に混濁した媒質中の物質の存在及び濃度について、次の段階を含んでなる方法によって分析することができる。すなわち、1つの光センサーから異なった距離だけ離してある複数の光源を逐次的に点滅させつつ該光源からの光の強度を第1の周波数で変調し、そして該変調された光を試験のための混濁したサンプルを通して当該センサーへ伝える。また、この変調された光とコヒーレントな第2の周波数の信号を該光センサーに提供して、該コヒーレントな信号によって、該第1の周波数と異なった該第2の周波数で該光センサーの利得を変調し又は出力を増幅する。次いで、該変調された光を受信しながら、該センサーから結果の信号を導き出す(該結果の信号は、該第1の周波数と該第2の周波数との差の周波数を有する)。これから、センサーによって感知された変調された光の次の特性のうち少なくとも2つを検出することが可能となる。すなわち、位相ずれ成分、DC成分、及びAC成分である。
【0013】
術語「DC成分」及び「AC成分」は、光源からの光の振幅の異なった部分を規定する。特に、先に記述したように、光源からの光は、強度が振幅変調されたものであり、それにより第1の周波数のサイクルで明るくそして薄暗くなる。この周波数は、光の強度の揺らぎが目には見えないほど、典型的には非常に早い(例えば80乃至200 MHz)。光のAC成分は、サイクルの頂点からサイクルの谷までの光の強度の変化よりなる。すなわち、光が振幅変調の急速なサイクルを経る際の光の強度の最大の変化である。DC成分は、ゼロから最低強度まで測定された、光が常に有する強度部分であり、それは勿論、振幅変調によって光 に課された波のパターンの谷の底に観測される。
【0014】
従って、光信号の最大強度(それは各波の頂点において観測される)は、DC成分とAC成分との和である。振幅変調されたサイクルにおける光の最小強度は、DC成分のみである。
【0015】
本発明によれば、振幅変調された光がヒトの組織又は他の高度に混濁した材料を通ってセンサーに至る際に、該振幅変調された光信号の位相が偏移し、DC成分及びAC成分が減衰する。この情報から、組織中に存在するある種の物質の濃度に関する量的情報を、リアルタイムでまたは各瞬間ごとのベースで得ることが可能である。
【0016】
これは好ましくは、光センサーから異なった距離にある複数の光源を逐次的に点滅させることによって達成される。こうして、異なった距離にある複数の光源の各々から提供されるデータによって、位相ずれ、DC成分及び/又はAC成分についての異なった値が、特徴的な勾配を有する直線的なグラフデータを算出するために、各光源について別々に測定される。一旦それらの勾配が知られると、用いられた光の波長において、散乱及び吸収係数の値が算出できる。これらの値から、特に2つの異なった波長において、オキシヘモグロビン、デオキシヘモグロビン、及び/又はグルコース等のような存在する材料の絶対濃度を算出することができる。一旦、例えばオキシヘモグロビン及びデオキシヘモグロビンの濃度が知られると、患者の酸素飽和及び血液量を算出することができる。
【0017】
これは、マイクロプロセッサー等によって非常に素早く達成することができ、それにより、単にセンサーのヘッドを患者の皮膚に当てるだけで、光が患者の組織を完全に通過して反対側へ至る必要なしに、各値をリアルタイムで医者又は看護婦に対して表示することができる。
【0018】
グルコースのような材料の濃度は、散乱係数の変化をモニターすることによって定量することができる。散乱係数は、用いられる光の波長において分析対象である材料が特徴的な強い吸収バンドを有しないでも、測定することができる。本発明の操作につき特定の理論に依存する意思はないが、組織のような高度に散乱性の媒質中において、散乱係数は、グルコースその他の試験材料の濃度に依存すると信じられている。存在するグルコースの濃度の変化は、高度に散乱性の媒質のうち水性部分の屈折率を変化させる。例えば、水性の脂肪エマルジョン中に存在するグルコースの濃度がモニターされているならば、該エマルジョンの脂肪相は、例えば1.42の屈折率を有するであろう。これは大豆油の屈折率である。該エマルジョンの水相の屈折率は、約1.33である。異なった濃度のグルコースを含有する水の屈折率は、ある幅にわたって変化し、それは該エマルジョン全体の散乱特性を変化させるであろう。こうして、混濁した媒質の散乱係数は、存在するグルコースの濃度と共に変動する。
【0019】
該水性媒質の屈折率が懸濁粒子の屈折率に一致すると、散乱は消失する。従って、媒質中の散乱粒子の屈折率が一定であるならば、該媒質の散乱係数は、該培地の残り部分の屈折率の関数となる。こうして、散乱性媒質の水性部分に含まれるグルコースその他の材料の濃度を、ベースラインデータとの比較によるか又は(一層単純なエマルジョンの場合には)予め計算された測定値の表によって、散乱係数から決定することができる。
【0020】
典型的には、種々の組織サンプルの散乱特性の変動性の観点から、ベースラインデータとの比較によりグルコースその他の材料の濃度の相対的変化をモニターする事ができるよう、同じ組織について取られたベースラインデータを使用する。こうして、例えば糖尿病患者が、単に測光法ヘッドを自分の体の同じ部分、例えば前腕又は腿に当てることによって、自分の血糖値を反復的にモニターすることができる。散乱係数は、該測光法装置中のソフトウェアにより、各読み取り毎に算出することができる。糖尿病の患者に、例えば、血糖レベルの変化について一日を通して頻繁に自らをモニターする機会を与えるために、散乱係数の如何なる変化も、何らかの慣用の警告モードによって示すことができる。
【0021】
本発明における光を検出するためのセンサーは、組織中で散乱した光を検出することができ、それにより光源からセンサーまでの光路は直線的である必要がない。実際、光の放射方向と光感知の一般的方向は、ここに開示するセンサーヘッドの特定の具体例によって示されるように、平行であってよい。
【0022】
好ましくは、ここに用いられる光を感知するためのセンサーは、共通のセンサーヘッド中に、センサーと並んで光源並びに、患者の組織を介さないで光源から光センサーに光が直接アクセスするのを阻止するための、遮蔽物を有するものであってもよい。
【0023】
本発明のセンサー装置は、光センサーからの距離を異にする複数の光源の各々からの別々の信号によって与えられる位相ずれ成分、DC成分、及びAC成分のうち少なくとも2つの勾配を算出するための電子的プロセッサーを有していてもよい。これにより、該プロセッサーは、該組織の散乱係数及び吸収係数も算出することができる。これにより、例えば、組織中に存在するオキシヘモグロビン及びデオキシヘモグロビンのうち少なくとも1つの絶対濃度を、典型的には吸光度係数から算出することができる。センサー装置は、次いで、そのような濃度をリアルタイムな値として表示するための手段を有していてよい。
【0024】
光源からの光の強度は、好ましくは、約50乃至150 MHzにて振幅変調される。第2の信号の有する第2の周波数は、同じオーダーではあるが、第1の周波数からは典型的には約10Hz乃至100 KHzだけ異なっている。
【0025】
典型的には、用いられる光は約650 nm乃至約1000nmの波長のものであり、光センサーからの距離を異にする少なくとも3つの光源が備えられている。しかしながら、光源が一対の列をなした状態で、そして各一対の光源が該光センサーから同じ距離に備えられているよう、距離を異にする少なくとも6つの光源が備えられていることが好ましい。これは、異なった光の波長において同時にデータを収集することを可能にし、この異なった波長の光は各々、一層正確なデータ収集のために、該列をなした光源の各々一つの列から放射される。
【0026】
該複数の光源の各々は、上述の第1の周波数と第2の周波数との差よりなる周波数(「相互相関周波数」という。)を有する波の周期の正確な倍数である一定の時間長にわたって、逐次的に活性化(発光)されることが好ましい。
【0027】
また、各光源から受け取られる測光法情報の増強された平均を得るために、該光センサーによって感知された情報は、合計され8乃至800 回の反復から平均されることができる。
【0028】
典型的には、本発明の方法及び装置は、周知の周波数領域蛍光測定法及び/又は燐光測定法の原理を用いており、それは、例えば取り分け、Gratton の米国特許第4,840,485 号、第5,212,386 号及び第5,323,010 号に開示されている。
【0029】
更に本発明により、患者の組織のような混濁した媒質中の材料の相対濃度を、次の方法によって測定することができる。該方法は、すなわち、該混濁した媒質内へ光を照射し、該混濁した媒質を通過した光の散乱係数を測定し、該散乱係数を該組織に関して測定されている従前の散乱係数と比較することよりなる。
【0030】
混濁した媒質中の多くの材料が、該材料の濃度が変化するとき、該混濁した媒質を通過する光の散乱係数の変化を引き起こすことが見いだされている。特に、生きた患者の組織中のグルコースの濃度については、そのようなモニタリングが可能である。その方法は、好ましくは、生きた組織中の水相中の、又はエマルジョンの水相中の溶質について適用できる。該方法は、溶質が強く吸収する波長における測光法的測定が不都合な情況においては、特に有利である。
【0031】
こうして、患者のグルコースのレベルを、本発明の方法により測光法によってモニターすることができる。本方法は定量的でなく、そのため結果を患者の同じ組織又は他の測定用サンプルについて測定された散乱係数データのベースラインと比較することが非常に望ましい。こうして、正常の散乱係数を測定でき、それにより、将来の測定値、例えば糖尿病患者のグルコースレベルを、光セルとセンサーとを患者の皮膚、例えば腿、前腕又は腹部に単に当てることにより、モニターすることができる。散乱係数について認識された、ベースライン値からの如何なる変化も、グルコース量の変化を示すものであり、処置をするよう患者に警告を与えるのに役立つ。
【0032】
好ましくは、患者の組織等のような高度に混濁した媒質中のそのような物質の存在及び濃度について、次の方法により分析することができる。該方法は、1つの光センサーから異なった距離で離してある複数の光源を逐次的に点滅させつつ該光源からの光の強度を第1の周波数で変調し、そして該変調された光を混濁したサンプルを通して当該センサーへ伝える。また、この変調された光とコヒーレントな、該第1の周波数と異なった第2の周波数の信号を該光センサーに提供して、該コヒーレントな信号によって該光センサーの利得を変調し又は出力を増幅する。次いで、該変調された光を受信しながら、該センサーから結果の信号を導き出す(該結果の信号は、該第1の周波数と該第2の周波数との差の周波数である)。これから、センサーによって感知された変調された光の次の特性のうち少なくとも2つを検出することが可能となる。すなわち、位相ずれ成分、DC成分、及びAC成分である。これらは、光源によって元々放射されたものとしての該変調された光の対応する成分と比較される。
【0033】
【実施例】
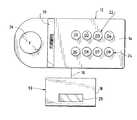
図面において、非侵襲的且つ定量的にリアルタイムで患者の生きた組織中のオキシヘモグロビン及びデオキシヘモグロビンの濃度を測定するためのセンサー装置が示されている。センサー機器10は、センサーヘッド12を含んでなり、該センサーヘッドは、平らでも又は、患者の腕、腿、胸その他の輪郭と一層よく接触するよう彎曲していてもよいセンサー面14を有する本体を含んでなる。センサーヘッド12は、センサー面14と共に、患者の皮膚に密着するよう配置されている。ケーブル16は、光学的及び電子的信号をプロセッサーユニット18へ送るための光ファイバー及び電気的導線の双方を含んでいる。代わりとしては、該光検出器は、センサーヘッド上に配置されていてもよくケーブル16は光ファイバーを含まなくてもよい。データは、慣用の仕方で読み取り窓20に表示することができる。
【0034】
センサーヘッド12は、それぞれの光源22及び24が各々慣用の光センサー26から異なった距離にあるよう、それぞれ4つずつの光源22及び24が離れた列に配置されているように、8つの光源22、24(個々にD1〜D8と表示されている)を有する。光源22及び24は、発光ダイオード、レーザーダイオード、又は他の、所望の周波数範囲で振幅変調させることのできる如何なる光源系でもよい。また、光源の波長は吸光度の差を最大にするように選択され、このオキシヘモグロビン及びデオキシヘモグロビン種のための特定の具体例においては、特に700 〜900 nmである。
【0035】
図4のマルチプレクサー回路により、それぞれの光源22、24は、一度に1つずつ、急速に連続して点滅される。この具体例においては、光源は、光源の変調及び散乱係数と吸光度係数に対する上述の勾配の感受性を最大にする周波数を提供するために、周波数120 MHzにて正弦波的に振幅変調される。また、この周波数において良好な感度を有する検出器又はセンサー26は、容易に入手可能である。同様に、ヘモグロビン検出のためには、そのような周波数が、最大の信号/ノイズ比を提供する。
【0036】
それぞれの光源22、24からの変調された光信号は、患者の組織に入り、高度に散乱された仕方で組織を通ってセンサー26へ至る。各光源22、24からセンサー26への、組織を通らない直接的な光伝達は、ゴム製の光遮蔽バリア30(それはセンサーヘッド12のセンサー面14より僅かに外方へ突出している)によって阻止される。
【0037】
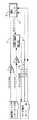
センサー26によって感知された組織を通った光は、接続ケーブル16内の光ファイバー32(図3)によって伝達され、該ケーブルはまた、各々センサーヘッド12とプロセッサーユニット10との間を連絡する導線をも有する。光ファイバー32からの光は、光電子増倍検出器34へ伝えられる。
【0038】
周波数シンセサイザーカード25は、ヘッド12及び発光ダイオード22、24に導線27(やはりケーブル16内にある)を介してそれぞれの発光ダイオード22、24に120.0000MHz(これは上述の第1の周波数である)の振幅変調を課すための無線周波数信号を提供するための、慣用の回路を備えた周波数発生器を有する。
【0039】
周波数シンセサイザーカード25はまた、光電子増倍検出器34の利得を変調するために、第1の信号とコヒーレントであるがしかし120.0004MHzの第2の周波数で変調されている第2の信号を、導線36を介して送る周波数シンセサイザーをも有する。こうしてアナログ信号(ファイバー32及び導線36を介した各信号の関数である)が、検出器34から導線38に沿ってデータ獲得カード40へと送られる。データ獲得カード40によって感知されたこの特定のアナログ信号は、第1の信号と第2の信号との差の周波数であってこの実施例においては400 Hzである、「相互相関周波数」を有する。このよく確立された方法は、光電子増倍検出器中に120 MHzで変調された電流と光電子増倍ダイノードに注入された120.0004MHzの無線周波数信号とのうなりを作り出し、導線38を通る光電子増倍検出器の出力は400 Hzの相互相関周波数で変調される。無線周波数の高調波は、検出器34中の増幅器において低域フィルターによって除去される。
【0040】
こうして、各々の光源22、24は、400 Hzの相互相関周波数の波の周期の正確な倍数すなわち2.5 ミリ秒又はその倍数に等しいある時間長さにわたって発光される。典型的な測定においては、センサー26において得られた組織を通過した光の強度に依存して、400 Hz波の最低8乃至最大800 周期分が集められる。これらの測定周期の各々は、16分割してディジタル化することができる。測定周期のこれらの集められた波の全ては、一緒にして平均化されて、Gratton 等の米国特許第5,212,386 号に記述されている方法と類似の、16個の点よりなる平均波を与える。次いで、この16個の点よりなる波が、高速フーリエ変換アルゴリズムを用いて変形でき、400 Hzという基本倍音の位相ずれ(P)成分、直流(DC)成分、及び/又は交流(AC)成分を与える。
【0041】
上記の方法は、各々の光源22、24について繰り返すことができる。2組のデータを得るために、それぞれの光源22は、720 nmのような一波長で発光し、他の光源24は、850 nmのような他の波長で発光してもよい。それぞれの光源22の各々は、光源24の各々と同様、センサー26から異なった距離にあり、それによって各々の組の個々の光源の各々のデータは異なり、一層遠い光源は組織を通って一層大きい光の減衰を示すであろう。この結果は、センサーからの光源の既知の距離に依存した、各々の波長におけるDC成分、AC成分及び位相ずれ(P)成分の4組の値であることができる。
【0042】
データ獲得カード40に受け取られた光検出器34からの信号は、該カード(例えばISS A2D カード)によってディジタル化される。センサー26からの各光源の既知の一定の距離と組合さって、それぞれの光がDC成分、AC成分及びP成分について異なった値を提供することから、これらのデータからコンピューターが、これらの組の光源22、24の各々によって提供されたDC成分、AC成分及びP成分のうちの少なくとも2つの勾配(S)を計算する。これは次のようにして達成できる。
【0043】
〔数学的背景〕
周波数領域分光光度計において、光の強度は、一般に100 MHzの領域であるある周波数fで正弦波的に変調される。光源は、高度に散乱性の媒質中に、水中における光の速度に対して減少した速度で伝達する光子密度波を発生する。これは、該光子密度波を構成している光子の、該媒質中の粒子との大きな数の衝突のためである。空間の何れの点においても、光の強度は光源と同じ周波数で正弦波的に変動するが、光源の強度に対して位相ずれし且つ減衰している。位相ずれP及び正弦波的に強度の変調されたAC及びまた平均光強度DCの減衰は、光源からの距離r及び散乱(μs)及び吸収(μa)係数、並びにDC、AC及びPの各値の関数である。光源22、24及び検出器26が両方とも、患者の腕のような広い均一な媒質の表面に配置されているときは、次の関係が成り立つ。
【0044】
DC={DC0exp(−r(2s)1/2)}/r2
AC={AC0exp(−rs1/2(x+1)1/2)}/r2
P=P0+rs1/2(x−1)1/2
ここに、
s=3μa(μa+μs)/2
x=(y2+1)1/2
y=2πf/vμa
【0045】
上記の式において、光源と検出器との間の距離rは、独立して正確に測定できる。光の変調の第1の周波数fもまた正確に知られており、vは水中での光の速度である。未知のパラメーターは、散乱及び吸収係数、及び変調された光の位相、DC及びAC因子のみである。
【0046】
上記の式は、光の位相、DCおよびAC因子を別々に測定することを必要とする。これらの量を独立して測定するよりも、数通りの距離rにおけるDC、AC及びPを測定することの方が実際的である。rの関数としてのln(r2DC)、ln(r2AC)及びPのプロットの勾配は、光源の各定数からは独立した量を与える。周波数領域分光光度計のこの特定の実施例において散乱及び吸収係数が測定されるのはこの勾配からである。最初に上に規定したプロットの勾配を最初に決定すれば、上記の量のうち何れか2つ、すなわちDC及びP、AC及びP、並びにDC又はACの測定によって、媒質の光学的パラメーターを決定することができる。先に規定された3つの勾配をSdc、Sac、及びSpで示すと、上記勾配に対してμa及びμsを表す式は次の式から得られる。
【0047】
μa=2πf(X2−1)−1/2/v (濃度を決定するために使用される)
μs=S2/3μa−μa (結像特性を決定するために使用される。米国特許第5,213,105 号を参照のこと。)
【0048】
こうして、吸収係数及び散乱係数を独立に測定することができる。
【0049】
シンボルX及びSは、前記3つの異なった組の可能な測定について次のように定義される。
【0050】
AC及び位相の測定を用いて:
X=(Sac2+Sp2)/(Sp2−Sac2)
S=(Sac2−Sp2)1/2
【0051】
DC及び位相の測定を用いて:
X=(Sdc2+2Sp2)/Sdc2
S=Sdc
【0052】
DC及びACを用いて:
X=(2Sac2−Sdc2)/Sdc2
S=Sdc
【0053】
こうして、μa及びμsが、上記の式を用いて計算できる。
【0054】
上述のように、3つの勾配のうちいずれか2つが、データ獲得カード40によって一旦計算されると、カード40によって、光源22及び24によってそれぞれ用いられた波長の各々における散乱係数及び吸収係数の値を電子的に算出するために使用できる。好ましくは、位相ずれ(P)の勾配及びDCの勾配が、散乱係数及び吸収係数を算出するために用いられる値である。これらの値から、次の式を用いてオキシヘモグロビン及びデオキシヘモグロビンの絶対濃度を計算することができる。
【0055】
〔O〕=(μa1εd2−μa2εd1)/(εo1εd2−εo2εd1)
〔D〕=(μa2εo1−μa1εo2)/(εo1εd2−εo2εd1)
【0056】
εが消衰係数であるとき、添字d1は第1の波長(例えば720 nm)におけるデオキシヘモグロビンの消衰係数であり、添字d2は、第2の波長(例えば850 nm)におけるデオキシヘモグロビンの消衰係数である。添字o1は、第1の波長におけるオキシヘモグロビンについての同じ係数を表す。添字o2は、第2の波長におけるオキシヘモグロビンについての同じ係数を表す。
【0057】
種々の波長におけるヘモグロビンについての消衰係数は、R. Lemberg及びJ.W. Leggeによる成書 “Hematin Compounds and Bile Pigments” (Interscience, N.Y.) 1994より得られる。特に、種々の添字についてのεの値は次の通りである:
モル−1cm−1単位で;d1=921 、d2=414 、o1=230 、o2=576
【0058】
μa1及びμa2は、式に応じて、オキシヘモグロビン及びデオキシヘモグロビンについての第1及び第2の波長におけるそれぞれの吸収係数をそれぞれ示す。
【0059】
上記の式が2つの異なった波長の光の使用を必要とすることが分かるであろう。それらは、前記のようにそれぞれ光源22及び光源24から放射することができる。
【0060】
オキシ及びデオキシヘモグロビンの上記濃度から、次の関係を用いて酸素飽和及び血液量を得ることができる。
【0061】
ヘモグロビンの酸素飽和=100 %〔O〕/(〔O〕+〔D〕)
総ヘモグロビン=〔O〕+〔D〕
【0062】
この特定の具体例においては、組織の酸素化の正確な値を、1秒未満で得ることができる。こうして、例えば図5に図解されているように、患者の皮膚にセンサーヘッド12を単に当てるだけで、個々の患者についてのヘモグロビン飽和の記録が経時的に提供できる。
【0063】
本発明の装置の各操作の度毎に光源22、24の全てを使用するという必要はない。より多くの光源、例えば16又は32個の光源を使用してもよい。また、より多くの代謝物の又は他の代謝物の濃度を得ることの困難なデータから同時測定するために所望により多重化の原理をより多くの光源に適用してもよい。4個又は8個より少ない数の光源が使用される場合には、データ取得の速度はそれに応じて上昇する。より早い取得速度は、心臓及び呼吸のリズムと相関した信号の測定を可能にすることができる。
【0064】
所望により、身体の異なった部位に配置された、又は異なったサンプリング速度を有する異なった検出器又はセンサー26からの信号を処理するために、一対の検出器ヘッドを備えることができ、それによって速い過程及び遅い過程を同時に測定することができる。
【0065】
ここに用いられる相互相関周波数は、典型的には、結果の同等性を維持しつつ、約40Hz乃至約4000Hzまで変えることができる。相互相関周波数についての一層高い値は、より速い過程のより優れた検出を可能にする。
【0066】
図6を参照して、示されているグラフは、ボランティア被験者の群について得られたデータを示す。それらのボランティアは、体重1kg当たり2gに相当する量のグルコースを飲んだ。次いで、本発明において記述した装置を用いて、図6に示されている典型的な操作で、拡散係数を規則的な間隔で2時間にわたってモニターした。2つの曲線をなすデータ点が示されているが、三角のデータ点は850 nmの赤外光によって取られ、下のデータ点は720 nmの赤外光によって取られた。
【0067】
見られるように、ゼロ点時間は、測光法ユニットのヘッド12が患者の腿に当てられた時の、元々の散乱係数を表す。グルコースの摂取の後、散乱係数は、実質的に最低値にまで下がり、次いでゆっくりとした速度で上昇して、元の値にほぼ等しい値へと戻った。850 nmにおける散乱係数の僅かな「リバウンド」は、糖の負荷に対する生理的応答、すなわち正常血糖レベルの僅かな低下を示すものかも知れない。
【0068】
これらのデータから、ボランティアの血糖レベルが、患者の身体の一部を通過した散乱係数のモニタリングによりリアルタイムでモニターできることが分かる。
【0069】
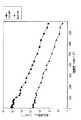
図7を参照して、静脈内脂質エマルジョン(Intralipidブランドの脂肪エマルジョン)が、図示したように増大するグルコース濃度と共に与えられている。脂肪エマルジョン+糖溶液を通過した光の散乱係数が種々の既知の濃度において測定され、その結果として、存在するグルコースの濃度に依存して予測可能な仕方で散乱係数が減少することが示されている。
【0070】
複数の光源の逐次的な点滅を起こさせるためのタイミング回路として、図4の光源マルチプレクサがこの具体例において機械的リレーを用いて構成されているが、それぞれの光源22、24を2.5 ミリ秒よりも高速で逐次的に発光させたいならば、代わりに固体スイッチを使用してもよい。
【0071】
それぞれの光源は、検出器26において同等の光強度を与えるよう較正しなければならない。これは、必要に応じて光源の幾つかの電流を減少させるための抵抗を加えることによって達成できる。光源の平衡化は、アナログ・ディジタル変換器のダイナミックレンジの全てを使用することを許容し、そしてそれは機器の構築に際して行うことができよう。
【0072】
しかしながら、光源の発光特性における長期の使用の間の変動について光源の較正を定期的にチェックすることが望ましい。この較正は、既知の吸収係数及び拡散係数を有する物質でできた個体ブロック上にヘッド12を置いて、センサー26によって感知されるものとしての各光源の強度を測定することによって実施できよう。この較正手順が、測定すべき特定の組織の測光法的特性に基づいてある統計表に従って較正する必要がある現在の市販の酸素メーターの較正とは異なっていることに注意しなければならない。本発明の機器において定期的に実施されるべき較正は、それぞれの光源22、24の光放射特性の簡単な測定であり、それ以上は要しない。
【0073】
本発明の機器は、組織酸素化及び総血液量のような数種の組織パラメーターについての直接的な、スクリーン上での、同時の、リアルタイムなモニタリングを許容する。血液流及び酸素消費のような他の生理学的に重要なパラメーターも同様に、独立して測定されたオキシヘモグロビン及びデオキシヘモグロビン濃度から算出でき、そしてそのようなパラメーターの時間依存性も、医療手順、手術操作その他に際して直ちに算出できる。
【0074】
本発明の上述の機器は、好ましくは2つの異なった波長において吸収係数及び散乱係数を計算するために、DC係数、AC係数、及び位相ずれ係数という3つのうち少なくとも2つの距離依存性を利用している。本発明によって得られたデータはまた、上に開示したのとは異なるアルゴリズムを用いて所望の情報を得るためにも使用できる。
【0075】
周波数シンセサイザーカード25及びデータ獲得カード40の双方は、基本的に、先に引用した特許に記述されたタイプのものであってよい。本発明のためのこれらのカードの修正は、当業者が直ちに達成できる。
【図面の簡単な説明】
【図1】身体組織のパラメーターを感知するために患者の腕に取り付けた状態の、センサー装置の立面図。
【図2】センサーヘッドの詳細を示す、図1のセンサー装置の概要的な平面図。
【図3】図1及び図2のセンサー装置のエレクトロニクスのブロックダイアグラム。
【図4】放射される光を高い周波数で振幅変調させながら複数の光源を逐次的に点滅させるための、マルチプレクサ回路のダイアグラム。
【図5】
本発明の装置が患者においてヘモグロビン飽和をいかに非侵襲的にリアルタイムで測定できるか、を示す模範的グラフ。
【図6】図1〜4の装置が患者においてグルコースレベルをいかに非侵襲的にリアルタイムで測定できるか、を示す模範的グラフ。
【図7】グルコース濃度を増加させたときの、静脈内脂質エマルジョン中での2つの波長における散乱係数の関係を示すグラフ。
【符号の説明】
10=センサー機器、12=センサーヘッド、14=センサー面、16=ケーブル、18=プロセッサーユニット、20=読み取り窓、22,24=光源、25=周波数シンセサイザーカード、26=センサー、27=導線、30=光遮蔽バリア、32=光ファイバー、34=光電子増倍検出器、40=データ獲得カード[0001]
[Industrial application fields]
Determining the optical properties of tissue has fundamental importance for diagnostic and monitoring purposes in many areas of medicine. It is well known that different wavelengths of light have different penetrances in various tissues. For example, in the near-infrared region (about 650 nm to about 1000 nm), light of this wavelength penetrates tissue several centimeters. As used herein, the term “light” also encompasses other electromagnetic radiation that is invisible to the human eye, such as infrared and ultraviolet light.
[0002]
[Prior art]
Because of the ability of various lights to penetrate several centimeters into tissue, metabolites of tissues such as hemoglobin can be photometric or spectrophotometrically measured by measuring the absorption of light at one or more wavelengths Can be used to measure the concentration of. It would be desirable and important for a device that measures the optical properties of a tissue for clinical purposes to provide quantitative information of the desired parameters such as oxyhemoglobin or deoxyhemoglobin, glucose and other metabolites.
[0003]
In normal procedures, the absolute concentration of a substance can be measured by measuring light transmitted through a sample of known thickness. Measurement of such transmitted light makes it possible to determine the extinction coefficient. Using this, the concentration of the measured substance can be calculated using the molecular extinction coefficient of the substance according to the Beer-Lambert rule.
[0004]
In the case of interference by more than one substance present in the medium, it is assumed that the substances have different absorption spectra and are present in the medium using measurements at different wavelengths. A method can be provided for quantifying the concentration of one or more chemical species that are present. The success of this method depends on the accuracy of the measurement and the number of different substances present.
[0005]
A further problem arises in photometry of tissues and other highly turbid materials such as emulsions. For the purposes of this disclosure, the term “tissue” includes living material, but if, for example, it is desired to obtain data similar to that performed by the present invention for tissue from an emulsion, for example, It should be understood that non-living materials such as emulsions may also be included. In the prior art, the measurement of light transmitted through a tissue slab uses a non-invasive method, except for special thin areas of the body where the light can pass completely through the tissue and be detected on the other side. Was not practical. An example of this is the photometric blood oxygen sensor that is used clinically, which is in close contact with the fingertip and passes light directly through it to give real-time oxygen concentration data.
[0006]
In tissue photometry, the amount of transmitted light depends not only on the absorption of the medium to be analyzed but also on its scattering properties. This light scattering greatly increases the complexity of photometric analysis of tissues, emulsions and similar materials. This is because scattered light gives an unpredictable variation to the amount of transmitted light that can vary considerably between tissues and various other samples.
[0007]
Many different methods have been proposed to deal with the scattering problem in this photometric method. For example, empirical correction based on the type of tissue to be measured has been used to handle the effect of scattering on absorption properties. For reflected light measurements, theoretical models have been used to calculate surface reflectivity. Although there are commercially available instruments based on these principles, all these models are not very successful. The main problem is that in order to get a good prediction of the concentration of a substance in a tissue, some a priori calibration must be performed based on a statistical analysis of a large number of corresponding tissue samples. is there. However, the range of scatter variation in tissues obtained from various individuals is basically unpredictable, as photometric results are strongly influenced by factors such as skin color and muscle lipid content. Results in.
[0008]
In 1990, Hamamatsu, Japan, introduced a simple tissue spectrophotometer called NIRO 500 for tissue oxygenation and whole blood volume measurement for newborn monitoring. The principle of this device is disclosed in US Pat. No. 5,032,024 to Cope. This device is a steady state device and is based on four different laser diodes emitting in the near infrared region. The light is directed to the tissue using an optical fiber system. The measurement is purely steady state and the length of the optical path in the tissue cannot be measured. Thus, contrary to the present invention, only relative amounts are obtained, not absolute amounts of oxy and deoxyhemoglobin.
[0009]
[Problems to be solved by the invention]
According to the invention, the absolute concentration of the material mixed in a highly turbid medium can be measured in a quantitative manner. In particular, tissue metabolites such as oxy and deoxyhemoglobin, glucose and others can be continuously and quantitatively measured in real time by the present invention. This can be accomplished without having to pass light through a narrow portion of tissue, such as a finger-like end. Rather, sensors can be placed in more central areas of the body for quantification of metabolite concentrations and other parameters. This can be accomplished essentially immediately by non-invasive methods. In addition, the various metabolites present can be measured essentially immediately, selectively and quantitatively.
[0010]
Certain substances, such as glucose, lack strong absorption lines at convenient light wavelengths that can be used for photometric quantification of light through tissue. In this situation, the problem of photometrically quantifying the concentration of glucose or other metabolites in tissues or emulsion materials becomes very difficult.
[0011]
In accordance with the present invention, components of highly scattering media (eg, glucose concentration in tissue) are measured in real time on a relative concentration basis by photometric techniques in the absence of light bands that are strongly absorbed by the monitored material. A method that can be quantified and monitored is provided.
[0012]
[Means for Solving the Problems]
According to the present invention, the presence and concentration of substances in highly turbid media such as patient tissue can be analyzed by a method comprising the following steps. That is, the light intensity from the light source is modulated at a first frequency while sequentially flashing a plurality of light sources that are separated from one optical sensor by different distances, and the modulated light is used for testing. Communicate to the sensor through a turbid sample. A second frequency signal coherent with the modulated light is provided to the optical sensor, the gain of the optical sensor at the second frequency different from the first frequency by the coherent signal; Or amplifies the output. The resulting signal is then derived from the sensor while receiving the modulated light (the resulting signal has a frequency that is the difference between the first frequency and the second frequency). From this, it is possible to detect at least two of the following characteristics of the modulated light sensed by the sensor. That is, a phase shift component, a DC component, and an AC component.
[0013]
The terms “DC component” and “AC component” define different parts of the amplitude of the light from the light source. In particular, as described above, the light from the light source is amplitude modulated in intensity, thereby brightening and dimming at the first frequency cycle. This frequency is typically very fast (eg, 80-200 MHz) so that no fluctuations in light intensity are visible. The AC component of light consists of a change in light intensity from the top of the cycle to the valley of the cycle. That is, the maximum change in light intensity as light undergoes a rapid cycle of amplitude modulation. The DC component is the intensity part of the light that is always measured from zero to the lowest intensity, which is of course observed at the bottom of the valley of the wave pattern imposed on the light by amplitude modulation.
[0014]
Thus, the maximum intensity of the optical signal (which is observed at the peak of each wave) is the sum of the DC and AC components. The minimum intensity of light in an amplitude modulated cycle is only the DC component.
[0015]
In accordance with the present invention, when amplitude modulated light travels through human tissue or other highly turbid material to the sensor, the phase of the amplitude modulated light signal shifts, and the DC component and AC The component is attenuated. From this information, quantitative information regarding the concentration of certain substances present in the tissue can be obtained in real time or on a moment-by-moment basis.
[0016]
This is preferably accomplished by sequentially flashing a plurality of light sources at different distances from the light sensor. Thus, depending on the data provided from each of a plurality of light sources at different distances, different values for phase shift, DC component and / or AC component calculate linear graph data having a characteristic gradient. Therefore, each light source is measured separately. Once these gradients are known, scattering and absorption coefficient values can be calculated at the wavelength of light used. From these values, it is possible to calculate the absolute concentration of the material present, such as oxyhemoglobin, deoxyhemoglobin, and / or glucose, especially at two different wavelengths. Once the concentrations of, for example, oxyhemoglobin and deoxyhemoglobin are known, the patient's oxygen saturation and blood volume can be calculated.
[0017]
This can be accomplished very quickly, such as with a microprocessor, so that the sensor head can be simply applied to the patient's skin without the need for light to pass completely through the patient's tissue to the other side. Each value can be displayed to the doctor or nurse in real time.
[0018]
The concentration of a material such as glucose can be quantified by monitoring the change in scattering coefficient. The scattering coefficient can be measured even if the material being analyzed does not have a characteristic strong absorption band at the wavelength of the light used. While not intending to rely on a particular theory for the operation of the present invention, it is believed that in highly scattering media such as tissue, the scattering coefficient depends on the concentration of glucose and other test materials. A change in the concentration of glucose present changes the refractive index of the aqueous portion of the highly scattering medium. For example, if the concentration of glucose present in an aqueous fat emulsion is being monitored, the fat phase of the emulsion will have a refractive index of, for example, 1.42. This is the refractive index of soybean oil. The refractive index of the aqueous phase of the emulsion is about 1.33. The refractive index of water containing different concentrations of glucose will vary over a range, which will change the scattering properties of the entire emulsion. Thus, the scattering coefficient of a turbid medium varies with the concentration of glucose present.
[0019]
Scattering disappears when the refractive index of the aqueous medium matches the refractive index of the suspended particles. Therefore, if the refractive index of the scattering particles in the medium is constant, the scattering coefficient of the medium will be a function of the refractive index of the rest of the medium. Thus, the concentration of glucose and other materials contained in the aqueous portion of the scattering medium can be determined by comparison with baseline data or (in the case of simpler emulsions) by a table of pre-calculated measurements. Can be determined from
[0020]
Typically, taken from the same tissue so that relative changes in the concentration of glucose and other materials can be monitored by comparison with baseline data in terms of variability in the scattering properties of various tissue samples. Use baseline data. Thus, for example, a diabetic patient can repeatedly monitor his blood glucose level simply by placing the photometric head on the same part of his body, for example the forearm or thigh. The scattering coefficient can be calculated for each reading by software in the photometric apparatus. In order to give a diabetic patient the opportunity to monitor himself frequently, for example, throughout the day for changes in blood glucose levels, any change in the scatter coefficient can be indicated by some conventional warning mode.
[0021]
The sensor for detecting light in the present invention can detect light scattered in the tissue, so that the light path from the light source to the sensor need not be linear. Indeed, the direction of light emission and the general direction of light sensing may be parallel, as shown by the specific embodiments of the sensor head disclosed herein.
[0022]
Preferably, the sensor for sensing light used herein prevents light from directly accessing the light sensor from the light source as well as the light source as well as the patient tissue in a common sensor head. Therefore, it may have a shield.
[0023]
The sensor device of the present invention calculates at least two gradients of a phase shift component, a DC component, and an AC component given by separate signals from each of a plurality of light sources having different distances from the optical sensor. You may have an electronic processor. Thereby, the processor can also calculate the scattering coefficient and the absorption coefficient of the tissue. Thereby, for example, the absolute concentration of at least one of oxyhemoglobin and deoxyhemoglobin present in the tissue can be typically calculated from the absorbance coefficient. The sensor device may then have means for displaying such concentrations as real time values.
[0024]
The intensity of the light from the light source is preferably amplitude modulated at about 50 to 150 MHz. The second frequency of the second signal is of the same order, but typically differs from the first frequency by about 10 Hz to 100 KHz.
[0025]
Typically, the light used is of a wavelength of about 650 nm to about 1000 nm, and at least three light sources with different distances from the photosensor are provided. However, it is preferred that at least six light sources with different distances are provided so that the light sources are in a pair of rows and each pair of light sources is provided at the same distance from the photosensor. This allows data to be collected simultaneously at different wavelengths of light, each of which has a different wavelength emitted from each one of the rows of light sources for more accurate data collection. Is done.
[0026]
Each of the plurality of light sources has a certain length of time that is an exact multiple of the period of a wave having a frequency (referred to as a “cross-correlation frequency”) that is the difference between the first frequency and the second frequency. It is preferable that activation (light emission) is sequentially performed.
[0027]
Also, in order to obtain an enhanced average of photometric information received from each light source, the information sensed by the light sensor can be summed and averaged from 8 to 800 iterations.
[0028]
Typically, the method and apparatus of the present invention uses the principles of well-known frequency domain fluorescence and / or phosphorescence measurements, such as, for example, Graton US Pat. No. 4,840,485, Nos. 5,212,386 and 5,323,010.
[0029]
Furthermore, according to the present invention, the relative concentration of material in a turbid medium such as a patient's tissue can be measured by the following method. The method irradiates light into the turbid medium, measures the scattering coefficient of the light passing through the turbid medium, and compares the scattering coefficient with the previous scattering coefficient measured for the tissue. Consists of.
[0030]
It has been found that many materials in a turbid medium cause a change in the scattering coefficient of light passing through the turbid medium when the concentration of the material changes. In particular, such monitoring is possible for the concentration of glucose in the tissue of a living patient. The method is preferably applicable to solutes in the aqueous phase of living tissue or in the aqueous phase of emulsions. The method is particularly advantageous in situations where photometric measurements at wavelengths where solutes absorb strongly are inconvenient.
[0031]
Thus, the patient's glucose level can be monitored photometrically by the method of the present invention. The method is not quantitative, so it is highly desirable to compare the results to a baseline of scattering coefficient data measured for the same patient tissue or other measurement sample. In this way, the normal scattering coefficient can be measured, thereby monitoring future measurements, such as the glucose level of a diabetic patient, simply by applying a light cell and sensor to the patient's skin, such as the thigh, forearm or abdomen. be able to. Any change from the baseline value, recognized for the scatter coefficient, is indicative of a change in glucose level and serves to alert the patient to treatment.
[0032]
Preferably, the presence and concentration of such substances in highly turbid media such as patient tissues can be analyzed by the following method. The method modulates the intensity of light from the light source at a first frequency while sequentially flashing a plurality of light sources that are separated from one light sensor at different distances, and turbidize the modulated light. Tell the sensor through the sample. Also, the optical sensor is provided with a signal having a second frequency different from the first frequency that is coherent with the modulated light, and the gain of the optical sensor is modulated or output by the coherent signal. Amplify. The resulting signal is then derived from the sensor while receiving the modulated light (the resulting signal is the difference frequency between the first frequency and the second frequency). From this, it is possible to detect at least two of the following characteristics of the modulated light sensed by the sensor. That is, a phase shift component, a DC component, and an AC component. These are compared with the corresponding components of the modulated light as originally emitted by the light source.
[0033]
【Example】
In the drawing, a sensor device for measuring the concentration of oxyhemoglobin and deoxyhemoglobin in a patient's living tissue non-invasively and quantitatively in real time is shown. The
[0034]
The
[0035]
The multiplexer circuit of FIG. 4 causes each
[0036]
The modulated optical signal from each
[0037]
Light that passes through the tissue sensed by the
[0038]
The frequency synthesizer card 25 is connected to the
[0039]
The frequency synthesizer card 25 also provides a second signal that is coherent with the first signal but modulated at a second frequency of 120.0004 MHz to modulate the gain of the
[0040]
Thus, each
[0041]
The above method can be repeated for each
[0042]
The signal from the
[0043]
[Mathematical background]
In a frequency domain spectrophotometer, the intensity of light is modulated sinusoidally at a frequency f which is typically in the 100 MHz region. The light source generates a photon density wave that transmits in a highly scattering medium at a reduced speed relative to the speed of light in water. This is due to the large number of collisions of the photons that make up the photon density wave with the particles in the medium. At any point in space, the light intensity varies sinusoidally at the same frequency as the light source, but is out of phase and attenuated with respect to the light source intensity. The phase shift P and sinusoidally intensity-modulated AC and also the attenuation of the average light intensity DC depends on the distance r from the light source and the scattering (μs) And absorption (μa) Coefficient and a function of DC, AC and P values. When the
[0044]
DC = {DC0exp (-r (2s)1/2)} / R2
AC = {AC0exp (-rs1/2(X + 1)1/2)} / R2
P = P0+ Rs1/2(X-1)1/2
here,
s = 3μa(Μa+ Μs) / 2
x = (y2+1)1/2
y = 2πf / vμa
[0045]
In the above equation, the distance r between the light source and the detector can be independently and accurately measured. The first frequency f of the light modulation is also known precisely, and v is the speed of light in water. The only unknown parameters are the scattering and absorption coefficients, and the phase of the modulated light, DC and AC factors.
[0046]
The above equation requires measuring the phase of the light, DC and AC factors separately. Rather than measuring these quantities independently, it is more practical to measure DC, AC, and P at several distances r. ln (r as a function of r2DC), ln (r2The slope of the AC) and P plots gives an independent amount from each constant of the light source. It is from this slope that the scattering and absorption coefficients are measured in this particular embodiment of the frequency domain spectrophotometer. If the slope of the plot defined above is initially determined, the optical parameters of the medium are determined by measuring any two of the above quantities: DC and P, AC and P, and DC or AC. can do. The three slopes previously defined are Sdc, SacAnd SpWhere μ against the gradientaAnd μsThe equation representing is obtained from the following equation.
[0047]
μa= 2πf (X2-1)-1/2/ V (used to determine concentration)
μs= S2/ 3μa−μa (Used to determine imaging characteristics; see US Pat. No. 5,213,105.)
[0048]
In this way, the absorption coefficient and the scattering coefficient can be measured independently.
[0049]
The symbols X and S are defined as follows for the three different sets of possible measurements:
[0050]
Using AC and phase measurements:
X = (Sac2+ Sp2) / (Sp2-Sac2)
S = (Sac2-Sp2)1/2
[0051]
Using DC and phase measurements:
X = (Sdc2+ 2Sp2) / Sdc2
S = Sdc
[0052]
Using DC and AC:
X = (2Sac2-Sdc2) / Sdc2
S = Sdc
[0053]
Thus, μaAnd μsCan be calculated using the above equation.
[0054]
As described above, once any two of the three gradients are calculated by the
[0055]
[O] = (μa1εd2−μa2εd1) / (Εo1εd2−εo2εd1)
[D] = (μa2εo1−μa1εo2) / (Εo1εd2−εo2εd1)
[0056]
When ε is an extinction coefficient, the subscript d1 is the extinction coefficient of deoxyhemoglobin at the first wavelength (eg, 720 nm), and the subscript d2 is the extinction of deoxyhemoglobin at the second wavelength (eg, 850 nm). It is a coefficient. The subscript o1 represents the same coefficient for oxyhemoglobin at the first wavelength. The subscript o2 represents the same coefficient for oxyhemoglobin at the second wavelength.
[0057]
The extinction coefficient for hemoglobin at various wavelengths is given by R.C. Lemberg and J.M. W. The book “Hematin Compounds and Bile Pigments” (Interscience, NY) 1994 by Legge. In particular, the values of ε for various subscripts are:
Mole-1cm-1In units; d1 = 921, d2 = 414, o1 = 230, o2 = 576
[0058]
μa1And μa2Indicates the respective absorption coefficients at the first and second wavelengths for oxyhemoglobin and deoxyhemoglobin, depending on the equation.
[0059]
It will be appreciated that the above equation requires the use of two different wavelengths of light. They can be emitted from
[0060]
From the above concentrations of oxy and deoxyhemoglobin, oxygen saturation and blood volume can be obtained using the following relationship:
[0061]
Oxygen saturation of hemoglobin = 100% [O] / ([O] + [D])
Total hemoglobin = [O] + [D]
[0062]
In this particular embodiment, an accurate value for tissue oxygenation can be obtained in less than 1 second. In this way, a record of hemoglobin saturation for an individual patient can be provided over time by simply applying the
[0063]
It is not necessary to use all of the
[0064]
If desired, a pair of detector heads can be provided to process signals from different detectors or
[0065]
The cross-correlation frequency used here can typically vary from about 40 Hz to about 4000 Hz while maintaining equality of results. Higher values for cross-correlation frequencies allow for better detection of faster processes.
[0066]
Referring to FIG. 6, the graph shown shows the data obtained for a group of volunteer subjects. These volunteers drank glucose equivalent to 2 g / kg body weight. The diffusion coefficient was then monitored over a period of 2 hours at regular intervals using the apparatus described in the present invention and the exemplary procedure shown in FIG. Data points forming two curves are shown, with the triangular data point taken by 850 nm infrared light and the lower data point taken by 720 nm infrared light.
[0067]
As can be seen, the zero point time represents the original scattering coefficient when the
[0068]
From these data, it can be seen that the blood glucose level of the volunteer can be monitored in real time by monitoring the scattering coefficient that has passed through a part of the patient's body.
[0069]
Referring to FIG. 7, an intravenous lipid emulsion (Intralipid brand fat emulsion) is provided with increasing glucose concentration as shown. The scattering coefficient of light passing through the fat emulsion + sugar solution is measured at various known concentrations, and as a result, it is shown that the scattering coefficient decreases in a predictable manner depending on the concentration of glucose present. Yes.
[0070]
As a timing circuit for causing sequential flashing of a plurality of light sources, the light source multiplexer of FIG. 4 is configured by using a mechanical relay in this specific example. If it is desired to emit light sequentially at a speed faster than a second, a solid state switch may be used instead.
[0071]
Each light source must be calibrated to provide equivalent light intensity at the
[0072]
However, it is desirable to periodically check the calibration of the light source for variations during prolonged use in the light emission characteristics of the light source. This calibration could be performed by placing the
[0073]
The instrument of the present invention allows direct, on-screen, real-time monitoring of several tissue parameters such as tissue oxygenation and total blood volume. Other physiologically important parameters such as blood flow and oxygen consumption can likewise be calculated from independently measured oxyhemoglobin and deoxyhemoglobin concentrations, and the time dependence of such parameters is also described in medical procedures, It can be calculated immediately for surgical operations and other operations.
[0074]
The above-described apparatus of the present invention preferably uses at least two distance dependencies of three of the DC coefficient, the AC coefficient, and the phase shift coefficient to calculate the absorption coefficient and the scattering coefficient at two different wavelengths. ing. The data obtained by the present invention can also be used to obtain the desired information using different algorithms than those disclosed above.
[0075]
Both the frequency synthesizer card 25 and the
[Brief description of the drawings]
FIG. 1 is an elevational view of a sensor device, attached to a patient's arm to sense body tissue parameters.
2 is a schematic plan view of the sensor device of FIG. 1, showing details of the sensor head.
3 is a block diagram of the electronics of the sensor device of FIGS. 1 and 2. FIG.
FIG. 4 is a diagram of a multiplexer circuit for sequentially flashing a plurality of light sources while amplitude modulating the emitted light at a high frequency.
[Figure 5]
4 is an exemplary graph showing how the apparatus of the present invention can measure hemoglobin saturation in a patient non-invasively in real time.
6 is an exemplary graph showing how the apparatus of FIGS. 1-4 can measure glucose levels non-invasively in a patient in real time.
FIG. 7 is a graph showing the relationship between scattering coefficients at two wavelengths in an intravenous lipid emulsion when the glucose concentration is increased.
[Explanation of symbols]
10 = sensor device, 12 = sensor head, 14 = sensor surface, 16 = cable, 18 = processor unit, 20 = reading window, 22, 24 = light source, 25 = frequency synthesizer card, 26 = sensor, 27 = conductor, 30 = Light shielding barrier, 32 = optical fiber, 34 = photomultiplier detector, 40 = data acquisition card
Claims (6)
Translated fromJapanese(1) 該媒質と接触するための面を有するセンサーヘッドと、
(2) 該面の一部を照射する光を検出するための光センサーと、
(3) 該面を通して該光を透過させるよう配置された複数の光源であって、該光センサーからの距離を異にするものである光源と、
(4) 該光源の逐次的な点滅を起こさせるためのタイミング回路と、
(5) 第1の周波数で振幅変調された光信号を与えるために、該点灯された光源の強度を変調させるための回路と、
(6) 該振幅変調された光信号とコヒーレントな、該第1の周波数と異なる第2の周波数の第2の信号を該光センサーに提供するための手段と、
(7) 該第2の信号によって該光センサーの利得を変調し又は出力を増幅するための手段と、そして
(8) 該光源から該媒質を通って該光センサーへ到達した該光信号の位相ずれ成分、DC成分、及びAC成分のうち少なくとも2つを検出するために、該変調された光信号を受信しながら該第1の周波数と該第2の周波数との差である周波数を有する結果の信号を該光センサーから導き出すための手段と、
(9) 該光センサーからの距離を異にする該複数の光源からの信号によって与えられる該位相ずれ成分、DC成分、及びAC成分のうち少なくとも2つの勾配を算出するためにプロセッサーと、
を含んでなるセンサー機器。A sensor device for highly scattering medium parameters,
(1) a sensor head having a surface for contacting the medium;
(2) an optical sensor for detecting light that irradiates a part of the surface;
(3) a plurality of light sources arranged to transmit the light through the surface, the light sources having different distances from the photosensor;
(4) a timing circuit for causing sequential flashing of the light source;
(5) a circuit for modulating the intensity of the lit light source to provide an optical signal amplitude modulated at a first frequency;
(6) means for providing to the optical sensor a second signal of a second frequency different from the first frequency that is coherent with the amplitude modulated optical signal;
(7) means for modulating the gain of the photosensor or amplifying the output by the second signal; and
(8) receiving the modulated optical signal to detect at least two of a phase shift component, a DC component, and an AC component of the optical signal that has reached the optical sensor from the light source through the medium; Means for deriving a resulting signal from the optical sensor having a frequency that is the difference between the first frequency and the second frequency;
(9) a processor for calculating a gradient of at least two of the phase shift component, the DC component, and the AC component given by signals from the plurality of light sources having different distances from the optical sensor;
Comprising sensor equipment.
Applications Claiming Priority (4)
| Application Number | Priority Date | Filing Date | Title |
|---|---|---|---|
| US08/168,813US5497769A (en) | 1993-12-16 | 1993-12-16 | Photosensor with multiple light sources |
| US08/253935 | 1994-06-03 | ||
| US08/168813 | 1994-06-03 | ||
| US08/253,935US5492118A (en) | 1993-12-16 | 1994-06-03 | Determining material concentrations in tissues |
Publications (2)
| Publication Number | Publication Date |
|---|---|
| JPH0889500A JPH0889500A (en) | 1996-04-09 |
| JP3619969B2true JP3619969B2 (en) | 2005-02-16 |
Family
ID=26864474
Family Applications (1)
| Application Number | Title | Priority Date | Filing Date |
|---|---|---|---|
| JP33254294AExpired - Fee RelatedJP3619969B2 (en) | 1993-12-16 | 1994-12-12 | Light sensor with multiple light sources |
Country Status (6)
| Country | Link |
|---|---|
| US (3) | US5492118A (en) |
| EP (1) | EP0663591B1 (en) |
| JP (1) | JP3619969B2 (en) |
| AT (1) | ATE219242T1 (en) |
| CA (1) | CA2137878C (en) |
| DE (1) | DE69430791T2 (en) |
Families Citing this family (241)
| Publication number | Priority date | Publication date | Assignee | Title |
|---|---|---|---|---|
| US5782755A (en)* | 1993-11-15 | 1998-07-21 | Non-Invasive Technology, Inc. | Monitoring one or more solutes in a biological system using optical techniques |
| US5987346A (en)* | 1993-02-26 | 1999-11-16 | Benaron; David A. | Device and method for classification of tissue |
| EP0731958A1 (en)* | 1993-11-30 | 1996-09-18 | Bell Communications Research, Inc. | Imaging system and method using direct reconstruction of scattered radiation |
| US5492118A (en)* | 1993-12-16 | 1996-02-20 | Board Of Trustees Of The University Of Illinois | Determining material concentrations in tissues |
| DE4417639A1 (en)* | 1994-05-19 | 1995-11-23 | Boehringer Mannheim Gmbh | Analysis of concns. of substances in a biological sample |
| JPH10500338A (en)* | 1994-05-19 | 1998-01-13 | ベーリンガー・マンハイム・ゲゼルシャフト・ミット・ベシュレンクテル・ハフツング | Method and apparatus for determining an analyte in a biological sample |
| DE19504174A1 (en)* | 1995-02-07 | 1996-08-08 | Siemens Ag | Method for the spectroscopic examination of a biological tissue |
| US5758653A (en)* | 1995-04-10 | 1998-06-02 | Bell Communications Research, Inc. | Simultaneous absorption and diffusion imaging system and method using direct reconstruction of scattered radiation |
| US5813403A (en)* | 1995-11-08 | 1998-09-29 | Soller; Babs R. | Optical measurement of tissue pH |
| US6405069B1 (en) | 1996-01-31 | 2002-06-11 | Board Of Regents, The University Of Texas System | Time-resolved optoacoustic method and system for noninvasive monitoring of glucose |
| EP0944347B1 (en)* | 1996-07-19 | 2006-11-29 | Daedalus I, LLC | Device for noninvasive determination of blood parameters |
| US5871442A (en) | 1996-09-10 | 1999-02-16 | International Diagnostics Technologies, Inc. | Photonic molecular probe |
| US6594510B2 (en) | 1996-09-10 | 2003-07-15 | Xoetronics Llc | Photonic molecular probe |
| US6018673A (en) | 1996-10-10 | 2000-01-25 | Nellcor Puritan Bennett Incorporated | Motion compatible sensor for non-invasive optical blood analysis |
| US6161028A (en)* | 1999-03-10 | 2000-12-12 | Optiscan Biomedical Corporation | Method for determining analyte concentration using periodic temperature modulation and phase detection |
| US5792053A (en)* | 1997-03-17 | 1998-08-11 | Polartechnics, Limited | Hybrid probe for tissue type recognition |
| US5961451A (en)* | 1997-04-07 | 1999-10-05 | Motorola, Inc. | Noninvasive apparatus having a retaining member to retain a removable biosensor |
| US7206623B2 (en)* | 2000-05-02 | 2007-04-17 | Sensys Medical, Inc. | Optical sampling interface system for in vivo measurement of tissue |
| US7383069B2 (en)* | 1997-08-14 | 2008-06-03 | Sensys Medical, Inc. | Method of sample control and calibration adjustment for use with a noninvasive analyzer |
| US6055451A (en) | 1997-12-12 | 2000-04-25 | Spectrx, Inc. | Apparatus and method for determining tissue characteristics |
| US20030135122A1 (en)* | 1997-12-12 | 2003-07-17 | Spectrx, Inc. | Multi-modal optical tissue diagnostic system |
| US6014204A (en)* | 1998-01-23 | 2000-01-11 | Providence Health System | Multiple diameter fiber optic device and process of using the same |
| US6694157B1 (en) | 1998-02-10 | 2004-02-17 | Daedalus I , L.L.C. | Method and apparatus for determination of pH pCO2, hemoglobin, and hemoglobin oxygen saturation |
| US6078833A (en)* | 1998-03-25 | 2000-06-20 | I.S.S. (Usa) Inc. | Self referencing photosensor |
| US7899518B2 (en)* | 1998-04-06 | 2011-03-01 | Masimo Laboratories, Inc. | Non-invasive tissue glucose level monitoring |
| US6721582B2 (en) | 1999-04-06 | 2004-04-13 | Argose, Inc. | Non-invasive tissue glucose level monitoring |
| US6728560B2 (en) | 1998-04-06 | 2004-04-27 | The General Hospital Corporation | Non-invasive tissue glucose level monitoring |
| US20020091324A1 (en)* | 1998-04-06 | 2002-07-11 | Nikiforos Kollias | Non-invasive tissue glucose level monitoring |
| AU766166B2 (en)* | 1998-04-06 | 2003-10-09 | General Hospital Corporation, The | Non-invasive tissue glucose level monitoring |
| US6505059B1 (en) | 1998-04-06 | 2003-01-07 | The General Hospital Corporation | Non-invasive tissue glucose level monitoring |
| US6526298B1 (en) | 1998-05-18 | 2003-02-25 | Abbott Laboratories | Method for the non-invasive determination of analytes in a selected volume of tissue |
| US7043287B1 (en) | 1998-05-18 | 2006-05-09 | Abbott Laboratories | Method for modulating light penetration depth in tissue and diagnostic applications using same |
| US6662031B1 (en) | 1998-05-18 | 2003-12-09 | Abbott Laboratoies | Method and device for the noninvasive determination of hemoglobin and hematocrit |
| US6241663B1 (en) | 1998-05-18 | 2001-06-05 | Abbott Laboratories | Method for improving non-invasive determination of the concentration of analytes in a biological sample |
| US6662030B2 (en) | 1998-05-18 | 2003-12-09 | Abbott Laboratories | Non-invasive sensor having controllable temperature feature |
| IL141864A0 (en)* | 1998-09-11 | 2002-03-10 | Spectrx Inc | Multi-modal optical tissue diagnostic system |
| US6219575B1 (en) | 1998-10-23 | 2001-04-17 | Babak Nemati | Method and apparatus to enhance optical transparency of biological tissues |
| US20130274837A1 (en)* | 1998-10-23 | 2013-10-17 | Babak Nemati | Systems and Methods to Enhance Optical Transparency of Biological Tissues for Photobiomodulation |
| ATE404110T1 (en) | 1998-11-18 | 2008-08-15 | Lea Medizintechnik Gmbh | DEVICE FOR THE NON-INVASIVE DETERMINATION OF OXYGEN CONVERSION IN TISSUES |
| US6353226B1 (en) | 1998-11-23 | 2002-03-05 | Abbott Laboratories | Non-invasive sensor capable of determining optical parameters in a sample having multiple layers |
| US6615061B1 (en)* | 1998-11-23 | 2003-09-02 | Abbott Laboratories | Optical sensor having a selectable sampling distance for determination of analytes |
| US6959211B2 (en)* | 1999-03-10 | 2005-10-25 | Optiscan Biomedical Corp. | Device for capturing thermal spectra from tissue |
| US20040147843A1 (en)* | 1999-11-05 | 2004-07-29 | Shabbir Bambot | System and method for determining tissue characteristics |
| US7299080B2 (en)* | 1999-10-08 | 2007-11-20 | Sensys Medical, Inc. | Compact apparatus for noninvasive measurement of glucose through near-infrared spectroscopy |
| US6675031B1 (en) | 1999-04-14 | 2004-01-06 | Mallinckrodt Inc. | Method and circuit for indicating quality and accuracy of physiological measurements |
| US6138046A (en)* | 1999-04-20 | 2000-10-24 | Miravant Medical Technologies, Inc. | Dosimetry probe |
| EP1207385B1 (en)* | 1999-06-03 | 2011-02-09 | Hamamatsu Photonics K.K. | Optical ct device and method of image reformation |
| EP1609410B1 (en)* | 1999-06-03 | 2014-05-28 | Hamamatsu Photonics K.K. | Optical CT apparatus |
| JP4148603B2 (en)* | 1999-07-23 | 2008-09-10 | 倉敷紡績株式会社 | Intraoral jig for optical measurement |
| TW453862B (en)* | 1999-08-30 | 2001-09-11 | Cas Medical Systems Inc | Near infrared spectrophotometric monitoring assembly for non-invasive monitoring of blood oxygenation levels in a subjects's body |
| JP3839202B2 (en)* | 1999-10-28 | 2006-11-01 | 株式会社日立製作所 | Biological light measuring device and program for causing this device to function |
| DE19954756A1 (en)* | 1999-11-17 | 2001-05-31 | Odim Gmbh | Device and method for examining biological tissue |
| US6397092B1 (en)* | 1999-12-17 | 2002-05-28 | Datex-Ohmeda, Inc. | Oversampling pulse oximeter |
| US6577884B1 (en) | 2000-06-19 | 2003-06-10 | The General Hospital Corporation | Detection of stroke events using diffuse optical tomagraphy |
| US6285904B1 (en)* | 2000-03-27 | 2001-09-04 | Sandia Corporation | Method and apparatus for determining fat content of tissue |
| US8224412B2 (en) | 2000-04-17 | 2012-07-17 | Nellcor Puritan Bennett Llc | Pulse oximeter sensor with piece-wise function |
| EP1274343B1 (en) | 2000-04-17 | 2012-08-15 | Nellcor Puritan Bennett LLC | Pulse oximeter sensor with piece-wise function |
| US6795730B2 (en) | 2000-04-20 | 2004-09-21 | Biophan Technologies, Inc. | MRI-resistant implantable device |
| US6925328B2 (en) | 2000-04-20 | 2005-08-02 | Biophan Technologies, Inc. | MRI-compatible implantable device |
| US8527046B2 (en) | 2000-04-20 | 2013-09-03 | Medtronic, Inc. | MRI-compatible implantable device |
| DE10020615C2 (en)* | 2000-04-27 | 2002-02-28 | Glukomeditech Ag | Process for the long-term stable and reproducible spectrometric measurement of the concentrations of the components of aqueous solutions and device for carrying out this process |
| US7606608B2 (en)* | 2000-05-02 | 2009-10-20 | Sensys Medical, Inc. | Optical sampling interface system for in-vivo measurement of tissue |
| US20060211931A1 (en)* | 2000-05-02 | 2006-09-21 | Blank Thomas B | Noninvasive analyzer sample probe interface method and apparatus |
| US7519406B2 (en)* | 2004-04-28 | 2009-04-14 | Sensys Medical, Inc. | Noninvasive analyzer sample probe interface method and apparatus |
| US6611339B1 (en) | 2000-06-09 | 2003-08-26 | Massachusetts Institute Of Technology | Phase dispersive tomography |
| US6765212B2 (en)* | 2001-02-12 | 2004-07-20 | Analytical Spectral Devices, Inc. | System and method for combining reflectance data |
| US6829509B1 (en) | 2001-02-20 | 2004-12-07 | Biophan Technologies, Inc. | Electromagnetic interference immune tissue invasive system |
| US20020116028A1 (en) | 2001-02-20 | 2002-08-22 | Wilson Greatbatch | MRI-compatible pacemaker with pulse carrying photonic catheter providing VOO functionality |
| JP2002303576A (en)* | 2001-04-05 | 2002-10-18 | Nippon Colin Co Ltd | Oxygen saturation measuring device |
| AU2002341039A1 (en)* | 2001-04-05 | 2002-11-18 | Agilent Technologies, Inc. | Optical property determination using differences in signal responses to applied modulated laser signals |
| US7126682B2 (en)* | 2001-04-11 | 2006-10-24 | Rio Grande Medical Technologies, Inc. | Encoded variable filter spectrometer |
| US7043288B2 (en) | 2002-04-04 | 2006-05-09 | Inlight Solutions, Inc. | Apparatus and method for spectroscopic analysis of tissue to detect diabetes in an individual |
| US7167734B2 (en) | 2001-04-13 | 2007-01-23 | Abbott Laboratories | Method for optical measurements of tissue to determine disease state or concentration of an analyte |
| DE10129754A1 (en)* | 2001-06-20 | 2003-01-02 | Holger Jungmann | Detection of the presence of substances in vital tissue materials by passing light of a given wavelength through the material for its intensity to be compared with a reference system |
| US6631282B2 (en) | 2001-08-09 | 2003-10-07 | Optiscan Biomedical Corporation | Device for isolating regions of living tissue |
| US6731979B2 (en) | 2001-08-30 | 2004-05-04 | Biophan Technologies Inc. | Pulse width cardiac pacing apparatus |
| US7054686B2 (en)* | 2001-08-30 | 2006-05-30 | Biophan Technologies, Inc. | Pulsewidth electrical stimulation |
| US20030144582A1 (en)* | 2001-09-07 | 2003-07-31 | Carl Cohen | Portable non-invasive glucose monitor |
| US6748254B2 (en) | 2001-10-12 | 2004-06-08 | Nellcor Puritan Bennett Incorporated | Stacked adhesive optical sensor |
| US6988001B2 (en)* | 2001-10-31 | 2006-01-17 | Biophan Technologies, Inc. | Hermetic component housing for photonic catheter |
| US7473229B2 (en)* | 2001-12-10 | 2009-01-06 | Pranalytica, Inc. | Method of analyzing components of alveolar breath |
| US6968236B2 (en) | 2002-01-28 | 2005-11-22 | Biophan Technologies, Inc. | Ceramic cardiac electrodes |
| US8504128B2 (en)* | 2002-03-08 | 2013-08-06 | Glt Acquisition Corp. | Method and apparatus for coupling a channeled sample probe to tissue |
| US7697966B2 (en)* | 2002-03-08 | 2010-04-13 | Sensys Medical, Inc. | Noninvasive targeting system method and apparatus |
| US20070149868A1 (en)* | 2002-03-08 | 2007-06-28 | Blank Thomas B | Method and Apparatus for Photostimulation Enhanced Analyte Property Estimation |
| US20050054908A1 (en)* | 2003-03-07 | 2005-03-10 | Blank Thomas B. | Photostimulation method and apparatus in combination with glucose determination |
| US20050187439A1 (en)* | 2003-03-07 | 2005-08-25 | Blank Thomas B. | Sampling interface system for in-vivo estimation of tissue analyte concentration |
| US8718738B2 (en)* | 2002-03-08 | 2014-05-06 | Glt Acquisition Corp. | Method and apparatus for coupling a sample probe with a sample site |
| JP4189322B2 (en)* | 2002-03-08 | 2008-12-03 | センシス メディカル インク | Compact instrument for non-invasive measurement of glucose by near infrared spectroscopy |
| US6654125B2 (en) | 2002-04-04 | 2003-11-25 | Inlight Solutions, Inc | Method and apparatus for optical spectroscopy incorporating a vertical cavity surface emitting laser (VCSEL) as an interferometer reference |
| US7027848B2 (en)* | 2002-04-04 | 2006-04-11 | Inlight Solutions, Inc. | Apparatus and method for non-invasive spectroscopic measurement of analytes in tissue using a matched reference analyte |
| US6711440B2 (en) | 2002-04-11 | 2004-03-23 | Biophan Technologies, Inc. | MRI-compatible medical device with passive generation of optical sensing signals |
| US6725092B2 (en) | 2002-04-25 | 2004-04-20 | Biophan Technologies, Inc. | Electromagnetic radiation immune medical assist device adapter |
| US6925322B2 (en)* | 2002-07-25 | 2005-08-02 | Biophan Technologies, Inc. | Optical MRI catheter system |
| US7096052B2 (en)* | 2002-10-04 | 2006-08-22 | Masimo Corporation | Optical probe including predetermined emission wavelength based on patient type |
| US7190986B1 (en) | 2002-10-18 | 2007-03-13 | Nellcor Puritan Bennett Inc. | Non-adhesive oximeter sensor for sensitive skin |
| US6954663B2 (en)* | 2003-01-07 | 2005-10-11 | Art Advanced Research Technologies Inc. | Continuous wave optical imaging assuming a scatter-law |
| US7388691B2 (en)* | 2003-02-26 | 2008-06-17 | Transpecific Ip Ltd. | Method of operating a double-sided scanner |
| US20050159656A1 (en)* | 2003-03-07 | 2005-07-21 | Hockersmith Linda J. | Method and apparatus for presentation of noninvasive glucose concentration information |
| US7356365B2 (en)* | 2003-07-09 | 2008-04-08 | Glucolight Corporation | Method and apparatus for tissue oximetry |
| US20070234300A1 (en)* | 2003-09-18 | 2007-10-04 | Leake David W | Method and Apparatus for Performing State-Table Driven Regression Testing |
| US20050073690A1 (en)* | 2003-10-03 | 2005-04-07 | Abbink Russell E. | Optical spectroscopy incorporating a vertical cavity surface emitting laser (VCSEL) |
| JP3801172B2 (en)* | 2003-11-25 | 2006-07-26 | 株式会社日立製作所 | Biological light measurement device |
| US7510849B2 (en)* | 2004-01-29 | 2009-03-31 | Glucolight Corporation | OCT based method for diagnosis and therapy |
| US7162288B2 (en) | 2004-02-25 | 2007-01-09 | Nellcor Purtain Bennett Incorporated | Techniques for detecting heart pulses and reducing power consumption in sensors |
| DE102004011631B4 (en)* | 2004-03-10 | 2011-03-24 | Ott, Lutz, Dipl.-Ing. | Method and device for the deep-selective detection of spontaneous activities and general muscle activities |
| US20080033275A1 (en)* | 2004-04-28 | 2008-02-07 | Blank Thomas B | Method and Apparatus for Sample Probe Movement Control |
| US8868147B2 (en)* | 2004-04-28 | 2014-10-21 | Glt Acquisition Corp. | Method and apparatus for controlling positioning of a noninvasive analyzer sample probe |
| WO2006009906A2 (en)* | 2004-06-17 | 2006-01-26 | The Regents Of The University Of California | Time-resolved non-invasive autofluorescence device for detecting diabetes |
| US7254429B2 (en) | 2004-08-11 | 2007-08-07 | Glucolight Corporation | Method and apparatus for monitoring glucose levels in a biological tissue |
| US8036727B2 (en)* | 2004-08-11 | 2011-10-11 | Glt Acquisition Corp. | Methods for noninvasively measuring analyte levels in a subject |
| GB0421793D0 (en)* | 2004-10-01 | 2004-11-03 | Univ Aston | Sensing device |
| DE112004002988B4 (en)* | 2004-10-15 | 2013-06-06 | Nagasaki Prefectural Government | Instrument for non-invasive measurement of blood sugar level |
| TWI258123B (en)* | 2005-02-03 | 2006-07-11 | Lite On It Corp | Apparatus for positioning a clamper of a disc driver |
| US20070078311A1 (en)* | 2005-03-01 | 2007-04-05 | Ammar Al-Ali | Disposable multiple wavelength optical sensor |
| US7647083B2 (en) | 2005-03-01 | 2010-01-12 | Masimo Laboratories, Inc. | Multiple wavelength sensor equalization |
| US20060217602A1 (en)* | 2005-03-04 | 2006-09-28 | Alan Abul-Haj | Method and apparatus for noninvasive targeting |
| WO2006110859A2 (en) | 2005-04-13 | 2006-10-19 | Glucolight Corporation | Method for data reduction and calibration of an oct-based blood glucose monitor |
| US7330747B2 (en)* | 2005-06-07 | 2008-02-12 | Chemimage Corporation | Invasive chemometry |
| US7330746B2 (en)* | 2005-06-07 | 2008-02-12 | Chem Image Corporation | Non-invasive biochemical analysis |
| US7657295B2 (en) | 2005-08-08 | 2010-02-02 | Nellcor Puritan Bennett Llc | Medical sensor and technique for using the same |
| US7590439B2 (en) | 2005-08-08 | 2009-09-15 | Nellcor Puritan Bennett Llc | Bi-stable medical sensor and technique for using the same |
| US7657294B2 (en) | 2005-08-08 | 2010-02-02 | Nellcor Puritan Bennett Llc | Compliant diaphragm medical sensor and technique for using the same |
| US7355688B2 (en)* | 2005-09-08 | 2008-04-08 | Vioptix, Inc. | Optical probe for optical imaging system |
| US20070060808A1 (en) | 2005-09-12 | 2007-03-15 | Carine Hoarau | Medical sensor for reducing motion artifacts and technique for using the same |
| US7904130B2 (en) | 2005-09-29 | 2011-03-08 | Nellcor Puritan Bennett Llc | Medical sensor and technique for using the same |
| US7899510B2 (en) | 2005-09-29 | 2011-03-01 | Nellcor Puritan Bennett Llc | Medical sensor and technique for using the same |
| US8092379B2 (en) | 2005-09-29 | 2012-01-10 | Nellcor Puritan Bennett Llc | Method and system for determining when to reposition a physiological sensor |
| US7869850B2 (en) | 2005-09-29 | 2011-01-11 | Nellcor Puritan Bennett Llc | Medical sensor for reducing motion artifacts and technique for using the same |
| US7486979B2 (en) | 2005-09-30 | 2009-02-03 | Nellcor Puritan Bennett Llc | Optically aligned pulse oximetry sensor and technique for using the same |
| US7483731B2 (en) | 2005-09-30 | 2009-01-27 | Nellcor Puritan Bennett Llc | Medical sensor and technique for using the same |
| US8233954B2 (en) | 2005-09-30 | 2012-07-31 | Nellcor Puritan Bennett Llc | Mucosal sensor for the assessment of tissue and blood constituents and technique for using the same |
| US8062221B2 (en) | 2005-09-30 | 2011-11-22 | Nellcor Puritan Bennett Llc | Sensor for tissue gas detection and technique for using the same |
| US7555327B2 (en) | 2005-09-30 | 2009-06-30 | Nellcor Puritan Bennett Llc | Folding medical sensor and technique for using the same |
| US7881762B2 (en) | 2005-09-30 | 2011-02-01 | Nellcor Puritan Bennett Llc | Clip-style medical sensor and technique for using the same |
| WO2007060583A2 (en)* | 2005-11-28 | 2007-05-31 | Koninklijke Philips Electronics N.V. | Method and apparatus for determining concentrations of analytes in a turbid medium |
| EP2243425B1 (en) | 2005-11-30 | 2014-08-13 | Toshiba Medical Systems Corporation | Method for noninvasive measurement of glucose and apparatus for noninvasive measurement of glucose |
| US7978081B2 (en)* | 2006-01-09 | 2011-07-12 | Applied Technology Holdings, Inc. | Apparatus, systems, and methods for communicating biometric and biomechanical information |
| US7477924B2 (en) | 2006-05-02 | 2009-01-13 | Nellcor Puritan Bennett Llc | Medical sensor and technique for using the same |
| US7522948B2 (en) | 2006-05-02 | 2009-04-21 | Nellcor Puritan Bennett Llc | Medical sensor and technique for using the same |
| US8073518B2 (en) | 2006-05-02 | 2011-12-06 | Nellcor Puritan Bennett Llc | Clip-style medical sensor and technique for using the same |
| US8145288B2 (en) | 2006-08-22 | 2012-03-27 | Nellcor Puritan Bennett Llc | Medical sensor for reducing signal artifacts and technique for using the same |
| US8219170B2 (en) | 2006-09-20 | 2012-07-10 | Nellcor Puritan Bennett Llc | System and method for practicing spectrophotometry using light emitting nanostructure devices |
| US8195264B2 (en) | 2006-09-22 | 2012-06-05 | Nellcor Puritan Bennett Llc | Medical sensor for reducing signal artifacts and technique for using the same |
| US8396527B2 (en) | 2006-09-22 | 2013-03-12 | Covidien Lp | Medical sensor for reducing signal artifacts and technique for using the same |
| US8175671B2 (en) | 2006-09-22 | 2012-05-08 | Nellcor Puritan Bennett Llc | Medical sensor for reducing signal artifacts and technique for using the same |
| US7869849B2 (en) | 2006-09-26 | 2011-01-11 | Nellcor Puritan Bennett Llc | Opaque, electrically nonconductive region on a medical sensor |
| US7574245B2 (en) | 2006-09-27 | 2009-08-11 | Nellcor Puritan Bennett Llc | Flexible medical sensor enclosure |
| US7796403B2 (en) | 2006-09-28 | 2010-09-14 | Nellcor Puritan Bennett Llc | Means for mechanical registration and mechanical-electrical coupling of a faraday shield to a photodetector and an electrical circuit |
| US7890153B2 (en) | 2006-09-28 | 2011-02-15 | Nellcor Puritan Bennett Llc | System and method for mitigating interference in pulse oximetry |
| US8175667B2 (en) | 2006-09-29 | 2012-05-08 | Nellcor Puritan Bennett Llc | Symmetric LED array for pulse oximetry |
| US7684842B2 (en) | 2006-09-29 | 2010-03-23 | Nellcor Puritan Bennett Llc | System and method for preventing sensor misuse |
| US7476131B2 (en) | 2006-09-29 | 2009-01-13 | Nellcor Puritan Bennett Llc | Device for reducing crosstalk |
| US8068891B2 (en) | 2006-09-29 | 2011-11-29 | Nellcor Puritan Bennett Llc | Symmetric LED array for pulse oximetry |
| US7680522B2 (en) | 2006-09-29 | 2010-03-16 | Nellcor Puritan Bennett Llc | Method and apparatus for detecting misapplied sensors |
| US8265723B1 (en) | 2006-10-12 | 2012-09-11 | Cercacor Laboratories, Inc. | Oximeter probe off indicator defining probe off space |
| JP5018105B2 (en)* | 2007-01-25 | 2012-09-05 | 株式会社日立製作所 | Biological light measurement device |
| US8639309B2 (en) | 2007-07-31 | 2014-01-28 | J&M Shuler, Inc. | Method and system for monitoring oxygenation levels of compartments and tissue |
| US8100834B2 (en)* | 2007-02-27 | 2012-01-24 | J&M Shuler, Inc. | Method and system for monitoring oxygenation levels of a compartment for detecting conditions of a compartment syndrome |
| US8265724B2 (en) | 2007-03-09 | 2012-09-11 | Nellcor Puritan Bennett Llc | Cancellation of light shunting |
| US8280469B2 (en) | 2007-03-09 | 2012-10-02 | Nellcor Puritan Bennett Llc | Method for detection of aberrant tissue spectra |
| US7894869B2 (en) | 2007-03-09 | 2011-02-22 | Nellcor Puritan Bennett Llc | Multiple configuration medical sensor and technique for using the same |
| EP2139383B1 (en) | 2007-03-27 | 2013-02-13 | Masimo Laboratories, Inc. | Multiple wavelength optical sensor |
| US8374665B2 (en) | 2007-04-21 | 2013-02-12 | Cercacor Laboratories, Inc. | Tissue profile wellness monitor |
| US20090036759A1 (en)* | 2007-08-01 | 2009-02-05 | Ault Timothy E | Collapsible noninvasive analyzer method and apparatus |
| US8346328B2 (en) | 2007-12-21 | 2013-01-01 | Covidien Lp | Medical sensor and technique for using the same |
| US8352004B2 (en) | 2007-12-21 | 2013-01-08 | Covidien Lp | Medical sensor and technique for using the same |
| US8366613B2 (en) | 2007-12-26 | 2013-02-05 | Covidien Lp | LED drive circuit for pulse oximetry and method for using same |
| US8577434B2 (en) | 2007-12-27 | 2013-11-05 | Covidien Lp | Coaxial LED light sources |
| US8442608B2 (en) | 2007-12-28 | 2013-05-14 | Covidien Lp | System and method for estimating physiological parameters by deconvolving artifacts |
| US8452364B2 (en) | 2007-12-28 | 2013-05-28 | Covidien LLP | System and method for attaching a sensor to a patient's skin |
| US8092993B2 (en) | 2007-12-31 | 2012-01-10 | Nellcor Puritan Bennett Llc | Hydrogel thin film for use as a biosensor |
| US8199007B2 (en) | 2007-12-31 | 2012-06-12 | Nellcor Puritan Bennett Llc | Flex circuit snap track for a biometric sensor |
| US8070508B2 (en) | 2007-12-31 | 2011-12-06 | Nellcor Puritan Bennett Llc | Method and apparatus for aligning and securing a cable strain relief |
| US8897850B2 (en) | 2007-12-31 | 2014-11-25 | Covidien Lp | Sensor with integrated living hinge and spring |
| US8571617B2 (en)* | 2008-03-04 | 2013-10-29 | Glt Acquisition Corp. | Flowometry in optical coherence tomography for analyte level estimation |
| US8437822B2 (en) | 2008-03-28 | 2013-05-07 | Covidien Lp | System and method for estimating blood analyte concentration |
| US8112375B2 (en) | 2008-03-31 | 2012-02-07 | Nellcor Puritan Bennett Llc | Wavelength selection and outlier detection in reduced rank linear models |
| CA3194784A1 (en) | 2008-05-20 | 2009-11-26 | University Health Network | Device and method for fluorescence-based imaging and monitoring |
| US7880884B2 (en) | 2008-06-30 | 2011-02-01 | Nellcor Puritan Bennett Llc | System and method for coating and shielding electronic sensor components |
| US20090324033A1 (en)* | 2008-06-30 | 2009-12-31 | Nellcor Puritan Bennett Ireland | Signal Processing Systems and Methods for Determining Slope Using an Origin Point |
| US8071935B2 (en) | 2008-06-30 | 2011-12-06 | Nellcor Puritan Bennett Llc | Optical detector with an overmolded faraday shield |
| US7887345B2 (en) | 2008-06-30 | 2011-02-15 | Nellcor Puritan Bennett Llc | Single use connector for pulse oximetry sensors |
| US20100004518A1 (en) | 2008-07-03 | 2010-01-07 | Masimo Laboratories, Inc. | Heat sink for noninvasive medical sensor |
| US8515509B2 (en) | 2008-08-04 | 2013-08-20 | Cercacor Laboratories, Inc. | Multi-stream emitter for noninvasive measurement of blood constituents |
| US8364220B2 (en) | 2008-09-25 | 2013-01-29 | Covidien Lp | Medical sensor and technique for using the same |
| US8433382B2 (en)* | 2008-09-30 | 2013-04-30 | Covidien Lp | Transmission mode photon density wave system and method |
| US8423112B2 (en) | 2008-09-30 | 2013-04-16 | Covidien Lp | Medical sensor and technique for using the same |
| US8386000B2 (en)* | 2008-09-30 | 2013-02-26 | Covidien Lp | System and method for photon density wave pulse oximetry and pulse hemometry |
| US8914088B2 (en) | 2008-09-30 | 2014-12-16 | Covidien Lp | Medical sensor and technique for using the same |
| US8417309B2 (en) | 2008-09-30 | 2013-04-09 | Covidien Lp | Medical sensor |
| US8452366B2 (en) | 2009-03-16 | 2013-05-28 | Covidien Lp | Medical monitoring device with flexible circuitry |
| US8221319B2 (en) | 2009-03-25 | 2012-07-17 | Nellcor Puritan Bennett Llc | Medical device for assessing intravascular blood volume and technique for using the same |
| US8509869B2 (en) | 2009-05-15 | 2013-08-13 | Covidien Lp | Method and apparatus for detecting and analyzing variations in a physiologic parameter |
| US8634891B2 (en) | 2009-05-20 | 2014-01-21 | Covidien Lp | Method and system for self regulation of sensor component contact pressure |
| US9010634B2 (en) | 2009-06-30 | 2015-04-21 | Covidien Lp | System and method for linking patient data to a patient and providing sensor quality assurance |
| US8505821B2 (en) | 2009-06-30 | 2013-08-13 | Covidien Lp | System and method for providing sensor quality assurance |
| US8311601B2 (en) | 2009-06-30 | 2012-11-13 | Nellcor Puritan Bennett Llc | Reflectance and/or transmissive pulse oximeter |
| US8391941B2 (en) | 2009-07-17 | 2013-03-05 | Covidien Lp | System and method for memory switching for multiple configuration medical sensor |
| US8417310B2 (en) | 2009-08-10 | 2013-04-09 | Covidien Lp | Digital switching in multi-site sensor |
| US8428675B2 (en) | 2009-08-19 | 2013-04-23 | Covidien Lp | Nanofiber adhesives used in medical devices |
| US8494604B2 (en)* | 2009-09-21 | 2013-07-23 | Covidien Lp | Wavelength-division multiplexing in a multi-wavelength photon density wave system |
| US8788001B2 (en)* | 2009-09-21 | 2014-07-22 | Covidien Lp | Time-division multiplexing in a multi-wavelength photon density wave system |
| US8401608B2 (en)* | 2009-09-30 | 2013-03-19 | Covidien Lp | Method of analyzing photon density waves in a medical monitor |
| US8290558B1 (en) | 2009-11-23 | 2012-10-16 | Vioptix, Inc. | Tissue oximeter intraoperative sensor |
| US9839381B1 (en) | 2009-11-24 | 2017-12-12 | Cercacor Laboratories, Inc. | Physiological measurement system with automatic wavelength adjustment |
| WO2011069122A1 (en) | 2009-12-04 | 2011-06-09 | Masimo Corporation | Calibration for multi-stage physiological monitors |
| US8391943B2 (en) | 2010-03-31 | 2013-03-05 | Covidien Lp | Multi-wavelength photon density wave system using an optical switch |
| US7884933B1 (en)* | 2010-05-05 | 2011-02-08 | Revolutionary Business Concepts, Inc. | Apparatus and method for determining analyte concentrations |
| EP2621333B1 (en) | 2010-09-28 | 2015-07-29 | Masimo Corporation | Depth of consciousness monitor including oximeter |
| US9775545B2 (en) | 2010-09-28 | 2017-10-03 | Masimo Corporation | Magnetic electrical connector for patient monitors |
| US8489164B2 (en)* | 2010-10-27 | 2013-07-16 | Medtronic, Inc. | Monitoring of tissue hemoglobin concentration |
| WO2012061584A2 (en) | 2010-11-03 | 2012-05-10 | University Of Washington Through Its Center For Commercialization | Deternimation of tissue oxygenation in vivo |
| DE102010062015B4 (en)* | 2010-11-26 | 2021-09-02 | Endress+Hauser Conducta Gmbh+Co. Kg | Measuring device for measuring absorption or scattering at different wavelengths |
| US8805465B2 (en) | 2010-11-30 | 2014-08-12 | Covidien Lp | Multiple sensor assemblies and cables in a single sensor body |
| US9545223B2 (en) | 2011-03-02 | 2017-01-17 | Board Of Regents, The University Of Texas System | Functional near infrared spectroscopy imaging system and method |
| US9833146B2 (en) | 2012-04-17 | 2017-12-05 | Covidien Lp | Surgical system and method of use of the same |
| US20150018646A1 (en) | 2013-07-12 | 2015-01-15 | Sandeep Gulati | Dynamic sample mapping noninvasive analyzer apparatus and method of use thereof |
| WO2015051016A1 (en)* | 2013-10-01 | 2015-04-09 | The General Hospital Corporation | System, method and computer-accessible medium for utilizing discrete fourier-transform for frequency near-infrared spectroscopy |
| EP3013217B1 (en)* | 2014-01-07 | 2017-02-22 | Opsolution GmbH | Device and method for determining a concentration in a sample |
| DE202014010964U1 (en)* | 2014-03-07 | 2017-03-10 | Laser- Und Medizin-Technologie Gmbh, Berlin | Sensor device for spatially resolving detection of target substances |
| USD763938S1 (en) | 2014-04-02 | 2016-08-16 | Cephalogics, LLC | Optical sensor array |
| USD763939S1 (en) | 2014-04-02 | 2016-08-16 | Cephalogics, LLC | Optical sensor array liner with optical sensor array pad |
| JP6769949B2 (en) | 2014-07-24 | 2020-10-14 | ユニバーシティー ヘルス ネットワーク | Data collection and analysis for diagnostic purposes |
| WO2016054079A1 (en) | 2014-09-29 | 2016-04-07 | Zyomed Corp. | Systems and methods for blood glucose and other analyte detection and measurement using collision computing |
| US10154815B2 (en) | 2014-10-07 | 2018-12-18 | Masimo Corporation | Modular physiological sensors |
| JP6570852B2 (en)* | 2015-03-20 | 2019-09-04 | 株式会社東芝 | Biological component estimation device, biological component estimation method, and program |
| US10638960B2 (en) | 2015-10-26 | 2020-05-05 | Reveal Biosensors, Inc. | Optical physiologic sensor methods |
| US10055948B2 (en) | 2015-11-30 | 2018-08-21 | Nike, Inc. | Apparel with ultrasonic position sensing and haptic feedback for activities |
| WO2017119130A1 (en)* | 2016-01-08 | 2017-07-13 | 株式会社三菱ケミカルホールディングス | Non-invasive biological lipid measuring instrument and non-invasive biological lipid measuring method |
| US9554738B1 (en) | 2016-03-30 | 2017-01-31 | Zyomed Corp. | Spectroscopic tomography systems and methods for noninvasive detection and measurement of analytes using collision computing |
| EP3315069A1 (en)* | 2016-10-25 | 2018-05-02 | Roche Diabetes Care GmbH | Method for determination of an analyte concentration in a body fluid and analyte concentration measurement device |
| US10441379B2 (en) | 2017-12-28 | 2019-10-15 | 3Gen, Inc. | Multipurpose medical illuminator with magnification |
| JPWO2019208718A1 (en)* | 2018-04-26 | 2021-05-27 | メディカルフォトニクス株式会社 | Lipid concentration measuring device and its method |
| US11395714B2 (en) | 2019-11-11 | 2022-07-26 | Dermlite Llc | Medical illuminator with variable polarization |
| WO2021146333A1 (en) | 2020-01-13 | 2021-07-22 | Masimo Corporation | Wearable device with physiological parameters monitoring |
| CN111562237A (en)* | 2020-05-26 | 2020-08-21 | 中国科学院合肥物质科学研究院 | CO based on double-beam cavity enhanced spectroscopy technology2、N2O stable isotope simultaneous detection device and method |
| GB2600681B (en)* | 2020-10-23 | 2023-08-02 | Comind Tech Limited | Event related optical signal neuroimaging and analysis system for monitoring activity of a subject's brain |
| EP4370022A1 (en) | 2021-07-13 | 2024-05-22 | Masimo Corporation | Wearable device with physiological parameters monitoring |
| US12201396B2 (en)* | 2021-09-10 | 2025-01-21 | Rockley Photonics Limited | Optical speckle receiver |
| US12396648B1 (en) | 2024-11-27 | 2025-08-26 | Rockley Photonics Limited | Wearable device with light source and optical sensor |
Family Cites Families (29)
| Publication number | Priority date | Publication date | Assignee | Title |
|---|---|---|---|---|
| US4840485A (en)* | 1986-12-17 | 1989-06-20 | I.S.S. (U.S.A.) Inc. | Frequency domain cross-correlation fluorometry with phase-locked loop frequency synthesizers |
| US4854699A (en)* | 1987-11-02 | 1989-08-08 | Nippon Colin Co., Ltd. | Backscatter oximeter |
| CA1331483C (en)* | 1988-11-02 | 1994-08-16 | Britton Chance | User-wearable hemoglobinometer for measuring the metabolic condition of a subject |
| US5564417A (en)* | 1991-01-24 | 1996-10-15 | Non-Invasive Technology, Inc. | Pathlength corrected oximeter and the like |
| US5402778A (en)* | 1993-01-19 | 1995-04-04 | Nim Incorporated | Spectrophotometric examination of tissue of small dimension |
| US5122974A (en)* | 1989-02-06 | 1992-06-16 | Nim, Inc. | Phase modulated spectrophotometry |
| US4972331A (en)* | 1989-02-06 | 1990-11-20 | Nim, Inc. | Phase modulated spectrophotometry |
| JPH06103257B2 (en)* | 1988-12-19 | 1994-12-14 | 大塚電子株式会社 | Method and apparatus for measuring absorption coefficient of substance using light scattering |
| US5353799A (en)* | 1991-01-22 | 1994-10-11 | Non Invasive Technology, Inc. | Examination of subjects using photon migration with high directionality techniques |
| US5187672A (en)* | 1989-02-06 | 1993-02-16 | Nim Incorporated | Phase modulation spectroscopic system |
| US5553614A (en)* | 1988-12-21 | 1996-09-10 | Non-Invasive Technology, Inc. | Examination of biological tissue using frequency domain spectroscopy |
| GB2227832A (en)* | 1989-02-06 | 1990-08-08 | Hamamatsu Photonics Kk | Optical examination apparatus |
| GB2228314B (en)* | 1989-02-16 | 1992-11-18 | Hamamatsu Photonics Kk | Examination apparatus |
| CA2028261C (en)* | 1989-10-28 | 1995-01-17 | Won Suck Yang | Non-invasive method and apparatus for measuring blood glucose concentration |
| EP0613653B1 (en)* | 1990-02-15 | 1996-11-13 | Hewlett-Packard GmbH | Method for non-invasive measurement of oxygen saturation |
| JPH0497021A (en) | 1990-08-10 | 1992-03-30 | Asahi Boukaban Kogyosho:Kk | Construction of underground structure |
| US5209231A (en)* | 1990-11-02 | 1993-05-11 | University Of Connecticut | Optical glucose sensor apparatus and method |
| US5213105A (en)* | 1990-12-04 | 1993-05-25 | Research Corporation Technologies, Inc. | Frequency domain optical imaging using diffusion of intensity modulated radiation |
| US5243983A (en)* | 1990-12-14 | 1993-09-14 | Georgia Tech Research Corporation | Non-invasive blood glucose measurement system and method using stimulated raman spectroscopy |
| EP0497021A1 (en)* | 1991-01-31 | 1992-08-05 | Hamamatsu Photonics K.K. | Oximeter with monitor |
| US5212386A (en)* | 1991-12-13 | 1993-05-18 | I.S.S. (U.S.A.) Inc. | High speed cross-correlation frequency domain fluorometry-phosphorimetry |
| US5267715A (en)* | 1992-02-14 | 1993-12-07 | Owen James D | Patio rail shelf bracket |
| US5331958A (en)* | 1992-03-31 | 1994-07-26 | University Of Manitoba | Spectrophotometric blood analysis |
| US5348003A (en)* | 1992-09-03 | 1994-09-20 | Sirraya, Inc. | Method and apparatus for chemical analysis |
| IL107396A (en)* | 1992-11-09 | 1997-02-18 | Boehringer Mannheim Gmbh | Method and apparatus for analytical determination of glucose in a biological matrix |
| US5515847A (en)* | 1993-01-28 | 1996-05-14 | Optiscan, Inc. | Self-emission noninvasive infrared spectrophotometer |
| JP3433498B2 (en)* | 1993-06-02 | 2003-08-04 | 浜松ホトニクス株式会社 | Method and apparatus for measuring internal information of scattering medium |
| US5492118A (en)* | 1993-12-16 | 1996-02-20 | Board Of Trustees Of The University Of Illinois | Determining material concentrations in tissues |
| AU676971B1 (en)* | 1995-08-24 | 1997-03-27 | Dainichiseika Color & Chemicals Mfg. Co. Ltd. | Production process of connected microgel particles and articles treated with connected microgel particles |
- 1994
- 1994-06-03USUS08/253,935patent/US5492118A/ennot_activeExpired - Lifetime
- 1994-12-12CACA002137878Apatent/CA2137878C/ennot_activeExpired - Lifetime
- 1994-12-12JPJP33254294Apatent/JP3619969B2/ennot_activeExpired - Fee Related
- 1994-12-14ATAT94309361Tpatent/ATE219242T1/ennot_activeIP Right Cessation
- 1994-12-14DEDE69430791Tpatent/DE69430791T2/ennot_activeExpired - Lifetime
- 1994-12-14EPEP94309361Apatent/EP0663591B1/ennot_activeExpired - Lifetime
- 1995
- 1995-11-29USUS08/564,439patent/US5772587A/ennot_activeExpired - Lifetime
- 1998
- 1998-05-04USUS09/072,912patent/US6192261B1/ennot_activeExpired - Lifetime
Also Published As
| Publication number | Publication date |
|---|---|
| CA2137878C (en) | 2007-04-24 |
| JPH0889500A (en) | 1996-04-09 |
| CA2137878A1 (en) | 1995-06-17 |
| DE69430791T2 (en) | 2003-02-06 |
| EP0663591A1 (en) | 1995-07-19 |
| DE69430791D1 (en) | 2002-07-18 |
| US5492118A (en) | 1996-02-20 |
| EP0663591B1 (en) | 2002-06-12 |
| ATE219242T1 (en) | 2002-06-15 |
| US5772587A (en) | 1998-06-30 |
| US6192261B1 (en) | 2001-02-20 |
Similar Documents
| Publication | Publication Date | Title |
|---|---|---|
| JP3619969B2 (en) | Light sensor with multiple light sources | |
| US5497769A (en) | Photosensor with multiple light sources | |
| US6216021B1 (en) | Method for measuring absolute saturation of time-varying and other hemoglobin compartments | |
| AU707523B2 (en) | Non-invasive blood analyte sensor | |
| EP3094251B1 (en) | Near-infrared spectroscopy and diffuse correlation spectroscopy device and methods | |
| Cysewska-Sobusiak | Metrological problems with noninvasive transillumination of living tissues | |
| US6985763B2 (en) | Method for measuring venous oxygen saturation | |
| JP4490587B2 (en) | Device for noninvasive detection of oxygen metabolism in tissues | |
| Zourabian et al. | Trans-abdominal monitoring of fetal arterial blood oxygenation using pulse oximetry | |
| EP2079363B1 (en) | Method for in vivo measurement of biological parameters | |
| JP4465271B2 (en) | Apparatus for noninvasively determining blood oxygen saturation in a target tissue | |
| US5277181A (en) | Noninvasive measurement of hematocrit and hemoglobin content by differential optical analysis | |
| EP2273914B1 (en) | Method for dating a body sample | |
| US20120277559A1 (en) | Apparatus for Measuring Blood Parameters | |
| US20110082355A1 (en) | Photoplethysmography device and method | |
| JPH11244267A (en) | Blood component concentration measuring device | |
| JP2021532846A (en) | Performing transabdominal fetal oximetry using optical tomography | |
| WO1996028085A1 (en) | Isolated layer pulse oximetry | |
| WO2007018921A2 (en) | Electro-optical system, aparatus, and method for ambulatory monitoring | |
| JP2004528917A5 (en) | ||
| WO1993012712A1 (en) | Blood constituent determination based on differential spectral analysis | |
| JPH08509287A (en) | Spectrophotometric inspection of small size tissue | |
| JP2000060826A (en) | Noninvasive vital component measuring instrument | |
| HU216847B (en) | Method and arrangement for prompt non-invasive determination of blood parameters | |
| EP1221034B1 (en) | Method and system for imaging the dynamics of scattering medium |
Legal Events
| Date | Code | Title | Description |
|---|---|---|---|
| A02 | Decision of refusal | Free format text:JAPANESE INTERMEDIATE CODE: A02 Effective date:20040525 | |
| A521 | Request for written amendment filed | Free format text:JAPANESE INTERMEDIATE CODE: A523 Effective date:20040820 | |
| A911 | Transfer to examiner for re-examination before appeal (zenchi) | Free format text:JAPANESE INTERMEDIATE CODE: A911 Effective date:20040928 | |
| TRDD | Decision of grant or rejection written | ||
| A01 | Written decision to grant a patent or to grant a registration (utility model) | Free format text:JAPANESE INTERMEDIATE CODE: A01 Effective date:20041102 | |
| A61 | First payment of annual fees (during grant procedure) | Free format text:JAPANESE INTERMEDIATE CODE: A61 Effective date:20041104 | |
| R150 | Certificate of patent or registration of utility model | Free format text:JAPANESE INTERMEDIATE CODE: R150 | |
| FPAY | Renewal fee payment (event date is renewal date of database) | Free format text:PAYMENT UNTIL: 20081126 Year of fee payment:4 | |
| FPAY | Renewal fee payment (event date is renewal date of database) | Free format text:PAYMENT UNTIL: 20081126 Year of fee payment:4 | |
| FPAY | Renewal fee payment (event date is renewal date of database) | Free format text:PAYMENT UNTIL: 20091126 Year of fee payment:5 | |
| FPAY | Renewal fee payment (event date is renewal date of database) | Free format text:PAYMENT UNTIL: 20101126 Year of fee payment:6 | |
| FPAY | Renewal fee payment (event date is renewal date of database) | Free format text:PAYMENT UNTIL: 20111126 Year of fee payment:7 | |
| FPAY | Renewal fee payment (event date is renewal date of database) | Free format text:PAYMENT UNTIL: 20121126 Year of fee payment:8 | |
| FPAY | Renewal fee payment (event date is renewal date of database) | Free format text:PAYMENT UNTIL: 20131126 Year of fee payment:9 | |
| R250 | Receipt of annual fees | Free format text:JAPANESE INTERMEDIATE CODE: R250 | |
| LAPS | Cancellation because of no payment of annual fees |