JP2023111727A - Planning method and planning program - Google Patents
Planning method and planning programDownload PDFInfo
- Publication number
- JP2023111727A JP2023111727AJP2022013730AJP2022013730AJP2023111727AJP 2023111727 AJP2023111727 AJP 2023111727AJP 2022013730 AJP2022013730 AJP 2022013730AJP 2022013730 AJP2022013730 AJP 2022013730AJP 2023111727 AJP2023111727 AJP 2023111727A
- Authority
- JP
- Japan
- Prior art keywords
- menu
- user
- service
- processing
- provider
- Prior art date
- Legal status (The legal status is an assumption and is not a legal conclusion. Google has not performed a legal analysis and makes no representation as to the accuracy of the status listed.)
- Pending
Links
Images


Classifications
- G—PHYSICS
- G16—INFORMATION AND COMMUNICATION TECHNOLOGY [ICT] SPECIALLY ADAPTED FOR SPECIFIC APPLICATION FIELDS
- G16H—HEALTHCARE INFORMATICS, i.e. INFORMATION AND COMMUNICATION TECHNOLOGY [ICT] SPECIALLY ADAPTED FOR THE HANDLING OR PROCESSING OF MEDICAL OR HEALTHCARE DATA
- G16H20/00—ICT specially adapted for therapies or health-improving plans, e.g. for handling prescriptions, for steering therapy or for monitoring patient compliance
- G16H20/60—ICT specially adapted for therapies or health-improving plans, e.g. for handling prescriptions, for steering therapy or for monitoring patient compliance relating to nutrition control, e.g. diets
- G—PHYSICS
- G16—INFORMATION AND COMMUNICATION TECHNOLOGY [ICT] SPECIALLY ADAPTED FOR SPECIFIC APPLICATION FIELDS
- G16H—HEALTHCARE INFORMATICS, i.e. INFORMATION AND COMMUNICATION TECHNOLOGY [ICT] SPECIALLY ADAPTED FOR THE HANDLING OR PROCESSING OF MEDICAL OR HEALTHCARE DATA
- G16H40/00—ICT specially adapted for the management or administration of healthcare resources or facilities; ICT specially adapted for the management or operation of medical equipment or devices
- G—PHYSICS
- G06—COMPUTING OR CALCULATING; COUNTING
- G06Q—INFORMATION AND COMMUNICATION TECHNOLOGY [ICT] SPECIALLY ADAPTED FOR ADMINISTRATIVE, COMMERCIAL, FINANCIAL, MANAGERIAL OR SUPERVISORY PURPOSES; SYSTEMS OR METHODS SPECIALLY ADAPTED FOR ADMINISTRATIVE, COMMERCIAL, FINANCIAL, MANAGERIAL OR SUPERVISORY PURPOSES, NOT OTHERWISE PROVIDED FOR
- G06Q10/00—Administration; Management
- G06Q10/06—Resources, workflows, human or project management; Enterprise or organisation planning; Enterprise or organisation modelling
- G06Q10/063—Operations research, analysis or management
- G06Q10/0631—Resource planning, allocation, distributing or scheduling for enterprises or organisations
- G—PHYSICS
- G06—COMPUTING OR CALCULATING; COUNTING
- G06Q—INFORMATION AND COMMUNICATION TECHNOLOGY [ICT] SPECIALLY ADAPTED FOR ADMINISTRATIVE, COMMERCIAL, FINANCIAL, MANAGERIAL OR SUPERVISORY PURPOSES; SYSTEMS OR METHODS SPECIALLY ADAPTED FOR ADMINISTRATIVE, COMMERCIAL, FINANCIAL, MANAGERIAL OR SUPERVISORY PURPOSES, NOT OTHERWISE PROVIDED FOR
- G06Q50/00—Information and communication technology [ICT] specially adapted for implementation of business processes of specific business sectors, e.g. utilities or tourism
- G06Q50/10—Services
- G06Q50/22—Social work or social welfare, e.g. community support activities or counselling services
- G—PHYSICS
- G06—COMPUTING OR CALCULATING; COUNTING
- G06Q—INFORMATION AND COMMUNICATION TECHNOLOGY [ICT] SPECIALLY ADAPTED FOR ADMINISTRATIVE, COMMERCIAL, FINANCIAL, MANAGERIAL OR SUPERVISORY PURPOSES; SYSTEMS OR METHODS SPECIALLY ADAPTED FOR ADMINISTRATIVE, COMMERCIAL, FINANCIAL, MANAGERIAL OR SUPERVISORY PURPOSES, NOT OTHERWISE PROVIDED FOR
- G06Q50/00—Information and communication technology [ICT] specially adapted for implementation of business processes of specific business sectors, e.g. utilities or tourism
- G06Q50/10—Services
- G06Q50/26—Government or public services
Landscapes
- Business, Economics & Management (AREA)
- Engineering & Computer Science (AREA)
- Health & Medical Sciences (AREA)
- Human Resources & Organizations (AREA)
- Tourism & Hospitality (AREA)
- Primary Health Care (AREA)
- General Health & Medical Sciences (AREA)
- Strategic Management (AREA)
- General Business, Economics & Management (AREA)
- Economics (AREA)
- Physics & Mathematics (AREA)
- General Physics & Mathematics (AREA)
- Theoretical Computer Science (AREA)
- Marketing (AREA)
- Public Health (AREA)
- Medical Informatics (AREA)
- Epidemiology (AREA)
- Entrepreneurship & Innovation (AREA)
- Educational Administration (AREA)
- Development Economics (AREA)
- Nutrition Science (AREA)
- Biomedical Technology (AREA)
- Quality & Reliability (AREA)
- Operations Research (AREA)
- Game Theory and Decision Science (AREA)
- Child & Adolescent Psychology (AREA)
- Management, Administration, Business Operations System, And Electronic Commerce (AREA)
- Medical Treatment And Welfare Office Work (AREA)
Abstract
Translated fromJapaneseDescription
Translated fromJapanese本発明は、計画立案方法および計画立案プログラムに関する。 The present invention relates to a planning method and a planning program.
近年、デジタルトランスフォーメーション(DX)の実現に向けて、既存の業務における様々な情報をデータとして収集し、このデータを利活用した既存業務の改善や効率化に期待が寄せられている。例えば、様々な業種において、提供するサービスの計画立案や実施の支援として、サービスに係る全てのステークホルダーの期待に基づいて具体的なメニューを推薦する技術がある。ステークホルダーは、例えば、サービスの計画の立案者、サービスを提供する提供者、サービスを受ける利用者を含む。 In recent years, toward the realization of digital transformation (DX), there are high expectations for collecting various information in existing operations as data and using this data to improve and streamline existing operations. For example, in various industries, there is a technique for recommending a specific menu based on the expectations of all stakeholders involved in the service as support for planning and implementation of services to be provided. Stakeholders include, for example, service planners, service providers, and service recipients.
従来、行政、病院、介護施設等における検診や治療、リハビリテーション(リハビリ)プラン等のサービスは、人手によって行われていた。しかし、AIや機械学習技術の進歩により、自動でサービスの計画立案や実施ができるようになってきており、データドリブンで効果的なサービスのメニューを推薦する技術が開発されている。 Conventionally, services such as examinations, treatments, rehabilitation (rehabilitation) plans, etc. in government, hospitals, nursing homes, etc. have been performed manually. However, advances in AI and machine learning technology have made it possible to automatically plan and implement services, and technologies have been developed to recommend data-driven and effective service menus.
計画立案のメニュー推薦に係る先行技術としては、例えば、過去の類似事例から対象利用者への介護度改善等の効果の最大化が見込めるパーソナルベストのメニューを推薦する技術がある。また、例えば、利用者のプロファイリングにより利用者自身の興味と疾病等のリスクを考慮してリハビリ計画のメニューに優先度を付けて推薦する技術がある。また、例えば、利用者に対する事前評価により、利用者の実施難度と効果を考慮してリハビリのメニューを推薦する技術がある。また、例えば、患者転帰データからの肯定的な転帰と医療製品の位置データとの間の相関関係を判定し、相関関係に基づいて医療資源使用実務を変更させるための医療提案を生成する技術がある。また、例えば、看護計画の変更時、看護計画、看護実績、評価度、看護計画の作成者、担当医療従事者の各情報を互いに紐付け、変更回数を付した個別看護計画情報をデータベースに格納し、医療従事者の条件指定により個別看護計画の情報を抽出する技術がある。また、例えば、被介護者を介護したケアプランで要介護度が改善する確率を求め、ケアプランのモデルを変更して要介護度の改善が期待できるケアプランを出力する技術がある。また、例えば、ケアプランについて、患者による再入院や不満のリスク、費用による評価でガイダンスを更新し、ケアプランの目標の達成をモデル学習で最適化する技術がある。また、例えば、患者看護計画による患者ケアプランとモニタリングアクションを個別の患者のアクションとライフスタイルに基づき選択し、患者ケアプランが時間と共に変化するにつれてモニタリング計画を変化させる技術がある。 As a prior art related to menu recommendation for planning, there is, for example, a technique for recommending a personal best menu that is expected to maximize effects such as improving the level of care for a target user based on similar cases in the past. Further, for example, there is a technique of prioritizing and recommending a menu of rehabilitation plans in consideration of the user's own interest and risk of illness or the like by profiling the user. Further, for example, there is a technique of recommending a rehabilitation menu based on a user's prior evaluation, taking into account the user's degree of difficulty and effectiveness. Also, for example, techniques for determining correlations between positive outcomes from patient outcome data and medical product location data and generating medical suggestions for changing medical resource usage practices based on the correlations. be. In addition, for example, when the nursing care plan is changed, each information of the nursing care plan, nursing performance, evaluation level, creator of the nursing care plan, and medical staff in charge are linked to each other, and the individual nursing care plan information with the number of changes is stored in the database. However, there is a technique for extracting information on an individualized nursing care plan according to conditions specified by medical staff. Further, for example, there is a technique of obtaining the probability of improvement in the level of care required in a care plan that takes care of a care recipient, changing the model of the care plan, and outputting a care plan that can be expected to improve the level of care required. In addition, for example, there is a technology for updating guidance based on the patient's risk of rehospitalization, dissatisfaction, and costs, and optimizing the achievement of care plan goals through model learning. There are also techniques for selecting a patient care plan and monitoring actions according to the patient care plan based on individual patient actions and lifestyle, and changing the monitoring plan as the patient care plan changes over time.
しかしながら、従来技術では、例えば、サービスの急なキャンセルや変更等による計画変更が生じると、推薦したメニューが実施されず、推薦時点で当初期待していた効果が得られないことがあった。従来技術では、立案者、提供者、利用者それぞれの都合や状況を考慮していないため、計画立案されたメニューの実施に対する計画変更の発生を考慮していない。推薦したメニューが実施されない場合、立案時に期待していた効果が得られなくなる。従来技術では、実際のサービス実施の状況を含めたメニュー推薦が行われていない。 However, with the conventional technology, for example, when a plan is changed due to sudden cancellation or change of service, the recommended menu is not implemented, and the initially expected effect at the time of recommendation may not be obtained. Since the prior art does not take into consideration the convenience and circumstances of the planner, provider, and user, it does not take into consideration the occurrence of plan changes in implementing the planned menu. If the recommended menu is not implemented, the effects expected at the time of planning cannot be obtained. In the conventional technology, menu recommendation including the actual service implementation status is not performed.
一つの側面では、本発明は、実施の可能性が高いサービスのメニューを推薦できることを目的とする。 An object of the present invention in one aspect is to be able to recommend a menu of services that are highly likely to be implemented.
一つの実施態様によれば、所定のサービスのメニューの情報と、前記サービスに関係するステークホルダーの情報とを取得し、前記ステークホルダーと前記メニューの組合せについて、前記メニューの実行の変更頻度を算出し、前記算出した変更頻度に基づいて、推薦対象のメニューを特定し、前記算出した組合せの前記ステークホルダーに対し、前記特定したメニューを出力する、処理をコンピュータが実行する計画立案方法および計画立案プログラムが提案される。 According to one embodiment, acquiring information on a menu of a predetermined service and information on a stakeholder related to the service, calculating a change frequency of execution of the menu for a combination of the stakeholder and the menu, A planning method and a planning program in which a computer executes a process of identifying a recommended menu based on the calculated change frequency and outputting the identified menu to the stakeholder of the calculated combination. be done.
一態様によれば、実施の可能性が高いサービスのメニューを推薦できるようになる。 According to one aspect, it becomes possible to recommend a menu of services that are highly likely to be implemented.
以下に、図面を参照して、本発明に係る計画立案方法および計画立案プログラムの実施の形態を詳細に説明する。 An embodiment of a planning method and a planning program according to the present invention will be described in detail below with reference to the drawings.
(実施の形態に係る計画立案方法の一実施例)
図1は、実施の形態に係る計画立案方法の一実施例を示す説明図である。計画立案装置100は、所定のサービスのメニューの情報と、サービスに関係するステークホルダーの情報を取得する。計画立案装置100は、ステークホルダーとメニューの組合せについて、メニュー実行の変更頻度を算出する。計画立案装置100は、算出した変更頻度に基づいて、推薦対象のメニューを特定する。そして、計画立案装置100は、算出した組合せのステークホルダーに対し、特定したメニューを出力する。計画立案装置100は、これらの処理を行うためのコンピュータである。(One example of the planning method according to the embodiment)
FIG. 1 is an explanatory diagram showing an example of a planning method according to an embodiment. The
計画立案装置100は、例えば、サーバやPC(Personal Computer)であり、計画立案装置100の制御を実行する制御部を含む。計画立案装置100は、クラウドサーバであってもよく、制御部の機能はクラウド上で任意に配置してもよい。 The
実施の形態の説明において、ステークホルダーのうち、立案者は、あるサービス、例えば、リハビリ計画のメニューを計画立案する。提供者は、立案者が計画したリハビリ計画のメニューを利用者に出力する。利用者は、提供者が提供したリハビリ計画のメニューに基づくリハビリを実施する。 In the description of the embodiment, among stakeholders, a planner plans a menu of a certain service, for example, a rehabilitation plan. The provider outputs to the user the rehabilitation plan menu planned by the planner. The user performs rehabilitation based on the rehabilitation plan menu provided by the provider.
実施の形態で説明する「計画変更」とは、計画されたサービスのメニューの実施における変更であり、関係者であるステークホルダーの恣意/意図に応じて起こる。計画変更として、以下の例がある。 A “plan change” described in the embodiment is a change in the implementation of a planned menu of services, which occurs according to the arbitrariness/intention of the stakeholder concerned. Examples of plan changes include:
ある利用者は、”時間を誤って認識しており”、メニューiを受けられなかった/受けるまでに時間がかかった。
ある利用者は、”以前失敗したので”、メニューiを受けるのをやめた。
ある提供者は、”準備に時間がかかり”、メニューiを提供できなかった/提供までに時間がかかった。
ある提供者は、”専用器具が故障したので”、メニューiの提供をやめた。
ある立案者は、”集団(他の利用者との合同)向けに”、メニューiの提供場所を変更した。この場合、利用者は当初の提供場所でメニューiを受けることができなくなる。利用者がメニューiを受けるには、例えば、変更後の提供場所への移動が必要になる。
ある立案者は、”規定(保険範囲)の変更に応じて”、メニューiの提供時間を変更した。この場合、利用者は当初の提供時間にメニューiを受けることができなくなる。利用者がメニューiを受けるには、例えば、変更後の提供時間に再度出向く必要が生じる。One customer "had the wrong time" and was unable/too long to receive menu i.
One user stopped receiving menu i "because of previous failures".
One provider was "long to prepare" and could not/take a long time to serve menu i.
One provider stopped offering menu i because "the special equipment broke down."
One planner changed the presentation location of menu i "for groups (combination with other users)". In this case, the user will not be able to receive the menu i at the place where it was originally provided. In order for the user to receive menu i, for example, it is necessary to move to the location after the change.
One planner changed the time of offer for menu i "according to changes in regulations (insurance coverage)." In this case, the user will not be able to receive menu i at the initial offering time. In order for the user to receive the menu i, for example, it will be necessary to visit again at the changed provision time.
また、“計画されたメニュー”とは、「あるタイミング(日時)で、ある場所(施設)において、ある提供者が、ある利用者(群)に対して、あるサービスのメニューを提供する、ことを、ある立案者が計画したもの」である。 In addition, "planned menu" means "to provide a certain service menu to a certain user (group) at a certain timing (date and time) at a certain place (facility). was planned by a planner.”
上記のように、問題は、サービスのメニューが計画変更されることである。例えば、計画変更は、時間的・内容的にサービスのメニューが変更されることを示す。このような計画変更は、サービスのメニューに対するステークホルダーの応答変化により生じる。応答変化は、例えば、サービスを実施する計画に対し、実際には、利用者がサービスを実施しない(できない)状況となった実績に相当する。ステークホルダーである立案者、提供者、利用者のうちのいずれか一人でも応答変化が生じると、メニューが計画変更されることになる。 As noted above, the problem is that the menu of services is rescheduled. For example, plan change indicates that the service menu is changed in terms of time and content. Such plan changes occur due to changes in stakeholder responses to the menu of services. The change in response corresponds to, for example, the actual situation in which the user does not (cannot) implement the service against the plan to implement the service. If any one of the stakeholders, planner, provider, or user, responds differently, the menu will be rescheduled.
上記により、発明者らは、応答変化が生じないようにサービスのメニューを推薦できれば、計画変更を抑制し、当初の効果でサービスを実施可能になることに着目した。このため、実施の形態に係る計画立案装置100では、サービスのメニューに対する複数のステークホルダーの応答変化に着目し、応答変化リスクを最小化し、効果を最大化するメニューを推薦できるようにする。 Based on the above, the inventors have focused on the fact that if a service menu can be recommended without causing a response change, it will be possible to suppress plan changes and implement services with the initial effect. For this reason, the
実施の形態では、各ステークホルダーに対し、実際にメニューを実施する利用者への効果を最大化できるメニューを推薦する。例えば、利用者に対しては、メニューに対して応答変化を最小にする組合せを推薦する。また、提供者に対しては、応答変化リスクを制約条件として各利用者のスケジュールを推薦する。 In the embodiment, for each stakeholder, a menu that can maximize the effect on the user who actually implements the menu is recommended. For example, the user is recommended a combination that minimizes the change in response to the menu. For the provider, each user's schedule is recommended with response change risk as a constraint.
実施の形態に係る計画立案装置100は、計画立案方法として下記1.~4.の処理を含み実施する。 The
1.応答変化点の抽出
計画立案装置100は、サービスの計画と、過去の実績との差分から応答変化が発生しているメニューを抽出する。例えば、計画立案装置100は、過去のサービスのメニューの変更の履歴を逐次記憶部に蓄積記憶する。計画立案装置100は、所定のタイミング、例えば、所定タイミング毎に、メニューの変更の履歴に基づき、応答変化が発生しているメニューを抽出する。1. Extraction of Response Change Points The
2.応答変化リスクの算出
計画立案装置100は、抽出したメニューに関して、ステークホルダー(立案者、利用者、提供者)毎に応答変化リスク(変更頻度)を算出する。例えば、計画立案装置100は、過去のデータから、変更されたサービスのメニューと、変更されなかったサービスのメニューを抽出し、各ステークホルダー間での応答変化リスクを算出する。そして、計画立案装置100は、各サービスのメニューに対するパラメータの範囲を関係者毎に算出する。例えば、立案者mが作成したサービスのメニュー群、提供者pが提供したサービスのメニュー群、利用者uが利用したサービスのメニュー群、それぞれのデータ群に分類し、各々の応答変化リスクを算出する。なお、mは立案者(menu planner)、pは提供者(provider)、uは利用者(user)の略である。2. Calculation of Response Change Risk The
3.応答変化リスクを最小化する条件を抽出
計画立案装置100は、あるメニューに対して、応答変化リスクを最小化するサービスのメニューの組合せを抽出する。例えば、計画立案装置100は、立案者mが立案したサービスのメニューにおいて、メニューiで頻繁に変更が起こっていた場合、メニューiに対する立案者mの応答変化リスクへの寄与が高いと判断する。この場合、計画立案装置100は、メニューiを受けるべき利用者uのサービスに立案者mが立案したサービスのメニューを推薦しない処理を行う。3. Extraction of Conditions to Minimize Response Change Risk The
4.抽出した条件において、利用者への効果を最大化するメニューを推薦
計画立案装置100は、上記3.で抽出した条件において、メニューを実施する利用者への効果を最大化するメニューを利用者に表示出力等で推薦する。4. The
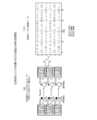
図1を用いて計画立案装置100によるメニューの推薦例を説明する。図1(a)に示すように、ある利用者u1に対するサービスには複数のメニュー1~nがあるとする。この場合、計画立案装置100は、利用者u1に対してメニュー1~nのいずれを推薦するかを判断する。 An example of menu recommendation by the
図1(b)に示すように、計画立案装置100は、あるサービスのメニュー1~nの実施における複数の組合せに対して応答変化リスク(変更頻度)を抽出する。例えば、利用者u1は、複数の立案者m1~mnが立案したメニュー1~nを、複数の提供者p1~pnからの提供で実施可能である。 As shown in FIG. 1(b), the
図1(b)の例では、計画立案装置100は、利用者u1に対し、立案者m1が立案したメニュー1,2について提供者p1,p2毎の応答変化リスク(変更頻度)を算出する。図1(b)の例では、メニュー1について、提供者p1の応答変化リスク(変更頻度)が最も高いことが示されている。 In the example of FIG. 1(b), the
同様に、計画立案装置100は、利用者u1に対し、立案者m2が立案したメニュー3,4について提供者p1,p2毎の応答変化リスク(変更頻度)を算出する。図1(b)の例では、メニュー3について、提供者p2の応答変化リスク(変更頻度)が最も低いことが示されている。 Similarly, the
そして、計画立案装置100は、図1(b)に示した応答変化リスク(変更頻度)が低いステークホルダーの組合せによるメニューを利用者に推薦する。図1(c)の例では、計画立案装置100は、利用者u1に対しては、立案者m2が計画し、提供者p2が提供するメニュー3を推薦する。利用者u1に対するメニュー3の推薦は、図1(b)に示した立案者m2と提供者p2の組合せにおけるメニュー3の応答変化リスク(変更頻度)が低いことに基づく。この場合、例えば、利用者u1に対し、立案者m1と提供者p1の組合せにおけるメニュー1の応答変化リスク(変更頻度)は高いため推薦を行わない。 Then, the
図1(c)の例では、計画立案装置100は、便宜上、利用者u1に対し、ステークホルダーを組合せて最も応答変化リスク(変更頻度)が低い一つのメニューを推薦したが、これに限らない。詳細は後述するが、計画立案装置100は、利用者u1に対して応答変化リスク(変更頻度)を最小にする複数のメニューを推薦してもよい。また、計画立案装置100は、各メニューの実施のスケジュールを併せて提示してもよい。さらには、計画立案装置100は、利用者u1に対し、メニュー毎の応答変化リスクを制約条件として推薦し、利用者u1に応答変化リスクを把握させた状態でメニューを選択可能としてもよい。 In the example of FIG. 1(c), the
実施の形態によれば、計画立案装置100は、計画したサービスのメニューを実際に実施するまでに生じる応答変化リスク(変更頻度)に基づき、ステークホルダーに対して、計画通りに実施可能なメニューを推薦する。また、計画立案装置100は、メニューに対する各ステークホルダーの期待を考慮して、最適なメニューを推薦できる。また、計画立案装置100によれば、応答変化リスクをメニュー割り当ての制約条件とすることで、より精度が高く実行可能なメニューを組合せたスケジューリングが行える。 According to the embodiment, the
(計画立案システムの構成例)
図2は、計画立案システムの構成例を示す図である。図2に示す例では、計画立案装置100は、利用者のリハビリ計画に過去の計画/実績DB213に対するメニューを推薦する。計画立案装置100は、サーバ200と、メニューの組合せテンプレートデータベース(DB)201とを含む。サーバ200は、ネットワークNWを介して利用者が利用するリハビリ施設A~N(210)のクライアント211と通信接続されている。(Configuration example of planning system)
FIG. 2 is a diagram showing a configuration example of a planning system. In the example shown in FIG. 2, the
リハビリ施設A~N(210)は、クライアント211、ネットワークNWと通信接続するハブ(HUB)212、過去の計画/実績DB213、メニューDB214、ステークホルダーDB215を含む。ステークホルダーである立案者、提供者、利用者は、それぞれクライアント211にアクセスして情報入力することで、入力された各ステークホルダーに関する情報がステークホルダーDB215に格納される。過去の計画/実績DB213には、リハビリのサービスとして計画された計画データと、計画データを実施した結果の実績データとを保持する。メニューDB214には、立案者が立案したリハビリのメニューに関する情報を保持する。 Rehabilitation facilities A to N (210) include a
リハビリ施設A~N(210)のクライアント211は、これら過去の計画/実績DB213、メニューDB214、ステークホルダーDB215に格納された情報を計画立案装置100のサーバ200に送信する。
計画立案装置100のサーバ200は、リハビリ施設A~N(210)の過去の計画/実績DB213、メニューDB214、ステークホルダーDB215に格納された情報に基づき、上述した処理1.~4.を実施する。計画立案装置100は、処理1.~4.の実施により、メニューの組合せテンプレートDB201を作成する。メニューの組合せテンプレートDB201は、リハビリに関する複数のメニューの組合せの情報を保持する。メニューの組合せテンプレートDB201には、メニューの実施の順番を含んでもよい。 The
計画立案装置100は、メニューの組合せテンプレートDB201の記憶内容に基づき、利用者に対し計画通りに実施可能なメニューを推薦する。具体的には、計画立案装置100は、リハビリ施設A~N(210)のクライアント211に対し、利用者が実施可能なメニューに関する情報を送信出力する。利用者はクライアント211の表示内容に基づき、実施可能なメニューに関する情報を受け取る。なお、クライアント211は、利用者が携帯するスマートフォン等に実施可能なメニューに関する情報を転送する構成としてもよい。 Based on the contents stored in the menu
(計画立案装置100のハードウェア構成例)
次に、図3を用いて、計画立案装置100のハードウェア構成例について説明する。(Hardware configuration example of planning device 100)
Next, a hardware configuration example of the
図3は、計画立案装置のハードウェア構成例を示す図である。図3において、計画立案装置100は、CPU(Central Processing Unit)301と、メモリ302と、ネットワークI/F(Interface)303と、記録媒体I/F304と、記録媒体305とを含む。また、可搬型記録媒体I/F306と、可搬型記録媒体307とを含む。また、各構成部は、バス300によってそれぞれ接続される。ネットワークNWは、例えば、LAN(Local Area Network)、WAN(Wide Area Network)、インターネットなどである。 FIG. 3 is a diagram showing a hardware configuration example of the planning device. In FIG. 3 , the
ここで、CPU301は、計画立案装置100の全体の制御を司る。メモリ302は、例えば、ROM(Read Only Memory)、RAM(Random Access Memory)およびフラッシュROMなどを有する。具体的には、例えば、フラッシュROMやROMが各種プログラムを記憶し、RAMがCPU301のワークエリアとして使用される。メモリ302に記憶されるプログラムは、CPU301にロードされることにより、コーディングされている処理をCPU301に実行させる。 Here, the
ネットワークI/F303は、通信回線を通じてネットワークNWに接続され、ネットワークNWを介して他のコンピュータに接続される。そして、ネットワークI/F303は、ネットワークNWと内部のインターフェースを司り、他のコンピュータからのデータの入出力を制御する。ネットワークI/F303は、例えば、モデムやLANアダプタなどである。 The network I/
記録媒体I/F304は、CPU301の制御に従って記録媒体305に対するデータのリード/ライトを制御する。記録媒体I/F304は、例えば、ディスクドライブ、SSD(Solid State Drive)、USB(Universal Serial Bus)ポートなどである。記録媒体305は、記録媒体I/F304の制御で書き込まれたデータを記憶する不揮発メモリである。記録媒体305は、例えば、磁気ディスク、光ディスクなどが挙げられる。 A recording medium I/
可搬型記録媒体I/F306は、CPU301の制御に従って可搬型記録媒体307に対するデータのリード/ライトを制御する。可搬型記録媒体307は、可搬型記録媒体I/F306の制御で書き込まれたデータを記憶する。可搬型記録媒体307としては、例えば、CD(Compact Disc)-ROM、DVD(Digital Versatile Disk)、USB(Universal Serial Bus)メモリなどが挙げられる。 A portable recording medium I/
計画立案装置100は、上述した構成部の他、例えば、キーボード、マウス、ディスプレイ、プリンタ、スキャナ、マイク、スピーカーなどを有してもよい。また、計画立案装置100は、記録媒体I/F304や記録媒体305を複数有していてもよい。また、計画立案装置100は、記録媒体I/F304や記録媒体305を有していなくてもよい。 The
図2に示したクライアント211のハードウェア構成例は、図3に示した計画立案装置100のハードウェア構成例と同様であるため、説明を省略する。 Since the hardware configuration example of the
(計画立案装置の機能例)
図4は、計画立案装置の機能的構成例を示すブロック図である。図4には、図2に示したサーバ200の各機能と、複数のDBを示す。サーバ200は、過去データ取得部401、応答変化点抽出部402、応答変化リスク推定部403、リスク最小条件抽出部404、メニュー推薦部405の各機能を含む。DBは、上記のメニューの組合せテンプレートDB201、応答変化点DB412、応答変化リスクDB413、条件付きメニューDB414を含む。(Function example of planning device)
FIG. 4 is a block diagram showing a functional configuration example of the planning device. FIG. 4 shows each function of the
図4に示したサーバ200の制御部に相当する過去データ取得部401~メニュー推薦部405は、図3に示したCPU301がメモリ302等に記憶されたプログラムを実行することで機能実現できる。また、図4に示したサーバ200の各DB412~414は、図3に示したメモリ302や記録媒体305等を用いて機能実現できる。また、図4に示したリハビリ施設210(クライアント211)側の各DB213~215は、図3に示したメモリ302や記録媒体305等を用いて機能実現できる。 The functions of the past
過去データ取得部401は、各リハビリ施設A~N(210)のクライアント211にアクセスして、過去の計画/実績DB213、メニューDB214、ステークホルダーDB215に格納された情報を取得する。 The past
応答変化点抽出部402は、過去データ取得部401が取得した情報に基づき、上記処理1.応答変化点の抽出の処理を実施する。応答変化点抽出部402は、メニュー毎の応答変化に係る情報を抽出し、抽出した応答変化に係る情報を応答変化点DB412に格納する。 Based on the information acquired by the past
応答変化リスク推定部403は、応答変化点抽出部402が抽出した応答変化点の情報に基づき、上記処理2.応答変化リスクの推定を実施する。応答変化リスク推定部403は、応答変化点DB412を参照し、メニュー毎の応答変化リスクを推定し、推定した応答変化リスクに係る情報を応答変化リスクDB413に格納する。 The response
リスク最小条件抽出部404は、応答変化リスク推定部403が推定した応答変化リスクの情報に基づき、上記処理3.応答変化リスクを最小化する条件を抽出する。リスク最小条件抽出部404は、応答変化リスクDB413を参照し、メニュー毎に応答変化リスクを最小化する条件、例えば、各ステークホルダーの組合せの情報を抽出する。そして、リスク最小条件抽出部404は、抽出した応答変化リスクを最小化する条件を付したメニューを条件付きメニューDB414に格納する。 The minimum risk
メニュー推薦部405は、上記処理4.抽出した条件において、利用者への効果を最大化するメニューの推薦を実施する。メニュー推薦部405は、メニューの組合せテンプレートDB201を参照し、複数のメニューを組合せた順番の情報を含み推薦するメニューを決定する。また、メニュー推薦部405は、条件付きメニューDB414を参照し、応答変化リスクを最小化する条件(メニュー毎の各ステークホルダーの組合せ等)の情報をステークホルダー(利用者や提供者)に推薦する。 The
(各データベースのデータ例)
図5A~図5Cは、クライアントが保持するDBのデータ例を示す図表である。図2に示した各リハビリ施設A~NのDB213~215のデータ例を説明する。(Data example of each database)
5A to 5C are charts showing examples of DB data held by the client. Data examples of the
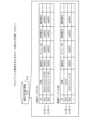
図5Aは、過去の計画/実績DB213を示す。過去の計画/実績DB213は、立案者が計画した計画データ213Aと、計画データ213Aに対応する実績データ213Bとを含む。 FIG. 5A shows the past plan/
計画データ213Aは、立案者が計画した情報に基づき、各フィールドに情報を設定したレコード213A-aとして記憶される。aは、任意の整数である。例えば、各フィールドには、レコード毎の識別子(ID)、日時、施設ID、メニューID、利用者ID等の情報が記憶される。例えば、レコード213A-1は、ID「001」、日時「2021/11/10 10:00」、施設ID「fid001」、メニューID「sid001」、利用者ID「uid001」、提供者ID「pid001」である。 The
実績データ213Bは、立案者が計画した計画データ213Aに対する実績として、各フィールドに情報を設定したレコード213B-aとして記憶される。例えば、各フィールドには、計画データ213Aと同様に、レコード毎の識別ID、日時、施設ID、メニューID、利用者ID等の情報が記憶される。ここで、レコード213B-1は、計画データ213Aのレコード213A-1のID「001」のメニューID「sid001」が実施されなかったことを示し、この場合、日時に「Cancel」が設定されている。 The
図5Bは、メニューDB214を示す。メニューDB214は、立案者が立案したリハビリ用のメニューに関連する情報に基づき、各フィールドに情報を設定したレコード214-aとして記憶される。例えば、各フィールドには、メニューID、メニュー名、所要時間、標準値、単位等の情報が記憶される。例えば、レコード214-1は、メニューID「sid001」、メニュー名「歩行訓練」、所要時間「30分」、標準値「10」、単位「歩」等の情報が記憶される。 FIG. 5B shows the
図5Cは、ステークホルダーDB215を示す。ステークホルダーDB215は、各ステークホルダー毎に、利用者データ215A、提供者データ215B、立案者データ215Cを含む。 FIG. 5C shows
利用者データ215Aは、利用者の情報に基づき、各フィールドに情報を設定したレコード215A-aとして記憶される。例えば、各フィールドには、利用者ID、氏名、年齢、住所、既往歴、介護度等の情報が記憶される。例えば、レコード215A-1は、利用者ID「uid001」、氏名「東京太郎」、年齢「75」、住所「東京都XXX」、既往歴「脳卒中」、介護度「要介護1」等の情報が記憶される。 The
提供者データ215Bは、提供者の情報に基づき、各フィールドに情報を設定したレコード215B-aとして記憶される。例えば、各フィールドには、提供者ID、氏名、資格等の情報が記憶される。例えば、レコード215B-1は、提供者ID「pid001」、氏名「東京次郎」、資格「訓練員」等の情報が記憶される。 The provider data 215B is stored as a record 215B-a in which information is set in each field based on provider information. For example, each field stores information such as provider ID, name, and qualification. For example, record 215B-1 stores information such as provider ID "pid001", name "Jiro Tokyo", qualification "trainee", and the like.
立案者データ215Cは、立案者の情報に基づき、各フィールドに情報を設定したレコード215C-aとして記憶される。例えば、各フィールドには、立案者ID、氏名、メニューID等の情報が記憶される。例えば、レコード215C-1は、立案者ID「mid001」、氏名「大阪次郎」、メニューID「sid001」等の情報が記憶される。 The
図6A~図6Dは、計画立案装置が保持するDBのデータ例を示す図表である。図6Aは、メニューの組合せテンプレートDB201を示す。メニューの組合せテンプレートDB201は、リハビリのメニューを組合せたワークフローの情報に基づき、各フィールドに情報を設定したレコード201-aとして記憶される。例えば、各フィールドには、ワークフロー別のID、ワークフロー名、メニューID、順番、表記等の情報が記憶される。例えば、レコード201-aは、ワークフローID「wid001」、ワークフロー名「認知症向け訓練」、メニューID「sid001」、順番「1」、表記「イベント」等の情報が記憶される。 6A to 6D are charts showing examples of data in the DB held by the planning device. FIG. 6A shows the menu
図6Bは、応答変化点DB412を示す。応答変化点DB412は、メニュー毎の応答変化に係る情報に基づき、各フィールドに情報を設定したレコード412-aとして記憶される。例えば、各フィールドには、ID、メニューID、応答変化点抽出部402が検出した応答変化点に関する変化タイプ、変化量、ステークホルダーID等の情報が記憶される。例えば、レコード412-1は、ID「001」、メニューID「sid001」、変化タイプ「日時」、変化量「24」、ステークホルダーID「uid001」等の情報が記憶される。 FIG. 6B shows the response
図6Cは、応答変化リスクDB413を示す。応答変化リスクDB413は、推定した応答変化リスクの情報に基づき、各フィールドに情報を設定したレコード413-aとして記憶される。例えば、各フィールドには、ID、メニューID、各ステークホルダーのID、応答変化リスク等の情報が記憶される。例えば、レコード413-1は、ID「1」、メニューID「sid001」、利用者ID「uid001」、提供者ID「pid001」、立案者ID「mid001」、応答変化リスクの値「0.2」等の情報が記憶される。 FIG. 6C shows response
図6Dは、条件付きメニューDB414を示す。条件付きメニューDB414は、抽出した応答変化リスクを最小化する条件を付したメニューに係る情報に基づき、各フィールドに情報を設定したレコード414-aとして記憶される。例えば、各フィールドには、ID、ワークフローID、メニューID、条件を満たす各ステークホルダーのID、条件タイプ等の情報が記憶される。例えば、レコード414-1は、ID「1」、ワークフローID「wid001」、メニューID「sid001」、利用者ID「uid001」、提供者ID「pid001」、立案者ID「mid001」、条件タイプ「リスク最小」等の情報が記憶される。 FIG. 6D shows the
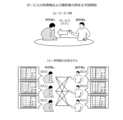
図7は、計画立案装置が行う処理の概要の説明図である。図7(a)は、応答変化点抽出部402が行う上記処理1.応答変化点の抽出を示す。例えば、応答変化点抽出部402は、立案者m1が立案した過去の計画/実績DB213を取得し、計画データ213Aと実績データ213Bとをレコード毎に比較することで、応答変化点を抽出する。図7(a)の例では、応答変化点抽出部402は、計画データ213Aのレコード213A-1で計画されていた所定日時のメニュー(i)について、実績データ213Bのレコード213B-1でキャンセルされたことを応答変化点として抽出する。 FIG. 7 is an explanatory diagram of an overview of the processing performed by the planning device. FIG. 7(a) shows the
図7(b)は、応答変化リスク推定部403が行う上記処理2.応答変化リスクの推定を示す。図7(b)の横軸はステークホルダー、縦軸は応答変化リスク(変更頻度)、奥行軸はメニューである。応答変化リスク推定部403は、図7(a)に示した応答変化点の抽出により、あるメニューに対するステークホルダー毎の応答変化リスク(変更頻度)を得る。 FIG. 7B shows the
図7(c)は、リスク最小条件抽出部404が行う上記処理3.応答変化リスクを最小化する条件の抽出を示す。リスク最小条件抽出部404は、あるメニューに対して、応答変化リスクを最小化するサービスのメニューの組合せを抽出する。図7(c)において、各ステークホルダー間の線の太さが太いほど応答変化リスクが高い。例えば、リスク最小条件抽出部404は、利用者u1にメニューiを提供する場合、立案者がm1、提供者がp1の組合せは、メニューiに対する応答変化リスク(変更頻度)が高いと判断する。リスク最小条件抽出部404は、各ステークホルダー間の線の太さが細いステークホルダー間の組合せを抽出する。 FIG. 7(c) shows the
図7(d)は、メニュー推薦部405が行う上記処理4.抽出した条件において、利用者への効果を最大化するメニューの推薦を示す。メニュー推薦部405は、図7(c)でリスク最小条件抽出部404が抽出した、各ステークホルダー間の線の太さが細いステークホルダー間の組合せに基づき、複数のメニューのうち利用者への効果を最大化できる一つあるいは複数のメニューを利用者に推薦する。また、メニュー推薦部405は、各メニューの実施のスケジュールを併せて提示してもよい。 FIG. 7(d) shows the
さらには、メニュー推薦部405は、利用者u1に対し、メニュー毎の応答変化リスクを制約条件として推薦してもよい。例えば、メニュー推薦部405は、図6Dに示した条件付きメニューDB414の情報を利用者u1に提示し、利用者u1にメニュー毎の応答変化リスクを把握させた状態でメニューを選択可能な状態で推薦してもよい。 Furthermore, the
上記説明において、応答変化リスク推定部403が推定する応答変化リスクは、例えば、下記式(1)で示すことができ、計画立案装置100でデータ処理できる。 In the above description, the response change risk estimated by the response
Pi(C=1|u,p,m)={Pi(u|C,p,m)×Pi(C|p,m)}/Pi(u|p,m) …(1) Pi(C=1|u,p,m)={Pi(u|C,p,m)×Pi(C|p,m)}/Pi(u|p,m) (1)
上記式(1)は、ある立案者mが計画し、ある提供者pがある利用者uへ提供予定のあるメニューiが変更(C=1)になる確率を示す。Pi(u|C,p,m)は、ある立案者mの計画上で、ある提供者pがメニューiを提供し、結果がCであった場合の利用者u毎の統計量から推定可能である。Pi(C|p,m)は、ある立案者mの計画上で、ある提供者pがメニューiを提供した場合の変更・非変更の統計量から推定可能である。Pi(u|p,m)は、ある立案者mの計画上で、ある提供者pがメニューiを提供した場合の利用者u毎の統計量から推定可能である。 The above formula (1) indicates the probability that a menu i planned by a certain planner m and scheduled to be provided to a certain user u by a certain provider p will be changed (C=1). Pi (u|C, p, m) can be estimated from the statistics for each user u when a certain provider p provides menu i on the plan of a certain planner m and the result is C is. Pi(C|p,m) can be estimated from the change/non-change statistic when a certain provider p provides menu i on the plan of a certain planner m. Pi(u|p,m) can be estimated from the statistics for each user u when a certain provider p provides menu i on the plan of a certain planner m.
そして、メニュー推薦部405は、応答変化リスクを最小化したメニューを推薦する場合、Pi(C=0,u|p,m)を最大化する提供者pと立案者mを選択する。メニュー推薦部405は、最も応答変化リスクが低い「立案者mが計画した提供者pによるメニューi」を利用者uに推薦する。 When recommending a menu that minimizes the response change risk,
上記説明によれば、実施の形態の計画立案装置100は、利用者uにメニューを出力する以前に、対象メニューに対して複数のステークホルダーの応答変化リスクの属性値を加えて探索空間を拡張する処理を行っている。例えば、従来技術では、効果と回数(利用回数)の2軸の探索空間上にメニューをプロットして探索することに相当し、メニューがどのように(いつ、誰が、どこで)提供されるかを考慮していない。これに対し、実施の形態の計画立案装置100では、応答変化リスクと、効果と、回数からなる3軸の探索空間を用いることで空間上の軸を増やすことに相当する。これにより、実施の形態の計画立案装置100によれば、メニューがどのように提供されるべきかを応答変化リスクとして考慮することができる。 According to the above description, the
(計画立案装置100の各機能による処理の詳細)
次に、計画立案装置100が有する各機能による処理例を詳細に説明する。(Details of processing by each function of the planning device 100)
Next, an example of processing by each function of the
図8は、応答変化リスクの推定の処理の説明図である。計画立案装置100が行う上記処理2.応答変化リスクの推定の処理例について説明する。計画立案装置100は、各ステークホルダーのサービス実施に対する期待値が異なる場合に応答変化(変更頻度)が生じやすい傾向に基づき、応答変化リスクを推定する。サービス実施に対する期待値とは、各ステークホルダーが有するサービス実施に関する各種情報(パラメータが時間、場所、効果、難度等)である。期待値の範囲が、他のステークホルダーと異なる場合に応答変化リスクが高くなる。 FIG. 8 is an explanatory diagram of processing for estimating a response change risk. 2. The above process performed by the
応答変化リスクが高くなる例を説明する。
例1:提供者pは、メニュー(i)は適度なトレーニング(難度中)だと考えていた。これに対し、利用者uは実際に受けてみて困難さ(難度高)を感じ、頻繁にメニュー(i)をキャンセルしている、あるいは類似のメニュー(ii)に変更した。
例2:立案者mは、メニュー(ii)は午前中に実施されるべき(早い時間)ものと考えていた。これに対し、提供者pの勤務体系では午後の実施に限られた(遅い時間)。
例3:利用者uは、メニュー(i)を時間通りに受けたいと思っていた。これに対し、利用者uを担当する提供者pはメニュー(i)の準備に時間がかかるため、頻繁にメニュー(i)の開始が遅れた。An example in which response change risk increases will be described.
Example 1: Provider p considered menu (i) to be moderate training (medium difficulty). On the other hand, user u found it difficult (high difficulty) after actually taking the test, and frequently canceled menu (i) or changed to similar menu (ii).
Example 2: Planner m thought that menu (ii) should be served in the morning (early hours). On the other hand, the work schedule of provider p was limited to the afternoon (late hours).
Example 3: User u wanted to receive menu (i) on time. On the other hand, provider p, who was in charge of user u, often delayed the start of menu (i) because it took a long time to prepare menu (i).
計画立案装置100は、過去の計画/実績DB213を参照し、抽出した応答変化点において、ステークホルダー毎に、サービス実施に対する各パラメータの期待値を算出し、範囲(分布)の重なりから、応答変化リスクを推定する。 The
各パラメータは、例えば、時間は、サービス実施の時刻等である。場所は、サービス実施の場所や距離等である。効果は、サービス実施時間、計測値等である。難度は、標準値と計測値の差、提供者のスキルセット、利用者のプロファイル等である。 Each parameter is, for example, the time of service execution. The location is the location, distance, etc. of service implementation. The effects are service execution time, measured values, and the like. The degree of difficulty is the difference between the standard value and the measured value, the provider's skill set, the user's profile, and the like.
図8(a)は、パラメータが時間である場合、各メニューに対する各ステークホルダーの期待値を示す図表である。メニュー(i)、(ii)に対する、立案者m、提供者p、利用者uそれぞれの期待値(縦軸)を示す。横軸は時間(例えば、時刻)である。立案者m、提供者p、利用者uは、それぞれ所定の時間幅と期待値の高さによる分布特性を有する。図8(a)の例では、計画立案装置100は、メニュー(i)に対して利用者uの応答変化リスクが高いと推定する。 FIG. 8(a) is a chart showing each stakeholder's expected value for each menu when the parameter is time. The expected values (vertical axis) of the planner m, the provider p, and the user u for menus (i) and (ii) are shown. The horizontal axis is time (for example, time). The planner m, the provider p, and the user u each have a distribution characteristic based on a predetermined time span and height of expected value. In the example of FIG. 8A, the
図8(b)は、パラメータが効果である場合、各メニューに対する各ステークホルダーの期待値を示す図表である。メニュー(i)、(ii)に対する、立案者m、提供者p、利用者uそれぞれの期待値(縦軸)を示す。横軸は時間(例えば、サービス実施時間)である。立案者m、提供者p、利用者uは、それぞれ所定の時間幅と期待値の高さによる分布特性を有する。図8(b)の例では、計画立案装置100は、メニュー(i)、(ii)に対して各ステークホルダーの応答変化リスクは低いと推定する。 FIG. 8(b) is a chart showing each stakeholder's expected value for each menu when the parameter is effect. The expected values (vertical axis) of the planner m, the provider p, and the user u for menus (i) and (ii) are shown. The horizontal axis is time (for example, service execution time). The planner m, the provider p, and the user u each have a distribution characteristic based on a predetermined time span and height of expected value. In the example of FIG. 8B, the
図8(c)は、パラメータが難度である場合、各メニューに対する各ステークホルダーの期待値を示す図表である。メニュー(i)、(ii)に対する、立案者m、提供者p、利用者uそれぞれの期待値(縦軸)を示す。横軸は時間(例えば、サービス実施時間)である。立案者m、提供者p、利用者uは、それぞれ所定の時間幅と期待値の高さによる分布特性を有する。図8(c)の例では、計画立案装置100は、提供者pが提供するメニュー(i)、(ii)を利用者uが利用すると応答変化リスクが高いと推定する。 FIG. 8(c) is a chart showing each stakeholder's expected value for each menu when the parameter is the degree of difficulty. The expected values (vertical axis) of the planner m, the provider p, and the user u for menus (i) and (ii) are shown. The horizontal axis is time (for example, service execution time). The planner m, the provider p, and the user u each have a distribution characteristic based on a predetermined time span and height of expected value. In the example of FIG. 8(c), the
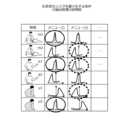
図9は、応答変化リスクを最小化する条件の抽出処理の説明図である。計画立案装置100が行う上記処理3.応答変化リスクを最小化する条件の抽出の処理例について説明する。実施の形態では、サービス実施に関する期待の範囲が同じステークホルダー(立案者、提供者、利用者)の組合せであれば、応答変化が起こりにくいことに着目する。計画立案装置100は、推定した応答変化リスク、すなわち、サービス実施に関する期待の分布の類似性に基づき、ステークホルダーをグルーピングし、対象グループ毎にメニューを推薦する。 FIG. 9 is an explanatory diagram of extraction processing of conditions for minimizing response change risk. 3. The above process performed by the
図9は、各メニューに対する各ステークホルダーの期待値を示す図表である。メニュー(i)、(ii)に対する、立案者m、提供者p、利用者uそれぞれの期待値(縦軸)を示す。横軸は時間である。図9の例では、計画立案装置100は、メニューiに対しては、立案者m1、提供者p1、利用者u2の期待の分布が類似していると判断する(図9の実線枠)。また、計画立案装置100は、メニューiiに対しては、立案者m2、提供者p1、利用者u1の期待の分布が類似していると判断する(図9の点線枠)。 FIG. 9 is a chart showing the expected value of each stakeholder for each menu. The expected values (vertical axis) of the planner m, the provider p, and the user u for menus (i) and (ii) are shown. The horizontal axis is time. In the example of FIG. 9, the
また、計画立案装置100は、応答変化リスクと期待値をスケジューリングに活用する。具体的には、メニューに対する提供者pの応答変化リスクが低ければ、メニュー実施時の変更が抑制できることに着目する。計画立案装置100は、例えば、提供者pの勤務スケジューリングの際に、割り当てるメニューと提供者pの応答変化リスクを制約条件として設定し、応答変化リスクが最小となるメニューを割り当てる。メニューと提供者pの応答変化リスク(制約条件の例)は、下記式(2)で示される。 Also, the

上記式(2)は、提供者pがメニューiを変更しないで(C=0)提供する確率を示す。計画立案装置100は、この確率がより高くなるように提供者pに対するメニューiの割り当てを実施する。 Equation (2) above indicates the probability that provider p will provide menu i without changing it (C=0). The
また、メニューiに対する利用者uの期待値が利用者uのメニューiに対する選好性に利用できることに着目する。計画立案装置100は、利用者uのメニューiの提供をスケジューリングする際に、割り当てメニューの時間(日時)や、場所に対する期待値の範囲(上限、下限、中間等)を制約条件として設定する。例えば、ある利用者uにおいて、時間に対する期待値の中央値に近いスケジュールの場合は、その利用者の応答変化が起こりにくいと判断する。一方で、他にも同じ期待値の利用者uがいた場合には、上限あるいは下限に近いスケジュールとして割り当てを調整することができる。 Also, it is noted that the user u's expected value for the menu i can be used for the user u's preference for the menu i. When scheduling the provision of menu i for user u, the
図10は、ワークフローを考慮した期待値の算出処理の説明図である。計画立案装置100は、メニューの推薦時、ワークフロー(メニューの組合せ)を考慮した期待値を算出する。メニューによっては、前後に実施されるメニューに応じて、サービス実施における各種情報(時間、場所、効果、難度)が決まる場合がある。例えば、前のメニューは回数を計測するメニューなので終了時間が曖昧であるが、後ろのメニューは集団実施のメニューなので場所と開始時間が厳密になる等がある。計画立案装置100は、このような場合を考慮して、計画からメニューの組合せを抽出し、メニューの組合せ毎に各メニューの期待値を算出する。 FIG. 10 is an explanatory diagram of the expected value calculation processing in consideration of the workflow. The
具体的には、計画立案装置100は、応答変化リスクの推定時、予め計画データからメニューの組合せのテンプレートを抽出し、テンプレート毎に各メニューに対する期待値を算出する。そして、計画立案装置100は、応答変化リスクを最小化する条件の抽出時におけるグルーピングに活用する。グルーピングは、メニューと、利用者と、提供者と、立案者の組合せからなる。 Specifically, when estimating the response change risk, the
図10(a)は、メニューの組合せ(ワークフロー)上での期待値を示す。図10(a)の横軸は時間、縦軸は期待値(例えば難度)、手前方向の軸は効果である。また、菱形(◇)はメニューi、丸形(〇)はメニューii、四角の枠は期待値の範囲を示す。ワークフローで複数のメニューは、開始点(●)~終了点(●)の間において、矢印で示すように複数を組合せることができる。この組合せの際、計画立案装置100は、メニューi、iiそれぞれの期待値の範囲に基づき、メニューi、iiを組合せる。例えば、ある組合せにおいてメニューi(S1)は期待値の範囲が狭いため例えば時間について厳密に実行する必要があるのに対し、メニューi(S2)は期待値の範囲が広いため時間について緩く実行することができることを示す。 FIG. 10(a) shows expected values on a combination of menus (workflow). In FIG. 10A, the horizontal axis is time, the vertical axis is expected value (for example, difficulty), and the front axis is effect. A rhombus (⋄) indicates menu i, a circle (∘) indicates menu ii, and a square frame indicates the range of expected values. Multiple menus in the workflow can be combined as indicated by arrows between the start point (●) and the end point (●). At the time of this combination, the
図10(b)は、パラメータが時間である場合、メニューの各組合せ1~3(ワークフロー)毎の各メニューの期待値を示す図表である。メニュー(i)、(ii)に対する、立案者m、提供者p、利用者uそれぞれの期待値(縦軸)を示す。横軸は時間(例えば、時刻)である。組合せ1の例では、メニューi,ii共に時間に対する期待値が中央値に近いため計画立案装置100は、これらメニューi,iiをスケジュールとして組合せる。また、組合せ2の例では、メニューiの期待値が中央値から早い側に偏移しており、メニューiiの期待値が中央値から遅い側に偏移しており、計画立案装置100は、これらメニューi,iiをスケジュールとして組合せる。また、組合せ3の例では、メニューiの期待値が中央値から遅い側に偏移しており、メニューiiの期待値が中央値から早い側に偏移しており、計画立案装置100は、これらメニューi,iiをスケジュールとして組合せる。 FIG. 10(b) is a chart showing the expected value of each menu for each
(計画立案装置の処理例)
図11は、計画立案装置の全体処理例を示すフローチャートである。計画立案装置100の制御部(CPU301)が行う処理例について説明する。計画立案装置100は、以下の処理を所定周期毎等に実施する。はじめに、計画立案装置100は、メニューとステークホルダー情報を取得する(ステップS1111)。次に、計画立案装置100は、過去のデータ(計画データと実績データ)を取得する(ステップS1112)。(Processing example of planning device)
FIG. 11 is a flow chart showing an example of overall processing of the planning device. An example of processing performed by the control unit (CPU 301) of the
次に、計画立案装置100は、応答変化点の抽出の処理を行う(ステップS1113)。次に、計画立案装置100は、メニュー数(i)のループ処理を開始する(ステップS1114~ステップS1121)。次に、計画立案装置100は、ステークホルダー数(j)のループ処理を開始する(ステップS1115~ステップS1120)。次に、計画立案装置100は、メニューiと、ステークホルダーjを含む応答変化点数(k)のループ処理(ステップS1116~ステップS1118)を開始する。 Next, the
次に、計画立案装置100は、応答変化をメニューの変更頻度として計上する(ステップS1117)。次に、計画立案装置100は、応答変化点数kにかかる処理が終了したか否かを判断する(ステップS1118)。計画立案装置100は、応答変化点数k分の処理が終了していなければステップS1116に戻り、応答変化点数k分の処理が終了すればステップS1119の処理に移行する。 Next, the
次に、計画立案装置100は、応答変化リスクの推定の処理を行う(ステップS1119)。次に、計画立案装置100は、ステークホルダー数jにかかる処理が終了したか否かを判断する(ステップS1120)。計画立案装置100は、ステークホルダー数j分の処理が終了していなければステップS1115に戻り、ステークホルダー数j分の処理が終了すればステップS1121の処理に移行する。 Next, the
次に、計画立案装置100は、メニュー数iにかかる処理が終了したか否かを判断する(ステップS1121)。計画立案装置100は、メニュー数i分の処理が終了していなければステップS1114に戻り、メニュー数i分の処理が終了すればステップS1122の処理に移行する。 Next, the
次に、計画立案装置100は、メニュー数(i)のループ処理を開始する(ステップS1122~ステップS1124)。次に、計画立案装置100は、応答変化リスク最小条件の抽出の処理を行う(ステップS1123)。次に、計画立案装置100は、メニュー数iにかかる処理が終了したか否かを判断する(ステップS1124)。計画立案装置100は、メニュー数i分の処理が終了していなければステップS1122に戻り、メニュー数i分の処理が終了すればステップS1125の処理に移行する。 Next, the
次に、計画立案装置100は、ステークホルダー数(j)のループ処理を開始する(ステップS1125~ステップS1127)。次に、計画立案装置100は、利用者への効果を最大化するメニューを推薦する(ステップS1126)。次に、計画立案装置100は、ステークホルダー数jにかかる処理が終了したか否かを判断する(ステップS1127)。計画立案装置100は、ステークホルダー数j分の処理が終了していなければステップS1125に戻り、ステークホルダー数j分の処理が終了すれば、以上の処理を終了する。 Next, the
図12は、ワークフローを考慮した期待値および応答変化リスクの算出処理例を示すフローチャートである。図12の処理は、図11で示した処理に対してワークフローを考慮した期待値および応答変化リスクの算出処理を加えた処理を示す。図12は、図11のステップS1114~ステップS1121の処理部分に相当する。 FIG. 12 is a flow chart showing an example of calculation processing of the expected value and the response change risk in consideration of the workflow. The process of FIG. 12 shows the process of adding the expected value and the response change risk calculation process in consideration of the workflow to the process shown in FIG. FIG. 12 corresponds to the processing portion of steps S1114 to S1121 in FIG.
まず、計画立案装置100は、応答変化点の抽出の処理(ステップS1113)の後、メニューの組合せテンプレート(ワークフロー)を抽出する(ステップS1201)。次に、計画立案装置100は、ワークフロー数(w)のループ処理を開始する(ステップS1202~ステップS1213)。次に、計画立案装置100は、ワークフローwに含まれるメニュー数(i)のループ処理を開始する(ステップS1203~ステップS1212)。次に、計画立案装置100は、ステークホルダー数(j)のループ処理を開始する(ステップS1204~ステップS1211)。次に、計画立案装置100は、メニューiと、ステークホルダーjを含む応答変化点数(k)のループ処理(ステップS1205~ステップS1209)を開始する。次に、計画立案装置100は、パラメータ数(l)のループ処理を開始する(ステップS1206~ステップS1208)。 First, the
次に、計画立案装置100は、期待値の算出を行う(図10参照、ステップS1207)。次に、計画立案装置100は、パラメータ数lにかかる処理が終了したか否かを判断する(ステップS1208)。計画立案装置100は、パラメータ数l分の処理が終了していなければステップS1206に戻り、パラメータ数l分の処理が終了すれば、ステップS1209の処理に移行する。 Next, the
次に、計画立案装置100は、応答変化点数kにかかる処理が終了したか否かを判断する(ステップS1209)。計画立案装置100は、応答変化点数k分の処理が終了していなければステップS1205に戻り、応答変化点数k分の処理が終了すればステップS1210の処理に移行する。ステップS1210では、計画立案装置100は、応答変化リスクの推定の処理を行う(ステップS1210)。 Next, the
次に、計画立案装置100は、ステークホルダー数jにかかる処理が終了したか否かを判断する(ステップS1211)。計画立案装置100は、ステークホルダー数j分の処理が終了していなければステップS1204に戻り、ステークホルダー数j分の処理が終了すればステップS1212の処理に移行する。 Next, the
次に、計画立案装置100は、メニュー数iにかかる処理が終了したか否かを判断する(ステップS1212)。計画立案装置100は、メニュー数i分の処理が終了していなければステップS1203に戻り、メニュー数i分の処理が終了すればステップS1213の処理に移行する。 Next, the
次に、計画立案装置100は、ワークフロー数wにかかる処理が終了したか否か判断する(ステップS1213)。計画立案装置100は、ワークフロー数w分の処理が終了していなければステップS1202に戻り、ワークフロー数w分の処理が終了すれば、以上の処理を終了してステップS1122(図11参照)の処理に移行する。 Next, the
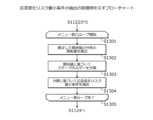
図13は、応答変化リスク最小条件の抽出の処理例を示すフローチャートである。図13は、図11のステップS1123の処理の詳細例を示す。はじめに、計画立案装置100は、メニュー数(i)のループ処理を開始する(ステップS1301~ステップS1305)。 FIG. 13 is a flowchart illustrating an example of processing for extracting a minimum response change risk condition. FIG. 13 shows a detailed example of the processing in step S1123 of FIG. First, the
次に、計画立案装置100は、推定した期待値の分布の類似性を算出する(ステップS1302)。次に、計画立案装置100は、類似性に基づいてステークホルダーを分類する(ステップS1303)。次に、計画立案装置100は、分類に基づいて応答変化リスクの最小条件を抽出する(ステップS1304)。次に、計画立案装置100は、メニュー数iにかかる処理が終了したか否かを判断する(ステップS1305)。計画立案装置100は、メニュー数i分の処理が終了していなければステップS1301に戻り、メニュー数i分の処理が終了すれば、以上の処理を終了してステップS1124の処理に移行する。 Next, the
図14は、応答変化リスクおよび期待値のスケジューリングの処理例を示すフローチャートである。図14に示す処理は、応答変化リスクおよび期待値のスケジューリングに活用する場合の例であり、図11のステップS1127の処理後に実行することができる。 FIG. 14 is a flowchart illustrating an example of processing for scheduling response change risks and expected values. The process shown in FIG. 14 is an example of utilization for scheduling of response change risk and expected value, and can be executed after the process of step S1127 in FIG. 11 .
計画立案装置100は、図11のステップS1127の処理後、メニュー数(i)のループ処理を開始する(ステップS1401~ステップS1408)。次に、計画立案装置100は、ステークホルダー数(j)のループ処理を開始する(ステップS1402~ステップS1407)。 After the processing of step S1127 in FIG. 11, the
次に、計画立案装置100は、応答変化リスクの最小値をステークホルダーjとメニューiにおけるパラメータtの制約条件として抽出する(ステップS1403)。次に、計画立案装置100は、パラメータ数(t)のループ処理を開始する(ステップS1404~ステップS1406)。 Next, the
次に、計画立案装置100は、期待値の範囲をステークホルダーjとメニューiにおけるパラメータtの制約条件として抽出する(ステップS1405)。次に、計画立案装置100は、パラメータ数t分の処理が終了していなければステップS1404に戻り、パラメータ数t分の処理が終了すればステップS1407の処理に移行する。 Next, the
次に、計画立案装置100は、ステークホルダー数jにかかる処理が終了したか否かを判断する(ステップS1407)。計画立案装置100は、ステークホルダー数j分の処理が終了していなければステップS1402に戻り、ステークホルダー数j分の処理が終了すればステップS1408の処理に移行する。次に、計画立案装置100は、メニュー数iにかかる処理が終了したか否かを判断する(ステップS1408)。計画立案装置100は、メニュー数i分の処理が終了していなければステップS1401に戻り、メニュー数i分の処理が終了すれば、以上の処理を終了する(図11のENDに移行)。 Next, the
(計画立案装置による処理の具体例)
次に、計画立案装置100による処理の具体例を説明する。図15Aは、サービスの利用者および提供者の例を示す説明図である。(Specific example of processing by planning device)
Next, a specific example of processing by the
図15A(a)はサービス例を示す図である。例えば、計画立案装置100は、一人の利用者uに対し一人の提供者pがサービスを提供する。この場合、ステークホルダーは利用者uと提供者pである。 FIG. 15A(a) is a diagram showing a service example. For example, in the
図15A(b)は利用者の応答モデルを示す図である。計画立案装置100は、各利用者uと、提供者pとで異なる応答モデルを用いる。計画立案装置100は、利用者uと提供者pの組合せをランダムに決定し、決定した各組合せの利用者uと提供者pの応答により提供するサービスを決定する。複数の利用者u(ID=0~2)、提供者p(ID=03~5)は、それぞれ時間違反の感度α,βそれぞれの値(図15A(b)では大小の表記)を有する。α,βの詳細は後述する。 FIG. 15A(b) is a diagram showing a user response model. The
図15Bは、計画データと実績データの例を示す図である。図15Bの横軸は時間(日付)、縦軸は図15Aに示した各利用者u(ID=0~2)と、提供者p(ID=3~5)である。図15Bにおいて、〇は提供者pの計画データ、△は利用者uの計画データ、□は実績データである。計画立案装置100は、提供者pの計画データ〇と利用者uの計画データ△とが一致する日付を利用者uに提示する。これに対し、利用者uは、提示された日付のうち実際にサービスを利用した日付が□で示される。 FIG. 15B is a diagram showing an example of plan data and performance data. The horizontal axis in FIG. 15B is time (date), and the vertical axis is each user u (ID=0 to 2) and provider p (ID=3 to 5) shown in FIG. 15A. In FIG. 15B, ◯ is the provider p's plan data, Δ is the user u's plan data, and □ is the performance data. The
例えば、日付(20)では、提供者p(ID=5)の計画データ〇と利用者u(ID=0)の計画データ△とが一致するため、計画立案装置100はこの日付でのサービス利用の情報を利用者uに提示する。そして、この日付で利用者uが実際にサービスを利用した実績データ□が示されている。 For example, on the date (20), the plan data ◯ of the provider p (ID=5) and the plan data Δ of the user u (ID=0) match. is presented to the user u. Then, the record data □ that the user u actually used the service on this date is shown.
これに対し、日付(21)では、提供者p(ID=4)の計画データ〇と利用者u(ID=0)の計画データ△とが一致するため、計画立案装置100はこの日付でのサービス利用の情報を利用者uに提示した。しかし、利用者uが実際にはサービスを利用していない(実績データ□がない)ことが示されている。 On the other hand, on the date (21), since the plan data ◯ of the provider p (ID=4) and the plan data Δ of the user u (ID=0) match, the
図16A,図16Bは、応答変化リスクの推定例の説明図である。計画立案装置100は、時間違反に関する感度を期待値(パラメータ)として応答変化リスクを推定する。図16Aに示すように、時刻tにおける対象sに対するステークホルダーiの応答変化リスクは、yt,s,iの式(3)に示される。累積違反は、vt,s,iの式(4)に示される。αiとβiは違反に対する感度、εsは対象s固有のノイズである。図16Aの横軸は時間であり、累積違反Vtに関与するノイズεs、違反量Xt、違反の信頼値δt、応答変化ytに関与する累積違反Vt、感度αiとβiの関係を示す。16A and 16B are explanatory diagrams of estimation examples of response change risks. The
図16B(a)に示すように、ステークホルダーiが利用者の場合、対象sに対する期待違反は、〇がsの観測値、点線の矩形□がsの計画値としたとき、違反量Xt-1、違反の信頼性δt-1、過去の累積の違反は上記式(4)で示される。図16B(a)の複数の□の位置に対する〇のずれ量が過去の違反に相当し、計画立案装置100は、過去の違反をΣ(累積)する。そして、計画立案装置100は、違反に対する感度(許容度)としてαiとβiを期待値(パラメータ)としてフィルタリングし、応答変化リスクを推定する。As shown in FIG. 16B (a), when stakeholder i is a user, the violation of expectations for target s is the amount of violation Xt- 1 , the reliability of the violation δt-1 , and the past cumulative violations are given by equation (4) above. 16B(a) corresponds to past violations, and the
ここで、図16B(b)に示すように、横軸をv、縦軸をyとしたとき、応答変化y=f(v)の関数の特性曲線を有する。特性曲線上において、y、v共に大きい範囲は、1.利用者iは、サービスの利用をやめようと考えていることに相当する。y、v共に中央部分の範囲では、2.利用者iは、例えば、前回、待たされた(時間違反が大きかった)のでサービスの利用をやめようかなと考えていることに相当する。y、v共に小さい範囲では、3.利用者iは、サービスをいつも通り利用しようと考えていることに相当する。 Here, as shown in FIG. 16B(b), when the horizontal axis is v and the vertical axis is y, it has a characteristic curve of a function of response change y=f(v). On the characteristic curve, the range where both y and v are large is 1. This corresponds to the fact that user i intends to stop using the service. In the central range of both y and v, 2. For example, the user i was made to wait last time (the time violation was significant), so this corresponds to thinking about stopping using the service. In the range where both y and v are small, 3. This means that user i intends to use the service as usual.
図16B(b)において、累積違反vが大きい程、応答変化リスクyが高い。切片βを超えるとサービスの利用をやめる利用者が増大する。時間違反の感度である傾きα、切片βはステークホルダー毎に異なる。違反に対する感度(傾きα,切片β)は、横軸を時間に対する時間違反、縦軸を割合とした場合、中央値μに対しσの幅を有する所定の分布特性を有する。 In FIG. 16B(b), the greater the cumulative violation v, the higher the response change risk y. When the intercept β is exceeded, the number of users who stop using the service increases. The slope α and intercept β, which are sensitivity to time violations, differ for each stakeholder. The sensitivity to violation (slope α, intercept β) has a predetermined distribution characteristic having a width of σ with respect to the median μ, where the horizontal axis is the time violation against time and the vertical axis is the ratio.
図17は、ステークホルダー毎の期待値の推定例を示す図である。利用者u(ID=0~2)と、提供者p(ID=3~5)それぞれの期待値(パラメータ)α,βの推定例を示す。利用者u(ID=0~2)と、提供者p(ID=3~5)それぞれで期待値(パラメータ)α,βの分布特性が異なっている。 FIG. 17 is a diagram illustrating an example of estimation of expected value for each stakeholder. Estimated examples of expected values (parameters) α and β for user u (ID=0 to 2) and provider p (ID=3 to 5) are shown. Distribution characteristics of expected values (parameters) α and β are different between user u (ID=0 to 2) and provider p (ID=3 to 5).
図18Aは、応答変化リスクを最小化する組合せ例の説明図である。図18A(a)は、応答変化リスクのパラメータが同じ人(ステークホルダー)同士で組合せた状態を示す。実施の形態の計画立案装置100は、α:大、β:小である利用者u(ID=0)と、提供者p(ID=3)を組合せる。また、計画立案装置100は、α:中、β:中である利用者u(ID=1)と、提供者p(ID=4)を組合せる。また、計画立案装置100は、α:小、β:大である利用者u(ID=2)と、提供者p(ID=5)を組合せる。 FIG. 18A is an explanatory diagram of a combination example that minimizes response change risk. FIG. 18A(a) shows a state in which people (stakeholders) with the same response change risk parameter are combined. The
図18A(b)は、図18A(a)に示す組合せ時の計画データと実績データである。この組合せの場合、計画変更の割合は、利用者u(ID=1)は0%、利用者u(ID=0)は4%であり、計画データに対する実績データのずれ(応答変化)を抑制できることが示されている。 FIG. 18A(b) is plan data and performance data at the time of combination shown in FIG. 18A(a). In the case of this combination, the rate of plan change is 0% for user u (ID=1) and 4% for user u (ID=0), suppressing deviation (response change) of actual data from plan data. shown that it can be done.
図18Bは、応答変化リスクを最小化できない組合せ例の説明図である。図18Bは、図18Aの対比用の説明図である。例えば、図18B(a)に示すように、応答変化リスクのパラメータが異なる人同士で組合せたとする。例えば、α:大、β:小である利用者u(ID=0)と、α:小、β:大である提供者p(ID=5)を組合せたとする。また、α:中、β:中である利用者u(ID=1)と、α:大、β;小である提供者p(ID=3)を組合せたとする。また、α:小、β:大である利用者u(ID=2)と、α:中、β:中の提供者p(ID=4)を組合せたとする。 FIG. 18B is an explanatory diagram of a combination example in which response change risk cannot be minimized. FIG. 18B is an explanatory diagram for comparison with FIG. 18A. For example, as shown in FIG. 18B(a), it is assumed that persons with different response change risk parameters are combined. For example, assume that a user u (ID=0) with α: large and β: small is combined with a provider p (ID=5) with α: small and β: large. Assume also that user u (ID=1) with α: medium and β: medium and provider p (ID=3) with α: large and β: small are combined. Assume also that a user u (ID=2) with α: small and β: large is combined with a provider p (ID=4) with α: medium and β: medium.
図18B(b)は、図18B(a)に示す組合せ時の計画データと実績データである。この組合せの場合、計画変更の割合は、利用者u(ID=1)は20%、利用者u(ID=0)は20%となった。このように、応答変化リスクのパラメータが異なる人同士で組合せた場合には、計画データに対する実績データのずれ(応答変化)が生じ、応答変化リスクを最小化することができない。 FIG. 18B(b) is plan data and performance data at the time of combination shown in FIG. 18B(a). In this combination, the rate of plan change was 20% for user u (ID=1) and 20% for user u (ID=0). In this way, when people with different response change risk parameters are combined, deviation (response change) of actual data from plan data occurs, and response change risk cannot be minimized.
図19は、推定した期待値の類似性の説明図である。図19(a)には、各利用者uと提供者pのα,βを示す。図19(b)には、縦軸に各利用者u(ID=0~2)、横軸に各提供者p(ID=3~5)を配置し、相互間のパラメータ分布の類似性(分布のずれ)を示す。類似性は、例えば、KLダイバージェンスあるいはJSダイバージェンスに基づき算出できる。 FIG. 19 is an explanatory diagram of the similarity of estimated expected values. FIG. 19(a) shows α and β of each user u and provider p. In FIG. 19(b), each user u (ID = 0 to 2) is arranged on the vertical axis and each provider p (ID = 3 to 5) is arranged on the horizontal axis, and the similarity of parameter distribution between each other ( distribution deviation). Similarity can be calculated based on, for example, KL divergence or JS divergence.
図19(b)に示すように、例えば、計画立案装置100は、利用者u(ID=1)に対しては、提供者p(ID=3)が値「0.04」であり、提供者p(ID=5)が値「0.01」でありそれぞれ類似していると判断する。また、計画立案装置100は、利用者u(ID=0)に対しては、提供者p(ID=4)が値「0.16」であり類似していると判断する。 As shown in FIG. 19B, for example, the
図20A,図20Bは、推薦するメニューの表示例を示す図である。計画立案装置100は、画面データを生成し、利用者あるいは提供者のクライアント211に画面データを送信出力する。 20A and 20B are diagrams showing display examples of recommended menus. The
図20Aは、利用者に対し推薦するメニューの表示画面2001を示す。例えば、計画立案装置100は、メニューに対して応答変化リスクを最小にする組合せを表示出力する。計画立案装置100は、表示画面2001の左側の利用者欄2011には、利用者の各種情報(名前「東京太郎」、年齢、既往歴等)を表示する。計画立案装置100は、表示画面2001の中央および右側のメニュー欄2012には、利用者「東京太郎」の認知症向け訓練として計画したメニューの情報を表示する。計画立案装置100は、メニュー欄2012には、立案者の名前、各メニュー(歩行訓練、栄養指導、認知トレーニング等)の目標と実績のグラフ2013、曜日別の各メニューの指導員とスケジュールを示すスケジュール表2014を表示する。 FIG. 20A shows a
図20Bは、提供者に対し推薦するメニューの表示画面2002を示す。例えば、計画立案装置100は、提供者に対し、応答変化リスクを制約条件としたメニューの組合せを表示出力する。計画立案装置100は、表示画面2002には、縦軸に各利用者を表示し、横軸の日付(2022年1月)に各利用者のメニューのスケジュール表2021を表示する。計画立案装置100は、スケジュール表2021の利用者と日付のマス部分にメニューを表示するとともに、応答変化リスクの値(図6C参照)を表示する。また、計画立案装置100は、例えば、応答変化リスクの値が高い程、対応するマス部分を濃い色等で表示することで、該当するマス(利用者と日付)部分のメニュー実行についてリスクが高いことを表示する。提供者は、スケジュール表2021に表示されている計画立案装置100が推薦するメニュー毎のリスクを考慮してスケジューリングを行うことができる。 FIG. 20B shows a
上述した実施の形態では、計画立案装置100は、サービスとして利用者のリハビリのメニューを推薦する例を用いて説明した。これに限らず、計画立案装置100は、各種技術の訓練や運動のメニュー、病院での検診や治療のメニュー、行政における各種サービスのメニュー等に同様に適用することができる。 In the above-described embodiment, the
以上説明したように、計画立案装置100によれば、所定のサービスのメニューの情報と、サービスに関係するステークホルダーの情報とを取得し、ステークホルダーとメニューの組合せについて、メニューの実行の変更頻度を算出し、算出した変更頻度に基づいて、推薦対象のメニューを特定し、算出した組合せのステークホルダーに対し、特定したメニューを出力する処理を行う。これにより、計画立案装置100は、ステークホルダーに対して、実施の可能性が高いメニューを推薦できるようになる。 As described above, according to the
また、計画立案装置100によれば、取得の処理は、サービスのメニュー実行を計画した計画データと、計画データのメニューを実際に実行した実績データとを取得し、算出の処理は、取得した計画データと実績データとの差分に基づき、メニュー実行の有無の変化点を抽出し、変化点を有するメニューに対するステークホルダー毎の変更頻度を算出し、特定の処理は、メニューに対して変更頻度が低いステークホルダーの組合せを特定する処理を行う。これにより、計画立案装置100は、過去の計画データと実績データとに基づき、ステークホルダーに対して、より実施の可能性が高いメニューを推薦できるようになる。 Further, according to the
また、計画立案装置100によれば、変更頻度の算出の処理は、ステークホルダー毎の、メニューの実施に関する期待値を示す時間、場所、効果、難度を含むパラメータの分布の重なりに基づき算出する処理を行う。このように、変更頻度はステークホルダー毎のサービス実施に対する期待値が異なる場合に生じやすい傾向を考慮し、計画立案装置100は、複数のステークホルダー間で最適なメニューを推薦できるようになる。 In addition, according to the
また、計画立案装置100によれば、特定の処理は、期待値の分布が類似するステークホルダー同士を組合せる処理を行う。これにより、計画立案装置100は、組合せたステークホルダーそれぞれに最適なメニューを推薦できるようになる。 Further, according to the
また、計画立案装置100によれば、特定の処理は、複数のメニュー毎の期待値の分布に基づき、複数のメニューを組合せたワークフローを求める処理を行う。これにより、計画立案装置100は、サービスを構成する複数のメニューについて、いずれも実施の可能性が高いメニューを組合せたサービスフローとして推薦できるようになる。 Further, according to the
また、ステークホルダーは、サービスのメニューを立案する立案者と、サービスを提供する提供者と、サービスを利用する利用者とを含み、計画立案装置100によれば、特定の処理は、期待値の分布が類似する提供者と利用者とを組合せる処理を含んでもよい。これにより、計画立案装置100は、提供者と利用者のそれぞれに対しいずれも実施の可能性が高いメニューを推薦できるようになる。 Stakeholders include planners who plan service menus, providers who provide services, and users who use services. may include processing to combine similar providers and users. As a result, the
また、計画立案装置100によれば、特定の処理は、メニューに対する提供者の変更頻度が低い場合、メニューに対する提供者の変更頻度を制約条件として、当該変更頻度が低いメニューを割り当てる処理を行う。これにより、計画立案装置100は、サービスのメニューを組合せたスケジューリングに活用でき、提供者によるスケジューリングの実施可能性を向上できるようになる。 Further, according to the
また、計画立案装置100によれば、特定の処理は、メニューに対する利用者の期待値の分布を制約条件として、メニューを割り当てる処理を行う。これにより、計画立案装置100は、利用者による複数のメニューの実施可能性を向上できるようになる。 Further, according to the
また、計画立案装置100によれば、出力の処理は、利用者に対し、変更頻度が低いメニューの組合せを表示出力する処理を行う。これにより、計画立案装置100を利用するサービスの利用者に対し、実現可能性が高いメニューの組合せを具体的に推薦できる。 Further, according to the
また、計画立案装置100によれば、出力の処理は、提供者に対し、変更頻度を制約条件として、利用者毎にメニューを組合せたスケジュールを表示出力する処理を行う。これにより、計画立案装置100を利用するサービスの提供者に対し、サービス提供の状況に応じて、各利用者に対し実現可能性が高いメニューの組合せを具体的に推薦できる。 Further, according to the
また、計画立案装置100によれば、表示出力の処理は、メニュー毎の変更頻度の情報を含むこととしてもよい。これにより、計画立案装置100は、提供者に対し、推薦したスケジュールの各メニューの実現可能性を具体的に提示でき、提供者はメニューの実現可能性を把握した状態でスケジュールを作成できるようになる。 Further, according to the
なお、本実施の形態で説明した計画立案方法は、予め用意されたプログラムをPCやワークステーションなどのコンピュータで実行することにより実現することができる。本実施の形態で説明した計画立案プログラムは、コンピュータで読み取り可能な記録媒体に記録され、コンピュータによって記録媒体から読み出されることによって実行される。記録媒体は、ハードディスク、フレキシブルディスク、CD(Compact Disc)-ROM、MO(Magneto Optical disc)、DVD(Digital Versatile Disc)などである。また、本実施の形態で説明した計画立案プログラムは、インターネットなどのネットワークを介して配布してもよい。 The planning method described in this embodiment can be implemented by executing a program prepared in advance on a computer such as a PC or workstation. The planning program described in this embodiment is recorded in a computer-readable recording medium and executed by being read from the recording medium by a computer. Recording media include hard disks, flexible disks, CD (Compact Disc)-ROM, MO (Magneto Optical disc), DVD (Digital Versatile Disc), and the like. Also, the planning program described in this embodiment may be distributed via a network such as the Internet.
上述した実施の形態に関し、さらに以下の付記を開示する。 Further, the following additional remarks are disclosed with respect to the above-described embodiment.
(付記1)所定のサービスのメニューの情報と、前記サービスに関係するステークホルダーの情報とを取得し、
前記ステークホルダーと前記メニューの組合せについて、前記メニューの実行の変更頻度を算出し、
前記算出した変更頻度に基づいて、推薦対象のメニューを特定し、
前記算出した組合せの前記ステークホルダーに対し、前記特定したメニューを出力する、
処理をコンピュータが実行することを特徴とする計画立案方法。(Appendix 1) Acquiring information on a menu of a predetermined service and information on stakeholders related to the service,
calculating the change frequency of execution of the menu for the combination of the stakeholder and the menu;
Identifying a menu to be recommended based on the calculated change frequency,
outputting the identified menu to the stakeholder of the calculated combination;
A planning method characterized in that processing is executed by a computer.
(付記2)前記取得の処理は、
前記サービスのメニュー実行を計画した計画データと、前記計画データの前記メニューを実際に実行した実績データとを取得し、
前記算出の処理は、
取得した前記計画データと前記実績データとの差分に基づき、前記メニュー実行の有無の変化点を抽出し、
前記変化点を有する前記メニューに対する前記ステークホルダー毎の前記変更頻度を算出し、
前記特定の処理は、
前記メニューに対して前記変更頻度が低い前記ステークホルダーの組合せを特定する、
ことを特徴とする付記1に記載の計画立案方法。(Appendix 2) The acquisition process is
Acquiring plan data for planning the menu execution of the service and actual data for actually executing the menu of the plan data;
The calculation process is
based on the difference between the acquired plan data and the actual data, extracting a point of change in whether or not the menu is executed;
calculating the change frequency for each of the stakeholders for the menu having the change point;
The specific processing is
identifying combinations of the stakeholders with the low frequency of changes to the menu;
The planning method according to
(付記3)前記変更頻度の算出の処理は、
前記ステークホルダー毎の、前記メニューの実施に関する期待値を示す時間、場所、効果、難度を含むパラメータの分布の重なりに基づき算出する、
ことを特徴とする付記2に記載の計画立案方法。(Appendix 3) The process of calculating the change frequency is
Calculated based on the overlap of the distribution of parameters including time, place, effect, and difficulty that indicate the expected value of the implementation of the menu for each of the stakeholders,
The planning method according to
(付記4)前記特定の処理は、
前記期待値の分布が類似する前記ステークホルダー同士を組合せる、
ことを特徴とする付記3に記載の計画立案方法。(Appendix 4) The specific processing is
Combining the stakeholders with similar distributions of the expected values,
The planning method according to
(付記5)前記特定の処理は、
複数のメニュー毎の前記期待値の分布に基づき、複数のメニューを組合せたワークフローを求める、
ことを特徴とする付記3または4に記載の計画立案方法。(Appendix 5) The specific processing is
Obtaining a workflow that combines a plurality of menus based on the distribution of the expected values for each of the plurality of menus;
The planning method according to
(付記6)前記ステークホルダーは、前記サービスのメニューを立案する立案者と、前記サービスを提供する提供者と、前記サービスを利用する利用者とを含み、
前記特定の処理は、
前記期待値の分布が類似する前記提供者と前記利用者とを組合せる処理を含む、
ことを特徴とする付記4に記載の計画立案方法。(Appendix 6) The stakeholders include a planner who plans the menu of the service, a provider who provides the service, and a user who uses the service,
The specific processing is
Including a process of combining the provider and the user with similar expected value distributions,
The planning method according to
(付記7)前記特定の処理は、
前記メニューに対する前記提供者の前記変更頻度が低い場合、前記メニューに対する前記提供者の前記変更頻度を制約条件として、当該変更頻度が低い前記メニューを割り当てる、
ことを特徴とする付記6に記載の計画立案方法。(Appendix 7) The specific processing is
When the frequency of change of the menu by the provider is low, assigning the menu with the low frequency of change with the frequency of change of the menu by the provider as a constraint condition;
The planning method according to
(付記8)前記特定の処理は、
前記メニューに対する前記利用者の前記期待値の分布を制約条件として、前記メニューを割り当てる、
ことを特徴とする付記6に記載の計画立案方法。(Appendix 8) The specific processing is
Allocating the menu with the distribution of the expected value of the user for the menu as a constraint;
The planning method according to
(付記9)前記出力の処理は、
前記利用者に対し、前記変更頻度が低い前記メニューの組合せを表示出力する、
ことを特徴とする付記8に記載の計画立案方法。(Appendix 9) The processing of the output is
Displaying and outputting the combination of the menus with the low change frequency to the user;
The planning method according to
(付記10)前記出力の処理は、
前記提供者に対し、前記変更頻度を制約条件として、前記利用者毎に前記メニューを組合せたスケジュールを表示出力する、
ことを特徴とする付記7に記載の計画立案方法。(Appendix 10) The processing of the output is
Displaying and outputting to the provider a schedule that combines the menus for each of the users, with the frequency of changes as a constraint condition;
The planning method according to
(付記11)前記表示出力の処理は、
前記メニュー毎の変更頻度の情報を含む、
ことを特徴とする付記10に記載の計画立案方法。(Appendix 11) The processing of the display output is
Including information on the change frequency for each menu,
The planning method according to
(付記12)所定のサービスのメニューの情報と、前記サービスに関係するステークホルダーの情報とを取得し、
前記ステークホルダーと前記メニューの組合せについて、前記メニューの実行の変更頻度を算出し、
前記算出した変更頻度に基づいて、推薦対象のメニューを特定し、
前記算出した組合せの前記ステークホルダーに対し、前記特定したメニューを出力する、
処理をコンピュータに実行させることを特徴とする計画立案プログラム。(Appendix 12) Acquiring information on a menu of a predetermined service and information on stakeholders related to the service,
calculating the change frequency of execution of the menu for the combination of the stakeholder and the menu;
Identifying a menu to be recommended based on the calculated change frequency,
outputting the identified menu to the stakeholder of the calculated combination;
A planning program characterized by causing a computer to execute processing.
(付記13)所定のサービスのメニューの情報と、前記サービスに関係するステークホルダーの情報とを取得し、
前記ステークホルダーと前記メニューの組合せについて、前記メニューの実行の変更頻度を算出し、
前記算出した変更頻度に基づいて、推薦対象のメニューを特定し、
前記算出した組合せの前記ステークホルダーに対し、前記特定したメニューを出力する、制御部を備えた、
ことを特徴とする計画立案装置。(Appendix 13) Acquiring information on a menu of a predetermined service and information on stakeholders related to the service,
calculating the change frequency of execution of the menu for the combination of the stakeholder and the menu;
Identifying a menu to be recommended based on the calculated change frequency,
A control unit that outputs the identified menu to the stakeholders of the calculated combination,
A planning device characterized by:
(付記14)前記制御部は、
前記メニューの情報と、前記サービスに関係するステークホルダーの情報を、前記ステークホルダーのクライアントから取得し、
前記推定したメニューを前記クライアントに出力する、
ことを特徴とする付記13に記載の計画立案装置。(Appendix 14) The control unit
obtaining information of the menu and information of stakeholders related to the service from clients of the stakeholders;
outputting the estimated menu to the client;
The planning device according to appendix 13, characterized in that:
100 計画立案装置
200 サーバ
201 メニューの組合せテンプレートDB
210 リハビリ施設
211 クライアント
213 過去の計画/実績DB
214 メニューDB
215 ステークホルダーDB
301 CPU
302 メモリ
303 ネットワークI/F
305 記録媒体
401 過去データ取得部
402 応答変化点抽出部
403 応答変化リスク推定部
404 リスク最小条件抽出部
405 メニュー推薦部
412 応答変化点DB
413 応答変化リスクDB
414 条件付きメニューDB
2001,2002 表示画面
m 立案者
p 提供者
u 利用者100
210
214 Menu DB
215 Stakeholder DB
301 CPUs
302
305
413 Response Change Risk DB
414 Conditional Menu DB
2001, 2002 Display screen m planner p provider u user
Claims (12)
Translated fromJapanese前記ステークホルダーと前記メニューの組合せについて、前記メニューの実行の変更頻度を算出し、
前記算出した変更頻度に基づいて、推薦対象のメニューを特定し、
前記算出した組合せの前記ステークホルダーに対し、前記特定したメニューを出力する、
処理をコンピュータが実行することを特徴とする計画立案方法。Acquiring information on a menu of a predetermined service and information on stakeholders related to the service;
calculating the change frequency of execution of the menu for the combination of the stakeholder and the menu;
Identifying a menu to be recommended based on the calculated change frequency,
outputting the identified menu to the stakeholder of the calculated combination;
A planning method characterized in that processing is executed by a computer.
前記サービスのメニュー実行を計画した計画データと、前記計画データの前記メニューを実際に実行した実績データとを取得し、
前記算出の処理は、
取得した前記計画データと前記実績データとの差分に基づき、前記メニュー実行の有無の変化点を抽出し、
前記変化点を有する前記メニューに対する前記ステークホルダー毎の前記変更頻度を算出し、
前記特定の処理は、
前記メニューに対して前記変更頻度が低い前記ステークホルダーの組合せを特定する、
ことを特徴とする請求項1に記載の計画立案方法。The acquisition process includes:
Acquiring plan data for planning the menu execution of the service and actual data for actually executing the menu of the plan data;
The calculation process is
based on the difference between the acquired plan data and the actual data, extracting a point of change in whether or not the menu is executed;
calculating the change frequency for each of the stakeholders for the menu having the change point;
The specific processing is
identifying combinations of the stakeholders with the low frequency of changes to the menu;
The planning method according to claim 1, characterized by:
前記ステークホルダー毎の、前記メニューの実施に関する期待値を示す時間、場所、効果、難度を含むパラメータの分布の重なりに基づき算出する、
ことを特徴とする請求項2に記載の計画立案方法。The processing for calculating the change frequency includes:
Calculated based on the overlap of the distribution of parameters including time, place, effect, and difficulty that indicate the expected value of the implementation of the menu for each of the stakeholders,
3. The planning method according to claim 2, characterized by:
前記期待値の分布が類似する前記ステークホルダー同士を組合せる、
ことを特徴とする請求項3に記載の計画立案方法。The specific processing is
Combining the stakeholders with similar distributions of the expected values,
4. The planning method according to claim 3, characterized in that:
複数のメニュー毎の前記期待値の分布に基づき、複数のメニューを組合せたワークフローを求める、
ことを特徴とする請求項3または4に記載の計画立案方法。The specific processing is
Obtaining a workflow that combines a plurality of menus based on the distribution of the expected values for each of the plurality of menus;
5. The planning method according to claim 3 or 4, characterized in that:
前記特定の処理は、
前記期待値の分布が類似する前記提供者と前記利用者とを組合せる処理を含む、
ことを特徴とする請求項4に記載の計画立案方法。The stakeholders include a planner who plans the menu of the service, a provider who provides the service, and a user who uses the service,
The specific processing is
Including a process of combining the provider and the user with similar expected value distributions,
5. The planning method according to claim 4, characterized in that:
前記メニューに対する前記提供者の前記変更頻度が低い場合、前記メニューに対する前記提供者の前記変更頻度を制約条件として、当該変更頻度が低い前記メニューを割り当てる、
ことを特徴とする請求項6に記載の計画立案方法。The specific processing is
When the frequency of change of the menu by the provider is low, assigning the menu with the low frequency of change with the frequency of change of the menu by the provider as a constraint condition;
7. The planning method according to claim 6, characterized by:
前記メニューに対する前記利用者の前記期待値の分布を制約条件として、前記メニューを割り当てる、
ことを特徴とする請求項6に記載の計画立案方法。The specific processing is
Allocating the menu with the distribution of the expected value of the user for the menu as a constraint;
7. The planning method according to claim 6, characterized by:
前記利用者に対し、前記変更頻度が低い前記メニューの組合せを表示出力する、
ことを特徴とする請求項8に記載の計画立案方法。Processing the output includes:
Displaying and outputting the combination of the menus with the low change frequency to the user;
9. The planning method according to claim 8, characterized by:
前記提供者に対し、前記変更頻度を制約条件として、前記利用者毎に前記メニューを組合せたスケジュールを表示出力する、
ことを特徴とする請求項7に記載の計画立案方法。Processing the output includes:
Displaying and outputting to the provider a schedule that combines the menus for each of the users, with the frequency of changes as a constraint condition;
8. The planning method according to claim 7, characterized by:
前記メニュー毎の変更頻度の情報を含む、
ことを特徴とする請求項10に記載の計画立案方法。The display output processing includes:
Including information on the change frequency for each menu,
11. The planning method according to claim 10, characterized in that:
前記ステークホルダーと前記メニューの組合せについて、前記メニューの実行の変更頻度を算出し、
前記算出した変更頻度に基づいて、推薦対象のメニューを特定し、
前記算出した組合せの前記ステークホルダーに対し、前記特定したメニューを出力する、
処理をコンピュータに実行させることを特徴とする計画立案プログラム。Acquiring information on a menu of a predetermined service and information on stakeholders related to the service;
calculating the change frequency of execution of the menu for the combination of the stakeholder and the menu;
Identifying a menu to be recommended based on the calculated change frequency,
outputting the identified menu to the stakeholder of the calculated combination;
A planning program characterized by causing a computer to execute processing.
Priority Applications (3)
| Application Number | Priority Date | Filing Date | Title |
|---|---|---|---|
| JP2022013730AJP2023111727A (en) | 2022-01-31 | 2022-01-31 | Planning method and planning program |
| US17/983,740US20230245756A1 (en) | 2022-01-31 | 2022-11-09 | Planning method and computer-readable recording medium storing planning program |
| EP22206609.4AEP4220657A1 (en) | 2022-01-31 | 2022-11-10 | Planning method and planning program |
Applications Claiming Priority (1)
| Application Number | Priority Date | Filing Date | Title |
|---|---|---|---|
| JP2022013730AJP2023111727A (en) | 2022-01-31 | 2022-01-31 | Planning method and planning program |
Publications (1)
| Publication Number | Publication Date |
|---|---|
| JP2023111727Atrue JP2023111727A (en) | 2023-08-10 |
Family
ID=84331126
Family Applications (1)
| Application Number | Title | Priority Date | Filing Date |
|---|---|---|---|
| JP2022013730APendingJP2023111727A (en) | 2022-01-31 | 2022-01-31 | Planning method and planning program |
Country Status (3)
| Country | Link |
|---|---|
| US (1) | US20230245756A1 (en) |
| EP (1) | EP4220657A1 (en) |
| JP (1) | JP2023111727A (en) |
Family Cites Families (9)
| Publication number | Priority date | Publication date | Assignee | Title |
|---|---|---|---|---|
| JP2008165358A (en) | 2006-12-27 | 2008-07-17 | Carecom:Kk | Nursing support system |
| US20090112618A1 (en)* | 2007-10-01 | 2009-04-30 | Johnson Christopher D | Systems and methods for viewing biometrical information and dynamically adapting schedule and process interdependencies with clinical process decisioning |
| US20100106517A1 (en)* | 2008-10-23 | 2010-04-29 | General Electric Company | Systems for and methods of medical scheduling based on simulation-based optimization |
| US20170091421A1 (en) | 2015-09-30 | 2017-03-30 | International Business Machines Corporation | Modification of Personalized Health Care Plans Based on Patient Adherence to Patient Actions |
| CN109564780B (en) | 2016-08-08 | 2023-11-03 | 赛因特凯亚控股公司 | Support system and method for creating care plan, and storage medium |
| US20190206555A1 (en) | 2017-12-28 | 2019-07-04 | Ethicon Llc | Cloud-based medical analytics for customization and recommendations to a user |
| US10811139B1 (en) | 2018-06-13 | 2020-10-20 | Clarify Health Solutions, Inc. | Computer network architecture with machine learning and artificial intelligence and dynamic patient guidance |
| US11631037B2 (en)* | 2019-03-20 | 2023-04-18 | Mend VIP, Inc. | Apparatus, system and method for predicting medical no-shows and for scheduling |
| JP6792892B2 (en) | 2019-03-29 | 2020-12-02 | 株式会社Rehab for JAPAN | Rehabilitation plan creation support device, rehabilitation plan creation support system, rehabilitation plan creation support method, rehabilitation plan creation support computer program |
- 2022
- 2022-01-31JPJP2022013730Apatent/JP2023111727A/enactivePending
- 2022-11-09USUS17/983,740patent/US20230245756A1/enactivePending
- 2022-11-10EPEP22206609.4Apatent/EP4220657A1/enactivePending
Also Published As
| Publication number | Publication date |
|---|---|
| US20230245756A1 (en) | 2023-08-03 |
| EP4220657A1 (en) | 2023-08-02 |
Similar Documents
| Publication | Publication Date | Title |
|---|---|---|
| US20200160985A1 (en) | Patient-Centric Eco-System with Automated Workflow and Facility Manager for Improved Delivery of Medical Services | |
| Salzarulo et al. | The impact of variability and patient information on health care system performance | |
| US20160188799A1 (en) | Method and system for online delivery of healthcare | |
| US20120166218A1 (en) | Method and system of real-time customizable medical search analytics | |
| US20130018674A1 (en) | System and method for radiology workflow management and a tool therefrom | |
| Salzarulo et al. | Beyond patient classification: Using individual patient characteristics in appointment scheduling | |
| JP5739700B2 (en) | Similar case browsing system, similar case browsing method | |
| CN112582057B (en) | Advanced Medical Imaging in a Distributed Setting | |
| Samorani et al. | Optimal sequencing of unpunctual patients in high‐service‐level clinics | |
| US20150100349A1 (en) | Untethered Community-Centric Patient Health Portal | |
| US20170177802A1 (en) | Allergy Service Management Portal | |
| US20180096483A1 (en) | Method of presenting health care information | |
| JP2018518783A (en) | System and method for implementing remote care services | |
| JP7388356B2 (en) | Medical information processing system, medical information processing device, and medical information processing method | |
| Ben Mbarek et al. | A human behaviour-based simulation model for resource allocation at a multi-specialty outpatient clinic | |
| US20150294071A1 (en) | Method and computer program for resource scheduling | |
| Villa et al. | A review on usability features for designing electronic health records | |
| JP7216664B2 (en) | Clinical reports with actionable recommendations | |
| KR102246603B1 (en) | Method For Converting Health Information And System For Managing Health Information | |
| US11328348B2 (en) | Obfuscated service provider identity during client selection | |
| JP2023111727A (en) | Planning method and planning program | |
| US20190244696A1 (en) | Medical record management system with annotated patient images for rapid retrieval | |
| Kyriazakos et al. | The role of big data and artificial intelligence in clinical research and digital therapeutics | |
| JP2009259219A (en) | Rater resource allocation system and method | |
| Bass et al. | Implementing an Application Programming Interface for PROMIS Measures at three medical centers |
Legal Events
| Date | Code | Title | Description |
|---|---|---|---|
| A621 | Written request for application examination | Free format text:JAPANESE INTERMEDIATE CODE: A621 Effective date:20241010 | |
| A977 | Report on retrieval | Free format text:JAPANESE INTERMEDIATE CODE: A971007 Effective date:20250924 |