JP2022163277A - System, method, and program for digitizing non-financial information and evaluating company value - Google Patents
System, method, and program for digitizing non-financial information and evaluating company valueDownload PDFInfo
- Publication number
- JP2022163277A JP2022163277AJP2021068118AJP2021068118AJP2022163277AJP 2022163277 AJP2022163277 AJP 2022163277AJP 2021068118 AJP2021068118 AJP 2021068118AJP 2021068118 AJP2021068118 AJP 2021068118AJP 2022163277 AJP2022163277 AJP 2022163277A
- Authority
- JP
- Japan
- Prior art keywords
- index
- pbr
- individual
- parent index
- regression analysis
- Prior art date
- Legal status (The legal status is an assumption and is not a legal conclusion. Google has not performed a legal analysis and makes no representation as to the accuracy of the status listed.)
- Granted
Links
- 238000000034methodMethods0.000titleclaimsabstractdescription20
- 238000000611regression analysisMethods0.000claimsabstractdescription86
- 238000011156evaluationMethods0.000claimsabstractdescription19
- 210000003813thumbAnatomy0.000claimsdescription5
- 238000004364calculation methodMethods0.000abstractdescription24
- 238000004458analytical methodMethods0.000abstractdescription3
- 238000010586diagramMethods0.000description14
- 238000004891communicationMethods0.000description5
- 230000006870functionEffects0.000description4
- 230000001419dependent effectEffects0.000description3
- 238000013459approachMethods0.000description2
- 238000013524data verificationMethods0.000description2
- 238000005516engineering processMethods0.000description1
- 230000004044responseEffects0.000description1
- 238000012502risk assessmentMethods0.000description1
Images


Landscapes
- Financial Or Insurance-Related Operations Such As Payment And Settlement (AREA)
Abstract
Description
Translated fromJapanese本発明は、非財務情報を数値化して企業価値を評価するためのシステム、方法、及びプログラムに関するものである。 The present invention relates to a system, method, and program for quantifying non-financial information and evaluating corporate value.
近年、ESG投資拡大に向けて、非財務情報を評価し、ESG格付け(Rating)を開示する動きがみられる(例えば、非特許文献1参照)。ここで、ESG投資とは、環境(Environment)、社会(Social)、企業統治(Governance)の3つの観点から企業の将来性や持続性などを分析・評価した上で、投資先の企業等を選別する方法である。 In recent years, there has been a movement to evaluate non-financial information and disclose ESG ratings in order to expand ESG investment (see, for example, Non-Patent Document 1). Here, ESG investment means analyzing and evaluating a company's future potential and sustainability from the three perspectives of Environment, Social, and Governance. It is a method of sorting.
しかしながら、ESG格付けは、非財務情報を点数化し、ESG対応状況などを踏まえて企業を評価する方法として有益であるものの、その格付けが企業の経済的価値にどのような影響を及ぼすのか、客観的かつ適切に把握するのが難しいという問題があった。 However, although ESG ratings are useful as a method of scoring non-financial information and evaluating companies based on the status of ESG compliance, etc., it is difficult to objectively assess how the ratings affect a company's economic value. In addition, there is a problem that it is difficult to grasp it properly.
本発明は、以上説明した事情を鑑みてなされたものであり、非財務情報を数値化することで、企業価値を客観的かつ適切に評価することができる技術を提供することを目的の1つとする。 The present invention has been made in view of the circumstances described above, and one of its purposes is to provide a technology that can objectively and appropriately evaluate corporate value by quantifying non-financial information. do.
本発明の実施形態に係るシステムは、制御部、記憶部を備えた企業価値の評価システムであって、制御部は、記憶部に記憶されたプログラムを実行することにより、対象国の株式指標である親指数を、親指数の純資産で除することで親指数の株価純資産倍率(PBR)を算出するステップと、式(1)に示す重回帰式を利用して親指数の重回帰分析を行うステップと、
Y0=α*X01+β*X02+γ*X03+δ・・・(1)
Y0:親指数
X01:株価指数
X02:為替レート
X03:親指数の純資産
親指数の重回帰分析によって得られた親指数の予測値を、親指数の純資産で除することで親指数の補正PBRを算出するステップと、式(2)に示す単回帰式を利用して個別企業の第1の単回帰分析を行うステップと、
Y1=α1*X11+β1・・・(2)
Y1:個別企業の純資産
X11:親指数の純資産
式(3)に示す単回帰式を利用して個別企業の第2の単回帰分析を行うステップと、
Y2=α2*X21+β2・・・(3)
Y2:個別企業のPBR
X21:親指数のPBR
個別企業の第1の単回帰分析によって得られた個別企業の純資産の予測値に、親指数の補正PBRを乗ずることで、個別企業の第1の修正時価を算出するステップと、親指数の補正PBRを、式(3)の単回帰式に当てはめることで、個別企業の調整PBRを算出するステップと、個別企業の純資産の予測値に、個別企業の調整PBRから親指数の補正PBRを減じたものを乗ずることで、個別企業の第2の修正時価を算出するステップと、個別企業の時価総額と、第1の修正時価及び第2の修正時価とに基づいて、個別企業の非財務リスクに関わる非財務リスク関連情報を生成するステップとを実行するように構成されたことを要旨とする。A system according to an embodiment of the present invention is a corporate value evaluation system comprising a control unit and a storage unit. A step of calculating the price book value ratio (PBR) of the parent index by dividing a certain parent index by the net assets of the parent index, and performing multiple regression analysis of the parent index using the multiple regression formula shown in formula (1). a step;
Y0=α*X01+β*X02+γ*X03+δ (1)
Y0: Parent index X01: Stock index X02: Exchange rate X03: Net assets of the parent index The adjusted PBR of the parent index is calculated by dividing the predicted value of the parent index obtained by the multiple regression analysis of the parent index by the net assets of the parent index. A step of calculating, a step of performing a first simple regression analysis of an individual company using the simple regression equation shown in formula (2),
Y1=α1*X11+β1 (2)
Y1: Net assets of individual companies X11: Net assets of parent index A step of performing a second simple regression analysis of individual companies using the simple regression formula shown in formula (3);
Y2=α2*X21+β2 (3)
Y2: PBR of individual companies
X21: PBR of thumb index
A step of calculating a first adjusted market value of an individual company by multiplying the predicted value of the net assets of the individual company obtained by the first simple regression analysis of the individual company by the corrected PBR of the parent index; By applying the PBR to the simple regression formula (3), the step of calculating the adjusted PBR of the individual company and subtracting the adjusted PBR of the parent from the adjusted PBR of the individual company to the predicted value of the net assets of the individual company Multiplying the non-financial risk of the individual company based on the step of calculating the second adjusted market value of the individual company, the market capitalization of the individual company, the first adjusted market value and the second adjusted market value and generating relevant non-financial risk-related information.
ここで、上記構成にあっては、非財務リスク関連情報を生成するステップは、個別企業の時価総額から、第1の修正時価及び第2の修正時価を減ずることで、個別企業の非財務情報のリスク量を算出するステップを含んでもよい。また、非財務リスク関連情報を生成するステップは、個別企業の非財務情報のリスク量を、個別企業の時価総額で除することで、個別企業の非財務情報のリスク割合を算出するステップをさらに含んでもよい。さらにまた、上記構成にあっては、所定期間における個別企業の非財務リスク関連情報を、表示装置にグラフ表示するステップをさらに実行するようにしてもよい。 Here, in the above configuration, the step of generating the non-financial risk-related information includes subtracting the first adjusted market value and the second adjusted market value from the market capitalization of the individual company to obtain the non-financial information of the individual company. may include a step of calculating the risk amount of Further, the step of generating the non-financial risk-related information further includes the step of calculating the risk ratio of the non-financial information of the individual company by dividing the risk amount of the non-financial information of the individual company by the market capitalization of the individual company. may contain. Furthermore, in the above configuration, the step of graphically displaying the non-financial risk-related information of individual companies for a predetermined period on the display device may be further executed.
本発明の実施形態によれば、非財務情報を数値化することで、企業価値を客観的かつ適切に評価することが可能となる。 According to the embodiment of the present invention, by quantifying non-financial information, it becomes possible to objectively and appropriately evaluate corporate value.
以下、図面を参照しながら、本発明の実施形態について説明する。 Hereinafter, embodiments of the present invention will be described with reference to the drawings.
A.本実施形態
(概要)
従来より、非財務情報のリスク(以下、非財務リスク)への対応として、個別のリスクの中から定量的に把握できるものを抽出し、リスク量の算出やリスク評価を行う方法が広く知られているが、非財務リスク全体としてどれくらいのリスク量なのかを把握するというアプローチを採用する方法は、未だ知られていない。A. This embodiment (outline)
Conventionally, as a response to non-financial information risks (hereafter referred to as non-financial risks), a method of extracting those that can be quantitatively grasped from individual risks, calculating the amount of risk, and conducting risk assessment has been widely known. However, there is still no known method of adopting an approach to grasp the amount of non-financial risk as a whole.
本開示の方法は、このような先進的なアプローチを採用することで、非財務リスクのリスク量やリスク割合など、非財務リスクに関わる情報(非財務リスク関連情報)を把握する点に特徴がある。 By adopting such an advanced approach, the method disclosed in this disclosure is characterized by the ability to grasp information related to non-financial risks (non-financial risk-related information), such as the risk amount and risk ratio of non-financial risks. be.
詳細は後述するが、本開示の方法は、親指数対比でのパフォーマンスを考慮して、個別企業の非財務リスク関連情報を生成する。なお、「親指数」とは、株式市場の代表的な株式指標をいい、例えばTOPIXなどである。 As will be described in more detail below, the method of the present disclosure generates non-financial risk-related information for individual companies by considering their performance relative to their parent index. The “parent index” refers to a representative stock index of the stock market, such as TOPIX.
(構成)
図1は、本発明の一実施形態に係る企業価値を評価する評価システム10を含むネットワークの構成を概略的に示す構成図である。評価システム10は、図示するように、インターネット等の通信ネットワークNWを介して、金融情報端末20と通信可能に接続されている。金融情報端末20は、例えばサーバコンピュータなどによって構成され、様々な金融情報(例えば親指数、株価指数、為替レート、個別企業の財務情報など)に関するデータを評価システム10に提供する。評価システム10は、金融情報端末20から必要なデータを取得し、非財務リスク関連情報を生成する。(Constitution)
FIG. 1 is a configuration diagram schematically showing the configuration of a network including an
評価システム10は、一般的なコンピュータとしての構成を有する。具体的には、評価システム10は、CPU又はGPUとして構成されるコンピュータプロセッサ11と、DRAM等によって構成されデータやプログラムを一時的に記憶するメインメモリ12と、ユーザ等との間で情報のやり取りを行う入出力インタフェース13と、有線又は無線の通信を制御する通信インタフェース14と、磁気ディスク又はフラッシュメモリ等によって構成されデータやプログラムを記憶するストレージ15とを備える。コンピュータプロセッサ11は、ストレージ15等に記憶されているプログラムをメインメモリ12に読み込んで、当該プログラムに含まれる命令を実行する。 The
入出力インタフェース13は、例えば、キーボード、マウス、タッチパネル、マイクロフォン、カメラ等の入力装置、ディスプレイ等の表示装置、及びスピーカ等の音声出力装置を含む。通信I/F14は、ネットワークアダプタ等のハードウェア、各種の通信用ソフトウェア、又はこれらの組み合わせとして実装される。ストレージ15は、金融情報端末20から取得した様々なデータや各種プログラムなどを記憶する。 The input/
また、評価システム10は、ストレージ15等に記憶されているプログラムに含まれる命令をコンピュータプロセッサ11が実行することによって、図2に示す各部の機能を実現する。 Also, the
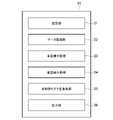
図2は、評価システム10の機能構成を示すブロック図である。
評価システム10は、設定部21、データ取得部22、重回帰分析部23、単回帰分析部24、非財務リスク量算出部25、出力部26などを備えている。FIG. 2 is a block diagram showing the functional configuration of the
The
設定部21は、ユーザの指示(入力操作)に従い、非財務リスク量を算出する個別企業や観測期間、アウトプットの対象期間や算出方法、各回帰分析の説明変数などを設定する(図3参照)。なお、本実施形態では、以下に示す前提条件が設定される場合を想定する。 The setting
<前提条件>
・非財務リスク量を算出する個別企業の銘柄(個別銘柄)は、企業Aとする。
・算出過程における重回帰分析および単回帰分析は、いずれも日時データで観測期間は10年(カレンダーベース)、アウトプットの対象期間は3年、アウトプットの算出方法は月次ベースとする。
・親指数に関する重回帰分析について、被説明変数は親指数(終値)、説明変数は株価指数、為替レート、親指数の純資産とする。
・個別企業に関する単回帰分析について、第1の修正時価(純資産部分)に関しては、被説明変数は個別企業の純資産、説明変数は親指数の純資産とする。
・個別企業に関する単回帰分析について、第2の修正時価(PBR(Price Book-value Ratio)部分)に関しては、被説明変数は個別企業のPBR、説明変数は親指数のPBRとする。<Prerequisites>
・Company A is the issue of an individual company (individual issue) for which the non-financial risk amount is to be calculated.
・The multiple regression analysis and single regression analysis in the calculation process are based on date and time data, the observation period is 10 years (calendar base), the output period is 3 years, and the output calculation method is monthly basis.
・In the multiple regression analysis of the parent index, the dependent variable is the parent index (closing price), and the explanatory variables are the stock index, the exchange rate, and the net assets of the parent index.
・Regarding the simple regression analysis of individual companies, regarding the first adjusted market value (net assets portion), the dependent variable is the net assets of the individual company, and the explanatory variable is the net assets of the parent index.
・Regarding the second modified market price (PBR (Price Book-value Ratio) portion) in the simple regression analysis of individual companies, the dependent variable is the PBR of the individual company, and the explanatory variable is the PBR of the parent index.
データ取得部22は、親指数の重回帰分析に必要なデータや、個別企業の単回帰分析に必要なデータなどを金融情報端末20から取得する。本実施形態では、2019年12月末時点での企業Aの非財務リスク量などを算出する場合を想定するため、データ取得部22は、以下に示す10年分の日時データを、金融情報端末20から取得する。
<日時データの詳細>
・重回帰分析のために、親指数(終値)、親指数(純資産)、株価指数、為替レートを取得する。
・単回帰分析のために、個別企業(時価総額)、個別企業(純資産)、個別企業(株価)を取得する。The
<Details of date and time data>
• Acquire the parent index (closing price), parent index (net worth), stock index, and exchange rate for multiple regression analysis.
・For simple regression analysis, obtain individual companies (market capitalization), individual companies (net assets), and individual companies (stock prices).
親指数や株価指数、為替レートや純資産は、任意のものを採用することができる。一例として、「TOPIX」や「JPX400」などを親指数として利用し、「MSCI World Index」や「FTSE All-World Index」などを株価指数として利用し、「ドル-円為替レート」などを為替レートとして利用し、「純資産総額」や「株主資本」などを純資産として利用することができるが、これらに限る趣旨ではない。 Any parent index, stock index, exchange rate, or net worth can be adopted. For example, "TOPIX" and "JPX400" are used as parent indices, "MSCI World Index" and "FTSE All-World Index" are used as stock indices, and "dollar-yen exchange rate" is used as exchange rate. It is possible to use "total net assets" and "shareholders' equity" as net assets, but it is not intended to be limited to these.
重回帰分析部23及び単回帰分析部24は、それぞれ、データ取得部22によって取得されたデータを用いて、重回帰分析及び単回帰分析を実施し、分析結果を非財務リスク量算出部25や出力部26に出力する。非財務リスク量算出部25は、各回帰分析の分析結果を利用して非財務リスク量などを算出する。出力部26は、ユーザの指示に従い、算出された非財務リスク量などを表示装置に表示する。 The multiple
以下、重回帰分析部23、単回帰分析部24、非財務リスク量算出部25、出力部26の動作の詳細について、2019年12月30日時点の企業Aの非財務リスク量を算出する場合を想定して具体的に説明する。 Details of the operations of the multiple
<重回帰分析部23>
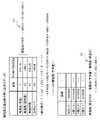
図4は、親指数の重回帰分析の説明図である。
重回帰分析部23は、まず、親指数(終値)を時価総額とみなして、親指数のPBRを算出する。
具体的には、重回帰分析部23は、親指数(終値)を、親指数(純資産)で除することで、親指数(PBR)を算出する。図4に示す例では、親指数(PBR)=1.15675(=1721.36/1488.1)となる(図4に示すF1参照)。親指数(PBR)は、単回帰分析を実施する際に利用される。<Multiple
FIG. 4 is an explanatory diagram of the multiple regression analysis of the index index.
The multiple
Specifically, the multiple
次に、重回帰分析部23は、図4の式(1)に示す重回帰式を利用して親指数の重回帰分析を行い、2019年12月30日時点での親指数の予測値を算出する。図4に示す例では、親指数(予測値)=1771.185(=0.474939*2353.25+10.73352*108.88+0.25236*1488.1-890.669)となる。 Next, the multiple
さらに、重回帰分析部23は、親指数(予測値)を、親指数(純資産)で除することで、親指数(補正PBR)を算出する。ここでは、親指数(予測値)は、親指数に関する非財務リスク量がゼロの状態であることから、親指数(純資産)が不変であることを前提として、親指数(PBR)を補正する。図4に示す例では、親指数(補正PBR)=1.19023(=1771.185/1488.1)となる(図4に示すF2参照)。重回帰分析部23は、重回帰分析の結果を、単回帰分析部24や非財務リスク量算出部25、出力部26に送る。 Further, the multiple
<単回帰分析部24>
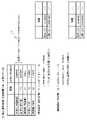
図5は、企業A(個別銘柄)の単回帰分析の説明図である。
単回帰分析部24は、まず、企業Aの時価総額を、企業Aの純資産で除することで企業AのPBRを算出する。図5に示す例では、企業A(PBR)=0.78983(=2398903/3037254)となる(図5に示すF3参照)。なお、企業A(PBR)は、この後の単回帰分析を実施する際に利用される。<Single
FIG. 5 is an explanatory diagram of simple regression analysis of company A (individual issue).
The simple
次に、単回帰分析部24は、図5の式(2)に示す単回帰式(純資産側)を利用して企業Aの第1の単回帰分析を行い、2019年12月30日時点での企業Aの純資産の予測値を算出する。図5に示す例では、企業A(純資産(予測値))=1771.185(=0.474939*2353.25+10.73352*108.88+0.25236*1488.1-890.669)となる。 Next, the simple
続いて、単回帰分析部24は、図5の式(3)に示す単回帰式(PBR側)を利用して企業Aの第2の単回帰分析を行い、2019年12月30日時点での企業AのPBRの予測値を算出する。図5に示す例では、企業A(PBR(予測値))=0.8799(=0.973356*1.15675-0.24602)となる。単回帰分析部24は、単回帰分析の結果を、非財務リスク量算出部25、出力部26に送る。 Subsequently, the simple
<非財務リスク量算出部25>
図6は、企業Aの本源的時価総額を算出する際の説明図である。
図6に示すように、企業Aの本源的時価総額は、第1の修正時価(純資産部分の本源的価値)と、第2の修正時価(PBR差部分の本源的価値)から構成される。<Non-financial risk
FIG. 6 is an explanatory diagram for calculating the intrinsic market capitalization of Company A. FIG.
As shown in Figure 6, the intrinsic market capitalization of Company A consists of a first adjusted market value (intrinsic value of the net worth portion) and a second adjusted market value (intrinsic value of the PBR difference portion).
(第1の修正時価の算出)
まず、非財務リスク量算出部25は、単回帰分析部24で求めた企業A(純資産(予測値))に、重回帰分析部23で求めた親指数(補正PBR)を乗ずることで、企業Aの第1の修正時価を算出する(図6に示す式(4)参照)。図6に示す例では、企業Aの第1の修正時価=3664553(=3078861*1.19023)となる。(Calculation of first adjusted market value)
First, the non-financial risk
(第2の修正時価の算出)
次に、非財務リスク量算出部25は、親指数(補正PBR)を、図5の式(3)に示す単回帰式(PBR側)に当てはめる(代入する)ことで、企業Aの調整後のPBRを求める(図6に示すN1参照)。このように、企業Aの調整後のPBR(以下、企業A(調整PBR))を求めるのは、以下の理由による。すなわち、単回帰分析部24で求める企業A(PBR)は、親指数の実績値におけるPBRであるため、親指数が予測値である場合に、企業AのPBRがどのように変化するのかを考慮する必要がある。ここで、親指数(予測値)=1771.185であるため、非財務リスク量算出部25は、親指数が1771.185である場合の企業AのPBR、すなわち企業A(調整PBR)を求める。図6に示す例では、企業A(調整PBR)=0.9125(=0.973356*(1.19023-0.24602))となる。(Calculation of second adjusted market value)
Next, the non-financial risk
非財務リスク量算出部25は、単回帰分析部で求めた企業A(純資産(予測値))に、上記で求めた企業A(調整PBR)から親指数(補正PBR)を減じたもの(=PBR差)を乗ずることで、企業Aの第2の修正時価を算出する(図6に示す式(5)参照)。図6に示す例では、企業Aの第2の修正時価=▲855092(=3078861*(0.9125-1.19023))となる(▲はマイナスを意味する)。 The non-financial risk
(非財務リスク関連情報の生成)
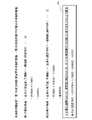
図7は、企業Aの非財務リスク関連情報を生成(ここでは、非財務リスク量及び非財務リスク割合を算出)する際の説明図である。
企業Aの時価総額は、企業Aの本源的時価総額に非財務リスク量を加算したものといえることから(図7に示す式(6)参照)、まず、非財務リスク量算出部25は、第1の修正時価に第2の修正時価を加算することで企業Aの本源的時価総額を求める(図7に示す式(7)参照)。そして、非財務リスク量算出部25は、2019年12月30日時点での企業Aの時価総額から、本源的時価総額(=第1の修正時価+第2の修正時価)を減じることで、企業Aの非財務リスク量を算出する。さらに、非財務リスク量算出部25は、企業Aの非財務リスク量を、企業Aの時価総額で除することで、企業Aの非財務リスク割合を算出する。(Generation of non-financial risk-related information)
FIG. 7 is an explanatory diagram for generating non-financial risk-related information of company A (here, calculating non-financial risk amount and non-financial risk ratio).
Since the market capitalization of Company A can be said to be the sum of the non-financial risk amount added to the intrinsic market capitalization of Company A (see formula (6) shown in FIG. 7), first, the non-financial risk
図7に示す例では、企業Aの本源的時価総額=2809461(=3664553-855092)であり、時価総額=2398903であることから、非財務リスク量=▲410558(=2398903-2809461)となり、非財務リスク割合=▲17.11%(=(▲410558/2398903)*100)となる。 In the example shown in FIG. 7, since the intrinsic market capitalization of Company A = 2809461 (= 3664553 - 855092) and the market capitalization = 2398903, the non-financial risk amount = -410558 (= 2398903 - 2809461). Financial risk ratio=▲17.11% (=(▲410558/2398903)*100).
なお、非財務リスク量算出部25は、親指数の非財務リスク量や非財務リスク割合を算出してもよい。具体的には、非財務リスク量算出部25は、親指数から、親指数の予測値を減じることで、親指数の非財務リスク量を算出する。さらに、非財務リスク量算出部25は、親指数の非財務リスク量を、親指数で除することで、親指数の非財務リスク割合を算出する。 The non-financial risk
上記例を踏襲すると、親指数の非財務リスク量=▲49.825(=1721.36-1771.185)となり、親指数の非財務リスク割合=▲2.89%(=(▲49.825/1721.36)*100)となる。非財務リスク量算出部25は、算出した結果を、出力部26に送る。 Following the above example, the non-financial risk amount of the parent index = -49.825 (= 1721.36 - 1771.185), and the non-financial risk ratio of the parent index = -2.89% (= (-49.825 /1721.36)*100). The non-financial
<出力部26>
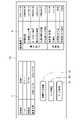
図8は、表示装置に表示されるアウトプット画面P1を例示した図である。
アウトプット画面P1には、非財務リスク量を算出した個別企業(企業A)、親指数などに関する基本設定情報I1や、非財務リスク量をはじめとする結果情報I2のほか、ユーザが操作可能な回帰分析結果ボタンB1、データ検証ボタンB2、グラフ作成ボタンB3が表示される。<
FIG. 8 is a diagram exemplifying an output screen P1 displayed on the display device.
On the output screen P1, in addition to basic setting information I1 related to the individual company (Company A) for which the non-financial risk amount was calculated, the parent index, etc., result information I2 including the non-financial risk amount, and other user-operable A regression analysis result button B1, a data verification button B2, and a graph creation button B3 are displayed.
回帰分析結果ボタンB1は、観測期間における日次ベースの重回帰分析及び単回帰分析の結果(被説明変数、説明変数など)を、表形式ファイルでダウンロード(及び/又は表示)するためのボタンである。
データ検証ボタンB2は、出力部が受け取った各算出結果に関する検証や統計学的見地での検証などを行うためのボタンである。
グラフ作成ボタンB3は、結果情報(非財務リスク関連情報)I2をグラフ表示するためのボタンである。The regression analysis result button B1 is a button for downloading (and/or displaying) the results of daily multiple regression analysis and single regression analysis (explained variables, explanatory variables, etc.) in the observation period in a tabular file. be.
The data verification button B2 is a button for verifying each calculation result received by the output unit and verifying from a statistical point of view.
The graph creation button B3 is a button for graphically displaying the result information (non-financial risk-related information) I2.
図9は、表示装置に表示されるグラフを例示した図である。
図9に示す例では、設定されたアウトプット対象期間(ここでは3年)における企業Aと親指数の非財務リスク割合の推移をあらわすグラフが表示装置に表示される。ユーザは、このグラフを参照することで、例えば2019年の初頭に非財務リスク割合が急峻に変化していることから、世間を揺るがす出来事があったと推測することが可能となる。なお、ユーザは、グラフの表示項目を適宜設定することで、企業Aと親指数の非財務リスク割合の推移だけでなく、例えば、企業Aにおける第1の修正時価と第2修正時価の推移や、企業Aの非財務リスク割合と親指数(株価)の推移など、企業Aの非財務リスクに関わる様々な非財務リスク関連情報を表示することができる。FIG. 9 is a diagram exemplifying a graph displayed on the display device.
In the example shown in FIG. 9, a graph showing changes in non-financial risk ratios of company A and the parent index over a set output target period (three years in this case) is displayed on the display device. By referring to this graph, the user can speculate that there was an event that shook the world, for example, from the sharp change in the non-financial risk ratio at the beginning of 2019. By appropriately setting the display items of the graph, the user can not only change the non-financial risk ratio of company A and the parent index, but also, for example, change the first and second adjusted market prices of company A, , a variety of non-financial risk-related information related to the non-financial risk of company A, such as changes in the non-financial risk ratio and parent index (stock price) of company A, can be displayed.
以上説明したように、本実施形態によれば、親指数対比でのパフォーマンスを考慮して、個別企業の非財務リスク量などを算出するため、全業態での比較が可能となり、企業価値を客観的かつ適切に評価することが可能となる。 As explained above, according to the present embodiment, the amount of non-financial risk of individual companies is calculated in consideration of their performance relative to the parent index. It will be possible to evaluate it objectively and appropriately.
B.その他
なお、上記各実施例において、「部」とは、単に物理的手段を意味するものではなく、その「部」が有する機能をソフトウェアによって実現する場合も含む。また、1つの「部」や装置が有する機能が2つ以上の物理的手段や装置により実現されても、2つ以上の「部」や装置の機能が1つの物理的手段や装置により実現されても良い。B. Others In each of the above-described embodiments, the term "unit" does not simply mean physical means, but also includes the case where the functions of the "unit" are implemented by software. In addition, even if the function of one "section" or device is realized by two or more physical means or devices, the functions of two or more "sections" or devices are realized by one physical means or device. can be
10…評価システム、11…コンピュータプロセッサ、12…メインメモリ、13…入出力インタフェース、14…通信インタフェース、15…ストレージ、20…金融情報端末、21…設定部、22…データ取得部、23…重回帰分析部、24…単回帰分析部、25…非財務リスク量算出部、26…出力部。 DESCRIPTION OF
Claims (7)
Translated fromJapanese株式市場の代表的な株式指標である親指数を、親指数の純資産で除することで親指数の株価純資産倍率(PBR)を算出するステップと、
式(1)に示す重回帰式を利用して親指数の重回帰分析を行うステップと、
Y0=α*X01+β*X02+γ*X03+δ・・・(1)
Y0:親指数
X01:株価指数
X02:為替レート
X03:親指数の純資産
親指数の重回帰分析によって得られた親指数の予測値を、親指数の純資産で除することで親指数の補正PBRを算出するステップと、
式(2)に示す単回帰式を利用して個別企業の第1の単回帰分析を行うステップと、
Y1=α1*X11+β1・・・(2)
Y1:個別企業の純資産
X11:親指数の純資産
式(3)に示す単回帰式を利用して個別企業の第2の単回帰分析を行うステップと、
Y2=α2*X21+β2・・・(3)
Y2:個別企業のPBR
X21:親指数のPBR
個別企業の第1の単回帰分析によって得られた個別企業の純資産の予測値に、親指数の補正PBRを乗ずることで、個別企業の第1の修正時価を算出するステップと、
親指数の補正PBRを、式(3)の単回帰式に当てはめることで、個別企業の調整PBRを算出するステップと、
個別企業の純資産の予測値に、個別企業の調整PBRから親指数の補正PBRを減じたものを乗ずることで、個別企業の第2の修正時価を算出するステップと、
個別企業の時価総額と、第1の修正時価及び第2の修正時価とに基づいて、個別企業の非財務リスクに関わる非財務リスク関連情報を生成するステップと
を実行するように構成された評価システム。A corporate value evaluation system comprising a control unit and a storage unit, wherein the control unit executes a program stored in the storage unit to
A step of calculating the price book value ratio (PBR) of the parent index by dividing the parent index, which is a representative stock index of the stock market, by the parent index's net assets;
A step of performing multiple regression analysis of the index index using the multiple regression equation shown in Equation (1);
Y0=α*X01+β*X02+γ*X03+δ (1)
Y0: Parent index X01: Stock index X02: Exchange rate X03: Net assets of the parent index The adjusted PBR of the parent index is calculated by dividing the predicted value of the parent index obtained by the multiple regression analysis of the parent index by the net assets of the parent index. a calculating step;
A step of performing a first simple regression analysis of an individual company using the simple regression equation shown in Equation (2);
Y1=α1*X11+β1 (2)
Y1: Net assets of individual companies X11: Net assets of parent index A step of performing a second simple regression analysis of individual companies using the simple regression formula shown in formula (3);
Y2=α2*X21+β2 (3)
Y2: PBR of individual companies
X21: PBR of thumb index
A step of calculating a first adjusted market value of an individual company by multiplying the predicted value of the net assets of the individual company obtained by the first simple regression analysis of the individual company by the corrected PBR of the parent index;
A step of calculating the adjusted PBR of the individual company by applying the corrected PBR of the parent index to the simple regression equation of formula (3);
calculating a second adjusted market value of the individual company by multiplying the predicted value of the net assets of the individual company by the adjusted PBR of the individual company minus the corrected PBR of the parent index;
generating non-financial risk-related information related to the non-financial risk of an individual company based on the market capitalization of the individual company and the first adjusted market value and the second adjusted market value. system.
式(1)に示す重回帰式を利用して株式市場の代表的な株式指標である親指数の重回帰分析を行うステップと、
Y0=α*X01+β*X02+γ*X03+δ・・・(1)
Y0:親指数
X01:株価指数
X02:為替レート
X03:親指数の純資産
重回帰分析の結果に基づいて、補正した親指数の株価純資産倍率(PBR)を算出するステップと、
式(2)に示す単回帰式を利用して個別企業の第1の単回帰分析を行うステップと、
Y1=α1*X11+β1・・・(2)
Y1:個別企業の純資産
X11:親指数の純資産
式(3)に示す単回帰式を利用して個別企業の第2の単回帰分析を行うステップと、
Y2=α2*X21+β2・・・(3)
Y2:個別企業のPBR
X21:親指数のPBR
個別企業の第1の単回帰分析の結果及び補正した親指数のPBR(親指数の補正PBR)に基づいて、個別企業の第1の修正時価を算出するステップと、
親指数の補正PBRを、式(3)の単回帰式に当てはめることで、個別企業の調整PBRを算出するステップと、
個別企業の第2の単回帰分析の結果、及び個別企業の調整PBRから親指数の補正PBRを減じたPBR差に基づいて、個別企業の第2の修正時価を算出するステップと、
個別企業の時価総額と、第1の修正時価及び第2の修正時価とに基づいて、個別企業の非財務リスクに関わる非財務リスク関連情報を生成するステップと
を実行するように構成された評価システム。A corporate value evaluation system comprising a control unit and a storage unit, wherein the control unit executes a program stored in the storage unit to
A step of performing a multiple regression analysis of the parent index, which is a representative stock index of the stock market, using the multiple regression equation shown in equation (1);
Y0=α*X01+β*X02+γ*X03+δ (1)
Y0: parent index X01: stock price index X02: exchange rate X03: net worth of the parent index A step of calculating a corrected price book value ratio (PBR) of the parent index based on the results of the multiple regression analysis;
A step of performing a first simple regression analysis of an individual company using the simple regression equation shown in Equation (2);
Y1=α1*X11+β1 (2)
Y1: Net assets of individual companies X11: Net assets of parent index A step of performing a second simple regression analysis of individual companies using the simple regression formula shown in formula (3);
Y2=α2*X21+β2 (3)
Y2: PBR of individual companies
X21: PBR of thumb index
a step of calculating a first adjusted market value of an individual company based on the result of the first simple regression analysis of the individual company and the PBR of the adjusted parent index (corrected PBR of the parent index);
A step of calculating the adjusted PBR of the individual company by applying the corrected PBR of the parent index to the simple regression equation of formula (3);
calculating the second adjusted market value of the individual company based on the result of the second simple regression analysis of the individual company and the PBR difference obtained by subtracting the adjusted PBR of the parent index from the adjusted PBR of the individual company;
generating non-financial risk-related information related to the non-financial risk of an individual company based on the market capitalization of the individual company and the first adjusted market value and the second adjusted market value. system.
株式市場の代表的な株式指標である親指数を、親指数の純資産で除することで親指数の(PBR)を算出するステップと、
式(1)に示す重回帰式を利用して親指数の重回帰分析を行うステップと、
Y0=α*X01+β*X02+γ*X03+δ・・・(1)
Y0:親指数
X01:株価指数
X02:為替レート
X03:親指数の純資産
親指数の重回帰分析によって得られた親指数の予測値を、親指数の純資産で除することで親指数の補正PBRを算出するステップと、
式(2)に示す単回帰式を利用して個別企業の第1の単回帰分析を行うステップと、
Y1=α1*X11+β1・・・(2)
Y1:個別企業の純資産
X11:親指数の純資産
式(3)に示す単回帰式を利用して個別企業の第2の単回帰分析を行うステップと、
Y2=α2*X21+β2・・・(3)
Y2:個別企業のPBR
X21:親指数のPBR
個別企業の第1の単回帰分析によって得られた個別企業の純資産の予測値に、親指数の補正PBRを乗ずることで、個別企業の第1の修正時価を算出するステップと、
親指数の補正PBRを、式(3)の単回帰式に当てはめることで、個別企業の調整PBRを算出するステップと、
個別企業の純資産の予測値に、個別企業の調整PBRから親指数の補正PBRを減じたものを乗ずることで、個別企業の第2の修正時価を算出するステップと、
個別企業の時価総額と、第1の修正時価及び第2の修正時価とに基づいて、個別企業の非財務リスクに関わる非財務リスク関連情報を生成するステップと
を含む方法。A method for valuing an enterprise, implemented by one or more computers, comprising:
A step of calculating a parent index (PBR) by dividing the parent index, which is a representative stock index of the stock market, by the net assets of the parent index;
A step of performing multiple regression analysis of the index index using the multiple regression equation shown in Equation (1);
Y0=α*X01+β*X02+γ*X03+δ (1)
Y0: Parent index X01: Stock index X02: Exchange rate X03: Net assets of the parent index The adjusted PBR of the parent index is calculated by dividing the predicted value of the parent index obtained by the multiple regression analysis of the parent index by the net assets of the parent index. a calculating step;
A step of performing a first simple regression analysis of an individual company using the simple regression equation shown in Equation (2);
Y1=α1*X11+β1 (2)
Y1: Net assets of individual companies X11: Net assets of parent index A step of performing a second simple regression analysis of individual companies using the simple regression formula shown in formula (3);
Y2=α2*X21+β2 (3)
Y2: PBR of individual companies
X21: PBR of thumb index
A step of calculating a first adjusted market value of an individual company by multiplying the predicted value of the net assets of the individual company obtained by the first simple regression analysis of the individual company by the corrected PBR of the parent index;
A step of calculating the adjusted PBR of the individual company by applying the corrected PBR of the parent index to the simple regression equation of formula (3);
calculating a second adjusted market value of the individual company by multiplying the predicted value of the net assets of the individual company by the adjusted PBR of the individual company minus the corrected PBR of the parent index;
generating non-financial risk-related information related to non-financial risks of an individual company based on the market capitalization of the individual company and the first adjusted market value and the second adjusted market value.
株式市場の代表的な株式指標である親指数を、親指数の純資産で除することで親指数の株価純資産倍率(PBR)を算出する処理と、
式(1)に示す重回帰式を利用して親指数の重回帰分析を行う処理と、
Y0=α*X01+β*X02+γ*X03+δ・・・(1)
Y0:親指数
X01:株価指数
X02:為替レート
X03:親指数の純資産
親指数の重回帰分析によって得られた親指数の予測値を、親指数の純資産で除することで親指数の補正PBRを算出する処理と、
式(2)に示す単回帰式を利用して個別企業の第1の単回帰分析を行う処理と、
Y1=α1*X11+β1・・・(2)
Y1:個別企業の純資産
X11:親指数の純資産
式(3)に示す単回帰式を利用して個別企業の第2の単回帰分析を行う処理と、
Y2=α2*X21+β2・・・(3)
Y2:個別企業のPBR
X21:親指数のPBR
個別企業の第1の単回帰分析によって得られた個別企業の純資産の予測値に、親指数の補正PBRを乗ずることで、個別企業の第1の修正時価を算出する処理と、
親指数の補正PBRを、式(3)の単回帰式に当てはめることで、個別企業の調整PBRを算出する処理と、
個別企業の純資産の予測値に、個別企業の調整PBRから親指数の補正PBRを減じたものを乗ずることで、個別企業の第2の修正時価を算出する処理と、
個別企業の時価総額と、第1の修正時価及び第2の修正時価とに基づいて、個別企業の非財務リスクに関わる非財務リスク関連情報を生成する処理と
を実行させるプログラム。A program for evaluating enterprise value, comprising:
A process of calculating the price book value ratio (PBR) of the parent index by dividing the parent index, which is a representative stock index of the stock market, by the net assets of the parent index;
A process of performing multiple regression analysis of the index index using the multiple regression equation shown in Equation (1);
Y0=α*X01+β*X02+γ*X03+δ (1)
Y0: Parent index X01: Stock index X02: Exchange rate X03: Net assets of the parent index The adjusted PBR of the parent index is calculated by dividing the predicted value of the parent index obtained by the multiple regression analysis of the parent index by the net assets of the parent index. a process of calculating;
A process of performing a first simple regression analysis of an individual company using the simple regression equation shown in Equation (2);
Y1=α1*X11+β1 (2)
Y1: Net assets of individual companies X11: Net assets of parent index A process of performing a second simple regression analysis of individual companies using the simple regression formula shown in formula (3),
Y2=α2*X21+β2 (3)
Y2: PBR of individual companies
X21: PBR of thumb index
A process of calculating the first adjusted market value of an individual company by multiplying the predicted value of the net assets of the individual company obtained by the first simple regression analysis of the individual company by the corrected PBR of the parent index;
A process of calculating the adjusted PBR of an individual company by applying the corrected PBR of the parent index to the simple regression equation of formula (3);
A process of calculating the second adjusted market value of an individual company by multiplying the estimated value of the net assets of the individual company by the adjusted PBR of the individual company minus the corrected PBR of the parent index;
A program for executing a process of generating non-financial risk-related information related to non-financial risks of individual companies based on the market capitalization of individual companies, the first adjusted market value, and the second adjusted market value.
Priority Applications (1)
| Application Number | Priority Date | Filing Date | Title |
|---|---|---|---|
| JP2021068118AJP6956292B1 (en) | 2021-04-14 | 2021-04-14 | Systems, methods, and programs for quantifying non-financial information and assessing corporate value |
Applications Claiming Priority (1)
| Application Number | Priority Date | Filing Date | Title |
|---|---|---|---|
| JP2021068118AJP6956292B1 (en) | 2021-04-14 | 2021-04-14 | Systems, methods, and programs for quantifying non-financial information and assessing corporate value |
Publications (2)
| Publication Number | Publication Date |
|---|---|
| JP6956292B1 JP6956292B1 (en) | 2021-11-02 |
| JP2022163277Atrue JP2022163277A (en) | 2022-10-26 |
Family
ID=78281994
Family Applications (1)
| Application Number | Title | Priority Date | Filing Date |
|---|---|---|---|
| JP2021068118AActiveJP6956292B1 (en) | 2021-04-14 | 2021-04-14 | Systems, methods, and programs for quantifying non-financial information and assessing corporate value |
Country Status (1)
| Country | Link |
|---|---|
| JP (1) | JP6956292B1 (en) |
Citations (4)
| Publication number | Priority date | Publication date | Assignee | Title |
|---|---|---|---|---|
| JP2003167987A (en)* | 2001-11-30 | 2003-06-13 | Obic Business Consultants Ltd | Financial accounting system with current price information acquiring function using internet |
| JP2003187052A (en)* | 2001-10-09 | 2003-07-04 | Kunio Ito | Corporate value evaluation system |
| JP2003216718A (en)* | 2002-01-17 | 2003-07-31 | Dentsu Inc | Corporate value analysis system with a function of analyzing market capitalization components |
| JP2021009696A (en)* | 2019-07-02 | 2021-01-28 | アビームコンサルティング株式会社 | System, method, and program for supporting esg management |
- 2021
- 2021-04-14JPJP2021068118Apatent/JP6956292B1/enactiveActive
Patent Citations (4)
| Publication number | Priority date | Publication date | Assignee | Title |
|---|---|---|---|---|
| JP2003187052A (en)* | 2001-10-09 | 2003-07-04 | Kunio Ito | Corporate value evaluation system |
| JP2003167987A (en)* | 2001-11-30 | 2003-06-13 | Obic Business Consultants Ltd | Financial accounting system with current price information acquiring function using internet |
| JP2003216718A (en)* | 2002-01-17 | 2003-07-31 | Dentsu Inc | Corporate value analysis system with a function of analyzing market capitalization components |
| JP2021009696A (en)* | 2019-07-02 | 2021-01-28 | アビームコンサルティング株式会社 | System, method, and program for supporting esg management |
Also Published As
| Publication number | Publication date |
|---|---|
| JP6956292B1 (en) | 2021-11-02 |
Similar Documents
| Publication | Publication Date | Title |
|---|---|---|
| US11449942B2 (en) | Dynamic asset sector simulator apparatuses, methods and systems | |
| US9183592B2 (en) | Systems and methods for graphically enabled retirement planning | |
| Benth et al. | Dynamic copula models for the spark spread | |
| Detemple | Portfolio selection: a review | |
| Huang et al. | Option pricing using the fast Fourier transform under the double exponential jump model with stochastic volatility and stochastic intensity | |
| Christensen et al. | Asymptotic theory of range-based multipower variation | |
| Marshall | Isolating the systematic and unsystematic components of a single stock’s (or portfolio’s) standard deviation | |
| Li et al. | The effect of policyholders’ rationality on unit-linked life insurance contracts with surrender guarantees | |
| JP2016099915A (en) | Server for credit examination, system for credit examination, and program for credit examination | |
| Cioffi | Completing projects according to plans: an earned-value improvement index | |
| Alfonsi et al. | Optimal execution and price manipulations in time-varying limit order books | |
| US20150081398A1 (en) | Determining a performance target setting | |
| US20190236711A1 (en) | System for Identifying and Obtaining Assets According to a Customized Allocation | |
| JP2017111769A (en) | Asset inheritance simulation system | |
| JP5901094B1 (en) | Investment simulation apparatus and method | |
| US20160171608A1 (en) | Methods and systems for finding similar funds | |
| JP7051194B1 (en) | Systems, methods, and programs for quantifying non-financial information and assessing corporate value | |
| Hassan et al. | Analyzing the impact of macroeconomic factors on stock market performance in ASEAN-5 countries | |
| Wilinski et al. | An analysis of price impact functions of individual trades on the London stock exchange | |
| Sun et al. | Evaluating McCallum rule as a policy guideline for China | |
| JP6956292B1 (en) | Systems, methods, and programs for quantifying non-financial information and assessing corporate value | |
| Lin et al. | Evaluating natural resource projects with embedded options and limited reserves | |
| Bannör et al. | On the calibration of distortion risk measures to bid-ask prices | |
| Tay et al. | The impact of transaction duration, volume and direction on price dynamics and volatility | |
| JP6890083B2 (en) | Business value evaluation device and business value evaluation method |
Legal Events
| Date | Code | Title | Description |
|---|---|---|---|
| A621 | Written request for application examination | Free format text:JAPANESE INTERMEDIATE CODE: A621 Effective date:20210414 | |
| A871 | Explanation of circumstances concerning accelerated examination | Free format text:JAPANESE INTERMEDIATE CODE: A871 Effective date:20210414 | |
| A977 | Report on retrieval | Free format text:JAPANESE INTERMEDIATE CODE: A971007 Effective date:20210729 | |
| TRDD | Decision of grant or rejection written | ||
| A01 | Written decision to grant a patent or to grant a registration (utility model) | Free format text:JAPANESE INTERMEDIATE CODE: A01 Effective date:20210902 | |
| A61 | First payment of annual fees (during grant procedure) | Free format text:JAPANESE INTERMEDIATE CODE: A61 Effective date:20211004 | |
| R150 | Certificate of patent or registration of utility model | Ref document number:6956292 Country of ref document:JP Free format text:JAPANESE INTERMEDIATE CODE: R150 | |
| S531 | Written request for registration of change of domicile | Free format text:JAPANESE INTERMEDIATE CODE: R313531 | |
| R350 | Written notification of registration of transfer | Free format text:JAPANESE INTERMEDIATE CODE: R350 | |
| R250 | Receipt of annual fees | Free format text:JAPANESE INTERMEDIATE CODE: R250 |