JP2021525929A - Methods and systems for utilizing quantitative imaging - Google Patents
Methods and systems for utilizing quantitative imagingDownload PDFInfo
- Publication number
- JP2021525929A JP2021525929AJP2020567160AJP2020567160AJP2021525929AJP 2021525929 AJP2021525929 AJP 2021525929AJP 2020567160 AJP2020567160 AJP 2020567160AJP 2020567160 AJP2020567160 AJP 2020567160AJP 2021525929 AJP2021525929 AJP 2021525929A
- Authority
- JP
- Japan
- Prior art keywords
- data
- imaging
- lesions
- lesion
- dataset
- Prior art date
- Legal status (The legal status is an assumption and is not a legal conclusion. Google has not performed a legal analysis and makes no representation as to the accuracy of the status listed.)
- Granted
Links
Images


Classifications
- G—PHYSICS
- G06—COMPUTING OR CALCULATING; COUNTING
- G06V—IMAGE OR VIDEO RECOGNITION OR UNDERSTANDING
- G06V20/00—Scenes; Scene-specific elements
- G06V20/60—Type of objects
- G06V20/69—Microscopic objects, e.g. biological cells or cellular parts
- G06V20/698—Matching; Classification
- G—PHYSICS
- G06—COMPUTING OR CALCULATING; COUNTING
- G06V—IMAGE OR VIDEO RECOGNITION OR UNDERSTANDING
- G06V10/00—Arrangements for image or video recognition or understanding
- G06V10/40—Extraction of image or video features
- G06V10/44—Local feature extraction by analysis of parts of the pattern, e.g. by detecting edges, contours, loops, corners, strokes or intersections; Connectivity analysis, e.g. of connected components
- G06V10/443—Local feature extraction by analysis of parts of the pattern, e.g. by detecting edges, contours, loops, corners, strokes or intersections; Connectivity analysis, e.g. of connected components by matching or filtering
- G06V10/449—Biologically inspired filters, e.g. difference of Gaussians [DoG] or Gabor filters
- G06V10/451—Biologically inspired filters, e.g. difference of Gaussians [DoG] or Gabor filters with interaction between the filter responses, e.g. cortical complex cells
- G06V10/454—Integrating the filters into a hierarchical structure, e.g. convolutional neural networks [CNN]
- G—PHYSICS
- G06—COMPUTING OR CALCULATING; COUNTING
- G06F—ELECTRIC DIGITAL DATA PROCESSING
- G06F18/00—Pattern recognition
- G06F18/20—Analysing
- G06F18/21—Design or setup of recognition systems or techniques; Extraction of features in feature space; Blind source separation
- G06F18/217—Validation; Performance evaluation; Active pattern learning techniques
- G06F18/2193—Validation; Performance evaluation; Active pattern learning techniques based on specific statistical tests
- G—PHYSICS
- G06—COMPUTING OR CALCULATING; COUNTING
- G06F—ELECTRIC DIGITAL DATA PROCESSING
- G06F18/00—Pattern recognition
- G06F18/20—Analysing
- G06F18/24—Classification techniques
- G06F18/241—Classification techniques relating to the classification model, e.g. parametric or non-parametric approaches
- G06F18/2413—Classification techniques relating to the classification model, e.g. parametric or non-parametric approaches based on distances to training or reference patterns
- G06F18/24133—Distances to prototypes
- G06F18/24137—Distances to cluster centroïds
- G06F18/2414—Smoothing the distance, e.g. radial basis function networks [RBFN]
- G—PHYSICS
- G06—COMPUTING OR CALCULATING; COUNTING
- G06N—COMPUTING ARRANGEMENTS BASED ON SPECIFIC COMPUTATIONAL MODELS
- G06N3/00—Computing arrangements based on biological models
- G06N3/02—Neural networks
- G06N3/04—Architecture, e.g. interconnection topology
- G06N3/0464—Convolutional networks [CNN, ConvNet]
- G—PHYSICS
- G06—COMPUTING OR CALCULATING; COUNTING
- G06N—COMPUTING ARRANGEMENTS BASED ON SPECIFIC COMPUTATIONAL MODELS
- G06N3/00—Computing arrangements based on biological models
- G06N3/02—Neural networks
- G06N3/08—Learning methods
- G—PHYSICS
- G06—COMPUTING OR CALCULATING; COUNTING
- G06T—IMAGE DATA PROCESSING OR GENERATION, IN GENERAL
- G06T7/00—Image analysis
- G06T7/0002—Inspection of images, e.g. flaw detection
- G06T7/0012—Biomedical image inspection
- G—PHYSICS
- G06—COMPUTING OR CALCULATING; COUNTING
- G06T—IMAGE DATA PROCESSING OR GENERATION, IN GENERAL
- G06T7/00—Image analysis
- G06T7/10—Segmentation; Edge detection
- G—PHYSICS
- G06—COMPUTING OR CALCULATING; COUNTING
- G06T—IMAGE DATA PROCESSING OR GENERATION, IN GENERAL
- G06T7/00—Image analysis
- G06T7/60—Analysis of geometric attributes
- G—PHYSICS
- G06—COMPUTING OR CALCULATING; COUNTING
- G06V—IMAGE OR VIDEO RECOGNITION OR UNDERSTANDING
- G06V10/00—Arrangements for image or video recognition or understanding
- G06V10/70—Arrangements for image or video recognition or understanding using pattern recognition or machine learning
- G06V10/82—Arrangements for image or video recognition or understanding using pattern recognition or machine learning using neural networks
- G—PHYSICS
- G06—COMPUTING OR CALCULATING; COUNTING
- G06T—IMAGE DATA PROCESSING OR GENERATION, IN GENERAL
- G06T2207/00—Indexing scheme for image analysis or image enhancement
- G06T2207/10—Image acquisition modality
- G06T2207/10072—Tomographic images
- G—PHYSICS
- G06—COMPUTING OR CALCULATING; COUNTING
- G06T—IMAGE DATA PROCESSING OR GENERATION, IN GENERAL
- G06T2207/00—Indexing scheme for image analysis or image enhancement
- G06T2207/10—Image acquisition modality
- G06T2207/10116—X-ray image
- G—PHYSICS
- G06—COMPUTING OR CALCULATING; COUNTING
- G06T—IMAGE DATA PROCESSING OR GENERATION, IN GENERAL
- G06T2207/00—Indexing scheme for image analysis or image enhancement
- G06T2207/20—Special algorithmic details
- G06T2207/20081—Training; Learning
- G—PHYSICS
- G06—COMPUTING OR CALCULATING; COUNTING
- G06T—IMAGE DATA PROCESSING OR GENERATION, IN GENERAL
- G06T2207/00—Indexing scheme for image analysis or image enhancement
- G06T2207/20—Special algorithmic details
- G06T2207/20084—Artificial neural networks [ANN]
- G—PHYSICS
- G06—COMPUTING OR CALCULATING; COUNTING
- G06T—IMAGE DATA PROCESSING OR GENERATION, IN GENERAL
- G06T2207/00—Indexing scheme for image analysis or image enhancement
- G06T2207/30—Subject of image; Context of image processing
- G06T2207/30004—Biomedical image processing
- G06T2207/30096—Tumor; Lesion
- G—PHYSICS
- G06—COMPUTING OR CALCULATING; COUNTING
- G06T—IMAGE DATA PROCESSING OR GENERATION, IN GENERAL
- G06T2207/00—Indexing scheme for image analysis or image enhancement
- G06T2207/30—Subject of image; Context of image processing
- G06T2207/30004—Biomedical image processing
- G06T2207/30101—Blood vessel; Artery; Vein; Vascular
- G—PHYSICS
- G06—COMPUTING OR CALCULATING; COUNTING
- G06V—IMAGE OR VIDEO RECOGNITION OR UNDERSTANDING
- G06V2201/00—Indexing scheme relating to image or video recognition or understanding
- G06V2201/03—Recognition of patterns in medical or anatomical images
- G06V2201/032—Recognition of patterns in medical or anatomical images of protuberances, polyps nodules, etc.
Landscapes
- Engineering & Computer Science (AREA)
- Theoretical Computer Science (AREA)
- Physics & Mathematics (AREA)
- General Physics & Mathematics (AREA)
- Computer Vision & Pattern Recognition (AREA)
- Evolutionary Computation (AREA)
- Artificial Intelligence (AREA)
- Health & Medical Sciences (AREA)
- General Health & Medical Sciences (AREA)
- Data Mining & Analysis (AREA)
- Life Sciences & Earth Sciences (AREA)
- Multimedia (AREA)
- General Engineering & Computer Science (AREA)
- Biomedical Technology (AREA)
- Molecular Biology (AREA)
- Computing Systems (AREA)
- Software Systems (AREA)
- Medical Informatics (AREA)
- Bioinformatics & Computational Biology (AREA)
- Bioinformatics & Cheminformatics (AREA)
- Evolutionary Biology (AREA)
- Biodiversity & Conservation Biology (AREA)
- Databases & Information Systems (AREA)
- Mathematical Physics (AREA)
- Biophysics (AREA)
- Computational Linguistics (AREA)
- Probability & Statistics with Applications (AREA)
- Geometry (AREA)
- Nuclear Medicine, Radiotherapy & Molecular Imaging (AREA)
- Radiology & Medical Imaging (AREA)
- Quality & Reliability (AREA)
- Apparatus For Radiation Diagnosis (AREA)
- Image Analysis (AREA)
- Investigating Or Analysing Biological Materials (AREA)
- Image Processing (AREA)
- Measuring And Recording Apparatus For Diagnosis (AREA)
Abstract
Translated fromJapaneseDescription
Translated fromJapanese本開示は、定量的イメージングおよび分析に関する。より具体的には、本開示は、定量的イメージングを利用して病変を分析するためのシステムおよび方法に関する。 The present disclosure relates to quantitative imaging and analysis. More specifically, the present disclosure relates to systems and methods for analyzing lesions using quantitative imaging.
特に安全で非侵襲的な方法によるイメージングは、疾患の原因を特定し、その詳細な病変を把握し、療法を指示し、健康への進行をモニタリングするための最も強力な方法である。イメージングはまた、より安価で破壊的である、適切な早期介入を可能にすることにより、これらの人的および経済的コストを軽減するための非常に価値のある低コストの方法でもある。 Imaging in a particularly safe and non-invasive manner is the most powerful method for identifying the cause of a disease, understanding its detailed lesions, directing therapy, and monitoring its progression to health. Imaging is also a very valuable and low-cost way to mitigate these human and economic costs by enabling appropriate early intervention, which is cheaper and more destructive.
強化されたイメージング技術により、医用イメージングは患者ケアの不可欠な成分となっている。イメージングは、非侵襲的または低侵襲的な方法を使用して、空間的および時間的に局所化された解剖学的および機能的な情報を提供することから特に価値がある。ただし、人間の目では容易に評価できないデータのパターンまたは特徴を活用するために、および大規模なデータを、データを臨床ワークフローに効率的に統合する方法で管理するために、空間的および時間的分解能の向上を効果的に利用する技術が必要である。臨床医は、支援がなければ、利用可能な情報コンテンツを効果的に抽出する時間もなく、しばしばその能力もなく、いずれにしても情報を主観的および定性的に解釈するのが一般的である。個々の患者管理および療法開発のための臨床試験のための定量的イメージングを統合することは、医療コミュニティが既存のワークフローおよび診療報酬の制約の中で、進化および成長するイメージングモダリティで可能な機能を十分に活用できるようにする、新しいクラスの意思決定支援インフォマティックスツールが必要とされている。 With enhanced imaging technology, medical imaging has become an integral part of patient care. Imaging is of particular value because it provides spatially and temporally localized anatomical and functional information using non-invasive or minimally invasive methods. However, spatially and temporally to take advantage of patterns or features of data that are not easily evaluated by the human eye, and to manage large amounts of data in a way that efficiently integrates the data into clinical workflows. There is a need for technology that effectively utilizes the improvement in resolution. Without assistance, clinicians generally do not have the time, and often the ability, to effectively extract available information content, and in any case interpret the information subjectively and qualitatively. Integrating quantitative imaging for clinical trials for individual patient management and therapy development enables the medical community to function with evolving and growing imaging modalities within the constraints of existing workflows and reimbursement fees. There is a need for a new class of decision support informatics tools that can be fully utilized.
イメージング法から得られる定量的な結果は、例えば、広く受け入れられているバイオマーカーのNIHコンセンサス会議の定義に従って、日常の臨床ケアと臨床試験との両方でバイオマーカーとして使用される可能性がある。臨床診療では、定量的イメージングは、(a)療法過程の前、最中、または後に疾患を検出し、特徴付けること、および(b)療法の有無にかかわらず疾患過程を予測することを目的としている。臨床研究では、イメージングバイオマーカーを使用して臨床試験のエンドポイントを定義することができる。 Quantitative results obtained from imaging methods may be used as biomarkers in both routine clinical care and clinical trials, for example, as defined by the widely accepted NIH Consensus Conference on Biomarkers. In clinical practice, quantitative imaging aims to (a) detect and characterize the disease before, during, or after the course of therapy, and (b) predict the course of the disease with or without therapy. .. In clinical studies, imaging biomarkers can be used to define clinical trial endpoints.
定量化は、空間的、時間的、およびコントラストの分解能の改善、ならびに複数のエネルギー/シーケンスで組織を励起し、多様な組織固有の応答をもたらすことができるようになったイメージング物理学の発展に基づいている。これらの改善により、組織の識別および機能評価が可能になり、例えば、コンピュータ断層撮影(CT)、デュアルエネルギーコンピュータ断層撮影(DECT)、スペクトルコンピュータ断層撮影(スペクトルCT)、コンピュータ断層撮影血管造影(CTA)、心臓コンピュータ断層撮影血管造影(CCTA)、磁気共鳴イメージング(MRI)、マルチコントラスト磁気共鳴イメージング(マルチコントラストMRI)、超音波(US)、および様々なイメージングモダリティを使用した標的型または一般的な造影剤によるアプローチなどで顕著に見られる。定量的イメージングは、ある治療の別の治療に対する有効性、現在の治療がどの程度有効であるか、または患者が治療を受けないままでいる場合にどのようなリスクがあるかを示す特定の生物学的特性を測定する。測定デバイスとして見ると、形成された画像の画像処理と組み合わされたスキャナは、所与のイメージングアプローチに関連する物理的原理に基づいて組織の特性を測定し、異なる組織がそれにどのように反応するかを測定する能力を有している。画像形成プロセスはモダリティによって大きく異なるが、いくつかの一般化は全体的な評価の枠組みを作るのに役立つが、例外、ニュアンス、および微妙な点が実際の結論を導き、それらが考慮されるまで、および考慮されない限り、最大の機会のいくつかを失う。 Quantification is advancing spatial, temporal, and contrast resolution, as well as the evolution of imaging physics, which has made it possible to excite tissues with multiple energies / sequences to produce diverse tissue-specific responses. Is based. These improvements allow for tissue identification and functional evaluation, such as computed tomography (CT), dual energy computed tomography (DECT), computed tomography (spectrum CT), and computed tomography angiography (CTA). ), Computed Tomography Angiography (CCTA), Magnetic Resonance Imaging (MRI), Multi-Contrast Magnetic Resonance Imaging (Multi-Contrast MRI), Ultrasonic (US), and Targeted or General Using Various Imaging Modality It is prominently seen when approaching with a contrast agent. Quantitative imaging shows the effectiveness of one treatment for another, how effective the current treatment is, or what the risks are if the patient remains untreated. Measure the scientific properties. When viewed as a measuring device, a scanner combined with image processing of the formed image measures the properties of the tissue based on the physical principles associated with a given imaging approach and how different tissues react to it. Has the ability to measure. The image formation process varies widely by modality, and some generalizations help to create an overall assessment framework, but until exceptions, nuances, and subtleties lead to actual conclusions and are taken into account. , And lose some of the greatest opportunities unless considered.
新規治療薬の臨床試験の初期フェーズでのイメージングは、基礎となる生物学的経路および薬理学的効果の理解に寄与する。イメージングはまた、新しい医薬品および療法の開発に必要なコストおよび時間を削減する可能性もある。開発の後期フェーズでは、イメージングバイオマーカーは、臨床的利益のための重要な終了地点として、および/または個別化された療法のための特定の患者の状態を説明および/または追跡するのに役立つコンパニオン診断として役立つ可能性がある。すべてのフェーズで、療法の効果をよりよく実証するために、イメージングバイオマーカーを使用して、疾患状態に基づいて患者を選択または層別化することができる。 Imaging in the early stages of clinical trials of new therapeutic agents contributes to an understanding of the underlying biological pathways and pharmacological effects. Imaging may also reduce the cost and time required to develop new medicines and therapies. In the late phase of development, imaging biomarkers are a companion that serves as an important end point for clinical benefit and / or to explain and / or track the condition of a particular patient for personalized therapy. May be useful as a diagnosis. In all phases, imaging biomarkers can be used to select or stratify patients based on disease status to better demonstrate the effectiveness of the therapy.
a.定量的医用イメージング
強化されたイメージング技術により、医用イメージングは患者ケアの不可欠な成分となっている。イメージングは、非侵襲的または低侵襲的な方法を使用して、空間的および時間的に局所化された解剖学的および機能的な情報を提供することから特に価値がある。ただし、人間の目では容易に評価できないデータのパターンまたは特徴を活用するために、および大規模なデータを、データを臨床ワークフローに効率的に統合する方法で管理するために、分解能の向上に対する技術が必要とされている。最新の高分解能イメージング技術では、放射線科医は支援がなければデータに「溺れて」しまうことになる。個々の患者管理のために定量的イメージングを統合することは、コミュニティが既存のワークフローおよび診療報酬の制約の中で、これらの新しいツールの機能を十分に活用できるようにするために、新しいクラスの意思決定支援インフォマティックスツールが必要となる。a. Quantitative Medical Imaging With enhanced imaging technology, medical imaging has become an integral part of patient care. Imaging is of particular value because it provides spatially and temporally localized anatomical and functional information using non-invasive or minimally invasive methods. However, techniques for improving resolution to take advantage of patterns or features of data that are not easily evaluated by the human eye, and to manage large amounts of data in a way that efficiently integrates the data into clinical workflows. Is needed. With the latest high-resolution imaging technology, radiologists will be "drown" in the data without assistance. Integrating quantitative imaging for individual patient management is a new class of new tools that allow the community to take full advantage of the capabilities of these new tools within the constraints of existing workflows and reimbursement fees. Decision support informative stools are needed.
追加的に、定量的イメージング法は、(i)前臨床試験、(ii)臨床研究、(iii)臨床試験、および(iv)臨床診療にとってますます重要になっている。新規治療薬の臨床試験の初期フェーズでのイメージングは、基礎となる生物学的経路および薬理学的効果の理解に寄与する。イメージングはまた、新規医薬品および療法の開発に必要なコストおよび時間を削減する可能性もある。開発の後期フェーズでは、イメージングバイオマーカーは臨床的利益のための重要な終了地点として役立つことがある。すべてのフェーズで、療法の効果をよりよく実証するために、イメージングバイオマーカーを使用して、疾患状態に基づいて患者を選択または層別化することができる。 In addition, quantitative imaging methods are becoming increasingly important for (i) preclinical studies, (ii) clinical studies, (iii) clinical trials, and (iv) clinical practice. Imaging in the early stages of clinical trials of new therapeutic agents contributes to an understanding of the underlying biological pathways and pharmacological effects. Imaging may also reduce the cost and time required to develop new medicines and therapies. In the later phases of development, imaging biomarkers may serve as an important end point for clinical benefit. In all phases, imaging biomarkers can be used to select or stratify patients based on disease status to better demonstrate the effectiveness of the therapy.
定量的イメージングの使用を通じた改善された患者選択は、(評価可能な患者の割合を増加させ、および/または迷惑変数の影響を低減することによって)所与の試験に必要なサンプルサイズを減少させ、提案された療法から最も利益を得られる可能性のある部分母集団を識別するのに役立ち得る。これにより、新薬の開発時間とコストが削減されるはずであるが、それに応じて「標的」母集団のサイズも減少される可能性もある。 Improved patient selection through the use of quantitative imaging reduces the sample size required for a given trial (by increasing the proportion of evaluable patients and / or reducing the effects of annoying variables). , Can help identify the partial population that may most benefit from the proposed therapy. This should reduce development time and costs for new drugs, but may also reduce the size of the "target" population accordingly.
疾患は単純ではなく、局所的に疾患が現れることが多いのに対し、全身性であることが多い。客観的に関連性のある組織特性の多要因評価は、連続的な指標のパネルまたは「プロファイル」として表され、時には将来の、および/または測定が困難であるが受け入れられているエンドポイントの「サロゲート」として理想的に証明されており、医学全体で効果的な方法であることが証明されているので、ここではそれに従うものとする。表現型の定量的なイメージング評価に基づく個別化診断のための次世代の計算方法の学際的な収束によって可能になった、病巣および/または臓器生態のコンピュータ支援測定、ならびにファーストリーダーまたはセカンドリーダーのパラダイムでの組織組成の定量化は、最新の臨床ITシステムとの相互運用性を積極的に最適化するアーキテクチャで実装されており、重症度の連続した疾患の患者を管理する際に、臨床医に力を提供し、外科、医療、およびモニタリングの経路にわたる患者分類を改善する。よりタイムリーで正確な評価は、結果の改善、ヘルスケアリソースのより効率的な使用、ツールのコストをはるかに上回るメリットを、基礎となる生物学に反するレベルに単純化できるという想定を保持するのではなく、疾患自体の複雑さに近い粒度と洗練度のレベルで生み出す。 The disease is not simple and often manifests locally, whereas it is often systemic. A multifactorial assessment of objectively relevant organizational characteristics is represented as a continuous panel of indicators or "profiles" of endpoints that are sometimes future and / or difficult to measure but accepted. It has been ideally proven as a "surrogate" and has proven to be an effective method throughout medicine, so we will follow it here. Computer-assisted measurements of lesion and / or organ ecology, as well as first- or second-leader, enabled by the interdisciplinary convergence of next-generation computational methods for personalized diagnosis based on phenotypic quantitative imaging assessments. Quantification of tissue composition in the paradigm is implemented in an architecture that actively optimizes interoperability with modern clinical IT systems and is used by clinicians in managing patients with consecutive severe illnesses. To improve patient classification across surgical, medical, and monitoring pathways. A more timely and accurate assessment holds the assumption that improved results, more efficient use of health care resources, and benefits that far outweigh the cost of tools can be simplified to levels contrary to the underlying biology. Rather, it is produced at a level of grain size and sophistication that is close to the complexity of the disease itself.
b.表現型:
放射線イメージングは、一般に、病状に対して主観的かつ定性的に解釈される。医学文献では、表現型という用語を、その遺伝子型と環境との相互作用から生じる個人の観察可能な特性のセットとして使用している。表現型は一般的に客観性を意味し、つまり、表現型は主観的なものではなく事実であると言える。放射線学は、特性を視覚化する能力でよく知られており、ますます、客観的な事実基準で検証され得る(米国出願整理番号第14/959,732号、米国出願整理番号第15/237,249号、米国出願整理番号第15/874,474号、および米国出願整理番号第16/102,042号)。結果として、放射線画像を使用して表現型を決定することができるが、そうするための適切な手段が不足していることが多い。b. Phenotype:
Radiation imaging is generally interpreted subjectively and qualitatively for the medical condition. The medical literature uses the term phenotype as a set of observable traits of an individual resulting from the interaction of its genotype with the environment. The phenotype generally means objectivity, that is, the phenotype is a fact rather than a subjective one. Radiology is well known for its ability to visualize properties and can be increasingly verified by objective factual criteria (US Application Reference No. 14 / 959,732, US Application Reference No. 15/237). , 249, US Application Reference No. 15 / 874,474, and US Application Reference No. 16 / 102,042). As a result, radiographic images can be used to determine the phenotype, but there is often a lack of suitable means for doing so.
有利には、表現型は事実に基づいているため、独立して客観的に評価することができる。さらに、表現型は、患者の治療上の決定を管理するために、ヘルスケア業界ですでに受け入れられている形式である。したがって、表現型は高度の臨床的関連性を有している。最後に、表現型は消費者との関連性がある。これにより、自己主張とライフスタイルの変化の動機付けとの両方が可能になる。 Advantageously, the phenotype is factual and can be evaluated independently and objectively. In addition, the phenotype is a form already accepted in the healthcare industry for managing the therapeutic decisions of patients. Therefore, the phenotype has a high degree of clinical relevance. Finally, phenotypes are consumer-related. This allows for both self-assertion and motivation for lifestyle changes.
単一の特徴を検出するだけでなく、連続的な指標の包括的なパネルに基づいて表現型を早期に識別することで、不可逆的な損傷および死亡を防ぐための迅速な介入が可能になる。事象を完全に先取りするため、または少なくとも兆候および/または症状を経験したときの診断精度を改善させるためには、ソリューションが不可欠である。構造の自動化測定ならびに組織組成および/または血行動態の定量化を備えた効率的なワークフローソリューションを使用して、リスクの高い患者(リスクの高くない患者とは異なる治療を受けることになるであろう患者)を特徴付けることができる。プラーク形態の特性を塞栓の可能性に結び付けると、臨床的に大きな臨床的意味合いを持つことになる。 Early identification of phenotypes based on a comprehensive panel of continuous indicators, as well as detection of a single feature, enables rapid intervention to prevent irreversible injury and death. .. Solutions are essential to fully anticipate events, or at least improve diagnostic accuracy when experiencing signs and / or symptoms. Efficient workflow solutions with automated structural measurements and quantification of tissue composition and / or hemodynamics will result in different treatment for high-risk patients (non-risk patients) Patient) can be characterized. Linking the characteristics of plaque morphology to the potential for embolism has significant clinical implications.
イメージング表現型は、関連研究において相関する遺伝子発現パターンであり得る。イメージング表現型は、イメージングが臨床現場で日常的に使用されており、個別化された治療における意思決定サポートを低コストで改善するためのこれまでにない機会を提供しているため、臨床的な影響を有し得る。特定のイメージング表現型を大規模なゲノム、プロテオミクス、トランスクリプトーム、および/またはメタボロミクス分析と相関させることは、より決定論的で患者固有の予後、および薬物療法または他の療法に対する反応の測定を作成することによって、療法戦略に影響を与える可能性がある。しかしながら、これまでのイメージング表現型を抽出するための方法は、ほとんどが経験的な性質のものであり、専門家とはいえ主に人間の観察に基づいている。これらの方法には人間による変動を内包しており、ハイスループット分析を支えるための拡張性がないことは明らかである。 The imaging phenotype can be a correlated gene expression pattern in related studies. The imaging phenotype is clinical because imaging is routinely used in clinical practice and provides an unprecedented opportunity to improve decision support in personalized treatment at low cost. Can have an impact. Correlating specific imaging phenotypes with large genomic, proteomics, transcriptome, and / or metabolomics analysis provides a more deterministic, patient-specific prognosis and measurement of response to drug or other therapies. By creating it, it may affect the therapeutic strategy. However, most of the conventional methods for extracting imaging phenotypes are of empirical nature and are mainly based on human observation, albeit by experts. It is clear that these methods involve human variation and are not scalable to support high-throughput analysis.
同時に、コストを追加せずに、つまり実際には、予防医療、比較有効性、診療報酬アプローチ、および/または不測の事象への対応ではなく回避におけるイニシアティブを通じて、より良いコスト管理に対してより個別化された医療を実現したいというアンメットニーズの収束は、能力を提供するだけでなく、同時にコストを削減する方法でそれを提供する技術の進歩に前例のないプレッシャーを与えている。 At the same time, more individualized for better cost management without additional costs, that is, in fact, through preventive care, comparative effectiveness, fee-based approaches, and / or initiatives in avoidance rather than response to unforeseen events. The convergence of unmet needs for the realization of medical care is putting unprecedented pressure on technological advances that not only provide capabilities, but at the same time provide them in ways that reduce costs.
表現型分類(順序付けられていないカテゴリの分類)の問題に加えて、転帰予測/リスク層別化(リスクの通常レベルの予測)の問題がある。両方とも臨床的有用性を有するが、技術的なデバイスの特性が異なる結果となっている。具体的には、一方が他方に厳密に依存しているわけではない。 In addition to the problem of phenotypic classification (classification of unordered categories), there is the problem of outcome prediction / risk stratification (prediction of normal level of risk). Both have clinical utility, but result in different technical device characteristics. Specifically, one is not strictly dependent on the other.
一般性を制限することなく、臨床的関連性を含む表現型分類の例を以下に示す。 An example of a phenotypic classification that includes clinical relevance without limiting generality is shown below.
動脈硬化症の「安定したプラーク」表現型の例示的な症状は、以下のように説明することができる。
●「治癒した」疾患、強化された抗スタチンレジームへの反応が低い
●バルーン/ステントの合併症が少ない
●狭窄が50%を上回ることがある
●Caが高く、深いことがある
●脂質、出血、潰瘍が最小限であるか、またはまったくない
●外観が平滑である
このようなプラークは一般に、「不安定なプラーク」表現型よりも有害事象の発生率が低い。
●活動性疾患であり、脂質低下および/または抗炎症レジームの強化に対して高い反応を示す可能性がある
●バルーン/ステントの合併症が多い
●狭窄が50%を下回ることがある
●Ca、内腔に近いCa、ナプキンリングの兆候、および/または微小石灰化が低いかまたは拡散性である
●脂質含有量が多い、キャップが薄い根拠があることがある
●出血もしくはプラーク内出血(IPH)、および/または潰瘍の根拠があることがあるAn exemplary manifestation of the "stable plaque" phenotype of arteriosclerosis can be explained as follows.
● “Cure” disease, low response to enhanced anti-statin regime ● Less balloon / stent complications ● Stenosis may exceed 50% ● Ca may be high and deep ● Lipids, bleeding Minimal or no bleeding ● Smooth appearance Such plaques generally have a lower incidence of adverse events than the “unstable plaque” phenotype.
● Active disease that may be highly responsive to lipid lowering and / or strengthening of the anti-inflammatory regime ● Many balloon / stent complications ● Stenosis may be less than 50% ● Ca, Ca near the lumen, signs of napkin ring, and / or low or diffuse microcalcifications ● High lipid content, thin cap may be evidenced ● Bleeding or intraplaque bleeding (IPH), And / or may have evidence of bleeding
このようなプラークは、安定した表現型と比較して、有害事象の発生率が3倍〜4倍であると報告されている。これらの2つの例は、1回の患者との遭遇で評価されてもよいが、「急速進行性」などの他の表現型は、経時的な特性の変化率を比較することによって決定されてもよい。すなわち、ある時点で統計的に存在するものだけでなく、むしろ、運動学および/またはどのようにn回を変化させているかに基づいて決定される表現型である。 Such plaques have been reported to have a three to four times higher incidence of adverse events than stable phenotypes. These two examples may be evaluated in a single patient encounter, but other phenotypes such as "rapid progression" are determined by comparing the rate of change in characteristics over time. May be good. That is, it is not only a phenotype that is statistically present at a given point in time, but rather a phenotype that is determined based on kinematics and / or how it changes n times.
c.機械および深層学習の技術:
深層学習(DL)の方法は、複雑な現実の問題に起因する多くの困難な機械学習(ML)および分類タスクに大成功を収めて適用されてきた。注目すべき最近の用途としては、コンピュータビジョン(光学式文字認識、顔認識、衛星画像の解釈など)、音声認識、自然言語処理、医療画像分析(画像セグメンテーション、特徴抽出、および分類)、臨床データおよび分子データのバイオマーカーの発見および検証が挙げられる。このアプローチの魅力的な特徴は、教師なし学習タスクと教師あり学習タスクとの両方に適用できることである。c. Machinery and deep learning techniques:
Deep learning (DL) methods have been successfully applied to many difficult machine learning (ML) and classification tasks due to complex real-life problems. Recent applications of note include computer vision (optical character recognition, face recognition, satellite image interpretation, etc.), speech recognition, natural language processing, medical image analysis (image segmentation, feature extraction, and classification), clinical data. And the discovery and validation of biomarkers in molecular data. An attractive feature of this approach is that it can be applied to both unsupervised and supervised learning tasks.
ニューラルネットワーク(NN)、および畳み込みニューラルネットワーク(CNN)、反復畳み込みニューラルネットワーク(RCNN)などを広く含む深層NNアプローチは、安定した理論的基盤に基づいていることが示されており、人間の脳の高度な認知機能を表現すると考えられている原理に基づいて広くモデリングされている。例えば、多くの認知能力に関連付けられた脳領域である新皮質では、感覚信号は、経時的に観察を表現することを学習する複雑な局所的なモジュール化された階層を介して伝播する。この設計原理は、画像分類および特徴抽出に使用されるCNNの一般的な定義および構築につながっている。ただし、同じ数のフィッティングパラメータを有しているが、深層アーキテクチャを有していないフレームワークと比較して、DLネットワークおよびアプローチの優れた性能のより根本的な理由は何であるかは、いくぶん未確定の問題である。 Deep NN approaches, including neural networks (NN) and convolutional neural networks (CNN), iterative convolutional neural networks (RCNN), etc., have been shown to be based on a stable theoretical basis and are based on the human brain. It is widely modeled on the principle that is thought to represent advanced cognitive functions. For example, in the neocortex, a brain region associated with many cognitive abilities, sensory signals propagate through complex, locally modularized hierarchies that learn to represent observations over time. This design principle has led to the general definition and construction of CNNs used for image classification and feature extraction. However, it is somewhat unclear what is the more fundamental reason for the superior performance of DL networks and approaches compared to frameworks that have the same number of fitting parameters but do not have a deep architecture. It's a matter of definiteness.
生データからの画像特徴抽出および画像ベースの学習に対する従来のMLアプローチには、多くの制限がある。特に、特徴が元の画像の3Dレベルではなく要約レベルにある場合、または3Dレベルにある場合、客観的に検証できる生物学的事実に縛られておらず、ただの数学的な演算子であるという範囲で、特徴抽出を使用するMLアプローチでは、空間的コンテキストを取得することが困難であることが多い。空間的コンテキストを含む生のデータセットの使用には、抽出された特徴の客観的なグラウンドトゥルースラベルを欠いていることが多いが、生の画像データ自体の使用には、目前の分類問題に関する「ノイズ」である多くの変動が含まれている。イメージング以外の用途では、この変動は通常、非常に大規模な訓練セットによって軽減され、その結果、ネットワーク訓練はこの変動を無視し、重要な情報のみに焦点を当てるように「学習」するが、この規模の大規模な訓練セットは、コスト、ロジスティックス、およびプライバシーの問題に起因して、医療用途、特にグラウンドトゥルースで注釈が付けられたデータセットでは一般に利用できない。本開示のシステムおよび方法は、これらの制限を克服するのに役立つ。 Traditional ML approaches to image feature extraction from raw data and image-based learning have many limitations. In particular, if the features are at the summary level rather than the 3D level of the original image, or at the 3D level, they are not bound by objectively verifiable biological facts and are just mathematical operators. In this range, it is often difficult to obtain a spatial context in the ML approach using feature extraction. The use of raw datasets, including spatial contexts, often lacks an objective ground truth label for the extracted features, while the use of raw image data itself is associated with the imminent classification problem. It contains many fluctuations that are "noise". For non-imaging applications, this variability is usually mitigated by a very large training set, so that network training ignores this variability and "learns" to focus only on important information. Large training sets of this size are not generally available for medical applications, especially ground truth annotated datasets, due to cost, logistics, and privacy issues. The systems and methods of the present disclosure help overcome these limitations.
d.例示的な適用:部分血流予備量比(FFR)およびプラークの安定性または高リスクプラーク(HRP)などの心血管測定:
新しい治療は過去30年間で結果の改善において革命的であったが、心血管疾患により米国経済には依然として年間3,200億ドルの負担がかかっている。主要な冠動脈または脳の有害事象のリスクのより良い特徴付けから恩恵を受けることができるかなりの患者集団が存在する。米国心臓協会(AHA)は、ACSD(動脈硬化性心血管疾患)リスクスコアを母集団に外挿した結果、成人(20歳よりも上)の9.4%が今後10年間に20%超の有害事象のリスクを有し、26%が7.5%〜20%のリスクを有すると予測している。これを母集団に適用すると、高リスク患者2,300万人および中程度のリスク患者5,700万人が得られる。リスクのある8,000万人は、新しいまたは再発事象を回避するために現在スタチン療法を受けている米国患者3,000万人、およびCVD診断を受けた1,650万人と比較することができる。スタチンを服用している人の中には、閉塞性疾患および急性冠症候群(ACS)を発症する患者もいる。患者の大多数は、胸痛が発症するまで疾患の進行に気づかない。冠動脈疾患のさらなる結果およびコストの改善は、改善された非侵襲的診断から流れ、どの患者が一次治療の下で進行している疾患を持っているかを識別する。d. Exemplary applications: Cardiovascular measurements such as partial blood flow reserve ratio (FFR) and plaque stability or high-risk plaque (HRP):
Although new treatments have been revolutionary in improving outcomes over the last three decades, cardiovascular disease still burdens the US economy with $ 320 billion annually. There is a significant patient population that can benefit from better characterization of the risk of major coronary or brain adverse events. The American Heart Association (AHA) extrapolated the ACSD (arteriosclerotic cardiovascular disease) risk score to the population, and found that 9.4% of adults (above 20 years old) will exceed 20% over the next decade. It has a risk of adverse events, and 26% predict that it has a risk of 7.5% to 20%. Applying this to the population yields 23 million high-risk patients and 57 million moderate-risk patients. 80 million at risk can be compared to 30 million US patients currently receiving statin therapy to avoid new or recurrent events, and 16.5 million with a CVD diagnosis. can. Some people taking statins develop obstructive disease and acute coronary syndrome (ACS). The majority of patients are unaware of the progression of the disease until the onset of chest pain. Further outcomes and cost improvements in coronary artery disease flow from improved non-invasive diagnosis to identify which patients have the disease progressing under first-line treatment.
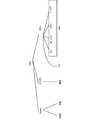
心臓の健康は、心臓を取り巻く動脈の劣化によって大きく影響を受ける可能性がある。様々な要因(例として、血管新生、新生血管化、炎症、石灰化、脂質沈着、壊死、出血、硬直、密度、狭窄、拡張、再モデリング比、潰瘍化、(例えば、チャネル内の血液の)流れ、(例えば、チャネル内の血液の、または1つの組織が別の組織に押し付けられる)圧力、細胞タイプ(例えば、マクロファージ)、(例えば、平滑筋細胞の)細胞整列、または(例えば、チャネル内の血液の)せん断応力、キャップ厚さ、および/または蛇行(例えば、入口角および出口角)などの組織特性)は、これらの動脈が酸素で満たされた血液を周囲の組織に伝達する際のそれらの有効性が低下する原因となり得る(図35)。 Heart health can be significantly affected by deterioration of the arteries surrounding the heart. Various factors (eg, angiogenesis, neovascularization, inflammation, calcification, lipid deposition, necrosis, bleeding, rigidity, density, stenosis, dilation, remodeling ratio, ulceration, (eg, of blood in a channel) Flow, pressure (eg, blood in a channel, or one tissue is pressed against another), cell type (eg, macrophages), cell alignment (eg, smooth muscle cells), or (eg, within a channel). Tissue properties such as shear stress, cap thickness, and / or serpentine (eg, entrance and exit angles) of the blood) cause these arteries to transmit oxygen-filled blood to surrounding tissues. It can cause a decrease in their effectiveness (Fig. 35).
冠動脈の機能テスト、主にストレス心電図検査および単一光子放出コンピュータ断層撮影心筋灌流テスト(SPECT MPI)は、閉塞性冠動脈疾患の診断のための主要な非侵襲的方法である。米国では毎年1,000万を超える機能検査が実施されており、その結果が陽性であった場合、冠動脈疾患の所見を確認するための侵襲的血管造影のために、260万件のカテーテル検査室への訪問が促されている。 Coronary function tests, primarily stress electrocardiography and single photon emission computed tomography myocardial perfusion test (SPECT MPI), are the primary non-invasive methods for the diagnosis of occlusive coronary artery disease. More than 10 million functional tests are performed each year in the United States, and if the result is positive, 2.6 million catheterization laboratories are used for invasive angiography to confirm the findings of coronary artery disease. A visit to is being encouraged.
灌流を評価するための別のアプローチは、酸素を伝達する血管系の能力を決定することである。具体的には、能力の低下は、部分血流予備量比、すなわち、FFRとして定量化できる。FFRは、虚血の直接の測定ではなく、むしろ病巣全体の圧力低下の比率を測定するサロゲートである。最大充血時に局所的な血管拡張性障害によって引き起こされる同一血管の他のセグメントに対する管腔直径の変化は、異常なFFR測定につながる著しい血行力学的効果を生じさせる。物理的なFFR測定の間、アデノシンの注入により下流の抵抗が減少し、これにより充血状態での流れが増加する。FFRを物理的に測定するには、動脈内の物理的圧力センサを含む侵襲的な外科的処置が必要である。このレベルの侵襲性はリスクと不便さを助長するため、物理的な測定を必要とせずに高精度でFFRを推定する方法が求められている。この測定を非侵襲的に実施できることで、指摘されている「治療バイアス」も減少する。患者がカテーテル検査室に入ると、ステント留置は比較的簡単に行えるため、多くの人が過剰治療が起こると指摘しているのに対し、血流予備量比を非侵襲的に評価することができれば、ステント留置を行うかどうかの決定が改善される可能性がある。同様に、血流予備量比は脳組織の灌流にも適用される(例えば、脳の充血に関連する)。 Another approach for assessing perfusion is to determine the ability of the vascular system to transmit oxygen. Specifically, the decline in capacity can be quantified as a partial blood flow reserve ratio, i.e., FFR. FFR is a surrogate that measures the rate of pressure drop across the lesion rather than a direct measurement of ischemia. Changes in luminal diameter relative to other segments of the same vessel caused by local vasodilatory disorders during maximal hyperemia produce significant hemodynamic effects leading to abnormal FFR measurements. During physical FFR measurements, infusion of adenosine reduces downstream resistance, which increases flow in a hyperemic state. Physical measurement of FFR requires invasive surgical procedures, including a physical pressure sensor in the artery. Since this level of invasiveness contributes to risk and inconvenience, there is a need for a method of estimating FFR with high accuracy without the need for physical measurements. Being able to perform this measurement non-invasively also reduces the indicated "treatment bias". Non-invasive assessment of the blood flow reserve ratio can be done, whereas many have pointed out that overtreatment occurs because stenting is relatively easy when the patient enters the catheterization laboratory. If possible, the decision on whether to perform stent placement may be improved. Similarly, the blood flow reserve ratio also applies to perfusion of brain tissue (eg, related to cerebral hyperemia).
機能検査には、感度および特異性に関する既知の問題がある。心血管疾患患者の約30〜50%は誤分類され、過大な治療または過少な治療を受けていると推定されており、金銭的および生活の質的に大きなコストがかかっている。機能テストはまた、高価で時間がかかり、閉塞性前疾患を有する患者への使用は限られている。非侵襲的機能テストによる偽陽性は、安定した患者における侵襲的冠動脈造影と経皮的冠動脈インターベンションとの両方の乱用の大きな要因であり、米国、英国、および中国では政策上の大きな問題となっている。偽陰性の影響に関する研究によると、米国の冠動脈疾患(CAD)が疑われる患者に年間380万件のMPI検査が実施されているが、そのうち60万件近くが誤陰性の所見を報告し、13,700件の急性冠動脈事象(その多くは、適切な薬物療法を導入するだけで防ぐことができる)につながると推定されている。機能テストのもう1つの欠点は、本質的に一時的なものである。虚血は、疾患の進行によって引き起こされる解剖学的変化に追従する遅れた指標である。ACSのリスクが高い患者では、将来の原因病巣を検出し、虚血の発症前に集中的な薬物療法で軽減することができれば、より良いサービスを受けることができる。 Functional testing has known issues regarding sensitivity and specificity. Approximately 30-50% of patients with cardiovascular disease are misclassified and estimated to be over-treated or under-treated, at great financial and quality of life costs. Functional tests are also expensive, time consuming, and have limited use in patients with preobstructive disease. False positives from non-invasive functional tests are a major contributor to both invasive coronary angiography and percutaneous coronary intervention in stable patients and have become a major policy issue in the United States, United Kingdom, and China. ing. According to a study on the effects of false negatives, 3.8 million MPI tests are performed annually in patients with suspected coronary artery disease (CAD) in the United States, of which nearly 600,000 report false negative findings, 13 It is estimated to lead to 700 acute coronary events, many of which can be prevented with the introduction of appropriate medications. Another drawback of functional testing is that it is temporary in nature. Ischemia is a delayed indicator that follows the anatomical changes caused by the progression of the disease. Patients at high risk for ACS can receive better service if they can detect future causative lesions and mitigate them with intensive medication before the onset of ischemia.
冠動脈コンピュータ断層撮影血管造影(CCTA)は、特に定量分析ソフトウェアと組み合わせて使用されたときに、冠動脈疾患の進行の程度および速度を理解する上でこのギャップを埋めるための理想的なテスト法になるように進化しつつある。過去10年間で、ほとんどの国のCTスキャナは、心臓の動きを遅くしたり、息を止めたりすることなく、優れた空間分解能を実現できる、より高速で検出器数の多い機械にアップグレードされてきた。放射線量は大幅に低下し、SPECT MPIおよび侵襲的血管造影と同等またはそれ以下になっている。 Coronary computed tomography angiography (CCTA) is an ideal test method to fill this gap in understanding the extent and rate of progression of coronary artery disease, especially when used in combination with quantitative analysis software. Is evolving. Over the last decade, CT scanners in most countries have been upgraded to faster, more detector-rich machines that can achieve superior spatial resolution without slowing the heart or holding your breath. rice field. Radiation doses have dropped significantly, equal to or less than SPECT MPI and invasive angiography.
SCOT−HEART、PREDICT、およびPROMISEなどの画期的な試験のデータを最近分析したところ、CCTAを使用して、患者(将来の有害事象のリスクが高い人)を識別することによって、高リスクプラーク(HRP)または不安定プラークと呼ばれることもある非閉塞性疾患を検出することの価値が実証された。研究設計は多様であり、心血管(CV)事象を伴うCCTA登録患者と、同様のリスク要因/人口統計学的属性を有する対照群とを比較する入れ子の症例対照コホート、FFRとの比較、および大規模な「検査および治療」研究への複数年の追跡調査などを含んでいた。CCTAを一次診断として位置決めするNICEからの最近の好ましい決定は、SCOT−HEART研究のCCTA群において、薬物治療の開始またはCCTAによるプラーク発見時の変化に起因するCV事象が有意に減少したことに基づいている。 A recent analysis of data from breakthrough trials such as SCOT-HEART, PREDICT, and PROMISE showed that high-risk plaques were used to identify patients (those at high risk for future adverse events) using CCTA. The value of detecting non-obstructive disease, sometimes referred to as (HRP) or vulnerable plaque, has been demonstrated. Study designs are diverse, with a nested case-control cohort comparing CCTA-registered patients with cardiovascular (CV) events with controls with similar risk factors / demographic attributes, comparison with FFR, and It included a multi-year follow-up to a large "test and treatment" study. A recent favorable decision from NICE to position CCTA as the primary diagnosis is based on a significant reduction in CV events due to changes at the start of drug treatment or at the time of plaque detection by CCTA in the CCTA group of the SCOT-HEART study. ing.
重要な標的患者グループは、安定した胸痛を有し、典型的または非典型的な狭心症症状を有するCADの既往歴がない患者(SCOT−HEARTデータに基づく)、ならびにプラークの評価が最も必要であることを示唆するPROMISE所見に基づいて、非閉塞性疾患(狭窄70%未満)を有する患者、および若年層(例えば、50〜65歳群)である患者である。CCTA分析に基づいて高リスクのプラークプロファイルが認められた非閉塞性CADを有する患者には、最も適切な高強度スタチン療法(特にPCSK9阻害剤などの非常に高価な新しい脂質低下療法、またはカナキヌマブなどの抗炎症薬に関する決定を検討する場合)に割り当てるか、冠動脈血栓症のリスクを軽減するための新しい抗血小板薬、および/または療法の強化または格下げの可能性を考慮した長期的な追跡調査を追加することができる。CCTAは非侵襲的であり、心臓カテーテル検査よりも必要な放射線が少ないため、理想的な診断ツールである。 An important target patient group is patients with stable chest pain, no history of CAD with typical or atypical angina symptoms (based on SCOT-HEART data), and plaque assessment most needed. Patients with non-obstructive disease (less than 70% angina) and patients in the younger age group (eg, 50-65 years old), based on PROMISE findings suggesting that. For patients with non-obstructive CAD who have a high-risk plaque profile based on CCTA analysis, the most appropriate high-intensity statin therapy (especially very expensive new hypolipidemic therapies such as PCSK9 inhibitors, or canaquinumab, etc.) (When considering decisions regarding anti-inflammatory drugs) or new antiplatelet drugs to reduce the risk of coronary thrombosis, and / or long-term follow-up considering the possibility of strengthening or downgrading therapy Can be added. CCTA is an ideal diagnostic tool because it is non-invasive and requires less radiation than cardiac catheterization.
致命的な心臓発作に関係する原因病変に関する病理学の文献では、臨床的に非閉塞性のCADは、より安定する傾向がある、より閉塞性のプラークよりも、最もリスクの高いプラークが存在する可能性がはるかに高いことが指摘されている。これらの所見は、侵襲的血管造影を受けているACS患者からの原因病巣に注目し、これらをベースラインCCTAの前駆プラークと比較した最近の研究によって裏付けられた。臨床的に示されたCCTAを受けているあるコホートでは、非閉塞性CADを有していることがわかった患者について、そのように検査された患者の38%は、中長期の重大な心血管有害事象および/または脳血管障害事象(MACCE)の有意なリスクを依然として有していた。閉塞とは無関係に、罹患したセグメントの数に基づくハザード比は、このグループにおけるMACCEの有意な長期予測要因であることがわかった。臨床的に非閉塞性CADの予測値に寄与する1つの要因は、これらの病巣が、より安定する傾向があるより閉塞性のプラークよりも、最もリスクの高いプラークが存在する可能性がはるかに高いことである。 In the pathological literature on causative lesions associated with a fatal heart attack, clinically non-obstructive CAD has the highest risk of plaques, which tends to be more stable than the more obstructive plaques. It has been pointed out that the possibility is much higher. These findings were supported by recent studies focusing on causative lesions from ACS patients undergoing invasive angiography and comparing them with precursor plaques of baseline CCTA. In one cohort undergoing clinically indicated CCTA, for patients found to have non-obstructive CAD, 38% of patients so tested had medium- to long-term significant cardiovascular disease. He still had a significant risk of adverse events and / or cerebrovascular accidents (MACCE). Hazard ratios based on the number of affected segments, independent of obstruction, were found to be significant long-term predictors of MACCE in this group. One factor that contributes clinically to the predictive value of non-obstructive CAD is that these lesions are far more likely to have the most risky plaques than the more obstructive plaques that tend to be more stable. It's expensive.
閉塞性および閉塞性前動脈硬化性病巣の検出および管理におけるCCTAの潜在的な有用性は、スタチンおよび抗炎症薬の治療効果に関する最近発表されたいくつかの縦断的研究でも見られ、治療群では、プラークのより安定した状態へのリモデリングおよびプラークの退縮が観察された。このことは、初期の血管内超音波(IVUS、「仮想組織学」VHを伴う場合もある)、近赤外線分光法(NIRS)、光コヒーレンストモグラフィー(OCT)など、様々な脂質低減薬のプロトコルの下で疾患の進行および治療効果を調査した研究を裏付けるものである。最近の治験は、新しい医学的療法の有効性を実証するための潜在的なプラークバイオマーカーを提供している。Integrated Biomarkers and Imaging Study−4(IBIS−4)では、スタチンの潜在的な保護効果として石灰化の進行が見い出された。他の研究では、スタチン治療下で脂質に富む壊死性コア(LRNC)が減少することが見い出された。これらの研究では、臨床変数を単独で使用した場合、高リスクのプラーク特性を識別する識別性が十分ではなかった。これらの研究は、CCTAが好適に分析できる、より正確なリスク層別化を可能にするために、原因病巣だけでなく、冠動脈ツリー全体の完全な特性評価および評価の重要性を強調している。メタアナリシスでは、CCTAは、IVUSと比較して冠動脈プラークを検出するための優れた診断精度を有していたが、プラークの面積および体積の評価、狭窄の割合、および内腔面積のわずかな過大評価にわずかな差があった。脂質に富む壊死性コアの変化率およびその内腔からの距離を加えることもまた、高い予後的価値を有することが見出された。追加的に、ROMICAT II試験の結果では、急性胸痛を有するが初期ECGおよびトロポニンが陰性の安定したCAD患者に対してCCTAで高リスクプラークを識別することは、重大なCADおよび臨床的リスク評価とは無関係にACSの可能性を増加させることが示されている。冠動脈動脈硬化性プラークの評価に対しては、CCTAによる検査が確立されている。侵襲的処置の必要性が不確かな患者に対しては、非侵襲的にMACCEを予測することは、疾患の負担および将来の事象のリスクの全体的な推定を与えるCCTAで有益であり、実現可能であろう。 The potential usefulness of CCTA in the detection and management of obstructive and obstructive pre-arteriosclerotic lesions has also been seen in several recently published longitudinal studies on the therapeutic effects of statins and anti-inflammatory drugs, in the treatment group. , Remodeling of the plaque to a more stable state and plaque regression was observed. This is the protocol of various lipid-reducing drugs such as early intravascular ultrasound (IVUS, which may be accompanied by "virtual histology" VH), near-infrared spectroscopy (NIRS), optical coherence tomography (OCT), etc. It supports a study that investigated the progression and therapeutic effects of the disease below. Recent clinical trials have provided potential plaque biomarkers to demonstrate the effectiveness of new medical therapies. In Integrated Biomarkers and Imaging Study-4 (IBIS-4), calcification progression was found as a potential protective effect of statins. Other studies have found that lipid-rich necrotic cores (LRNCs) are reduced under statin treatment. In these studies, the clinical variables alone were not sufficiently discriminating to identify high-risk plaque characteristics. These studies emphasize the importance of complete characterization and assessment of the entire coronary tree, not just the causative lesion, to allow for more accurate risk stratification that CCTA can better analyze. .. In a meta-analysis, CCTA had superior diagnostic accuracy for detecting coronary plaques compared to IVUS, but an assessment of plaque area and volume, rate of stenosis, and slight overload of luminal area. There was a slight difference in the evaluation. Adding the rate of change of the lipid-rich necrotic core and its distance from its lumen has also been found to have high prognostic value. In addition, in the results of the ROMICAT II trial, identifying high-risk plaques with CCTA in stable CAD patients with acute chest pain but negative for early ECG and troponin is a significant CAD and clinical risk assessment. Has been shown to increase the likelihood of ACS regardless. Examination by CCTA has been established for the evaluation of coronary arteriosclerotic plaques. For patients with uncertain need for invasive treatment, non-invasive prediction of MACCE is beneficial and feasible in CCTA, which provides an overall estimate of disease burden and risk of future events. Will.
頸動脈疾患の有病率とCADは密接に関連している。頸動脈動脈硬化症は、既存のCADを有さない患者でも、MACCEの独立した予測要因であることが示されている。このような所見は、両方の状態で共有される共通の基礎となる病因を示唆しており、このことは動脈硬化症の多民族的研究(MESA)によってさらに裏付けられている。動脈硬化症は、コレステロールに富む脂質の蓄積および炎症反応の結果として、動脈壁の病巣の進展を通じて進行性に発展する。これらの変化は、冠動脈、頸動脈、大動脈、および末梢動脈で類似している(同一ではない場合でも)。脂質が豊富な内容物を有する大きな動脈硬化性コア、薄いキャップ、外向きのリモデリング、マクロファージおよびリンパ球によるプラークへの浸潤、ならびに媒体の菲薄化などの特定のプラーク特性は、脆弱性および破裂の素因となる。 The prevalence of carotid artery disease and CAD are closely related. Carotid arteriosclerosis has been shown to be an independent predictor of MACCE, even in patients without existing CAD. Such findings suggest a common underlying pathogenesis shared by both conditions, which is further supported by the Multiethnic Study of Arteriosclerosis (MESA). Arteriosclerosis develops progressively through the development of lesions in the arterial wall as a result of the accumulation of cholesterol-rich lipids and the inflammatory response. These changes are similar (if not identical) in the coronary, carotid, aorta, and peripheral arteries. Certain plaque properties such as large arteriosclerotic cores with lipid-rich contents, thin caps, outward remodeling, infiltration of plaques by macrophages and lymphocytes, and media thinning are fragile and ruptured. It becomes a predisposition to.
e.HRPおよび/またはFFRの非侵襲的決定:
CCTAを使用した狭窄の機能的重要性の非侵襲的評価は、臨床的および経済的に関心が高い。病巣または血管の外形または解剖学的構造と、壁および/または壁中のプラークを含む組織の特性または組成との組み合わせは、プラーク形態と総称され、リスクの高いまたはリスクの低いプラーク(HRP)、ならびにまたは正常および異常な血流予備量比(FFR)の直交的な考慮により、病巣の結果を説明することができる。大きな壊死性コアを伴う病巣は、プラーク形成中の外向きのリモデリングに起因して動的狭窄を発症し、その結果、より多くの組織が伸張し、組織が硬くなるか、または平滑筋層がすでにグラゴフ現象の限界まで伸張し、その後病巣が内腔自体を侵食することがある。同様に、炎症性傷害および/または酸化ストレスは、局所的な内皮機能障害をもたらし、血管拡張能力の低下として顕在化する可能性がある。e. Non-invasive determination of HRP and / or FFR:
Non-invasive assessment of the functional importance of stenosis using CCTA is of clinical and economic interest. The combination of the contour or anatomical structure of the lesion or blood vessel with the properties or composition of the wall and / or tissue containing plaque in the wall is collectively referred to as plaque morphology, high-risk or low-risk plaque (HRP), Orthogonal consideration of normal and abnormal blood flow reserve ratios (FFRs) can also explain the outcome of the lesion. A lesion with a large necrotic core develops dynamic stenosis due to outward remodeling during plaque formation, resulting in more tissue stretching, tissue stiffening, or smooth muscle layer. Has already extended to the limits of the Gragov phenomenon, after which the lesions may erode the lumen itself. Similarly, inflammatory injury and / or oxidative stress can result in local endothelial dysfunction, manifested as diminished vasodilatory capacity.
プラークを構成する組織が壊死性コアに組織化されていないマトリックスまたは「脂肪筋」である場合、プラークは需要に追いつくために十分に拡張する。ただし、プラークがより実質的な壊死性コアを有している場合、それは拡張することができない。血液の供給は需要に追いつくことができなくなる。プラーク形態は、LRNC、石灰化、出血、および潰瘍化などの複雑な要因を、中間測定の客観的検証がないことに起因して他のアプローチではできない方法で、基礎となる情報を検証するために使用できる客観的事実で評価することによって精度を向上させる。 If the tissue that makes up the plaque is a matrix or "adipose muscle" that is not organized into a necrotic core, the plaque expands sufficiently to keep up with demand. However, if the plaque has a more substantial necrotic core, it cannot expand. The blood supply will not be able to keep up with the demand. Plaque morphology validates complex factors such as LRNC, calcification, bleeding, and ulceration in a way that cannot be done by other approaches due to the lack of objective validation of intermediate measurements. Improve accuracy by assessing with objective facts that can be used for.
しかし、プラークができることはそれだけではない。プラークが破裂して突然血栓を引き起こし、次いでそれが心臓または脳組織の梗塞を引き起こすことがあまりにも多い。プラーク形態はまた、これらの高リスクのプラークを識別および定量化する。例えば、プラーク形態を使用して、壊死性コアが内腔にどれだけ近いかを決定できる。これは、梗塞リスクの重要な決定要因である。病巣がストレス下での流れを制限するかどうかを知ることは、破裂のリスクを示すものではなく、その逆も同様である。客観的に検証されたプラーク形態を伴わない計算流体力学(CFD)などの他の方法では、流れの制限をシミュレートできても、梗塞のリスクはシミュレートできない。プラーク形態の基本的な利点は、その精度が血管構造と組織特性との両方の決定にあり、一緒に表現型の決定を可能にすることである。 But that's not the only plaque that can be created. Too often, the plaque ruptures and suddenly causes a blood clot, which in turn causes an infarction of the heart or brain tissue. Plaque morphology also identifies and quantifies these high-risk plaques. For example, plaque morphology can be used to determine how close the necrotic core is to the lumen. This is an important determinant of infarct risk. Knowing whether a lesion restricts flow under stress does not indicate a risk of rupture, and vice versa. Other methods, such as computational fluid dynamics (CFD) without objectively validated plaque morphology, can simulate flow limitation but not the risk of infarction. The fundamental advantage of plaque morphology lies in its accuracy in determining both vascular structure and tissue properties, which together allow phenotypic determination.
血流予備量比の評価が異なる患者の最適な管理に関して利用可能な臨床ガイドラインがますます増えている。高リスクの特徴(大きな壊死性コアおよび薄いキャップ)を伴う閉塞性病巣は、将来の事象の最大の可能性を予見することが知られており、重要なことに、その逆も当てはまることである。 Increasingly, clinical guidelines are available for optimal management of patients with different assessments of blood reserve ratios. Obstructive lesions with high-risk features (large necrotic core and thin cap) are known to foresee the greatest potential for future events and, importantly, vice versa. ..
プラーク形態を正確に評価することなく、CFDを使用してFFRを決定するアプローチが公開されている。しかし、CFDベースの血流予備量比は、心周期の異なる部分で内腔のみ、またはせいぜい内腔表面がどのように変化するかを考慮している。せいぜい内腔表面のみを考慮すると、収縮期と拡張期との両方を処理して動きベクトルを取得する必要がある(これはほとんどの利用可能な方法では行われない)が、これらの分析は実際のストレスを測定するのではなく、ストレス下で何が起こるかをコンピュータでシミュレーションして行われ、血管拡張能力の起源となる実際の特性ではなく、血流路だけに基づいているため、それでもストレス時に何が起こるかを考慮していない。いくつかの方法では、力をシミュレートして生体力学的モデルを適用しようとするが、壁組織の検証された測定値ではなく、想定を使用している。その結果、これらの方法には、ストレスが実際に初歩的な想定を超えて破裂を引き起こした場合に何が起こり得るかを予測する能力がない。むしろ、組織を特徴付けることはこれらの問題を解決する。壁の膨張性に起因する血管の血管拡張能力への影響を含む壁の特性は、病巣の構成が柔軟性およびエネルギー吸収を決定し、安定した病巣が依然として過剰に治療され、MACCEリスクの評価が不完全であるという点で優れていると考えられる。形態を使用してFFRを評価することの利点には、形態が先行指標であり、FFRが遅れていること、およびHRPの存在および程度が境界の被験者の治療に役立つという事実が含まれる。形態による正確な評価を解決することの重要性は、形態がFFRを予測できるが、FFRは形態学を予測しないことを示す研究が増えていることによって強化されている。つまり、効果的に評価された形態は、FFRを決定する能力だけでなく、患者を虚血から梗塞またはHRPに移動させるプラークの不連続な変化の可能性も有している。 An approach to determine FFR using CFD without accurately assessing plaque morphology has been published. However, the CFD-based blood flow reserve ratio takes into account how the lumen alone, or at best, the lumen surface changes at different parts of the cardiac cycle. Considering only the luminal surface at best, it is necessary to process both systole and diastole to obtain motion vectors (this is not done by most available methods), but these analyzes are in fact Rather than measuring stress, it is done by computer simulation of what happens under stress and is still stressed because it is based solely on the blood flow path, not the actual properties that give rise to vasodilatory capacity. It doesn't consider what happens at times. Some methods attempt to simulate forces and apply biomechanical models, but use assumptions rather than validated measurements of wall tissue. As a result, these methods lack the ability to predict what could happen if stress actually caused a rupture beyond rudimentary assumptions. Rather, characterizing the tissue solves these problems. Wall properties, including the effect of swelling of the wall on the vasodilatory capacity of blood vessels, indicate that lesion composition determines flexibility and energy absorption, stable lesions are still overtreated, and MACCE risk assessment It is considered superior in that it is incomplete. Advantages of assessing FFR using morphology include the fact that morphology is a leading indicator, FFR is delayed, and the presence and extent of HRP is useful in treating borderline subjects. The importance of resolving accurate morphological assessments is enhanced by the growing number of studies showing that morphology can predict FFR, but FFR does not. That is, the effectively evaluated morphology has not only the ability to determine FFR, but also the potential for discontinuous changes in plaque that move the patient from ischemia to infarction or HRP.
階層的分析フレームワークを利用して、イメージングデータから生物学的性状/分析物を識別および定量化し、次に、定量化された生物学的性状/分析物に基づいて1つ以上の病状を識別および特徴付けるシステムおよび方法が本明細書で提供される。いくつかの実施形態では、システムおよび方法は、コンピュータ化された画像分析およびデータ融合アルゴリズムを患者の臨床化学および血液バイオマーカーデータとともに組み込み、疾患の異なるサブタイプを区別するために使用できる多要因パネルを提供する。したがって、本開示のシステムおよび方法は、有利には、生物学的および臨床的洞察を高度な計算モデルに実装することができる。これらのモデルは、病因の理解度の高まりに関連付けられた要因を特定する豊富なオントロジーを介して洗練された画像処理と連携することができ、何が測定されているか、それがどのように測定および評価されているか、そしてそれが検証される可能性がある疾患の臨床的に関連するサブタイプおよび病期とどのように関連しているかの厳密な定義の形を取る。 A hierarchical analysis framework is used to identify and quantify biological properties / analyzes from imaging data, and then identify one or more pathologies based on the quantified biological properties / analyzes. And the systems and methods of characterizing are provided herein. In some embodiments, systems and methods incorporate computerized image analysis and data fusion algorithms with patient clinical chemistry and blood biomarker data and can be used to distinguish between different subtypes of disease. I will provide a. Therefore, the systems and methods of the present disclosure can advantageously implement biological and clinical insights into advanced computational models. These models can work with sophisticated image processing through a wealth of ontologies that identify factors associated with increased understanding of pathogenesis, what is being measured and how it is being measured. And take the form of a rigorous definition of what is being evaluated and how it is associated with the clinically relevant subtypes and stages of the disease for which it may be validated.
人間の疾患は強い表現型の違いを示し、この違いは、イメージングによって測定可能な空間的、時間的、およびスペクトルの結果を捕捉するが単独では理解することが難しい、抽出された特徴に洗練された分類器を適用することによって理解することができる。従来のコンピュータ支援診断は、画像の特徴から単一ステップで推論を行う。対照的に、本開示のシステムおよび方法は、形態、組成および構造の生物学的に客観的な成分の複数のレベルで、空間的に分解された画像特徴、および時間的に分解された動力学を決定する中間ステップ(これらは、その後、臨床的な推論を導くために利用される)を含む階層的な推論スキームを使用している。階層的推論スキームは、有利には、臨床的推論が階層の各レベルで理解、検証、および説明されることを保証する。 Human disorders show strong phenotypic differences, refined into extracted features that capture spatial, temporal, and spectral results that can be measured by imaging but are difficult to understand on their own. It can be understood by applying the classifier. Conventional computer-aided diagnosis makes inferences from image features in a single step. In contrast, the systems and methods of the present disclosure include spatially decomposed image features and temporally decomposed kinetics at multiple levels of biologically objective components of morphology, composition and structure. It uses a hierarchical reasoning scheme that includes intermediate steps to determine (these are then used to guide clinical reasoning). Hierarchical reasoning schemes advantageously ensure that clinical reasoning is understood, validated, and explained at each level of the hierarchy.
したがって、例示的な実施形態では、本開示のシステムおよび方法は、イメージングとは独立した事実標準に対して客観的に検証することができる生物学的性状を測定する第1のレベルのアルゴリズムから構成される階層分析フレームワークを利用し、次いで、測定された生物学的性状に基づいて医学的または臨床的状態を決定するための第2のセットのアルゴリズムを利用する。このフレームワークは、「および/または」の様式で、すなわち、単独でまたは組み合わせて、いくつかの異なる生物学的性状に適用可能であり、これらの生物学的特性は例として、血管新生、新生血管化、炎症、石灰化、脂質沈着、壊死、出血、硬直、密度、狭窄、拡張、再モデリング比、潰瘍化、(例えば、チャネル内の血液の)流れ、(例えば、チャネル内の血液の、またはある組織が別の組織に押し付けられる)圧力、細胞タイプ(例えば、マクロファージ)、(例えば、平滑筋細胞の)細胞整列、または(例えば、チャネル内の血液の)せん断応力、キャップ厚さ、および/または蛇行(例えば、入口角および出口角)などである。これらの各々の測定値は、性状の量および/または程度および/または特徴などで測定することができる。状態の例としては、(例えば、限定されたものとして)(例えば、脳または心臓組織の)灌流/虚血、(完全に切断されたものとして)(例えば、脳または心臓組織の)灌流/梗塞、酸素化、代謝、血流予備量比(灌流する能力)、悪性腫瘍、侵襲、および/またはリスク層別化(事象の確率、または事象までの時間(TTE)として)、例えば、重大心臓脳血管有害事象(MACCE)が挙げられる。事実の根拠としては、例えば、生検、切除組織からの専門家の組織注釈(例えば、動脈内切除または剖検)、切除組織に関する専門家の表現型注釈(例えば、動脈内切除または剖検)、物理的圧力線、他のイメージング法、生理学的モニタリング(例えば、ECG、SaO2など)、ゲノムおよび/もしくはプロテオミクスおよび/もしくはメタボロミクスおよび/もしくはトランスクリプトミクスアッセイ、ならびに/または臨床転帰が挙げられる。これらの性状および/または状態は、所与の時点で評価されてもよく、および/または経時的(縦断的)に変化してもよい。 Thus, in exemplary embodiments, the systems and methods of the present disclosure consist of first-level algorithms for measuring biological properties that can be objectively verified against imaging-independent fact standards. It utilizes a hierarchical analysis framework that is followed by a second set of algorithms for determining medical or clinical conditions based on measured biological properties. This framework is applicable in a "and / or" fashion, i.e., alone or in combination, to several different biological properties, these biological properties being, for example, angiogenesis, neoplasia. Vascularization, inflammation, calcification, lipid deposition, necrosis, bleeding, rigidity, density, stenosis, dilation, remodeling ratio, ulceration, flow (eg, of blood in the channel), (eg, of blood in the channel, Or pressure, cell type (eg, macrophages), cell alignment (eg, smooth muscle cells), or shear stress (eg, blood in a channel), cap thickness, and cap thickness, and one tissue is pressed against another. / Or meandering (eg, entrance and exit angles). Each of these measurements can be measured in terms of quantity and / or degree and / or characteristics of the property. Examples of conditions are perfusion / ischemia (eg, as limited) (eg, brain or heart tissue), perfusion / infarction (eg, as completely severed) (eg, brain or heart tissue). , Oxygenation, metabolism, blood flow reserve ratio (ability to perfuse), malignant tumor, invasiveness, and / or risk stratification (as event probability or time to event (TTE)), eg, critical cardiac brain Adverse vascular events (MACCE) can be mentioned. The rationale for the facts is, for example, biopsy, expert tissue commentary from excised tissue (eg, intra-arterial resection or autopsy), expert phenotypic commentary on excised tissue (eg, intra-arterial resection or autopsy), physiology. Target pressure lines, other imaging methods, physiological monitoring (eg, ECG, SaO2, etc.), genomic and / or proteomics and / or metabolomics and / or transcriptomics assays, and / or clinical outcomes. These properties and / or conditions may be assessed at a given point in time and / or may change over time (longitudinal).
例示的な実施形態では、本出願のシステムおよび方法は、有利には、疾患のコンピュータ支援表現型(CAP)に関連する。CAPは、コンピュータ支援診断(CAD)の分野を補完する新しい刺激的なものである。本明細書に開示されるように、CAPは、コンピュータ化された画像分析およびデータ融合アルゴリズムを組み込んだ階層的推論を患者の臨床化学および血液バイオマーカーデータに適用して、異なる治療を受けるであろう疾患の異なるサブタイプを区別するために使用され得る多要因パネルまたは測定値の「プロファイル」を提供してもよい。したがって、CAPは、堅牢な特徴抽出、データ統合、およびスケーラブルな計算戦略への新しいアプローチを実装して、臨床意思決定支援を実装する。例えば、時空間テクスチャ(SpTeT)メソッドは、組織を空間的および速度論的に特徴付けるための関連する統計的特徴を捕捉する。空間的特徴は、例えば、細胞外マトリックス繊維、壊死組織、および/または炎症細胞と混合された脂質の特徴的なパターンにマッピングされる。速度論的特徴は、例えば、内皮透過性、血管新生、壊死、および/またはコラーゲン分解にマッピングされる。 In exemplary embodiments, the systems and methods of the present application are advantageously associated with a computer-aided phenotype (CAP) of the disease. CAP is a new and exciting complement to the field of computer-aided diagnosis (CAD). As disclosed herein, CAP will receive different treatments by applying hierarchical inference incorporating computerized image analysis and data fusion algorithms to patient clinical chemistry and blood biomarker data. A multifactorial panel or measurement "profile" that can be used to distinguish between different subtypes of fistula may be provided. Therefore, CAP implements new approaches to robust feature extraction, data integration, and scalable computational strategies to implement clinical decision support. For example, the spatiotemporal texture (SpTeT) method captures relevant statistical features for spatially and kineticly characterizing tissue. Spatial features are mapped, for example, to characteristic patterns of lipids mixed with extracellular matrix fibers, necrotic tissue, and / or inflammatory cells. Kinetic features are mapped, for example, to endothelial permeability, angiogenesis, necrosis, and / or collagen degradation.
画像特徴から機械分類の単一ステップで臨床的推論を行う現在のCADアプローチとは対照的に、主題の適用のシステムおよび方法は、有利には、空間的に分解された画像特徴だけでなく、中間の形態および構造組成の生物学的に客観的な成分の複数のレベルで時間的に分解された動態から始まり、そして最後に臨床的推論を行う階層的な推論スキームを適用することができる。この結果、最下部の低レベルの画像特徴から最上部の生物学的および臨床的特徴まで、階層の各レベルで理解、検証、および説明できるシステムが実現する。 In contrast to current CAD approaches, which make clinical inferences from image features in a single step of machine classification, the systems and methods of subject application favorably include not only spatially decomposed image features, but also spatially decomposed image features. Hierarchical reasoning schemes can be applied, starting with temporally degraded dynamics at multiple levels of biologically objective components of intermediate morphology and structural composition, and finally making clinical reasoning. The result is a system that can be understood, validated, and explained at each level of the hierarchy, from low-level image features at the bottom to biological and clinical features at the top.
本開示のシステムおよび方法は、表現型分類と転帰予測との両方を改善する。表現型分類は、一方では個々の解剖学的位置と、他方ではより一般的に説明されている身体部位との2つのレベルで発生し得る。前者の入力データは2Dデータセットであり得、後者の入力データは3Dデータセットであり得る。表現型分類では、客観的事実はどちらのレベルでもよいのに対し、転帰予測/リスク層別化では、一般的に患者レベルで起こるが、特定の例(例えば、脳卒中の症状がどちらの側に現れたかなど)ではより具体的になる可能性がある。ここでの意味は、同じ入力データを両方の目的に使用できるということであるが、入力データが使用されるレベルおよび事実の注釈の基礎により、モデルは大幅に異なるということである。 The systems and methods of the present disclosure improve both phenotypic classification and outcome prediction. Phenotypic classification can occur at two levels: on the one hand individual anatomical positions and on the other hand the more commonly described body parts. The input data of the former can be a 2D data set, and the input data of the latter can be a 3D data set. In phenotypic classification, objective facts can be at either level, whereas outcome prediction / risk stratification generally occurs at the patient level, but in certain cases (eg, on which side the symptoms of stroke are). It may be more specific (such as whether it appeared). The implication here is that the same input data can be used for both purposes, but the models differ significantly depending on the level at which the input data is used and the basis of factual annotation.
入力データとしてモデル構築の読み取り値ベクトルを実施することは可能であるが、性能は、実装された測定値によって制限されることが多い。主題の適用は、性能を改善するために、独特の測定値(例えば、キャップの厚さ、カルシウムの深さ、および潰瘍形成)を有利に利用する。したがって、読み取り値ベクトルのみのアプローチは、ベクトルがこれらの測定値を含む場合に、(例えば、従来の測定値と組み合わせて)適用できる。しかしながら、本開示のシステムおよび方法は、深層学習(DL)アプローチを有利に利用することができるが、それはさらに豊富なデータセットを提供することができる。主題の適用のシステムおよび方法はまた、教師なし学習適用を有利に利用することができ、それによりデータ領域全体でより優れたスケーラビリティ(新しい生物医学データが生成されるペースを念頭に置いた非常に望ましい機能)を提供する。 Although it is possible to implement model building reading vectors as input data, performance is often limited by the measured values implemented. Subject applications take advantage of unique measurements (eg, cap thickness, calcium depth, and ulceration) to improve performance. Therefore, the read vector-only approach can be applied (eg, in combination with conventional measurements) when the vector contains these measurements. However, while the systems and methods of the present disclosure can take advantage of the deep learning (DL) approach, it can provide a richer data set. The subject application systems and methods can also take advantage of unsupervised learning applications, resulting in greater scalability across the data domain (very much in mind at the pace at which new biomedical data is generated). It provides the desired function).
本明細書に提示される例示的な実施形態では、畳み込みニューラルネットワーク(CNN)を利用して、微調整アプローチを伴う転移学習として特徴付けることができるアプローチで分類器を構築することができる。強力な計算プラットフォーム上のイメージングデータの大規模な大要で訓練されたCNNを使用して、ネットワーク訓練で注釈付けされていない画像を分類することができる。このことは、多くの一般的なクラスの特徴は、非常に異なるオブジェクト(つまり、形状、境界、空間の向きなど)の画像を識別するのに役立つため、直感的に理解できる。その場合、数千万の画像の事前に注釈付けされたデータセットを使用して数千の異なるオブジェクトを認識するように訓練されたCNNは、基本的な画像認識タスクを偶然よりもはるかにうまくこなすことができ、最後の分類層(「ソフトマックス層と呼ばれることもある)を比較的わずかに微調整すれば、ゼロから訓練されたCNNと同等の性能を発揮することが考えられる。これらのモデルは非常に大きく、事前に注釈付けされた膨大な数の画像で訓練されているため、非常に特徴的で識別力のあるイメージング特徴を「学習する」傾向がある。したがって、畳み込み層を特徴抽出器として使用するか、またはすでに訓練された畳み込み層を微調整して、目前の問題に適合させることができる。前者のアプローチは転移学習と呼ばれ、後者は微調整と呼ばれる。 In the exemplary embodiments presented herein, a convolutional neural network (CNN) can be utilized to construct a classifier with an approach that can be characterized as transfer learning with a fine-tuning approach. CNNs trained in large summaries of imaging data on powerful computational platforms can be used to classify unannotated images in network training. This is intuitive because many common class features help identify images of very different objects (ie, shapes, boundaries, spatial orientation, etc.). In that case, CNNs trained to recognize thousands of different objects using pre-annotated datasets of tens of millions of images perform basic image recognition tasks much better than chance. It can be done, and with relatively slight tweaking of the last classification layer (sometimes called the "softmax layer"), it is possible that it will perform as well as a CNN trained from scratch. Because the model is so large and trained with a huge number of pre-annotated images, it tends to "learn" very distinctive and discriminative imaging features. Therefore, the convolutional layer can be used as a feature extractor or the already trained convolutional layer can be fine-tuned to fit the problem at hand. The former approach is called transfer learning and the latter is called fine-tuning.
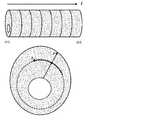
CNNは、様々なコンピュータビジョンタスクの実施に優れている。ただし、CNNはいくつかの欠点を有する。医療システムにとって重要な2つの重要な欠点は、1)膨大な訓練および検証データセットが必要であること、ならびに2)中間CNN計算がいかなる測定可能な性状も表現していないことである(根拠が説明されていない「ブラックボックス」であると批判されることがある)。本明細書に開示されるアプローチは、有利には、生の画像だけではなく、これらから始まる畳み込みニューラルネットワークに続く、生物学的に測定可能で独立した検証が可能な1つ以上の段階から構成されるパイプラインを利用してもよい。さらに、例えば、ネットワークに供給する前に、ドーナツ型の血管断面をアンラップして正規化された座標系を有する長方形の表現にするなど、目前の問題とは関係のない変動を低減するために特定の変換が適用されてもよい。これらのフロントエンドパイプライン段階は、医用イメージングにCNNを使用することの2つの欠点の両方を同時に軽減する。 CNNs excel at performing various computer vision tasks. However, CNN has some drawbacks. Two important drawbacks to the medical system are 1) the need for a large training and validation data set, and 2) the intermediate CNN calculation does not represent any measurable properties (foundation). It may be criticized as an unexplained "black box"). The approach disclosed herein advantageously consists of not only raw images, but also one or more stages that are biologically measurable and independently verifiable, following a convolutional neural network that begins with them. You may use the pipeline that is generated. Further identified to reduce unrelated fluctuations, such as unwrapping a donut-shaped vessel cross section into a rectangular representation with a normalized coordinate system before feeding to the network. The transformation of may be applied. These front-end pipeline stages simultaneously alleviate both of the two drawbacks of using CNN for medical imaging.
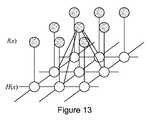
一般に、初期の畳み込み層は特異性を高める特徴抽出器として機能し、完全に接続された1つまたは2つの最後の層は分類器として機能する(例えば、「ソフトマックス層」)。典型的なCNNでの層の順序とその機能の概略的な表現は、多くの情報源から入手可能である。 In general, the initial convolutional layer acts as a feature extractor that enhances specificity, and one or two last layers that are fully connected act as a classifier (eg, "softmax layer"). A schematic representation of the order of layers and their function in a typical CNN is available from many sources.
有利には、本開示のシステムおよび方法は、補強されたデータセットを利用して、放射線データセットによってアッセイされた組織の非侵襲的表現型決定を可能にする。補強の1つのタイプは、データを前処理して組織分類を実施し、「偽色」オーバーレイを使用して、客観的に検証できるデータセットを提供することである(この可能性を有さない生の画像のみを使用するのとは対照的である)。別のタイプの補強は、座標系上の変換を使用して、分類精度を改善させるか、より小さいトレーニングセットを可能にするか、またはその両方を行うために、ノイズの変動を除去しながら、生物学的に実現可能な空間的コンテキストを強調することである。 Advantageously, the systems and methods of the present disclosure utilize augmented datasets to allow non-invasive phenotyping of tissues assayed by radiation datasets. One type of reinforcement is to preprocess the data, perform tissue classification, and use "false color" overlays to provide a dataset that can be objectively validated (without this possibility). In contrast to using only raw images). Another type of reinforcement uses transformations on the coordinate system to improve classification accuracy, allow smaller training sets, or both, while removing noise fluctuations. To emphasize the biologically feasible spatial context.
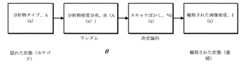
例示的な実施形態では、主題の適用のシステムおよび方法は、以下の多段階パイプラインを使用することができる:(i)関心領域を識別および分類するためのセマンティックセグメンテーション(例えば、定量的な生物学的分析物を表現し得る)(ii)管状構造(例えば、静脈/動脈断面)の断面を長方形に変換するための空間的アンラップ、ならびに(iii)注釈付けされた長方形を読み取り、どの表現型(例えば、安定もしくは不安定プラークおよび/または正常もしくは異常なFFR)に関連しているか、および/または事象までの予測時間(TTE)を識別するための訓練されたCNNの適用。アンラップされたデータセット(アンラップを伴う)とドーナツデータセット(アンラップを伴わない)を使用してCNNを訓練およびテストすることによって、アンラップが各特定の実施形態の検証精度を改善させることが実証されることに留意されたい。したがって、管状構造(例えば、プラーク表現型決定)または他の構造(例えば、肺癌腫瘤部分型解析)の様々な実装イメージング、または他の適用は、同様に、同様のステップ(例えば、セマンティックセグメンテーションに続いて、アンラップなどの空間変換を行うこと(CNNを適用する前に))を実施することから利益を得ることができる。しかしながら、いくつかの代替の実施形態では、変換されていないデータセット(例えば、空間的にアンラップされていないデータセット)が表現型を決定する際に、(例えば、変換されていないデータセットと組み合わせて、またはこれとは独立して)使用され得ることが企図される。 In exemplary embodiments, the subject application system and method can use the following multi-step pipeline: (i) Semantic segmentation for identifying and classifying regions of interest (eg, quantitative organisms). (Iii) Spatial unwrapping to convert cross-sections of tubular structures (eg, venous / arterial cross-sections) into rectangles, and (iii) reading annotated rectangles, which phenotype Application of trained CNNs to identify predicted time to event (eg, stable or vulnerable plaque and / or normal or abnormal FFR) and / or event. By training and testing CNNs using unwrapped datasets (with unwrapped) and donut datasets (without unwrapped), it has been demonstrated that unwrapped improves the validation accuracy of each particular embodiment. Please note that. Therefore, various implementation imaging, or other applications of tubular structures (eg, plaque phenotyping) or other structures (eg, lung cancer mass partial typology), likewise follow similar steps (eg, semantic segmentation). Therefore, it is possible to benefit from performing spatial transformations such as unwrapping (before applying CNN). However, in some alternative embodiments, the untransformed dataset (eg, the spatially unwrapped dataset) is combined with the untransformed dataset in determining the phenotype (eg, in combination with the untransformed dataset). It is intended that it can be used (or independently).
例示的な実施形態では、セマンティックセグメンテーションおよび空間変換は、以下を含み得る:画像体積は、表現型決定されるべき生理学的標的を含む関心領域を形成するために、標的の初期化、正規化、およびぼけ除去または復元などの他の任意の所望の前処理を含めて前処理されてもよい。特に、当該関心領域は、その体積を通る断面から構成された体積であってもよい。自動的に決定されてもよいし、ユーザによって明示的に提供されてもよい身体部位である。本質的に管状である身体部位の標的は、中心線を伴ってもよい。中心線は、存在する場合、分岐し得る。分岐には、自動的に、またはユーザによってラベル付けされてもよい。中心線の概念に関する一般化は、管状ではないが、いくつかの構造的指向性、例えば腫瘍の領域によって利益を得る解剖学的構造について表され得ることに留意されたい。いずれの場合も、体積内の断面ごとに重心を決定することができる。管状構造の場合、重心はチャネルの中心、例えば血管の内腔であってもよい。病巣の場合、重心は腫瘍の重心である可能性がある。(任意選択でぼけ除去または復元された)画像は、直交データセットで表現することができ、ここで、xは重心からの距離を表現し、yは回転シータを表現し、zは断面を表現する。このような直交セットは、分岐または領域につき1つ形成されることになる。複数のセットが使用される場合、「ヌル」値が重なり合う領域に使用される場合があり、つまり、各物理ボクセルは、幾何学的に互いに適合するような方法で、セット全体で1回だけ表されてもよい。各データセットは、客観的に検証可能な組織組成によってラベル付けされたサブ領域を有する追加のデータセットとペアにすることができる。血管組織のラベルの例としては、内腔、石灰化、LRNC、IPHなどを挙げることができる。病巣のラベルの例としては、壊死性、新生血管化などを挙げることができる。これらのラベルは、客観的に、例えば組織学などによって検証することができる。ペアのデータセットは、畳み込みニューラルネットワークを構築するための訓練ステップへの入力として使用されてもよいできる。例示的な実施形態では、2つのレベルの分析をサポートすることができ、1つ目は個々の断面レベルで、2つ目は体積レベルである。出力ラベルは、表現型またはリスク層別化を表現する。 In an exemplary embodiment, semantic segmentation and spatial transformation may include: image volume initialization, normalization, target initialization, normalization, to form a region of interest containing the physiological target to be phenotyped. And may be pretreated including any other desired pretreatment such as deblurring or restoration. In particular, the region of interest may be a volume composed of cross sections that pass through that volume. A body part that may be determined automatically or explicitly provided by the user. Targets of body parts that are tubular in nature may be accompanied by a centerline. The centerline, if present, can diverge. The branch may be labeled automatically or by the user. It should be noted that generalizations regarding the concept of centerlines can be expressed for some structural orientations, such as anatomical structures that benefit from the area of the tumor, although they are not tubular. In either case, the center of gravity can be determined for each cross section within the volume. For tubular structures, the center of gravity may be the center of the channel, eg the lumen of a blood vessel. In the case of a lesion, the center of gravity may be the center of gravity of the tumor. The image (optionally deblurred or restored) can be represented by an orthogonal dataset, where x represents the distance from the center of gravity, y represents the rotating theta, and z represents the cross section. do. One such orthogonal set will be formed per branch or region. If multiple sets are used, they may be used in areas where "null" values overlap, that is, each physical voxel is tabulated only once throughout the set in such a way that they are geometrically compatible with each other. May be done. Each dataset can be paired with an additional dataset that has subregions labeled with an objectively verifiable tissue composition. Examples of labels for vascular tissue include lumen, calcification, LRNC, IPH and the like. Examples of lesion labels include necrosis, neovascularization and the like. These labels can be verified objectively, for example by histology. The paired dataset may be used as input to a training step to build a convolutional neural network. In an exemplary embodiment, two levels of analysis can be supported, the first at the individual cross-section level and the second at the volume level. The output label represents a phenotype or risk stratification.
例示的な画像前処理は、例えば、画像形成プロセスから生じるアーチファクトまたは画像制限を軽減するための患者固有の点広がり決定アルゴリズムを使用したぼけ除去または復元を含んでもよい。これらのアーティファクトおよび画像制限により、表現型を予測する特性を決定する能力が低下する可能性がある。ぼけ除去または復元は、例えば、画像の異なる領域の真の潜在密度についての想定を正規化して、スキャナ点広がり関数の物理モデルを反復的にフィッティングすることの結果として達成されてもよい。 An exemplary image pretreatment may include, for example, deblurring or restoration using a patient-specific point spread determination algorithm to reduce artifacts or image limitations resulting from the image formation process. These artifacts and image limitations can reduce the ability to determine phenotypic predictive properties. Blurring or restoration may be achieved, for example, as a result of iterative fitting of the physical model of the scanner point spread function, normalizing assumptions about the true potential density of different regions of the image.
例示的な実施形態では、CNNは、AlexNet、Inception、CaffeNet、または他のネットワークであってもよい。いくつかの実施形態では、例えば、同じ数およびタイプの層が使用されるが、入力および出力の寸法が変更される(アスペクト比を変更するなど)場合、CNNに対してリファクタリングを行うことができる。様々な例示的なCNNの例示的な実装は、例えば、TensorFlowでオープンソースとして提供され、かつ/またはオープンソースおよび/もしくはライセンスされた構成として利用可能な他のフレームワークで提供される。 In an exemplary embodiment, the CNN may be AlexNet, Inception, CafeNet, or other network. In some embodiments, for example, layers of the same number and type are used, but if the input and output dimensions are changed (such as changing the aspect ratio), refactoring can be done for the CNN. .. Illustrative implementations of various exemplary CNNs are provided, for example, in TensorFlow as open source and / or in other frameworks available as open source and / or licensed configurations.
例示的な実施形態では、データセットは増強されてもよい。例えば、いくつかの実施形態では、2Dまたは3D回転がデータセットに適用されてもよい。したがって、変換されていない(例えば、ドーナツ)データセットの場合、増強は、例えば、データセットをランダムに(例えば、0〜360度のランダムな角度によって)回転させるとともに、データセットをランダムに水平方向に反転させることを含んでもよい。同様に、変換された(例えば、アンラップされた)データセットの場合、増強は、例えば、画像のランダムな「スクロール」と関連して、0から画像の幅までの範囲のピクセルの乱数などによって、画像をランダムに水平方向に反転させることを含んでもよい(ここで、スクロールは、シータの周りを回転することに類似している)。 In an exemplary embodiment, the dataset may be augmented. For example, in some embodiments, 2D or 3D rotation may be applied to the dataset. Thus, for untransformed (eg, donut) datasets, augmentation will rotate the dataset randomly (eg, by a random angle of 0-360 degrees) and randomly horizontally the dataset. May include inversion to. Similarly, for transformed (eg, unwrapped) datasets, the augmentation is associated with, for example, a random "scroll" of the image, such as by a random number of pixels in the
例示的な実施形態では、データセットは、異なる組織分析物タイプを表現するために異なる色を使用することによって補強されてもよい。これらの色は、相互に、および非分析物表面(例えば、通常の壁)に対して視覚的に対比するように選択することができる。いくつかの実施形態では、非分析物表面は灰色で描かれ得る。例示的な実施形態では、データセット補強は、組織特性(例えば、プラーク表現型を示す組織特性)のグラウンドトゥルース注釈をもたらすだけでなく、そのような組織特性が断面(例えば、血管の軸に直交して取られる)でどのように存在するかの空間的コンテキストを提供してもよい。このような空間的コンテキストは、組織学的断面に関連するデータセットの分析のための共通の基礎を提供する(例えば、断面の重心に関連する極座標に基づく)座標系を含んでもよい。したがって、補強されたデータセットは、色分けされた病理医の注釈の上に有利にオーバーレイされてもよい(またはその逆であってもよい)。有利には、組織学に基づく注釈付けされたデータセットは、放射線データセットの画像特徴分析と組み合わせて、またはこれとは独立して、訓練(例えば、CNNの訓練)に使用することができる。特に、組織学に基づく注釈付けされたデータセットは、空間的コンテキストを失うことなく、高解像度のフル画像の代わりに比較的単純な偽色画像を使用するので、DLアプローチの効率を改善させる可能性がある。例示的な実施形態では、座標方向は、単位フェーザおよびフェーザ角度を使用して内部的に表現することができる。いくつかの実施形態では、座標系は、例えば、壁の厚さに関して半径方向の座標を正規化することによって正規化され得る(異なる直径/厚さの管状構造/断面を比較するための共通の基礎を提供するためなど)。例えば、正規化された半径方向の距離は、内側(内壁の内腔境界)で値0を有し、外側の境界(外壁境界)で値1を有する。特に、これは、血管または他の病態生理学(例えば、消化管)に関連する管状構造に適用されてもよい。 In an exemplary embodiment, the dataset may be reinforced by using different colors to represent different tissue analyte types. These colors can be selected to visually contrast with each other and against the surface of the non-analyte (eg, a normal wall). In some embodiments, the non-analyte surface may be painted gray. In an exemplary embodiment, dataset reinforcement not only provides a ground truth annotation of tissue properties (eg, tissue properties exhibiting plaque phenotype), but such tissue properties are orthogonal to the cross section (eg, the axis of the blood vessel). It may provide a spatial context of how it exists. Such a spatial context may include a coordinate system that provides a common basis for the analysis of datasets related to histological sections (eg, based on polar coordinates related to the centroid of the section). Therefore, the reinforced dataset may be advantageously overlaid on the color-coded pathologist's annotations (or vice versa). Advantageously, histologically annotated datasets can be used for training (eg, CNN training) in combination with or independently of the image feature analysis of radiation datasets. In particular, histologically annotated datasets can improve the efficiency of the DL approach by using relatively simple false color images instead of high resolution full images without losing spatial context. There is sex. In an exemplary embodiment, the coordinate orientation can be represented internally using the unit phasor and phasor angle. In some embodiments, the coordinate system can be normalized, for example, by normalizing radial coordinates with respect to wall thickness (common for comparing tubular structures / cross sections of different diameters / thicknesses). To provide the basis, etc.). For example, the normalized radial distance has a value of 0 at the inner (luminal boundary of the inner wall) and a value of 1 at the outer boundary (outer wall boundary). In particular, it may be applied to tubular structures related to blood vessels or other pathophysiology (eg, gastrointestinal tract).
有利には、主題の適用の補強されたデータセットは、既知のグラウンドトゥルースに基づくインビボでの非侵襲的な画像に基づく分類(例えば、組織分類スキームを使用して非侵襲的に表現型を決定することができる)を提供する。いくつかの実施形態では、既知のグラウンドトゥルースは、非放射線学的であってもよい(組織学または別のエクスビボに基づく組織分析など)。したがって、例えば、エクスビボのグラウンドトゥルースデータ(組織学情報など)を含むように注釈が付けされた放射線データセットは、分類器の入力データとして有利に使用され得る。いくつかの実施形態では、複数の異なる既知のグラウンドトゥルースを、補強されたデータセットに注釈付けする際に、互いに組み合わせて、または互いに独立して使用することができる。 Advantageously, the augmented dataset of the subject application determines the phenotype non-invasively based on known ground truth-based in vivo non-invasive image-based classification (eg, using a tissue classification scheme). Can be provided). In some embodiments, the known ground truth may be non-radiological (such as histology or tissue analysis based on another Exvivo). Thus, for example, a radiation dataset annotated to include Exvivo ground truth data (such as histological information) can be advantageously used as input data for the classifier. In some embodiments, a plurality of different known ground truths can be used in combination with each other or independently of each other when annotating a reinforced dataset.
本明細書に記載されるように、いくつかの実施形態では、補強されたデータセットは、正規化された座標系を利用して、例えば、壁の厚さおよび半径方向の提示に関連付けられた、無関係な変動を回避することができる。さらに、本明細書に記載されるように、例示的な実施形態では、「ドーナツ」形状のデータセットは、例えば、(例えば、CNNを使用した)分類訓練の前に、および/またはデータセットに対して訓練分類器を実行する前に、「アンラップ」されてもよい。特に、このような実施形態では、訓練データセットの分析物注釈は、変換の前、例えば、アンラップ後、または両方の組み合わせのタイミングであってもよい。例えば、いくつかの実施形態では、変換されていないデータセットに(例えば、組織学情報などのエクスビボ分類データを使用して)注釈を付け、次にこれを分類器訓練のために変換することができる。このような実施形態では、エクスビボに基づく分類のより細かい粒度をインビボ放射線分析のより低い意図された粒度に一致させるように折り畳み、計算の複雑さを軽減するだけでなく、本来であれば「ブラックボックス」であるという批判にさらされるものに同時に対処することができる。 As described herein, in some embodiments, the reinforced dataset utilizes a normalized coordinate system and is associated with, for example, wall thickness and radial presentations. , Unrelated fluctuations can be avoided. In addition, as described herein, in exemplary embodiments, the "doughnut" shaped dataset is, for example, prior to classification training (eg, using CNN) and / or in the dataset. On the other hand, it may be "unwrapped" before running the training classifier. In particular, in such embodiments, the analyte annotation of the training dataset may be before the transformation, eg, after unwrapping, or at the timing of a combination of both. For example, in some embodiments, the untransformed dataset may be annotated (eg, using Exvivo classification data such as histological information) and then transformed for classifier training. can. In such an embodiment, the finer particle size of the ex vivo-based classification is folded to match the lower intended particle size of the in vivo radiological analysis, not only reducing the complexity of the calculation, but also essentially "black". You can deal with what is exposed to the criticism of being a "box" at the same time.
いくつかの実施形態では、注釈付けされた放射線データセットを視覚化するための色および/または軸は、エクスビボのグラウンドトゥルースに基づく分類で典型的に示されるのと同じ色/軸(例えば、組織学で使用されるのと同じ色/軸)に対応するように選択されてもよい。例示的な実施形態では、変換された補強されたデータセット(例えば、壁の厚さに対して正規化され得る)が示されてもよく、ここで、各分析物は、視覚的に、異なる対照的な色で、すべての非分析物領域に対して背景領域(例えば、黒色または灰色)に対して示されてもよい。特に、実施形態に応じて、共通の背景に注釈付けされてもされなくてもよく、したがって、血管壁の内側の非分析物領域と外側の非分析物領域との間、または背景の特徴(腔内表面の不規則性、壁の厚さの変化など)同士を視覚的に区別してもしなくてもよい。したがって、いくつかの実施形態では、(例えば、壁の厚さに対して色分けおよび正規化された)注釈付けされた分析物領域は、均一な(例えば、完全に黒色、完全に灰色、完全に白色などの)背景に対して視覚的に描かれてもよい。他の実施形態では、(例えば、色分けされているが壁の厚さに対して正規化されていない)注釈付けされた分析物領域は、注釈付けされた背景(例えば、異なる色合い(灰色、黒色、および/または白色)を使用して(i)管状構造の内腔内部の中心内腔領域、(ii)壁の内側の非分析物領域、および/または(iii)外壁の外側の領域に対して視覚的に描かれてもよい。これにより、(例えば、潰瘍形成または血栓に起因する)壁の厚さの変動の分析を可能にすることができる。さらなる例示的な実施形態では、注釈付けされたデータセットは、例えば、プラーク内出血および/または他の形態学的側面の領域の識別(および視覚化)を含んでもよい。例えば、プラーク内出血の領域は赤色で、LRNCは黄色で視覚化してもよい。 In some embodiments, the color and / or axis for visualizing the annotated radiation dataset is the same color / axis (eg, tissue) typically shown in Exvivo's ground truth-based classification. It may be selected to correspond to the same color / axis used in the study. In an exemplary embodiment, a transformed reinforced dataset (eg, which can be normalized to wall thickness) may be presented, where each analyte is visually different. Contrast colors may be shown for the background area (eg, black or gray) for all non-analyte areas. In particular, depending on the embodiment, the common background may or may not be annotated, and thus between the non-analyte area inside the vessel wall and the non-analyte area outside, or background features ( Irregularities in the intracavitary surface, changes in wall thickness, etc.) may or may not be visually distinguished from each other. Thus, in some embodiments, the annotated analyte area (eg, color-coded and normalized to wall thickness) is uniform (eg, completely black, completely gray, completely). It may be drawn visually against a background (such as white). In other embodiments, the annotated analyte area (eg, color-coded but not normalized to wall thickness) has an annotated background (eg, a different shade (gray, black). , And / or white) to (i) the central lumen area inside the lumen of the tubular structure, (ii) the non-analyte area inside the wall, and / or (iii) the outside area of the outer wall. May be visually depicted, which allows analysis of wall thickness variation (eg, due to ulceration or thrombosis). In a further exemplary embodiment, annotation. The dataset may include, for example, identification (and visualization) of intra-plaque bleeding and / or other morphological aspects of the region, eg, the intra-plaque bleeding region is visualized in red and the LRNC is visualized in yellow. May be good.
主題の適用のシステムおよび方法の1つの特定の実装は、血管療法を指示することであり得る。分類は、プラーク病巣の可能性のある動的挙動(その物理的特性または特定のメカニズム、例えば炎症性またはコレステロール代謝に基づく)に従って、および/または疾患の進行(例えば、その自然史の早期対後期)に基づいて確立されてもよい。このような分類は、患者の治療を指示するために使用することができる。例示的な実施形態では、AHAによって採用されたStaryプラーク表現型決定システムをアンダーレイとして利用し、インビボで決定されたタイプを色のオーバーレイで示す。例示的なマッピングは、「I」、「II」、「III」、「IV」、「V」、「VI」、「VII」、「VIII」]であり、class_map=[不顕性、不顕性、不顕性、不顕性、不顕性、不安定、不安定、安定、安定]をもたらす。しかしながら、本開示のシステムおよび方法は、Staryに結び付けられていない。別の例として、Virmaniシステム[「石灰化結節」、「CTO」、「FA」、「FCP」、「治癒プラーク破裂」、「PIT」、「IPH」、「破裂」、「TCFA」、「ULC」]は、class_map=[安定、安定、安定、安定、安定、安定、不安定、不安定、不安定、不安定]で使用されており、他の型決定システムでも同様に高い性能が得られる可能性がある。例示的な実施形態では、本開示のシステムおよび方法は、異種の型決定システムをマージしてもよく、クラスマップを変更してもよく、または他の変形例があってもよい。FFR表現型の場合、例えば物理的FFRとの比較を容易にするために、正常または異常などの値が使用されてもよく、および/または数値が使用されてもよい。 One particular implementation of the subject application system and method may be to direct vascular therapy. Classification is according to the possible dynamic behavior of plaque lesions (based on their physical properties or specific mechanisms, such as inflammatory or cholesterol metabolism) and / or disease progression (eg, early vs. late in their natural history). ) May be established. Such a classification can be used to direct the treatment of a patient. In an exemplary embodiment, the Stary plaque phenotyping system adopted by AHA is utilized as an underlay and the in vivo determined type is indicated by a color overlay. Exemplary mappings are "I", "II", "III", "IV", "V", "VI", "VII", "VIII"], and class_map = [subclinical, subclinical]. Sex, subclinical, subclinical, subclinical, unstable, unstable, stable, stable]. However, the systems and methods of the present disclosure are not tied to Stary. As another example, the Virmani system ["calcified nodules", "CTO", "FA", "FCP", "healing plaque rupture", "PIT", "IPH", "rupture", "TCFA", "ULC" "] Is used with class_map = [stable, stable, stable, stable, stable, stable, unstable, unstable, unstable, unstable], and high performance can be obtained in other typing systems as well. there is a possibility. In exemplary embodiments, the systems and methods of the present disclosure may merge heterogeneous typing systems, modify class maps, or have other variants. In the case of the FFR phenotype, values such as normal or abnormal may be used and / or numerical values may be used to facilitate comparison with, for example, physical FFR.
したがって、例示的な実施形態では、本開示のシステムおよび方法は、補強された放射線データセットに基づくプラークの表現型分類を提供することができる。特に、表現型分類(複数可)は、安定プラークを不安定プラークから区別することを含んでもよく、例えばここでは、分類のグラウンドトゥルースの基礎が、(i)内腔狭窄(蛇行および/または潰瘍化のような追加の測定によって増強される場合がある)、(ii)カルシウム含有量(深さ、形状、および/または他の複雑な提示によって増加する可能性がある)、(iii)脂質含有量(キャップの厚さおよび/または他の複雑な提示の測定によって増加する可能性がある)、(iv)解剖学的構造または形状、および/または(v)IPHもしくはその他の含有量などの要因に基づいている。特に、この分類は、全体的に高い精度、感度、特異度、および高い程度の臨床的関連性(カテーテル検査および心血管ケアを受けている患者の既存の標準ケアを変更する可能性がある)を有することが実証されていることである。 Thus, in exemplary embodiments, the systems and methods of the present disclosure can provide phenotypic classification of plaques based on a reinforced radiation dataset. In particular, the phenotypic classification (s) may include distinguishing stable plaques from vulnerable plaques, eg, here the basis of the ground truth of the classification is (i) luminal stenosis (serpentine and / or ulcer). (May be enhanced by additional measurements such as chemistry), (ii) Calcium content (may be increased by depth, shape, and / or other complex presentations), (iii) Lipid content Factors such as quantity (which may be increased by measurement of cap thickness and / or other complex presentations), (iv) anatomy or shape, and / or (v) IPH or other content. Is based on. In particular, this classification has overall high accuracy, sensitivity, specificity, and a high degree of clinical relevance (which may alter existing standard care for patients undergoing catheterization and cardiovascular care). It has been proven to have.
別の例示的な実施形態は肺癌であり、ここでは、腫瘤のサブタイプが、顕在表現型に基づいて患者にとって最も有益な治療を指示するように決定され得る。特に、前処理およびデータセットの補強は、固体対半固体(「すりガラス」)のサブ領域に分離するために使用することができ、これらのサブ領域は、悪性度が異なるだけでなく、異なる最適な治療を示唆している。 Another exemplary embodiment is lung cancer, where the subtype of the mass can be determined to direct the most beneficial treatment for the patient based on the overt phenotype. In particular, pretreatment and dataset reinforcement can be used to separate into sub-regions of solid-to-semi-solid (“ground glass”), which are not only of different grades, but also of different optimums. Suggests a good treatment.
さらなる例示的な実施形態では、本開示のシステムおよび方法は、CT血管造影(CTA)診断画像の画像前処理、画像ノイズ除去、および新規な幾何学的表現(例えば、アフィン変換)を提供して、クラス最高の分類器、および表現手順の間に有害な心血管系の影響のリスクのマーカーを開発するためのCNNに基づく深層学習アルゴリズムの性能を促進および最大化することができる。したがって、本明細書に開示されるように、画像のぼけ除去または復元を使用して関心のある病巣を識別し、プラーク組成を定量的に抽出することができる。さらに、断面(主軸血管に沿った)セグメンテーションされた画像の、例えば、X軸に沿って確立された内腔に追従する「アンラップされた」長方形の参照フレームへの変換は、DLアプローチが表現的な特徴を最もよく学習することを可能にするために正規化されたフレームを提供するために適用されてもよい。 In a further exemplary embodiment, the systems and methods of the present disclosure provide image preprocessing of CT angiography (CTA) diagnostic images, image noise removal, and novel geometric representations (eg, affine transformations). , Best-in-class classifiers, and CNN-based deep learning algorithms for developing markers of risk of harmful cardiovascular effects during representation procedures can be facilitated and maximized. Thus, as disclosed herein, image deblurring or restoration can be used to identify lesions of interest and quantitatively extract plaque composition. In addition, the DL approach expresses the conversion of a cross-section (along the main vessel) segmented image into, for example, an "unwrapped" rectangular reference frame that follows a lumen established along the X-axis. It may be applied to provide a normalized frame to allow the best learning of features.
本明細書の例示的な実施形態は、分析および表現型決定のために2Dの注釈付けされた断面を利用するが、主題の適用はそのような実施形態に限定されないことに留意されたい。特に、いくつかの実施形態は、例えば、2D断面を別々に処理する代わりに、またはそれに加えて、補強された3Dデータセットを利用することができる。したがって、例示的な実施形態では、コンピュータビジョンからのビデオ解釈を分類器入力データセットに適用することができる。中心線に沿った「映画」シーケンスにあるように、複数の断面を順次処理することは、管状構造、例えば、中心線を上下に移動すること、および/または解剖学に最も適した側面に応じて他の3D顕在化のために、これらの方法を一般化することができることに留意されたい。 It should be noted that the exemplary embodiments herein utilize 2D annotated cross sections for analysis and phenotyping, but the application of the subject is not limited to such embodiments. In particular, some embodiments may utilize a reinforced 3D dataset, for example, instead of or in addition to processing the 2D cross sections separately. Thus, in an exemplary embodiment, video interpretation from computer vision can be applied to the classifier input dataset. Sequential processing of multiple cross sections, as in the "movie" sequence along the centerline, depends on the tubular structure, eg, moving the centerline up and down, and / or the most suitable aspect for anatomy. Note that these methods can be generalized for other 3D manifestations.
さらなる例示的な実施形態では、補強されたデータセット内の偽色表現は、ピクセルまたはボクセルの位置にわたって連続的な値を有してもよい。この値は、明示的な検証の有無にかかわらず、「ラジオミクス」特徴、または検証された組織タイプに使用され、各ボクセルに対して独立して算出されてもよい。このような値のセットは、任意の数の前処理されたオーバーレイに存在してもよく、表現型分類器に供給されてもよい。特に、いくつかの実施形態では、各ピクセル/ボクセルは、任意の数の異なる特徴の値を有することができる(例えば、異なる分析物のための任意の数の異なるオーバーレイ中に表現されてもよく、「多重占有」と呼ばれることもある)。代替的に、各ピクセル/ボクセルは、1つの分析物にのみ割り当てられてもよい(例えば、単一の分析物オーバーレイのみに割り当てられる)。さらに、いくつかの実施形態では、所与の分析物(例えば、所与の分析物)のピクセル/ボクセル値は、オールオアナッシング分類スキーム(例えば、ピクセルがカルシウムであるかそうでないかのいずれか)に基づくことができる。代替的に、所与の分析物のピクセル/ボクセル値は、相対値、例えば、確率スコアであってもよい。いくつかの実施形態では、ピクセル/ボクセルの相対値は、分析物のセット全体で(例えば、合計確率が合計で100%になるように)正規化される。 In a further exemplary embodiment, the false color representation in the reinforced dataset may have continuous values across pixel or voxel positions. This value may be used for "radiomic" features, or validated tissue types, with or without explicit validation, and may be calculated independently for each voxel. Such a set of values may be present in any number of preprocessed overlays and may be fed to the phenotypic classifier. In particular, in some embodiments, each pixel / voxel can have any number of different feature values (eg, may be represented in any number of different overlays for different analyzes. , Sometimes called "multiple occupancy"). Alternatively, each pixel / voxel may be assigned to only one analyte (eg, to only a single analyte overlay). Moreover, in some embodiments, the pixel / voxel values of a given analyte (eg, a given analyte) are either an all-or-nothing classification scheme (eg, pixels are calcium or not). ) Can be based. Alternatively, the pixel / voxel value of a given analyte may be a relative value, eg, a probability score. In some embodiments, the pixel / voxel relative values are normalized across the set of analytes (eg, so that the total probability is 100% total).
例示的な実施形態では、分類モデルは、例えば、偏微分方程式などのマルチスケールモデリング技術の適用によって全体的または部分的に訓練されて、例えば、可能性の高い細胞信号伝達経路または生物学的に動機付された実現可能な提示を表現することができる。 In an exemplary embodiment, the classification model is trained in whole or in part by applying multiscale modeling techniques such as, for example, partial differential equations, eg, likely cell signaling pathways or biologically. It is possible to express a motivated and feasible presentation.
他の代替の実施形態は、単一の時点からの(唯一の)データではなく、例えば、複数の時点から収集されたような変化データを使用することを含む。例えば、陰性細胞型の量または性質が増加した場合、それは、減少した場合の「リグレッサー」表現型に対して、「プログレッサー」表現型であると言うことができる。リグレッサーは、例えば、薬物への反応が原因である可能性がある。代替的に、例えば、LRNCの変化率が速い場合、これは、異なる表現型、例えば、「急速なプログレッサー」を意味してもよい。 Other alternative embodiments include using change data, such as those collected from multiple time points, rather than (unique) data from a single point in time. For example, if the amount or nature of a negative cell type increases, it can be said to be a "progressor" phenotype as opposed to a "reggressor" phenotype when it decreases. The regressor may be due, for example, to a reaction to a drug. Alternatively, for example, if the rate of change of LRNC is fast, this may mean a different phenotype, eg, "rapid progresser".
いくつかの実施形態では、他のアッセイ(例えば、実験室の結果)、人口統計学/リスク要因、または放射線画像から得られた他の測定値から導出されるような非空間情報を、CNNの最終層に供給して空間情報を非空間情報と組み合わせてもよい。 In some embodiments, the CNN provides non-spatial information as derived from other assays (eg, laboratory results), demographic / risk factors, or other measurements obtained from radiographic images. Spatial information may be combined with non-spatial information by supplying to the final layer.
特に、システムおよび方法は表現型分類に焦点を当てているが、転帰予測に関しても同様のアプローチを適用することができる。このような分類は、訓練データセットに割り当てられたグラウンドトゥルースの過去の転帰に基づいていてもよい。例えば、平均余命、生活の質、治療効果(異なる治療方法の比較を含む)、および他の転帰予測は、主題の適用のシステムおよび方法を使用して決定することができる。 In particular, systems and methods focus on phenotypic classification, but a similar approach can be applied for outcome prediction. Such classification may be based on past outcomes of ground truth assigned to the training dataset. For example, life expectancy, quality of life, therapeutic effect (including comparison of different treatment methods), and other outcome predictions can be determined using the system and method of application of the subject.
主題の適用のシステムおよび方法の例は、複数の図面および以下の詳細な説明にさらに示されている。 Examples of systems and methods of application of the subject are further shown in the drawings and detailed description below.
さらなる例示的な実施形態では、本開示のシステムおよび方法は、プラーク形態の測定による心筋および/または脳組織における部分的な部分血流予備量比の決定を提供する。本開示のシステムおよび方法は、その膨張性に影響を与える組織のタイプおよび特徴の客観的に検証された決定を介して血管の血管拡張能力を特徴付けるために洗練された方法を使用してもよい。特に、プラーク形態は、血流予備量比の観点からの血管系の動的挙動の分析への入力として使用されてもよい(血流予備量比事実データを使用してモデルを訓練する)。したがって、静的な記述(のみ)ではなく、システムの動的な動作を決定することが可能である。狭窄自体は、静的な記述しか提供しないという点で、予測力が低いことでよく知られており、動的機能の最高精度のイメージングに基づく評価には、正確なプラーク形態の追加が必要である。本開示は、正確なプラーク形態を決定するシステムおよび方法を提供し、次いで、動的機能を決定するために処理する。 In a further exemplary embodiment, the systems and methods of the present disclosure provide determination of partial partial blood flow reserve ratios in myocardium and / or brain tissue by measuring plaque morphology. The systems and methods of the present disclosure may use sophisticated methods to characterize the vasodilatory capacity of blood vessels through objectively validated determinations of tissue types and characteristics that affect their swelling. .. In particular, plaque morphology may be used as an input to the analysis of dynamic behavior of the vascular system in terms of blood flow reserve ratio (train the model using blood flow reserve ratio factual data). Therefore, it is possible to determine the dynamic behavior of the system rather than the static description (only). The stenosis itself is well known for its poor predictability in that it provides only a static description, and the most accurate imaging-based assessment of dynamic function requires the addition of accurate plaque morphology. be. The present disclosure provides systems and methods for determining the exact plaque morphology and then processes to determine dynamic function.
例示的な実施形態では、深層学習を利用して、組織特性および血管の解剖学的構造(「プラーク形態」と総省される)の空間的コンテキストを最適なレベルの粒度で保持し、訓練セットにおける過度の非物質的変動を回避しながら、機械学習の他のより単純な使用を超えるために必要とされるものを保持する。他者による代替の方法は、組織特性のより完全な処理ではなく、血管構造の測定値のみを使用する。このような方法は、病巣の長さ、狭窄、ならびにおそらく入口および出口の角度を捕捉することができるが、血管拡張能力の決定要因を無視している。これらのモデルを使用するには、動脈樹全体の柔軟性に関する高レベルの想定を行う必要があるが、プラークおよびその他の組織性状は、冠動脈樹の膨張性を不均一な方法で膨張させる原因となる。ツリーの様々な部分が多かれ少なかれ拡張性である。拡張性はFFRを決定する上で重要な要素であるため、方法は不十分である。組織特性を行おうとする他の方法は、それらの精度に関する客観的な検証を伴わず、および/または深層学習法の有効性を提供するために必要な医用画像深層学習(例えば、アンラッピングおよび検証された偽色組織タイプオーバーレイなどの変換)に最適な空間的コンテキストを保持するために必要なデータ補強方法を伴わずに実行する。いくつかの方法では、合成データを使用することによって訓練セットサイズを大きくしようとするが、これは最終的に、合成生成の基になる限られたデータに限定され、入力訓練セットの実際の拡張ではなく、データ拡張スキームである。追加的に、本開示のシステムおよび方法は、血管の長さ全体にわたって連続的な評価を作成することができる。 In an exemplary embodiment, deep learning is used to preserve the spatial context of tissue properties and vascular anatomy (abbreviated as "plaque morphology") at an optimal level of granularity in the training set. It retains what is needed to go beyond other simpler uses of machine learning while avoiding excessive immaterial fluctuations. Alternative methods by others use only vascular structure measurements rather than a more complete treatment of tissue properties. Such methods can capture lesion length, stenosis, and possibly entrance and exit angles, but ignore determinants of vasodilatory capacity. While these models require high-level assumptions about the flexibility of the entire arterial tree, plaques and other tissue properties are responsible for the non-uniform expansion of coronary tree swelling. Become. Various parts of the tree are more or less extensible. The method is inadequate because extensibility is an important factor in determining FFR. Other methods of attempting tissue properties do not involve objective validation of their accuracy and / or medical image deep learning (eg, unwrapping and validation) necessary to provide the effectiveness of deep learning methods. Performed without the data augmentation methods required to maintain optimal spatial context for transformations such as false color tissue type overlays. Some methods try to increase the training set size by using synthetic data, but this is ultimately limited to the limited data on which the synthetic generation is based, and the actual extension of the input training set. Not a data expansion scheme. In addition, the systems and methods of the present disclosure can create a continuous assessment over the length of the vessel.
本開示のシステムおよび方法は、複数の動脈床にわたる組織学によって検証された客観的な組織の特徴付けを効果的に活用する。動脈硬化症の例示的な適用に関連して、プラーク組成は、その年齢に関係なく、冠動脈および頸動脈で類似しており、これは、相対的安定性を主に決定し、CTAと同様にCCTAにおいても同様の提示を示唆するであろう。様々なプラークの特徴の程度のわずかな違いとしては、冠動脈ではキャップが厚く、頸動脈ではプラーク内出血および石灰化結節の有病率が高いことが挙げられるが、プラーク成分の性質に違いはない。加えて、頸動脈および冠動脈は、プラークの進化に影響を与える血管緊張調節の生理学において多くの類似点を有している。心筋の血液灌流は、NOなどの様々な刺激に反応して心外膜冠動脈の血管拡張によって調節され、冠動脈の緊張に動的な変化を引き起こし、血流に複数の変化をもたらす可能性がある。同様に、頸動脈は脳循環をサポートする単なる導管ではなく、それらは、せん断応力の変化を含む刺激に反応して血管反応性状を実証する。内皮せん断応力は、内皮の健康および好ましい血管壁トランスクリプトームプロファイルに寄与する。臨床研究では、内皮せん断応力が低い領域が動脈硬化症の発症および高リスクのプラークの特徴に関連付けられていることが実証されている。同様に、頸動脈では、より低い壁のせん断応力がプラークの発達および局在化に関連付けられている。(内皮のせん断応力はそれ自体が有用な測定値であるが、プラークの形態学に取って代わるものではない。)技術的な課題は床(例えば、ゲートの使用、血管サイズ、動きの量および性質)によって異なるが、これらの影響はスキャンプロトコルによって軽減され、面内ボクセルサイズは0.5〜0.75mmの範囲で近似的になり、冠動脈(より小さな血管)の面内分解能は、実際には頸動脈のそれよりも優れている(ボクセルは冠動脈では等方的であり、頸部および末梢四肢ではそうではない)ことを認識することが重要である。 The systems and methods of the present disclosure effectively utilize objective tissue characterization verified by histology across multiple arterial beds. In connection with the exemplary application of arteriosclerosis, plaque composition is similar in the coronary and carotid arteries, regardless of their age, which primarily determines relative stability and is similar to CTA. A similar presentation would be suggested in the CCTA. The slight differences in the degree of characteristics of the various plaques include thick caps in the coronary arteries and a high prevalence of intra-plaque bleeding and calcified nodules in the carotid arteries, but there is no difference in the nature of the plaque components. In addition, the carotid and coronary arteries have many similarities in the physiology of vascular tone regulation that influences plaque evolution. Myocardial hemoperfusion is regulated by epicardial coronary vasodilation in response to various stimuli such as NO, causing dynamic changes in coronary tone and potentially multiple changes in blood flow. .. Similarly, the carotid arteries are not just conduits that support cerebral circulation, they demonstrate vascular responsiveness in response to stimuli, including changes in shear stress. Endothelial shear stress contributes to endothelial health and favorable vascular wall transcriptome profiles. Clinical studies have demonstrated that areas with low endothelial shear stress are associated with the development of arteriosclerosis and the characteristics of high-risk plaques. Similarly, in the carotid artery, lower wall shear stress is associated with plaque development and localization. (Endothelial shear stress is a useful measure in itself, but it does not replace plaque morphology.) Technical challenges are floor (eg, gate use, vessel size, amount of movement and). Depending on the nature), these effects are mitigated by the scan protocol, the in-plane boxel size becomes approximate in the range of 0.5-0.75 mm, and the in-plane resolution of the coronary arteries (smaller vessels) is actually It is important to recognize that is superior to that of the carotid artery (boxels are isotropic in the coronary arteries, not in the cervix and peripheral limbs).
本開示は、ナイキスト−シャノンのサンプリング定理を尊重する堅実な数学の原理に基づいて、IVUS VHとほぼ同じように定期的に取得されるCTAで効果的な分解能を達成する。IVUSイメージングは、全体的な構造(つまり、内腔)に対して優れた空間分解能を有しているが、一般に、プラーク成分を高精度で特徴付ける能力に欠けている。文献によると、IVUSの分解能は、20〜40MHzの範囲の典型的なトランスデューサーを使用して、軸方向に70〜200μm、横方向に200〜400μmと推定されている。IVUS VHは、プラーク組成分析(したがって測定)を可能にするスペクトル後方散乱分析の方法である。軸方向に大きな(例えば、480μm)移動ウィンドウを使用するIVUS VH手法の場合、この移動ウィンドウの比較的大きなサイズ(したがって、組成分析の精度)は、スペクトル分析の帯域幅要件によって根本的に制限される。IVUS VH画像が、例えば250μmの小さな移動ウィンドウに表示される場合、各IVUSピクセルは個別のカテゴリに分類されるので、この分析の精度が制限される。64スライスマルチ検出器CCTAスキャンは、300〜400μmの分解能の範囲であると説明されている。これにより、CCTAの解像度はすでにIVUS VHの解像度に非常に近くなるが、考慮すべき本発明の分析に特有の追加の要因がある。したがって、CCTAピクセルを離散的に分類するのではなく、本開示のシステムおよび方法は、例えば、脂質コアの真の表面を表現するために三角形のテッセレーションされた表面を使用して、サブボクセル精度で反復的なぼけ除去または復元モデリングステップを実施する。脂質コア区域は、393人の患者で6.5〜14.3mm2の範囲にある(対応する曲率半径は1.4〜2.1mm)。弦が単一のボクセルに対角線上に広がる弦の長さの式を使用すると、これは44μmでの脂質コアのテッセレーションされた表面表現の誤差の上限を表現する。一般的にキャップの厚さを測定するためのIVUS VHの精度と同等の194〜244μmの精度の合計範囲のために、半分のピクセルのオーダーの誤差を引き起こす可能性があるぶれ除去または復元分析に関連付けられた追加の要因がある。 The present disclosure achieves effective resolution in regularly acquired CTA, much like IVUS VH, on the basis of solid mathematical principles that respect the Nyquist-Shannon sampling theorem. IVUS imaging has excellent spatial resolution for the overall structure (ie, lumen), but generally lacks the ability to characterize plaque components with high accuracy. According to the literature, the resolution of IVUS is estimated to be 70-200 μm axially and 200-400 μm laterally using typical transducers in the 20-40 MHz range. IVUS VH is a method of spectral backscatter analysis that allows plaque composition analysis (and thus measurement). For IVUS VH techniques that use a large (eg, 480 μm) moving window in the axial direction, the relatively large size of this moving window (and therefore the accuracy of composition analysis) is fundamentally limited by the bandwidth requirements of spectral analysis. NS. When IVUS VH images are displayed, for example in a small moving window of 250 μm, the accuracy of this analysis is limited because each IVUS pixel is classified into a separate category. The 64-slice multi-detector CCTA scan is described as having a resolution range of 300-400 μm. This makes the resolution of CCTA already very close to that of IVUS VH, but there are additional factors specific to the analysis of the present invention to consider. Therefore, rather than classifying CCTA pixels discretely, the systems and methods of the present disclosure use, for example, a triangular tessellated surface to represent the true surface of the lipid core, with subboxel accuracy. Perform iterative deblurring or restoration modeling steps. The lipid core area ranges from 6.5 to 14.3 mm2 in 393 patients (corresponding radius of curvature is 1.4 to 2.1 mm). Using the chord length equation, where the chord extends diagonally across a single voxel, this represents the upper limit of the error in the tessellated surface representation of the lipid core at 44 μm. For blur removal or restoration analysis that can cause errors on the order of half a pixel due to the total range of accuracy of 194 to 244 μm, which is generally equivalent to the accuracy of IVUS VH for measuring cap thickness. There are additional factors associated with it.
本開示は、動脈硬化症のイメージングデータの分析への人工知能および深層学習の適用の基本的な制限に対処する上でも革新的である。のような検証された客観的な基盤を欠いている従来の競争的アプローチは、根本的に複数の方法で制限されている。第1に、任意の閾値が使用されるため、それ自体が客観的な検証を欠いている他のマーカーとの相関の弱い形式を除いて精度を評価することができない。第2に、この客観性の欠如は、状況に応じて相関関係の基礎となる大量のデータに対する需要を増大させる。これは、それ自体が分析の対象である放射線画像の手動注釈に対して実行不可能な要求を課している(つまり、独立したモダリティから検証されるのとは対照的である)。第3に、結果として得られるモデルの解釈可能性に起因して、これらのモデルはFDAなどの規制機関に「ブラックボックス」として提示されなければならず、従来の生物学的仮説テストと結びつけることができる作用機序の科学的な厳密な解明を欠いている。具体的には、CNNは多くの異なるコンピュータビジョンのタスクを実施するのに優れていることが証明されているが、放射線データセットに適用すると、以下の大きな欠点がある:1)膨大な訓練および検証のデータセットが必要であること、2)中間CNNの計算は一般的に測定可能な性状を表現するものではないので、規制当局の承認を難しくしていること。これらの課題に対処するために、生物学的レベルで個別に客観的に検証してCNNに供給することができる出力を備えた段階で構成されるパイプラインアプローチを利用する。本発明は、生物学的に測定可能である(すなわち、客観的に検証することができる)1つ以上の段階から構成されるパイプラインを使用し、続いてこれらの検証された生物学的性状に対してより小さな範囲の畳み込みニューラルネットワーク処理を行い、主観的または定性的な「イメージング特徴」に基づくのではなく、むしろ所望の出力条件を出力することによってこれらの欠点を克服する。これらのアーキテクチャ機能は、利用可能な訓練データの効率を高めることによって欠点を軽減し、中間ステップを客観的に検証できるようにする。本開示のシステムおよび方法は、1)中程度のサイズのデータセットでCNNを訓練するときに許容できるレベルまでビジョンタスクの複雑さを減少させ、2)客観的に検証され、ユーザまたは規制機関によって容易に解釈できる中間出力を生成することによって、医用イメージングにCNNを使用することの欠点を同時に軽減する。中間CNN計算は一般にいかなる測定可能な性状を表現するものでもなく、特徴抽出を使用するMLアプローチでは空間的コンテキストを取得するのが難しいことが多く、空間的コンテキストを含む生のデータセットを使用すると、従来の機械学習でも深層学習アプローチでも、抽出された特徴の客観的なグラウンドトゥルースラベルが欠落することが多い。同様に、生のデータセットは、目前の分類問題に関して「ノイズ」である多くの変動を含み、これは、医療以外のコンピュータビジョン用途では、医療用途で一般的に利用できない規模の非常に大規模な訓練セット、特にグラウンドトゥルースで注釈付けされたセットを持つことによって克服されている。 The disclosure is also innovative in addressing the fundamental limitations of applying artificial intelligence and deep learning to the analysis of arteriosclerosis imaging data. Traditional competitive approaches that lack a validated and objective basis, such as, are fundamentally limited in multiple ways. First, because arbitrary thresholds are used, accuracy cannot be evaluated except in forms that are weakly correlated with other markers that themselves lack objective verification. Second, this lack of objectivity increases the demand for large amounts of data that underlie the correlation, depending on the situation. This imposes an infeasible requirement on the manual annotation of the radiographic image that is itself the subject of analysis (that is, in contrast to being validated from an independent modality). Third, due to the interpretability of the resulting models, these models must be presented as a "black box" to regulators such as the FDA and should be linked to traditional biological hypothesis testing. It lacks a rigorous scientific elucidation of the mechanism of action that can occur. Specifically, CNNs have proven to be good at performing many different computer vision tasks, but when applied to radiation datasets, they have the following major drawbacks: 1) Extensive training and A validation data set is required, and 2) intermediate CNN calculations generally do not represent measurable properties, making regulatory approval difficult. To address these challenges, we utilize a pipeline approach consisting of stages with outputs that can be individually and objectively validated at the biological level and supplied to the CNN. The present invention uses a pipeline consisting of one or more steps that are biologically measurable (ie, objectively verifiable), followed by these verified biological properties. It overcomes these drawbacks by performing a smaller range of convolutional neural network processing on the device and outputting the desired output conditions rather than based on subjective or qualitative "imaging features". These architectural features mitigate shortcomings by increasing the efficiency of available training data and allow intermediate steps to be objectively validated. The systems and methods of the present disclosure 1) reduce the complexity of vision tasks to an acceptable level when training CNNs on medium-sized datasets, 2) are objectively validated and by users or regulators. Simultaneously alleviates the drawbacks of using CNNs for medical imaging by producing an easily interpretable intermediate output. Intermediate CNN calculations generally do not represent any measurable properties, and it is often difficult to obtain spatial context with ML approaches that use feature extraction, using raw datasets that include spatial context. In both traditional machine learning and deep learning approaches, the objective ground truth label of the extracted features is often missing. Similarly, raw datasets contain many variations that are "noise" with respect to the immediate classification problem, which is a very large scale that is not generally available in medical applications in non-medical computer vision applications. Overcome by having a good training set, especially a set annotated with ground truth.
本開示のシステムおよび方法の定量的能力は、より高度なイメージングプロトコル(組織の特徴付けのために、早期/遅延フェーズコントラスト、デュアルエネルギー、およびマルチスペクトル技術などのプロトコルが研究されている)の分析に理想的なものとなる。 The quantitative capabilities of the systems and methods disclosed are the analysis of more advanced imaging protocols, such as early / delayed phase contrast, dual energy, and multispectral techniques for tissue characterization. It will be ideal for.
本開示のシステムおよび方法を特に示し、その例示的な実施形態を参照して説明してきたが、その中で、本開示の範囲から逸脱することなく、様々な形態および詳細の変更が行われ得ることは、当業者には理解されるであろう。 Although the systems and methods of the present disclosure have been specifically shown and described with reference to exemplary embodiments thereof, various embodiments and details may be modified without departing from the scope of the present disclosure. That will be understood by those skilled in the art.
前述のことは、添付の図面に示されているように、例示的な実施形態の以下のより具体的な説明から明らかである。図面では、同様の参照文字は、異なる図全体にわたって同じ部分を参照している。図面は必ずしも原寸に比例しておらず、代わりに本開示の実施形態を説明することに重点が置かれている。 The above is evident from the following more specific description of the exemplary embodiments, as shown in the accompanying drawings. In drawings, similar reference characters refer to the same part throughout different drawings. The drawings are not necessarily proportional to their actual size and instead the emphasis is on explaining embodiments of the present disclosure.
定量的イメージングを利用して病変を分析するためのシステムおよび方法が本明細書に提示される。本開示のシステムおよび方法は、イメージングデータから生物学的性状/分析物を識別および定量化し、次いで、定量化された生物学的性状/分析物に基づいて1つ以上の病変を識別および特徴付ける階層分析フレームワークを有利に利用する。病変を評価するための中間体としてイメージングを使用して基礎となる生態を調べるこの階層的アプローチは、検証ステップを伴わずに、および/または本明細書に記載される有利な処理を伴わずに、生のイメージングデータから病変を直接決定し、特徴付けるように構成されたシステムおよび方法よりも多くの分析および処理上の利点を提供する。 Systems and methods for analyzing lesions using quantitative imaging are presented herein. The systems and methods of the present disclosure identify and quantify biological properties / analyzes from imaging data, and then identify and characterize one or more lesions based on the quantified biological properties / analyzes. Take advantage of the analytical framework. This hierarchical approach of examining the underlying ecology using imaging as an intermediate for assessing lesions does not involve validation steps and / or the advantageous treatments described herein. Provides more analytical and processing benefits than systems and methods configured to determine and characterize lesions directly from raw imaging data.
1つの利点は、例えば非放射線源からの、例えば、組織学的情報などの組織サンプル源からの訓練セットを、放射線源の訓練セットと組み合わせて、またはこれとは独立して利用して、放射線イメージング特徴を生物学的性状/分析物と病変とに相関させる能力である。例えば、いくつかの実施形態では、組織学的情報は、定量化された生物学的性状/分析物に基づいて1つ以上の病変を識別し、特徴付けるための訓練アルゴリズムで使用されてもよい。より具体的には、(例えば、侵襲的に取得された組織学的データセット内のまたは遺伝子発現プロファイリングを介して取得可能な)非放射線データで識別可能/定量化可能な生物学的性状/分析物も、放射線データ(有利に非侵襲的である)内で識別および定量化されてもよい。次に、これらの生物学的性状/分析物は、例えば、組織学的情報、遺伝子発現プロファイリング、または他の臨床的に豊富なデータセットを利用して、非放射線源からの情報を使用して病変に関する臨床所見と相関させることができる。次に、この臨床的に相関するデータのセットは、生物学的性状/分析物を臨床的転帰と既知の関係を有する病変と相関させるアルゴリズムを決定/調整する(例えば、機械学習を利用する)ための訓練セットまたは訓練セットの一部として機能することができる。次に、生物学的性状/分析物を非放射線源訓練セットを利用して導出された病変に相関させるこれらのアルゴリズムを、放射線データから導出された生物学的性状/分析物の評価に適用することができる。したがって、本開示のシステムおよび方法は、放射線イメージング(有利に費用効果が高く非侵襲的であり得る)を利用して、臨床転帰を予測するためのまたは治療を導くためのサロゲート手段を提供することを有利に可能にし得る。 One advantage is that a training set from, for example, a non-radiation source, eg, from a tissue sample source, such as histological information, can be used in combination with or independently of the radiation source training set to provide radiation. The ability to correlate imaging features with biological properties / analyzes and lesions. For example, in some embodiments, histological information may be used in training algorithms to identify and characterize one or more lesions based on quantified biological properties / analyzes. More specifically, identifiable / quantifiable biological properties / analyzes in non-radiative data (eg, in invasively acquired histological datasets or via gene expression profiling). The object may also be identified and quantified within the radiation data (which is advantageously non-invasive). These biological properties / analyzes then utilize information from non-radioactive sources, eg, utilizing histological information, gene expression profiling, or other clinically rich datasets. It can be correlated with clinical findings regarding lesions. This set of clinically correlated data then determines / adjusts an algorithm that correlates biological properties / analyzes with lesions that have a known association with clinical outcome (eg, using machine learning). Can function as a training set or part of a training set. Next, these algorithms that correlate biological properties / analysts with lesions derived using a non-radioactive source training set are applied to the evaluation of biological properties / analysts derived from radiation data. be able to. Accordingly, the systems and methods of the present disclosure utilize radioimaging (which can be advantageously cost-effective and non-invasive) to provide surrogate means for predicting clinical outcomes or guiding treatment. Can be advantageously enabled.
特に、場合によっては、非放射線源の訓練データ(組織学的情報など)は、放射線源の訓練データよりも正確で/信頼できる高い場合がある。さらに、いくつかの実施形態では、非放射線源からの訓練データを使用して、放射線源からの訓練データを拡張することができる。したがって、より良いデータ入力はより良いデータ出力をもたらす可能性が高いので、開示される階層分析フレームワークは、本明細書に開示されるアルゴリズムの訓練可能性および結果として得られる信頼性を有利に改善する。上記のように、1つの重要な利点は、一度訓練されると、本開示のシステムおよび方法が、侵襲的および/または費用のかかる手順を経る必要を伴わずに、既存の組織学的なおよび他の非放射線診断タイプのテストに匹敵する臨床情報を導出することを可能にし得ることである。 In particular, in some cases, non-radiation source training data (such as histological information) may be more accurate / reliable than radiation source training data. In addition, in some embodiments, training data from non-radioactive sources can be used to extend training data from radiation sources. Therefore, the disclosed analytic hierarchy process favors the trainability and consequent reliability of the algorithms disclosed herein, as better data input is likely to result in better data output. Improve. As mentioned above, one important advantage is that once trained, the systems and methods of the present disclosure do not require going through invasive and / or costly procedures, the existing histological and / or costly procedures. It may be possible to derive clinical information comparable to other non-radiographic type tests.
代替的に、いくつかの実施形態では、非放射線源(非放射線イメージング源、例えば、組織学的源、および/または非イメージング源など)のための訓練セットは、例えば、画像特徴を生物学的性状/分析物に相関させる際に、放射線源のための訓練セットと組み合わせて、またはこれとは独立して利用されてもよい。例えば、いくつかの実施形態では、1つ以上の生物学的モデルを外挿し、フィッティングして、放射線データと非放射線データとを相関させることができる。例えば、組織学情報は、基礎となる生物学的モデルに基づく放射線情報と相関されてもよい。この相関関係は、非放射線の、例えば組織学的情報を利用する放射線データにおける生物学的性状/分析物の認識を訓練することを有利に可能にし得る。 Alternatively, in some embodiments, training sets for non-radioactive sources (such as non-radioactive imaging sources, such as histological sources and / or non-imaging sources), eg, biological image features. It may be used in combination with or independently of a training set for a radiation source in correlating with properties / analyzes. For example, in some embodiments, one or more biological models can be extrapolated and fitted to correlate radiation and non-radiation data. For example, histological information may be correlated with radiation information based on the underlying biological model. This correlation can advantageously make it possible to train the recognition of biological properties / analysts in non-radiation, eg, histologically informative, radiation data.
いくつかの実施形態では、補完的なモダリティから導出されたデータを、例えば、画像特徴を、血液パネル、物理的FFR、および/または他のデータ源からの生物学的性状/分析物と相関させる際に使用することができる。 In some embodiments, data derived from complementary modality, eg, image features, are correlated with biological properties / analyzes from blood panels, physical FFRs, and / or other sources of data. Can be used when.
例示的な実施形態では、1つ以上の生物学的モデルは、別のイメージングモダリティまたは血液検査などの非イメージングソースと相関および/または融合された1つのイメージングモダリティから引き出されたイメージングデータを利用して外挿およびフィッティングすることができる。これらの生物学的モデルは、生物学的モデルに基づいて、イメージングデータセットと非イメージングデータセットとの間で有利に相関し得る。したがって、これらの生物学的モデルは、階層分析フレームワークが、1つ以上の生物学的性状/分析物を識別/定量化するか、または1つ以上の病状を識別し/特徴付ける際に、1つのイメージングモダリティからのデータを別のイメージングモダリティまたは非イメージングソースとともに利用することを可能にし得る。 In an exemplary embodiment, one or more biological models utilize imaging data derived from one imaging modality correlated and / or fused with another imaging modality or non-imaging source such as a blood test. Can be extrapolated and fitted. These biological models can be favorably correlated between imaging and non-imaging datasets based on the biological model. Thus, these biological models are one in which the hierarchical analysis framework identifies / quantifies one or more biological properties / analyzes, or identifies / characterizes one or more pathologies. It may be possible to utilize data from one imaging modality with another imaging modality or non-imaging source.
本明細書に開示される階層分析フレームワークの別の利点は、複数の同じまたは異なるタイプのデータソースからのデータを、イメージングデータに基づいて病変を識別し、特徴付けるプロセスに組み込むことができることである。例えば、いくつかの実施形態では、1つ以上の非イメージングデータソースを、生物学的性状/分析物のセットを識別および定量化する際に、1つ以上のイメージングデータソースと組み合わせて使用することができる。したがって、特に、生物学的性状/分析物のセットは、1つ以上のイメージングデータソースに基づいて識別および/もしくは定量化された1つ以上の生物学的性状/分析物、1つ以上の非イメージングデータソースに基づいて識別および/もしくは定量化された1つ以上の生物学的性状/分析物、ならびに/または、イメージングデータソースと非イメージングデータソースとの組み合わせに基づいて識別および/もしくは定量化された1つ以上の生物学的性状/分析物(本開示の定量的イメージングシステムおよび方法の目的のために、生物学的特性/分析物のセットは、一般的に、イメージングデータの少なくとも一部に基づいて識別および/または定量化された少なくとも1つ以上の生物学的性状/分析物を含み得ることに留意されたい)を含んでもよい。生物学的性状/分析物のセットを識別および定量化する際に、イメージングデータソースからの情報を他のイメージングおよび/または非イメージングデータソースからの情報で拡張する能力は、本明細書に提示されるシステムおよび方法の堅牢性に付加し、病変の識別および特徴付けにおける任意およびすべての関連する情報の利用を可能にする。 Another advantage of the analytic hierarchy process disclosed herein is that data from multiple same or different types of data sources can be incorporated into the process of identifying and characterizing lesions based on imaging data. .. For example, in some embodiments, one or more non-imaging data sources are used in combination with one or more imaging data sources in identifying and quantifying a set of biological properties / analytes. Can be done. Thus, in particular, a set of biological properties / analyzes is one or more biological properties / analyzes identified and / or quantified based on one or more imaging data sources. One or more biological properties / analyzes identified and / or quantified based on an imaging data source, and / or identified and / or quantified based on a combination of an imaging data source and a non-imaging data source. One or more biological properties / analyzes (for the purposes of the quantitative imaging systems and methods of the present disclosure, a set of biological properties / analyzes is generally at least a portion of the imaging data. It should be noted that it may include at least one or more biological properties / analyzes identified and / or quantified based on. The ability to extend information from imaging data sources with information from other imaging and / or non-imaging data sources in identifying and quantifying a set of biological properties / analyzes is presented herein. In addition to the robustness of the system and method, it enables the availability of any and all relevant information in the identification and characterization of lesions.
階層分析フレームワークのさらに別の利点は、各レベル、例えば、そのデータを利用して後のレベルを評価する前または後のレベル(いくつかの実施形態では、これは反復的なプロセスであり得ることに留意されたい)で、データを調整/微調整する能力を含んでいる。例えば、いくつかの実施形態では、識別および定量化された生物学的性状/分析物のセットに関連する情報は、事後的に(例えば、その最初の識別および/または定量化の後に)調整されてもよい。同様に、いくつかの実施形態では、識別および特徴付けされた病変のセットに関連する情報は、事後的に(例えば、その最初の識別および/または特徴付けの後に)調整されてもよい。これらの調整は自動またはユーザに基づくものであってもよく、客観的または主観的であってもよい。各レベルでデータを調整/微調整する能力は、データの説明責任および信頼性を有利に改善することができる。 Yet another advantage of the analytic hierarchy process is the level before or after each level, for example, the level after using that data to evaluate (in some embodiments, this can be an iterative process). Note), which includes the ability to adjust / fine-tune the data. For example, in some embodiments, the information associated with the identified and quantified set of biological properties / analyzes is adjusted ex post facto (eg, after its initial identification and / or quantification). You may. Similarly, in some embodiments, the information associated with the set of identified and characterized lesions may be adjusted ex post facto (eg, after its initial identification and / or characterization). These adjustments may be automatic or user-based, and may be objective or subjective. The ability to adjust / fine-tune data at each level can favorably improve the accountability and reliability of data.
例示的な実施形態では、調整は、生物学的性状/分析物の決定または定量化に影響を与える1つ以上の確率を更新するために使用され得るコンテキスト情報に基づくことができる。例示的な実施形態では、識別および定量化された生物学的性状/分析物のセットに関連する情報を事後的に調整するためのコンテキスト情報は、患者の人口統計学的情報、生物学的性状/分析物間の相関、または識別/特徴付けされた病変および生物学的性状/分析物間の相関を含んでもよい。例えば、場合によっては、生物学的性状/分析物は、第1の生物学的性状/分析物の識別/定量化が、第2の生物学的性状/分析物の識別/定量化に関連する確率に影響を与え得るという意味で関連し得る。他の場合には、例えば、識別/定量化された生物学的性状/分析物の初期セットに基づく第1の病変の識別/特徴付けは、初期セット内にある生物学的性状/分析物、またはさらには、第1のセット内になかった生物学的性状/分析物の識別/定量化に関連する確率に影響を与えてもよい。さらなる場合には、病変は関連していてもよく、例えば、第1の病変の識別/特徴付けは、第1の病変の識別/特徴付けに関連する確率に影響を与えてもよい。上記のように、生物学的性状/分析物の識別および定量化に関連する情報、ならびに/または病変の識別および特徴付けに関連する情報は、例えば、データ収束もしくは閾値/ベンチマークが達成されるまで、または選択されたサイクル数に対して反復的に更新されてもよい。 In exemplary embodiments, adjustments can be based on contextual information that can be used to update one or more probabilities that influence the determination or quantification of biological properties / analyzes. In an exemplary embodiment, the contextual information for ex post facto adjustment of the information associated with the identified and quantified set of biological properties / analyzes is the patient's demographic information, biological properties. / Correlation between analysts, or identified / characterized lesions and biological properties / correlations between analysts may be included. For example, in some cases, for a biological property / analyte, the identification / quantification of the first biological property / analysis is associated with the identification / quantification of the second biological property / analysis. It can be relevant in the sense that it can affect probability. In other cases, for example, the identification / characterization of the first lesion based on an initial set of identified / quantified biological properties / analytes is the biological properties / analyzes within the initial set. Or even more, it may affect the probabilities associated with the identification / quantification of biological properties / analytes that were not in the first set. In further cases, the lesions may be associated, for example, the identification / characterization of the first lesion may affect the probability associated with the identification / characterization of the first lesion. As mentioned above, information related to the identification and quantification of biological properties / analytes and / or information related to the identification and characterization of lesions, for example, until data convergence or threshold / benchmarking is achieved. , Or it may be updated iteratively for the selected number of cycles.
階層分析フレームワークのさらなる利点は、病変と基礎となる生態との両方に関連する情報を、例えば医師などのユーザに提供する能力を含む。この追加されたコンテキストは、臨床診断/評価だけでなく、次のステップ、例えば療法/治療オプションまたはさらなる診断の評価/決定を促進することができる。例えば、システムおよび方法は、1つ以上の病変の識別/定量化に関連するどの生物学的パラメータ/分析物が最も不確定であるか/最も高い程度の不確実性を有するかを決定するように構成されてもよい(例えば、データの欠如または矛盾するデータの理由から)。そのような場合、特定のさらなる診断が推奨され得る。病変と基礎となる生態との両方に関連する情報をユーザに提供するという追加のコンテキストは、ユーザが分析によって到達した様々な臨床的結論および推奨事項を評価/エラーチェックするのにさらに役立ち得る。 Further advantages of the analytic hierarchy process include the ability to provide information related to both lesions and the underlying ecology to users, such as doctors. This added context can facilitate not only clinical diagnosis / evaluation, but also the next step, such as evaluation / decision of therapy / treatment options or further diagnosis. For example, systems and methods may determine which biological parameters / analyzes associated with the identification / quantification of one or more lesions are the most uncertain / have the highest degree of uncertainty. (For example, due to lack of data or inconsistent data reasons). In such cases, certain further diagnoses may be recommended. The additional context of providing the user with information related to both the lesion and the underlying ecology may be further helpful in assessing / error-checking the various clinical conclusions and recommendations reached by the analysis.
本明細書で使用される階層分析フレームワークとは、データ点の初期セットとデータ点の最終セットとの間の中間処理層または中間変換として、1つ以上の中間セットが利用される分析フレームワークを意味する。このフレームワークは、アルゴリズムを使用して、複数の処理レイヤを使用するか、またはその他の方法では複数の非線形変換などの複数の変換を利用して、より高いレベルの抽象化をモデリングする深層学習または階層学習の概念に類似している。一般に、本開示のシステムおよび方法の階層分析フレームワークは、イメージングデータ点と病変データ点との間の中間処理層または中間変換としての生物学的性状/分析物に関連するデータ点を含み、例示的な実施形態では、イメージング情報、基礎となる生物学的情報、および病理学的情報の各々を決定するために、(例えば、複数のレベルのデータ点によって具現化されるような)複数の処理層または複数の変換を含んでもよい。例示的な階層分析フレームワーク構造(例えば、特定の処理層、変換、およびデータ点を有する)が本明細書で紹介されているが、本開示のシステムおよび方法は、このような実装に限定されない。むしろ、本開示の範囲および精神から逸脱することなく、任意の数の異なるタイプの分析フレームワーク構造を利用することができる。 The analytic hierarchy process used herein is an analytical framework in which one or more intermediate sets are used as an intermediate processing layer or intermediate transformation between an initial set of data points and a final set of data points. Means. This framework uses algorithms to model deep learning that uses multiple processing layers or otherwise utilizes multiple transformations, such as multiple non-linear transformations. Or similar to the concept of hierarchical learning. In general, the hierarchical analysis framework of the systems and methods of the present disclosure includes and exemplifies data points associated with biological properties / analyzes as intermediate processing layers or intermediate transformations between imaging data points and lesion data points. In certain embodiments, multiple processes (eg, as embodied by multiple levels of data points) to determine each of the imaging information, the underlying biological information, and the pathological information. It may include layers or multiple transformations. Although exemplary analytic hierarchy process structures (eg, having specific processing layers, transformations, and data points) are introduced herein, the systems and methods of the present disclosure are not limited to such implementations. .. Rather, any number of different types of analytical framework structures can be utilized without departing from the scope and spirit of the present disclosure.
例示的な実施形態では、主題の適用の階層分析フレームワークは、経験的データ層(イメージングデータを含む)と結果層(病理学情報を含む)との間の中間体として論理データ層を含むものとして概念化されてもよい。経験的データ層は直接供給されたデータを表現するが、論理データ層は、この生データを問題の結果層のための有用な分析物のセットに抜き出すある程度の論理および推論を有利に追加する。したがって、例えば、生のイメージング情報などの診断からの経験的な情報は、選択された病変または病変のグループ(例えば、患者の身体のイメージングされた領域に関連する病変)を評価するために関連する、生物学的特徴の特定のセットに関連する論理情報に有利に抜き出されてもよい。このように、主題の適用の生物学的特徴/分析物は、病理学的症状/指標と考えることもできる。 In an exemplary embodiment, the analytic hierarchy process of subject application includes a logical data layer as an intermediate between the empirical data layer (including imaging data) and the result layer (including pathological information). It may be conceptualized as. While the empirical data layer represents the directly supplied data, the logical data layer advantageously adds some logic and reasoning to extract this raw data into a set of useful analysts for the outcome layer of the problem. Thus, empirical information from a diagnosis, for example raw imaging information, is relevant to assess selected lesions or groups of lesions (eg, lesions associated with an imaged area of the patient's body). , The logical information associated with a particular set of biological features may be extracted in favor of it. Thus, the biological features / analyzes of the subject's application can also be thought of as pathological symptoms / indicators.
主題の適用の生物学的特徴/分析物は、本明細書ではバイオマーカーと呼ばれることがある。用語「生物学的」または接頭辞「バイオ」は、生物学的特徴またはバイオマーカーを特徴付けるために使用されるが、これは、特徴またはマーカーが患者の身体に関してある程度の関連性を有することを意味することのみを意図している。例えば、生物学的特徴は、解剖学的、形態学的、組成的、機能的、化学的、生化学的、生理学的、組織学的、遺伝的、または患者の身体に関連する任意の数の他のタイプの特徴であり得る。例として、本開示のシステムおよび方法の特定の実施形態によって利用される生物学的特徴(例えば、血管系、呼吸器系、肺、心臓、もしくは腎臓などの器官、または他の解剖学的領域などの、患者の特定の解剖学的領域に関連する)が本明細書に開示されている。 Biological features / analyzes of subject application are sometimes referred to herein as biomarkers. The term "biological" or the prefix "bio" is used to characterize a biological feature or biomarker, which means that the feature or marker has some relevance to the patient's body. It is intended only to do. For example, biological features can be anatomical, morphological, compositional, functional, chemical, biochemical, physiological, histological, genetic, or any number related to the patient's body. It can be another type of feature. By way of example, biological features utilized by certain embodiments of the systems and methods of the present disclosure, such as organs such as the vascular system, respiratory system, lungs, heart, or kidneys, or other anatomical areas. (Relevant to the particular anatomical region of the patient) is disclosed herein.
本開示の例示的なシステムおよび方法は、病変/疾患の検出、特徴付け、および治療に向けられてもよいが、本開示のシステムおよび方法の適用は、病変/疾患に限定されるものではなく、むしろ、例えば、症候群、障害、外傷、アレルギー反応などを含む、患者の任意の臨床的に関連する病状に関して、より一般的に適用可能であってもよい。 Although exemplary systems and methods of the present disclosure may be directed to the detection, characterization, and treatment of lesions / diseases, the application of the systems and methods of the present disclosure is not limited to lesions / diseases. Rather, it may be more generally applicable with respect to any clinically relevant medical condition of the patient, including, for example, syndromes, disorders, trauma, allergic reactions, and the like.
例示的な実施形態では、本開示のシステムおよび方法は、例えば、生態に関する知識を使用して医用画像を分析して、研究を通じて決定された疾患タイプ間の差異を測定し、ひいては転帰を予測する表現型を示すための、コンピュータ支援表現型決定に関する。したがって、いくつかの実施形態では、病変を特徴付けることは、病変の表現型を決定することを含んでもよく、表現型は次いで予測転帰を決定することができる。 In exemplary embodiments, the systems and methods of the present disclosure use, for example, knowledge of ecology to analyze medical images to measure differences between study-determined disease types and thus predict outcomes. Concerning computer-aided phenotypic determination to indicate phenotypes. Thus, in some embodiments, characterizing a lesion may include determining the phenotype of the lesion, which in turn can determine the predicted outcome.
図1を最初に参照すると、例示的なシステム100の概略図が描かれている。訓練器モジュール110、分析器モジュール120、およびコホートツールモジュール130によって表現されるように、システム100によって提供され得る3つの基本的な機能が存在する。描かれているように、分析器モジュール120は、有利には、最初に、(i)患者50の1つ以上の取得された画像121Aからのイメージング特徴122と、(ii)患者50のための非イメージング入力データ121Bとの組み合わせを利用して生物学的性状/分析物130を識別および定量化し、次いで、定量化された生物学的性状/分析物123に基づいて1つ以上の病変(例えば、予後表現型)124を識別し、特徴付ける階層分析フレームワークを実装する。分析器モジュール120は、有利には、1つ以上の事前訓練された、例えば、その推論を引き出すための機械学習アルゴリズムを実装することによって、グラウンドトゥルースまたは検証参照から独立して動作することができる。 With reference to FIG. 1 first, a schematic diagram of an
例示的な実施形態では、分析器は、患者50の取得された画像121Aからイメージング特徴122を算出するためのアルゴリズムを含んでもよい。画像特徴122のいくつかは、有利には、ボクセルごとに計算されてもよいが、他の画像特徴は、関心領域に基づいて計算されてもよい。取得された画像121Aと共に利用され得る非イメージング入力121Bの例は、実験室システム、患者が報告した症状、または患者の病歴からのデータを含んでもよい。 In an exemplary embodiment, the analyzer may include an algorithm for calculating imaging features 122 from the acquired
上記のように、画像特徴122および非イメージング入力は、生物学的性状/分析物123を算出するために分析器モジュール120によって利用されてもよい。特に、生物学的性状/分析物は、典型的には、例えば、マーカー(化学物質など)の存在および程度、または関心領域の構造、サイズ、または解剖学的特性などの他の測定値を表現することができる定量的な客観的性状(例えば、印象または外観として記載されるのではなく、客観的に検証可能な)である。例示的な実施形態では、定量化された生物学的性状/分析物123は、分析器モジュールによるさらなる処理に加えて、またはそれとは独立して、ユーザによる、例えば臨床医による直接利用のために表示またはエクスポートされてもよい。 As mentioned above, the image feature 122 and the non-imaging input may be utilized by the
例示的な実施形態では、定量化された生物学的性状/分析物123のうちの1つ以上を、表現型を決定するための入力として使用することができる。表現型は典型的には、イメージングとは独立した疾患固有の方法で定義され、多くの場合、期待される転帰との関係が文書化されているエクスビボの病態生理学的サンプルから引き出される。例示的な実施形態では、分析器モジュール120はまた、決定された表現型に予測された転帰125を提供することもできる。 In an exemplary embodiment, one or more of the quantified biological properties / analyte 123 can be used as inputs to determine the phenotype. The phenotype is typically defined in a disease-specific manner independent of imaging and is often derived from Exvivo's pathophysiological samples whose relationship to expected outcomes is documented. In an exemplary embodiment, the
分析器モジュール120の例示的な実装は、システム100の一般的な説明に従う特定の実施形態に関して、本明細書でさらに説明されることが理解されるべきである。特に、特定のイメージング特徴、生物学的性状/分析物、および病変/表現型は、血管系または呼吸器系などの特定の医療用途に関して説明されている。 It should be understood that the exemplary implementation of the
さらに図1を参照すると、コホートツールモジュール130は、例えば、問題のコホート研究に関連する選択された一連の基準に基づいて、患者のグループ分析のために患者のコホートを定義することを可能にする。例示的なコホート分析は、臨床試験に登録された患者のグループのためのものであってもよく、例えば、患者は、例えば治療群対対照群などの試験の1つ以上の群に基づいてさらにグループ化されてもよい。別のタイプのコホート分析は、グラウンドトゥルースまたは参照が存在する被験者のセットに対するものであってもよく、このタイプのコホートは、訓練セットまたは「開発」セットとテストまたは「ホールドアウト」セットにさらに分解されてもよい。分析器モジュール120内のアルゴリズムおよびモデルを訓練する(112)ために開発セットをサポートすることができ、分析器モジュール120内のアルゴリズムまたはモデルの性能を評価/検証する(113)ためにホールドアウトセットをサポートすることができる。 Further referring to FIG. 1, the
図1を引き続き参照すると、訓練器モジュール110を利用して、分析器モジュール120内のアルゴリズムおよびモデルを訓練する112ことができる。特に、訓練器モジュール110は、例えば、確立された機械学習パラダイムに従って、またはアルゴリズム開発者に通知することによって、重みまたはモデルを導出するために、グラウンドトゥルース111および/または参照注釈114に依存してもよい。例示的な実施形態では、分類および回帰モデルが使用され、これは、高度に適応可能であり、例えば、予測因子と応答との間の複雑な関係を明らかにすることができてもよい。ただし、既存のデータ内の基礎となる構造に適応するこれらのモデルの能力により、モデルは、被験者の別のサンプルでは再現できないパターンを見つけることができてもよい。既存のデータ内の再現不可能な構造への適応は、一般にモデルのオーバーフィッティングとして知られている。オーバーフィッティングモデルの構築を回避するために、最終的なモデルが見せかけの構造を見つけるのを防ぎ、モデルが評価されたデータのセット上で同様の程度の精度で新しいサンプルを予測するという確信を、エンドユーザが有することを可能にする体系的なアプローチが適用されてもよい。 With reference to FIG. 1, the trainer module 110 can be utilized to train the algorithms and models in the
連続した訓練セットを利用して最適な調整パラメータ(複数可)を決定し、テストセットを利用してアルゴリズムまたはモデルの予測性能を推定することができる。訓練セットは、ランダム化された交差検証を介して分類器の各々を訓練するために使用することができる。データセットは、訓練セットおよびテストセットに反復的に分割でき、分類性能およびモデルパラメータを決定するために使用することができる。データセットの訓練セットとテストセットとへの分割は、層化されたまたは最大の非類似度アプローチを使用して行われる。例示的な実施形態では、(i)最適なパラメータ推定値、および(ii)モデルの予測性能の信頼区間を得るために、最サンプリングアプローチ(例えば、ブートストラップ)を訓練セット内で利用することができる。 A continuous training set can be used to determine the optimal adjustment parameters (s), and a test set can be used to estimate the predictive performance of the algorithm or model. The training set can be used to train each of the classifiers through randomized cross-validation. The dataset can be iteratively divided into training sets and test sets and can be used to determine classification performance and model parameters. The division of the dataset into training and test sets is done using a stratified or maximum dissimilarity approach. In an exemplary embodiment, the best sampling approach (eg, bootstrap) may be utilized within the training set to obtain (i) optimal parameter estimates and (ii) confidence intervals for the predictive performance of the model. can.
図2は、本開示のシステムおよび方法によって利用され得る再サンプリングに基づくモデル構築アプローチ200の概要を示している。まず、ステップ210で、調整パラメータセットを定義することができる。次に、ステップ220で、各調整パラメータセットに対して、データを再サンプリングし、モデルをフィッティングし、ホールドアウトサンプルを予測する。ステップ230で、再サンプリング推定値が性能プロファイルに組み合わされる。次に、ステップ240で、最終調整パラメータを決定することができる。最後に、ステップ250で、訓練セット全体に最終調整パラメータを再フィッティングする。各モデルを訓練セットから調整した後、各々をテストセットにおける予測性能に対して評価することができる。テストセットの評価は、モデル構築プロセスがテストセットにオーバーフィッティングしないことを確認するために、各モデルに対して1回起こる。構築された各モデルに対して、最適な調整パラメータの推定値、再サンプリングされた訓練セットの性能、およびテストセットの性能を報告することができる。次に、ランダム化された分割に対するモデルパラメータの値を比較して、モデルの安定性および訓練データに対する堅牢性を評価する。 FIG. 2 outlines a resampling-based
本開示のシステムおよび方法によると、いくつかのモデルは、グラウンドトゥルースマップに表現される生物学的性状/分析物(例えば、組織タイプ)の各々に対して調整されてもよい。モデル応答は、例えば、共分散に基づく技術、非共分散に基づく技術、およびツリーに基づくモデルを含んでもよい。これらの構造に応じて、エンドポイントは、連続応答およびカテゴリ応答を有してもよく、上記のカテゴリの技術のいくつかは、カテゴリ応答と連続応答との両方に使用され、他の技術は、カテゴリ応答または連続応答のいずれかに固有である。各モデルに対して、最適な調整パラメータの推定値、再サンプリングされた訓練セットの性能、およびテストセットの性能を報告することができる。
上記の表1は、システム100の分析器モジュール120の例示的な機能のいくつかの要約を提供する。すなわち、分析器モジュール120は、フィールドを縁取るように、例えば、フィールドをまたいで複数のデータストリームを位置合わせするように、臓器、血管、病巣、および他の適用固有のオブジェクトをセグメンテーションするように、および/または特定の分析のために解剖学的構造を再フォーマット/再構成するように構成されてもよい。分析器モジュール120は、縁取られたフィールド内の標的、例えば病巣を縁取るように構成されてもよい。標的の縁取りは、例えば、ロケールで複数のデータストリームを位置合わせすること、きめ細かいセグメンテーションを実施すること、関連する解剖学的構造のサイズおよび/もしくは他の特性を測定すること、ならびに/または標的全体の特徴(例えば、標的領域全体に特徴的な生物学的性状/分析物)を抽出することが含んでもよい。いくつかの実施形態では、1つ以上のサブ標的領域も縁取られてもよく、例えば、標的領域は、サブ標的固有の計算(例えば、サブ標的領域の生物学的性状/分析物の特性)を使用した特定の適用に従ってサブ標的に分割されてもよい。分析器モジュール120はまた、例えば、特定のフィールド、標的、またはサブ標的領域において、成分または関連する特徴(組成など)を縁取ることもできる。これは、成分/特徴のセグメンテーションまたは再セグメンテーション、セグメンテーションされた成分/特徴の値の算出(例えば、成分/特徴の生物学的性状/分析物の特性)、および読み取り値への確率マップの割り当てを含んでもよい。次の病変は、生物学的に定量化された性状/分析物に基づいて、例えば、病変の表現型および/または予測転帰を決定することによって特徴付けられてもよい。いくつかの実施形態では、分析器モジュール120は、複数の時点にわたってデータを比較するように構成されてもよく、例えば、生物学的成分/分析物の1つ以上は、時間に基づく定量化を含んでもよい。さらなる実施形態では、広いスキャンフィールドを利用して、例えば、縁取られたフィールド内の複数の標的にわたる生物学的性状/分析物の集約的定量化に基づいて、多発性病病変を評価することができる。最後に、前述の分析に基づいて、分析器モジュール120は、患者レポートを生成するように構成されてもよい。 Table 1 above provides some summaries of exemplary functions of
サンプル患者レポート300を図3に示す。示されるように、サンプル患者レポート300は、構造310および組成320に関連するような生物学的パラメータ/分析物の定量化、および血行動態330などの非イメージングソースからのデータを含んでもよい。サンプル患者レポートは、視覚化340、例えば、画像データの2Dおよび/または3D視覚化、ならびにイメージングデータにオーバーレイされた血行動態データなどの非イメージングデータの組み合わされた視覚化をさらに含んでもよい。病変を決定し/特徴付けるための1つ以上のモデル(複数可)(例えば、決定木モデル)の視覚化を含む、生物学的パラメータ/分析物を評価するために、様々な分析350を表示することができる。患者の背景および識別情報がさらに含まれてもよい。したがって、システム100の分析器モジュール120は、有利には、ユーザに、例えば、臨床医に、患者を評価するための包括的なフィードバックを提供することができる。 Sample
本開示のシステムおよび方法は、有利には、特定の適用に適合させることができる。例示的な血管および肺の適用は、以下のセクションでより詳細に説明されている(ただし、記載されている特定の適用は、他の多くの適用に関して一般的な意味および相互運用性を有することが理解されるであろう)。表2は、本明細書に記載される階層分析フレームワークを利用した血管および肺関連適用の概要を提供する。
以下のセクションは、血管の適用に関して本開示のシステムおよび方法によって利用できる定量的生物学的性状/分析物の特定の例を提供する。
解剖学的構造:血管構造測定、特に狭窄度(%)の決定につながる血管構造測定は、長い間、患者ケアにおいて単一の最も使用されている測定であり、現在も続いている。これらの測定は当初、血管壁の内側と外側との両方の表面を含む壁の測定ではなく、内側の内腔の測定に限定されていた。ただし、X線血管造影とは異なり、すべての主要な非侵襲的モダリティは血管壁を分解することができ、これにより、達成され得る拡張された測定が行われる。カテゴリは幅広く、測定値は様々なサイズのオブジェクトであるため、一般化には注意して行う必要がある。主な考慮事項は、空間サンプリングまたは解像度の制限である。しかしながら、壁の厚さの最小限に検出可能な変化は、部分的な体積効果に起因する強度レベルのわずかな変化を利用することによって、空間サンプリングよりも低くなる可能性がある。追加的に、記載されている分解能は、一般に、分解できる最小の特徴サイズを決定するイメージングプロトコルの実際の分解能ではなく、取得後の再構成のグリッドサイズおよび視野を指している。同様に、面内分解能と面貫通分解能は同じである場合と同じでない場合があり、所定の特徴のサイズだけでなく、その性状および形状も測定精度を左右する。最後になったが、いくつかのケースでは、測定値に閾値を適用することから定型的な結論が引き出されるが、これは、その後、感度と特異性との間のトレードオフを最適化する能力を有する信号検出理論に従って解釈されてもよい。The following sections provide specific examples of quantitative biological properties / analyzes available by the systems and methods of the present disclosure for vascular application.
Anatomy: Vascular structure measurements, especially those that lead to the determination of stenosis (%), have long been the single most used measurement in patient care and are still ongoing. Initially, these measurements were limited to measurements of the inner lumen, not of walls that included both the inner and outer surfaces of the vessel wall. However, unlike X-ray angiography, all major non-invasive modalities are capable of degrading the vessel wall, which provides an expanded measurement that can be achieved. Since the categories are wide and the measurements are objects of various sizes, generalization should be done with caution. The main consideration is spatial sampling or resolution limitations. However, the minimally detectable change in wall thickness can be lower than spatial sampling by taking advantage of the slight change in strength level due to the partial volume effect. In addition, the resolutions described generally refer to the post-acquisition reconstruction grid size and field of view, rather than the actual resolution of the imaging protocol that determines the smallest feature size that can be resolved. Similarly, the in-plane resolution and the in-plane resolution may or may not be the same, and not only the size of a predetermined feature but also its properties and shape determine the measurement accuracy. Last but not least, in some cases, applying thresholds to measurements draws stereotyped conclusions, which in turn are the ability to optimize the trade-off between sensitivity and specificity. It may be interpreted according to the signal detection theory having.
組織の特徴:例えば脂質に富む壊死性コア(LRNC)、線維症、プラーク内出血(IPH)、透過性、および石灰化を含む、動脈硬化性プラークの個々の成分の定量的評価は、内科的または外科的療法の過程に関する医師の決定を支援することができる、プラークの相対的な構造的完全性に関する重要な情報を提供することができる。イメージング技術の観点から、これを行う能力は、空間分解能よりも、異なる組織が異なる受信信号を生成するように入射エネルギーに異なるように反応することによって可能になるコントラスト分解能および組織の区別に依存する。各イメージングモダリティはこれをある程度まで行っている:「エコールーセンシー」などの超音波の用語、ハウンズフィールド単位のCT値、およびT1、T2、およびT2*などの様々なシーケンスの関数としての微分MR強度(ただしこれらに限定されない)。 Tissue characteristics: Quantitative assessment of individual components of arteriosclerotic plaque, including, for example, lipid-rich necrotic core (LRNC), fibrosis, intra-plaque hemorrhage (IPH), permeability, and calcification, is medical or It can provide important information about the relative structural integrity of plaques that can assist physicians in making decisions about the course of surgical treatment. From the point of view of imaging technology, the ability to do this depends on the contrast resolution and tissue distinction made possible by differently reacting to incident energies so that different tissues produce different received signals, rather than spatial resolution. .. Each imaging modality does this to some extent: ultrasonic terms such as "echo lucency", CT values per Houndsfield, and differential MR as a function of various sequences such as T1, T2, and T2 *. Strength (but not limited to these).
動的組織挙動(例えば、透過性):血管壁/プラークの形態学的特徴に加えて、動的特徴が血管病変の貴重な定量的指標であるという認識が高まっている。取得が複数の密接に間隔をあけて行われる動的シーケンス(フェーズとして知られている)は、空間的に分解された値tを超えてレパートリーを拡張し、コンパートメントモデリングまたは刺激に対する組織の動的応答を決定するための他の技術(例えば、限定されないが、造影剤のウォッシュインおよびウォッシュアウト)に使用することができる時間的に分解された値を含む。頸動脈における超音波またはMRを使用した動的コントラスト強化イメージングまたは冠動脈内の遅延コントラスト強化の使用を通じて、関心のあるプラーク内の新生血管化の微小血管ネットワークの相対的な透過性(例えば、力学的分析からのKtransおよびVpパラメータ)の感度の高い評価を決定することができる。加えて、これらの動的シリーズは、血管透過性の増加とプラーク内出と血の区別にも役立つ。 Dynamic tissue behavior (eg, permeability): In addition to the morphological features of vascular walls / plaques, there is growing recognition that dynamic features are a valuable quantitative indicator of vascular lesions. A dynamic sequence (known as a phase), in which acquisitions are made at multiple closely spaced intervals, extends the repertoire beyond the spatially decomposed value t, and the dynamics of the tissue to compartment modeling or stimuli. Includes time-resolved values that can be used in other techniques for determining the response, such as, but not limited to, contrast agent wash-in and wash-out. Relative permeability of neovascularization microvascular networks within plaques of interest (eg, mechanical) through the use of dynamic contrast enhancement imaging in the carotid artery using ultrasound or MR or delayed contrast enhancement in the coronary arteries. A sensitive assessment of Ktrans and Vp parameters) from the analysis can be determined. In addition, these dynamic series also help increase vascular permeability and distinguish between plaque excretion and blood.
血行動態:循環の基本的な血行動態パラメータは、血管障害に直接影響を与える。血圧、血流速度、および血管壁せん断応力は、非常に単純なオシロメトリーから高度なイメージング分析に至るまでの技術で測定することができる。流体力学の一般的な原理を使用して、血管壁せん断応力の計算を壁の様々な領域で確認することができる。同様に、MRIは、USの組み合わせの有無にかかわらず、壁せん断応力(WSS)を算出し、その結果を関心のある血管の構造変化と相関させるために使用されている。加えて、血行動態に対する降圧薬の効果は、短期および長期の研究で追跡調査されている。 Hemodynamics: The basic hemodynamic parameters of the circulation directly affect angiopathy. Blood pressure, blood flow velocity, and vessel wall shear stress can be measured by techniques ranging from very simple oscillometry to advanced imaging analysis. Using the general principles of hydrodynamics, the calculation of vessel wall shear stress can be confirmed in various regions of the wall. Similarly, MRI is used to calculate wall shear stress (WSS) with or without a combination of US and correlate the results with structural changes in the vessel of interest. In addition, the effects of antihypertensive drugs on hemodynamics have been followed up in short-term and long-term studies.
したがって、例示的な実施形態では、血管設定において本開示のシステムおよび方法を適用することの重要な側面は、プラーク構造およびプラーク組成を評価することを含んでもよい。プラーク構造を評価することは、有利には、例えば、内腔測定(これは、直径測定だけでなく面積を提供することによって狭窄測定を改善する)、および壁測定(例えば、壁の厚さおよび血管再モデリング)を含んでもよい。プラーク組成を評価することは、有利には、先行技術で典型的に見られるような単なる「ソフト」または「ハード」の指定だけではなく、組織特性(例えば、脂質コア、線維症、石灰化、透過性など)の定量化を含んでもよい。以下の表3および表4は、それぞれ、本開示のシステムおよび方法の血管適用によって利用できる、例示的な構造計算および組織特性計算を説明する。
血管系の評価に関連する例示的なシステムは、有利には、血管構造を評価するためのアルゴリズムを含む/使用することができる。したがって、システムは、例えば、イメージングされた血管の基礎となる構造をセグメンテーションするための標的/血管セグメント/断面モデルを使用することができる。高速進行競争フィルタを別々の血管セグメントに有利に適用することができる。システムは、血管分岐を処理するようにさらに構成されてもよい。画像位置合わせは、マテス相互情報(MR)または平均二乗誤差(CT)メトリック、剛体ベルソル変換、またはLBFGSBオプティマイザなどを利用して適用することができる。本明細書に記載されているように、血管セグメンテーションは、有利には、内腔セグメンテーションを含んでもよい。初期の内腔セグメンテーションは、内腔を区別するために、信頼接続フィルタ(例えば、頸動脈、椎骨、大腿骨など)を利用することができる。内腔セグメンテーションは、MRイメージング(正規化された、例えば、暗いコントラストのために反転された画像の組み合わせなど)、またはCTイメージング(位置合わせされたプレコントラスト、ポストコントラストCT、および2Dガウス分布の使用など)を利用して血管性機能を定義することができる。様々な連結成分を分析し、閾値を適用することができる。血管セグメンテーションは、外壁セグメンテーションをさらに伴う場合がある(例えば、内腔の不規則性を説明するために最小曲率(k2)フローを利用する)。いくつかの実施形態では、エッジ電位マップは、コントラストおよび非コントラストの両方における外向きから下向きの勾配として算出される。例示的な実施形態では、外壁セグメンテーションは、いかなる他のエッジ情報もない場合に厚さの中央値を可能にするために、速度関数に累積分布関数(壁厚さの事前分布、例えば1〜2の隣接するレベルからの分布を組み込む)を利用してもよい。例示的な実施形態では、フェレットの直径は、血管の特徴付けのために使用されてもよい。さらなる実施形態では、壁の厚さは、内腔までの距離と外壁までの距離の合計として算出することができる。さらなる実施形態では、内腔および/または壁のセグメンテーションは、例えば、CNNを使用するセマンティックセグメンテーションを使用して行うことができる。 An exemplary system related to the evaluation of the vascular system can advantageously include / use an algorithm for evaluating the vascular structure. Thus, the system can use, for example, a target / vascular segment / cross-section model to segment the underlying structure of the imaged blood vessel. The fast traveling competition filter can be applied advantageously to separate vascular segments. The system may be further configured to handle vascular bifurcation. Image alignment can be applied using Mates Mutual Information (MR) or Mean Squared Error (CT) metrics, rigid body Belsol transformations, LBFGSB optimizers, and the like. As described herein, vascular segmentation may advantageously include luminal segmentation. Early lumen segmentation can utilize reliable connection filters (eg, carotid arteries, vertebrae, femurs, etc.) to distinguish the lumen. Cavity segmentation is the use of MR imaging (normalized, eg, a combination of images inverted for dark contrast), or CT imaging (aligned pre-contrast, post-contrast CT, and 2D Gaussian distribution). Etc.) can be used to define vascular function. Various connected components can be analyzed and thresholds can be applied. Vascular segmentation may be further accompanied by outer wall segmentation (eg, utilizing minimal curvature (k2) flow to account for luminal irregularities). In some embodiments, the edge potential map is calculated as an outward to downward gradient in both contrast and non-contrast. In an exemplary embodiment, the outer wall segmentation has a cumulative distribution function (prior distribution of wall thickness, eg 1-2) in the velocity function to allow median thickness in the absence of any other edge information. Incorporate the distribution from adjacent levels of). In an exemplary embodiment, the ferret diameter may be used for vascular characterization. In a further embodiment, the wall thickness can be calculated as the sum of the distance to the lumen and the distance to the outer wall. In a further embodiment, lumen and / or wall segmentation can be performed using, for example, semantic segmentation using CNN.
血管系の評価に関連する例示的なシステムは、血管組成をさらに有利に分析することができる。例えば、いくつかの実施形態では、組成は、画像強度および他の画像特徴に基づいて決定されてもよい。いくつかの実施形態では、管腔形状は、例えば、血栓症の決定に関連するものとして利用することができる。分析物ブロブモデルを有利に使用して、血管の特定のサブ領域の組成をよりよく分析することができる。分析物のブロブは、2D、3D、または4D画像で、1つのクラスの生物学的分析物の空間的に隣接する領域であると定義する。ブロブモデルは、等輪郭を使用して、例えば、内腔表面から血管壁の外膜表面までの正規化された半径方向の距離において、解剖学的に整列された座標系を利用することができる。モデルは、有利には、1つ以上のブロブを識別し、例えば、全体的な血管構造に関して、および他のブロブと比較して、各ブロブ位置を分析することができる。例示的な実施形態では、ハイブリッドベイジアン/マルコフネットワークを利用して、ブロブの相対位置をモデリングすることができる。モデルは、有利には、隠れた分析物カテゴリノードの局所的な近傍によって影響を受けているピクセルまたはボクセルで観察された画像強度を説明し、それによって部分体積およびスキャナ点広がり関数(PSF)を説明することができる。モデルは、分析器モジュールによる推論中に分析物確率マップから分析物ブロブ境界を動的に縁取ることをさらに可能にし得る。これは、スーパーピクセルアプローチを使用した場合など、分析される小さな領域を事前に計算するが、これらの領域を動的に調整できない一般的なマシンビジョンアプローチとの重要な違いである。分析物の確率とブロブ境界との両方の現在の推定値を利用する反復推論手順を適用することができる。いくつかの実施形態では、パラメトリックモデリングの想定またはカーネル密度推定方法を使用して、モデルを訓練するために使用される疎なデータ間の確率密度推定を可能にすることができる。 An exemplary system related to the evaluation of the vascular system can analyze vascular composition even more advantageously. For example, in some embodiments, the composition may be determined based on image intensity and other image features. In some embodiments, the luminal shape can be utilized, for example, as related to the determination of thrombosis. Analyte blob models can be advantageously used to better analyze the composition of specific subregions of blood vessels. An analyte blob is defined as a spatially adjacent region of a class of biological analyte in a 2D, 3D, or 4D image. The blob model can utilize an anatomically aligned coordinate system using equi-contours, for example, at a normalized radial distance from the luminal surface to the adventitial surface of the vessel wall. .. The model can advantageously identify one or more blobs and analyze the location of each blob, eg, with respect to the overall vascular structure and relative to other blobs. In an exemplary embodiment, a hybrid Bayesian / Markov network can be utilized to model the relative position of the blob. The model advantageously describes the image intensity observed at the pixel or voxel affected by the local proximity of the hidden analyte category node, thereby providing the partial volume and scanner point spread function (PSF). Can be explained. The model may further allow for dynamically framing the analyte blob boundaries from the analyte probability map during inference by the analyzer module. This is an important difference from the general machine vision approach, where small areas to be analyzed are pre-computed, such as when using the superpixel approach, but these areas cannot be adjusted dynamically. Iterative inference procedures can be applied that utilize current estimates of both the probability of the analyte and the blob boundary. In some embodiments, parametric modeling assumptions or kernel density estimation methods can be used to enable probability density estimation between sparse data used to train the model.
ここで紹介するのは、組織学から放射線学への位置合わせのための要件を除去する、血管プラーク成分の組成の分類のための新規のモデルである。このモデルは、依然として専門家による注釈付き組織学を参照標準として利用しているが、モデルの訓練では、放射線イメージングへの位置合わせは必要ない。マルチスケールモデルは、「ブロブ」と呼ばれ得る所与の分析物タイプの各連続した領域の統計量を計算する。血管を通る断面内では、壁は2つの境界、つまり内腔との内側の境界および血管壁の外側境界によって定義され、断面にドーナツ形状を作成する。ドーナツ形状の壁領域内には、離散的な数のブロブがある(ブロブとはみなされない通常の壁組織のデフォルトのバックグラウンドクラスとは異なる)。ブロブの数は、離散確率変数としてモデリングされる。次に、各ブロブに分析物タイプのラベルが割り当てられ、様々な形状記述子が計算される。追加的に、blobはペアワイズとみなされる。最後に、各ブロブ内で、各ピクセルは放射線イメージング強度値を生成することができ、これは、各分析物タイプに固有の連続的に評価される分布から得られる、独立した同一分布(i.i.d.)サンプルとしてモデリングされる。この最後のステップでは、イメージング強度分布のパラメータは訓練プロセスの一部ではないことに留意されたい。 Introduced here is a novel model for the classification of the composition of vascular plaque components that removes the requirement for histology-to-radiology alignment. The model still utilizes expert annotated histology as a reference standard, but training the model does not require alignment to radiation imaging. The multiscale model calculates a statistic for each contiguous region of a given analyte type, which can be called a "blob". Within the cross section through the vessel, the wall is defined by two boundaries, the inner boundary with the lumen and the outer boundary of the vessel wall, creating a donut shape in the cross section. Within the donut-shaped wall area, there is a discrete number of blobs (unlike the default background class of normal wall tissue, which is not considered a blob). The number of blobs is modeled as a discrete random variable. Each blob is then assigned an analyte type label and various shape descriptors are calculated. In addition, blobs are considered pairwise. Finally, within each blob, each pixel can generate a radiation imaging intensity value, which is an independent identical distribution (i. i.d.) Modeled as a sample. Note that in this final step, the parameters of the imaging intensity distribution are not part of the training process.
このモデルの1つの重要な特徴は、血管内の分析物ブロブの空間的な関係を考慮していることであり、点単位の画像特徴(組織学および/または放射線学からのものであるかどうかにかかわらず)が専門家がプラーク組成を決定するための唯一の情報源ではないことを認識していることである。このモデルでは、組織学から放射線学への明示的な位置合わせを伴わずに訓練を行うことができるが、その位置合わせが既知である状況にも適用できる。未見のプラークを分類するための動脈硬化性プラーク成分の空間レイアウトを統計的にモデリングすることは、新規の概念であると考えられる。 One important feature of this model is that it takes into account the spatial relationships of the analyte blobs within the vessel, whether from point-by-point imaging features (histology and / or radiology). Regardless of), they recognize that experts are not the only source of information for determining plaque composition. This model allows training without explicit alignment from histology to radiology, but can also be applied in situations where the alignment is known. Statistical modeling of the spatial layout of arteriosclerotic plaque components to classify unseen plaques may be a novel concept.
CTまたはMR画像から血管壁の組成を推定するための例示的な技術については、次のセクションでさらに詳しく説明する。特に、これらの方法は、マルチスケールベイズ分析モデルを使用してもよい。基本的なベイズ定式化は次のとおりである。
本開示の文脈において、仮説は、CTまたはMR画像強度情報Iからの観察コーミングを伴う、マルチスケール血管壁分析物マップAに基づくことができる。 In the context of the present disclosure, the hypothesis can be based on a multiscale vessel wall analyzer map A with observational combing from CT or MR image intensity information I.
図4に描かれているように、マルチスケールの血管壁分析物マップは、有利には、壁レベルのセグメンテーション410(例えば、血管の断面スライス)、ブロブレベルのセグメンテーション、およびピクセルレベルのセグメンテーション430(例えば、個々の画像ピクセルに基づく)を含んでもよい。例えば、A=(B、C)は、血管壁クラスラベルのマップ(頂点Bおよび辺Cを有するグラフに類似している)として定義されてもよく、ここで、Bは、ブロブのセット(ラベルを共有する非背景壁の断面的に連続する領域)であり、Cは、ブロブの対またはペアのセットである。Bbは、一般的な単一のブロブとして定義することができ、ここで、b∈[1..nB]はA内のすべてのブロブのインデックスである。Bbaはラベルaを有するブロブである。統計上の目的で、個々のブロブ記述子演算子DB{}は低次元空間にある。Ccは、ブロブのペアとして定義することができ、ここで、c∈[1..nB(nB−1)/2]は、Aの全ブロブペアのインデックスである。Ccf,gは、ラベルfおよびgを有するブロブペアである。統計上の目的で、ブロブペア記述子演算子DC{}は低次元空間にある。A(x)=aは、ピクセルxのクラスラベルとして定義でき、ここで、a∈{‘CALC’、‘LRNC’、‘FIBR’、‘IPH’、‘background’}(構成特性)である。例示的な実施形態では、I(x)は、ピクセルxでの連続的に値付けされたピクセル強度である。各ブロブ内で、I(x)は独立したものとしてモデリングされる。モデルは3D放射線画像の壁構成を分類するために使用されるので、「ピクセル」という単語は2Dピクセルと3Dボクセルの両方を一般的に示すために使用されることに留意されたい。As depicted in FIG. 4, the multiscale vascular wall analyzer map advantageously provides wall-level segmentation 410 (eg, vessel cross-sectional slices), blob-level segmentation, and pixel-level segmentation 430 (eg, vascular cross-section slices). For example, based on individual image pixels) may be included. For example, A = (B, C) may be defined as a map of vessel wall class labels (similar to a graph with vertices B and sides C), where B is a set of blobs (labels). A cross-sectional contiguous region of a non-background wall that shares), where C is a set of blob pairs or pairs. Bb can be defined as a general single blob, where b ∈ [1. .. nB ] is the index of all blobs in A. Bba is a blob with the label a. For statistical purposes, each blob descriptor operator DB {} is in the low dimensional space. Cc can be defined as a pair of blobs, where c ∈ [1. .. nB (nB -1) / 2] is the index of all blob pairs of A. Ccf, g are blob pairs with labels f and g. For statistical purposes, Burobupea descriptor operator DC {} is the low dimensional space. A (x) = a can be defined as a class label of pixel x, where a ∈ {'CALC','LRNC','FIBR','IPH','baccground'} (constituent characteristics). In an exemplary embodiment, I (x) is a continuously priced pixel intensity at pixel x. Within each blob, I (x) is modeled as independent. Note that the word "pixel" is used to commonly refer to both 2D pixels and 3D voxels, as the model is used to classify the wall composition of 3D radiographic images.
同様の組成/構造のブロブ領域の特性は、有利には、疾患プロセスに関する洞察を提供することができる。血管の各スライス(例えば、断面スライス)は、有利には、複数のブロブを含んでもよい。ブロブ間の関係は、ペア単位で評価することができる。断面内のブロブの数は、離散確率変数としてモデリングされており、定量化可能な有意性も有してもよい。セグメンテーションのスライスレベルでは、関連する特性(例えば、生物学的性状/分析物)は、特定の構造/組成分類のブロブの総数および/またはブロブの数の定量化、ブロブ間の関係、例えば、内部に近いといった空間的関係を含んでもよい。セグメンテーションのブロブレベルでは、各ブロブの特性、例えば、構造的特性、例えば、サイズおよび形状、ならびに組成的特性などが、生物学的性状/分析物として機能するように評価されてもよい。最後に、セグメンテーションのピクセルレベルで、個々のピクセルレベルの分析、例えば、基となる画像強度分布を実施してもよい。 The properties of the blob region of similar composition / structure can advantageously provide insights into the disease process. Each slice of blood vessel (eg, cross-section slice) may advantageously contain multiple blobs. Relationships between blobs can be evaluated on a pair-by-pair basis. The number of blobs in a cross section is modeled as a discrete random variable and may also have quantifiable significance. At the slice level of segmentation, the relevant properties (eg, biological properties / analysts) are the total number and / or number of blobs of a particular structural / composition classification, the quantification of the number of blobs, the relationships between blobs, eg, internal. It may include a spatial relationship such as close to. At the blob level of segmentation, the properties of each blob, such as structural properties, such as size and shape, as well as compositional properties, may be evaluated to function as biological properties / analysts. Finally, at the pixel level of the segmentation, individual pixel level analysis, eg, the underlying image intensity distribution, may be performed.
特性の確率マッピングは、図4に描かれているマルチスケールの血管壁分析物マップに関して適用されてもよい。確率マッピングは、有利には、各クラスの分析物の確率のためのベクトルの成分と、背景組織の確率のための1つの成分と、を有するすべてのピクセルの確率のベクトルを確立することができる。例示的な実施形態では、確率ベクトルのセットは、相互に排他的な特性を表現してもよい。したがって、相互に排他的な特性を表現する確率ベクトルの各セットの合計は1になる。例えば、いくつかの実施形態では、ピクセルは、1つの、およびただ1つの組成カテゴリに分類されるべきであることが既知であってもよい(例えば、血管の単一の座標は、線維性のものと石灰化されたものとの両方であってはならない)。特に注目すべきは、確率マッピングは、ピクセル間の分析物クラスの独立性を想定していないことである。これは、隣接するピクセルまたは同じブロブ内のピクセルが、典型的に、同じまたは類似の特性を有している可能性があるためである。したがって、本明細書でより詳細に説明されるように、確率マッピングの説明は、ピクセル間の依存性を有利に説明する。 Probabilistic mapping of properties may be applied with respect to the multi-scale vessel wall analyzer map depicted in FIG. Probability mapping can advantageously establish a vector of probabilities for all pixels with a vector component for the probabilities of each class of analyte and one component for the probabilities of the background texture. .. In an exemplary embodiment, the set of probability vectors may represent mutually exclusive properties. Therefore, the sum of each set of probability vectors representing mutually exclusive properties is 1. For example, in some embodiments, it may be known that pixels should be classified into one and only one composition category (eg, a single coordinate of a blood vessel is fibrous). It cannot be both a thing and a calcified thing). Of particular note is that probability mapping does not assume the independence of the analysis class between pixels. This is because adjacent pixels or pixels in the same blob may typically have the same or similar properties. Therefore, as described in more detail herein, the description of probability mapping favorably describes the dependencies between pixels.
f(A=α)は、マップaの確率密度として定義することができる。f(A)は、すべての血管壁にわたる確率分布関数である。f(DB{Ba}=β)は、ラベルaを有する記述子ベクトルβの確率密度である。f(DB{Ba})は、ラベルaを有するブロブ記述子の確率密度関数(pdf)である。各aの値に対して確率分布関数がある。f(B)=Πf(DB{Ba})f(DC{Cf,g}=γ)は、ラベルfおよびgを有するペアワイズ記述子ベクトルγの確率密度である。f(DC{Cf、g})は、ペアワイズブロブ記述子の確率密度関数(pdf)である。各順序ペアf、gに対して確率分布関数がある。したがって以下のとおりである:
f(C)=Π f(Dc{Ca})
f(A)=f(B) f(C)=Π f(Db{Ba})Π f(Dc{Ca})
P(A(x)=a)は、ピクセルxがラベルaを有する確率である。P(A(x))は、分析物の確率質量関数(pmf)(有病率)である。これは、特定のピクセルxでの確率のベクトル、または特定のクラスラベル値の確率マップとみなすことができる。
f(A)=P(N)・f(C)・f(B)=P(N)・Πf(Cc)・Πf(Bb)であることに留意されたい。f (A = α) can be defined as the probability density of the map a. f (A) is a probability distribution function across all vessel walls.f (D B {B a} = β) is the probability density of the descriptor vector beta having a label a.f (D B {B a} ) is the probability density function of the blob descriptor has the label a (pdf). There is a probability distribution function for each value of a.f (B) = Πf (D B {B a}) f (D C {C f, g} = γ) is the probability density of the pair-wise descriptor vectors gamma with labels f and g.f (D C {C f, g}) is the probability density function of the pairwise blob descriptor (pdf). There is a probability distribution function for each order pair f, g. Therefore:
f (C) = Π f (Dc {Ca })
f (A) = f (B) f (C) = Π f (Db {Ba }) Π f (Dc {Ca })
P (A (x) = a) is the probability that pixel x has the label a. P (A (x)) is the probability mass function (pmf) (prevalence) of the analyte. This can be thought of as a vector of probabilities at a particular pixel x, or a probability map of a particular class label value.
Note that f (A) = P (N), f (C), f (B) = P (N), Πf (Cc ), Πf (Bb).
f(Cc=γ)は、ペアワイズ記述子ベクトルγの確率密度である。f(Cc)は、ペアワイズブロブ記述子の確率密度関数(pdf)である。f(Bb=β)は、記述子ベクトルβの確率密度である。f(Bb)は、ブロブ記述子の確率密度関数(pdf)である。P(A(x)=a)は、ピクセルxがラベルaを有する確率である。P(A(x))は、分析物の確率質量関数(pmf)である(所与のマップにおける有病率)。これは、特定のピクセルxでの確率のベクトル、または特定の分析物タイプの空間確率マップとみなすことができる。P(A(x)=a|I(x)=i)は、計算する主な目標である画像強度が与えられた場合の分析物の確率である。P(I(x)=i|A(x)=a)は、所与の分析物の画像強度の分布である。f (Cc = γ) is the probability density of the pairwise descriptor vector γ. f (Cc ) is the probability density function (pdf) of the pairwise blob descriptor. f (Bb = β) is the probability density of the descriptor vector β. f (Bb ) is the probability density function (pdf) of the blob descriptor. P (A (x) = a) is the probability that pixel x has the label a. P (A (x)) is the probability mass function (pmf) of the analyte (prevalence in a given map). This can be thought of as a vector of probabilities at a particular pixel x, or a spatial probability map of a particular analyte type. P (A (x) = a | I (x) = i) is the probability of the analyte given the image intensity, which is the main target to be calculated. P (I (x) = i | A (x) = a) is the distribution of the image intensity of a given analyte.
図5は、分析物の確率ベクトルのセットとしてのピクセルレベルの確率質量関数の例を描いている。上記のように、以下の想定は確率質量関数に情報を与えることができる。完全性:例示的な実施形態では、十分に小さなピクセルが分析物クラス(キャッチオールな「背景」カテゴリを含む)の少なくとも1つに分類されなければならず、確率の和は1になると想定することができる。相互排他性:十分に小さなピクセルは、1つのクラスの分析物にのみに属しているとみなすことができる。組み合わせがある場合(つまり、LRNC背景に棘状カルシウムがある場合)、相互排他性を維持するために新しい組み合わせクラスを作成することができる。非独立性:各ピクセルは、その隣接ピクセルおよびAの全体的な構造に大きく依存していると想定することができる。 FIG. 5 depicts an example of a pixel-level probability mass function as a set of probability vectors for an analyte. As mentioned above, the following assumptions can inform the probability mass function. Integrity: In an exemplary embodiment, it is assumed that sufficiently small pixels must be classified in at least one of the analyte classes (including the catch-all "background" category) and the sum of probabilities is 1. be able to. Mutual exclusivity: Small enough pixels can be considered to belong to only one class of analyte. If there are combinations (ie, spiny calcium in the LRNC background), new combination classes can be created to maintain mutual exclusivity. Non-independence: Each pixel can be assumed to be highly dependent on its adjacent pixels and the overall structure of A.
分析物マップの代替の見方は、所与の分析物の確率の空間マップとして見ることである。推論中の任意の所与の時点で、分析物のブロブは半値全幅ルールを使用して定義することができる。このルールを使用すると、その分析物の確率の各極大値に対して、領域が極大値の半分の低い閾値まで外側に向かって成長する。この50%の値は調整可能なパラメータであることに留意されたい。ここでは、境界をより現実的に保つために、確率マップでいくつかの曲率の展開を実施することによって、ブロブの空間正則化(トポロジカルホールがほとんどなく平滑である)を行うことができる。確率を折り畳むまで、これらは同じピクセルの対立仮説を表現し、したがって修飾子「推定」を表現するため、異なる分析物クラスの異なる可能性のある推定ブロブは、一般に空間的な重複を有する可能性があることに留意されたい。 An alternative view of the Analyte Map is to view it as a spatial map of the probabilities of a given Analyte. At any given point in the inference, the blob of the analyte can be defined using the full width at half maximum rule. Using this rule, for each maximal of the probability of the analyte, the region grows outward to a threshold that is half the local maxima. Note that this 50% value is an adjustable parameter. Here, in order to keep the boundaries more realistic, we can perform spatial regularization of blobs (smooth with few topological holes) by performing some curvature expansion in the probability map. Different potentially different putative blobs of different analyte classes may generally have spatial overlap, as they represent the alternative hypothesis of the same pixel, and thus the modifier "estimate", until the probabilities are folded. Please note that there is.
反復推論が終了すると、結果を表現するためのいくつかのオプションがある。まず、連続的に値付けされた確率マップは、表面プロット、等高線プロット、またはPET値をCT上に色相および彩度の変化として視覚化するのと同様の画像融合を使用することを含む(ただしこれらに限定されない)いくつかの形式のうちの1つでユーザに直接提示することができる。2番目の代替方法は、各ピクセルに対して1つの分析物ラベルを選択することによって、各ピクセルで確率マップを折り畳むことである。これは、各ピクセルで最大事後値を独立して選択することによって最も簡単に行うことができ、したがって、各分析物ラベルに異なる色を割り当て、放射線画像の上に完全または部分的な不透明度を割り当てることによって視覚化できるカテゴリマップを作成する。この2番目の代替方法では、各ブロブの確率の優先度に基づいて、重複する推定ブロブを分解することによって、ラベル値を独立せずに割り当てることができる。したがって、所与のピクセルにおいて、それがより高い確率のブロブに属する場合、より低い優先度の分析物の確率がラベルに使用される可能性がある。 Once the iterative inference is complete, there are several options for expressing the result. First, the continuously priced probability map involves using surface plots, contour plots, or image fusion similar to visualizing PET values as changes in hue and saturation on CT (although). It can be presented directly to the user in one of several formats (but not limited to these). The second alternative is to collapse the probability map at each pixel by selecting one analyte label for each pixel. This is most easily done by independently selecting the maximum posterior value for each pixel, thus assigning a different color to each analyte label and providing full or partial opacity over the radiographic image. Create a category map that can be visualized by assigning it. In this second alternative, label values can be assigned independently by decomposing overlapping estimated blobs based on the probability priority of each blob. Therefore, at a given pixel, if it belongs to a higher probability blob, the probability of a lower priority analyte may be used for the label.
図6は、推定分析物ブロブを計算するための技術を示している。例示的な実施形態では、推定ブロブは、重複する領域を有し得る。したがって、推定ブロブによるピクセルのセグメンテーションに分析技術を適用することが有利な場合がある。所与分析物の確率に対して、確率の極大値が決定される。次に、半値全幅ルールを適用して、離散ブロブを決定することができる。推論の任意の所与の反復において、分析物ブロブは半値全幅ルールを使用して定義することができる。極大値を見つけてから、0.5*maxの低い閾値で領域を成長させる。(50%の値は調整可能なパラメータである可能性がある。)いくつかの実施形態では、例えば、境界を平滑に保ち、穴を回避するために確率マップ上でいくつかの曲率展開を実施することによって、ブロブの空間正則化を適用することもできる。この段階では、異なる分析物クラスの異なる推定ブロブは、確率が崩壊するまで対立仮説を表現するため、一般に、空間的に重複する可能性があることに留意されたい。したがって、画像レベルの分析物マップは、例えば、確率マップ関数の崩壊に基づいて計算される。特に、この崩壊は、ピクセルレベルの分析物確率マップ、推定ブロブ、またはこれらの両方の組み合わせのいずれかに基づいて決定することができる。ピクセルレベルの分析物確率マップに関して、崩壊は、最大確率A(x):=arg maxa P(A(x)=a)のラベルを選択することによって、各ピクセルに対して決定することができる。これは、実装ビタビアルゴリズムに類似している。基本的に、相互に排他的な確率ベクトルの各セットに対して最高確率が固定される(例えば、分析物の優先順位が可能な結びつきを破壊した状態)。次に、セット内のすべての他の確率をゼロに設定することができる。いくつかの実施形態では、隣接するピクセル/領域の確率は、ピクセルレベルでデータを崩壊するときに考慮されてもよい。推定ブロブレベルの崩壊に関して、重複する推定ブロブが分解される可能性がある。いくつかの実施形態では、優先順位付けは、ブロブ確率密度f(D1{Aab}=d1)に基づくことができる。確率の高いブロブは、重複したより低い確率のブロブの形状を変化させる可能性があるため、これは、ブロブレベルの特性の分析に影響を与える可能性がある。例示的な実施形態では、データを崩壊するのではなく、確率の全範囲を維持することができる。FIG. 6 shows a technique for calculating the putative analyte blob. In an exemplary embodiment, the putative blob may have overlapping regions. Therefore, it may be advantageous to apply analytical techniques to pixel segmentation by estimated blobs. The maximum value of the probability is determined for the probability of a given analyte. The full width at half maximum rule can then be applied to determine the discrete blobs. For any given iteration of inference, the analyte blob can be defined using the full width at half maximum rule. After finding the maximum value, the region is grown with a low threshold of 0.5 * max. (A value of 50% may be an adjustable parameter.) In some embodiments, for example, some curvature expansion is performed on the probability map to keep the boundaries smooth and avoid holes. By doing so, blob spatial regularization can also be applied. It should be noted that at this stage, different putative blobs of different analyte classes generally represent spatial overlap as they represent alternative hypotheses until the probabilities collapse. Therefore, the image-level analysis map is calculated, for example, based on the collapse of the probability map function. In particular, this decay can be determined based on either a pixel-level analyte probability map, an estimated blob, or a combination of both. For pixel-level analyte probability maps, the decay can be determined for each pixel by selecting the label with maximum probability A (x): = arg maxa P (A (x) = a). This is similar to the implemented Viterbi algorithm. Basically, the highest probability is fixed for each set of mutually exclusive probability vectors (eg, broken associations that allow precedence of the analyte). Then all other probabilities in the set can be set to zero. In some embodiments, the probabilities of adjacent pixels / regions may be taken into account when collapsing data at the pixel level. Overlapping estimated blobs can be degraded with respect to the decay of estimated blob levels. In some embodiments, the prioritization can be based on the blob probability density f (D1 {Aab } = d1). This can affect the analysis of blob-level characteristics, as high-probability blobs can change the shape of overlapping, lower-probability blobs. In an exemplary embodiment, the full range of probabilities can be maintained rather than collapsing the data.
血管壁内のブロブの相対的な空間配置をモデリングするために、異なる画像間で回転、並進、およびスケール不変性を提供するために適切な座標系を選択することができる。これらの不変性は、動脈硬化プロセスが異なる血管床間で類似しているという前提の下で、あるタイプの血管(例えば、内膜切除標本が容易に入手可能な頸動脈)で訓練し、他の血管床(例えば、プラーク標本が一般的に入手できない冠動脈)にモデルを適用することができるため、モデルにとって重要である。管状オブジェクトの場合、自然座標系は血管の中心線から続き、ここで、中心線に沿った距離が縦座標を提供し、中心線に垂直な各平面は半径方向の距離および角度の極座標を有する。しかしながら、特に分析を目的とし得る罹患した患者では、血管壁の外形の変動性に起因して、改善された座標系が利用されることがある。縦方向の距離は、中心線または補間された垂直面に沿ってだけでなく、各3D放射線画像ピクセルに値が与えられるように計算される。特定のプラークに対して、中心線に垂直な近位面および遠位面は、各々元の画像グリッド上に符号なし距離マップを作成するために使用され、符号なし距離マップはそれぞれP(x)およびD(x)と呼ばれ、ここでxは3D座標を表現する。距離マップl(x)=P(x)/(P(x)+D(x))は、プラークに沿った相対距離を表現し、値は近位面で0、遠位面で1である。l軸の方向は∇l(x)によって決定される。 To model the relative spatial arrangement of blobs within the vessel wall, the appropriate coordinate system can be selected to provide rotation, translation, and scale invariance between different images. These invariances are trained in one type of vessel (eg, the carotid artery for which intimal resection specimens are readily available), and others, assuming that the arteriosclerosis process is similar between different vascular beds. It is important for the model because the model can be applied to the vascular bed of the vessel (eg, the coronary artery for which plaque specimens are not generally available). For tubular objects, the natural coordinate system continues from the centerline of the blood vessel, where the distance along the centerline provides the vertical coordinates, and each plane perpendicular to the centerline has the polar coordinates of the radial distance and angle. .. However, improved coordinate systems may be utilized due to the variability of the outer shape of the vessel wall, especially in affected patients who may be of analytical purpose. The vertical distance is calculated so that each 3D radiographic image pixel is given a value as well as along the centerline or the interpolated vertical plane. For a particular plaque, the proximal and distal planes perpendicular to the centerline are used to create unsigned distance maps on the original image grid, respectively, and the unsigned distance maps are P (x), respectively. And D (x), where x represents 3D coordinates. The distance map l (x) = P (x) / (P (x) + D (x)) represents the relative distance along the plaque, with values of 0 on the proximal plane and 1 on the distal plane. The direction of the l-axis is determined by ∇l (x).
壁の形状は著しく非円形であり得るので、半径方向の距離は、内側の内腔内面までの最短距離および外側の外膜表面までの最短距離に基づいて定義することができる。組織画像の専門家による注釈は、内腔および血管を定義する領域(内腔および血管壁の結合として定義される)を含む。符号付き距離関数は、それぞれL(x)およびV(x)の各々に対して作成することができる。慣例では、これらの領域の内部は負であり、壁ではLが正であり、Vが負になるようにする。相対半径方向の距離は、r(x)=L(x)/(L(x)−V(x))として計算される。管腔表面で0の値を有し、外膜表面で1の値を有する。r軸の方向は∇r(x)によって決定される。 Since the shape of the wall can be significantly non-circular, the radial distance can be defined based on the shortest distance to the inner surface of the inner lumen and the shortest distance to the outer outer membrane surface. Tissue imaging expert annotations include areas that define lumens and vessels (defined as lumen and vessel wall connections). Signed distance functions can be created for each of L (x) and V (x), respectively. By convention, the interior of these regions is negative, the walls are positive for L, and the V is negative. The distance in the relative radial direction is calculated as r (x) = L (x) / (L (x) −V (x)). It has a value of 0 on the surface of the lumen and a value of 1 on the surface of the adventitia. The direction of the r-axis is determined by ∇r (x).
壁の外形が非円形であるため、正規化された接線距離は、r(および3Dで処理する場合は1)の等高線に沿って存在すると定義することができる。t軸の方向は∇r×∇lによって決定される。慣例では、組織学的スライスは、正の1が画像を指すように、近位方向から遠位方向に向かって見ていると想定される。他のものとは異なり、tは血管の周りに巻き付いているため、自然な原点を持っていないことに留意されたい。したがって、この座標の原点は、ブロブの重心に対してブロブごとに異なる方法で定義することができる。 Since the outer shape of the wall is non-circular, the normalized tangent distance can be defined to exist along the contour lines of r (and 1 when processing in 3D). The direction of the t-axis is determined by ∇r × ∇l. By convention, histological slices are assumed to be viewed from proximal to distal, with a positive one pointing to the image. Note that unlike others, t has no natural origin because it wraps around the blood vessel. Therefore, the origin of this coordinate can be defined differently for each blob with respect to the center of gravity of the blob.
使用される別の壁座標は、正規化された壁の厚さである。ある意味で、これは疾患の進行に対する代用である。より厚い壁は、より進行した疾患が原因であると想定される。分析物の統計的関係は、より進行した疾患で変化するという想定。絶対的な壁の厚さは、wabs(x)=L(x)−V(x)として簡単に算出することができる。それを[0〜1]の範囲に正規化するために、内腔がゼロのサイズに近づき、完全に偏心して外側表面に近いときの可能な最大の壁の厚を決定することができる。この場合、最大直径は血管の最大フェレット直径、Dmaxである。したがって、相対的な壁の厚さは、w(x)=wabs(x)/Dmaxとして計算することができる。Another wall coordinate used is the normalized wall thickness. In a sense, this is a substitute for disease progression. Thicker walls are assumed to be due to more advanced disease. The assumption is that the statistical relationships of the analyte will change with more advanced disease. The absolute wall thicknesscan be easily calculated as wabs (x) = L (x) -V (x). To normalize it to the range [0-1], the maximum possible wall thickness can be determined when the lumen approaches zero size and is completely eccentric and close to the outer surface. In this case, the maximum diameter is the maximum ferret diameter of the blood vessel,Dmax . Therefore, the relative wall thickness can be calculated asw (x) = w abs (x) /Dmax.
前述の座標がモデルで使用されてもよいかどうかの程度は、利用可能な訓練データの量に部分的に依存する。訓練データが限られている場合は、いくつかのオプションが利用可能である。相対的な縦方向の距離は、同じ統計的分布に由来するかのように、各プラークを通る異なる区分を処理することで無視することができる。プラーク組成は、中央でより深刻なプラークが出現する縦軸に沿って変化することが観察されている。ただし、l(x)によって分布をパラメータ化する代わりに、この次元を崩壊することができる。同様に、相対的な壁の厚さも崩壊することができる。特定の分析物は、w(x)が中間値を有するあろうプラークの「肩」領域で発生することが観察されている。ただし、十分な訓練データが利用可能になるまで、この次元を崩壊することもできる。 The extent to which the above coordinates may be used in the model depends in part on the amount of training data available. If training data is limited, several options are available. Relative longitudinal distances can be ignored by treating different compartments through each plaque as if they came from the same statistical distribution. Plaque composition has been observed to vary along the vertical axis where more severe plaques appear in the center. However, instead of parameterizing the distribution with l (x), this dimension can be collapsed. Similarly, relative wall thickness can collapse. Certain analytes have been observed to occur in the "shoulder" region of the plaque where w (x) would have an intermediate value. However, this dimension can be collapsed until sufficient training data is available.
上記のように、血管壁組成モデルは、(例えば、以前のP(A)で)最初の仮説として利用することができる。図7は、例示的な血管壁組成モデルの正規化された血管壁座標を描いている。描かれたモデルでは、1は近位から遠位までの血管標的に沿った相対的な縦方向の距離であり、これは、例えば、正規化された間隔[0、1]で計算することができる。縦方向の距離は、近位面および遠位面から開始する2つの高速マーチング伝搬を使用して算出し、符号なし距離フィールドPおよびDを計算することができる。ここで1=P/(P+D)である。l軸方向は∇lである。描かれているように、rは正規化された半径方向の距離であり、これはまた、内腔から外膜表面までの正規化された間隔[0、1]で算出することもできる。したがって、r=L/(L+(−V))であり、ここで、Lは内腔符号付き距離フィールド(SDF)であり、Vは血管SDFである。r軸方向は∇rである。最後に、tは正規化された接線距離であり、例えば正規化された間隔[−0.5、0.5]で計算することができる。特に、例示的な実施形態では、個々の分析物ブロブについてのみ、壁全体に意味のある起点がない場合がある(したがって、起点はブロブ重心にある場合がある)。接線距離は、1およびrの等高曲線に沿って計算される。t軸方向は∇r×∇lである。 As mentioned above, the vessel wall composition model can be used as the first hypothesis (eg, in the previous P (A)). FIG. 7 depicts normalized vessel wall coordinates of an exemplary vessel wall composition model. In the model depicted, 1 is the relative longitudinal distance along the vascular target from proximal to distal, which can be calculated, for example, at a normalized interval [0, 1]. can. The longitudinal distance can be calculated using two fast marching propagations starting from the proximal and distal planes, and the unsigned distance fields P and D can be calculated. Here, 1 = P / (P + D). The l-axis direction is ∇l. As depicted, r is the normalized radial distance, which can also be calculated by the normalized spacing [0, 1] from the lumen to the surface of the adventitia. Therefore, r = L / (L + (−V)), where L is the lumen signed distance field (SDF) and V is the blood vessel SDF. The r-axis direction is ∇r. Finally, t is the normalized tangential distance, which can be calculated, for example, at the normalized interval [-0.5, 0.5]. In particular, in an exemplary embodiment, there may be no meaningful origin throughout the wall (thus, the origin may be at the center of gravity of the blob) only for individual analyte blobs. The tangential distance is calculated along the contour curves of 1 and r. The t-axis direction is ∇r × ∇l.
図9は、本明細書に記載される技術を使用して説明することができるいくつかの複雑な血管トポロジーを示している。特に、CTまたはMRを3Dで処理する場合、異なる分岐を別々に分析し、別々の分岐における分析物ブロブ間の関係が適切に無視されるようにしてもよい。したがって、セグメンテーションされた像(断面スライス)が、もし2つ以上の内腔を含む場合、壁を各内腔に属する領域に分割した後、各領域を別々に考慮/分析するために、r上で流域変換を行うことによって、このことを説明することができる。 FIG. 9 shows some complex vascular topologies that can be described using the techniques described herein. In particular, when processing CT or MR in 3D, different branches may be analyzed separately so that the relationships between the analyte blobs in the separate branches are appropriately ignored. Therefore, if the segmented image (cross-section slice) contains more than one lumen, after dividing the wall into regions belonging to each lumen, then on r to consider / analyze each region separately. This can be explained by performing the basin transformation in.
上記のように、本明細書に記載される座標および確率測定の多くは、正規化されたスケールを利用して表現することができ、それによって、例えば、異なるサイズの血管間のスケール不変性を維持する。したがって、提案されたモデルは、疾患プロセスが類似しており、異なる口径の血管に対して比例しているという想定の下で、有利には、絶対的な血管サイズからは独立していてもよい。 As mentioned above, many of the coordinate and probability measurements described herein can be represented using normalized scales, thereby, for example, scale invariance between vessels of different sizes. maintain. Therefore, the proposed model may advantageously be independent of absolute vessel size, assuming that the disease process is similar and proportional to vessels of different calibers. ..
いくつかの実施形態では、モデルは、同心プラーク対偏心プラークを特徴付けるように構成されてもよい。特に、1に近い正規化されたすべての厚さは、非常に偏心した場所を示していてもよい。さらなる実施形態では、内側のプラーク対外側のプラークの特徴付けを実装することができる。特に、この特性に関する組織学的情報は変形によって妨げられる。したがって、いくつかの実施形態では、CTおよび訓練データを利用して、内側のプラーク対外側のプラーク特性を決定するためのアルゴリズムを確立することができる。 In some embodiments, the model may be configured to characterize concentric plaques vs. eccentric plaques. In particular, all normalized thicknesses close to 1 may indicate very eccentric locations. In a further embodiment, inner plaque vs. outer plaque characterization can be implemented. In particular, histological information about this property is hampered by deformation. Therefore, in some embodiments, CT and training data can be utilized to establish an algorithm for determining inner plaque vs. outer plaque characteristics.
上記のように、例示的な実施形態では、組織学的データなどの非イメージングデータを、画像の特徴を生物学的性状/分析物にリンクするアルゴリズムを確立するための訓練セットとして利用することができる。ただし、適切な相関関係を確保するために対処する必要があるデータ型の間にはいくつかの違いがある。例えば、組織学とイメージングとの間の以下の違いは、適切な相関関係に影響を与える可能性がある:頸動脈内膜剥離術(CEA)は、外側の外膜表面を見つけるために推定される患者のCTまたはMRイメージング分析に外膜およびいくつかの媒体を残す。(例えば、外側の血管外壁に対する組織学的標本のために除去されたプラーク間のマージンを示す図8を参照)。特に、科学文献は、石灰化が外膜で発生し得るかどうかの不確実性を示している。この違いを説明するために、以下の技術を使用することができる。組織学は、例えば、壁に分析物がほとんど残されていないか、またはまったく残されていないという想定に基づいて、外側に拡張することができる。代替的に、画像セグメンテーションは、例えば、残された典型的または特定のマージンの知識に基づいて、内側に侵食される可能性がある。例えば、平均マージンを利用することができる。いくつかの実施形態では、平均マージンは、血管の全直径のパーセンテージで正規化されてもよい。さらなる実施形態では、組織学を使用して、イメージングをマスクする(例えば、整列基準に基づくオーバーレイ)ことができる。このような実施形態では、適切な整列に一致するように、組織学的データに1つ以上の変換を適用する必要があり得る。最後に、いくつかの実施形態では、差分は無視されてもよい(これは、除去されたプラークを壁全体に均一にスケーリングすることと同等である)。これは、若干の小さなエラーを誘発するかもしれないが、おそらく残された壁はCEA患者のプラークと比較して薄くてもよい。 As mentioned above, in an exemplary embodiment, non-imaging data, such as histological data, can be used as a training set to establish an algorithm that links image features to biological properties / analysts. can. However, there are some differences between the data types that need to be addressed to ensure proper correlation. For example, the following differences between histology and imaging can affect the proper correlation: carotid endarterectomy (CEA) is presumed to find the outer adventitial surface. Leave the adventitia and some media for CT or MR imaging analysis of the patient. (See, for example, FIG. 8 showing the margin between plaques removed for histological specimens against the outer wall of the blood vessel). In particular, scientific literature shows the uncertainty as to whether calcification can occur in the adventitia. The following techniques can be used to illustrate this difference. Histology can be extended outwards, for example, on the assumption that there is little or no analysis left on the wall. Alternatively, image segmentation can be eroded inward, for example, based on knowledge of the typical or specific margins left behind. For example, the average margin can be used. In some embodiments, the average margin may be normalized as a percentage of the total diameter of the vessel. In a further embodiment, histology can be used to mask the imaging (eg, alignment criteria based overlay). In such embodiments, it may be necessary to apply one or more transformations to the histological data to match the proper alignment. Finally, in some embodiments, the differences may be ignored (this is equivalent to uniformly scaling the removed plaque across the wall). This may induce some minor errors, but perhaps the remaining wall may be thinner compared to the plaque of a CEA patient.
組織学的データ(例えば、訓練セット)と血管壁組成モデルによって表現されるイメージングデータとの間にも縦方向の差が存在していてもよい。例示的な実施形態では、縦方向の距離は、明示的にモデリングし/相関させることができる。したがって、例えば、組織学的スライス番号付け(例えば、A〜G)を使用して、プラークの切除された部分内の位置を大まかに決定することができる。ただし、このアプローチでは、対応する組織学データを伴わない他のスライスに関する分析が制限される。したがって、代替的に、いくつかの実施形態では、すべての組織学的スライスは、同じ分布から生じるものとして扱われてもよい。例示的な実施形態では、いくつかの制限された正則化が、依然として縦方向に沿って使用されてもよい。 There may also be a longitudinal difference between the histological data (eg, the training set) and the imaging data represented by the vessel wall composition model. In an exemplary embodiment, longitudinal distances can be explicitly modeled / correlated. Thus, for example, histological slice numbering (eg, AG) can be used to roughly determine the location of the plaque within the excised portion. However, this approach limits the analysis of other slices without the corresponding histological data. Thus, instead, in some embodiments, all histological slices may be treated as originating from the same distribution. In an exemplary embodiment, some limited regularization may still be used along the vertical direction.
上記のように、正規化された壁の厚さは、ある意味で、疾患の進行に対する不完全な代用である。特に、より厚い壁は、例えば、分析物の統計的関係がより進行した疾患とともに変化するという想定に基づいて、より進行した疾患に起因すると想定される。正規化された壁の厚さは以下のように算出することができる:絶対的な壁の厚さTaを決定する(mm単位で)、例えば、Ta=L+(−V)として計算することができ、ここで、Lは内腔SDF、Vは血管SDF、Dmaxは、血管の最大フェレット直径(mm)である。次に、相対的な壁さの厚Tは、T=Ta/Dmax、例えば、間隔[0、1]に基づいて計算することができ、ここで、1は、完全に偏心したプラークを示す小さな内腔の最も厚い部分を示す。例示的な実施形態では、確率は、例えば、分析物ブロブの分布が壁の厚さに依存するように、壁の厚さに基づいて調整されてもよい。これは有利には、疾患の進行の過程にわたる分析物組成の違いをモデリングすることができる。As mentioned above, the normalized wall thickness is, in a sense, an incomplete substitute for disease progression. In particular, the thicker walls are assumed to be due to more advanced disease, for example, based on the assumption that the statistical relationship of the analyte changes with more advanced disease. The thickness of the normalized wall can be calculated as follows: determining the thickness Ta of the absolute wall (in mm), for example, T a= L + - calculated as (V) Here, L is the lumen SDF, V is the blood vessel SDF, andDmax is the maximum ferret diameter (mm) of the blood vessel. The relative wall thickness Tcan then be calculated based on T = Ta / Dmax , eg, spacing [0, 1], where 1 is a completely eccentric plaque. Shows the thickest part of the small lumen shown. In an exemplary embodiment, the probabilities may be adjusted based on the wall thickness, for example, so that the distribution of the analyte blob depends on the wall thickness. This can advantageously model differences in analytical composition over the course of disease progression.
図10は、正規化された血管壁座標の分布を有する例示的な分析物ブロブを表現することを描いている。特に、tの原点はブロブ重心に配置される。(r、t)座標は、位置/形状が内部の点の同時分布によって完全に表現されるランダムなベクトルである。これは、周辺分布を考慮することによって簡略化することができる(半径方向および接線方向の形状特性は比較的独立しているように見えるため)。周辺分布は、rおよびtに沿った投影として算出することができる(lおよびT座標も考慮できることに留意されたい)。特に、半径方向の周辺分布は、有利には、同心円層(例えば、内側層、外膜層、および内膜層)におけるプラーク成長を表現する/特徴付けることができる。同様に、接線方向の周辺分布は、有利には、疾患の段階分けを示し得る成長要因を表現することができる。例示的な実施形態では、分析物ブロブ記述子は、周辺分布に基づいて計算することができる。例えば、オンは周辺分布の低次統計を取得する(またはヒストグラムを使用するか、もしくはパラメトリック確率分布関数をフィッティングする)ことができる。 FIG. 10 depicts representing an exemplary analytical blob with a normalized distribution of vessel wall coordinates. In particular, the origin of t is located at the center of gravity of the blob. The (r, t) coordinates are random vectors whose positions / shapes are perfectly represented by the joint distribution of internal points. This can be simplified by considering the marginal distribution (because the radial and tangential shape characteristics appear to be relatively independent). The marginal distribution can be calculated as a projection along r and t (note that the l and T coordinates can also be considered). In particular, the radial marginal distribution can advantageously represent / characterize plaque growth in concentric layers (eg, medial, adventitial, and intima). Similarly, the tangential marginal distribution can advantageously represent growth factors that may indicate disease grading. In an exemplary embodiment, the analyte blob descriptor can be calculated based on a marginal distribution. For example, ON can get low-order statistics of marginal distribution (or use a histogram or fit a parametric probability distribution function).
例示的な実施形態では、以下の分析物ブロブ記述子を使用して、例えば、個々のブロブの位置、形状、または他の構造的特性を捕捉することができる。
−正規化された血管座標での位置
・主にrに関して
−例えば、浅い石灰化と深い石灰化とを区別するため
・t方向は無視される。[任意選択でl方向をモデリング]
−正規化された血管座標の範囲
・範囲は正規化された値であるのに対し、絶対的な測定を意味する「サイズ」という単語は意図的に避けている
−分布の非対称性の程度を表現する偏り
・臨床的意義は不明であるが、信じ難い偏った形状に対して形状を正則化するのに役立つ場合がある
−平行な組織層への閉じ込めを表現するための整列
・分析物ブロブは放射状の層(rの等高線)内に非常によく留まっているように見えるので、これは類似した画像処理された形状を選択するのに役立つと思われる
−ブロブが配置されている壁の厚さ
・薄いプラークとは異なる統計量を有すると想定される厚い(すなわち、進行した)プラークIn an exemplary embodiment, the following analytical blob descriptors can be used, for example, to capture the location, shape, or other structural properties of individual blobs.
-Position in normalized vascular coordinates-Mainly with respect to r-For example, to distinguish between shallow and deep calcifications-The t direction is ignored. [Modeling the l direction by arbitrary selection]
-Regularized range of vascular coordinates-The range is a normalized value, while the word "size", which means absolute measurement, is intentionally avoided-the degree of asymmetry of the distribution Bias to express-The clinical significance is unknown, but it may help to regularize the shape for incredible biased shapes-Alignment to represent confinement in parallel tissue layers-Analyte blobs This seems to help select a similar image-processed shape, as it appears to stay very well within the radial layer (r contours) -the thickness of the wall on which the blobs are located. Thick (ie, advanced) plaques that are supposed to have different statistics than thin plaques
いくつかの実施形態では、ペアワイズブロブ記述子も利用することができる。例えば:
−相対的な場所
・例えば、線維症がLRNCの内腔側にある場合
−相対的な範囲
・例えば、LRNCと比較した線維症の厚さ/幅
−周囲性
・一方の周辺投影が他方の中間にどれだけ近づくか
・例えば、ナプキンリングサインまたはLRNC周辺の線維症
−相対的な壁の厚さ
・「肩」の程度を表現するため(肩は中心プラーク本体よりも比較的薄い)In some embodiments, pairwise blob descriptors are also available. for example:
-Relative location-For example, if the fibrosis is on the luminal side of the LRNC-Relative range-For example, the thickness / width of the fibrosis compared to the LRNC-Peripheral-One peripheral projection is in the middle of the other How close to-for example, fibrosis around the napkin ring sign or LRNC-relative wall thickness-to express the degree of "shoulder" (shoulder is relatively thinner than the central plaque body)
高次の相互作用(例えば、3つのブロブ間または2つのブロブと別の特徴との間)も実装され得ることに留意されたい。ただし、収穫逓減と訓練の制限を考慮することができる。 Note that higher-order interactions (eg, between 3 blobs or between 2 blobs and another feature) can also be implemented. However, diminishing returns and training restrictions can be considered.
以下は、blob記述子の例示的な定量化である。
特に、記述子のセット(例えば、8〜12個の記述子)は、ブロブが存在する有限の形状空間を形成する。そして、ブロブの母集団の分布をこの有限空間の分布として見ることができる。図11は、ブログ記述子の分布の例を描いている。例示的な実施形態では、ブロブ記述子の分布は、訓練セット全体にわたって計算されてもよい。いくつかの実施形態では、低次の統計量は、(独立性を想定して)個々のブロブ記述子に利用することができる(例えば、場所:E[αr]、Var[αr])。他の実施形態では、多次元ガウス(平均ベクトル+共分散行列)分析を使用して、記述子をモデリングすることができる(例えば、独立性が想定されていない場合)。さらなる実施形態では、分布が非正規分布である場合、密度推定技術を使用してこれをモデリングすることができる。In particular, a set of descriptors (eg, 8-12 descriptors) form a finite shape space in which blobs reside. Then, the distribution of the blob population can be seen as the distribution of this finite space. FIG. 11 depicts an example of the distribution of blog descriptors. In an exemplary embodiment, the distribution of blob descriptors may be calculated throughout the training set. In some embodiments, lower-order statistics are available for individual blob descriptors (assuming independence) (eg, location: E [αr ], Var [αr ]). .. In other embodiments, multidimensional Gaussian (mean vector + covariance matrix) analysis can be used to model the descriptor (eg, if independence is not assumed). In a further embodiment, if the distribution is non-normal, density estimation techniques can be used to model it.
上述したように、断面ごとのブロブの数(または各クラスの数)、例えば、分析物のクラスを考慮しないη、および各分析物クラスにおけるηiカウント数をモデリングできる。図14は、各組織学的スライドのブロブの総数の頻度分布を示している。ポイズン回帰は過度に適用されている。図14の分析チャートは、分析物クラスを考慮することなく、断面Nあたりのブロブの数を描いていることに留意されたい(各分析物タイプのブロブの数はBで表現される)。As mentioned above, the number of blobs per cross section (or the number of each class) can be modeled, for example, η, which does not consider the class of analyte, and the number of η i counts in each class of analyte. FIG. 14 shows the frequency distribution of the total number of blobs on each histological slide. Poison regression is over-applied. Note that the analysis chart of FIG. 14 depicts the number of blobs per section N without considering the analyte class (the number of blobs for each analyte type is represented by B).
前述のセクションを要約すると、例示的な実施形態では、全体的な血管壁組成モデルは、以下を含んでもよい。
・pmf前のピクセルごとの分析物
−P(A(x)=ai)=ρi
・個々のブロブ記述子
−B1=(αr、βr、βt、γr、γt、δr、δt、τT)
−B1〜N(μ1、Σ1)
・ペアワイズブロブ記述子
−C2=(αrr、αtt、βrr、βtt、εrr、εtt、τTT)
−C2〜N(μ2、Σ2)
・ブロブの数
−η〜Poission(λη)
式中、以下のとおりである:
・ Pixel-by-pixel analyte before pmf −P (A (x) = ai ) = ρi
-Individual blob descriptor −B1 = (αr , βr , βt , γr , γt , δr , δt , τT )
−B1 to N (μ1, Σ1 )
-Pairwise blob descriptor -C2 = (αr r , αtt , βr r , βtt , εr r , εtt , τTT )
-C2 to N (μ2 , Σ2 )
・ Number of blobs −η ~ Poission (λ η)
In the formula:
上記のように、イメージングモデルはベイズ分析モデルの尤度(例えば、P(I¥A))として機能してもよい。次に、最尤推定値を決定することができる。例示的な実施形態では、これは、各ピクセルを分離して(例えば、モデル内の構造の事前確率を考慮せずに)考慮して行うことができる。推定された分析物マップは、典型的に、画像が平滑であるという理由だけで平滑になる(そのため、典型的に、事前の平滑化は実施されない)。独立したピクセルごとの分析は、例えば、少なくともスキャナのPSFを考慮する時点まで行うことができる。イメージングモデルは、不完全なイメージングデータを考慮するために利用される。例えば、プラークの小さな成分をイメージングすると、ピクセル値の上に独立したノイズが追加される。さらに、部分体積効果およびスキャナPSFは、小さなオブジェクトに適用することでよく知られている。したがって、モデル(例えば、分析物領域のレベルセット表現)が与えられた場合、PSFを使用したガウスぼかしによるCTのシミュレーションは簡単かつ高速である。本明細書に記載されるイメージングモデルはまた、異なる分析物の真の(ぼやけていない)密度の分布を決定(または推定)するために適用されてもよい。特に、この密度の分布は、ぼやけた画像強度を有することになるので、典型的なイメージング研究から得ることはできない。いくつかの実施形態では、不確実性を表現するために広い分散を使用することができる。代替的に、分布パラメータを訓練セットから最適化することもできるが、目的関数は、例えば、整列した組織学データが利用可能でない限り、(分析物領域の)下流の読み取り値に基づく必要がある。図12は、イメージングデータの例示的なモデル(例えば、隠れた(カテゴリ)状態(A(x))と観察された(連続)状態(I(x))との間の相関を示しており、これにより、ランダム(例えば、分析物密度分布(H(A(x)))ノイズ要因および決定論的(例えば、スキャナぼかし*G(x))ノイズ要因が考慮される。θは、Hのパラメータ(各分析物の比率およびHUの平均/分散)である。正規分布を想定したN個の異なるN個の異なる分析物クラスについて、θ=(τ1、μ1、σ1、...、τN、μN、σN)である。θは患者固有であり、例えば、分析物ラベルが潜在変数であり、画像が観察データである場合、期待値最大化(EM)方式で推定されることに留意されたい。
・E−step:現在のパラメータを指定してメンバーシップ確率を決定する
・M−step:メンバーシップ確率を指定してパラメータの尤度を最大化するAs described above, the imaging model may function as the likelihood (eg, P (I \ A)) of the Bayesian analytical model. Next, the maximum likelihood estimation value can be determined. In an exemplary embodiment, this can be done by considering each pixel separately (eg, without considering the prior probabilities of the structures in the model). The estimated analytical material map is typically smoothed simply because the image is smooth (so typically no pre-smoothing is performed). Independent pixel-by-pixel analysis can be performed, for example, at least until the scanner's PSF is considered. Imaging models are used to account for incomplete imaging data. For example, imaging a small component of plaque adds independent noise above the pixel values. In addition, partial volume effects and scanner PSFs are well known for their application to small objects. Therefore, given a model (eg, a level set representation of the area of the analyte), simulation of CT with Gaussian blur using PSF is simple and fast. The imaging models described herein may also be applied to determine (or estimate) the distribution of true (non-blurred) densities of different analytes. In particular, this density distribution will have blurred image intensities and cannot be obtained from typical imaging studies. In some embodiments, wide variance can be used to express uncertainty. Alternatively, the distribution parameters can be optimized from the training set, but the objective function should be based on, for example, downstream readings (of the area of analysis) unless aligned histological data are available. .. FIG. 12 shows the correlation between an exemplary model of imaging data (eg, hidden (category) state (A (x)) and observed (continuous) state (I (x)). This takes into account random (eg, analyzer density distribution (H (A (x))) noise factors and deterministic (eg, scanner blur * G (x)) noise factors. θ is a parameter of H. (Ratio of each analyte and mean / variance of HU). For N different N different analyzer classes assuming a normal distribution, θ = (τ1 , μ1 , σ1 , ..., τN , μN , σN ). θ is patient-specific, for example, when the analyte label is a latent variable and the image is observational data, it is estimated by the expected value maximization (EM) method. Please note that.
-E-step: Specify the current parameter to determine the membership probability-M-step: Specify the membership probability to maximize the likelihood of the parameter
図13は、画像モデルにおける観察状態と隠れた状態との関連付けのための例示的なマルコフモデル/ビタビアルゴリズムの図を描く。特に、この図では、観察状態(灰色)(観察画像強度、I(x))および隠れた状態(白色)(純粋な分析物強度、H(A(x)))が描かれており、これらは経験的ヒストグラムでモデリングされるか、またはガウス分布関数もしくはボックスカー確率分布関数でモデリングされる。イメージングシステムのPSFは、ガウス、G(x)としてモデリングされる。したがって、以下の式になる:
I(x)=G(x)*H(A(x))FIG. 13 depicts an exemplary Markov model / Viterbi algorithm for associating an observed state with a hidden state in an image model. In particular, in this figure, the observed state (gray) (observed image intensity, I (x)) and hidden state (white) (pure analyte intensity, H (A (x))) are depicted. Is modeled with an empirical histogram or with a Gaussian or Boxker probability distribution function. The PSF of the imaging system is modeled as Gauss, G (x). Therefore, we have the following equation:
I (x) = G (x) * H (A (x))
ここではビタビのようなアルゴリズムを適用できるが、畳み込みは放出確率をおこ変えることになり、Hはガウス分布または一様分布としてモデル化できることが留意されたい。 Although algorithms such as the Viterbi can be applied here, it should be noted that convolution changes the emission probability and H can be modeled as a Gaussian or uniform distribution.
上記のように、推論手順の一部分は期待値最大化(EM)に基づいている。EMの一般的な適用では、データ点は、未知のいくつかのクラスのうちの1つに属するものとしてモデリングされる。各データポイントは特徴ベクトルを有し、各クラスに対して、この特徴ベクトルは、平均ベクトルおよび共分散行列で表現される多次元ガウス分布などのパラメトリック分布でモデリングすることができる。ここに提示するモデルの文脈では、単純なEM実装は以下のように機能する:
この単純なモデルの主な問題は、高次構造をピクセルにコーディングしないことである。ピクセルのより現実的な配置に関連付けられた事前確率はない。タウのみが分析物クラスの比率を決定する。したがって、特にメンバーシップ確率を更新するステップで、ブロブの事前確率モデルに挿入するために、タウ変数を使用することができる。 The main problem with this simple model is that it does not code higher order structures on pixels. There are no prior probabilities associated with more realistic placement of pixels. Only tau determines the ratio of the analyte class. Therefore, tau variables can be used to insert into blob prior probability models, especially in the step of updating membership probabilities.
したがって、修正されたベイズ推論手順は、はるかに洗練されたベイズ事前確率で適用されてもよい。基本的なEM実装では、実際の事前分布はない。変数タウは、各クラスの先験的な相対的な比率を表現するが、この変数でさえも指定されておらず、推論手順中に推定される。したがって、基本的なEMモデルでのクラスの分布について先験的な確信はない。我々のモデルでは、以前のモデルはマルチスケール分析物モデルによって表現される。タウは、グローバルな比率だけでなく、位置(およびその他の変数)の関数になる。
メンバーシップ確率関数は次のように定義される:
推論アルゴリズムは次のとおりである。反復の各ステップで、メンバーシップ確率マップがゼロに初期化されるため、すべてのクラスの確率はゼロになる。次に、考えられるすべてのモデル構成について、メンバーシップ確率マップを次のように追加することができる:
最後に、確率ベクトルは、完全性の想定を復元するために、メンバーシップ確率マップの各ピクセルにおいて正規化することができる。有利には、すべてのモデル構成にわたって繰り返すことができる。これは、0から比較的低い値(例えば9)までのNの値を順次検討することによって行われ、この時点で、非常に少数の区分が同じ数のブロブを有することが観察されている。各Nの値に対して、異なる推定ブロブ構成を調べることができる。推定ブロブは、それらの個々のブロブ確率に基づいて、小さな数(N)に閾値処理されてもよい。次に、N個のブロブのすべての順列が考慮される。したがって、最も可能性の高いすべてのブロブ構成を同時に検討し、事前確率によって各モデルに重み付けすることができる。マルチスケールモデル構成の全空間が考慮されていない可能性があるため、この手順は明らかに近似的な推論スキームである。ただし、(Nとブロブとの両方に関して)最も可能性の高いものを考慮することにより、良好な近似が達成されると想定できる。この手順では、最も可能性の高い構成の加重平均が、各個々のピクセルにおいて良好な推定値を提供することも想定できる。別の代替方法は、モデル構成の制約付き検索を実施し、MAP(最大事後)推定値として最も可能性の高いモデルを選択することである。 Finally, the probability vector can be normalized at each pixel of the membership probability map to restore the integrity assumption. Advantageously, it can be repeated across all model configurations. This is done by sequentially examining the value of N from 0 to a relatively low value (eg 9), at which point it has been observed that very few compartments have the same number of blobs. Different estimated blob configurations can be examined for each value of N. Estimated blobs may be thresholded to a small number (N) based on their individual blob probabilities. Next, all permutations of N blobs are considered. Therefore, all the most probable blob configurations can be considered simultaneously and each model can be weighted by prior probabilities. This procedure is clearly an approximate inference scheme, as the entire space of a multiscale model configuration may not be considered. However, it can be assumed that a good approximation is achieved by considering the most likely ones (for both N and blobs). In this procedure, it can also be assumed that the weighted average of the most likely configuration provides a good estimate for each individual pixel. Another alternative is to perform a constrained search of the model configuration and select the most likely model as the MAP (maximum posterior) estimate.
さらなる例示的な統計モデル(例えば、事後P(A/I))もまた、本明細書に記載されている。CT血管造影では、次の情報を利用できる場合がある:
・強度
−CTハウンズフィールド単位またはMR強度
−おそらく他のイメージング特徴
・解剖学的構造に対する位置
−プラークのどこにピクセルがあるか
・隣接するピクセル
−例えば、レベルセットを通じて輪郭を平滑化するためFurther exemplary statistical models (eg, posterior P (A / I)) are also described herein. The following information may be available for CT angiography:
-Intensity-CT Hounds field unit or MR intensity-Probably other imaging features-Position to anatomical structure-Where are the pixels in the plaque-Adjacent pixels-For example, to smooth the contour through a level set
事後確率は次のように計算することができる:
したがって、以下の画像情報は分析物の確率Ai(x)に影響を与える可能性がある
I(x)は観察された画像強度(おそらくベクトル)である
T(x)は、画像セグメンテーションから観察された相対的な壁の厚さである
F(x)はCT画像特徴である
S(x)は血管壁の形状の特徴(例、内腔の膨らみ)であるTherefore, the following image information may affect the probability Ai (x) of the analyte I (x) is the observed image intensity (probably a vector) T (x) is observed from image segmentation. F (x), which is the relative wall thickness, is a CT image feature, and S (x) is a shape feature of the vessel wall (eg, bulge of the lumen).
いくつかの実施形態では、メトロポリス・ヘイスティングスのようなアプローチを利用することができる。他の実施形態では、最大事後アプローチを適用することができる。 In some embodiments, approaches such as Metropolis-Hastings can be utilized. In other embodiments, the maximum a posteriori approach can be applied.
以下は、統計分析モデルの例示的なアルゴリズムの可能性である。いくつかの実施形態では、モデルは、確率伝搬法(別名、max sum、max product、sum product messaging)を利用することができる。したがって、例えば、ビタビ(HMM)タイプのアプローチを利用することができ、ここで、隠れた状態は分析物割り当て、Aであり、観察された状態はイメージ強度、Iである。このアプローチは、有利には、MAP推定値がargmax P(A|I)であり得ることを発見してもよい。いくつかの実施形態では、ソフト出力ビタビアルゴリズム(SOVA)を利用することができる。各決定の信頼性は、選択された(サバイバー)パスと破棄されたパスとの違いによって示される場合があることに留意されたい。したがって、これは各ピクセル分析物分類の信頼性を示し得る。さらなる例示的な実施形態では、前方/後方バウムウェルチ(HMM)アプローチを利用することができる。例えば、任意の時点で最も可能性の高い状態を計算できるが、最も可能性の高いシーケンスは計算でない(ビタビを参照)。 The following are the possibilities of an exemplary algorithm for a statistical analysis model. In some embodiments, the model can utilize belief propagation (also known as max sum, max product, sum product messaging). Thus, for example, a Viterbi (HMM) type approach can be utilized, where the hidden state is the analyte assignment, A, and the observed state is the image intensity, I. This approach may advantageously discover that the MAP estimate can be argmax P (A | I). In some embodiments, a soft output Viterbi algorithm (SOVA) can be utilized. Note that the reliability of each decision may be indicated by the difference between the selected (survivor) path and the discarded path. Therefore, this may indicate the reliability of each pixel analyte classification. In a further exemplary embodiment, the anterior / posterior Baum-Welch (HMM) approach can be utilized. For example, the most probable state can be calculated at any given time, but the most probable sequence is not (see Viterbi).
別の考えられる技術は、メトロポリス−ヘイスティングス(MCMC)アプローチであり、例えば、Aを繰り返しサンプリングし、尤度および事前によって重み付けする。いくつかの実施形態では、サンプリングのための単純なMRFバージョンを利用することができる。後方を直接サンプリングすることが特に有利な場合があることに留意されたい。例示的な実施形態では、分析物クラスのピクセルごとのヒストグラムを構築することができる。 Another possible technique is the Metropolis-Hastings (MCMC) approach, where, for example, A is iteratively sampled and weighted by likelihood and pre-weighting. In some embodiments, a simple MRF version for sampling is available. Note that sampling directly behind may be particularly advantageous. In an exemplary embodiment, a pixel-by-pixel histogram of the analyte class can be constructed.
他のアルゴリズムの可能性は、ギブスサンプラ、変分ベイズ(EMに類似)、平均場近似、カルマンフィルタ、または他の技術の適用を含む。 The possibilities of other algorithms include the application of Gibbs samplers, variational Bayes (similar to EM), mean field approximation, Kalman filters, or other techniques.
上記のように、いくつかの実施形態では、期待値最大化(EM)事後アプローチを利用することができる。このアプローチでは、観察されたデータXはイメージング値、未知のパラメータθは分析物マップ(ただし、分析物確率は含まない)に起因するものであり、潜在変数Zは分析物確率ベクトルである。このアプローチ1つの主要な特徴は、クラスメンバーシップ(Z)およびモデルパラメータ(θ)が、各々相互に依存しているため、これら間の推定を繰り返すことができることである。ただし、分析物マップは分析物の確率を分離するため、現在のクラスメンバーシップがモデルパラメータに影響を与える必要がないようにアプローチを変更することができる(これらは訓練ステップで学習されるため)。したがって、基本的に、現在のデータを反復するときにモデルパラメータを学習するEM。EMアプローチの例示的な実装は、有利には、最尤法を反復的に計算するが、フラットな事前を想定している。 As mentioned above, in some embodiments, an expected value maximization (EM) ex post facto approach can be utilized. In this approach, the observed data X is due to the imaging value, the unknown parameter θ is due to the analyte map (but not including the analyte probabilities), and the latent variable Z is the analyte probability vector. One major feature of this approach is that the class membership (Z) and model parameters (θ) are each interdependent and the estimation between them can be repeated. However, because the Analyte map separates the analyte probabilities, the approach can be modified so that current class membership does not have to affect the model parameters (because these are learned in the training steps). .. Therefore, basically, an EM that learns model parameters when iterating over the current data. An exemplary implementation of the EM approach advantageously assumes the maximum likelihood method iteratively, but with a flat prior.
縦方向の共分散を表現するための技術も本明細書で提供される。組織学的スライスの間隔が広い(例えば、4mm)ことに起因して、サンプリングは分析物の縦方向の変動を忠実に捕捉しない場合がある。ただし、3D画像分析は、典型的に実施され、おそらくいくつかの真の縦方向の共分散がある。問題は、組織学的情報が典型的に、縦方向の共分散に対して提供されないことである。それにもかかわらず、本明細書に開示される例示的な統計モデルは、縦方向のゆっくりとした変動を反映することができる。 Techniques for expressing the vertical covariance are also provided herein. Due to the wide spacing of histological slices (eg, 4 mm), sampling may not faithfully capture longitudinal variations of the analyte. However, 3D image analysis is typically performed and there is probably some true longitudinal covariance. The problem is that histological information is typically not provided for vertical covariance. Nevertheless, the exemplary statistical models disclosed herein can reflect slow vertical fluctuations.
いくつかの実施形態では、マルコフモデル/連鎖を適用することができる。図15は、テキスト/DNA用の1Dマルコフ連鎖の例示的な埋め込み例を描いている。従来、MRFマルコフ連鎖の画像に適用する場合は、可能な限り低次であるのが一般的である。ただし、条件付き独立性(マルコフ性)により、高次連鎖が有利な場合がある。それ以外の場合は、データがスクランブル化されすぎて価値がなくなる可能性がある。これは、テキストに適用される例示的なマルコフ連鎖の1Dサンプリングによって実証される。
・一様確率サンプリング出力:
−earryjnv anr jakroyvnbqkrxtgashqtzifzstqaqwgktlfgidmxxaxmmhzmgbya mjgxnlyattvc rwpsszwfhimovkvgknlgddou nmytnxpvdescbg k syfdhwqdrj jmcovoyodzkcofmlycehp
・0次マルコフ連鎖出力:
−ooyusdii eltgotoroo tih ohnnattti gyagditghreay nm roefnnasos r naa euuecocrrfca ayas el s yba anoropnn laeo piileo hssiod idlif beeghec ebnnioouhuehinely neiis cnitcwasohs ooglpyocp h trog 1
・1次マルコフ連鎖出力:
−icke inginatenc blof ade and jalorghe y at helmin by hem owery fa st sin rdn eke stw anks hinioro e orin en s ar whes ore jot j whede chrve blan ted sesourethegebe inaberens s ichath fie watt o
・2次マルコフ連鎖出力:
−he ton th a s my caroodif flows an the er ity thayertione wil ha m othenre re creara quichow mushing whe so mosing bloack abeenem used she sighembs inglis day p wer wharon the graiddid wor thad k
・3次マルコフ連鎖出力:
−es in angull o shoppinjust stees ther a kercourats allech is hote temal liked be weavy because in coy mrs hand room him rolio und ceran in that he mound a dishine when what to bitcho way forgot pIn some embodiments, Markov models / chains can be applied. FIG. 15 depicts an exemplary embedding example of a 1D Markov chain for text / DNA. Conventionally, when applied to an image of an MRF Markov chain, it is generally as low as possible. However, due to conditional independence (Markov property), higher-order chains may be advantageous. Otherwise, the data may be over-scrambled and worthless. This is demonstrated by 1D sampling of exemplary Markov chains applied to the text.
・ Uniform probability sampling output:
-Earlyjnv anr jakroyvnbqkrxtgashqtzifzstqaqwgktlfgidmxxaxmmhzmgbya mjgxnlyatttvc rwpsszwffhimovkvgkhdvykdfkvkvykdfvyczkmdzhkmovkv
・ 0th order Markov chain output:
-ooyusdii eltgotoroo tih ohnnattti gyagditghreay nm roefnnasos r naa euuecocrrfca ayas el s yba anoropnn laeo piileo hssiod idlif beeghec ebnnioouhuehinely neiis cnitcwasohs ooglpyocp
・Primary Markov chain output:
-icke inginatenc blof ade and jalorghe y at helmin by hem owery fa st sin rdn eke stw anks hinioro e orin en s ar whes ore jot j whede chrve blan ted sesourethegebe inaberens s ichath fie watt o
・Secondary Markov chain output:
-he ton th a s my caroodif flows an the er ity thayertione wil ha m othenre re creara quichow mushing whe so mosing bloack abeenem used she sighembs inglis day p wer wharon the graiddid wor thad k
・ Third-order Markov chain output:
-es in angull o shoppinjust stees ther a kercourats allech is hote temal liked be weavy because in coy mrs hand room him rolio und ceran in that he mound a dishine when what to bitcho way forgot p
図16は、テキスト確率表の例示的な1次マルコフ連鎖描いている。このような表は、次の順序で指数関数的にサイズ設定されていることに留意されたい。
D=マルコフ連鎖の次数
N=文字数
サイズ=NDFIG. 16 depicts an exemplary first-order Markov chain of a text probability table. Note that such tables are exponentially sized in the following order:
D = degree N = number of characters the size of the Markov chain =N D
したがって、高次は次元の問題につながる。有利には、組織学的サンプルは非常に高い分解能を有する。ただし、組織学サンプルは統計的に独立していないため、後で詳しく説明するように、オーバーフィットにつながる可能性がある。一般に、モデリングされる条件付き依存関係が多いほど、モデルはより予測可能になり得る。 Therefore, higher orders lead to dimensional problems. Advantageously, the histological sample has a very high resolution. However, histological samples are not statistically independent and can lead to overfits, as will be explained in detail later. In general, the more conditional dependencies that are modeled, the more predictable the model can be.
例示的な実施形態では、文字などの1Dシーケンスの代わりに、2Dマルコフ確率場(MRF)をピクセル値に使用することができる。図17は、隣接するピクセル(灰色)に基づく最初のピクセル(黒色)の条件付き依存性を描いている。例示的な実施形態では、小集団は、依存性の数を半分に減少するために対称性を利用してもよい。いくつかの実施形態では、ピクセルの値は、単純な画像強度であり得るか、または分類問題の確率値であり得る。典型的なのMRFの使用には問題が存在する。従来のMRFは、ほとんどの場合、表現される確率空間の特異性を大幅に低下させる条件付き依存性を提供する最近傍ピクセルに制限されており、通常は、非常に汎用的なセグメンテーション/フィルタリング用の黒色/白色のブロブのみであり、非常に短い範囲の依存性である。ただし、ピクセルが高度に離散化されているのに対し、ブロブは1つのピクセルが欠けて次のピクセルに落ちるだけで、確率分布を完全に変化させることができる。したがって、実際の画像構造は、MRFを使用して典型的に考慮されるよりもはるかに連続的である。 In an exemplary embodiment, a 2D Markov random field (MRF) can be used for pixel values instead of a 1D sequence such as a character. FIG. 17 depicts a conditional dependency of the first pixel (black) based on adjacent pixels (gray). In an exemplary embodiment, the small population may utilize symmetry to reduce the number of dependencies in half. In some embodiments, the pixel value can be a simple image intensity or a probability value for a classification problem. There are problems with the use of typical MRFs. Traditional MRFs are most often limited to the nearest neighbor pixels, which provide conditional dependencies that significantly reduce the specificity of the represented probability space, and are usually for very general segmentation / filtering. Only black / white blobs, with a very short range of dependencies. However, while the pixels are highly discretized, blobs can completely change the probability distribution by simply missing one pixel and dropping to the next. Therefore, the actual image structure is much more continuous than typically considered using MRF.
このため、本開示のシステムおよび方法は、推論手順、例えば、事後α尤度×事前(P(A/I)αP(I/A)×P(A))のベイズ型規則を有利に利用することができる。クロスワード型の類推を使用すると、主題の適用のシステムおよび方法によって実装される推論手順は、ノイズの多いスキャンからクロスワードパズルをOCRしようとするようなものである。知識(いくつかの正方形の不完全な知識でさえ、クロスワードパズルの未知の正方形に情報を与えるのに役立つ場合がある。垂直方向と水平方向の両方を同時に考慮することによって、効率がさらに改善する。例示的な実施形態では、推論手順はヒューリスティックであってもよい。例えば、知らされていない事前で初期化し、簡単なものを先に解いて、後に解かれる難しいものについての手がかりを与えるようにしてもよい。したがって、高密度カルシウムなどの生物学的性状を比較的簡単に検出できることで、脂質などの検出が難しい他の分析物の存在を知ることができる。推論手順の各ステップは、未解決のピクセルの確率分布を絞り込むことができる。 For this reason, the systems and methods of the present disclosure take advantage of inference procedures, such as the Bayesian rule of posterior α-likelihood × pre-(P (A / I) αP (I / A) × P (A)). be able to. Using crossword analogies, the inference procedure implemented by the system and method of subject application is like trying to OCR a crossword puzzle from a noisy scan. Knowledge (even incomplete knowledge of some squares can help inform unknown squares in a crossword puzzle. Considering both vertical and horizontal at the same time further improves efficiency. In an exemplary embodiment, the inference procedure may be heuristic, eg, uninformed pre-initialization, solving the simple ones first, and giving clues about the difficult ones to be solved later. Therefore, the relatively easy detection of biological properties such as high density calcium makes it possible to know the presence of other analytes such as lipids that are difficult to detect. Each step of the inference procedure is You can narrow down the probability distribution of unresolved pixels.
上記のように、使用可能なデータを取得するには、高次のマルコフ連鎖が望ましい。高次マルコフアプローチを利用することの欠点は、推論プロセスに情報を提供するのに十分なデータがない可能性があることである。例示的な実施形態では、この問題には、パルゼンウィンドウ処理などの密度推定法を利用することによって、またはクリギング技術を利用することによって対処することができる。 As mentioned above, higher order Markov chains are desirable to obtain usable data. The disadvantage of using the higher-order Markov approach is that there may not be enough data to inform the inference process. In an exemplary embodiment, this problem can be addressed by utilizing density estimation methods such as Parzen window processing or by utilizing kriging techniques.
推論手順を形成するには、分析物の条件なしの事前確率で初期化し、次に最高レベルの証拠を使用して確率の絞り込みを開始してもよい。例えば、いくつかの実施形態では、不確実な幅は、各分析物確率推定値に関連付けられてもよい。他の実施形態では、1/Nに近いことは、そのような不確実性を表現し得る。 To form an inference procedure, you may initialize the analyte with unconditional prior probabilities and then start narrowing down the probabilities using the highest level of evidence. For example, in some embodiments, the uncertainty width may be associated with each analyte probability estimate. In other embodiments, being close to 1 / N can express such uncertainty.
特に、提案されたマルコフ実装はメモリレスではなく、長距離(空間)依存性を明示的にモデリングしようとしているため、「マルコフ」という用語はここでは大まかに使用される。 In particular, the term "Markov" is used loosely here because the proposed Markov implementation is not memoryless and attempts to explicitly model long-range (spatial) dependencies.
CT分解能は組織学およびプラーク解剖学と比較して低いので、いくつかの実施形態では、離散空間(時間)よりも連続空間(時間)マルコフモデルを利用することが好ましい場合がある。これは、サブピクセル補間で自然にうまく機能するため、確率マップのレベルセット表現でうまく機能する可能性がある。分析物の状態が離散的なので、モデルは離散空間モデルになる。ただし、分析物が分析物の存在/不在ではなく連続的な確率を表現する場合は、モデルは連続空間モデルになる。 Since CT resolution is low compared to histology and plaque anatomy, it may be preferable to utilize a continuous space (time) Markov model rather than a discrete space (time) in some embodiments. This works naturally well with subpixel interpolation, so it may work well with level set representations of probability maps. Since the state of the analyte is discrete, the model becomes a discrete space model. However, if the analyte represents a continuous probability rather than the presence / absence of the analyte, the model is a continuous spatial model.
肺に基づく適用に目を向けると、以下の表4は、このような適用の階層分析フレームワークに関して利用できる例示的な生物学的性状/分析物を描いている。
特に、システムは、肺病巣を検出するように構成されてもよい。したがって、例示的なシステムは、肺全体のセグメンテーションのために構成されてもよい。いくつかの実施形態では、システムは、胸膜近傍病巣の問題を解決するための最小曲率進展の使用を含んでもよい。いくつかの実施形態では、システムは、肺成分分析(血管、裂傷、気管支、病巣など)を実装してもよい。有利には、肺成分分析を容易にするための、ヘッセフィルタを利用してもよい。いくつかの実施形態では、肺成分分析は、例えば、裂傷の外形の関数として、胸膜浸潤をさらに含んでもよい。さらなる実施形態では、解剖学的構造への付着も考慮されてもよい。肺成分分析に加えて、記載されたすりガラスと固体との別々の分析も適用してもよい。この分析は、体積、直径、球形度などの外形特徴、密度および質量などの画像特徴の決定、およびフラクタル分析を含んでもよい。 In particular, the system may be configured to detect lung lesions. Therefore, an exemplary system may be configured for whole lung segmentation. In some embodiments, the system may include the use of minimal curvature extension to solve the problem of near-pleural lesions. In some embodiments, the system may implement lung component analysis (blood vessels, lacerations, bronchi, lesions, etc.). Advantageously, a Hesse filter may be utilized to facilitate lung component analysis. In some embodiments, lung component analysis may further include pleural infiltration, for example as a function of the contour of the laceration. In a further embodiment, attachment to the anatomical structure may also be considered. In addition to the lung component analysis, separate analyzes of ground glass and solids described may also be applied. This analysis may include determination of external features such as volume, diameter, sphericity, image features such as density and mass, and fractal analysis.
フラクタル分析は、鱗状の成長パターンを推論するために使用してもよい。非常に小さな関心領域でフラクタル分析を実施するために、我々の方法は、畳み込みカーネルのサポートを適応的に変更して、それらを関心領域(すなわち、肺結節)に制限する。交差する血管/気管支および非病巣の特徴は、フラクタル分析の目的でマスクアウトされてもよい。これは、マスクされた局所近傍にIIRガウスフィルタを適用し、IIRぼかしバイナリマスキングを使用して正規化することによって行われる。いくつかの実施形態では、フラクタル分析は、(局所平均の分散に基づいて)空隙性を決定することをさらに含んでもよい。これは、肺病巣、病巣のサブパートに関して適用することができる。例示的な実施形態では、IIRガウスフィルタまたは円形近傍を適用することができる。いくつかの実施形態では、分散を計算するために、IIRを利用することができる。局所分散の平均(AVL)もまた、例えば、肺病巣に適用されるように計算されてもよい。同様に、局所分散の分散を算出することができる。 Fractal analysis may be used to infer scaly growth patterns. To perform fractal analysis in very small areas of interest, our method adaptively modifies support for convolution kernels to limit them to areas of interest (ie, lung nodules). Crossing vessel / bronchial and non-focal features may be masked out for fractal analysis purposes. This is done by applying an IIR Gaussian filter to the masked local neighborhood and normalizing it using IIR blur binary masking. In some embodiments, the fractal analysis may further include determining lacunarity (based on the variance of the local average). This can be applied for lung lesions, lesion subparts. In an exemplary embodiment, an IIR Gaussian filter or a circular neighborhood can be applied. In some embodiments, IIRs can be utilized to calculate the variance. The mean local dispersion (AVL) may also be calculated to apply, for example, to lung lesions. Similarly, the variance of the local variance can be calculated.
例示的な実施形態では、病巣の構造と組成との両方を算出することができる。有利には、病巣構造を計算することは、薄い区分の全体積測定を利用することができ、それにより、サイズ測定変化の算出を改善することができる。病巣構造の評価の一部として、亜固体およびすりガラス不透明度(GGO)体積などの測定値を決定することもできる。病巣の組成に目を向けると、圧密、浸潤、近接、および灌流などの組織特性を算出することができ、例えば、それにより、従来の分析と比較して偽陽性率を低減することができる。 In an exemplary embodiment, both the structure and composition of the lesion can be calculated. Advantageously, the calculation of the lesion structure can utilize the total volume measurement of the thin section, which can improve the calculation of the size measurement change. Measurements such as subsolid and ground glass opacity (GGO) volume can also be determined as part of the assessment of lesion structure. Looking at the composition of the lesions, tissue properties such as consolidation, infiltration, proximity, and perfusion can be calculated, for example, which can reduce the false positive rate compared to conventional analysis.
ここで図18を参照すると、本開示のシステムのためのさらなる例示的な階層分析フレームワーク1800が描かれている。図18は、階層的推論システムの例示的な中間処理層に関してより詳細を解明する図1の詳細として理解することができる。有利には、階層的推論は、依然として、イメージングデータ1810から基礎となる生物学的情報1820に、臨床疾患1800に流れる。しかしながら、特に、フレームワーク1800は、生物学的性状/分析物を決定するためにイメージングデータを処理するための複数レベルのデータ点を含む。前処理レベル1812では、物理的パラメータ、位置合わせ変換、および領域セグメンテーションを決定してもよい。次に、この前処理されたイメージング情報を利用して、強度特徴、形状、テクスチャ、および時間特性などの次のレベルのデータ点1814で画像特徴を抽出することができる。次に、抽出された画像特徴をレベル1816で利用して、1つ以上の生物学的モデルをイメージングされた解剖学的構造にフィッティングすることができる。例示的モデルには、ベイズ/マルコフ正味病巣下部構造、フラクタル成長モデル、または本明細書に記載されているような他のモデルが含まれる。生物学的モデルは、有利には、イメージング特徴をレベル1822で基礎となる生物学的性状/分析物に相関させるためのブリッジとして機能することができる。生物学的性状/分析物の例には、解剖学的構造、組織組成、生物学的機能、遺伝子発現相関などが含まれる。最後に、レベル1832では、生物学的性状/分析物を利用して、例えば、疾患のサブタイプ、予後、意思決定支援などに関連するものを含む、病変に関連する臨床所見を決定することができる。 With reference to FIG. 18, a further exemplary analytic
図19は、AHAが採用したStaryプラーク型決定システムをアンダーレイとして使用し、インビボで決定されたタイプを色のオーバーレイで示した、血管療法の指示における表現型決定目的の例示的な適用である。左のパネルは、プラーク病変の物理的特性に基づいて、プラーク病巣の動的挙動の可能性に応じてラベル付けを行う例を示し、右図は、分類結果を患者の治療指導に利用した例を示す。例示的なマッピングは、「I」、「II」、「III」、「IV」、「V」、「VI」、「VII」、「VIII」]であり、class_map=[不顕性、不顕性、不顕性、不顕性、不顕性、不安定、不安定、安定、安定]をもたらす。この方法は、Staryとは結び付けられていない。例えば、Virmaniシステム[「石灰化結節」、「CTO」、「FA」、「FCP」、「治癒プラーク破裂」、「PIT」、「IPH」、「破裂」、「TCFA」、「ULC」]は、class_map=[安定、安定、安定、安定、安定、安定、不安定、不安定、不安定、不安定]で使用されており、他の型決定システムでも同様に高い性能が得られる可能性がある。例示的な実施形態では、本開示のシステムおよび方法は、異種の型検査システムをマージしてもよく、クラスマップを変更してもよく、または他の変形例があってもよい。FFR表現型の場合、例えば物理的FFRとの比較を容易にするために、正常または異常などの値が使用されてもよく、および/または数値が使用されてもよい。 FIG. 19 is an exemplary application of the phenotyping objective in vascular therapy instructions, using the Stary plaque typology system adopted by AHA as an underlay and showing the in vivo determined types in color overlays. .. The left panel shows an example of labeling according to the possibility of dynamic behavior of plaque lesions based on the physical characteristics of plaque lesions, and the right figure shows an example of using the classification results for patient treatment guidance. Is shown. Exemplary mappings are "I", "II", "III", "IV", "V", "VI", "VII", "VIII"], and class_map = [subclinical, subclinical]. Sex, subclinical, subclinical, subclinical, unstable, unstable, stable, stable]. This method is not tied to Stary. For example, the Virmani system ["calcified nodule", "CTO", "FA", "FCP", "healing plaque rupture", "PIT", "IPH", "rupture", "TCFA", "ULC"] , Class_map = [Stable, Stable, Stable, Stable, Stable, Stable, Unstable, Unstable, Unstable, Unstable], with the potential for high performance in other typing systems as well. be. In exemplary embodiments, the systems and methods of the present disclosure may merge dissimilar typing systems, modify class maps, or have other variants. In the case of the FFR phenotype, values such as normal or abnormal may be used and / or numerical values may be used to facilitate comparison with, for example, physical FFR.
図20は、肺癌などの別の疾患の例である。この例では、腫瘤のサブタイプは、顕在表現型に基づいて患者にとって最も有益な治療を指示するように決定され得る。 FIG. 20 is an example of another disease such as lung cancer. In this example, the subtype of the mass can be determined to direct the most beneficial treatment for the patient based on the overt phenotype.
CNNは、分析物の面積測定値に含まれない(のみ)に含まれていない空間的コンテキストを抽出するフィルタを含むので、CNNは読み取り値ベクトル分類よりも優れた性能を発揮することが期待される。訓練セットが減少したにもかかわらず、CNNを使用するのは、以下の理由から実用的であり得る。
1)大幅に異なる代替療法に対応するクラスは比較的少ない(エクスビボ組織を必要とする研究アッセイで行われるように完全に粒状ではない)、例えば分類問題の3つの表現型、転帰予測/リスク層別化問題の3つのリスクレベルがあるので、問題は一般的に簡単になる。
2)例えば、レベルセットまたは他のアルゴリズムクラスによる分析物領域の偽色領域への処理は、セグメンテーションを生成し、簡略化された、しかしかなり補強されたデータセットで分類器を提示することによって、画像解釈のかなりの部分を実施する。測定可能なパイプライン段階は、データの次元を減らし(CNNが分解しなければならない問題の複雑さを低減する)と同時に、検証可能な中間値を提供し、これによりパイプライン全体の信頼性を高めることができる。
3)正規化された座標系を使用してデータを再フォーマットすると、分類に実質的な影響を与えない変数(プラーク表現型決定の例の血管サイズなど)に起因するノイズの変動が除去される。CNNs are expected to outperform reading vector classifications because they include filters that extract spatial contexts that are not (only) included in the area measurements of the analyte. NS. Despite the reduced training set, the use of CNNs can be practical for the following reasons:
1) Relatively few classes correspond to significantly different alternative therapies (not completely granular as done in study assays that require Exvivo tissue), eg, three phenotypes of classification problems, outcome prediction / risk strata The problem is generally simplified because there are three risk levels for the classification problem.
2) For example, the processing of the analyte area into the false color area by a level set or other algorithm class generates segmentation and presents the classifier in a simplified but well-enhanced dataset. Perform a significant portion of image segmentation. The measurable pipeline step reduces the dimension of the data (reduces the complexity of the problem that the CNN has to decompose) while providing verifiable intermediate values, thereby increasing the reliability of the entire pipeline. Can be enhanced.
3) Reformatting the data using a normalized coordinate system eliminates noise fluctuations due to variables that have no substantial effect on classification (such as vessel size in the plaque phenotyping example). ..
このアイデアをテストするために、次の3つの段階で構成されるパイプラインが構築された。
1)バイオマスのどの領域が特定のクラスに分類されるかを識別するためのセマンティックセグメンテーション
2)静脈/動脈の断面を長方形に変換するための空間アンラッピング、および
3)注釈付けされた長方形を読み取り、それに関連するクラス(安定または不安定)を識別するための訓練されたCNN。To test this idea, a pipeline was constructed consisting of the following three stages.
1) Semantic segmentation to identify which regions of the biomass fall into a particular class 2) Spatial unwrapping to convert venous / arterial cross sections into rectangles, and 3) Read annotated rectangles , A trained CNN to identify the class (stable or unstable) associated with it.
一般性を損なうことなく、本明細書に記載される例示的なシステムおよび方法は、空間アンラップを適用することができる(例えば、(アンラップされたデータセット)空間アンラッピングを伴う、および(ドーナツデータセット)空間アンラッピングを伴わないCNNの訓練およびテスト)。アンラッピングは、検証精度を改善させることが観察された Without compromising generality, the exemplary systems and methods described herein can apply spatial unwrapping (eg, with (unwrapped dataset) spatial unwrapping, and (doughnut data). Set) CNN training and testing without spatial unwrapping). Unwrapping was observed to improve verification accuracy
セマンティックセグメンテーションおよび空間アンラッピング:
まず、画像体積を前処理する。この前処理には、標的の初期化、正規化、および表現型決定される生理学的標的を含む関心領域を形成するためのぼけ除去または復元などの他の前処理が含まれてもよい。当該領域は、その体積を通る断面から構成される体積である。身体部位は自動的に決定されるか、またはユーザによって明示的に提供される。本質的に管状である身体部位の標的は、中心線を伴う。中心線は、存在する場合、分岐し得る。分岐には、自動的に、またはユーザによってラベル付けされてもよい。中心線の概念に関する一般化は、管状ではないが、いくつかの構造的指向性、例えば腫瘍の領域によって利益を得る解剖学的構造について表現され得る。いずれの場合も、体積の断面ごとに重心が決定される。管状構造の場合、重心はチャネルの中心、例えば血管の内腔になる。病巣の場合、これが腫瘍の重心になる。Semantic segmentation and spatial unwrapping:
First, the image volume is preprocessed. This pretreatment may include other pretreatments such as target initialization, normalization, and deblurring or restoration to form a region of interest containing the phenotypized physiological target. The region is a volume composed of a cross section passing through the volume. Body parts are determined automatically or provided explicitly by the user. Targets of body parts that are tubular in nature are accompanied by a centerline. The centerline, if present, can diverge. The branch may be labeled automatically or by the user. Generalizations on the concept of centerlines can be expressed for some structural orientations, such as anatomical structures that benefit from the area of the tumor, although they are not tubular. In either case, the center of gravity is determined for each volume cross section. In the case of a tubular structure, the center of gravity is the center of the channel, eg the lumen of a blood vessel. In the case of a lesion, this is the center of gravity of the tumor.
図21は、例示的な画像前処理ステップの表現であり、この場合、患者固有の点広がり決定アルゴリズムを使用して、表現型を予測する特性を決定する能力を低下させる可能性のある画像形成プロセスから生じるアーチファクトまたは画像制限を軽減するぼけ除去または復元する。この図は、CTからのプラークの放射線分析アプリケーション分析の一部分を実証している。ここに示されているのは、画像の異なる領域の真の潜在密度に関する想定を正規化して、スキャナ点広がり関数の物理モデルを反復的にフィッティングした結果である、ぼけ除去または復元された画像である。この図は、定量的ステップを実施する能力を支援するために様々な画像処理操作を実施できることを説明するために含まれており、この方法が本開示の特定の発明に必要であることを示すものではなく、むしろ全体的な性能を改善するために取られる可能性のあるステップの例である。 FIG. 21 is a representation of an exemplary image preprocessing step, in which case image formation that may reduce the ability to determine phenotypic predictive properties using a patient-specific point spread determination algorithm. Blurring or restoring to reduce artifacts or image restrictions resulting from the process. This figure demonstrates part of the radiation analysis application analysis of plaques from CT. Shown here is a deblurred or restored image that is the result of iterative fitting of the physical model of the scanner point spread function, normalizing assumptions about the true potential density of different regions of the image. be. This figure is included to illustrate that various image processing operations can be performed to support the ability to perform quantitative steps, indicating that this method is required for the particular invention of the present disclosure. It is not a thing, but rather an example of the steps that may be taken to improve overall performance.
(任意選択でぼけ除去または復元された)画像は、直交データセットで表現され、ここで、xは重心からの距離を表現し、yは回転シータを表現し、zは断面を表現する。このような直交セットは、分岐または領域につき1つ形成されることになる。複数のセットが使用される場合、「ヌル」値が重なり合う領域に使用されることになり、つまり、各物理ボクセルは、幾何学的に互いに適合するような方法で、セット全体で1回だけ表現されることになる。各データセットは、客観的に検証可能な組織組成によってラベル付けされたサブ領域を有する追加のデータセットとペアになる(例えば、図36を参照)。血管組織のラベルの例としては、内腔、石灰化、LRNCなどを挙げることができる。病巣のラベルの例としては、壊死性、新生血管化などを挙げることができる。これらのラベルは、客観的に、例えば組織学などによって検証することができる(例えば、図37を参照)。ペアのデータセットは、畳み込みニューラルネットワークを構築するための訓練ステップへの入力として使用すされることになる。2つのレベルの分析がサポートされており、1つは個々の断面レベルでの分析であり、任意選択で出力が隣接する断面間で連続的に変化する場合、もう1つは、体積レベルでの分析(個々の断面は静止フレームとみなされる場合があり、血管ツリーの走査は、動画のように考えられる)である。 The image (optionally deblurred or restored) is represented by an orthogonal dataset, where x represents the distance from the center of gravity, y represents the rotating theta, and z represents the cross section. One such orthogonal set will be formed per branch or region. If multiple sets are used, they will be used in areas where the "null" values overlap, meaning that each physical voxel is represented only once throughout the set in a way that geometrically fits each other. Will be done. Each dataset is paired with an additional dataset that has subregions labeled with an objectively verifiable tissue composition (see, eg, FIG. 36). Examples of labels for vascular tissue include lumens, calcifications, LRNCs and the like. Examples of lesion labels include necrosis, neovascularization and the like. These labels can be objectively verified, for example by histology (see, eg, FIG. 37). The paired dataset will be used as input to the training steps for building a convolutional neural network. Two levels of analysis are supported, one at the individual cross-section level and optionally if the output changes continuously between adjacent cross-sections, the other at the volume level. Analysis (individual cross sections may be considered static frames, and scanning of the vessel tree is thought of as a moving image).
例示的なCNN設計:
AlexNetはCNNであり、2012年にImageNet Large Scale Visual Recognition Challengeに参加した。このネットワークは15.3%のトップ5エラーを達成した。AlexNetは、当時トロント大学のAlex Krizhevsky、Geoffrey Hinton、Ilya SutskeverからなるSupervisionグループによって設計された。AlexNetは、独立した画像のセットを分類するためにゼロから訓練された(ネットワーク訓練中の訓練および検証ステップでは使用されない)。アンラップデータには、400x200ピクセルの入力を有するAlexNetスタイルのネットワークが使用され、ドーナツネットワークは280x280ピクセルの入力を有するAlexNetスタイルである(解像度はほぼ同じであるが、アスペクト比が異なる)。すべての畳み込みフィルタ値は、ImageNetデータセットで訓練されたAlexNetから取得された重みで初期化された。ImageNetデータセットは自然な画像データセットであるが、これは単に重みの初期化の効果的な方法として機能する。訓練が開始されると、すべての重みが新しいタスクによりよくフィッティングするように調整される。訓練スケジュールのほとんどは、オープンソースのAlexNet実装から直接取得されたが、ある程度の調整が必要であった。具体的には、AlexNetドーナツネットワークとAlexNetアンラップネットワークとの両方で、基本学習率が0.001(solver.prototxt)に低減され、バッチサイズが32(train_val.prototxt)に低減された。すべてのモデルは10,000回の反復で訓練され、2,000回の反復まで訓練されたときにスナップショットと比較された。オーバーフィットに関するより詳細な研究を行うことをできるが、一般に、訓練と検証との両方のエラーが2,000〜10,000の反復で減少することがわかった。Illustrative CNN design:
AlexNet is CNN and participated in the ImageNet Large Scale Visual Recognition Challenge in 2012. This network achieved a top 5 error of 15.3%. AlexNet was designed by the Supervision group of Alex Krizhevsky, Geoffrey Hinton, and Ilya Sutsukever of the University of Toronto at the time. AlexNet was trained from scratch to classify independent sets of images (not used in training and validation steps during network training). AlexNet-style networks with 400x200 pixel inputs are used for unwrapped data, and donut networks are AlexNet-style with 280x280 pixel inputs (same resolution but different aspect ratios). All convolution filter values were initialized with weights obtained from AlexNet trained on the ImageNet dataset. The ImageNet dataset is a natural image dataset, but it simply serves as an effective method of weight initialization. When training begins, all weights are adjusted to better fit the new task. Most of the training schedule was taken directly from the open source AlexNet implementation, but required some tweaking. Specifically, in both the AlexNet donut network and the AlexNet unwrap network, the basic learning rate was reduced to 0.001 (solver.prototxt) and the batch size was reduced to 32 (train_val.prototxt). All models were trained at 10,000 iterations and compared to snapshots when trained up to 2,000 iterations. More detailed studies on overfitting can be done, but in general it has been found that both training and validation errors are reduced with 2,000 to 10,000 iterations.
代替の機能拡張子(接頭辞)は、以下のものを含むこともある。
・ResNet−https://arxiv.org/abs/1512.03385
・GoogLeNet−https://www.cs.unc.edu/〜wliu/papers/GoogLeNet.pdf
・ResNext−https://arxiv.org/abs/1611.05431
・ShuffleNet V2−https://arxiv.org/abs/1807.11164
・MobileNet V2−https://arxiv.org/abs/1801.04381Alternative feature extensions (prefixes) may include:
-ResNet-https: // arxiv. org / abs / 1512.03385
-GoodLeNet-https: // www. cs. unc. edu / ~ wliu / papers / GoogleLeNet. pdf
-ResNext-https: // arxiv. org / abs / 1611.05431
-ShuffleNet V2-https: // arxiv. org / abs / 1807.11.164
-MobileNet V2-https: // arxiv. org / abs / 1801.04381
断面間のフレーム間冗長性(「時間的」冗長性と呼ばれることもあるが、我々の場合は断面間冗長性の一形態である)などの実行時最適化は、計算量を節約するために活用することができる(例えば、http://arxiv.org/abs/1803.06312)。訓練または推論のための多くの最適化を実装することができる。 Run-time optimizations such as inter-section redundancy (sometimes called "temporal" redundancy, but in our case it is a form of inter-section redundancy) are to save computation. It can be utilized (for example, http: //arciv.org/abs/1803.06312). Many optimizations for training or reasoning can be implemented.
例示的なテストの実装では、AlexNetは、VおよびVIの組織学的グラウンドトゥルースプラークタイプに基づいて、臨床的に有意な2つのカテゴリ、例えば「不安定な」プラークと「安定した」プラークとの間で独立した画像セットを分類するように訓練された。後者には、米国心臓協会(AHA)によって承認された業界の事実上の標準的なプラーク分類命名法に従うプラークタイプVIIおよびVIIIが含まれている。 In an exemplary test implementation, AlexNet has two clinically significant categories, eg, "unstable" plaques and "stable" plaques, based on the histological ground truth plaque types of V and VI. Trained to classify independent image sets between. The latter includes plaque types VII and VIII, which follow the industry's de facto standard plaque classification nomenclature approved by the American Heart Association (AHA).
一般性を損なうことなく、示された例では、全体の精度と混同行列との両方を利用して性能を評価した。この形式は、二項分類システムで4つの可能性、つまり、真陽性、真陰性、偽陽性、偽陰性を計算するという概念に基づいていた。例示的な実施形態では、他の転帰変数を使用することができるが、例えば、転帰変数として感度および特異性、またはF1スコア(精度および感度の調和平均)を利用することができる。代替的に、AUC特性を二項分類器に対して計算することもできる。さらに、分類器はバイナリに基づいていなくてもよい。例えば、いくつかの実施形態では、分類器は、3つ以上の可能な状態に基づいてソートすることができる。 Without compromising generality, in the examples shown, performance was evaluated using both overall accuracy and the confusion matrix. This form was based on the concept of calculating four possibilities in a binary classification system: true positives, true negatives, false positives, and false negatives. In exemplary embodiments, other outcome variables can be used, for example, sensitivity and specificity, or F1 score (harmonic mean of accuracy and sensitivity) can be utilized as outcome variables. Alternatively, the AUC characteristic can be calculated for a binary classifier. Moreover, the classifier does not have to be binary based. For example, in some embodiments, the classifier can be sorted based on three or more possible states.
データセットの拡張:
医師の注釈付けされたデータは高価であるため、医療データセットを人為的に増加させることが望ましい(例えば、訓練および/または検証で使用するため)。本明細書に記載される例示的な実施形態では、2つの異なる拡張技術を使用した。ドーナツは水平方向にランダムに反転し、0〜360のランダムな角度に回転した。結果として得られた回転ドーナツを、ドーナツが存在する範囲に切り取り、次に、正方形のアスペクト比を持つように画像を埋めるために黒いピクセルでパディングした。次に、結果を280x280サイズにスケーリングし、PNGに保存した。Dataset expansion:
Physician annotated data is expensive and it is desirable to artificially increase the medical dataset (eg, for use in training and / or validation). In the exemplary embodiments described herein, two different extensions were used. The donuts were randomly flipped horizontally and rotated at random angles from 0 to 360. The resulting rotating donut was cut to the extent that the donut was present and then padded with black pixels to fill the image with a square aspect ratio. The results were then scaled to 280x280 size and stored in PNG.
アンラップデータセットは、ランダムに水平方向に反転することによって拡張し、0から画像の幅までの範囲のランダムな数のピクセルによって「スクロール」した。次に、結果を400x200サイズにスケーリングし、PNGに保存した。 The unwrapped dataset was extended by randomly flipping horizontally and "scrolled" by a random number of pixels ranging from 0 to the width of the image. The results were then scaled to 400x200 size and stored in PNG.
両方のデータセットを15倍に増加させた。これにより、拡張後の画像の総数は元の数の15倍になる。クラスの正規化を実装した。つまり、最終的なデータセットには、各クラスに関連する画像の数がほぼ同じになる。各クラスの元の画像数が異なる可能性があるため、これは重要である。したがって、訓練セット内の画像数が多いクラスに分類器はバイアスがかけられる。 Both datasets were increased 15-fold. As a result, the total number of expanded images is 15 times the original number. Implemented class normalization. That is, the final dataset will have approximately the same number of images associated with each class. This is important because the original number of images in each class can be different. Therefore, the classifier is biased to the class with the highest number of images in the training set.
一般性を損なうことなく、注釈を実施した各放射線科医は、任意の数の組織タイプを使用することができる。 Each annotated radiologist may use any number of tissue types without compromising generality.
図22は、本発明の態様を実証するために使用された例示的な適用を示し、この場合、動脈硬化性プラーク表現型分類の分類(例として特定の対象データを使用する)のためのものである。異なる色は異なる組織分析物の種類を表現し、濃い灰色は通常の壁を示す。この図は、プラーク表現型を示す組織特性のグラウンドトゥルース注釈の結果、および血管の軸に直交する断面にそれらがどのように存在するかについての空間的コンテキストを示している。この図はまた、多数の組織学的断面の分析に共通の基礎を提供するために開発された座標系も示している。座標系(接線距離対半径距離)を実証するためにグリッド線を追加し、色分けされた病理医の注釈の上にオーバーレイする。これの重要な側面は、この種のデータセットは、高解像度のフル画像の代わりに比較的単純な偽色画像を使用して情報を単純化するが、空間的コンテキストを失うことなく、例えば、「ナプキンリングサイン」、近傍内腔カルシウム、薄い(または厚い)キャップ(LRNCと内腔との間の間隔)などの表現のための形式的な表現を有することから、深層学習アプローチで効率的に使用される可能性があるということである。 FIG. 22 shows an exemplary application used to demonstrate aspects of the invention, in this case for classification of arteriosclerotic plaque phenotyping (using specific subject data as an example). Is. Different colors represent different types of tissue analysts, dark grays indicate normal walls. This figure shows the results of ground truth annotations of tissue properties showing plaque phenotypes, and the spatial context of how they are present in cross-sections orthogonal to the axis of the vessel. The figure also shows a coordinate system developed to provide a common basis for the analysis of many histological sections. Add grid lines to demonstrate the coordinate system (tangent distance vs. radius distance) and overlay on top of the color-coded pathologist annotations. An important aspect of this is that this type of dataset simplifies information by using relatively simple false color images instead of high resolution full images, but without losing spatial context, for example, Efficient in deep learning approaches, as it has formal expressions for expressions such as "napkin ring signs", nearby lumen calcium, thin (or thick) caps (distance between LRNC and lumen), etc. It means that it may be used.
図23は、単位フェーザを使用して内部的に表現された接線方向および半径方向の変数を示しており、ここでは、グレースケールでコード化されたフェーザ角度を示されており、これは、血管およびそのような構造(例えば、胃腸管)に関連付けられた他の病態生理に関連する管状構造の正規化された軸の使用を例示している。黒色から白色への垂直バーは、グレースケールエンコーディングに起因して純粋に任意の境界であり、正規化された半径距離は、内腔境界で0の値、外側境界で1の値を有することに留意されたい。 FIG. 23 shows the tangential and radial variables internally expressed using the unit phasor, where the grayscale-coded phasor angle is shown, which is the blood vessel. And exemplifies the use of normalized axes of tubular structures associated with other pathophysiology associated with such structures (eg, gastrointestinal tract). The black-to-white vertical bar is a purely arbitrary boundary due to the grayscale encoding, and the normalized radial distance has a value of 0 at the lumen boundary and a value of 1 at the outer boundary. Please note.
図24は、病理医が組織学から生成した注釈(実線の領域)の上に、CTAから生成した注釈(塗りつぶされていない色の輪郭)を重ね合わせた例示的な放射線分析アプリケーションの例示的なオーバーレイを示している。本明細書に提示されるシステムおよび方法の例示的な態様は、分類器が既知のグラウンドトゥルースで訓練される場合に、表現型を非侵襲的に決定するために、インビボ非侵襲的イメージングを形成する輪郭を分類スキームとともに使用できることである。具体的には、(対応関係を示すために提供されるこの特定の区分のためのエクスビボ注釈との関係を曖昧にしないように)この図に塗りつぶされていない示されている輪郭を塗りつぶすと、分類器のための入力データが作成される。 FIG. 24 is an exemplary radiation analysis application in which a pathologist-generated annotation (solid line area) is overlaid with a CTA-generated annotation (unfilled color contour). Shows an overlay. Illustrative aspects of the systems and methods presented herein form in vivo non-invasive imaging to determine the phenotype non-invasively when the classifier is trained with known ground truth. The contours to be used with the classification scheme. Specifically, if you fill in the unfilled contours shown in this figure (so as not to obscure the relationship with the Exvivo annotations for this particular segment provided to show the correspondence), Input data for the classifier is created.
図25は、具体的には、壁の厚さおよび半径方向の提示に関連付けられた無関係な変動を回避するために正規化された座標系を利用する、データ補強のさらなるステップを実証する。具体的には、「ドーナツ」は、病理医の注釈を保持しながら「アンラップ」される。左のパネルは、切り開いた「C」形状を無傷の血管壁のインビボ「O」形状に戻すためにモーフィングした後のプラークの組織学的スライスの病理医の領域注釈を示している。横軸は壁の周りの接線方向である。縦軸は正規化された半径方向である(下部は内腔表面、上部は外側表面である)。また、病理医の注釈のより細かい粒度は、インビボ放射線分析アプリケーション(例えば、LRNC、CALC、IPH)による抽出を目的とした粒度と一致するように折りたたまれていることに留意されたい。右のパネルは、比較可能なアンラップされた放射線分析アプリケーションの注釈を示している。軸および色は病理医の注釈と同じである。 FIG. 25 demonstrates a further step in data augmentation, specifically utilizing a normalized coordinate system to avoid irrelevant variations associated with wall thickness and radial presentations. Specifically, the "doughnut" is "unwrapped" while retaining the pathologist's annotations. The left panel shows the pathologist's regional annotation of the histological slice of plaque after morphing to restore the in vivo "O" shape of the intact vessel wall to the cut open "C" shape. The horizontal axis is the tangential direction around the wall. The vertical axis is the normalized radial direction (the lower part is the lumen surface and the upper part is the outer surface). Also note that the finer particle size of the pathologist's annotations is collapsed to match the particle size intended for extraction by in vivo radiological analysis applications (eg, LRNC, CALC, IPH). The right panel shows annotations for comparable unwrapped radiation analysis applications. The axes and colors are the same as the pathologist's notes.
図26は、プラーク表現型決定の例に関連する次の改良点を表現している。アンラップされた形式から作業すると、内腔の不規則性(例えば、潰瘍化または血栓の結果として)および局所的に変化する壁の厚さが表現される。下部の薄い灰色は内腔を表現し(内腔表面の不規則性を表現するためにこのステップで追加される)、前のステップで使用された黒色は、様々な壁の厚さを表現するために、ここで濃い灰色に置き換えられる。色は壁の外側の領域を完全に表現する。 FIG. 26 represents the following improvements related to the example of plaque phenotyping. Working from the unwrapped form expresses luminal irregularities (eg, as a result of ulceration or thrombosis) and locally varying wall thickness. The light gray color at the bottom represents the lumen (added in this step to represent the irregularity of the lumen surface), and the black color used in the previous step represents various wall thicknesses. Therefore, it is replaced with dark gray here. The color perfectly represents the area outside the wall.
図27は、例えば、プラーク内出血および/または必要に応じて他の形態の側面を含むように、追加の例を表現する(例として特定の対象データを使用する)。左のパネルはドーナツの表現を示し、右のパネルは内腔表面および局所的な壁の厚さでアンラップされた状態を示している。 FIG. 27 represents an additional example (using specific target data as an example) to include, for example, intra-plaque bleeding and / or other morphological aspects as needed. The left panel shows the donut representation, and the right panel shows the unwrapped state with the lumen surface and local wall thickness.
テストしたCNNの例には、AlexNetおよびInceptionフレームワークに基づくCNNが含まれていた。 Examples of CNNs tested included CNNs based on AlexNet and the Inception framework.
AlexNetの結果:
テストした実施形態の例では、畳み込みフィルタ値を、ImageNet(ここでは引用)データセットで訓練されたAlexNetから取得された重みで初期化した。ImageNetデータセットは自然な画像データセットであるが、これは単に重みの初期化の効果的な方法として機能する。訓練が開始されると、すべての重みが新しいタスクによりよくフィッティングするように調整される。AlexNet Results:
In the example of the embodiments tested, the convolution filter values were initialized with weights obtained from AlexNet trained on the ImageNet (cited here) dataset. The ImageNet dataset is a natural image dataset, but it simply serves as an effective method of weight initialization. When training begins, all weights are adjusted to better fit the new task.
訓練スケジュールのほとんどは、オープンソースのAlexNet実装から直接取得されたが、ある程度の調整が必要であった。具体的には、AlexNetドーナツネットワークとAlexNetアンラップネットワークとの両方で、基本学習率が0.001(solver.prototxt)に低減され、バッチサイズが32(train_val.prototxt)に低減された。 Most of the training schedule was taken directly from the open source AlexNet implementation, but required some tweaking. Specifically, in both the AlexNet donut network and the AlexNet unwrap network, the basic learning rate was reduced to 0.001 (solver.prototxt) and the batch size was reduced to 32 (train_val.prototxt).
すべてのモデルは10,000回の反復で訓練され、2,000回の反復まで訓練されたときにスナップショットと比較された。オーバーフィットに関するより詳細な研究を行うことをできるが、一般に、訓練と検証との両方のエラーが2,000〜10,000の反復で減少することがわかった。 All models were trained at 10,000 iterations and compared to snapshots when trained up to 2,000 iterations. More detailed studies on overfitting can be done, but in general it has been found that both training and validation errors are reduced with 2,000 to 10,000 iterations.
まったく新しいAlexNetネットワークモデルを、2人の主要な病理学者のグラウンドトゥルース結果の4つの異なる組み合わせ、画像の2つの異なる処理方法(上記を参照)、およびアンラップ画像およびドーナツ画像についてゼロから訓練した。結果を図28に示す。各データセットのバリエーションでは、クラス正規化を有効にして、訓練データを15倍に拡張した。ネットワークは、この拡張データで訓練され、そのバリエーションに対応する対応する拡張されていない検証データでテストした。アンラップデータには、400x200ピクセルの入力を有するAlexNetスタイルのネットワークが使用され、ドーナツネットワークは280x280ピクセルの入力を有するAlexNetスタイルである(解像度はほぼ同じであるが、アスペクト比が異なる)。テスト実施形態では、従来の層および完全に接続された層の寸法を変更したことに留意されたい。したがって、AlexNetテストの実施形態のネットワークは、5つの畳み込み層、3つの完全に接続された層のネットワークとして説明することができる。一般性を損なうことなく、これらの結果から示されるいくつかの高レベルの結論を以下に示す。
1)WN_RVデータセットを除いて、アンラップされたデータは、全体的に高い検証精度を受け取るため、データの分析が容易であるように思われる
2)正規化されていないデータは、予想どおり、より表現的なものであることが実証される。
3)WN_RVデータセットに関して、当初のアイデアは、WNおよびRVの真理データをプールして、型決定システムの互換性およびセットをマージできる程度を確認することであった。そうすることで、WNおよびRVのデータに有意差が観察された。WN_RV実験の本来の目的は、複数の病理学者からの訓練データをプールして、その情報が有効性に寄与するかどうかを確認することであった。代わりに、改善というよりはむしろ劣化が観察された。これは、そのようなデータのプール化を妨げた配色の変化によるものと決定された。したがって、プール化を有効にするために配色を正規化することを検討することができる。A brand new AlexNet network model was trained from scratch on four different combinations of ground truth results from two major pathologists, two different ways of processing images (see above), and unwrapped and donut images. The results are shown in FIG. For each dataset variation, class normalization was enabled to extend the training data by a factor of 15. The network was trained with this extended data and tested with the corresponding unextended validation data corresponding to its variations. AlexNet-style networks with 400x200 pixel inputs are used for unwrapped data, and donut networks are AlexNet-style with 280x280 pixel inputs (same resolution but different aspect ratios). Note that in the test embodiment, the dimensions of the conventional layer and the fully connected layer were changed. Therefore, the network of the AlexNet test embodiment can be described as a network of five convolution layers and three fully connected layers. Some high-level conclusions drawn from these results, without compromising generality, are presented below.
1) With the exception of the WN_RV dataset, the unwrapped data receives high overall validation accuracy, which seems to make the data easier to analyze. 2) The unnormalized data is better, as expected. It proves to be expressive.
3) For the WN_RV dataset, the original idea was to pool the WN and RV truth data to see the compatibility of the type determination system and the extent to which the sets could be merged. By doing so, significant differences were observed in the WN and RV data. The original purpose of the WN_RV experiment was to pool training data from multiple pathologists to see if that information contributed to its effectiveness. Instead, deterioration was observed rather than improvement. It was determined that this was due to a change in the color scheme that prevented such data from being pooled. Therefore, it is possible to consider normalizing the color scheme to enable pooling.
代替ネットワークの例:開始:
Inception v3 CNNの転移学習の再訓練は、2016年8月8日バージョンのネットワークがTensorFlowサイトにアップロードされて公開されたものから開始された。ネットワークは10,000ステップで訓練された。訓練セットおよび検証セットは、画像の拡張によって画像の数が正規化されたため、両方のサブセットが同じ数の注釈付けされた画像になった。他のすべてのネットワークパラメータは、デフォルト値であるとみなされた。Alternate network example: Start:
Retraining of Inception v3 CNN transfer learning began with the August 8, 2016 version of the network being uploaded and published on the TensorFlow site. The network was trained in 10,000 steps. The training and validation sets had the same number of annotated images for both subsets because the number of images was normalized by image expansion. All other network parameters were considered default values.
事前に訓練されたCNNを使用して、最後の畳み込み層からの出力を使用してイメージング特徴を分類することができ、これは、Google Inception v3CNNの場合は2048×2の次元の数値テンソルである。次に、オブジェクトを認識するようにSVM分類器を訓練する。このプロセスは典型的に、画像の新しいカテゴリを認識するために、ImageNet 2014データセットで最初に訓練されたモデルの最後のsoftmaxレイヤが削除され、再訓練される転移学習および微調整のステップの後に、Inceptionモデルで実施する。 Pre-trained CNNs can be used to classify imaging features using the output from the last convolution layer, which is a 2048x2 dimensional numerical tensor for Google Inception v3 CNNs. .. The SVM classifier is then trained to recognize the object. This process typically involves removing and retraining the last softmax layer of the model first trained in the ImageNet 2014 dataset to recognize new categories of images after the transfer learning and fine-tuning steps. , Implementation model.
代替の実施形態:
図29は、癌の可能性のある肺病巣を表現型決定するための代替例を提供している。左端のパネルは、セグメンテーションされた病巣の輪郭を示しており、前処理により、固体と半固体(「すりガラス」)のサブ領域に分離されている。中央のパネルは肺内での位置を示し、右端のパネルは偽色のオーバーレイで示される。この場合、病巣の三次元の性質が重要であるとみなされる可能性が高いため、二次元断面を別々に処理する代わりに、コンピュータビジョンからのビデオ解釈などの技術を分類子入力データセットに適用してもよい。実際、中心線に沿った「動画」シーケンスのように、複数の断面を順次処理することで、管状構造のこれらの方法を一般化することができる。Alternative Embodiment:
FIG. 29 provides an alternative example for phenotyping potential lung lesions of cancer. The leftmost panel outlines the segmented lesions, which have been pretreated into solid and semi-solid (“ground glass”) subregions. The central panel shows its position in the lungs and the rightmost panel is shown with a false color overlay. In this case, the three-dimensional nature of the lesion is likely to be considered important, so instead of processing the two-dimensional cross-sections separately, techniques such as video interpretation from computer vision are applied to the classifier input dataset. You may. In fact, these methods of tubular construction can be generalized by sequentially processing multiple cross sections, such as a "moving" sequence along the centerline.
別の一般化は、偽の色が個別のパレットから選択されず、代わりにピクセルまたはボクセルの位置で連続値を有する場合である。肺の例を使用して、図30は、各ボクセルに対して算出できる、いわゆる「ラジオミクス」機能と呼ばれることもある一連の機能を示している。このような値のセットは、任意の数の前処理されたオーバーレイに存在してもよく、表現型分類器に供給されてもよい。 Another generalization is when false colors are not selected from a separate palette and instead have continuous values at pixel or voxel positions. Using the lung example, FIG. 30 shows a set of functions that can be calculated for each voxel, sometimes referred to as the so-called "radiomics" function. Such a set of values may be present in any number of preprocessed overlays and may be fed to the phenotypic classifier.
他の代替の実施形態は、単一の時点からの(唯一の)データではなく、例えば、複数の時点から収集されたような変更データを使用することを含む。例えば、陰性細胞型の量または性質が増加した場合、それは、減少した場合の「リグレッサー」表現型に対して、「プログレッサー」表現型であると言うことができる。リグレッサーは、例えば、薬物への反応が原因である可能性がある。代替的に、例えば、LRNCの変化率が速い場合、これは、異なる表現型を意味してもよい。デルタ値または変化率を使用するための例の拡張は、当業者には明らかである。 Other alternative embodiments include using modified data, for example, as collected from multiple time points, rather than (unique) data from a single point in time. For example, if the amount or nature of a negative cell type increases, it can be said to be a "progressor" phenotype as opposed to a "reggressor" phenotype when it decreases. The regressor may be due, for example, to a reaction to a drug. Alternatively, for example, if the rate of change of LRNC is fast, this may mean a different phenotype. An extension of the example for using delta values or rate of change is apparent to those of skill in the art.
追加の代替の実施形態では、他のアッセイ(例えば、実験室の結果)、人口統計学/リスク要因、または放射線画像から得られた他の測定値から導出されるような非空間情報を、CNNの最終層に供給して、空間情報を非空間情報と組み合わせてもよい。また、イメージング時の完全な3D座標の推論によって、分岐部または吻合部などの参照からの血管に沿った1つ以上の特定の位置での読み取りを伴う圧力線の使用などの局所的な情報を決定してもよい。 In additional alternative embodiments, CNN provides non-spatial information as derived from other assays (eg, laboratory results), demographic / risk factors, or other measurements obtained from radiographic images. Spatial information may be combined with non-spatial information by supplying to the final layer of. Full 3D coordinate inference during imaging also provides local information, such as the use of pressure lines with readings at one or more specific locations along the vessel from a reference such as a bifurcation or anastomosis. You may decide.
これらの例の焦点は表現型分類にあったが、本発明のさらなる実施形態として、同様のアプローチを転帰予測の問題に適用することができる。 Although the focus of these examples was on phenotypic classification, a similar approach can be applied to outcome prediction problems as a further embodiment of the invention.
例示的な実装:
本開示のシステムおよび方法は、有利には、複数の段階からなるパイプラインを含み得る。図34は、階層分析フレームワークのさらなる例示的な実装を提供する。生物学的性状は、生物学的性状を、例示的な適用では、脂質に富んだ壊死性コア、キャップの厚さ、狭窄、拡張、再モデリング比、蛇行(例えば、入口角および出口角)、石灰化、IPH、および/または潰瘍化を単独または組み合わせて識別するために、セマンティックセグメンテーションによって識別および定量化される。生物学的性状は、数値的に、また補強されたデータセットにおいて表現され、このデータセットは、静脈/動脈断面を長方形に変換し、次いで、病状(例えば、g、虚血を引き起こす部分血流予備量比FFR、高リスク表現型HRP、および/またはリスク層別化時間から事象(TTE)までを変換し、訓練されたCNN(複数可)を使用して補強されたデータセットを読み取って、状態を識別し、特徴付けるための空間的アンラッピングを伴う。患者の画像が収集され、生のスライスデータは、客観的に検証され得る生物学的性状を測定するためのアルゴリズムのセットで使用され、これらは、次いで、1つ以上のCNNを供給するために補強されたデータセットとして形成され、この例では、結果は、制約を実装するか、または連続的な条件(例えば、血管ツリー全体で近位から遠位への単調に減少する部分血流予備量比、または焦点病巣における一定のHRP値、または他の制約など)を作成するために再帰CNNを使用して前方および後方に伝播される。HRPのグラウンドトゥルースデータは、エクスビボで決定された所与の断面におけるプラークタイプを専門の病理医が決定したものとして存在する場合がある。FFRのグラウンドトゥルースデータは、物理的な圧力線からのものであり、圧力線は1つ以上の測定値を有し、所定の測定値の近位の中心線に沿った位置が測定値以上になるように、遠位の位置は測定値以下になるように制限され、同じ中心線上の2つの測定値が既知である場合には、2つの測定値の間の値が間隔内で制限されるようなネットワーク訓練を有する。Illustrative implementation:
The systems and methods of the present disclosure may advantageously include a multi-stage pipeline. FIG. 34 provides a further exemplary implementation of the analytic hierarchy process framework. Biological properties, biological properties, in exemplary applications, lipid-rich necrotic cores, cap thickness, stenosis, dilation, remodeling ratios, serpentine (eg, entrance and exit angles), Calcification, IPH, and / or ulceration are identified and quantified by semantic segmentation to identify them alone or in combination. Biological properties are expressed numerically and in a reinforced dataset, which transforms a venous / arterial cross section into a rectangular shape, followed by a medical condition (eg, g, partial blood flow that causes ischemia). Transforming reserve ratio FFRs, high-risk phenotypic HRPs, and / or risk stratification times to events (TTEs) and reading augmented datasets using trained CNNs (s) With spatial unwrapping to identify and characterize the condition. Patient images are collected and raw slice data are used in a set of algorithms to measure biological properties that can be objectively verified. These are then formed as a reinforced dataset to supply one or more CNNs, in this example the results either implement constraints or are close to continuous conditions (eg, the entire vascular tree). Propagated anteriorly and posteriorly using retrograde CNNs to create a monotonically decreasing partial blood flow reserve ratio from position to distal, or constant HRP values in focal lesions, or other constraints) The HRP ground truth data may exist as the plaque type in a given cross section determined by Exvivo determined by a professional pathologist. The FFR ground truth data is from physical pressure lines. The pressure line has one or more measured values, and the distal position is less than or equal to the measured value so that the position along the proximal centerline of the predetermined measured value is greater than or equal to the measured value. With network training such that if two measurements on the same centerline are known, the value between the two measurements is limited within the interval.
これらの性状および/または状態は、所与の時点で評価されてもよく、および/または経時的(縦断的)に変化してもよい。一般性を失うことなく、プラーク表現決定または他の適用のいずれかで同様のステップを実施する他の実施形態は、本発明の実施形態となる。 These properties and / or conditions may be assessed at a given point in time and / or may change over time (longitudinal). Other embodiments that carry out similar steps in either plaque representation determination or other applications without loss of generality are embodiments of the invention.
例示的な実装では、生物学的性状には、以下の1つ以上を含むことができる。
●血管新生
●新生血管化
●炎症
●石灰化
●脂質沈着物
●壊死
●出血
●潰瘍
●剛性
●密度
●狭窄
●拡張
●再モデリング比
●蛇行
●流れ(例えば、チャネル内の血液の流れ)
●圧力(例えば、チャネル内の血液または1つの組織が別の組織を圧迫している)
●細胞タイプ(例えば、マクロファージなど)
●細胞整列(例えば、平滑筋細胞の)
●せん断応力(例えば、チャネル内の血液)In an exemplary implementation, biological properties can include one or more of the following:
● Neovascularization ● Neovascularization ● Inflammation ● Calcification ● Lipid deposits ● Necrosis ● Bleeding ● Ulcers ● Rigidity ● Density ● Stenosis ● Dilation ● Remodeling ratio ● Serpentine ● Flow (eg, blood flow in a channel)
● Pressure (for example, blood in a channel or one tissue is compressing another)
● Cell type (eg macrophages)
● Cell alignment (for example, of smooth muscle cells)
● Shear stress (eg blood in the channel)
分析は、前述の生物学的性状の各々に対して、量、程度、および/または特性のうちの1つ以上を決定することを含むことができる。 Analysis can include determining one or more of the quantity, degree, and / or properties for each of the aforementioned biological properties.
生物学的性状に基づいて決定できる条件は、以下の1つ以上を含むことができる。
●灌流/虚血(制限時)(例、脳または心臓組織)
●灌流/梗塞(切断時)(例、脳または心臓組織)
●酸素化
●代謝
●血流予備量比(灌流能力)、例えば、FFR(+)対FFR(−)および/または連続数
●悪性腫瘍
●侵入
●リスクの高いプラーク、例えば、HRP(+)対HRP(−)および/またはラベル付けされた表現型
●リスク層別化(事象の確率として、または事象までの時間として)(例えば、MACCE、明示的に言及されたもの)Conditions that can be determined based on biological properties can include one or more of the following:
● Perfusion / ischemia (when restricted) (eg, brain or heart tissue)
● Perfusion / infarction (at the time of amputation) (eg, brain or heart tissue)
● Oxygenation ● Metabolism ● Blood flow reserve ratio (perfusion capacity), eg FFR (+) vs. FFR (-) and / or number of consecutive ● Malignant tumors ● Invasion ● High-risk plaques, eg HRP (+) vs. HRP (-) and / or labeled phenotype ● Risk stratification (as probability of event or time to event) (eg MACCE, explicitly mentioned)
事実に基づく形式での検証には、次のものを含むことができる。
●生検
●専門家の組織注釈は、切除された組織を形成する(例えば、動脈内膜切除術または剖検)
●切除された組織の専門家の表現型注釈(例えば、動脈内膜切除術または剖検)
●物理圧力線
●その他のイメージングモダリティ
●生理学的モニタリング(例えば、ECG、SaO2など)
●ゲノムおよび/またはプロテオミクスおよび/またはメタボロミクスおよび/またはトランスクリプトームアッセイ
●臨床転帰Factual verification can include:
● Biopsy ● Expert tissue annotations form excised tissue (eg, endarterectomy or autopsy)
● Expert phenotypic annotation of the resected tissue (eg, endarterectomy or autopsy)
● Physical pressure lines ● Other imaging modality ● Physiological monitoring (eg ECG, SaO2, etc.)
● Genome and / or proteomics and / or metabolomics and / or transcriptome assays ● Clinical outcomes
分析は、所与の時点で行うこともでき、縦断的(つまり、時間の経過に伴う変化)で行うこともできる。 The analysis can be done at a given point in time or longitudinally (ie, changes over time).
例示的なシステムアーキテクチャ:
図31は、本開示のシステムおよび方法に従って、分析プラットフォームと対話するユーザおよび他のシステムの高レベルの図を示している。この図の利害関係者には、相互運用性、セキュリティ、フェイルオーバーおよびディザスタリカバリ、規制上の懸念があるシステム管理者、サポート技術者が含まれる。Illustrative system architecture:
FIG. 31 shows a high level diagram of users and other systems interacting with the analytics platform according to the systems and methods of the present disclosure. Stakeholders in this figure include interoperability, security, failover and disaster recovery, system administrators with regulatory concerns, and support technicians.
プラットフォームは、2つの主要な構成、つまり、オンプレミスまたはリモートサーバーで配備することができる(図32)。プラットフォームの配備は、スタンドアロン構成(左上)、オンプレミスサーバー構成(左下)、またはリモートサーバー構成(右)であってもよい。オンプレミス配備構成は、2つのサブ構成、つまり、デスクトップのみまたはラックマウントを含むことができる。リモート構成では、プラットフォームはHIPAA準拠のデータセンターに配備することができる。クライアントは、安全なHTTP接続を介してそのAPIサーバーにアクセスする。クライアントは、デスクトップブラウザまたはタブレットブラウザにすることができる。Webブラウザを実行しているコンピュータ以外のハードウェアは、消費者サイトに配備されていない。配備されたサーバーは、パブリッククラウド上、またはVPNを使用する消費者のプライベートネットワークの拡張上にあってもよい。 The platform can be deployed in two main configurations: on-premises or remote servers (Figure 32). The platform deployment may be a standalone configuration (upper left), an on-premises server configuration (lower left), or a remote server configuration (right). The on-premises deployment configuration can include two subconfigurations, namely desktop only or rack mount. In a remote configuration, the platform can be deployed in a HIPAA compliant data center. The client accesses its API server over a secure HTTP connection. The client can be a desktop browser or a tablet browser. Hardware other than the computer running the Web browser is not deployed on the consumer site. The deployed server may be on a public cloud or on an extension of a consumer's private network using a VPN.
例示的な実施形態は、クライアントおよびサーバーからなる。例えば、図33は、クライアントをC++アプリケーションとして、サーバーをPythonアプリケーションとして示している。これらのコンポーネントは、HTML 5.0、CSS 5.0、およびJava(登録商標)Scriptを使用して対話する。インターフェースには、HTTP(S)、REST、DICOM、SPARQL、およびJSONを含むがこれらに限定されないオープンスタンダードが可能な限り使用されている。テクノロジースタックの主要部分を示すこの図に示されているように、サードパーティライブラリも使用される。多くの変形例および異なるアプローチは、当業者によって理解され得る。 An exemplary embodiment comprises a client and a server. For example, FIG. 33 shows the client as a C ++ application and the server as a Python application. These components interact using HTML 5.0, CSS 5.0, and Java® Script. As much as possible, open standards are used for the interface, including but not limited to HTTP (S), REST, DICOM, SPARQL, and JSON. Third-party libraries are also used, as shown in this figure, which shows the main parts of the technology stack. Many variants and different approaches can be understood by those skilled in the art.
上記のシステムおよび方法の様々な実施形態は、デジタル電子回路、コンピュータハードウェア、ファームウェア、および/またはソフトウェアに実装されてもよい。実装は、コンピュータプログラム製品(すなわち、情報キャリアに具体的に具体化されたコンピュータプログラム)として行うことができる。実装は、例えば、データ処理装置による実行のために、またはデータ処理装置の動作を制御するために、機械可読記憶装置および/または伝搬信号内にあり得る。実装は、例えば、プログラム可能なプロセッサ、コンピュータ、および/または複数のコンピュータであり得る。 Various embodiments of the above systems and methods may be implemented in digital electronic circuits, computer hardware, firmware, and / or software. Implementation can be done as a computer program product (ie, a computer program specifically embodied in an information carrier). The implementation can be in a machine-readable storage device and / or a propagating signal, for example, for execution by a data processor or to control the operation of the data processor. Implementations can be, for example, programmable processors, computers, and / or multiple computers.
コンピュータプログラムは、コンパイルされた言語および/または解釈された言語を含む任意の形式のプログラミング言語で書くことができ、コンピュータプログラムは、スタンドアロンプログラムとして、またはコンピューティング環境で使用するのに好適なサブルーチン、要素、および/または他のユニットとしてを含む任意の形態で配備することができる。コンピュータプログラムは、1台のコンピュータまたは1つのサイトの複数のコンピュータで実行するように配備することができる。 Computer programs can be written in any form of programming language, including compiled and / or interpreted languages, and computer programs are suitable subroutines to be used as stand-alone programs or in a computing environment. It can be deployed in any form, including as an element and / or other unit. Computer programs can be deployed to run on a single computer or multiple computers at a site.
方法ステップは、コンピュータプログラムを実行する1つ以上のプログラム可能なプロセッサによって実施され、入力データを操作して出力を生成することによって本発明の機能を実施することができる。方法ステップはまた、特別目的の論理回路として実装された装置によって実施することもでき、装置は、特別目的の論理回路として実装することができる。回路は、例えば、FPGA(フィールドプログラマブルゲートアレイ)および/またはASIC(特定用途向け集積回路)であり得る。モジュール、サブルーチン、およびソフトウェアエージェントは、コンピュータプログラム、プロセッサ、特別な回路、ソフトウェア、および/またはその機能を実装するハードウェアの一部を参照することができる。 Method Steps are performed by one or more programmable processors that execute computer programs, and the functions of the invention can be performed by manipulating input data to produce output. Method Steps can also be performed by a device implemented as a special purpose logic circuit, which device can be implemented as a special purpose logic circuit. The circuit can be, for example, an FPGA (Field Programmable Gate Array) and / or an ASIC (Application Specific Integrated Circuit). Modules, subroutines, and software agents can reference computer programs, processors, special circuits, software, and / or some of the hardware that implements their functionality.
コンピュータプログラムの実行に好適なプロセッサには、例として、汎用および特殊目的の両方のマイクロプロセッサ、および任意の種類のデジタルコンピュータの任意の1つ以上のプロセッサが含まれる。一般に、プロセッサは、読み取り専用メモリまたはランダムアクセスメモリまたはその両方から命令およびデータを受信する。コンピュータの重要な要素は、命令を実行するためのプロセッサ、ならびに命令およびデータを記憶するための1つ以上のメモリデバイスである。一般に、コンピュータは、データを記憶するための1つ以上の大容量記憶装置(例えば、磁気、光磁気ディスク、または光ディスク)からデータを受信し、および/またはこれにデータを転送するように動作可能に結合することができる。 Suitable processors for running computer programs include, for example, both general purpose and special purpose microprocessors, and any one or more processors of any kind of digital computer. In general, the processor receives instructions and data from read-only memory and / or random access memory. An important element of a computer is a processor for executing instructions, as well as one or more memory devices for storing instructions and data. In general, a computer can operate to receive data from and / or transfer data to one or more mass storage devices (eg, magnetic, magneto-optical disks, or optical disks) for storing data. Can be combined with.
データの送信および命令は、通信ネットワークを介して行うこともできる。コンピュータプログラムの命令およびデータを具体化するのに好適な情報キャリアには、例として半導体メモリデバイスを含む、すべての形態の不揮発性メモリが含まれる。情報キャリアは、例えば、EPROM、EEPROM、フラッシュメモリデバイス、磁気ディスク、内蔵ハードディスク、リムーバブルディスク、磁気光学ディスク、CD−ROM、および/またはDVD−ROMディスクであり得る。プロセッサおよびメモリは、特別な目的の論理回路によって補完され、および/またはこれに組み込むことができる。 Data transmission and instruction can also be performed via a communication network. Suitable information carriers for embodying instructions and data in computer programs include all forms of non-volatile memory, including, for example, semiconductor memory devices. The information carrier can be, for example, an EPROM, EEPROM, a flash memory device, a magnetic disk, an internal hard disk, a removable disk, a magnetic optical disk, a CD-ROM, and / or a DVD-ROM disk. Processors and memory can be complemented and / or incorporated into logic circuits of special purpose.
ユーザとの対話を提供するために、上記の技術は、表示デバイスを有するコンピュータ上に実装され得る。表示デバイスは、例えば、ブラウン管(CRT)および/または液晶ディスプレイ(LCD)モニタであり得る。ユーザとの対話は、例えば、ユーザへの情報の表示と、キーボード、およびユーザがコンピュータに入力を提供することができる(例えば、ユーザインターフェイス要素と対話する)ポインティングデバイス(例えば、マウスまたはトラックボール)とであり得る。他の種類のデバイスを使用して、ユーザとの対話を提供してもよい。他のデバイスは、例えば、任意の形態の感覚フィードバック(例えば、視覚的フィードバック、聴覚的フィードバック、または触覚的フィードバック)でユーザに提供されるフィードバックであり得る。ユーザからの入力は、例えば、音響、音声、および/または触覚入力を含む任意の形式で受信することができる。 To provide user interaction, the above techniques can be implemented on a computer with a display device. The display device can be, for example, a cathode ray tube (CRT) and / or a liquid crystal display (LCD) monitor. User interaction is, for example, displaying information to the user and a keyboard, and a pointing device (eg, mouse or trackball) that allows the user to provide input to the computer (eg, interacting with user interface elements). And can be. Other types of devices may be used to provide user interaction. Other devices can be, for example, feedback provided to the user in any form of sensory feedback (eg, visual feedback, auditory feedback, or tactile feedback). Inputs from the user can be received in any format, including, for example, acoustic, audio, and / or tactile inputs.
上記の技術は、バックエンドコンポーネントを含む分散コンピューティングシステムに実装することができる。バックエンドコンポーネントは、例えば、データサーバー、ミドルウェアコンポーネント、および/またはアプリケーションサーバーであり得る。上記の技術は、フロントエンドコンポーネントを含む分散コンピューティングシステムに実装することができる。フロントエンドコンポーネントは、例えば、グラフィカルユーザインターフェースを有するクライアントコンピュータ、ユーザが例示的な実装と対話できるウェブブラウザ、および/または送信デバイスのための他のグラフィカルユーザインターフェースであり得る。システムのコンポーネントは、デジタルデータ通信の任意の形式または媒体(例えば、通信ネットワーク)によって相互接続することができる。通信ネットワークの例としては、ローカルエリアネットワーク(LAN)、ワイドエリアネットワーク(WAN)、インターネット、有線ネットワーク、および/またはワイヤレスネットワークが挙げられる。 The above techniques can be implemented in distributed computing systems that include back-end components. The backend component can be, for example, a data server, a middleware component, and / or an application server. The above techniques can be implemented in distributed computing systems that include front-end components. The front-end component can be, for example, a client computer with a graphical user interface, a web browser that allows the user to interact with an exemplary implementation, and / or other graphical user interface for the sending device. The components of the system can be interconnected by any form or medium of digital data communication (eg, a communication network). Examples of communication networks include local area networks (LANs), wide area networks (WANs), the Internet, wired networks, and / or wireless networks.
システムには、クライアントおよびサーバーを含めることができる。クライアントおよびサーバーは一般に、互いに離れており、典型的に、通信ネットワークを介して対話する。クライアントとサーバーとの関係は、それぞれのコンピュータで実行され、クライアントとサーバーとの関係を有するコンピュータプログラムによって発生する。 The system can include clients and servers. Clients and servers are generally separated from each other and typically interact over a communication network. The client-server relationship runs on each computer and is generated by a computer program that has a client-server relationship.
パケットに基づくネットワークとしては、例えば、インターネット、キャリアインターネットプロトコル(IP)ネットワーク(例えば、ローカルエリアネットワーク(LAN)、ワイドエリアネットワーク(WAN)、キャンパスエリアネットワーク(CAN)、メトロポリタンエリアネットワーク(MAN)、ホームエリアネットワーク(HAN))、プライベートIPネットワーク、IPプライベート分岐エクスチェンジ(IPBX)、ワイヤレスネットワーク(例えば、無線アクセスネットワーク(RAN)、802.11ネットワーク、802.16ネットワーク、一般パケット無線サービス(GPRS)ネットワーク、HiperLAN)、および/または他のパケットに基づくネットワークが挙げられる。回線に基づくネットワークとしては、例えば、公衆交換電話網(PSTN)、構内交換機(PBX)、無線ネットワーク(RAN、Bluetooth(登録商標)、符号分割多元接続(CDMA)ネットワーク、時分割多元接続(TDMA)ネットワーク、モバイル通信用グローバルシステム(GSM(登録商標))ネットワーク)、および/またはその他の回線に基づくネットワークが挙げられる。 Packet-based networks include, for example, the Internet, carrier Internet protocol (IP) networks (eg, local area networks (LAN), wide area networks (WAN), campus area networks (CAN), metropolitan area networks (MAN), homes. Area network (HAN)), private IP network, IP private branch exchange (IPBX), wireless network (eg, wireless access network (RAN), 802.11 network, 802.16 network, general packet radio service (GPRS) network, HyperLAN), and / or networks based on other packets. The network based on the line includes, for example, a public switched telephone network (PSTN), a private switch (PBX), a wireless network (RAN, Bluetooth (registered trademark), a code division multiple access (CDMA) network, and a time division multiple access (TDMA). Included are networks, global systems for mobile communications (GSM® networks), and / or networks based on other lines.
コンピューティングデバイスとしては、例えば、コンピュータ、ブラウザデバイスを備えたコンピュータ、電話、IP電話、モバイルデバイス(例えば、携帯電話、パーソナルデジタルアシスタント(PDA)デバイス、ラップトップコンピュータ、電子メールデバイス)、および/または他の通信デバイスが挙げられる。ブラウザデバイスとしては、例えば、ワールドワイドウェブブラウザ(例えば、Microsoft Corporationから入手可能なMicrosoft(登録商標)Internet Explorer(登録商標)、Mozilla Corporationから入手可能なMozilla(登録商標)Firefox)を備えたコンピュータ(例えば、デスクトップコンピュータ、ラップトップコンピュータ)が挙げられる。モバイルコンピューティングデバイスとしては、例えば、Blackberry(登録商標)、iPAD(登録商標)、iPhone(登録商標)、または他のスマートフォンデバイスが挙げられる。 Computing devices include, for example, computers, computers with browser devices, telephones, IP phones, mobile devices (eg mobile phones, personal digital assistant (PDA) devices, laptop computers, email devices), and / or Other communication devices can be mentioned. As a browser device, for example, a computer equipped with a worldwide web browser (for example, Microsoft® Internet Explorer® available from Microsoft Corporation, Mozilla® Filefox available from Mozilla Corporation) (for example, For example, desktop computers, laptop computers). Mobile computing devices include, for example, BlackBerry®, iPad®, iPhone®, or other smartphone devices.
前述の説明を読んだ後、本開示の多くの変更および修正が当業者に明らかになることは間違いないが、例示として示され説明された特定の実施形態は、限定的であると考えられることを意図したものではないことが理解されるべきである。さらに、主題は特定の実施形態を参照して説明されてきたが、本開示の精神および範囲内の変動は、当業者には発生するであろう。前述の例は、単に説明の目的で提供されたものであり、本開示を限定するものとして解釈されるものではないことに留意されたい。 While there is no doubt that many changes and amendments to this disclosure will be apparent to those skilled in the art after reading the above description, the particular embodiments illustrated and described as exemplary are considered to be limited. It should be understood that it was not intended. Moreover, although the subject matter has been described with reference to specific embodiments, variations within the spirit and scope of the present disclosure will occur to those skilled in the art. It should be noted that the above examples are provided solely for illustration purposes and are not to be construed as limiting this disclosure.
本開示は、特定の実施形態を参照して本明細書に記載されているが、本開示は、本明細書に開示されている詳細に限定されることを意図するものではない。むしろ、本開示は、添付の特許請求の範囲内のものを含む当業者に明らかであるであろうそのすべての変形および一般化に及ぶ。
Although this disclosure is described herein with reference to specific embodiments, this disclosure is not intended to be limited to the details disclosed herein. Rather, the present disclosure extends to all modifications and generalizations thereof that will be apparent to those skilled in the art, including those within the appended claims.
Claims (15)
Translated fromJapanese患者の放射線データセットを受け取ることと、
病変に関連する分析物のセットに対する客観的検証により、解剖学的構造、形状、もしくは外形および/または組織の特性、タイプ、もしくは特徴の分析物測定および/または分類を実施することによって、前記データセットを補強することと、
既知のグラウンドトゥルースに基づく機械学習分類アプローチを使用して、前記補強されたデータセットを処理し、(i)前記病変の表現型、または(ii)前記病変に関連する予測転帰の一方または両方を決定することと、を含み、
前記データセットを補強することが、生物学的に有意な空間的コンテキストを強調するための前記データセットの空間変換をさらに含み、
前記変換が、病変に適した変換されたデータセットを生成するために、前記放射線データセット内の病変固有の構造の断面に対して空間的に変換することを含み、
前記機械学習分類アプローチが、前記病変に適した変換されたデータセットに適用される、訓練されたの畳み込みニューラルネットワーク(CNN)の使用である、方法。A method for computer-aided phenotyping or outcome prediction of lesions using a reinforced radiation dataset, said method.
Receiving the patient's radiation dataset and
The data by performing analytical material measurements and / or classification of anatomical structure, shape, or external and / or tissue characteristics, types, or characteristics by objective validation of a set of lesion-related analysts. To reinforce the set and
Using a known ground-truth-based machine learning classification approach, the augmented dataset is processed to (i) the phenotype of the lesion, or (ii) one or both of the predicted outcomes associated with the lesion. Including making decisions
Reinforcing the dataset further includes spatial transformation of the dataset to emphasize a biologically significant spatial context.
The transformation involves spatially transforming the cross section of the lesion-specific structure within the radiation dataset to generate a transformed dataset suitable for the lesion.
A method, wherein the machine learning classification approach is the use of a trained convolutional neural network (CNN) applied to a transformed dataset suitable for the lesion.
The method of claim 1, wherein the machine learning classification approach comprises constructing one or more machine learning learning models for computer-assisted phenotyping or outcome prediction of lesions.
Priority Applications (1)
| Application Number | Priority Date | Filing Date | Title |
|---|---|---|---|
| JP2022100036AJP7542578B2 (en) | 2018-05-27 | 2022-06-22 | Methods and systems for utilizing quantitative imaging - Patents.com |
Applications Claiming Priority (5)
| Application Number | Priority Date | Filing Date | Title |
|---|---|---|---|
| US201862676975P | 2018-05-27 | 2018-05-27 | |
| US62/676,975 | 2018-05-27 | ||
| US201862771448P | 2018-11-26 | 2018-11-26 | |
| US62/771,448 | 2018-11-26 | ||
| PCT/US2019/033930WO2019231844A1 (en) | 2018-05-27 | 2019-05-24 | Methods and systems for utilizing quantitative imaging |
Related Child Applications (1)
| Application Number | Title | Priority Date | Filing Date |
|---|---|---|---|
| JP2022100036ADivisionJP7542578B2 (en) | 2018-05-27 | 2022-06-22 | Methods and systems for utilizing quantitative imaging - Patents.com |
Publications (2)
| Publication Number | Publication Date |
|---|---|
| JP2021525929Atrue JP2021525929A (en) | 2021-09-27 |
| JP7113916B2 JP7113916B2 (en) | 2022-08-05 |
Family
ID=68697312
Family Applications (2)
| Application Number | Title | Priority Date | Filing Date |
|---|---|---|---|
| JP2020567160AActiveJP7113916B2 (en) | 2018-05-27 | 2019-05-24 | Methods and systems for utilizing quantitative imaging |
| JP2022100036AActiveJP7542578B2 (en) | 2018-05-27 | 2022-06-22 | Methods and systems for utilizing quantitative imaging - Patents.com |
Family Applications After (1)
| Application Number | Title | Priority Date | Filing Date |
|---|---|---|---|
| JP2022100036AActiveJP7542578B2 (en) | 2018-05-27 | 2022-06-22 | Methods and systems for utilizing quantitative imaging - Patents.com |
Country Status (5)
| Country | Link |
|---|---|
| EP (1) | EP3803687A4 (en) |
| JP (2) | JP7113916B2 (en) |
| KR (1) | KR102491988B1 (en) |
| CN (2) | CN119851269A (en) |
| WO (1) | WO2019231844A1 (en) |
Cited By (7)
| Publication number | Priority date | Publication date | Assignee | Title |
|---|---|---|---|---|
| US12144669B2 (en) | 2022-03-10 | 2024-11-19 | Cleerly, Inc. | Systems, devices, and methods for non-invasive image-based plaque analysis and risk determination |
| US12156759B2 (en) | 2020-01-07 | 2024-12-03 | Cleerly, Inc. | Systems, methods, and devices for medical image analysis, diagnosis, risk stratification, decision making and/or disease tracking |
| US12245882B2 (en) | 2020-01-07 | 2025-03-11 | Cleerly, Inc. | Systems, methods, and devices for medical image analysis, diagnosis, risk stratification, decision making and/or disease tracking |
| US12283046B2 (en) | 2020-01-07 | 2025-04-22 | Cleerly, Inc. | Systems, methods, and devices for medical image analysis, diagnosis, risk stratification, decision making and/or disease tracking |
| US12299885B2 (en) | 2022-03-10 | 2025-05-13 | Cleerly, Inc. | Systems, devices, and methods for non-invasive image-based plaque analysis and risk determination |
| US12380560B2 (en) | 2022-03-10 | 2025-08-05 | Cleerly, Inc. | Systems, methods, and devices for image-based plaque analysis and risk determination |
| US12440180B2 (en) | 2024-02-29 | 2025-10-14 | Cleerly, Inc. | Systems, devices, and methods for non-invasive image-based plaque analysis and risk determination |
Families Citing this family (30)
| Publication number | Priority date | Publication date | Assignee | Title |
|---|---|---|---|---|
| CN111504675B (en)* | 2020-04-14 | 2021-04-09 | 河海大学 | An online diagnosis method for mechanical faults of gas-insulated combined electrical appliances |
| KR20230066277A (en)* | 2020-06-19 | 2023-05-15 | 클리어리, 인크. | Systems, methods and devices for medical image analysis, diagnosis, risk stratification, decision making and/or disease tracking |
| CN111784704B (en)* | 2020-06-24 | 2023-11-24 | 中国人民解放军空军军医大学 | Automatic quantitative grading sequential method for MRI hip joint inflammation segmentation and classification |
| US20220036560A1 (en)* | 2020-07-30 | 2022-02-03 | Biosense Webster (Israel) Ltd. | Automatic segmentation of anatomical structures of wide area circumferential ablation points |
| CN112669439B (en)* | 2020-11-23 | 2024-03-19 | 西安电子科技大学 | Method for establishing intracranial angiography enhanced three-dimensional model based on transfer learning |
| JP2023551869A (en)* | 2020-12-04 | 2023-12-13 | コーニンクレッカ フィリップス エヌ ヴェ | Pressure and X-ray image prediction of balloon inflation events |
| CN112527374B (en) | 2020-12-11 | 2024-08-27 | 北京百度网讯科技有限公司 | Annotation tool generation method, annotation method, device, equipment and storage medium |
| EP4293685A4 (en)* | 2021-03-16 | 2025-01-08 | Deep Bio Inc. | Prognosis prediction method using result of disease diagnosis through neural network and system therefor |
| CN113499098A (en)* | 2021-07-14 | 2021-10-15 | 上海市奉贤区中心医院 | Carotid plaque detector based on artificial intelligence and evaluation method |
| CN115797666A (en)* | 2021-09-09 | 2023-03-14 | 安霸国际有限合伙企业 | For accelerating speckle image block matching using convolution techniques |
| US20230115927A1 (en)* | 2021-10-13 | 2023-04-13 | Shanghai United Imaging Healthcare Co., Ltd. | Systems and methods for plaque identification, plaque composition analysis, and plaque stability detection |
| CN113935258B (en)* | 2021-10-15 | 2022-05-20 | 北京百度网讯科技有限公司 | Computational fluid dynamics acceleration method, device, equipment and storage medium |
| CN114170143A (en)* | 2021-11-11 | 2022-03-11 | 复旦大学 | Method for aneurysm detection and rupture risk prediction in digital subtraction angiography |
| KR102602559B1 (en)* | 2021-11-30 | 2023-11-16 | (주)자비스 | Method, apparatus and system for non-constructive inspection of object based on selective artificial intelligence engine |
| KR102597081B1 (en)* | 2021-11-30 | 2023-11-02 | (주)자비스 | Method, apparatus and system for ensemble non-constructing inspection of object based on artificial intelligence |
| US12405772B2 (en)* | 2021-12-22 | 2025-09-02 | Mendix Technology B.V. | Managing an app, for example developing an app comprising updating a workflow of the app, method, and system |
| KR102567138B1 (en)* | 2021-12-30 | 2023-08-17 | 가천대학교 산학협력단 | Method and system for diagnosing hair health based on machine learning |
| CN114533201B (en)* | 2022-01-05 | 2024-06-18 | 华中科技大学同济医学院附属协和医院 | An extracorporeal wave clot-breaking auxiliary device |
| CN114548179A (en)* | 2022-02-24 | 2022-05-27 | 北京航空航天大学 | Biological tissue identification method and device based on ultrasonic echo time-frequency spectrum features |
| CN114820496A (en)* | 2022-04-20 | 2022-07-29 | 中科微影(浙江)医疗科技有限公司 | A method and system for detecting and recognizing human motion during magnetic resonance imaging examination |
| CN115115654B (en)* | 2022-06-14 | 2023-09-08 | 北京空间飞行器总体设计部 | An object image segmentation method based on saliency and neighbor shape query |
| CN115099682B (en)* | 2022-07-18 | 2024-09-06 | 同济大学 | A method for classifying the softness and hardness of shield tunnel faces and grading excavation risks |
| CN115294191B (en)* | 2022-10-08 | 2022-12-27 | 武汉楚精灵医疗科技有限公司 | Marker size measuring method, device, equipment and medium based on electronic endoscope |
| CN115546612A (en)* | 2022-11-30 | 2022-12-30 | 中国科学技术大学 | Image interpretation method and device combining graph data and graph neural network |
| CN116110589B (en)* | 2022-12-09 | 2023-11-03 | 东北林业大学 | A predictive method for diabetic retinopathy based on retrospective correction |
| CN115797333B (en)* | 2023-01-29 | 2023-05-09 | 成都中医药大学 | A personalized and customized intelligent vision training method |
| CN116452645B (en)* | 2023-04-23 | 2025-08-08 | 安徽大学 | Cross-modal medical image registration method based on symbol distance function collaborative segmentation |
| CN117132577B (en)* | 2023-09-07 | 2024-02-23 | 湖北大学 | Method for non-invasively detecting myocardial tissue tension and vibration |
| EP4566541A1 (en)* | 2023-12-07 | 2025-06-11 | Koninklijke Philips N.V. | Predicting vessel characteristics |
| KR20250119467A (en)* | 2024-01-30 | 2025-08-07 | 서울대학교병원 | Apparatus and method for analyzing medical image |
Citations (5)
| Publication number | Priority date | Publication date | Assignee | Title |
|---|---|---|---|---|
| US20050118632A1 (en)* | 2003-11-06 | 2005-06-02 | Jian Chen | Polynucleotides and polypeptides encoding a novel metalloprotease, Protease-40b |
| JP2006181025A (en)* | 2004-12-27 | 2006-07-13 | Fuji Photo Film Co Ltd | Abnormal shadow detecting method, device and program |
| WO2017150497A1 (en)* | 2016-03-02 | 2017-09-08 | 地方独立行政法人神奈川県立病院機構 | Diagnosis support system for lesion in lung field, and method and program for controlling same |
| JP2018011958A (en)* | 2016-07-21 | 2018-01-25 | 東芝メディカルシステムズ株式会社 | Medical image processing apparatus and medical image processing program |
| JP2018504969A (en)* | 2015-01-28 | 2018-02-22 | エレクタ、インク.Elekta, Inc. | 3D localization and tracking for adaptive radiation therapy |
Family Cites Families (11)
| Publication number | Priority date | Publication date | Assignee | Title |
|---|---|---|---|---|
| US7467119B2 (en)* | 2003-07-21 | 2008-12-16 | Aureon Laboratories, Inc. | Systems and methods for treating, diagnosing and predicting the occurrence of a medical condition |
| US8090164B2 (en)* | 2003-08-25 | 2012-01-03 | The University Of North Carolina At Chapel Hill | Systems, methods, and computer program products for analysis of vessel attributes for diagnosis, disease staging, and surgical planning |
| CN1952981A (en)* | 2005-07-13 | 2007-04-25 | 西门子共同研究公司 | Method for knowledge based image segmentation using shape models |
| US8734823B2 (en)* | 2005-12-14 | 2014-05-27 | The Invention Science Fund I, Llc | Device including altered microorganisms, and methods and systems of use |
| WO2007087113A2 (en)* | 2005-12-28 | 2007-08-02 | The Scripps Research Institute | Natural antisense and non-coding rna transcripts as drug targets |
| PT2145276T (en)* | 2007-04-05 | 2020-07-30 | Fund D Anna Sommer Champalimaud E Dr Carlos Montez Champalimaud | Systems and methods for treating, diagnosing and predicting the occurrence of a medical condition |
| US8774479B2 (en)* | 2008-02-19 | 2014-07-08 | The Trustees Of The University Of Pennsylvania | System and method for automated segmentation, characterization, and classification of possibly malignant lesions and stratification of malignant tumors |
| US10176408B2 (en)* | 2015-08-14 | 2019-01-08 | Elucid Bioimaging Inc. | Systems and methods for analyzing pathologies utilizing quantitative imaging |
| DE102016010909A1 (en)* | 2015-11-11 | 2017-05-11 | Adobe Systems Incorporated | Structured modeling, extraction and localization of knowledge from images |
| KR101980955B1 (en)* | 2016-08-22 | 2019-05-21 | 한국과학기술원 | Method and system for analyzing feature representation of lesions with depth directional long-term recurrent learning in 3d medical images |
| CN107730489A (en)* | 2017-10-09 | 2018-02-23 | 杭州电子科技大学 | Wireless capsule endoscope small intestine disease variant computer assisted detection system and detection method |
- 2019
- 2019-05-24CNCN202411927615.9Apatent/CN119851269A/enactivePending
- 2019-05-24KRKR1020207037314Apatent/KR102491988B1/enactiveActive
- 2019-05-24CNCN201980049912.9Apatent/CN112567378B/enactiveActive
- 2019-05-24WOPCT/US2019/033930patent/WO2019231844A1/ennot_activeCeased
- 2019-05-24EPEP19811880.4Apatent/EP3803687A4/enactivePending
- 2019-05-24JPJP2020567160Apatent/JP7113916B2/enactiveActive
- 2022
- 2022-06-22JPJP2022100036Apatent/JP7542578B2/enactiveActive
Patent Citations (5)
| Publication number | Priority date | Publication date | Assignee | Title |
|---|---|---|---|---|
| US20050118632A1 (en)* | 2003-11-06 | 2005-06-02 | Jian Chen | Polynucleotides and polypeptides encoding a novel metalloprotease, Protease-40b |
| JP2006181025A (en)* | 2004-12-27 | 2006-07-13 | Fuji Photo Film Co Ltd | Abnormal shadow detecting method, device and program |
| JP2018504969A (en)* | 2015-01-28 | 2018-02-22 | エレクタ、インク.Elekta, Inc. | 3D localization and tracking for adaptive radiation therapy |
| WO2017150497A1 (en)* | 2016-03-02 | 2017-09-08 | 地方独立行政法人神奈川県立病院機構 | Diagnosis support system for lesion in lung field, and method and program for controlling same |
| JP2018011958A (en)* | 2016-07-21 | 2018-01-25 | 東芝メディカルシステムズ株式会社 | Medical image processing apparatus and medical image processing program |
Cited By (13)
| Publication number | Priority date | Publication date | Assignee | Title |
|---|---|---|---|---|
| US12324695B2 (en) | 2020-01-07 | 2025-06-10 | Cleerly, Inc. | Systems, methods, and devices for medical image analysis, diagnosis, risk stratification, decision making and/or disease tracking |
| US12156759B2 (en) | 2020-01-07 | 2024-12-03 | Cleerly, Inc. | Systems, methods, and devices for medical image analysis, diagnosis, risk stratification, decision making and/or disease tracking |
| US12171606B2 (en) | 2020-01-07 | 2024-12-24 | Cleerly, Inc. | Systems, methods, and devices for medical image analysis, diagnosis, risk stratification, decision making and/or disease tracking |
| US12178627B2 (en) | 2020-01-07 | 2024-12-31 | Cleerly, Inc. | Systems, methods, and devices for medical image analysis, diagnosis, risk stratification, decision making and/or disease tracking |
| US12245882B2 (en) | 2020-01-07 | 2025-03-11 | Cleerly, Inc. | Systems, methods, and devices for medical image analysis, diagnosis, risk stratification, decision making and/or disease tracking |
| US12283046B2 (en) | 2020-01-07 | 2025-04-22 | Cleerly, Inc. | Systems, methods, and devices for medical image analysis, diagnosis, risk stratification, decision making and/or disease tracking |
| US12396695B2 (en) | 2020-01-07 | 2025-08-26 | Cleerly, Inc. | Systems, methods, and devices for medical image analysis, diagnosis, risk stratification, decision making and/or disease tracking |
| US12299885B2 (en) | 2022-03-10 | 2025-05-13 | Cleerly, Inc. | Systems, devices, and methods for non-invasive image-based plaque analysis and risk determination |
| US12324696B2 (en) | 2022-03-10 | 2025-06-10 | Cleerly, Inc. | Systems, devices, and methods for non-invasive image-based plaque analysis and risk determination |
| US12380560B2 (en) | 2022-03-10 | 2025-08-05 | Cleerly, Inc. | Systems, methods, and devices for image-based plaque analysis and risk determination |
| US12144669B2 (en) | 2022-03-10 | 2024-11-19 | Cleerly, Inc. | Systems, devices, and methods for non-invasive image-based plaque analysis and risk determination |
| US12406365B2 (en) | 2022-03-10 | 2025-09-02 | Cleerly, Inc. | Systems, devices, and methods for non-invasive image-based plaque analysis and risk determination |
| US12440180B2 (en) | 2024-02-29 | 2025-10-14 | Cleerly, Inc. | Systems, devices, and methods for non-invasive image-based plaque analysis and risk determination |
Also Published As
| Publication number | Publication date |
|---|---|
| EP3803687A1 (en) | 2021-04-14 |
| EP3803687A4 (en) | 2022-03-23 |
| CN112567378A (en) | 2021-03-26 |
| CN119851269A (en) | 2025-04-18 |
| KR20210042267A (en) | 2021-04-19 |
| CN112567378B (en) | 2024-12-13 |
| KR102491988B1 (en) | 2023-01-27 |
| JP7113916B2 (en) | 2022-08-05 |
| WO2019231844A1 (en) | 2019-12-05 |
| JP7542578B2 (en) | 2024-08-30 |
| JP2022123103A (en) | 2022-08-23 |
Similar Documents
| Publication | Publication Date | Title |
|---|---|---|
| JP7542578B2 (en) | Methods and systems for utilizing quantitative imaging - Patents.com | |
| US12045983B2 (en) | Functional measures of stenosis significance | |
| US11607179B2 (en) | Non-invasive risk stratification for atherosclerosis | |
| US12008751B2 (en) | Quantitative imaging for detecting histopathologically defined plaque fissure non-invasively | |
| US20210312622A1 (en) | Quantitative imaging for instantaneous wave-free ratio (ifr) | |
| US11120312B2 (en) | Quantitative imaging for cancer subtype | |
| US11113812B2 (en) | Quantitative imaging for detecting vulnerable plaque | |
| US11676359B2 (en) | Non-invasive quantitative imaging biomarkers of atherosclerotic plaque biology | |
| US12026868B2 (en) | Quantitative imaging for detecting histopathologically defined plaque erosion non-invasively |
Legal Events
| Date | Code | Title | Description |
|---|---|---|---|
| A621 | Written request for application examination | Free format text:JAPANESE INTERMEDIATE CODE: A621 Effective date:20210126 | |
| A131 | Notification of reasons for refusal | Free format text:JAPANESE INTERMEDIATE CODE: A131 Effective date:20220405 | |
| A521 | Request for written amendment filed | Free format text:JAPANESE INTERMEDIATE CODE: A523 Effective date:20220622 | |
| TRDD | Decision of grant or rejection written | ||
| A01 | Written decision to grant a patent or to grant a registration (utility model) | Free format text:JAPANESE INTERMEDIATE CODE: A01 Effective date:20220705 | |
| A61 | First payment of annual fees (during grant procedure) | Free format text:JAPANESE INTERMEDIATE CODE: A61 Effective date:20220726 | |
| R150 | Certificate of patent or registration of utility model | Ref document number:7113916 Country of ref document:JP Free format text:JAPANESE INTERMEDIATE CODE: R150 | |
| R250 | Receipt of annual fees | Free format text:JAPANESE INTERMEDIATE CODE: R250 |