Movatterモバイル変換


[0]ホーム

URL:


JP2019144966A - Display method, program, and display system - Google Patents

Display method, program, and display system
Download PDF

Info

Publication number
JP2019144966A
JP2019144966AJP2018030126AJP2018030126AJP2019144966AJP 2019144966 AJP2019144966 AJP 2019144966AJP 2018030126 AJP2018030126 AJP 2018030126AJP 2018030126 AJP2018030126 AJP 2018030126AJP 2019144966 AJP2019144966 AJP 2019144966A
Authority
JP
Japan
Prior art keywords
display
power
information
displayed
facility
Prior art date
Legal status (The legal status is an assumption and is not a legal conclusion. Google has not performed a legal analysis and makes no representation as to the accuracy of the status listed.)
Pending
Application number
JP2018030126A
Other languages
Japanese (ja)
Inventor
好章 松本
Yoshiaki Matsumoto
好章 松本
浩基 數野
Hiroki Kazuno
浩基 數野
馬場 朗
Akira Baba
朗 馬場
Current Assignee (The listed assignees may be inaccurate. Google has not performed a legal analysis and makes no representation or warranty as to the accuracy of the list.)
Panasonic Intellectual Property Management Co Ltd
Original Assignee
Panasonic Intellectual Property Management Co Ltd
Priority date (The priority date is an assumption and is not a legal conclusion. Google has not performed a legal analysis and makes no representation as to the accuracy of the date listed.)
Filing date
Publication date
Application filed by Panasonic Intellectual Property Management Co LtdfiledCriticalPanasonic Intellectual Property Management Co Ltd
Priority to JP2018030126ApriorityCriticalpatent/JP2019144966A/en
Publication of JP2019144966ApublicationCriticalpatent/JP2019144966A/en
Pendinglegal-statusCriticalCurrent

Links

Images

Landscapes

Abstract

Translated fromJapanese

【課題】施設の設備が非稼働状態とみなされる期間における電力使用についての評価及び当該期間において節約可能な電力に関する情報を知ることができる表示方法、プログラム及び表示システムを提供する。【解決手段】表示方法は、情報端末30が有する表示部31に情報を表示する方法である。表示方法は、抽出ステップと、表示ステップとを含む。抽出ステップは、施設における複数の設備の各々について、当該設備で計測された当該設備の電力に関連する電力情報のうち、少なくとも当該設備が非稼働状態とみなされる期間の電力情報を非稼働情報として抽出する。表示ステップは、複数の設備の各々について、非稼働情報に基づいた期間における電力使用の評価結果及び非稼働情報で表される電力のうち節約可能な改善電力に関連する改善情報を、表示部31に表示させる。【選択図】図1[Problem] To provide a display method, program, and display system that enable an evaluation of power usage during periods when facility equipment is considered to be in a non-operating state and information regarding power that can be saved during said periods. [Solution] The display method is a method of displaying information on a display unit 31 of an information terminal 30. The display method includes an extraction step and a display step. The extraction step extracts, for each of a plurality of facilities in the facility, power information related to the power of the facility measured at least for a period when the facility is considered to be in a non-operating state as non-operating information. The display step causes the display unit 31 to display, for each of the plurality of facilities, an evaluation result of power usage during a period based on the non-operating information and improvement information related to improved power that can be saved out of the power represented by the non-operating information. [Selected Figure] Figure 1

Description

Translated fromJapanese

本開示は、一般に表示方法、プログラム及び表示システムに関し、より詳細には、施設で消費された電力量に関する情報を表示する表示方法、プログラム及び表示システムに関する。  The present disclosure relates generally to a display method, a program, and a display system, and more particularly to a display method, a program, and a display system that display information related to the amount of power consumed in a facility.

従来、電力エネルギーを的確に監視する技術が知られている(例えば、特許文献1参照)。特許文献1の電力エネルギー監視システムは、日単位や月単位などの長時間、長期間に亘る電力エネルギー使用量の予測値および目標値を、工場、管理センタなどの事業所別に高い精度で求めて、電力エネルギーを的確に監視している。  Conventionally, a technique for accurately monitoring electric power energy has been known (see, for example, Patent Document 1). The power energy monitoring system ofPatent Document 1 obtains a predicted value and a target value of power energy usage over a long period of time, such as daily or monthly, with high accuracy for each office such as a factory or a management center. The power energy is accurately monitored.

特開2010−211780号公報JP 2010-2111780 A

しかしながら、特許文献1では、事業所(施設)の設備が非稼働状態とみなされる期間における電力使用についての評価、及び当該期間において節約可能な電力について利用者は知ることができない。  However, inPatent Document 1, the user cannot know the evaluation of the power usage during the period when the equipment of the establishment (facility) is considered to be in the non-operating state and the power that can be saved during the period.

そこで、本開示は上記事由に鑑みてなされており、施設の設備が非稼働状態とみなされる期間における電力使用についての評価及び当該期間において節約可能な電力に関する情報を知ることができる表示方法、プログラム及び表示システムを提供することを目的とする。  Accordingly, the present disclosure has been made in view of the above-described reasons, and a display method and a program that can be used to evaluate power usage during a period in which facilities of a facility are considered to be in a non-operating state, and to know information about power that can be saved during the period. And it aims at providing a display system.

本開示の一態様に係る表示方法は、情報端末が有する表示部に情報を表示する方法である。前記表示方法は、抽出ステップと、表示ステップとを含む。前記抽出ステップは、施設における複数の設備の各々について、当該設備で計測された当該設備の電力に関連する電力情報のうち、少なくとも当該設備が非稼働状態とみなされる期間の電力情報を非稼働情報として抽出する。前記表示ステップは、前記複数の設備の各々について、前記非稼働情報に基づいた前記期間における電力使用の評価結果及び前記非稼働情報で表される電力のうち節約可能な改善電力に関連する改善情報を、前記表示部に表示させる。  A display method according to an aspect of the present disclosure is a method of displaying information on a display unit included in an information terminal. The display method includes an extraction step and a display step. The extraction step includes, for each of a plurality of facilities in the facility, out of power information related to the power of the facility measured by the facility, at least power information for a period in which the facility is regarded as a non-operating state. Extract as The display step includes, for each of the plurality of facilities, an evaluation result of power use in the period based on the non-operation information and improvement information related to the improved power that can be saved out of the electric power represented by the non-operation information. Is displayed on the display unit.

本開示の一態様に係るプログラムは、コンピュータに、前記表示方法を、実行させるためのプログラムである。  A program according to an aspect of the present disclosure is a program for causing a computer to execute the display method.

本開示の一態様に係る表示システムは、情報端末が有する表示部に情報を表示するシステムである。前記表示システムは、抽出部と、表示制御部とを備える。前記抽出部は、施設における複数の設備の各々について、当該設備で計測された当該設備の電力に関連する電力情報のうち、少なくとも当該設備が非稼働状態とみなされる期間の電力情報を非稼働情報として抽出する。前記表示制御部は、前記複数の設備の各々について、前記非稼働情報に基づいた前記期間における電力使用の評価結果及び前記非稼働情報で表される電力のうち節約可能な改善電力に関連する改善情報を、前記表示部に表示させる。  The display system which concerns on 1 aspect of this indication is a system which displays information on the display part which an information terminal has. The display system includes an extraction unit and a display control unit. The extraction unit, for each of a plurality of equipment in the facility, out of power information related to the power of the equipment measured by the equipment, at least power information of a period in which the equipment is considered to be non-operating state Extract as The display control unit, for each of the plurality of facilities, an improvement result related to power saving that can be saved out of an evaluation result of power use in the period based on the non-operation information and the electric power represented by the non-operation information. Information is displayed on the display unit.

本開示によると、施設の設備が非稼働状態とみなされる期間における電力使用についての評価及び当該期間において節約可能な電力に関する情報を知ることができる。  According to the present disclosure, it is possible to know information on power use in a period in which facilities of a facility are considered to be non-operating and information on power that can be saved in the period.

図1は、本開示の一実施形態に係る表示システムの構成を示すブロック図である。FIG. 1 is a block diagram illustrating a configuration of a display system according to an embodiment of the present disclosure.図2は、同上の表示システムを含むシステムの構成図である。FIG. 2 is a configuration diagram of a system including the above display system.図3は、同上の表示システムが表示する第1画面の一例を示す図である。FIG. 3 is a diagram showing an example of a first screen displayed by the above-described display system.図4は、同上の表示システムが表示する第2画面の一例を示す図である。FIG. 4 is a diagram showing an example of a second screen displayed by the above display system.図5は、同上の表示システムが表示する第3画面の一例を示す図である。FIG. 5 is a diagram showing an example of a third screen displayed by the above display system.図6は、同上の表示システムが表示する第4画面の一例を示す図である。FIG. 6 is a diagram showing an example of a fourth screen displayed by the above display system.図7は、同上の表示システムが表示する第5画面の一例を示す図である。FIG. 7 is a diagram showing an example of a fifth screen displayed by the above display system.図8は、同上の表示システムが表示する第6画面の一例を示す図である。FIG. 8 is a diagram showing an example of a sixth screen displayed by the above display system.

以下に説明する実施形態及び変形例は、本開示の一例に過ぎず、本開示は、実施形態及び変形例に限定されることなく、この実施形態及び変形例以外であっても、本開示に係る技術的思想を逸脱しない範囲であれば、設計等に応じて種々の変更が可能である。  Embodiments and modifications described below are merely examples of the present disclosure, and the present disclosure is not limited to the embodiments and modifications, and the present disclosure may include other embodiments and modifications. Various modifications can be made according to the design or the like as long as the technical idea does not depart from the scope.

(実施形態)
本実施形態に係る表示方法、プログラム及び表示システムについて、図1〜図8を用いて説明する。
(Embodiment)
A display method, a program, and a display system according to the present embodiment will be described with reference to FIGS.

(1)全体概要
本実施形態では、施設で計測された電力に関する電力量情報を表示する機能を、基本的な機能として有する表示システムについて説明する。
(1) Overall Overview In the present embodiment, a display system having a function of displaying power amount information related to power measured at a facility as a basic function will be described.

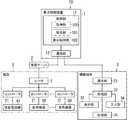
本実施形態においては、コンピュータシステムが備える表示システム10は、図1、図2に示すように、情報端末3に表示するコンテンツを作成する表示制御装置1にて構成される。ここでいう「施設」は、電力の供給を受けるビル等の施設を意味しており、電力会社等の電気事業者から電力の供給を受ける施設だけでなく、太陽光発電設備等の発電設備から電力の供給を受ける施設も含む。  In the present embodiment, thedisplay system 10 included in the computer system is configured by adisplay control device 1 that creates content to be displayed on theinformation terminal 3, as shown in FIGS. The term “facility” as used herein means a facility such as a building that receives power supply, not only from a facility that receives power supply from an electric power company such as an electric power company, but also from power generation equipment such as solar power generation equipment. Includes facilities that receive power.

施設5に設けられた計測システム20は、施設5における電力の消費データ(消費電力量)を取得する。具体的には、計測システム20は、施設5における複数の分岐回路について、消費電力量を消費データとして取得する。施設5における複数の分岐回路の各々には負荷機器50が接続されている。負荷機器50は、例えば施設5に設けられた機器であり、電力を消費する電気機器である。負荷機器50は、例えば照明器具50a〜50c、空調機器50d〜50f等である。  Themeasurement system 20 provided in thefacility 5 acquires power consumption data (power consumption amount) in thefacility 5. Specifically, themeasurement system 20 acquires the power consumption amount as consumption data for a plurality of branch circuits in thefacility 5. Aload device 50 is connected to each of a plurality of branch circuits in thefacility 5. Theload device 50 is a device provided in thefacility 5, for example, and is an electric device that consumes power. Theload device 50 is, for example,lighting fixtures 50a to 50c,air conditioning devices 50d to 50f, and the like.

蓄積サーバ2は、計測システム20にネットワーク4を介して接続される。蓄積サーバ2は、計測システム20が計測した複数の分岐回路に対する計測値を分岐回路ごとに時系列に記憶している。  Thestorage server 2 is connected to themeasurement system 20 via thenetwork 4. Theaccumulation server 2 stores measurement values for a plurality of branch circuits measured by themeasurement system 20 in time series for each branch circuit.

表示制御装置1は、図2に示すように、施設5に設けられた蓄積サーバ2にネットワーク4を介して接続される。また、表示制御装置1は、図2に示すように、表示部31を備える情報端末3にネットワーク4を介して接続される。  As shown in FIG. 2, thedisplay control device 1 is connected to astorage server 2 provided in afacility 5 via anetwork 4. Moreover, thedisplay control apparatus 1 is connected to theinformation terminal 3 provided with thedisplay part 31 via thenetwork 4 as shown in FIG.

情報端末3は、表示システム10(表示制御装置1)で出力された情報(コンテンツ)を表示部31に表示する。これにより、情報端末3は、表示システム10で作成された情報(コンテンツ)を、情報端末3の所有者に対して提示することが可能となる。ここで、所有者は、例えば、施設5の管理者である。  Theinformation terminal 3 displays information (content) output from the display system 10 (display control device 1) on thedisplay unit 31. Thereby, theinformation terminal 3 can present the information (content) created by thedisplay system 10 to the owner of theinformation terminal 3. Here, the owner is an administrator of thefacility 5, for example.

(2)構成
次に、本実施形態に係る表示システム10、計測システム20、蓄積サーバ2及び情報端末3の構成について説明する。
(2) Configuration Next, configurations of thedisplay system 10, themeasurement system 20, thestorage server 2, and theinformation terminal 3 according to the present embodiment will be described.

(2.1)計測システム
まず、本実施形態の計測システム20の構成について説明する。
(2.1) Measurement system First, the structure of themeasurement system 20 of this embodiment is demonstrated.

計測システム20は、図2に示すように、複数のコントローラ21と、電流センサ22〜28とを備えている。また、施設5には、系統電源9に電気的に接続される受変電設備61(キュービクル)が設けられている。なお、複数のコントローラ21を個別に表す必要がある場合には、コントローラ21a〜21cと記載する。  As illustrated in FIG. 2, themeasurement system 20 includes a plurality ofcontrollers 21 andcurrent sensors 22 to 28. In addition, thefacility 5 is provided with a power receiving / transforming facility 61 (cubicle) that is electrically connected to thesystem power supply 9. In addition, when it is necessary to represent theseveral controller 21 separately, it describes as thecontrollers 21a-21c.

複数のコントローラ21は、少なくとも1つの電流センサに電気的に接続されている。具体的には、コントローラ21aは、電流センサ22に電気的に接続されている。コントローラ21bは、電流センサ23〜25に電気的に接続されている。コントローラ21cは、電流センサ26〜28に電気的に接続されている。電流センサ22は、受変電設備61の一次側に設けられ、幹線を流れる電流の値を計測する。電流センサ23〜29は、複数の分岐ブレーカ62に対応して設けられ、複数の分岐回路に流れる電流の値をそれぞれ計測する。ここでいう「分岐回路」は、受変電設備61及び複数の分岐ブレーカ62にて幹線から分岐された各回路を意味する。分岐回路には、分岐ブレーカ62に接続される配線、照明器具や調理家電等の負荷機器50、コンセント(アウトレット)、壁スイッチ等を含んでいる。なお、複数の分岐ブレーカ62を個別に表す必要がある場合には、分岐ブレーカ62a〜62fと記載する。例えば、分岐ブレーカ62cで分岐された分岐回路は、分岐ブレーカ62cと照明器具50a,50bとを含む回路である。また、受変電設備61で分岐された分岐回路は、受変電設備61と分岐ブレーカ62a,62bの各々で分岐された分岐回路とを含む回路である。  The plurality ofcontrollers 21 are electrically connected to at least one current sensor. Specifically, thecontroller 21 a is electrically connected to thecurrent sensor 22. Thecontroller 21b is electrically connected to the current sensors 23-25. Thecontroller 21c is electrically connected to thecurrent sensors 26 to 28. Thecurrent sensor 22 is provided on the primary side of the power receiving / transformingequipment 61 and measures the value of the current flowing through the main line. Thecurrent sensors 23 to 29 are provided corresponding to the plurality ofbranch breakers 62 and measure the values of the currents flowing through the plurality of branch circuits, respectively. The “branch circuit” here means each circuit branched from the trunk line by the receiving / transformingequipment 61 and the plurality ofbranch breakers 62. The branch circuit includes wiring connected to thebranch breaker 62, aload device 50 such as a lighting fixture or a cooking appliance, an outlet (outlet), a wall switch, and the like. In addition, when it is necessary to representseveral branch breaker 62 separately, it describes asbranch breaker 62a-62f. For example, the branch circuit branched by the branch breaker 62c is a circuit including the branch breaker 62c and thelighting fixtures 50a and 50b. The branch circuit branched by the power receiving / transformingequipment 61 is a circuit including the power receiving / transformingequipment 61 and the branch circuit branched by each of thebranch breakers 62a and 62b.

複数のコントローラ21の各々は、電気的に接続された1つ以上の電流センサの出力を用いて、複数の負荷機器50及び受変電設備61の各々について、消費電力と消費電力量(電力量)との少なくとも一方を計測する。複数のコントローラ21の各々は、計測された計測値を、施設5に設けられたルータ7を介して蓄積サーバ2へ送信する。例えば、コントローラ21aは、受変電設備61で分岐される分岐回路で使用される電力量を計測する。コントローラ21bは、複数の負荷機器50(照明器具50a〜50c)の各々で使用される電力量の値を、負荷機器50ごとに計測する。コントローラ21cは、複数の負荷機器50(空調機器50d〜50f)の各々で使用される電力量の値を、負荷機器50ごとに計測する。  Each of the plurality ofcontrollers 21 uses the output of one or more current sensors electrically connected to each of the plurality ofload devices 50 and the power receiving / transformingequipment 61, and the power consumption and the power consumption (power amount). And measure at least one of Each of the plurality ofcontrollers 21 transmits the measured values to thestorage server 2 via therouter 7 provided in thefacility 5. For example, thecontroller 21 a measures the amount of power used in the branch circuit branched by the power receiving / transformingequipment 61. Thecontroller 21b measures the value of the amount of power used in each of the plurality of load devices 50 (lighting fixtures 50a to 50c) for eachload device 50. Thecontroller 21c measures the value of the electric energy used in each of the plurality of load devices 50 (air conditioning devices 50d to 50f) for eachload device 50.

上述したように、計測システム20の計測値は、複数のコントローラ21で計測される消費電力と消費電力量との少なくとも一方を含んでいる。つまり、計測値は、瞬時電力を表す消費電力であってもよいし、あるいは一定時間における電力の消費量(使用量)を表す消費電力量であってもよい。また、計測値は、消費電力と消費電力量との両方であってもよい。本実施形態では一例として、計測値は、消費電力を一定時間(例えば正時から30分間隔)で積算した消費電力量である。  As described above, the measurement value of themeasurement system 20 includes at least one of the power consumption and the power consumption measured by the plurality ofcontrollers 21. That is, the measured value may be power consumption representing instantaneous power, or may be power consumption representing power consumption (usage) for a certain period of time. Further, the measured value may be both power consumption and power consumption. In the present embodiment, as an example, the measured value is a power consumption amount obtained by integrating the power consumption at a certain time (for example, every 30 minutes from the hour).

コントローラ21は、計測対象である設備(受変電設備61又は負荷機器50)の計測値と、計測対象である受変電設備61又は負荷機器50を識別する識別情報とを対応付けて、ルータ7を介して蓄積サーバ2に送信する。識別情報とは、コントローラによって電力量の計測が可能な回路に割り当てられた情報である。例えば、図2に示す受変電設備61には、識別情報として“回路[31−1]”が割り当てられている。  Thecontroller 21 associates the measured value of the facility to be measured (the power receiving / transformingfacility 61 or the load device 50) with the identification information for identifying the power receiving / transformingfacility 61 or theload device 50 to be measured, and To thestorage server 2. The identification information is information assigned to a circuit that can measure the amount of power by the controller. For example, “circuit [31-1]” is assigned as identification information to the power receiving / transformingequipment 61 shown in FIG.

(2.2)蓄積サーバ
蓄積サーバ2は、計測システム20が計測した計測値(例えば消費電力量)を記憶する。つまり、蓄積サーバ2は、ROM(Read Only Memory)、RAM(Random Access Memory)、またはEEPROM(Electrically Erasable Programmable Read Only Memory)等から選択されるデバイスを有している。このデバイスに、計測システム20が計測した計測値が時系列に記憶される。
(2.2) Storage Server Thestorage server 2 stores measurement values (for example, power consumption) measured by themeasurement system 20. That is, thestorage server 2 includes a device selected from a ROM (Read Only Memory), a RAM (Random Access Memory), an EEPROM (Electrically Erasable Programmable Read Only Memory), or the like. Measurement values measured by themeasurement system 20 are stored in this device in time series.

蓄積サーバ2は、識別情報ごとに、つまり計測対象の設備ごとに、計測された計測値を時系列に記憶する。  Theaccumulation server 2 stores measured values in time series for each identification information, that is, for each facility to be measured.

蓄積サーバ2は、計測対象である複数の設備(受変電設備61及び複数の負荷機器50)と、複数の識別情報とを一対一に対応付けて記憶している。  Thestorage server 2 stores a plurality of facilities to be measured (receiving and transformingfacilities 61 and a plurality of load devices 50) and a plurality of identification information in a one-to-one correspondence.

(2.3)表示システム
次に、本実施形態の表示システム10の構成について説明する。
(2.3) Display system Next, the structure of thedisplay system 10 of this embodiment is demonstrated.

表示システム10は、上述したように、本実施形態では表示制御装置1にて構成されている。表示制御装置1は、情報端末3及び蓄積サーバ2にネットワーク4を介して接続される。  As described above, thedisplay system 10 is configured by thedisplay control device 1 in this embodiment. Thedisplay control device 1 is connected to theinformation terminal 3 and thestorage server 2 via thenetwork 4.

表示制御装置1は、図1に示すように、処理部11と、通信部12とを備える。表示制御装置1は、CPU(Central Processing Unit)及びメモリを有している。CPUがメモリに格納されているプログラムを実行することにより、処理部11の機能を実現する。プログラムは、ここではインターネット等の電気通信回線を通じて、あるいはメモリカード等の記録媒体に記録されて提供されるが、コンピュータのメモリに予め記録されていてもよい。  As shown in FIG. 1, thedisplay control device 1 includes aprocessing unit 11 and acommunication unit 12. Thedisplay control device 1 has a CPU (Central Processing Unit) and a memory. The function of theprocessing unit 11 is realized by the CPU executing a program stored in the memory. Here, the program is provided through an electric communication line such as the Internet or recorded in a recording medium such as a memory card, but may be recorded in advance in a memory of a computer.

処理部11は、図1に示すように、取得部100、抽出部101及び表示制御部102を有している。  As illustrated in FIG. 1, theprocessing unit 11 includes an acquisition unit 100, an extraction unit 101, and a display control unit 102.

取得部100は、計測システム20が施設5における複数の計測点でそれぞれ計測された複数の設備の電力量に関連する電力量情報を、蓄積サーバ2から取得する。具体的には、取得部100は、電流センサ22〜28で計測された複数の設備(受変電設備61及び負荷機器50)の消費電力量と、計測された日時とを含む電力量情報を、蓄積サーバ2から取得する。  The acquisition unit 100 acquires, from thestorage server 2, power amount information related to the power amounts of a plurality of facilities measured by themeasurement system 20 at a plurality of measurement points in thefacility 5. Specifically, the acquisition unit 100 obtains the power amount information including the power consumption amount of the plurality of facilities (the power receiving / transformingfacility 61 and the load device 50) measured by thecurrent sensors 22 to 28 and the measured date and time. Obtained from theaccumulation server 2.

抽出部101は、各設備について、当該設備が非稼働状態の開始とみなされる開始時刻、及び当該設備の非稼働状態の終了とみなされる終了時刻を、予め記憶している。例えば、抽出部101は、基準電力が継続する期間の開始時刻及び終了時刻を、設備が非稼働状態の開始とみなされる開始時刻、及び非稼働状態の終了とみなされる終了時刻として、予め記憶する。ここで、基準電力とは、設備が稼働していないとみなされる期間における安定した電力である。基準電力は、設備の待機電力、又は待機電力に所定値を加えた電力である。非稼働状態とみなされる期間では、例えば、計測された大量の計測値(消費電力量)を用いて、複数の日においてそれぞれ発生する複数の基準電力の開始時刻の平均の時刻を当該期間の開始時刻とし、複数の終了時刻の平均の時刻を当該期間の終了時刻とする。なお、本実施形態では、複数の基準電力の開始時刻の平均の時刻を設備が非稼働状態の開始とみなされる開始時刻とし、複数の基準電力の終了時刻の平均の時刻を設備が非稼働状態の開始とみなされる終了時刻としたが、これに限定されない。複数の基準電力の開始時刻のうち最も早い開始時刻又は最も遅い開始時刻を、非稼働状態の開始とみなされる開始時刻としてもよい。または、複数の基準電力の開始時刻の中間値を非稼働状態の開始とみなされる開始時刻としてもよい。同様に、複数の基準電力の終了時刻のうち最も早い終了時刻又は最も遅い終了時刻を、非稼働状態の終了とみなされる終了時刻としてもよい。または、複数の基準電力の終了時刻の中間値を非稼働状態の開始とみなされる終了時刻としてもよい。  For each piece of equipment, the extraction unit 101 stores in advance a start time at which the equipment is considered to be in the non-operating state and an end time at which the equipment is considered to be in the non-operating state. For example, the extraction unit 101 stores in advance the start time and end time of the period in which the reference power continues as the start time when the facility is considered to be the start of the non-operating state and the end time when the facility is considered to be the end of the non-operating state. . Here, the reference power is stable power during a period when the equipment is considered not to be operating. The reference power is standby power of the facility or power obtained by adding a predetermined value to the standby power. In a period that is regarded as a non-operating state, for example, using a large amount of measured values (power consumption) measured, the average time of the start times of a plurality of reference powers respectively generated on a plurality of days is started. Let time be the average time of a plurality of end times as the end time of the period. In this embodiment, the average time of the start times of the plurality of reference powers is set as the start time when the equipment is regarded as the start of the non-operating state, and the average time of the end times of the plurality of reference powers is set in the non-operating state. However, the present invention is not limited to this. The earliest start time or the latest start time among the start times of the plurality of reference powers may be set as the start time considered as the start of the non-operating state. Or it is good also considering the intermediate value of the start time of several reference electric power as the start time considered as the start of a non-operation state. Similarly, the earliest or latest end time among the end times of the plurality of reference powers may be set as the end time regarded as the end of the non-operating state. Or it is good also considering the intermediate value of the end time of several reference electric power as the end time considered as the start of a non-operation state.

抽出部101は、各設備について、当該設備に対応する複数の電力量情報のうち、少なくとも当該設備が非稼働状態の開始とみなされる開始時刻から当該設備の非稼働状態の終了とみなされる終了時刻までの期間の電力量情報を非稼働情報として抽出する。本実施形態では、抽出部101は、各設備について、非稼働情報の他、当該設備の稼働期間におけるすべての電力量情報を稼働情報として抽出する。つまり、抽出部101は、各設備について、非稼働状態の期間の電力量情報だけでなく、稼働状態の期間の電力量情報も取得する。  For each facility, the extraction unit 101 determines, from among a plurality of pieces of power information corresponding to the facility, at least the end time at which the facility is regarded as the start of the non-operation state from the start time at which the facility is regarded as the start of the non-operation state. The amount of power information for the period up to is extracted as non-operation information. In the present embodiment, the extraction unit 101 extracts, for each facility, all power amount information in the operation period of the facility as operation information in addition to the non-operation information. That is, for each piece of equipment, the extraction unit 101 acquires not only the power amount information during the non-operating state but also the power amount information during the operating state.

抽出部101は、各設備について、当該設備の非稼働状態での基準電力を予め記憶している。例えば、計測された大量の計測値を用いて、複数の日においてそれぞれ発生する非稼働状態時の電力の平均値を基準電力として記憶する。なお、本実施形態では、複数の非稼働状態時の電力の平均値を基準電力としたが、これに限定されない。複数の非稼働状態時の電力の最小値、最大値、中間値を基準電力としてもよい。  For each piece of equipment, the extraction unit 101 stores in advance the reference power when the equipment is not in operation. For example, the average value of the power in the non-operating state generated on each of a plurality of days is stored as the reference power using a large amount of measured values. In the present embodiment, the average power value in a plurality of non-operating states is set as the reference power, but the present invention is not limited to this. A minimum value, a maximum value, and an intermediate value of power in a plurality of non-operating states may be used as the reference power.

抽出部101は、各設備について、取得した複数の電力量情報(非稼働情報)のうち基準電力を超えている消費電力量を含む電力量情報(非稼働情報)を抽出する。抽出部101は、抽出した電力量情報と、当該電力量情報に含まれる消費電力量に対する節約可能な電力量(改善電力量)とを含む超過電力量情報を生成する。例えば、基準電力を超えている消費電力量は、非稼働とみなされる期間に負荷機器50の電源の切り忘れ等により発生している電力である。ここで、改善電力量は、計測された消費電力量と基準電力との差分である。以降、本実施形態では、負荷機器50の電源の切り忘れにより発生した電力を超過電力量として説明する。  The extraction unit 101 extracts, for each facility, power amount information (non-operation information) including the power consumption exceeding the reference power among the plurality of acquired power amount information (non-operation information). The extraction unit 101 generates excess power amount information including the extracted power amount information and a conservable power amount (improved power amount) with respect to the power consumption amount included in the power amount information. For example, the power consumption exceeding the reference power is power generated due to forgetting to turn off the power source of theload device 50 during a period considered to be non-operating. Here, the improved power amount is a difference between the measured power consumption amount and the reference power. Hereinafter, in the present embodiment, the power generated by forgetting to turn off the power of theload device 50 will be described as the excess power amount.

表示制御部102は、情報端末3からの要求に応じた画面を作成し、情報端末3の表示部31に表示する。  The display control unit 102 creates a screen in response to a request from theinformation terminal 3 and displays it on thedisplay unit 31 of theinformation terminal 3.

表示制御部102は、情報端末3からの要求に応じて、計測が開始されてから現在までの期間におけるすべての超過電力量情報に基づいた第1画面200(コンテンツ)を作成し、表示部31に表示する。  In response to a request from theinformation terminal 3, the display control unit 102 creates a first screen 200 (content) based on all excess power amount information in a period from the start of measurement to the present, and thedisplay unit 31. To display.

表示制御部102は、情報端末3からの要求に応じて、指定された年におけるすべての超過電力量情報に基づいた第2画面300(コンテンツ)を作成し、表示部31に表示する。  In response to a request from theinformation terminal 3, the display control unit 102 creates a second screen 300 (content) based on all excess power amount information in the specified year and displays it on thedisplay unit 31.

表示制御部102は、情報端末3からの要求に応じて、指定された月におけるすべての超過電力量情報に基づいた第3画面400(コンテンツ)を作成し、表示部31に表示する。  In response to a request from theinformation terminal 3, the display control unit 102 creates a third screen 400 (content) based on all excess power amount information in the specified month and displays it on thedisplay unit 31.

表示制御部102は、情報端末3からの要求に応じて、指定された週におけるすべての超過電力量情報に基づいた第4画面500(コンテンツ)を作成し、表示部31に表示する。  In response to a request from theinformation terminal 3, the display control unit 102 creates a fourth screen 500 (content) based on all excess power amount information for the specified week and displays it on thedisplay unit 31.

表示制御部102は、情報端末3からの要求に応じて、特定の設備について指定された月におけるすべての非稼働情報及びすべての稼働情報と、当該月におけるすべての超過電力量情報とに基づいた第5画面600(コンテンツ)を作成し、表示部31に表示する。  In response to a request from theinformation terminal 3, the display control unit 102 is based on all non-operation information and all operation information for a specified month for a specific facility, and all excess power information for the month. A fifth screen 600 (content) is created and displayed on thedisplay unit 31.

表示制御部102は、情報端末3からの要求に応じて、特定の設備について指定された日におけるすべての非稼働情報及びすべての稼働情報と、当該月におけるすべての超過電力量情報とに基づいた第6画面700(コンテンツ)を作成し、表示部31に表示する。  In response to a request from theinformation terminal 3, the display control unit 102 is based on all non-operation information and all operation information on a specified date for a specific facility, and all excess power amount information in the month. A sixth screen 700 (content) is created and displayed on thedisplay unit 31.

表示制御部102は、作成した画面を情報端末3に送信し、表示部31に表示させる。  The display control unit 102 transmits the created screen to theinformation terminal 3 and causes thedisplay unit 31 to display the screen.

通信部12は、ネットワーク4に接続されることで、表示制御装置1と情報端末3との間、及び表示制御装置1と蓄積サーバ2との間の通信を可能にする。  Thecommunication unit 12 is connected to thenetwork 4 to enable communication between thedisplay control device 1 and theinformation terminal 3 and between thedisplay control device 1 and thestorage server 2.

(2.4)情報端末
次に、本実施形態の情報端末3の構成について説明する。
(2.4) Information terminal Next, the structure of theinformation terminal 3 of this embodiment is demonstrated.

情報端末3は、一例として表示部31を備えるスマートフォンである。情報端末3は、図3に示すように、表示部31の他、処理部32と、通信部33と、入力部34と、記憶部35とを備える。情報端末3は、CPU及びメモリを有しており、CPUがメモリに格納されているプログラムを実行することにより、コンピュータを処理部32として機能させる。プログラムは、ここではインターネット等の電気通信回線を通じて、あるいはメモリカード等の記録媒体に記録されて提供されるが、コンピュータのメモリに予め記録されていてもよい。  Theinformation terminal 3 is a smart phone provided with thedisplay part 31 as an example. As shown in FIG. 3, theinformation terminal 3 includes adisplay unit 31, aprocessing unit 32, acommunication unit 33, aninput unit 34, and a storage unit 35. Theinformation terminal 3 has a CPU and a memory, and causes the computer to function as theprocessing unit 32 when the CPU executes a program stored in the memory. Here, the program is provided through an electric communication line such as the Internet or recorded in a recording medium such as a memory card, but may be recorded in advance in a memory of a computer.

表示部31は、例えば液晶ディスプレイや有機EL(electroluminescence)ディスプレイのような薄型のディスプレイ装置である。  Thedisplay unit 31 is a thin display device such as a liquid crystal display or an organic EL (electroluminescence) display.

処理部32は、表示部31を制御することにより、表示制御装置1の表示制御部102が作成した画面を表示部31に表示する機能を持つ。つまり、情報端末3は、専用のアプリケーションソフトをインストールし、このアプリケーションソフトを起動することにより、表示部31を制御するための処理部32としての機能を実現する。  Theprocessing unit 32 has a function of displaying the screen created by the display control unit 102 of thedisplay control device 1 on thedisplay unit 31 by controlling thedisplay unit 31. That is, theinformation terminal 3 implements a function as theprocessing unit 32 for controlling thedisplay unit 31 by installing dedicated application software and starting the application software.

通信部33は、ネットワーク4に接続されることで、情報端末3と表示制御装置1(表示システム10)との間の通信を可能にする。ここでは、情報端末3はスマートフォンであるから、通信部33は、通信事業者が提供する携帯電話網(キャリア網)を介して、例えばインターネットからなるネットワーク4に接続される。携帯電話網には、例えば3G(第3世代)回線、LTE(Long Term Evolution)回線等がある。なお、通信部33は、公衆無線LAN(Local Area Network)を介してネットワーク4に接続されてもよい。  Thecommunication unit 33 is connected to thenetwork 4 to enable communication between theinformation terminal 3 and the display control device 1 (display system 10). Here, since theinformation terminal 3 is a smartphone, thecommunication unit 33 is connected to thenetwork 4 made of the Internet, for example, via a mobile phone network (carrier network) provided by a communication carrier. Examples of the mobile phone network include a 3G (third generation) line and an LTE (Long Term Evolution) line. Thecommunication unit 33 may be connected to thenetwork 4 via a public wireless LAN (Local Area Network).

入力部34は、情報端末3の所有者の操作を受け付ける機能を有している。本実施形態では、情報端末3はタッチパネルディスプレイを搭載したスマートフォンであり、タッチパネルディスプレイが表示部31及び入力部34として機能する。そのため、以下の説明では、表示部31に表示される画面上のボタンに対する種々のタッチ操作を、「タップ」等と表現する。ただし、入力部34は、タッチパネルディスプレイに限らず、例えばキーボードやポインティングデバイス、メカニカルなスイッチ等であってもよい。  Theinput unit 34 has a function of accepting an operation of the owner of theinformation terminal 3. In the present embodiment, theinformation terminal 3 is a smartphone equipped with a touch panel display, and the touch panel display functions as thedisplay unit 31 and theinput unit 34. Therefore, in the following description, various touch operations on the buttons on the screen displayed on thedisplay unit 31 are expressed as “tap” or the like. However, theinput unit 34 is not limited to a touch panel display, and may be a keyboard, a pointing device, a mechanical switch, or the like.

記憶部35は、例えばフラッシュメモリ等の電気的に書換可能な不揮発性の半導体メモリで構成される。  The storage unit 35 is configured by an electrically rewritable nonvolatile semiconductor memory such as a flash memory.

情報端末3は、上記構成により表示制御装置1で作成された画面(コンテンツ)を表示することができる。  Theinformation terminal 3 can display the screen (content) created by thedisplay control device 1 with the above configuration.

なお、情報端末3がスマートフォンで構成されることは一例である。情報端末3は、携帯電話機、パーソナルコンピュータ等で構成されてもよい。  In addition, it is an example that theinformation terminal 3 is comprised with a smart phone. Theinformation terminal 3 may be configured by a mobile phone, a personal computer, or the like.

(3)動作説明
以下、本実施形態に係る表示システム10の動作について説明する。
(3) Description of Operation Hereinafter, the operation of thedisplay system 10 according to the present embodiment will be described.

まず、電力情報と構成情報とを表示部31に表示する場合の表示システム10の動作について説明する。  First, the operation of thedisplay system 10 when displaying power information and configuration information on thedisplay unit 31 will be described.

本実施形態に係るプログラムは、情報端末3の表示部31に、計測システム20が計測した施設5における消費電力量に関する電力量情報及び超過電力量情報に応じた改善電力量に関する改善情報を表示するためのプログラムである。ここで、改善電力量は、超過電力量情報に含まれる電力量のうち節約可能な電力量である。つまり、本実施形態に係るプログラムは、表示制御装置1のコンピュータを、取得部100、抽出部101及び表示制御部102として機能させるためのプログラムである。  The program according to the present embodiment displays, on thedisplay unit 31 of theinformation terminal 3, the power amount information related to the power consumption amount in thefacility 5 measured by themeasurement system 20 and the improvement information related to the improved power amount according to the excess power amount information. It is a program for. Here, the improved power amount is a power amount that can be saved among the power amounts included in the excess power amount information. That is, the program according to the present embodiment is a program for causing the computer of thedisplay control apparatus 1 to function as the acquisition unit 100, the extraction unit 101, and the display control unit 102.

取得部100は、電流センサ22〜28で計測された複数の設備(受変電設備61及び負荷機器50)の消費電力量と、計測された日時とを含む電力量情報を、蓄積サーバ2から取得する。  The acquisition unit 100 acquires, from thestorage server 2, power amount information including the power consumption amount of the plurality of facilities (the power receiving / transformingfacility 61 and the load device 50) measured by thecurrent sensors 22 to 28 and the measured date and time. To do.

抽出部101は、各設備について、計測システム20が計測したすべての非稼働情報及びすべての稼働情報を、蓄積サーバ2から抽出する。  The extraction unit 101 extracts all non-operation information and all operation information measured by themeasurement system 20 for each facility from thestorage server 2.

抽出部101は、各設備について、取得した複数の電力量情報(非稼働情報)のうち基準電力を超えている消費電力量を含む電力量情報(非稼働情報)を抽出する。抽出部101は、抽出した電力量情報と、改善電力量とを含む超過電力量情報を生成する。  The extraction unit 101 extracts, for each facility, power amount information (non-operation information) including the power consumption exceeding the reference power among the plurality of acquired power amount information (non-operation information). The extraction unit 101 generates excess power amount information including the extracted power amount information and the improved power amount.

表示制御部102は、情報端末3からの要求に応じて、第1画面200を作成し、表示部31に表示する。具体的には、表示制御部102は、計測が開始されてから現在までの期間を1ヶ月ごとのグループに分割する。表示制御部102は、設備ごとに、当該設備に対するすべての超過電力量情報を、対応するグループに分類する。例えば、超過電力量情報に含まれる消費電力量が計測された日時に対応するグループに当該超過電力量は分類される。表示制御部102は、分類したグループごとに、超過電力量情報が含まれる日数をカウントする。表示制御部102は、超過電力量情報が含まれる日数に応じて、該当する月において非稼働状態とみなされる期間の消費電力量に対する評価結果の表示色を決定する。例えば、超過電力量情報が含まれる日数が0日であれば白色に、1〜2日であれば表示色を黄色に、3〜4日であれば表示色を橙色に、5日以上であれば表示色を赤色に、それぞれ決定する。つまり、負荷機器50の電源の切り忘れが無い月の表示色は白色に、電源の切り忘れが1〜2日であれば表示色は黄色に、3〜4日であれば表示色は橙色に、5日以上であれば表示色は赤色に、それぞれ決定される。さらに、表示制御部102は、計測が開始されてから現在までの期間に含まれるすべての超過電力量情報の改善電力量の合計を算出し、その結果を改善情報とする。表示制御部102は、各設備について、月ごとに決定された表示色(月ごとの評価結果)及び改善情報を含む第1画面200を生成する。  The display control unit 102 creates thefirst screen 200 in response to a request from theinformation terminal 3 and displays it on thedisplay unit 31. Specifically, the display control unit 102 divides the period from the start of measurement to the present into groups for each month. For each facility, the display control unit 102 classifies all excess power amount information for the facility into a corresponding group. For example, the excess power amount is classified into a group corresponding to the date and time when the power consumption amount included in the excess power amount information is measured. The display control unit 102 counts the number of days in which the excess power amount information is included for each classified group. The display control unit 102 determines the display color of the evaluation result for the power consumption amount during the period considered to be a non-operating state in the corresponding month according to the number of days in which the excess power amount information is included. For example, if the number of days in which excess power information is included is 0, the display color is white, if 1-2 days, the display color is yellow, if 3-4 days, the display color is orange, and the display color is 5 days or more. In this case, the display color is determined to be red. That is, the display color of the month in which the power supply of theload device 50 is not forgotten to be turned off is white, the display color is yellow if the power supply is forgotten to be turned off for 1 to 2 days, and the display color is orange for 3 to 4 days. If it is more than a day, the display color is determined to be red. Furthermore, the display control unit 102 calculates the sum of the improved power amounts of all excess power amount information included in the period from the start of measurement to the present, and uses the result as the improved information. The display control unit 102 generates afirst screen 200 including display colors (monthly evaluation results) determined for each month and improvement information for each facility.

表示制御部102は、情報端末3からの要求に応じて、第2画面300を作成し、表示部31に表示する。具体的には、表示制御部102は、指定された年を1ヶ月ごとのグループに分割する。表示制御部102は、設備ごとに、当該設備に対するすべての超過電力量情報のうち指定された年に計測された消費電力量を含む超過電力量情報を、対応するグループに分類する。表示制御部102は、分類したグループごとに、超過電力量情報が含まれる日数をカウントする。表示制御部102は、超過電力量情報が含まれる日数に応じて、該当する月において非稼働状態とみなされる期間の消費電力量に対する評価結果の表示色を決定する。例えば、表示制御部102は、1ヶ月を3つの期間(第1〜第3期間)に分割し、各期間について超過電力量情報が含まれる日数が0日であれば白色に、1〜2日であれば表示色を黄色に、3〜4日であれば表示色を橙色に、5日以上であれば表示色を赤色に、それぞれ決定する。つまり、第1〜第3期間のうち負荷機器50の電源の切り忘れが無い期間の表示色は白色に、電源の切り忘れが1〜2日である期間の表示色は黄色に、3〜4日である期間の表示色は橙色に、5日以上である期間の表示色は赤色に、それぞれ決定される。さらに、表示制御部102は、指定された年に含まれるすべての超過電力量情報の改善電力量の合計を算出し、その結果を改善情報とする。表示制御部102は、各設備について、月ごとに決定された表示色(月ごとの評価結果)及び改善情報を含む第2画面300を生成する。  The display control unit 102 creates thesecond screen 300 in response to a request from theinformation terminal 3 and displays it on thedisplay unit 31. Specifically, the display control unit 102 divides the specified year into groups for each month. The display control unit 102 classifies the excess power amount information including the power consumption amount measured in the specified year among all the excess power amount information for the facility for each facility into a corresponding group. The display control unit 102 counts the number of days in which the excess power amount information is included for each classified group. The display control unit 102 determines the display color of the evaluation result for the power consumption amount during the period considered to be a non-operating state in the corresponding month according to the number of days in which the excess power amount information is included. For example, the display control unit 102 divides one month into three periods (first to third periods), and turns white if the number of days in which excess power amount information is included for each period is 0 days, or 1-2 days. If so, the display color is determined to be yellow, if 3 to 4 days, the display color is determined to be orange, and if 5 days or more, the display color is determined to be red. That is, in the first to third periods, the display color of the period in which the power of theload device 50 is not forgotten to be turned off is white, the display color of the period in which the power supply is forgotten to be turned off for 1 to 2 days is yellow, and 3 to 4 days. The display color for a certain period is determined to be orange, and the display color for a period of five days or more is determined to be red. Further, the display control unit 102 calculates the sum of the improved power amounts of all the excess power amount information included in the specified year, and uses the result as the improved information. The display control unit 102 generates thesecond screen 300 including the display color determined for each month (evaluation result for each month) and improvement information for each facility.

表示制御部102は、情報端末3からの要求に応じて、第3画面400を作成し、表示部31に表示する。具体的には、表示制御部102は、指定された月を1日ごとのグループに分割する。表示制御部102は、設備ごとに、当該設備に対するすべての超過電力量情報のうち指定された月に計測された消費電力量を含む超過電力量情報を、対応するグループに分類する。表示制御部102は、分類したグループごとに、超過電力量情報が含まれるか否かを判断する。表示制御部102は、判断結果に応じて、該当する日において非稼働状態とみなされる期間の消費電力量に対する評価結果の表示色を決定する。例えば、グループに超過電力量情報が含まれると判断する場合には表示色を黄色に、グループに超過電力量情報が含まれないと判断する場合には白色に、それぞれ決定する。つまり、負荷機器50の電源の切り忘れが無い日の表示色は白色に、電源の切り忘れた日があれば表示色は黄色に決定される。さらに、表示制御部102は、指定された月に含まれるすべての超過電力量情報の改善電力量の合計を算出し、その結果を改善情報とする。表示制御部102は、各設備について、日ごとに決定された表示色(日ごとの評価結果)及び改善情報を含む第3画面400を生成する。  In response to a request from theinformation terminal 3, the display control unit 102 creates thethird screen 400 and displays it on thedisplay unit 31. Specifically, the display control unit 102 divides the designated month into groups for each day. The display control unit 102 classifies the excess power amount information including the power consumption amount measured in the specified month among all the excess power amount information for the facility for each facility into a corresponding group. The display control unit 102 determines whether or not excess power amount information is included for each classified group. The display control unit 102 determines the display color of the evaluation result for the power consumption amount during the period regarded as the non-operating state on the corresponding day according to the determination result. For example, when it is determined that excess power amount information is included in the group, the display color is determined to be yellow, and when it is determined that excess power amount information is not included in the group, it is determined to be white. In other words, the display color of theload device 50 on which the power is not forgotten to be turned off is determined to be white, and if there is a date on which the power supply is forgotten to be turned off, the display color is set to yellow. Further, the display control unit 102 calculates the sum of the improved power amounts of all excess power amount information included in the specified month, and uses the result as the improved information. The display control unit 102 generates thethird screen 400 including the display color determined for each day (evaluation result for each day) and improvement information for each facility.

表示制御部102は、情報端末3からの要求に応じて、第4画面500を作成し、表示部31に表示する。具体的には、表示制御部102は、指定された週を曜日ごとのグループに分割する。表示制御部102は、設備ごとに、当該設備に対するすべての超過電力量情報のうち指定された曜日に計測された消費電力量を含む超過電力量情報を、対応するグループに分類する。表示制御部102は、分類したグループごとに、該当する曜日における非稼働状態とみなされる期間における消費電力量に対する評価結果の表示色を決定する。ここでは、表示制御部102は、非稼働状態とみなされる期間における1時間ごとの消費電力量に対する評価結果の表示色を決定する。表示制御部102は、非稼働状態とみなされる期間のうち超過電力量情報に含まれる消費電力量が計測されていない時間帯については、表示色を白色に決定する。表示制御部102は、非稼働状態とみなされる期間のうち超過電力量情報に含まれる消費電力量が計測された時間帯については、計測された消費電力量に応じて、表示色を決定する。例えば、表示制御部102は、計測された消費電力量が基準電力の1.5倍未満である場合には表示色を黄色に、1.5倍以上2.0未満である場合には表示色を橙色に、2.0以上である場合には表示色を赤色に、それぞれ決定する。つまり、負荷機器50の電源の切り忘れが発生している場合において、その負荷機器50の消費電力量に応じて表示色が変更される。さらに、表示制御部102は、指定された週に含まれる超過電力量情報の改善電力量の合計を算出し、その結果を改善情報とする。表示制御部102は、各設備について、月ごとに決定された表示色(曜日ごとの評価結果)及び改善情報を含む第4画面500を生成する。  The display control unit 102 creates thefourth screen 500 in response to a request from theinformation terminal 3 and displays it on thedisplay unit 31. Specifically, the display control unit 102 divides the designated week into groups for each day of the week. The display control unit 102 classifies the excess power amount information including the power consumption amount measured on the designated day among all the excess power amount information for the facility for each facility into a corresponding group. The display control unit 102 determines, for each classified group, a display color of an evaluation result for power consumption during a period that is considered to be a non-operating state on the corresponding day of the week. Here, the display control unit 102 determines the display color of the evaluation result for the hourly power consumption during the period regarded as the non-operating state. The display control unit 102 determines the display color to be white for a time period during which the power consumption amount included in the excess power amount information is not measured during the period regarded as the non-operating state. The display control unit 102 determines a display color according to the measured power consumption amount for a time period in which the power consumption amount included in the excess power amount information is measured during the period regarded as the non-operating state. For example, the display control unit 102 displays the display color in yellow when the measured power consumption is less than 1.5 times the reference power, and the display color when the measured power consumption is 1.5 to 2.0. Is orange, and when it is 2.0 or more, the display color is determined to be red. That is, when forgetting to turn off the power of theload device 50 occurs, the display color is changed according to the power consumption of theload device 50. Further, the display control unit 102 calculates the sum of the improved power amounts of the excess power amount information included in the designated week, and uses the result as the improved information. The display control unit 102 generates afourth screen 500 that includes the display color determined for each month (evaluation result for each day of the week) and improvement information for each facility.

表示制御部102は、情報端末3からの要求に応じて、特定の設備について指定された月におけるすべての非稼働情報及び稼働情報の消費電力をグラフ形式とする第5画面600を作成し、表示部31に表示する。具体的には、表示制御部102は、指定された月に計測された電力量情報に基づいて、時間軸に沿った消費電力量の電力グラフを日ごとに作成する。表示制御部102は、指定された月に含まれる超過電力量情報の改善電力量の合計を算出し、その結果を改善情報とする。表示制御部102は、指定された月の日ごとに、当該日に計測された消費電力量を含む超過電力量情報が存在する場合には、当該日に対応する電力グラフの背景の表示色を黄色に決定する。超過電力情報が存在しない日の電力グラフの背景については、表示色を白色とする。表示制御部102は、特定の設備について、日ごとに作成された電力グラフ、電力グラフの背景色及び改善情報を含む第5画面600を生成する。表示制御部102は、電力グラフにおいて抽出部101が予め記憶している開始時刻、終了時刻及び基準電力を表す線分を、さらに表示させる。  In response to a request from theinformation terminal 3, the display control unit 102 creates and displays afifth screen 600 that graphs the power consumption of all non-operation information and operation information in a specified month for a specific facility. Displayed on theunit 31. Specifically, the display control unit 102 creates a power graph of power consumption along the time axis for each day based on the power amount information measured in a specified month. The display control unit 102 calculates the total improvement power amount of the excess power amount information included in the specified month, and uses the result as improvement information. If there is excess power amount information including the power consumption measured on the day for each day of the specified month, the display control unit 102 changes the display color of the background of the power graph corresponding to the day. Determine yellow. For the background of the power graph on the day when there is no excess power information, the display color is white. The display control part 102 produces | generates the5th screen 600 containing the electric power graph produced for every day about the specific installation, the background color of an electric power graph, and improvement information. The display control unit 102 further displays a line segment representing the start time, the end time, and the reference power stored in advance in the extraction unit 101 in the power graph.

表示制御部102は、情報端末3からの要求に応じて、特定の設備について指定された日におけるすべての非稼働情報及び稼働情報の消費電力をグラフ形式とする第6画面700を作成し、表示部31に表示する。具体的には、表示制御部102は、指定された日に計測された電力量情報に基づいて、時間軸に沿った消費電力量の電力グラフを作成する。表示制御部102は、指定された日に含まれる超過電力量情報の改善電力量の合計を算出し、その結果を改善情報とする。表示制御部102は、指定された日に計測された消費電力量を含む超過電力量情報が存在する場合には、当該日に対応する電力グラフの背景の表示色を黄色に決定する。超過電力情報が存在しない場合の電力グラフの背景については、表示色を白色とする。表示制御部102は、特定の設備について作成された電力グラフ、電力グラフの背景色及び改善情報を含む第6画面700を生成する。表示制御部102は、電力グラフにおいて抽出部101が予め記憶している開始時刻、終了時刻及び基準電力を表す線分を、さらに表示させる。  In response to a request from theinformation terminal 3, the display control unit 102 creates and displays asixth screen 700 that displays all non-operation information and power consumption of operation information on a specified date for a specific facility in a graph format. Displayed on theunit 31. Specifically, the display control unit 102 creates a power graph of power consumption along the time axis based on the power amount information measured on the specified date. The display control unit 102 calculates the sum of the improved power amounts of the excess power amount information included in the designated day, and uses the result as the improved information. If there is excess power amount information including the power consumption measured on the specified date, the display control unit 102 determines the display color of the background of the power graph corresponding to that day to be yellow. For the background of the power graph when there is no excess power information, the display color is white. The display control unit 102 generates asixth screen 700 including a power graph created for a specific facility, a background color of the power graph, and improvement information. The display control unit 102 further displays a line segment representing the start time, the end time, and the reference power stored in advance in the extraction unit 101 in the power graph.

(4)画面
ここでは、表示部31で表示する画面について説明する。
(4) Screen Here, the screen displayed on thedisplay unit 31 will be described.

(4.1)第1画面
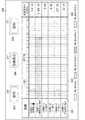
まず、第1画面200について説明する。なお、図3の参照符号及び領域を囲む一点鎖線は、説明のために記載しているのみであり、実際の画面には表示されない。以下、図4〜図8においても同様である。
(4.1) First Screen First, thefirst screen 200 will be described. Note that the reference numerals in FIG. 3 and the alternate long and short dash line surrounding the region are only described for explanation, and are not displayed on the actual screen. The same applies to FIGS. 4 to 8 below.

本実施形態の第1画面200は、図3に示すように、設備表示領域201、評価結果表示領域202及び改善情報表示領域203を含んでいる。  Thefirst screen 200 of this embodiment includes anequipment display area 201, an evaluationresult display area 202, and an improvementinformation display area 203, as shown in FIG.

設備表示領域201には、計測対象の設備に係る情報が表示される。本実施形態では、設備の識別情報及び名称が表示される。  In thefacility display area 201, information related to the facility to be measured is displayed. In this embodiment, the identification information and name of equipment are displayed.

評価結果表示領域202には、計測が開始されてから現在までの期間における月ごとの評価結果が時系列に並んで表示される。図3では、2015年1月〜2018年12月を期間として、各月の評価結果が表示されている。各月の評価結果は、表示制御部102が決定した表示色で表示される。これにより、例えば、識別情報が[回路1−1]である設備では、2015年7月において電源の消し忘れが5日以上あったことが評価結果として表示される。  In the evaluationresult display area 202, the evaluation results for each month in the period from the start of measurement to the present are displayed in time series. In FIG. 3, the evaluation results for each month are displayed in the period from January 2015 to December 2018. The evaluation result for each month is displayed in the display color determined by the display control unit 102. Thereby, for example, in the facility whose identification information is [Circuit 1-1], it is displayed as an evaluation result that the power supply was forgotten to be turned off for 5 days or more in July 2015.

改善情報表示領域203には、設備ごとの改善情報が表示される。つまり、改善情報表示領域203には、計測が開始されてから現在までの期間において、電源の消し忘れがあったために生じた消費電力量の合計値が表示されるので、利用者は、電源の消し忘れが生じていなければ削減できた消費電力量を知ることができる。  In the improvementinformation display area 203, improvement information for each facility is displayed. In other words, the improvementinformation display area 203 displays the total amount of power consumption caused by forgetting to turn off the power supply during the period from the start of measurement to the present time. If there is no forgetting to turn off, it is possible to know the power consumption that can be reduced.

第1画面200において、評価結果表示領域202に表示された複数の年のうち1つの年が表示された領域をタップすると、タップされた領域に表示された年を指定年とする第2画面300へと画面が遷移する。つまり、情報端末30の表示部31が第1画面200を表示している場合に特定の年が表示された領域がタップされると、表示制御部102は、タップされた領域に表示された年を指定年とする第2画面300を作成し、表示部31に表示する。例えば、図3に示す第1画面200において、“2017年”が表示された領域210がタップされると、指定年を2017年とする第2画面300が生成される。  In thefirst screen 200, when a region where one year is displayed among a plurality of years displayed in the evaluationresult display region 202 is tapped, thesecond screen 300 is displayed in which the year displayed in the tapped region is the designated year. The screen changes. In other words, when thedisplay unit 31 of theinformation terminal 30 displays thefirst screen 200 and a region where a specific year is displayed is tapped, the display control unit 102 displays the year displayed in the tapped region. Is created on thedisplay unit 31. For example, on thefirst screen 200 shown in FIG. 3, when thearea 210 displaying “2017” is tapped, thesecond screen 300 having the designated year 2017 is generated.

また、第1画面200において、評価結果表示領域202に表示された複数の月のうち1つの月が表示された領域をタップすると、タップされた領域に表示された月を指定月とする第3画面400へと画面が遷移する。つまり、情報端末30の表示部31が第1画面200を表示している場合に特定の月が表示された領域がタップされると、表示制御部102は、タップされた領域に表示された月を指定月とする第3画面400を作成し、表示部31に表示する。例えば、図3に示す第1画面200において、“2017年2月”が表示された領域211がタップされると、指定月を2017年2月とする第3画面400が生成される。  In addition, when a region where one month is displayed among a plurality of months displayed in the evaluationresult display region 202 on thefirst screen 200 is tapped, the month displayed in the tapped region is set as a designated month. The screen transitions to thescreen 400. That is, when thedisplay unit 31 of theinformation terminal 30 displays thefirst screen 200 and the area where the specific month is displayed is tapped, the display control unit 102 displays the month displayed in the tapped area. Athird screen 400 with the designated month is created and displayed on thedisplay unit 31. For example, on thefirst screen 200 shown in FIG. 3, when thearea 211 displaying “February 2017” is tapped, thethird screen 400 having the designated month as February 2017 is generated.

(4.2)第2画面
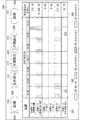
本実施形態の第2画面300は、図4に示すように、設備表示領域301、評価結果表示領域302、改善情報表示領域303、第1ボタン表示領域304、第2ボタン表示領域305及び第3ボタン表示領域306を含んでいる。
(4.2) Second Screen As shown in FIG. 4, thesecond screen 300 of the present embodiment includes anequipment display area 301, an evaluationresult display area 302, an improvementinformation display area 303, a firstbutton display area 304, A two-button display area 305 and a thirdbutton display area 306 are included.

設備表示領域301には、計測対象の設備に係る情報が表示される。本実施形態では、設備の識別情報及び名称が表示される。  In theequipment display area 301, information related to the equipment to be measured is displayed. In this embodiment, the identification information and name of equipment are displayed.

評価結果表示領域302には、指定された年における月ごとの評価結果が時系列に並んで表示される。図4では、2017年を指定年として、2017年の各月の評価結果が表示されている。各月の評価結果は、表示制御部102が決定した表示色で表示される。上述したように、第2画面300で表示される各月は、3つの期間(第1〜第3期間)に分割される。第1期間を上旬、第2期間を中旬、第3期間を下旬とした場合に、識別情報が[回路1−1]である設備では、2017年9月の下旬において電源の消し忘れが4日以下あったことが評価結果として表示される。  In the evaluationresult display area 302, the evaluation results for each month in the designated year are displayed in time series. In FIG. 4, the evaluation results for each month of 2017 are displayed with 2017 as the designated year. The evaluation result for each month is displayed in the display color determined by the display control unit 102. As described above, each month displayed on thesecond screen 300 is divided into three periods (first to third periods). In the case where the first period is the beginning, the second period is the middle, and the third period is the end, the equipment whose identification information is [Circuit 1-1] will forget to turn off the power in the end of September 2017. The following is displayed as an evaluation result.

改善情報表示領域303には、設備ごとの改善情報が表示される。つまり、改善情報表示領域303には、指定された年において、電源の消し忘れがあったために生じた消費電力量の合計値が表示されるので、利用者は、指定された年において電源の消し忘れが生じていなければ削減できた消費電力量を知ることができる。  In the improvementinformation display area 303, improvement information for each facility is displayed. In other words, the improvementinformation display area 303 displays the total amount of power consumption caused by forgetting to turn off the power in the specified year, so that the user can turn off the power in the specified year. If no forgetting has occurred, the amount of power consumption that can be reduced can be known.

第1ボタン表示領域304には、指定年を前年に変更するためのボタン310が表示される。ボタン310がタップされると、現在表示されている第2画面300の指定年を前年に変更した第2画面300が表示される。例えば、図4では、指定年として2017年が指定されている。このとき、ボタン310がタップされると、指定年を2016年とする第2画面300へと画面が遷移する。  In the firstbutton display area 304, abutton 310 for changing the designated year to the previous year is displayed. When thebutton 310 is tapped, thesecond screen 300 in which the designated year of the currently displayedsecond screen 300 is changed to the previous year is displayed. For example, in FIG. 4, 2017 is designated as the designated year. At this time, when thebutton 310 is tapped, the screen transitions to thesecond screen 300 in which the designated year is 2016.

第2ボタン表示領域305には、指定年を翌年に変更するためのボタン311が表示される。ボタン311がタップされると、現在表示されている第2画面300の指定年を翌年に変更した第2画面300が表示される。例えば、図4では、指定年として2017年が指定されている。このとき、ボタン311がタップされると、指定年を2018年とする第2画面300へと画面が遷移する。  In the secondbutton display area 305, abutton 311 for changing the designated year to the next year is displayed. When thebutton 311 is tapped, thesecond screen 300 in which the designated year of the currently displayedsecond screen 300 is changed to the next year is displayed. For example, in FIG. 4, 2017 is designated as the designated year. At this time, when thebutton 311 is tapped, the screen transitions to thesecond screen 300 in which the designated year is 2018.

第3ボタン表示領域306には、第1画面200へと画面遷移するためのボタン312が表示される。ボタン312がタップされると、現在表示されている第2画面300から第1画面200へと画面が遷移する。  In the thirdbutton display area 306, abutton 312 for transitioning to thefirst screen 200 is displayed. When thebutton 312 is tapped, the screen changes from the currently displayedsecond screen 300 to thefirst screen 200.

また、第2画面300において、評価結果表示領域302に表示された複数の月のうち1つの月が表示された領域をタップすると、タップされた領域に表示された月を指定月とする第3画面400へと画面が遷移する。例えば、図4に示す第2画面300において、“2017年2月”が表示された領域321がタップされると、指定月を2017年2月とする第3画面400が生成される。  In addition, when a region where one month is displayed among the plurality of months displayed in the evaluationresult display region 302 on thesecond screen 300, the month displayed in the tapped region is set as the designated month. The screen transitions to thescreen 400. For example, on thesecond screen 300 shown in FIG. 4, when anarea 321 in which “February 2017” is displayed is tapped, athird screen 400 in which the designated month is February 2017 is generated.

(4.3)第3画面
本実施形態の第3画面400は、図5に示すように、設備表示領域401、評価結果表示領域402、改善情報表示領域403、第1ボタン表示領域404、第2ボタン表示領域405、第3ボタン表示領域406及び第4ボタン表示領域407を含んでいる。
(4.3) Third Screen As shown in FIG. 5, thethird screen 400 of the present embodiment includes anequipment display area 401, an evaluationresult display area 402, an improvementinformation display area 403, a firstbutton display area 404, A two-button display area 405, a thirdbutton display area 406, and a fourthbutton display area 407 are included.

設備表示領域401には、計測対象の設備に係る情報が表示される。本実施形態では、設備の識別情報及び名称が表示される。  In theequipment display area 401, information related to the equipment to be measured is displayed. In this embodiment, the identification information and name of equipment are displayed.

評価結果表示領域402には、指定された月における日ごとの評価結果が時系列に並んで表示される。図5では、2017年2月を指定月として、2017年2月の日ごとの評価結果が表示されている。日ごとの評価結果は、表示制御部102が決定した表示色で表示される。例えば、識別情報が[回路3−3]である設備では、2017年2月6日において電源の消し忘れがあったことが評価結果として表示される。  In the evaluationresult display area 402, the evaluation results for each day in the designated month are displayed in time series. In FIG. 5, the evaluation results for each day of February 2017 are displayed with February 2017 as the designated month. The evaluation result for each day is displayed in the display color determined by the display control unit 102. For example, in the equipment whose identification information is [Circuit 3-3], it is displayed as an evaluation result that the user forgot to turn off the power on February 6, 2017.

改善情報表示領域403には、設備ごとの改善情報が表示される。つまり、改善情報表示領域403には、指定された月において、電源の消し忘れがあったために生じた消費電力量の合計値が表示されるので、利用者は、指定された月において電源の消し忘れが生じていなければ削減できた消費電力量を知ることができる。  In the improvementinformation display area 403, improvement information for each facility is displayed. In other words, the improvementinformation display area 403 displays the total value of the power consumption that occurs because the power is forgotten to be turned off in the specified month, so that the user can turn off the power in the specified month. If no forgetting has occurred, the amount of power consumption that can be reduced can be known.

第1ボタン表示領域404には、指定月を前月に変更するためのボタン410が表示される。ボタン410がタップされると、現在表示されている第3画面400の指定月を前月に変更した第3画面400が表示される。例えば、図5では、指定月として2017年2月が指定されている。このとき、ボタン410がタップされると、指定月を2017年1月とする第3画面400へと画面が遷移する。  In the firstbutton display area 404, abutton 410 for changing the designated month to the previous month is displayed. Whenbutton 410 is tapped, athird screen 400 is displayed in which the designated month of the currently displayedthird screen 400 is changed to the previous month. For example, in FIG. 5, February 2017 is designated as the designated month. At this time, when thebutton 410 is tapped, the screen transitions to thethird screen 400 in which the designated month is January 2017.

第2ボタン表示領域405には、指定月を翌月に変更するためのボタン411が表示される。ボタン411がタップされると、現在表示されている第3画面400の指定月を翌月に変更した第3画面400が表示される。例えば、図5では、指定月として2017年2月が指定されている。このとき、ボタン411がタップされると、指定月を2017年3月とする第3画面400へと画面が遷移する。  In the secondbutton display area 405, abutton 411 for changing the designated month to the next month is displayed. When thebutton 411 is tapped, thethird screen 400 in which the designated month of the currently displayedthird screen 400 is changed to the next month is displayed. For example, in FIG. 5, February 2017 is designated as the designated month. At this time, when thebutton 411 is tapped, the screen transitions to thethird screen 400 in which the designated month is March 2017.

第3ボタン表示領域406には、第1画面200へと画面遷移するためのボタン412が表示される。ボタン412がタップされると、現在表示されている第3画面400から第1画面200へと画面が遷移する。  In the thirdbutton display area 406, abutton 412 for transitioning to thefirst screen 200 is displayed. When thebutton 412 is tapped, the screen transitions from the currently displayedthird screen 400 to thefirst screen 200.

第4ボタン表示領域407には、第2画面300へと画面遷移するためのボタン413が表示される。ボタン413がタップされると、現在表示されている第3画面400から第2画面300へと画面遷移する。例えば、図5では、指定月として2017年2月が指定されている。このとき、ボタン413がタップされると、第3画面400の指定月を含む年である2017年を指定年とする第2画面300へと画面が遷移する。  In the fourthbutton display area 407, abutton 413 for transitioning to thesecond screen 300 is displayed. When thebutton 413 is tapped, the screen transitions from the currently displayedthird screen 400 to thesecond screen 300. For example, in FIG. 5, February 2017 is designated as the designated month. At this time, when thebutton 413 is tapped, the screen transitions to thesecond screen 300 having the specified year 2017 as the year including the specified month on thethird screen 400.

第3画面400において、評価結果表示領域402に表示された複数の日のうち1つの日が表示された領域をタップすると、タップされた領域に表示された日を1週間の開始日とする第4画面500へと画面が遷移する。例えば、図5に示す第3画面400において、“1日”が表示された領域421がタップされると、2月1日を1週間の開始日とする第4画面500が生成される。  In thethird screen 400, when a region where one day is displayed among a plurality of days displayed in the evaluationresult display region 402 is tapped, the day displayed in the tapped region is set as the start date of one week. The screen transitions to fourscreens 500. For example, on thethird screen 400 shown in FIG. 5, when anarea 421 displaying “1 day” is tapped, afourth screen 500 is generated with February 1 as the start date of one week.

また、第3画面400において、評価結果表示領域402のうち、特定の設備の評価結果が表示されている領域内をタップすると、当該設備に対する第5画面600へと画面が遷移する。例えば、図5に示す第3画面400において、識別情報が[回路3−3]である設備の評価結果が表示されている領域422内がタップされると、第3画面400から識別情報が[回路3−3]である設備に対する第5画面600へと画面が遷移する。  On thethird screen 400, when an area in the evaluationresult display area 402 where the evaluation result of a specific facility is displayed is tapped, the screen transitions to thefifth screen 600 for the facility. For example, in thethird screen 400 shown in FIG. 5, when thearea 422 in which the evaluation result of the equipment whose identification information is [Circuit 3-3] is displayed is tapped, the identification information is displayed on thethird screen 400 as [ The screen transits to thefifth screen 600 for the equipment that is the circuit 3-3].

(4.4)第4画面
本実施形態の第4画面500は、図6に示すように、設備表示領域501、評価結果表示領域502、改善情報表示領域503、第1ボタン表示領域504、第2ボタン表示領域505、第3ボタン表示領域506、第4ボタン表示領域507及び第5ボタン表示領域508を含んでいる。
(4.4) Fourth Screen As shown in FIG. 6, thefourth screen 500 of the present embodiment includes anequipment display area 501, an evaluationresult display area 502, an improvementinformation display area 503, a firstbutton display area 504, and a fourth screen. A two-button display area 505, a thirdbutton display area 506, a fourthbutton display area 507, and a fifth button display area 508 are included.

設備表示領域501には、計測対象の設備に係る情報が表示される。本実施形態では、設備の識別情報及び名称が表示される。  In thefacility display area 501, information related to the facility to be measured is displayed. In this embodiment, the identification information and name of equipment are displayed.

評価結果表示領域502には、指定された週における日ごとの評価結果が時系列に並んで表示される。図6では、2017年2月1日を週の開始日として、1週間の日ごとの評価結果が表示されている。日ごとの評価結果は、表示制御部102が決定した表示色で表示される。例えば、識別情報が[回路3−3]である設備では、2017年2月1日において設備が稼働状態とみなす期間において消費電力が基準電力より1.5倍未満の時間帯と、2.0倍に未満の時間帯とがあったことが評価結果として表示される。  In the evaluationresult display area 502, the evaluation results for each day in the designated week are displayed in time series. In FIG. 6, the evaluation results for each day of the week are displayed with February 1, 2017 as the start date of the week. The evaluation result for each day is displayed in the display color determined by the display control unit 102. For example, in the facility whose identification information is [Circuit 3-3], the power consumption is less than 1.5 times the reference power in the period when the facility is considered to be in operation on February 1, 2017, and 2.0 It is displayed as an evaluation result that there was a time zone less than double.

なお、上述したように、表示制御部102は、非稼働状態とみなされる期間における1時間ごとの消費電力量に対する評価結果の表示色を決定している。図5では、紙面の都合上、非稼働状態とみなされる期間において同一評価が継続する場合には継続する期間を1つの表示表域として扱っている。  Note that, as described above, the display control unit 102 determines the display color of the evaluation result for the hourly power consumption during the period considered to be the non-operating state. In FIG. 5, for the convenience of space, when the same evaluation continues in a period that is regarded as a non-operating state, the continuous period is treated as one display table area.

改善情報表示領域503には、設備ごとの改善情報が表示される。つまり、改善情報表示領域503には、指定された週において、電源の消し忘れがあったために生じた消費電力量の合計値が表示されるので、利用者は、指定された週において電源の消し忘れが生じていなければ削減できた消費電力量を知ることができる。  In the improvementinformation display area 503, improvement information for each facility is displayed. That is, the improvementinformation display area 503 displays the total amount of power consumption caused by forgetting to turn off the power in the designated week, so that the user can turn off the power in the designated week. If no forgetting has occurred, the amount of power consumption that can be reduced can be known.

第1ボタン表示領域504には、指定週を前週に変更するためのボタン510が表示される。ボタン510がタップされると、現在表示されている第4画面500の指定週を前週に変更した第4画面500が表示される。例えば、図6では、指定週として2017年2月1日から2月7日までの1週間が指定されている。このとき、ボタン510がタップされると、指定週を2017年1月25日から1月31日までの1週間を指定週とする第4画面500へと画面が遷移する。  In the firstbutton display area 504, abutton 510 for changing the designated week to the previous week is displayed. When thebutton 510 is tapped, afourth screen 500 in which the designated week of the currently displayedfourth screen 500 is changed to the previous week is displayed. For example, in FIG. 6, one week from February 1, 2017 to February 7, 2017 is designated as the designated week. At this time, when thebutton 510 is tapped, the screen transitions to thefourth screen 500 in which the designated week is one week from January 25, 2017 to January 31, 2017.

第2ボタン表示領域505には、指定週を翌週に変更するためのボタン511が表示される。ボタン511がタップされると、現在表示されている第4画面500の指定月を翌週変更した第4画面500が表示される。例えば、図6では、指定週として2017年2月1日から2月7日までの1週間が指定されている。このとき、ボタン511がタップされると、指定週を2017年2月8日から2月14日までの1週間を指定週とする第4画面500へと画面が遷移する。  In the secondbutton display area 505, abutton 511 for changing the designated week to the next week is displayed. When thebutton 511 is tapped, thefourth screen 500 in which the designated month of the currently displayedfourth screen 500 is changed to the next week is displayed. For example, in FIG. 6, one week from February 1, 2017 to February 7, 2017 is designated as the designated week. At this time, when thebutton 511 is tapped, the screen transitions to thefourth screen 500 in which the designated week is one week from February 8, 2017 to February 14, 2017.

第3ボタン表示領域506には、第1画面200へと画面遷移するためのボタン512が表示される。ボタン512がタップされると、現在表示されている第4画面500から第1画面200へと画面が遷移する。  In the thirdbutton display area 506, abutton 512 for transitioning to thefirst screen 200 is displayed. When thebutton 512 is tapped, the screen transitions from the currently displayedfourth screen 500 to thefirst screen 200.

第4ボタン表示領域507には、第2画面300へと画面遷移するためのボタン513が表示される。ボタン513がタップされると、現在表示されている第4画面500から第2画面300へと画面遷移する。例えば、図6では、指定週として2017年2月1日から2月7日までの1週間が指定されている。このとき、ボタン513がタップされると、第4画面500の指定週を含む年である2017年を指定年とする第2画面300へと画面が遷移する。  In the fourthbutton display area 507, abutton 513 for transitioning to thesecond screen 300 is displayed. When thebutton 513 is tapped, the screen transitions from the currently displayedfourth screen 500 to thesecond screen 300. For example, in FIG. 6, one week from February 1, 2017 to February 7, 2017 is designated as the designated week. At this time, when thebutton 513 is tapped, the screen transitions to thesecond screen 300 having the specified year 2017 as the year including the specified week on thefourth screen 500.

また、第4画面500において、評価結果表示領域402内において特定の設備の評価結果が表示されている領域のうち特定の日の評価結果が表示されている領域内をタップすると、当該設備に対する第6画面700へと画面が遷移する。例えば、図6に示す第4画面500において、識別情報が[回路3−3]である設備の評価結果が表示されている領域521のうち2月6日の評価結果が表示されている領域522内がタップされると、第4画面500から識別情報が[回路3−3]である設備の2月6日に対する第6画面700へと画面が遷移する。  In addition, on thefourth screen 500, when an area in which an evaluation result of a specific day is displayed in an area in which an evaluation result of a specific facility is displayed in the evaluationresult display area 402 is displayed, The screen changes to 6screen 700. For example, in thefourth screen 500 shown in FIG. 6, thearea 522 in which the evaluation result of February 6 is displayed in thearea 521 in which the evaluation result of the facility whose identification information is [Circuit 3-3] is displayed. When the inside is tapped, the screen transitions from thefourth screen 500 to thesixth screen 700 for February 6 of the facility whose identification information is [Circuit 3-3].

(4.5)第5画面
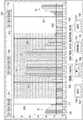
本実施形態の第5画面600は、図7に示すように、評価結果表示領域601、月選択表示領域602、改善情報表示領域603、閾値表示領域604、非稼働時間帯表示領域605、第1ボタン表示領域606、第2ボタン表示領域607、第3ボタン表示領域608及び第4ボタン表示領域609を含んでいる。
(4.5) Fifth Screen As shown in FIG. 7, thefifth screen 600 of the present embodiment is an evaluationresult display area 601, a monthselection display area 602, an improvement information display area 603, athreshold display area 604, and a non-operation. A time zone display area 605, a firstbutton display area 606, a secondbutton display area 607, a thirdbutton display area 608 and a fourthbutton display area 609 are included.

評価結果表示領域601は、特定の設備の指定された月における評価結果及び計測結果を表示する領域である。評価結果表示領域601は、設備表示領域610及びグラフ表示領域611を有している。  The evaluationresult display area 601 is an area for displaying an evaluation result and a measurement result in a specified month of a specific facility. The evaluationresult display area 601 has anequipment display area 610 and agraph display area 611.

設備表示領域610には、指定された設備に係る情報が表示される。  In theequipment display area 610, information related to the designated equipment is displayed.

グラフ表示領域611には、カレンダ形式で、指定された月の日ごとの電力グラフG1が表示される。グラフ表示領域611には、電力グラフG1が表示される際に、非稼働状態とみなされる開始時刻を表す第1線分630、終了時刻を表す第2線分631及び基準電力を表す第3線分632も表示される。なお、図7では、第1線分630、第2線分ン631及び第3線分632は、破線で表されているが、この線種は一例であり、線種を破線に限定する趣旨ではない。  In thegraph display area 611, a power graph G1 for each day of the specified month is displayed in a calendar format. In thegraph display area 611, when the power graph G1 is displayed, afirst line segment 630 representing a start time considered as a non-operating state, asecond line segment 631 representing an end time, and a third line representing a reference power. Aminute 632 is also displayed. In FIG. 7, thefirst line segment 630, thesecond line segment 631, and thethird line segment 632 are represented by broken lines, but this line type is an example, and the line type is limited to the broken line. is not.

また、グラフ表示領域611で表示される日ごとの電力グラフG1の背景色は、表示制御部102が決定した表示色で表示される。非稼働状態とみなされる期間において、計測された消費電力量が基準電力を超えている場合には、その日の電力グラフG1の背景色は黄色になる。例えば、2月6日では、非稼働状態とみなされる期間において消費電力量が基準電力を超えているので、電力グラフG1の背景色は黄色になる。  The background color of the daily power graph G1 displayed in thegraph display area 611 is displayed in the display color determined by the display control unit 102. When the measured power consumption exceeds the reference power during the period considered as the non-operating state, the background color of the power graph G1 for that day is yellow. For example, on February 6, the background color of the power graph G1 is yellow because the amount of power consumption exceeds the reference power during the period considered to be a non-operating state.

また、電力グラフG1は、設備が稼働状態であるとみなされる期間(第2線分631から次の非稼働状態の開始時刻を表す第1線分630までの期間)におけるグラフの色と、他の期間(0時から第2線分631で表される時刻までの期間、第1線分630で表される時刻から0時までの期間)におけるグラフの色とが異なるように、表示制御部102はグラフの色を決定してもよい。  In addition, the power graph G1 includes the color of the graph in the period (the period from thesecond line segment 631 to thefirst line segment 630 representing the start time of the next non-operational state) in which the facility is considered to be in operation, and the like. Display control unit so that the color of the graph is different in the period (the period from 0:00 to the time represented by thesecond line segment 631, the period from the time represented by thefirst line segment 630 to 0:00) 102 may determine the color of the graph.

月選択表示領域602は、第5画面600として表示する際の指定月を“年月”で表示される。また、月選択表示領域602には、プルダウンボタン641,642が表示されている。プルダウンボタン641,642を用いて、指定月を“年月”で選択することが可能となる。  In the monthselection display area 602, the designated month when displayed as thefifth screen 600 is displayed as “year and month”. In the monthselection display area 602, pull-downbuttons 641 and 642 are displayed. Using the pull-downbuttons 641 and 642, the designated month can be selected as “year / month”.

改善情報表示領域603には、指定された設備の指定された月の改善情報が表示される。つまり、改善情報表示領域603には、指定された設備について、指定された月において電源の消し忘れがあったために生じた消費電力量の合計値が表示されるので、利用者は、指定された月において電源の消し忘れが生じていなければ削減できた消費電力量を知ることができる。  In the improvement information display area 603, the improvement information for the specified month of the specified equipment is displayed. That is, the improvement information display area 603 displays the total amount of power consumption caused by forgetting to turn off the power in the specified month for the specified equipment. If the power is not forgotten in the month, the amount of power consumption that can be reduced can be known.

閾値表示領域604には、基準電力が表示される。つまり、第3線分632の値が表示される。非稼働時間帯表示領域605には、指定された設備について非稼働状態とみなされる期間の開始時刻と終了時刻とが表示される。つまり、第1線分630及び第2線分631で表される時刻が表示される。ここでは、22:00〜06:00の期間が非稼働時間帯として設定されている。本実施形態では、非稼働状態とみなされる期間は、開始時刻から翌日の終了時刻までの期間である。例えば、7月1日22:00〜7月2日06:00が非稼働状態とみなされる期間である。  In thethreshold display area 604, the reference power is displayed. That is, the value of thethird line segment 632 is displayed. In the non-operating time zone display area 605, the start time and end time of a period that is regarded as a non-operating state for the specified equipment are displayed. That is, the time represented by thefirst line segment 630 and thesecond line segment 631 is displayed. Here, a period of 22:00 to 06:00 is set as a non-operating time zone. In the present embodiment, the period regarded as the non-operating state is a period from the start time to the end time of the next day. For example, July 1 22: 00 to July 2 06: 00 is a period that is considered as a non-operating state.

第1ボタン表示領域606には、指定月を前月に変更するためのボタン620が表示される。ボタン620がタップされると、現在表示されている第3画面400の指定月を前月に変更した第5画面600が表示される。例えば、図7では、指定月として2015年7月が指定されている。このとき、ボタン620がタップされると、指定月を2017年6月とする第5画面600へと画面が遷移する。  In the firstbutton display area 606, abutton 620 for changing the designated month to the previous month is displayed. When thebutton 620 is tapped, afifth screen 600 is displayed in which the designated month of the currently displayedthird screen 400 is changed to the previous month. For example, in FIG. 7, July 2015 is designated as the designated month. At this time, when thebutton 620 is tapped, the screen transitions to thefifth screen 600 in which the designated month is June 2017.

第2ボタン表示領域607には、指定月を翌月に変更するためのボタン621が表示される。ボタン621がタップされると、現在表示されている第5画面600の指定月を翌月に変更した第5画面600が表示される。例えば、図7では、指定月として2015年7月が指定されている。このとき、ボタン621がタップされると、指定月を2015年8月とする第5画面600へと画面が遷移する。  In the secondbutton display area 607, abutton 621 for changing the designated month to the next month is displayed. When thebutton 621 is tapped, afifth screen 600 in which the designated month of the currently displayedfifth screen 600 is changed to the next month is displayed. For example, in FIG. 7, July 2015 is designated as the designated month. At this time, when thebutton 621 is tapped, the screen transitions to thefifth screen 600 in which the designated month is August 2015.

第3ボタン表示領域608には、第1画面200へと画面遷移するためのボタン622が表示される。ボタン622がタップされると、現在表示されている第5画面600から第1画面200へと画面が遷移する。  In the thirdbutton display area 608, abutton 622 for transitioning to thefirst screen 200 is displayed. When thebutton 622 is tapped, the screen changes from the currently displayedfifth screen 600 to thefirst screen 200.

第4ボタン表示領域609には、第2画面300へと画面遷移するためのボタン623が表示される。ボタン623がタップされると、現在表示されている第5画面600から第2画面300へと画面遷移する。例えば、図7では、指定月として2015年7月が指定されている。このとき、ボタン623がタップされると、第5画面600の指定月を含む年である2015年を指定年とする第2画面300へと画面が遷移する。  In the fourthbutton display area 609, abutton 623 for transitioning to thesecond screen 300 is displayed. When thebutton 623 is tapped, the screen transitions from the currently displayedfifth screen 600 to thesecond screen 300. For example, in FIG. 7, July 2015 is designated as the designated month. At this time, when thebutton 623 is tapped, the screen transitions to thesecond screen 300 having the specified year 2015 as the year including the specified month on thefifth screen 600.

また、第5画面600において、評価結果表示領域601で表示される複数の電力グラフG1のうち1つの電力グラフG1が表示された領域をタップすると、タップされた電力グラフに対応する日と指定日とする第6画面700へと画面が遷移する。例えば、図6に示す第5画面600において、7月7日に対応する電力グラフG1が表示されている領域をタップすると、識別情報が[回路3−3]である設備について7月7日を指定日とする第6画面700が作成される。  On thefifth screen 600, when a region where one power graph G1 is displayed among the plurality of power graphs G1 displayed in the evaluationresult display region 601 is tapped, a date corresponding to the tapped power graph and a designated date are displayed. The screen transitions to thesixth screen 700. For example, on thefifth screen 600 shown in FIG. 6, when an area where the power graph G1 corresponding to July 7 is displayed is tapped, July 7 is set for the equipment whose identification information is [Circuit 3-3]. Asixth screen 700 with the specified date is created.

(4.6)第6画面
本実施形態の第6画面700は、図8に示すように、評価結果表示領域701、閾値表示領域702、非稼働時間帯表示領域703、第1ボタン表示領域704、第2ボタン表示領域705、第3ボタン表示領域706及び第4ボタン表示領域707を含んでいる。
(4.6) Sixth Screen As shown in FIG. 8, thesixth screen 700 of the present embodiment has an evaluationresult display area 701, athreshold display area 702, a non-working time zone display area 703, and a firstbutton display area 704. , A secondbutton display area 705, a third button display area 706, and a fourthbutton display area 707.

評価結果表示領域701は、特定の設備の指定された日における評価結果及び計測結果を表示する領域である。評価結果表示領域701は、対象日表示領域710及びグラフ表示領域711を有している。  The evaluationresult display area 701 is an area for displaying an evaluation result and a measurement result on a specified date of a specific facility. The evaluationresult display area 701 has a targetdate display area 710 and agraph display area 711.

対象日表示領域710は、指定日表示領域720、前日表示領域721及び翌日表示領域722を有する。指定日表示領域720には指定日が、前日表示領域721には指定日の前日が、翌日表示領域722には指定日の翌日が、それぞれ表示される。  The targetdate display area 710 includes a designated date display area 720, a previousday display area 721, and a next day display area 722. The specified date is displayed in the specified date display area 720, the previous day of the specified date is displayed in the previousday display area 721, and the next day of the specified date is displayed in the next day display area 722.

グラフ表示領域611には、指定日の電力グラフG1が指定日表示領域720で表示された指定日に対応するように表示される。グラフ表示領域611には、指定日の前日における電力グラフG1のうち少なくとも非稼働状態とみなされる開始時刻以降の電力グラフG1が表示される。さらに、グラフ表示領域611には、指定日の翌日における電力グラフG1のうち少なくとも非稼働状態とみなされる終了時刻までの電力グラフG1が表示される。  In thegraph display area 611, the power graph G1 on the specified date is displayed so as to correspond to the specified date displayed in the specified date display area 720. In thegraph display area 611, at least the power graph G1 after the start time regarded as the non-operating state is displayed in the power graph G1 on the day before the specified date. Furthermore, in thegraph display area 611, the power graph G1 up to the end time considered to be at least the non-operating state is displayed in the power graph G1 on the next day of the specified date.

また、グラフ表示領域611には、指定日の前日及び指定日に対する第1線分630が表示される。グラフ表示領域611には、指定日及び指定日の翌日に対する第2線分631が表示される。さらに、グラフ表示領域611には、第3線分632が表示される。なお、図8では、第1線分630、第2線分631及び第3線分632は、破線で表されているが、この線種は一例であり、線種を破線に限定する趣旨ではない。  In thegraph display area 611, the day before the specified date and thefirst line segment 630 for the specified date are displayed. In thegraph display area 611, thesecond line segment 631 for the specified date and the next day of the specified date is displayed. Further, athird line segment 632 is displayed in thegraph display area 611. In FIG. 8, thefirst line segment 630, thesecond line segment 631, and thethird line segment 632 are represented by broken lines. However, this line type is an example, and the line type is limited to the broken line. Absent.

また、第6画面700における電力グラフG1は、設備が稼働状態であるとみなされる期間におけるグラフの色と、他の期間(0時から第2線分で表される時刻までの期間、第1線分で表される時刻から0時までの期間)におけるグラフの色とが異なるように、表示制御部102はグラフの色を決定してもよい。  In addition, the power graph G1 on thesixth screen 700 includes the color of the graph in the period in which the facility is considered to be operating, the other period (the period from 0:00 to the time represented by the second line segment, the first The display control unit 102 may determine the color of the graph so that the color of the graph in the period from the time represented by the line segment to 0:00) is different.

本実施形態では、非稼働の状態とみなされる期間は、22:00〜06:00であるので、指定日における非稼働の状態とみなされる期間は、前日の22:00から継続している期間と、指定日の22:00から翌日に継続する期間の2つの期間がある。そこで、図8に示すように、指定日に対する電力グラフG1を表示する際に、指定日の前後についても表示することで、これら2つの期間における消費電力量の推移を利用者は知ることができる。  In the present embodiment, since the period considered to be a non-operating state is 22:00 to 06:00, the period considered to be a non-operating state on the specified date is a period continuing from 22:00 on the previous day. Then, there are two periods from 22:00 on the designated date to the next day. Therefore, as shown in FIG. 8, when displaying the power graph G1 for the specified date, the user can know the transition of the power consumption amount in these two periods by displaying also before and after the specified date. .

また、グラフ表示領域611で表示される指定日の電力グラフG1の背景色は、表示制御部102が決定した表示色で表示される。非稼働状態とみなされる期間において、計測された消費電力量が基準電力を超えている場合には、その日の電力グラフG1の背景色は黄色になる。図8では、22:00以降で計測された消費電力が基準電力を超えているので、指定日における電力グラフG1の背景色は、黄色になる。  In addition, the background color of the power graph G1 on the specified date displayed in thegraph display area 611 is displayed in the display color determined by the display control unit 102. When the measured power consumption exceeds the reference power during the period considered as the non-operating state, the background color of the power graph G1 for that day is yellow. In FIG. 8, since the power consumption measured after 22:00 exceeds the reference power, the background color of the power graph G1 on the designated date is yellow.

第1ボタン表示領域704には、指定日を前日に変更するためのボタン730が表示される。ボタン730がタップされると、現在表示されている第6画面700の指定日を前日に変更した第6画面700が表示される。例えば、図8では、指定日として2015年7月7日が指定されている。このとき、ボタン730がタップされると、指定日を2017年7月6日とする第6画面700へと画面が遷移する。  In the firstbutton display area 704, abutton 730 for changing the designated date to the previous day is displayed. Whenbutton 730 is tapped, asixth screen 700 is displayed in which the designated date of the currently displayedsixth screen 700 is changed to the previous day. For example, in FIG. 8, July 7, 2015 is designated as the designated date. At this time, when thebutton 730 is tapped, the screen transitions to asixth screen 700 in which the designated date is July 6, 2017.

第2ボタン表示領域705には、指定日を翌日に変更するためのボタン731が表示される。ボタン731がタップされると、現在表示されている第6画面700の指定日を翌日に変更した第6画面700が表示される。例えば、図8では、指定日として2015年7月7日が指定されている。このとき、ボタン731がタップされると、指定日を2015年7月8日とする第6画面700へと画面が遷移する。  In the secondbutton display area 705, abutton 731 for changing the designated date to the next day is displayed. When thebutton 731 is tapped, asixth screen 700 in which the designated date of the currently displayedsixth screen 700 is changed to the next day is displayed. For example, in FIG. 8, July 7, 2015 is designated as the designated date. At this time, when thebutton 731 is tapped, the screen transitions to asixth screen 700 in which the designated date is July 8, 2015.

第3ボタン表示領域706には、第5画面600へと画面遷移するためのボタン732が表示される。ボタン732がタップされると、現在表示されている第6画面700から第5画面600へと画面が遷移する。例えば、図8では、指定日として2015年7月7日が指定されている。このとき、ボタン732がタップされると、第6画面700の指定日を含む月である2015年7月を指定月とする第5画面600へと画面が遷移する。  In the third button display area 706, abutton 732 for transitioning to thefifth screen 600 is displayed. Whenbutton 732 is tapped, the screen transitions from the currently displayedsixth screen 700 tofifth screen 600. For example, in FIG. 8, July 7, 2015 is designated as the designated date. At this time, when thebutton 732 is tapped, the screen transitions to thefifth screen 600 in which July 2015, which is the month including the designated date on thesixth screen 700, is designated.

第4ボタン表示領域707には、第4画面500へと画面遷移するためのボタン733が表示される。ボタン733がタップされると、現在表示されている第6画面700から第4画面500へと画面遷移する。例えば、図8では、指定日として2015年7月7日が指定されている。このとき、ボタン733がタップされると、第6画面700の指定日を開始日とする1週間に対する第4画面500へと画面が遷移する。なお、ボタン733がタップされた場合、第4画面500においてすべての設備を表示する代わりに特定の設備のみについて表示してもよい。  In the fourthbutton display area 707, abutton 733 for transitioning to thefourth screen 500 is displayed. When thebutton 733 is tapped, the screen transitions from thesixth screen 700 currently displayed to thefourth screen 500. For example, in FIG. 8, July 7, 2015 is designated as the designated date. At this time, when thebutton 733 is tapped, the screen transitions to thefourth screen 500 for one week starting from the designated date of thesixth screen 700. When thebutton 733 is tapped, only specific equipment may be displayed instead of displaying all equipment on thefourth screen 500.

(5)変形例
以下に、変形例について列記する。なお、以下に説明する変形例は、上記実施形態と適宜組み合わせて適用可能である。
(5) Modifications Modifications are listed below. Note that the modifications described below can be applied in appropriate combination with the above embodiment.

上記実施形態では、表示制御部102は、情報端末3の表示部31に表示する画面(第1画面200〜第6画面700)を作成する構成としたが、この構成に限定されない。表示制御部102は、情報端末3に所望の表示画面を表示させるための画面情報を作成してもよい。例えば、情報端末3が表示画面を表示するためのアプリケーションを有していれば、画面情報はアプリケーションと共同して表示画面を表示するためのデータであってもよい。また例えば、情報端末3のアプリケーションが表示画面の画像データの全てを有していれば、画面情報は、画像データにより表示画面を構成するためのデータであってもよい。あるいは、情報端末3のアプリケーションが表示画面の画像データの一部を有していれば、画面情報は、画像データの残りの部分であってもよい。  In the above embodiment, the display control unit 102 is configured to create a screen (first screen 200 to sixth screen 700) to be displayed on thedisplay unit 31 of theinformation terminal 3, but is not limited to this configuration. The display control unit 102 may create screen information for causing theinformation terminal 3 to display a desired display screen. For example, if theinformation terminal 3 has an application for displaying the display screen, the screen information may be data for displaying the display screen in cooperation with the application. Further, for example, if the application of theinformation terminal 3 has all the image data of the display screen, the screen information may be data for configuring the display screen with the image data. Alternatively, if the application of theinformation terminal 3 has a part of the image data of the display screen, the screen information may be the remaining part of the image data.

上記実施形態において、電力グラフG1は、折れ線グラフとして表示されてもよい。  In the above embodiment, the power graph G1 may be displayed as a line graph.

上記実施形態では、施設5には複数のコントローラ21が設けられる構成としたが、この構成に限定されない。1つのコントローラ21が、施設5に設けられてもよい。つまり、施設5には、1つ以上のコントローラ21が設けられていればよい。  In the said embodiment, although it was set as the structure by which the somecontroller 21 is provided in thefacility 5, it is not limited to this structure. Onecontroller 21 may be provided in thefacility 5. That is, thefacility 5 only needs to be provided with one ormore controllers 21.

上記実施形態では、表示制御装置1と蓄積サーバ2とは個別の装置とする構成としたが、この構成に限定されない。表示制御装置1と蓄積サーバ2とを1つの装置として構成してもよい。  In the above embodiment, thedisplay control device 1 and thestorage server 2 are configured as separate devices, but the present invention is not limited to this configuration. Thedisplay control device 1 and thestorage server 2 may be configured as one device.

上記実施形態では、第5画面600及び第6画面700で表示される電力グラフG1において、稼働状態であるとみなされる期間(時間帯)における消費電力を含めている。しかしながら、第5画面600及び第6画面700で表示される電力グラフG1において、稼働状態であるとみなされる期間(時間帯)における消費電力を含めることは必須ではない。つまり、第5画面600及び第6画面700で表示される電力グラフG1では、少なくとも非稼働状態であるとみなされる期間(時間帯)における消費電力を含んでいればよい。  In the above embodiment, the power graph G1 displayed on thefifth screen 600 and thesixth screen 700 includes the power consumption in the period (time zone) considered to be in the operating state. However, in the power graph G1 displayed on thefifth screen 600 and thesixth screen 700, it is not essential to include power consumption in a period (time zone) that is considered to be in the operating state. That is, the power graph G1 displayed on thefifth screen 600 and thesixth screen 700 only needs to include power consumption in a period (time zone) considered to be at least a non-operating state.

上記実施形態において、電力グラフG1は、設備が稼働状態であるとみなされる期間と他の期間とでグラフの色とが異なるように表示する構成としたが、この構成に限定されない。電力グラフG1は、設備が稼働状態であるとみなされる期間と他の期間とでグラフの色とを同一色として表示してもよい。  In the said embodiment, although it was set as the structure which displays so that the color of a graph may differ in the period when the installation is considered that an installation is an operation state, and another period, it is not limited to this structure. The power graph G1 may display the color of the graph as the same color in a period in which the facility is considered to be in operation and another period.

上記実施形態において、表示制御装置1は、計測された計測値のデータが少ない設備について評価ができない場合、又は開始時刻及び終了時刻が求められない場合には、当該設備の評価ができないことを識別できる色で当該設備の評価結果を表示部31に表示してもよい。  In the above-described embodiment, thedisplay control device 1 identifies that the equipment cannot be evaluated when the equipment with a small amount of measured value data cannot be evaluated, or when the start time and the end time are not obtained. You may display the evaluation result of the said facility on thedisplay part 31 with the color which can be performed.

上記実施形態は、本開示の様々な実施形態の一つに過ぎない。上記実施形態は、本開示の目的を達成できれば、設計等に応じて種々の変更が可能である。また、表示システム10(表示制御装置1)と同様の機能は、表示方法、コンピュータプログラム、又はプログラムを記録した記録媒体等で具現化されてもよい。一態様に係る表示システム10の表示方法は、情報端末3が有する表示部31に情報を表示する方法である。表示方法は、抽出ステップと、表示ステップとを含む。抽出ステップは、施設5における複数の設備(受変電設備61、負荷機器50)の各々について、当該設備で計測された当該設備の電力に関連する電力情報のうち、少なくとも当該設備が非稼働状態とみなされる期間の電力情報を非稼働情報として抽出する。表示ステップは、複数の設備の各々について、非稼働情報に基づいた当該期間における電力使用の評価結果及び非稼働情報で表される電力量のうち節約可能な改善電力量に関連する改善情報を、表示部31に表示させる。一態様に係るプログラムは、コンピュータシステムを、上述した表示方法又は表示システムとして機能させるためのプログラムである。  The above embodiment is only one of various embodiments of the present disclosure. The above embodiment can be variously modified according to the design and the like as long as the object of the present disclosure can be achieved. The functions similar to those of the display system 10 (display control device 1) may be embodied by a display method, a computer program, a recording medium storing the program, or the like. The display method of thedisplay system 10 according to one aspect is a method of displaying information on thedisplay unit 31 included in theinformation terminal 3. The display method includes an extraction step and a display step. In the extraction step, for each of a plurality of facilities (receiving / transformingfacility 61, load device 50) infacility 5, at least the facility is in a non-operating state among power information related to the power of the facility measured by the facility. The power information for the assumed period is extracted as non-operation information. In the display step, for each of the plurality of facilities, the evaluation result of the power use in the period based on the non-operation information and the improvement information related to the improved electric energy that can be saved among the electric energy represented by the non-operation information, It is displayed on thedisplay unit 31. The program which concerns on 1 aspect is a program for functioning a computer system as the display method or display system mentioned above.

本開示における表示システム10(表示制御装置1)又は表示方法の実行主体は、コンピュータシステムを含んでいる。コンピュータシステムは、ハードウェアとしてのプロセッサ及びメモリを有する。コンピュータシステムのメモリに記録されたプログラムをプロセッサが実行することによって、本開示における表示システム10又は表示方法の実行主体としての機能が実現される。プログラムは、コンピュータシステムのメモリに予め記録されていてもよいが、電気通信回線を通じて提供されてもよい。また、プログラムは、コンピュータシステムで読み取り可能なメモリカード、光学ディスク、ハードディスクドライブ等の非一時的な記録媒体に記録されて提供されてもよい。コンピュータシステムのプロセッサは、半導体集積回路(IC)又は大規模集積回路(LSI)を含む1又は複数の電子回路で構成される。複数の電子回路は、1つのチップに集約されていてもよいし、複数のチップに分散して設けられていてもよい。複数のチップは、1つの装置に集約されていてもよいし、複数の装置に分散して設けられていてもよい。  An execution subject of the display system 10 (display control device 1) or the display method in the present disclosure includes a computer system. The computer system has a processor and memory as hardware. When the processor executes the program recorded in the memory of the computer system, a function as an execution subject of thedisplay system 10 or the display method according to the present disclosure is realized. The program may be recorded in advance in the memory of the computer system, but may be provided through a telecommunication line. The program may be provided by being recorded on a non-transitory recording medium such as a memory card, an optical disk, or a hard disk drive that can be read by a computer system. A processor of a computer system includes one or a plurality of electronic circuits including a semiconductor integrated circuit (IC) or a large scale integrated circuit (LSI). The plurality of electronic circuits may be integrated on one chip, or may be distributed on the plurality of chips. The plurality of chips may be integrated into one device, or may be distributed and provided in a plurality of devices.

コンピュータシステムである表示システム10(表示制御装置1)は、1又は複数のコンピュータで構成されるシステムであってもよい。例えば、表示システム10の少なくとも一部の機能は、クラウド(クラウドコンピューティング)によって実現されてもよい。  The display system 10 (display control device 1), which is a computer system, may be a system constituted by one or a plurality of computers. For example, at least a part of the functions of thedisplay system 10 may be realized by cloud (cloud computing).

(まとめ)
以上説明したように、第1の態様の表示方法は、情報端末(30)が有する表示部(31)に情報を表示する方法である。表示方法は、抽出ステップと、表示ステップとを含む。抽出ステップは、施設(5)における複数の設備(受変電設備61、負荷機器50)の各々について、当該設備で計測された当該設備の電力に関連する電力情報のうち、少なくとも当該設備が非稼働状態とみなされる期間の電力情報を非稼働情報として抽出する。表示ステップは、複数の設備の各々について、非稼働情報に基づいた期間における電力使用の評価結果及び非稼働情報で表される電力のうち節約可能な改善電力に関連する改善情報を、表示部(31)に表示させる。
(Summary)
As described above, the display method of the first aspect is a method of displaying information on the display unit (31) included in the information terminal (30). The display method includes an extraction step and a display step. In the extraction step, for each of a plurality of facilities (receiving / transformingfacility 61, load device 50) in facility (5), at least the facility is not operating among power information related to the power of the facility measured by the facility. The power information for the period regarded as a state is extracted as non-operation information. In the display step, for each of the plurality of facilities, the evaluation result of the power usage in the period based on the non-operation information and the improvement information related to the improved power that can be saved among the electric power represented by the non-operation information are displayed on the display unit ( 31).

この表示方法によると、施設(5)の設備が非稼働状態とみなされる期間における電力使用についての評価及び当該期間において節約可能な電力に関する情報を表示する。これにより、利用者は、設備が非稼働状態とみなされる期間における電力使用についての評価及び当該期間において節約可能な電力に関する情報について知ることができる。  According to this display method, the information about the power usage during the period when the facility of the facility (5) is considered to be in the non-operating state and the power that can be saved during the period are displayed. Thereby, the user can know about the evaluation about the electric power use in the period when an installation is considered as a non-operation state, and the information regarding the electric power which can be saved in the said period.

第2の態様の表示方法では、第1の態様において、表示ステップは、非稼働情報で表される電力に対応付けられた色で評価結果を、表示部(31)に表示させる。  In the display method according to the second aspect, in the first aspect, the display step causes the display unit (31) to display the evaluation result in a color associated with the power represented by the non-operation information.

この表示方法によると、評価結果に応じて色を分けて表示するので、利用者は一目で評価結果を認識することができる。  According to this display method, the color is displayed according to the evaluation result, so that the user can recognize the evaluation result at a glance.

第3の態様の表示方法では、第1又は第2の態様において、表示ステップは、評価結果を時系列に並べて表示部(31)に表示させる。  In the display method of the third aspect, in the first or second aspect, the display step displays the evaluation results in time series on the display unit (31).

この表示方法によると、評価結果を時系列に並べて表示部(31)に表示させるので、利用者は、評価結果の時間的推移を知ることができる。  According to this display method, since the evaluation results are displayed in time series on the display unit (31), the user can know the temporal transition of the evaluation results.

第4の態様の表示方法では、第3の態様において、時系列は、年、月及び週のいずれかである。  In the display method of the fourth aspect, in the third aspect, the time series is any one of year, month, and week.

この表示方法によると、年、月及び週のいずれかに応じた時間的推移での評価結果を利用者は知ることができる。  According to this display method, the user can know the evaluation result over time according to any of year, month and week.

第5の態様の表示方法では、第4の態様において、時系列を週及び日のいずれかとして評価結果が表示されている場合に特定の設備に対して表示内容を変更する指示が情報端末(30)で受け付けられる。この場合、表示ステップは、特定の設備における特定月の非稼働情報、又は特定の設備における特定日の非稼働情報を、時間経過に応じた電力グラフ(G1)で表示部(31)に表示させる。  In the display method according to the fifth aspect, in the fourth aspect, when the evaluation result is displayed with the time series as either week or day, an instruction to change the display content for the specific equipment is provided on the information terminal ( 30). In this case, the display step causes the display unit (31) to display the non-operation information of the specific month for the specific facility or the non-operation information for the specific date of the specific facility on the power graph (G1) according to the passage of time. .

この表示方法によると、設備における特定月の非稼働情報、又は特定の設備における特定日の非稼働情報が表す電力についてグラフ形式で、利用者は知ることができる。  According to this display method, the user can know in graph form the power represented by the non-operation information for a specific month in the facility or the non-operation information for the specific day in the specific facility.

第6の態様の表示方法では、第5の態様において、表示ステップは、電力グラフ(G1)を表示部(31)に表示させる場合に、非稼働状態とみなされる期間の開始時刻、当該期間の終了時刻、及び改善電力を求める基準となる基準電力をそれぞれ表す線分(第1線分630〜第3線分632)を、表示部(31)にさらに表示させる。  In the display method according to the sixth aspect, in the fifth aspect, when the display step displays the power graph (G1) on the display unit (31), the start time of the period regarded as the non-operating state, Line segments (first line segment 630 to third line segment 632) respectively representing the end time and the reference power that serves as a reference for obtaining improved power are further displayed on the display unit (31).

この表示方法によると、線分が表示されるので、利用者は、非稼働状態とみなされる期間において、基準電力とグラフ形式で表される電力との比較を容易に行うことができる。  According to this display method, since the line segment is displayed, the user can easily compare the reference power and the power represented in the graph format in the period considered as the non-operating state.

第7の態様の表示方法では、第5又は6の態様において、表示ステップは、期間において、改善電力が存在する場合には、電力グラフ(G1)の背景色に色付けをして電力グラフ(G1)を表示部(31)に表示させる。  In the display method according to the seventh aspect, in the fifth or sixth aspect, when the improved power is present in the period, the display step colors the background color of the power graph (G1) to change the power graph (G1). ) Is displayed on the display unit (31).

この表示方法によると、利用者は、節約可能な電力に関する情報について知ることができる。  According to this display method, the user can know information on power that can be saved.

第8の態様のプログラムは、コンピュータに、第1〜7のいずれかの態様の表示方法を実行させるためのプログラム。  A program according to an eighth aspect is a program for causing a computer to execute the display method according to any one of the first to seventh aspects.

このプログラムによると、利用者は、設備が非稼働状態とみなされる期間における電力使用についての評価及び当該期間において節約可能な電力に関する情報について知ることができる。  According to this program, the user can know about the evaluation about the electric power use in the period when the equipment is regarded as the non-operating state and the information on the power that can be saved in the period.

第9の態様の表示システム(10)は、情報端末(30)が有する表示部(31)に情報を表示するシステムである。表示システム(10)は、抽出部(101)と、表示制御部(102)とを備える。抽出部(101)は、施設(5)における複数の設備(受変電設備61、負荷機器50)の各々について、当該設備で計測された当該設備の電力に関連する電力情報のうち、少なくとも当該設備が非稼働状態とみなされる期間の電力情報を非稼働情報として抽出する。表示制御部(102)は、複数の設備の各々について、非稼働情報に基づいた期間における電力使用の評価結果及び非稼働情報で表される電力のうち節約可能な改善電力に関連する改善情報を、表示部(31)に表示させる。  The display system (10) of the ninth aspect is a system that displays information on the display unit (31) of the information terminal (30). The display system (10) includes an extraction unit (101) and a display control unit (102). For each of a plurality of facilities (receiving / transformingfacility 61, load device 50) in facility (5), the extraction unit (101) includes at least the facility among power information related to the power of the facility measured by the facility. Is extracted as non-operation information during a period in which is considered as a non-operation state. The display control unit (102) displays, for each of the plurality of facilities, improvement information related to power saving evaluation results that can be saved among the power use evaluation results in the period based on the non-operation information and the non-operation information. To be displayed on the display unit (31).

この構成によると、利用者は、設備が非稼働状態とみなされる期間における電力使用についての評価及び当該期間において節約可能な電力に関する情報について知ることができる。  According to this configuration, the user can know the evaluation about the power usage in the period in which the facility is regarded as the non-operating state and the information on the power that can be saved in the period.

1 表示制御装置
3 情報端末
5 施設
10 表示システム
30 情報端末
31 表示部
50 負荷機器(設備)
61 受変電設備(設備)
101 抽出部
102 表示制御部
G1 電力グラフ
DESCRIPTION OFSYMBOLS 1Display control apparatus 3Information terminal 5Facility 10Display system 30Information terminal 31Display part 50 Load apparatus (facility)
61 Substation equipment (equipment)
101 Extraction unit 102 Display control unit G1 Power graph

Claims (9)

Translated fromJapanese
情報端末が有する表示部に情報を表示する表示方法であって、
施設における複数の設備の各々について、当該設備で計測された当該設備の電力に関連する電力情報のうち、少なくとも当該設備が非稼働状態とみなされる期間の電力情報を非稼働情報として抽出する抽出ステップと、
前記複数の設備の各々について、前記非稼働情報に基づいた前記期間における電力使用の評価結果及び前記非稼働情報で表される電力のうち節約可能な改善電力に関連する改善情報を、前記表示部に表示させる表示ステップとを、
含む表示方法。
A display method for displaying information on a display unit of an information terminal,
Extraction step for extracting, as non-operation information, power information for at least a period in which the facility is considered to be non-operating among power information related to the power of the facility measured by the facility for each of a plurality of facilities in the facility When,
For each of the plurality of facilities, the display unit displays an evaluation result of power usage in the period based on the non-operation information and improvement information related to power that can be saved among the electric power represented by the non-operation information. Display steps to be displayed on
Including display method.
前記表示ステップは、
前記非稼働情報で表される電力に対応付けられた色で前記評価結果を、前記表示部に表示させる
請求項1に記載の表示方法。
The display step includes
The display method according to claim 1, wherein the evaluation result is displayed on the display unit in a color associated with the power represented by the non-operation information.
前記表示ステップは、
前記評価結果を時系列に並べて前記表示部に表示させる
請求項1又は2に記載の表示方法。
The display step includes
The display method according to claim 1, wherein the evaluation results are displayed in time series on the display unit.
前記時系列は、年、月及び週のいずれかである
請求項3に記載の表示方法。
The display method according to claim 3, wherein the time series is one of a year, a month, and a week.
前記時系列を週及び日のいずれかとして前記評価結果が表示されている場合に特定の設備に対して表示内容を変更する指示が前記情報端末で受け付けられると、
前記表示ステップは、
前記特定の設備における特定月の前記非稼働情報、又は前記特定の設備における特定日の前記非稼働情報を、時間経過に応じた電力グラフで前記表示部に表示させる
請求項4に記載の表示方法。
When the information terminal receives an instruction to change the display content for specific equipment when the evaluation result is displayed as either the week or the day in the time series,
The display step includes
The display method according to claim 4, wherein the non-operating information for a specific month in the specific facility or the non-operating information for a specific date in the specific facility is displayed on the display unit in a power graph according to the passage of time. .
前記表示ステップは、
前記電力グラフを前記表示部に表示させる場合に、前記期間の開始時刻、前記期間の終了時刻、及び前記改善電力を求める基準となる基準電力をそれぞれ表す線分を、前記表示部にさらに表示させる
請求項5に記載の表示方法。
The display step includes
When displaying the power graph on the display unit, the display unit further displays line segments respectively representing the start time of the period, the end time of the period, and the reference power used as a reference for obtaining the improved power. The display method according to claim 5.
前記表示ステップは、
前記期間において、前記改善電力が存在する場合には、前記電力グラフの背景色に色付けをして前記電力グラフを前記表示部に表示させる
請求項5又は6に記載する表示方法。
The display step includes
The display method according to claim 5 or 6, wherein when the improved power exists during the period, the power graph is displayed on the display unit by coloring a background color of the power graph.
コンピュータに、
請求項1〜7のいずれか一項に記載の表示方法を、
実行させるためのプログラム。
On the computer,
The display method according to any one of claims 1 to 7,
A program to be executed.
情報端末が有する表示部に情報を表示する表示システムであって、
施設における複数の設備の各々について、当該設備で計測された当該設備の電力に関連する電力情報のうち、少なくとも当該設備が非稼働状態とみなされる期間の電力情報を非稼働情報として抽出する抽出部と、
前記複数の設備の各々について、前記非稼働情報に基づいた前記期間における電力使用の評価結果及び前記非稼働情報で表される電力のうち節約可能な改善電力に関連する改善情報を、前記表示部に表示させる表示制御部とを、
備える表示システム。
A display system for displaying information on a display unit of an information terminal,
For each of a plurality of facilities in a facility, an extraction unit that extracts, as non-operational information, at least power information for a period in which the facility is considered to be non-operational from power information related to the power of the facility measured by the facility When,
For each of the plurality of facilities, the display unit displays an evaluation result of power usage in the period based on the non-operation information and improvement information related to power that can be saved among the electric power represented by the non-operation information. Display control unit to be displayed on
Display system with.
JP2018030126A2018-02-222018-02-22Display method, program, and display systemPendingJP2019144966A (en)

Priority Applications (1)

Application NumberPriority DateFiling DateTitle
JP2018030126AJP2019144966A (en)2018-02-222018-02-22Display method, program, and display system

Applications Claiming Priority (1)

Application NumberPriority DateFiling DateTitle
JP2018030126AJP2019144966A (en)2018-02-222018-02-22Display method, program, and display system

Publications (1)

Publication NumberPublication Date
JP2019144966Atrue JP2019144966A (en)2019-08-29

Family

ID=67773855

Family Applications (1)

Application NumberTitlePriority DateFiling Date
JP2018030126APendingJP2019144966A (en)2018-02-222018-02-22Display method, program, and display system

Country Status (1)

CountryLink
JP (1)JP2019144966A (en)

Cited By (1)

* Cited by examiner, † Cited by third party
Publication numberPriority datePublication dateAssigneeTitle
JP2023125963A (en)*2022-02-282023-09-07パナソニックIpマネジメント株式会社Display system, display method, and program

Cited By (1)

* Cited by examiner, † Cited by third party
Publication numberPriority datePublication dateAssigneeTitle
JP2023125963A (en)*2022-02-282023-09-07パナソニックIpマネジメント株式会社Display system, display method, and program

Similar Documents

PublicationPublication DateTitle
US20240063658A1 (en)Power socket for reducing wastage of electrical energy and related aspects
JP7038314B2 (en) Display control method, display control program, and display control system
JP6876953B2 (en) Information presentation method, program, and information presentation system
EP3614686A1 (en)Display method, program and display system
JP6846633B2 (en) Information distribution system, information distribution method and program
JP5991611B2 (en) Energy management device, energy management system, program
US9818565B2 (en)Human-machine interface for a self-supplied relay
JP2013090485A (en)Co2 emission amount monitoring apparatus, co2 emission amount monitoring method, co2 emission amount monitoring program, and co2 emission amount monitoring system
JP2025100766A (en) Notification system, notification method, and program
JP2019144966A (en)Display method, program, and display system
JP2017191522A (en)Electricity charge estimate system, electricity charge estimate method, and program
JP6697769B2 (en) Energy management device and energy management method
JP2020035110A (en)Display method, program and display control system
JP6757907B2 (en) Display method, program and display system
JP6827215B2 (en) Display method, program and display system
JP6757908B2 (en) Setting method, setting system and setting program
JP6504374B2 (en) Power management device and program
JP2018055292A (en)Display method, program and display system
JP6440082B2 (en) Energy management device and program
EP4365814A1 (en)Information processing device, and program
US20190155231A1 (en)Power management system
JP2020005425A (en) Display method, program, analysis system and management system
JP7126206B2 (en) DEMAND MONITORING SYSTEM, MONITORING METHOD AND PROGRAM
JP2012200040A (en)Method of monitoring step-down power-receiving system of ac power source
Chakkaravarthy et al.An IoT Based Early Alert System to Monitor and Reduce Electrical Energy Consumption at Home in Smart Cities

[8]ページ先頭

©2009-2025 Movatter.jp