JP2014502858A - Analyte test method and system with high and low analyte trend notification - Google Patents
Analyte test method and system with high and low analyte trend notificationDownload PDFInfo
- Publication number
- JP2014502858A JP2014502858AJP2013539864AJP2013539864AJP2014502858AJP 2014502858 AJP2014502858 AJP 2014502858AJP 2013539864 AJP2013539864 AJP 2013539864AJP 2013539864 AJP2013539864 AJP 2013539864AJP 2014502858 AJP2014502858 AJP 2014502858A
- Authority
- JP
- Japan
- Prior art keywords
- analyte
- analyte measurement
- indicia
- threshold
- trend
- Prior art date
- Legal status (The legal status is an assumption and is not a legal conclusion. Google has not performed a legal analysis and makes no representation as to the accuracy of the status listed.)
- Ceased
Links
Images


Classifications
- G—PHYSICS
- G16—INFORMATION AND COMMUNICATION TECHNOLOGY [ICT] SPECIALLY ADAPTED FOR SPECIFIC APPLICATION FIELDS
- G16H—HEALTHCARE INFORMATICS, i.e. INFORMATION AND COMMUNICATION TECHNOLOGY [ICT] SPECIALLY ADAPTED FOR THE HANDLING OR PROCESSING OF MEDICAL OR HEALTHCARE DATA
- G16H40/00—ICT specially adapted for the management or administration of healthcare resources or facilities; ICT specially adapted for the management or operation of medical equipment or devices
- G16H40/60—ICT specially adapted for the management or administration of healthcare resources or facilities; ICT specially adapted for the management or operation of medical equipment or devices for the operation of medical equipment or devices
- G16H40/67—ICT specially adapted for the management or administration of healthcare resources or facilities; ICT specially adapted for the management or operation of medical equipment or devices for the operation of medical equipment or devices for remote operation
- A—HUMAN NECESSITIES
- A61—MEDICAL OR VETERINARY SCIENCE; HYGIENE
- A61B—DIAGNOSIS; SURGERY; IDENTIFICATION
- A61B5/00—Measuring for diagnostic purposes; Identification of persons
- A61B5/14—Devices for taking samples of blood ; Measuring characteristics of blood in vivo, e.g. gas concentration within the blood, pH-value of blood
- A—HUMAN NECESSITIES
- A61—MEDICAL OR VETERINARY SCIENCE; HYGIENE
- A61B—DIAGNOSIS; SURGERY; IDENTIFICATION
- A61B5/00—Measuring for diagnostic purposes; Identification of persons
- A61B5/15—Devices for taking samples of blood
- A61B5/150007—Details
- A61B5/150015—Source of blood
- A61B5/150022—Source of blood for capillary blood or interstitial fluid
- A—HUMAN NECESSITIES
- A61—MEDICAL OR VETERINARY SCIENCE; HYGIENE
- A61B—DIAGNOSIS; SURGERY; IDENTIFICATION
- A61B5/00—Measuring for diagnostic purposes; Identification of persons
- A61B5/15—Devices for taking samples of blood
- A61B5/150007—Details
- A61B5/150358—Strips for collecting blood, e.g. absorbent
- A—HUMAN NECESSITIES
- A61—MEDICAL OR VETERINARY SCIENCE; HYGIENE
- A61B—DIAGNOSIS; SURGERY; IDENTIFICATION
- A61B5/00—Measuring for diagnostic purposes; Identification of persons
- A61B5/15—Devices for taking samples of blood
- A61B5/150007—Details
- A61B5/150847—Communication to or from blood sampling device
- A61B5/15087—Communication to or from blood sampling device short range, e.g. between console and disposable
- A—HUMAN NECESSITIES
- A61—MEDICAL OR VETERINARY SCIENCE; HYGIENE
- A61B—DIAGNOSIS; SURGERY; IDENTIFICATION
- A61B5/00—Measuring for diagnostic purposes; Identification of persons
- A61B5/15—Devices for taking samples of blood
- A61B5/151—Devices specially adapted for taking samples of capillary blood, e.g. by lancets, needles or blades
- A61B5/15186—Devices loaded with a single lancet, i.e. a single lancet with or without a casing is loaded into a reusable drive device and then discarded after use; drive devices reloadable for multiple use
- A—HUMAN NECESSITIES
- A61—MEDICAL OR VETERINARY SCIENCE; HYGIENE
- A61B—DIAGNOSIS; SURGERY; IDENTIFICATION
- A61B5/00—Measuring for diagnostic purposes; Identification of persons
- A61B5/15—Devices for taking samples of blood
- A61B5/157—Devices characterised by integrated means for measuring characteristics of blood
- G—PHYSICS
- G06—COMPUTING OR CALCULATING; COUNTING
- G06F—ELECTRIC DIGITAL DATA PROCESSING
- G06F3/00—Input arrangements for transferring data to be processed into a form capable of being handled by the computer; Output arrangements for transferring data from processing unit to output unit, e.g. interface arrangements
- G06F3/01—Input arrangements or combined input and output arrangements for interaction between user and computer
- G06F3/048—Interaction techniques based on graphical user interfaces [GUI]
- G06F3/0487—Interaction techniques based on graphical user interfaces [GUI] using specific features provided by the input device, e.g. functions controlled by the rotation of a mouse with dual sensing arrangements, or of the nature of the input device, e.g. tap gestures based on pressure sensed by a digitiser
- G06F3/0488—Interaction techniques based on graphical user interfaces [GUI] using specific features provided by the input device, e.g. functions controlled by the rotation of a mouse with dual sensing arrangements, or of the nature of the input device, e.g. tap gestures based on pressure sensed by a digitiser using a touch-screen or digitiser, e.g. input of commands through traced gestures
- G—PHYSICS
- G16—INFORMATION AND COMMUNICATION TECHNOLOGY [ICT] SPECIALLY ADAPTED FOR SPECIFIC APPLICATION FIELDS
- G16H—HEALTHCARE INFORMATICS, i.e. INFORMATION AND COMMUNICATION TECHNOLOGY [ICT] SPECIALLY ADAPTED FOR THE HANDLING OR PROCESSING OF MEDICAL OR HEALTHCARE DATA
- G16H15/00—ICT specially adapted for medical reports, e.g. generation or transmission thereof
- G—PHYSICS
- G16—INFORMATION AND COMMUNICATION TECHNOLOGY [ICT] SPECIALLY ADAPTED FOR SPECIFIC APPLICATION FIELDS
- G16H—HEALTHCARE INFORMATICS, i.e. INFORMATION AND COMMUNICATION TECHNOLOGY [ICT] SPECIALLY ADAPTED FOR THE HANDLING OR PROCESSING OF MEDICAL OR HEALTHCARE DATA
- G16H40/00—ICT specially adapted for the management or administration of healthcare resources or facilities; ICT specially adapted for the management or operation of medical equipment or devices
- G16H40/60—ICT specially adapted for the management or administration of healthcare resources or facilities; ICT specially adapted for the management or operation of medical equipment or devices for the operation of medical equipment or devices
- G16H40/63—ICT specially adapted for the management or administration of healthcare resources or facilities; ICT specially adapted for the management or operation of medical equipment or devices for the operation of medical equipment or devices for local operation
- G—PHYSICS
- G16—INFORMATION AND COMMUNICATION TECHNOLOGY [ICT] SPECIALLY ADAPTED FOR SPECIFIC APPLICATION FIELDS
- G16H—HEALTHCARE INFORMATICS, i.e. INFORMATION AND COMMUNICATION TECHNOLOGY [ICT] SPECIALLY ADAPTED FOR THE HANDLING OR PROCESSING OF MEDICAL OR HEALTHCARE DATA
- G16H50/00—ICT specially adapted for medical diagnosis, medical simulation or medical data mining; ICT specially adapted for detecting, monitoring or modelling epidemics or pandemics
- G16H50/20—ICT specially adapted for medical diagnosis, medical simulation or medical data mining; ICT specially adapted for detecting, monitoring or modelling epidemics or pandemics for computer-aided diagnosis, e.g. based on medical expert systems
- H—ELECTRICITY
- H04—ELECTRIC COMMUNICATION TECHNIQUE
- H04B—TRANSMISSION
- H04B7/00—Radio transmission systems, i.e. using radiation field
- H04B7/24—Radio transmission systems, i.e. using radiation field for communication between two or more posts
- A—HUMAN NECESSITIES
- A61—MEDICAL OR VETERINARY SCIENCE; HYGIENE
- A61B—DIAGNOSIS; SURGERY; IDENTIFICATION
- A61B5/00—Measuring for diagnostic purposes; Identification of persons
- A61B5/15—Devices for taking samples of blood
- A61B5/150007—Details
- A61B5/150374—Details of piercing elements or protective means for preventing accidental injuries by such piercing elements
- A61B5/150381—Design of piercing elements
- A61B5/150412—Pointed piercing elements, e.g. needles, lancets for piercing the skin
- G—PHYSICS
- G16—INFORMATION AND COMMUNICATION TECHNOLOGY [ICT] SPECIALLY ADAPTED FOR SPECIFIC APPLICATION FIELDS
- G16H—HEALTHCARE INFORMATICS, i.e. INFORMATION AND COMMUNICATION TECHNOLOGY [ICT] SPECIALLY ADAPTED FOR THE HANDLING OR PROCESSING OF MEDICAL OR HEALTHCARE DATA
- G16H10/00—ICT specially adapted for the handling or processing of patient-related medical or healthcare data
- G16H10/40—ICT specially adapted for the handling or processing of patient-related medical or healthcare data for data related to laboratory analysis, e.g. patient specimen analysis
- G—PHYSICS
- G16—INFORMATION AND COMMUNICATION TECHNOLOGY [ICT] SPECIALLY ADAPTED FOR SPECIFIC APPLICATION FIELDS
- G16H—HEALTHCARE INFORMATICS, i.e. INFORMATION AND COMMUNICATION TECHNOLOGY [ICT] SPECIALLY ADAPTED FOR THE HANDLING OR PROCESSING OF MEDICAL OR HEALTHCARE DATA
- G16H10/00—ICT specially adapted for the handling or processing of patient-related medical or healthcare data
- G16H10/60—ICT specially adapted for the handling or processing of patient-related medical or healthcare data for patient-specific data, e.g. for electronic patient records
- G—PHYSICS
- G16—INFORMATION AND COMMUNICATION TECHNOLOGY [ICT] SPECIALLY ADAPTED FOR SPECIFIC APPLICATION FIELDS
- G16H—HEALTHCARE INFORMATICS, i.e. INFORMATION AND COMMUNICATION TECHNOLOGY [ICT] SPECIALLY ADAPTED FOR THE HANDLING OR PROCESSING OF MEDICAL OR HEALTHCARE DATA
- G16H20/00—ICT specially adapted for therapies or health-improving plans, e.g. for handling prescriptions, for steering therapy or for monitoring patient compliance
- G16H20/10—ICT specially adapted for therapies or health-improving plans, e.g. for handling prescriptions, for steering therapy or for monitoring patient compliance relating to drugs or medications, e.g. for ensuring correct administration to patients
- G16H20/17—ICT specially adapted for therapies or health-improving plans, e.g. for handling prescriptions, for steering therapy or for monitoring patient compliance relating to drugs or medications, e.g. for ensuring correct administration to patients delivered via infusion or injection
- G—PHYSICS
- G16—INFORMATION AND COMMUNICATION TECHNOLOGY [ICT] SPECIALLY ADAPTED FOR SPECIFIC APPLICATION FIELDS
- G16H—HEALTHCARE INFORMATICS, i.e. INFORMATION AND COMMUNICATION TECHNOLOGY [ICT] SPECIALLY ADAPTED FOR THE HANDLING OR PROCESSING OF MEDICAL OR HEALTHCARE DATA
- G16H20/00—ICT specially adapted for therapies or health-improving plans, e.g. for handling prescriptions, for steering therapy or for monitoring patient compliance
- G16H20/60—ICT specially adapted for therapies or health-improving plans, e.g. for handling prescriptions, for steering therapy or for monitoring patient compliance relating to nutrition control, e.g. diets
Landscapes
- Health & Medical Sciences (AREA)
- Life Sciences & Earth Sciences (AREA)
- Engineering & Computer Science (AREA)
- Biomedical Technology (AREA)
- Public Health (AREA)
- Medical Informatics (AREA)
- General Health & Medical Sciences (AREA)
- Pathology (AREA)
- Physics & Mathematics (AREA)
- Veterinary Medicine (AREA)
- Molecular Biology (AREA)
- Surgery (AREA)
- Biophysics (AREA)
- Animal Behavior & Ethology (AREA)
- Hematology (AREA)
- Heart & Thoracic Surgery (AREA)
- Epidemiology (AREA)
- Primary Health Care (AREA)
- Business, Economics & Management (AREA)
- General Business, Economics & Management (AREA)
- Theoretical Computer Science (AREA)
- General Engineering & Computer Science (AREA)
- Databases & Information Systems (AREA)
- Data Mining & Analysis (AREA)
- Human Computer Interaction (AREA)
- General Physics & Mathematics (AREA)
- Signal Processing (AREA)
- Computer Networks & Wireless Communication (AREA)
- Investigating Or Analysing Biological Materials (AREA)
- Measuring And Recording Apparatus For Diagnosis (AREA)
- Measurement Of The Respiration, Hearing Ability, Form, And Blood Characteristics Of Living Organisms (AREA)
Abstract
Translated fromJapaneseDescription
Translated fromJapanese 本願は、35 USC §119,120,365、並びに/又は2010年11月19日出願の先行仮特許出願番号第61/415,598号(代理人整理番号LFS5217USPSP)、2011年3月29日出願の同第61/469,046号(代理人整理番号LFS2222USPSP)に対するパリ条約、及び2011年7月27日の非仮特許出願番号第13/192,348号(代理人整理番号LFS5217USNP)の下で利益を主張し、それらの先行出願は、参照により全体として本願に組み込まれる。 This application is 35 USC §119,120,365 and / or prior provisional
糖尿病患者にとって、グルコース監視は日常のことである。そのような監視の精度は、糖尿病者の健康、及び最終的には生活の質に多大な影響を与えることがある。一般に糖尿病患者は、血中グルコース濃度を1日に数回測定し、血糖値を監視し制御する。血中グルコース濃度を正確にかつ定期的に検査しないと、心臓血管疾患、腎疾患、神経損傷、及び失明などの重篤な糖尿病関連合併症を引き起こす可能性がある。現在は、少量の血液サンプル中のグルコース濃度を個人が検査できる、多くの電子機器が存在する。このようなグルコース測定器の1つが、LifeScan製の製品であるOneTouch(登録商標)Profile(商標)グルコース測定器である。 For diabetics, glucose monitoring is a daily thing. The accuracy of such monitoring can have a significant impact on the health of the diabetic and ultimately the quality of life. In general, a diabetic patient measures blood glucose levels several times a day and monitors and controls blood glucose levels. Failure to accurately and regularly check blood glucose levels can cause serious diabetes-related complications such as cardiovascular disease, kidney disease, nerve damage, and blindness. Currently, there are many electronic devices that allow an individual to examine the glucose concentration in a small blood sample. One such glucose meter is the OneTouch® Profile ™ glucose meter, a product from LifeScan.
グルコース監視に加え、糖尿病患者は多くの場合、例えば、不規則な食事又は運動によって悪影響を受けないように、ライフスタイルに対する厳しい管理を維持しなければならない。更に、特定の糖尿病患者を扱う医師は、糖尿病管理に対して効果的な治療や治療の変更を提供するために、その患者のライフスタイルに関する詳細な情報を必要とする場合がある。現在、糖尿病患者のライフスタイルを管理する方法の1つとして、その患者にライフスタイルに関する紙の日記をつけさせることがある。別の方法として、その患者にライフスタイルに関する出来事を単に記憶させ、各診察時に医師にその詳細を伝えさせることがある。 In addition to glucose monitoring, diabetics often have to maintain strict controls on their lifestyles so that they are not adversely affected by, for example, irregular diets or exercise. In addition, physicians working with a particular diabetic patient may need detailed information about the patient's lifestyle in order to provide effective treatment and treatment changes for diabetes management. Currently, one way to manage the lifestyle of a diabetic patient is to have the patient keep a paper diary about the lifestyle. Alternatively, the patient can simply remember lifestyle events and have the doctor communicate the details at each visit.
ライフスタイルに関する情報を記録する上記の方法は、本質的に難しく、時間がかかり、場合によっては正確ではない。紙の日記は、患者が必ずしも常に携帯しておらず、必要な時に正確に記録できない場合がある。このような紙の日記は小さいため、ライフスタイルにおける出来事の詳細な記述を必要とする詳細情報を記入することが難しい。更に、手書きのノートを手作業で確認し、その情報を解釈すべき医師に質問された際に、しばしば、患者はライフスタイルの主要な出来事を忘れている場合がある。紙の日記からは、要素情報を抽出又は分類するための分析が得られない。また、この情報の縮図又は要約もない。二次データ記憶システム、例えば、データベース又はその他電子システムへのデータ入力は、この二次データ記憶装置への、ライフスタイルデータを含む情報の労力を要する複写作業を必要とする。データの記録が難しいため、関連情報を思い出しながら入力することになり、結果として不正確かつ不完全な記録となる。 The above methods of recording lifestyle information are inherently difficult, time consuming and in some cases not accurate. Paper diaries are not always carried by patients and may not be accurately recorded when needed. Because such a paper diary is small, it is difficult to fill in detailed information that requires detailed descriptions of events in the lifestyle. In addition, patients often forget about major lifestyle events when handwritten notes are manually checked and asked by a physician who should interpret the information. An analysis for extracting or classifying element information cannot be obtained from a paper diary. There is also no miniature or summary of this information. Data entry into a secondary data storage system, such as a database or other electronic system, requires a laborious duplication of information, including lifestyle data, into this secondary data storage device. Since it is difficult to record data, it is necessary to input relevant information while remembering, resulting in inaccurate and incomplete recording.
現在は、個人の分析物濃度を測定でき、分析用の別のコンピュータに読み出し又はアップロードするために、この濃度を保存できる多くの携帯用電子機器が存在する。しかし、既知のシステムでは、計測器内に保存されるライフスタイル変数は制限されたものが選択できるのみである。事前に計測器内に入力された値からのインテリジェントフィードバックはなく、計測器をたまに使用するユーザーにとってユーザーインターフェースは直観的ではない。別のデバイスは、Agamatrix WaveSenseである。しかしながら、WaveSenseは、高傾向又は低傾向の検出を提供しない。 Currently, there are many portable electronic devices that can measure an individual's analyte concentration and store this concentration for reading or uploading to another computer for analysis. However, in known systems, only limited lifestyle variables can be selected that are stored in the instrument. There is no intelligent feedback from values previously entered into the instrument and the user interface is not intuitive for users who occasionally use the instrument. Another device is Agatrix WaveSense. However, WaveSense does not provide detection of high or low trends.
一実施形態では、プロセッサと、通信モジュールと、ディスプレイスクリーンと、メモリ記憶装置と、を含む、モバイルコンピュータデバイスが提供される。通信モジュールは、プロセッサに連結され、複数の分析物測定結果を含むデータを、分析物測定デバイスから受信するように構成される。ディスプレイスクリーンは、プロセッサに連結され、メモリ記憶装置は、プロセッサに連結される。メモリは、一例では、第1の閾値未満の1日の所与の時間の最新の分析物測定結果と、第1の閾値よりも低いN日の期間にわたる最新の分析物測定結果の所与の時間に関して、X時間のタイムフレーム内で実施される少なくとも1つ以上の分析物測定結果と、を含むデータを受信するように構成され、そのような例では、プロセッサが、それぞれ行ヘッダ及び列ヘッダを有する複数の行及び複数の列を有する表を表示するように、ディスプレイスクリーンを制御するように構成され、列ヘッダが、1日のうちの異なる期間を示し、1日の各期間内の食前又は食後の分析物測定結果を示す、列ヘッダのそれぞれの細分割部を有し、行ヘッダが、各分析物測定結果の日付を示し、1つの分析物傾向の一部として識別される分析物値を表す数値が、第1のしるしによって表され、別の分析物傾向の一部として識別される分析物値を表す数値が、第1のしるしとは異なる第2のしるしによって表され、N日の期間にわたる最新の分析物測定結果の所与の時間に関して、X時間のタイムフレーム内の第1の閾値よりも低い分析物測定結果の傾向に対する、記憶された分析物の第1のしるしの分配が、グラフィックコネクタにより第1のしるしの分配のそれぞれに接続される。 In one embodiment, a mobile computing device is provided that includes a processor, a communication module, a display screen, and a memory storage device. The communication module is coupled to the processor and is configured to receive data including a plurality of analyte measurement results from the analyte measurement device. The display screen is coupled to the processor and the memory storage device is coupled to the processor. The memory may, in one example, provide the latest analyte measurement results for a given time of the day less than the first threshold and the latest analyte measurement results for a period of N days lower than the first threshold. With respect to time, configured to receive data comprising at least one analyte measurement performed within a time frame of X hours, in such an example, the processor includes a row header and a column header, respectively. Configured to control the display screen to display a table having a plurality of rows and a plurality of columns, wherein the column header indicates different periods of the day and pre-meal within each period of the day Or an analyte having a respective subdivision of the column header indicating the analyte measurement results after a meal, the row header indicating the date of each analyte measurement result and identified as part of one analyte trend The number representing the value is A numeric value representing an analyte value represented by one indicia and identified as part of another analyte trend is represented by a second indicia that is different from the first indicia, and is the most recent analysis over a period of N days. For a given time of the analyte measurement, the distribution of the first indicia of the stored analyte for the trend of the analyte measurement lower than the first threshold in the X time time frame is determined by the graphic connector. Connected to each of the 1 indicia distributions.
更に別の実施形態では、プロセッサと、通信モジュールと、ディスプレイスクリーンと、メモリ記憶装置と、を含む、モバイルコンピュータデバイスが提供される。通信モジュールは、プロセッサに連結され、複数の分析物測定結果を含むデータを、分析物測定デバイスから受信するように構成される。ディスプレイスクリーンは、プロセッサに連結され、メモリ記憶装置は、プロセッサに連結される。メモリは、一例では、1日のうちの所与の時間に、N日の期間にわたって、第2の閾値を超える、食前に行われたとしてフラグ付けされている最新の分析物測定結果と、最新の分析物測定結果の所与の時間に関して、X時間のタイムフレーム内で実施される、第2の閾値よりも高い、複数の分析物測定結果のうちの少なくとも1つの分析物測定結果と、を含むデータを受信するように構成され、そのような例では、プロセッサが、それぞれ行ヘッダ及び列ヘッダを有する複数の行及び複数の列を有する表を表示するように、ディスプレイスクリーンを制御するように構成され、列ヘッダが、1日のうちの異なる期間を示し、1日の各期間内の食前又は食後の分析物測定結果を示す、列ヘッダのそれぞれの細分割部を有し、行ヘッダが、各分析物測定結果の日付を示し、1つの分析物傾向の一部として識別される分析物値を表す数値が、第1のしるしによって表され、別の分析物傾向の一部として識別される分析物値を表す数値が、第1のしるしとは異なる第2のしるしによって表され、N日の期間にわたる最新の分析物測定結果の所与の時間に関して、X時間のタイムフレーム内の第2の閾値よりも高い分析物測定結果の傾向に対する、記憶された分析物の第2のしるしの分配が、グラフィックコネクタにより第1のしるしの分配のそれぞれに接続される。 In yet another embodiment, a mobile computing device is provided that includes a processor, a communication module, a display screen, and a memory storage device. The communication module is coupled to the processor and is configured to receive data including a plurality of analyte measurement results from the analyte measurement device. The display screen is coupled to the processor and the memory storage device is coupled to the processor. The memory, in one example, at the given time of the day, over the period of N days, exceeds the second threshold and is updated with the most recent analyte measurement flagged as done pre-meal At least one of the plurality of analyte measurements higher than a second threshold, performed within a time frame of X hours, for a given time of the analyte measurements of Configured to receive data including, in such an example, the processor is configured to control the display screen to display a table having a plurality of rows and a plurality of columns, each having a row header and a column header. The column headers have different subdivisions of the column headers indicating different periods of the day and indicating the analyte measurement results before or after the meal within each period of the day, and the row headers , Each analysis An analyte value indicating the date of the measurement result and representing an analyte value identified as part of one analyte trend is represented by the first indicia and identified as part of another analyte trend Is represented by a second indicia that is different from the first indicia, for a given time of the latest analyte measurement over a period of N days, than the second threshold in the time frame of X hours A distribution of stored second indicia of analytes for a trend of higher analyte measurement results is connected to each of the first indicia distributions by a graphic connector.
これらの実施形態では、N日数が、約2〜約14の任意の数字を含んでよく、X時間が、約0〜約7時間の任意の数字を含んでよく、X時間が、約0〜約3時間の任意の数字を含んでもよく、第1の閾値が、血液1デシリットルあたり約70mgのグルコースを含んでよく、第2の閾値は、血液1デシリットルあたり約150mgのグルコースを含んでもよい。 In these embodiments, the N days may include any number from about 2 to about 14, the X time may include any number from about 0 to about 7 hours, and the X time is from about 0 to about Any number of about 3 hours may be included, the first threshold may include about 70 mg glucose per deciliter of blood, and the second threshold may include about 150 mg glucose per deciliter of blood.
なおも更なる実施形態では、分析物測定ユニットを用い、モバイル通信デバイスと併用して得られる分析物値中の高又は低傾向をユーザーに通知する方法が提供される。各デバイスは、それぞれのディスプレイ及びメモリ記憶装置に連結されるマイクロプロセッサを有する。本方法は、分析物測定ユニットを用いて、生理学的流体中の分析物を酵素副生成物に変換し、プロセス中に、流体中の分析物の測定結果を提供する、変換する工程と;分析物測定ユニットのメモリ中に、分析物測定結果のうちの1つ以上を記憶する工程と;モバイル通信デバイスを用いて、1日のうちの所与の時間の最新の分析物測定結果が第1の閾値未満であるかどうかを決定する工程と;モバイル通信デバイスを用いて、N日の期間にわたる最新の分析物測定結果の所与の時間に関して、X時間のタイムフレーム内で実施される複数の分析物測定結果のうちの少なくとも1つの分析物測定結果が、第1の閾値よりも低いかどうかを評価する工程と;モバイル通信ユニット内で、N日数にわたって同一のタイムフレームで、複数の分析物測定結果が、ディスプレイの表中の第1のしるしで、第1の閾値よりも低い分析物傾向を示すことを通知する工程と、により達成され得、表は、それぞれ行ヘッダ及び列ヘッダを有する複数の行及び複数の列を有し、列ヘッダが、1日のうちの異なる期間を示し、1日の各期間内の食前又は食後の分析物測定結果を示す、列ヘッダのそれぞれの細分割部を有し、行ヘッダが、各分析物測定結果の日付を示し、1つの分析物傾向の一部として識別される分析物値を表す数値が、第1のしるしによって表され、別の分析物傾向の一部として識別される分析物値を表す数値が、第1のしるしとは異なる第2のしるしによって表される。 In yet a further embodiment, a method is provided that uses an analyte measurement unit to notify a user of high or low trends in analyte values obtained in conjunction with a mobile communication device. Each device has a microprocessor coupled to a respective display and memory storage. The method uses an analyte measurement unit to convert an analyte in a physiological fluid to an enzyme by-product, and provides a measurement result of the analyte in the fluid during the process; Storing one or more of the analyte measurement results in a memory of the object measurement unit; using the mobile communication device, the most recent analyte measurement result for a given time of day is first A plurality of times implemented within a time frame of X hours for a given time of the latest analyte measurement over a period of N days using a mobile communication device; Evaluating whether at least one of the analyte measurements is lower than a first threshold; and within the mobile communication unit, a plurality of analytes in the same time frame over N days Measurement Informing that the result indicates an analyte trend lower than the first threshold at a first indicia in the table of the display, the table having a plurality of row headers and column headers, respectively. Each of the column headers with different rows and columns, wherein the column headers indicate different periods of the day, and indicate the pre-meal or post-meal analyte measurement results within each period of the day And the row header indicates the date of each analyte measurement, and a numeric value representing the analyte value identified as part of one analyte trend is represented by a first indicia and another analyte A numerical value representing the analyte value identified as part of the trend is represented by a second indicia that is different from the first indicia.
更に別の実施形態では、分析物測定ユニットを用い、モバイル通信デバイスと併用して得られる分析物値中の高又は低傾向をユーザーに通知する方法が提供される。各デバイスは、それぞれのディスプレイ及びメモリ記憶装置に連結されるマイクロプロセッサを有する。本方法は、分析物測定ユニットを用いて、生理学的流体中の分析物の酵素副生成物への分析物の変換を開始し、プロセス中に、流体中の分析物の測定結果を提供する工程と;分析物測定ユニットのメモリ中に、分析物測定結果のうちの1つ以上を記憶する工程と;1日のうちの所与の時間の最新の分析物測定結果が第2の閾値を超えるかどうかを決定する工程と;最新の分析物測定値が(a)食前に行われた測定結果、又は(b)空腹期間中に行われた測定結果のいずれか、又は両方としてフラグが付けられたかどうかを確認する工程と;モバイル通信デバイスを用いて、N日の期間にわたる最新の分析物測定結果の所与の時間に関して、X時間のタイムフレーム内で実施される複数の分析物測定結果のうちの少なくとも1つの分析物測定結果が、第2の閾値よりも高いかどうかを評価する工程と;N日数にわたる同一のタイムフレームで、複数の分析物測定結果が、ディスプレイの表中の第2のしるしで第2の閾値よりも高い別の分析物傾向を示すことを通知する工程と、により達成され得、表は、それぞれ行ヘッダ及び列ヘッダを有する複数の行及び複数の列を有し、列ヘッダが、1日のうちの異なる期間を示し、1日の各期間内の食前又は食後の分析物測定結果を示す、列ヘッダのそれぞれの細分割部を有し、行ヘッダが、各分析物測定結果の日付を示し、1つの分析物傾向の一部として識別される分析物値を表す数値が、第1のしるしによって表され、別の分析物傾向の一部として識別される分析物値を表す数値が、第1のしるしとは異なる第2のしるしによって表される。 In yet another embodiment, a method is provided for using an analyte measurement unit to notify a user of a high or low trend in an analyte value obtained in conjunction with a mobile communication device. Each device has a microprocessor coupled to a respective display and memory storage. The method uses an analyte measurement unit to initiate the conversion of the analyte into an enzyme byproduct of the analyte in the physiological fluid and provides a measurement result of the analyte in the fluid during the process. Storing one or more of the analyte measurement results in a memory of the analyte measurement unit; and the latest analyte measurement result for a given time of day exceeds a second threshold And whether the latest analyte measurement is flagged as either (a) a measurement taken before a meal, or (b) a measurement taken during an empty stomach, or both A plurality of analyte measurements performed within a time frame of X hours for a given time of the latest analyte measurement over a period of N days using a mobile communication device; At least one analyte measurement result Assessing whether or not is greater than a second threshold; and in the same time frame over N days, the plurality of analyte measurements are greater than the second threshold at the second indicia in the display table Informing that it exhibits a high separate analyte trend, the table having a plurality of rows and a plurality of columns, each having a row header and a column header, wherein the column header is Each column has a respective subdivision of the column header indicating the pre-meal or post-meal analyte measurements within each period of the day, the row header indicating the date of each analyte measurement, A number representing an analyte value identified as part of one analyte trend is represented by a first indicia and a number representing an analyte value identified as part of another analyte trend is a first Represented by a second indicia different from the indicia
上記方法では、分析物はグルコースであってよく、N日数は、約2〜約14の任意の数字を含んでもよく、X時間は、約0〜約7時間の任意の数字を含んでもよく、表示する工程は、グラフィックコネクタにより第1のしるしの分配のそれぞれに接続されている、N日の期間にわたる最新の分析物測定結果の所与の時間に関して、X時間のタイムフレーム内の第1の閾値よりも低い分析物測定結果の傾向に対する、記憶された分析物の第1のしるしの分配を示す工程を含み、表示する工程は、グラフィックコネクタにより第2のしるしの分配のそれぞれに接続されている、N日の期間にわたる最新の分析物測定結果の所与の時間に関して、X時間のタイムフレーム内の第2の閾値よりも高い分析物測定結果の傾向に対する、記憶された分析物の第2のしるしの分配を示す工程を含んでもよく、X時間は、約0〜約3時間の任意の数字であってよく、第1の閾値は、血液1デシリットルあたり約70mgであってもよく、第2の閾値は、血液1デシリットルあたり約150mgであってもよい。 In the above method, the analyte may be glucose, the N days may comprise any number from about 2 to about 14, and the X hour may comprise any number from about 0 to about 7 hours, The displaying step is for a given time of the most recent analyte measurement over a period of N days connected to each of the first indicia distributions by a graphic connector for the first time in the X hour time frame. A step of indicating a distribution of the first indicia of the stored analyte for trends in analyte measurement results below a threshold, the displaying step being connected to each of the second indicia distribution by a graphic connector. Stored analyte for a trend in analyte measurement higher than a second threshold within a time frame of X hours for a given time of the latest analyte measurement over a period of N days A second indication of dispensing may be included, the X time may be any number from about 0 to about 3 hours, and the first threshold may be about 70 mg per deciliter of blood. The second threshold may be about 150 mg per deciliter of blood.
更に別の実施形態では、少なくとも1つの分析物試験ストリップと、分析物測定ユニットと、を含む、慢性疾患管理システムが提供される。測定ユニットは、ハウジングと、分析物マイクロプロセッサと、モバイル通信ユニットと、を含む。ハウジングは、分析物試験ストリップを受信するように構成される、試験ストリップポートを含む。分析物マイクロプロセッサは、試験ストリップ上に配置されるユーザーの生理学的流体中で測定される分析物の量に関するデータを提供するように構成される、試験ストリップポートに連結される。マイクロプロセッサは、メモリに連結される。モバイル通信ユニットは、ディスプレイ及びメモリに連結されるモバイルプロセッサを含む。分析物マイクロプロセッサ又はモバイルプロセッサのうちの1つは、生理学的流体中の分析物を測定して、分析物測定結果を提供するように;分析物測定結果のうちの1つ以上を記憶するように;1日のうちの所与の時間の最新の分析物測定結果が第1の閾値未満であるかどうかを決定するように;N日の期間にわたる最新の分析物測定結果の所与の時間に関して、X時間のタイムフレーム内で実施される複数の分析物測定結果のうちの少なくとも1つの分析物測定結果が、第1の閾値よりも低いかどうかを評価するように;評価の完了時に、N日数にわたる少なくとも2日の同一のタイムフレーム内で、複数の分析物測定結果が、低閾値よりも低い分析物傾向又は第2の閾値よりも高い傾向を示すことを通知するように;そしてそれぞれ行ヘッダ及び列ヘッダを有する複数の行及び複数の列を有する表中で、モバイル通信デバイスのディスプレイ上に複数の分析物測定値を表示するようにプログラムされ、列ヘッダが、1日のうちの異なる期間を示し、1日の各期間内の食前又は食後の分析物測定結果を示す、列ヘッダのそれぞれの細分割部を有し、行ヘッダが、各分析物測定結果の日付を示し、1つの分析物傾向の一部として識別される分析物値を表す数値が、第1のしるしによって表され、別の分析物傾向の一部として識別される分析物値を表す数値が、第1のしるしとは異なる第2のしるしによって表される。 In yet another embodiment, a chronic disease management system is provided that includes at least one analyte test strip and an analyte measurement unit. The measurement unit includes a housing, an analyte microprocessor, and a mobile communication unit. The housing includes a test strip port configured to receive an analyte test strip. The analyte microprocessor is coupled to a test strip port configured to provide data regarding the amount of analyte measured in a user's physiological fluid disposed on the test strip. The microprocessor is coupled to the memory. The mobile communication unit includes a mobile processor coupled to a display and a memory. One of the analyte microprocessor or mobile processor measures the analyte in the physiological fluid and provides an analyte measurement result; stores one or more of the analyte measurement result To determine if the latest analyte measurement result for a given time of day is less than a first threshold; the given time of the latest analyte measurement over a period of N days To evaluate whether at least one analyte measurement result of a plurality of analyte measurement results performed within a time frame of X hours is lower than a first threshold; Notifying that within a same time frame of at least 2 days over N days, multiple analyte measurements show an analyte trend below a low threshold or a trend above a second threshold; and line Programmed to display multiple analyte measurements on a display of a mobile communication device in a table having multiple rows and multiple columns with headers and column headers, wherein the column headers are Each subdivision of the column header indicates a different period and indicates the analyte measurement results before or after the meal within each period of the day, the row header indicates the date of each analyte measurement result, 1 A number representing an analyte value identified as part of one analyte trend is represented by a first indicia, and a number representing an analyte value identified as part of another analyte trend is a first It is represented by a second indicia different from the indicia.
上記システムでは、マイクロプロセッサは、(a)食前に行われた測定結果、又は(b)空腹期間中に行われた測定結果を含む既定条件のうちの1つとしてフラグが付けられたかどうかを確認するように更にプログラム化され、マイクロプロセッサは、最新の分析物測定値が、既定条件として第1の閾値未満であるかどうかを確認するように更にプログラム化され、N日数は、約2〜約14の任意の数字であってよく、X時間は、約0〜約7時間の任意の数字であってよく、X時間は、約0〜約3時間の任意の数字であってもよく、第1の閾値は、血液1デシリットルあたり約70mgであってよく、第2の閾値は、血液1デシリットルあたり約150mgであってもよい。 In the above system, the microprocessor checks to see if it has been flagged as one of (a) a measurement result taken before a meal, or (b) a measurement result made during an empty stomach. Further programmed so that the microprocessor is further programmed to check if the latest analyte measurement is less than the first threshold as a predetermined condition, and the N days is about 2 to about 14 can be any number, X time can be any number from about 0 to about 7 hours, X time can be any number from about 0 to about 3 hours, The threshold value of 1 may be about 70 mg per deciliter of blood and the second threshold value may be about 150 mg per deciliter of blood.
更なる実施形態では、分析物測定ユニットと、モバイル通信ユニットと、を含む、慢性疾患管理システムが提供される。分析物測定ユニットは、ハウジングと分析物マイクロプロセッサとを含む。ハウジングは、分析物試験ストリップを受信するように構成される、試験ストリップポートを含む。試験ストリップポートは、1つ以上の試験ストリップ上に配置されるユーザーの生理学的流体からの分析物の量に関するデータを提供するように構成される。分析物マイクロプロセッサは、複数の分析物測定結果を表すデータを記憶するように構成される、メモリに連結される。モバイル通信ユニットは、マイクロプロセッサと、ディスプレイと、メモリと、を含む。モバイルプロセッサはディスプレイ及びメモリに連結され、分析物マイクロプロセッサ又はモバイルマイクロプロセッサのうちの1つが、N日の期間にわたる最新の分析物測定結果の所与の時間に関して、X時間のタイムフレーム内で実施される複数の分析物測定結果の少なくとも1つの分析物測定結果が、第1の閾値よりも低いかどうかを決定し、N日数にわたるタイムフレームで、表中で、第1の閾値よりも低い分析物傾向を表示するように構成され、表が、それぞれ行ヘッダ及び列ヘッダを有する複数の行及び複数の列を有し、列ヘッダが、1日のうちの異なる期間を示し、1日の各期間内の食前又は食後の分析物測定結果を示す、列ヘッダのそれぞれの細分割部を有し、行ヘッダが、各分析物測定結果の日付を示し、1つの分析物傾向の一部として識別される分析物値を表す数値が、第1のしるしによって表され、別の分析物傾向の一部として識別される分析物値を表す数値が、第1のしるしとは異なる第2のしるしによって表される。 In a further embodiment, a chronic disease management system is provided that includes an analyte measurement unit and a mobile communication unit. The analyte measurement unit includes a housing and an analyte microprocessor. The housing includes a test strip port configured to receive an analyte test strip. The test strip port is configured to provide data regarding the amount of analyte from a user's physiological fluid disposed on the one or more test strips. The analyte microprocessor is coupled to a memory configured to store data representing a plurality of analyte measurement results. The mobile communication unit includes a microprocessor, a display, and a memory. The mobile processor is coupled to the display and memory, and one of the analyte microprocessor or mobile microprocessor performs within a time frame of X hours for a given time of the latest analyte measurement over a period of N days. Determining whether at least one analyte measurement result of the plurality of analyte measurement results is lower than the first threshold and analyzing in the table below the first threshold in a time frame over N days Configured to display physical trends, the table has a plurality of rows and a plurality of columns, each having a row header and a column header, wherein the column header indicates different periods of the day Each subdivision of the column header indicates the analyte measurement results before or after the meal within the period, the row header indicates the date of each analyte measurement result, and one analyte trend The numerical value representing the analyte value identified as part of the first indicia is represented by a first indicia and the numerical value representing the analyte value identified as part of another analyte trend is different from the first indicia. Represented by a second indicia.
なおも更なる実施形態では、分析物測定ユニットとモバイル通信ユニットとを含む、慢性疾患管理システムが提供される。分析物測定ユニットは、ハウジングと分析物マイクロプロセッサとを含む。ハウジングは、分析物試験ストリップを受信するように構成される、試験ストリップポートを含む。試験ストリップポートは、1つ以上の試験ストリップ上に配置されるユーザーの生理学的流体からの分析物の量に関するデータを提供するように構成される。分析物マイクロプロセッサは、複数の分析物測定結果を表すデータを記憶するように構成される、メモリに連結される。モバイル通信ユニットは、マイクロプロセッサと、ディスプレイと、メモリと、を含む。モバイルプロセッサはディスプレイ及びメモリに連結され、分析物マイクロプロセッサ又はモバイルマイクロプロセッサのうちの1つが、N日の期間にわたる最新の分析物測定結果の所与の時間に関して、X時間のタイムフレーム内で実施される複数の分析物測定結果の少なくとも1つの分析物測定結果が、第2の閾値よりも高いかどうかを決定し、N日数にわたるタイムフレームで、表中で、第2の閾値よりも高い分析物傾向を表示するように構成され、表が、それぞれ行ヘッダ及び列ヘッダを有する複数の行及び複数の列を有し、列ヘッダが、1日のうちの異なる期間を示し、1日の各期間内の食前又は食後の分析物測定結果を示す、列ヘッダのそれぞれの細分割部を有し、行ヘッダが、各分析物測定結果の日付を示し、1つの分析物傾向の一部として識別される分析物値を表す数値が、第1のしるしによって表され、別の分析物傾向の一部として識別される分析物値を表す数値が、第1のしるしとは異なる第2のしるしによって表される。 In a still further embodiment, a chronic disease management system is provided that includes an analyte measurement unit and a mobile communication unit. The analyte measurement unit includes a housing and an analyte microprocessor. The housing includes a test strip port configured to receive an analyte test strip. The test strip port is configured to provide data regarding the amount of analyte from a user's physiological fluid disposed on the one or more test strips. The analyte microprocessor is coupled to a memory configured to store data representing a plurality of analyte measurement results. The mobile communication unit includes a microprocessor, a display, and a memory. The mobile processor is coupled to the display and memory, and one of the analyte microprocessor or mobile microprocessor performs within a time frame of X hours for a given time of the latest analyte measurement over a period of N days. Determining whether at least one analyte measurement result of the plurality of analyte measurement results is higher than a second threshold and analyzing in the table higher than the second threshold in a time frame over N days Configured to display physical trends, the table has a plurality of rows and a plurality of columns, each having a row header and a column header, wherein the column header indicates different periods of the day Each subdivision of the column header indicates the analyte measurement results before or after the meal within the period, the row header indicates the date of each analyte measurement result, and one analyte trend The numerical value representing the analyte value identified as part of the first indicia is represented by a first indicia and the numerical value representing the analyte value identified as part of another analyte trend is different from the first indicia. Represented by a second indicia.
これらのシステムでは、N日数は、約2〜約14の任意の数を含み、X時間は、約0〜約7時間の任意の数を含み、第1の閾値は、血液1デシリットルあたり約70mgのグルコースを含み、第2の閾値は、血液1デシリットルあたり約150mgのグルコースを含み、複数の分析物測定結果は、少なくとも2つのグルコース測定結果を含み、複数の分析物測定結果は、少なくとも3つのグルコース測定結果を含む。 In these systems, N days includes any number from about 2 to about 14, X hours includes any number from about 0 to about 7 hours, and the first threshold is about 70 mg per deciliter of blood. The second threshold includes about 150 mg glucose per deciliter of blood, the plurality of analyte measurements includes at least two glucose measurements, and the plurality of analyte measurements includes at least three Includes glucose measurement results.
これら及び他の実施形態、特徴並びに利点は、以下に述べる本発明の異なる例示的実施形態のより詳細な説明を、はじめに下記に簡単に述べる付属の図面とあわせて参照することによって当業者にとって明らかになるであろう。 These and other embodiments, features and advantages will be apparent to those skilled in the art by reference to the more detailed description of the different exemplary embodiments of the invention described below, first in conjunction with the accompanying drawings briefly described below. It will be.
本明細書に援用する明細書の一部をなす添付図面は、現時点における本発明の好適な実施形態を示したものであって、上記に述べた一般的説明及び下記に述べる詳細な説明とともに、本発明の特徴を説明する役割を果たすものである(同様の数字は同様の要素を表す)。 The accompanying drawings, which form a part of the specification incorporated herein, illustrate a preferred embodiment of the present invention at the present time, together with the general description set forth above and the detailed description set forth below. It serves to illustrate the features of the present invention (similar numbers represent similar elements).
以下の詳細な説明は、図面を参照しつつ読まれるべきもので、異なる図面中、同様の要素は同様の参照符号にて示してある。図面は必ずしも一定の縮尺を有さず、選択した実施形態を示したものであって、本発明の範囲を限定するものではない。詳細な説明は本発明の原理を限定するものではなく、あくまでも例として説明するものである。この説明文は、当業者による発明の製造及び使用を明確に可能ならしめるものであり、出願時における発明を実施するための最良の形態と考えられるものを含む、発明の複数の実施形態、適応例、変形例、代替例、並びに使用例を述べるものである。 The following detailed description should be read with reference to the drawings, in which like elements in different drawings are designated with like reference numerals. The drawings are not necessarily to scale and illustrate selected embodiments and are not intended to limit the scope of the invention. The detailed description is not intended to limit the principles of the invention but is provided as an example only. This description clearly allows the person skilled in the art to make and use the invention, and includes several embodiments of the invention, including what is considered to be the best mode for carrying out the invention at the time of filing. Examples, variations, alternatives, and usage examples are described.
本明細書で任意の数値や数値の範囲について用いる「約」又は「およそ」という用語は、構成要素の部分又は構成要素の集合が、本明細書で述べるその所望の目的に沿って機能することを可能とするような適当な寸法の許容誤差を示すものである。更に、本明細書で用いる「患者」、「ホスト」、「ユーザー」、及び「被験者」という用語は任意のヒト又は動物患者を指し、システム又は方法をヒトにおける使用に限定することを目的としたものではないが、ヒト患者における本発明の使用は好ましい実施形態を代表するものである。また「分析物」という用語は、これらに限定されないが、血液、尿、唾液、又は汗を含む、ユーザーから抽出可能な任意の流体(以下、「生理学的液体」)の任意の成分(例えば、グルコース、ケトン、尿素、コレステロール、ヘマトクリット等)を示す。 The term “about” or “approximately” as used herein for any numerical value or range of numerical values means that a component part or set of components functions in accordance with its desired purpose as described herein. The tolerance of an appropriate dimension that enables the Further, as used herein, the terms “patient”, “host”, “user”, and “subject” refer to any human or animal patient and are intended to limit the system or method to use in humans. Although not intended, the use of the invention in human patients represents a preferred embodiment. Also, the term “analyte” includes, but is not limited to, any component (eg, “physiological fluid”) of any fluid that can be extracted from a user, including blood, urine, saliva, or sweat (eg, Glucose, ketone, urea, cholesterol, hematocrit, etc.).
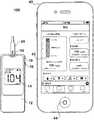
図1Aは、生体内感知装置で使用するためのグルコース試験ストリップ20の形態の分析物測定ユニット10(「AMU」)、及びモバイル通信デバイス40を含む、慢性疾患管理システム100を示す。グルコース測定器又はAMU 10は、図1Aに示すように、ハウジング12、ディスプレイ14、ストリップポートコネクタ16、及びデータポート18を含むことができる。ボタンは示されていないが、バーチャルボタンを有するタッチスクリーンが利用されてもよい。通信デバイス40は、機械的ホームスイッチ44を有する、ディスプレイ42、好ましくは、タッチスクリーン型ディスプレイを含む。 FIG. 1A illustrates a chronic
図1Bは、回路基板22の上面上に配置されたAMU 10の電子構成要素を(概略的な形で)示す。上面上に、電子構成要素は、ストリップポートコネクタ16と、マイクロコントローラ24と、ディスプレイコネクタ14aと、不揮発性メモリ40と、時計42と、第1のワイヤレスモジュール1と、を含む。下面上に、電子構成要素は、バッテリコネクタ(図示せず)と、データポート18と、を含んでもよい。マイクロコントローラ24は、ストリップポートコネクタ16、オペアンプ回路(簡潔にするために図示せず)、無線モジュール26、ディスプレイ14、不揮発性メモリ(簡潔にするために図示せず)、クロック(簡潔にするために図示せず)、電池(簡潔にするために図示せず)、及びデータポート18に電気的に接続されてもよい。 FIG. 1B shows (in schematic form) the electronic components of the
オペアンプ回路(簡潔にするために図示せず)は、ポテンシオスタット機能及び電流測定機能の一部を提供するように構成される、2つ以上のオペアンプを含むことができる。ポテンシオスタット機能とは、試験ストリップの少なくとも2つの電極間に試験電圧を加えることを指し得る。電流機能とは、加えられた試験電圧によって生じる試験電流を測定することを指し得る。電流測定は、電流電圧変換器によって行うことができる。マイクロコントローラ24は、例えば、Texas Instrument MSP 430などの混合シグナルマイクロプロセッサ(MSP)の形態であってよい。MSP 430は、ポテンシオスタット機能及び電流測定機能の一部を行うように構成することもできる。更に、MSP 430は、揮発性及び不揮発性メモリを含むこともできる。別の実施形態において、電子構成要素の多くを特定用途向け集積回路(ASIC)の形態でマイクロコントローラに組み込むことができる。 An operational amplifier circuit (not shown for brevity) can include two or more operational amplifiers that are configured to provide part of the potentiostat function and the current measurement function. The potentiostat function may refer to applying a test voltage between at least two electrodes of the test strip. Current function may refer to measuring the test current caused by the applied test voltage. The current measurement can be performed by a current-voltage converter. The microcontroller 24 may be in the form of a mixed signal microprocessor (MSP), such as, for example, a
ストリップポートコネクタ16は、試験ストリップと電気的接続を形成するように構成することができる。ディスプレイ14は、測定された分析物値を報告し、生活習慣に関連した情報の入力を容易にするための、液晶ディスプレイの形態であってよい。ディスプレイ14は、任意にバックライトを有してよい。あるいは、ディスプレイ14は、ボタン及びスイッチを必要とすることなく、データ入力及び応答を可能にする、タッチスクリーンディスプレイを含んでもよい。データポート18は、接続リード線に取り付けられる、好適なコネクタを受容し、それにより、AMU 10が、パーソナルコンピュータ等の外部デバイスに連結されることを可能にすることができるか、又は測定器10の再充電可能電池が再充電されることを可能にすることができる。データポート18は、例えば、シリアル、USB、又はパラレルポートなど、データ送信が可能な任意のポートであってもよい。好ましくは、データポート18は、USB 2.0ポートの形態である。クロック(簡潔にするために図示せず)は、ユーザーが位置する地理的領域に関連する現在時刻を維持し、また時間を計測するように構成され得る。AMU 10は、例えば、電池などの電源に電気的に接続されるように構成され得る。 The
AMU 10は、例えば、グルコース、ケトン、コレステロール等の生理学的流体中の分析物の1つ以上の測定を提供する、好適な分析物試験ストリップ(例えば、電気化学的又は光化学的)と協働するように設計される。例示的な一実施形態では、試験ストリップ20は、電気化学的グルコース試験ストリップの形態であり得る。試験ストリップ20は、1つ以上の作用電極及び対電極を含んでよい。試験ストリップ20は、更に複数の電気的接触パッドを含んでもよく、その場合、各電極は、少なくとも1つの電気的接触パッドと電気的に連通してもよい。ストリップポートコネクタ16は、電気的接触パッドと電気的にインターフェースし、電極と電気的に連通しているように構成されてよい。試験ストリップ20は、少なくとも1つの電極上に配置されている試薬層を含むことができる。試薬層は、酵素及び調節物質を含み得る。試薬層に使用するのに適した例示的な酵素としては、グルコースオキシダーゼ、グルコースデヒドロゲナーゼ(ピロロキノリンキノン補因子「PQQ」とともに)、及びグルコースデヒドロゲナーゼ(フラビンアデニンジヌクレオチド補因子「FAD」とともに)が挙げられる。試薬層に使用するのに適した例示的な調節物質としては、フェリシアニドがあり、この場合では酸化型である。試薬層は、分析物(例、グルコース)を酵素的副産物に物理的に変換させ、その過程で分析物濃度に比例した所定量の還元型の調節物質(例、フェロシアニド)を生成するように構成することができる。この後、作用電極によって還元型調節物質の濃度を電流の形態で測定することができる。次いで、AMU 10は、電流の大きさを分析物濃度に変換することができる。好ましい試験ストリップの詳細は、米国特許第6179979号、同第7045046号、同第7291256号、同第7498132号に提供されており、当該特許の全ては、参照によりその全体が本明細書に組み込まれる。
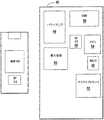
再び図1Bを参照すると、概略的形態で、その上にある特定の構成要素が配置される、手持ち式演算器40の回路基板46が示される。パワーアンプチップセット48は、電力管理チップセット50と共に、マイクロプロセッサ52に対して提供されるが、それは、メモリチップセット54、無線通信モジュール56(例えば、Bluetooth(登録商標) 2.0)、GSM(登録商標)又はGPRSチップセット58、及びWi−Fiチップセット60に連結される。市販のポータブル通信デバイスの例としては、Blackberry Torch Smartphone、Android Smartphone、iPhone、iPod Touch、iPad、並びにNokia、LG、Samsung、及びMotorolaからのその他のものが挙げられる。本明細書に用いるポータブル通信デバイスは、スマートフォンである必要はないが、データをサーバと通信し合う能力を有する、任意の手持ち式ポータブルコンピュータデバイスを含んでもよいことに留意されたい。好ましくは、ポータブル通信デバイスは、iPhone 4Gである。 Referring again to FIG. 1B, in schematic form, there is shown a
操作中、患者は、血液検査を実施することによって、システム100の使用を開始してもよい。具体的には、好適な試験ストリップ20がAMU 10に挿入され、デバイスをオンにする。血液又は好適な生理学的流体が、好適なデバイス(例えば、ランセット)によって抽出され、ストリップ20の遠位端上に配置される。流体の付着は、分析物(例えば、グルコース)の酵素副生成物、例えば、グルコン酸への物理的形質転換を開始し、それにより、AMU 10が、試験ストリップの試験チャンバ中の酵素反応からの電流フローを測定することを可能にする。酵素反応が行われ、反応からの電流が測定された後に、分析物結果、又は例示の実施形態において、202の血中グルコース(「BG」)の結果が、ユーザーに通知される。本明細書で用いる「通知された」という用語及びこの語幹の変形は、文字、音声、画像又は全ての通信の態様の組み合わせを介してユーザーに通知されることを表す。 During operation, the patient may begin using the
ユーザーの健康又は疾病の管理においてユーザーを補助するための更なる処理のために、試験(例えば、電気化学的又は電気光学的)からの結果もまた、可能な場合すぐに、手持ち式演算器40に転送される。システム100中に種々の機能性が提供されるが、それらの機能性は、2010年2月25日出願の米国特許仮出願番号第61/308,217号(代理人整理番号DDI−5194USPSP)、及び2010年6月9日出願の米国特許出願番号第12/826,543号(代理人整理番号DDI−5194USNP)に示され、記載され、それらは、参照により全体として本願に組み込まれる。すでに述べた出願によって記載される機能性が、AMU 10又はHCU 40のいずれかにおいて、これらのデバイスのうちの一方又は両方の一部又は全部において、利用され得ることに留意されたい。 For further processing to assist the user in managing the user's health or illness, the results from the test (eg, electrochemical or electro-optical) are also available as soon as possible. Forwarded to Various functionalities are provided in the
デバイス40が、最近出された分析物測定結果の高傾向(又は低傾向)をユーザーに警告することを可能にするために、システム100において1つの機能性が提供される。低傾向パターン検出に対する論理の2つの変化形が、図2A及び2Bに関連して本明細書に示され、記載されるが、一方で、高傾向パターン検出に対する論理の2つの変化形は、図3A及び3Bに記載される。 One functionality is provided in the
図2A中、瞬間又は最新のBGは、402において、かかるBGが第1の閾値未満であるかどうかを決定するために比較される。402において真である場合、マイクロプロセッサは、404において、最新のBG測定結果602が最新のN日数で出されたのと同一の期間(9:30AM)を区分する、X時間のウィンドウ(例えば、約8AM〜約11AMの約3時間)内で出された、複数の分析物測定結果のうちの少なくとも1つ以上が、第1の閾値よりも低いかどうかを決定する。一実施例では、BG結果は65mg/dLであり、それは、約70mg/dLのプリセット第1の閾値未満である。BGは、9:30AM前後に測定された。本明細書に記載する論理に基づき、マイクロプロセッサ52は、以前のN日数中に最新の血液測定結果が出された時間(すなわち、9:30AM前後)を区切る、X時間のタイムフレームで出されたその記憶された分析物測定結果を見て、所与の時間(すなわち、9:30AM)前後のかかる区分されたタイムフレーム中の少なくとも1つの分析物測定結果が、第1の閾値よりも低いかどうかを決定する。少なくとも1つの以前の測定結果がこの条件に適合する場合、マイクロプロセッサは、低傾向の警告の形態で、技術的効果を提供するメッセージ406を通知する(例えば、図4A)。具体的には、図4Aのスクリーン604に示すように、テキストメッセージは、プリセットN日数のそれぞれにわたって、65mg/dLの最新の分析物測定結果が出された所与の時間を区分する、同一タイムフレームに対して、低傾向が検出されたことを示すために、任意のスクリーンにおいてポップアップしてもよい。ユーザーが最新の分析物結果を見たい場合、スクリーン608が表示されてもよく、低傾向メッセージに対する選択609が選択され得る。「表示」ボタン609の選択は、ユーザーが、図4Bのスクリーン610上に示されるように、例えば、日付、時間、BG結果の値、及びBG結果に関連する他の文脈的情報、例えば、運動、食事、又はインスリン薬物をリストアップする表等、低傾向の検出に関する詳細を見ることを可能にする。 In FIG. 2A, the instantaneous or latest BG is compared at 402 to determine whether such BG is below a first threshold. If true at 402, the microprocessor, at 404, has a window of X hours that partitions the same period (9:30 AM) that the latest BG measurement result 602 was issued in the latest N days (eg, It is determined whether at least one or more of the plurality of analyte measurements made within about 3 hours of about 8 AM to about 11 AM is lower than the first threshold. In one example, the BG result is 65 mg / dL, which is less than a preset first threshold of about 70 mg / dL. BG was measured around 9:30 AM. Based on the logic described herein,
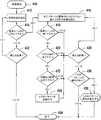
図2Aの論理の代替として、図2Bの論理もまた利用され得る。410において、論理流れ図は、AMU 10から手持ち式演算器40への1つ以上のBG結果の転送で始まる。HCU 40のプロセッサ52は、412においてBG結果を読み、低パターン傾向検出の分析を開始する。414において、結果がプリセット下限「LOW」よりも低いかどうかに関する決定が行われる。真である場合、論理は、任意の検出されたパターンの一部として利用されない、前の5日間から収集された結果を読む。418において、論理は、最新の結果がLOW(下限)未満であるか確認し、真である場合、論理は、420に流れ、前日のいずれかの時点で、前の日付のBG(「前のBG」)の結果がLOW(下限)よりも低いかどうかを判定するために決定される。真の場合、プロセスは、工程422に流れるが、前のBG結果が、最新のBG結果が出された時間に及ぶ時間ウィンドウ(例えば、3時間)内に入るかどうかが決定される。本実施例において、最新のBG結果が9:00AMに出された場合、前のBGは、(a)LOW(下限)よりも低くなければならず、(b)前の日(複数可)の6:00AM〜正午までの任意の時間に測定されなければならない。422において真の場合、プログラムは、低パターン424の一部として、これらの結果を記録する。決定418に戻ると、最新の結果がLOW(下限)以上である場合、プロセスは、426に流れるが、システムは、414〜424の論理プロセスが実行されている間に、更なる結果が転送されたか確認する。426において真である場合、プロセスは、除外416に戻り、工程418〜424がもう一度利用される。426において偽である場合、プロセスは、決定428に流れ、HCU 40において識別及び記憶されたLOWパターンがあるか判定する。真の場合、HCU 40は、430において、低パターン傾向警告を通知する。 As an alternative to the logic of FIG. 2A, the logic of FIG. 2B can also be utilized. At 410, the logic flow diagram begins with the transfer of one or more BG results from the
プロセス414に戻ると、プロセスが414で偽を返す場合、流れは432に進み、結果への更新があるか判定する。工程412〜424が実行されている間に、新しい結果が転送されなかったとすれば、論理は、434で終了する。 Returning to process 414, if the process returns false at 414, flow proceeds to 432 to determine if there is an update to the result. If no new results were transferred while steps 412-424 were being executed, the logic ends at 434.
ここで図3Aに例示的に示される、高傾向検出論理800もまた、システムに提供される。高傾向パターン検出の適切な操作を確実にするために、デバイス40中でメッセージが提供され、高傾向がユニットによって検出されるために、ユーザーにBG測定結果にタグ又はフラグを付けるように気付かせてもよい。ユーザーが空の第2の閾値を選択することを主張する場合、高傾向が検出されるために、タグ付け機能性が使用可能でなければならないという趣旨のメッセージが表示される。これは、ユーザーが食前の限度とタグ付けとの間の関係を理解するのを助けることを目的とする。換言すれば、食前測定結果のタグ付けが行われない場合、高傾向メッセージの提供にはほとんど価値がない。更に、たとえタグ付けが使用可能であっても、ユーザーは、食前の高傾向がユーザーにとって有益であるために、タグ付けが常に使用されるべきであることを、メッセージによって気付かされる。 High
図3Aのこの論理流れ図において、最新のBG結果が高閾値を超えるかどうかに関して、論理的質問802が行われる。真の場合、論理的質問804は、最新のBG結果が食前のBG結果又は空腹時のBG結果としてタグ付けされたかどうかに関する。真の場合、論理は、質問806に流れ、前のN日数(例えば、4日間)にわたる2つ以上の前のBG測定結果が高閾値を超えるかどうかを決定する。真の場合、論理は、質問808に流れ、同一の2つ以上のBG結果が両方とも、食前のBG結果又は空腹時のBG結果のいずれかとしてフラグ付けされたかどうかを決定する。真の場合、論理は、質問810に流れ、最新のBG結果及び同一の2つ以上の前のBG結果が全て、X時間タイムフレーム内で生じているかどうかを決定する。真の場合、論理800は、出力812において、高傾向の警告を通知する技術的効果を提供する。質問802〜810において、論理が偽を返す場合、ルーチンは814で終了する。好ましい実施形態において、変数Nは、約2〜90日の任意の値であってもよく、Xは、約1時間〜約12時間の任意の値であってもよい。 In this logic flow diagram of FIG. 3A, a
論理800の一実施例として、以下の表1に記載するように、ユーザーが月曜日から金曜日まで一連の測定を実施し、最新のBG結果は、金曜日の9AMであると仮定してみる。 As an example of

表1を参照すると、最新のBGは、論理的質問802及び804に対して、論理的に真の状態を有する(すなわち、高閾値を超え、空腹時としてフラグ付けされる)。最後の4日間のそれぞれに対する少なくとも1つのBGは、論理的質問806及び808に対して、論理的に真の状態を有する。論理的質問810は、少なくとも3つのBGを評価しなければならないが、それらは、最新のBG(質問802及び804から)、並びに少なくとも2つのBG(質問806及び808から)である。 Referring to Table 1, the latest BG has a logical true state for
前の4日間に収集された結果に基づき、警告メッセージは、金曜日9:00AMの最新のBGと共に通知される。3時間区分は、時刻の時系列で、7:50AM(月曜日)、9:00AM(金曜日)、及び10:49AM(火曜日)を含んでもよく、最遅時刻と最早時刻との差は、3時間未満である(10:49AM−7:50AM=2時間59分)。したがって、月曜日、金曜日、及び火曜日のBGは、3時間区分内に入る。月曜日、金曜日、及び火曜日に加えて、3時間区分はまた、時刻の時系列で、7:40AM(水曜日)、7:50AM(月曜日)、及び9:00AM(金曜日)を含んでもよく、最遅時刻と最早時刻との差は、3時間未満である(9:00AM−7:40AM=1時間20分)。 Based on the results collected in the previous 4 days, a warning message is notified with the latest BG at 9:00 AM on Friday. The 3 hour section is a time series of time, and may include 7:50 AM (Monday), 9:00 AM (Friday), and 10:49 AM (Tuesday). The difference between the latest time and the earliest time is 3 hours. (10:49 AM-7: 50 AM = 2 hours 59 minutes). Therefore, Monday, Friday, and Tuesday BGs fall within the 3 hour segment. In addition to Monday, Friday, and Tuesday, the 3-hour section may also include the time series of time: 7:40 AM (Wednesday), 7:50 AM (Monday), and 9:00 AM (Friday), the latest The difference between the time and the earliest time is less than 3 hours (9:00 AM-7: 40 AM = 1
再び表1を参照すると、水曜日に対して高傾向警告はない。水曜日に対して、2つの前のBG及び1つの最新のBGが論理的質問810において評価されるが、それらは、7:40AM(水曜日)、7:50AM(月曜日)、及び10:49AM(火曜日)であり、最遅時刻と最早時刻との差は、3時間を超える(すなわち、10:49AM−7:40AM=3時間9分)。したがって、水曜日、月曜日、及び火曜日のBGは、3時間区分内に入らない。 Referring back to Table 1, there is no high trend warning for Wednesday. For Wednesday, two previous BGs and one latest BG are evaluated in
再び表1を参照すると、木曜日に対して高傾向警告はない。木曜日に対して、2つの前のBG及び1つの最新のBGは、論理的質問810において評価される。論理的質問810において評価され得る前の日にちの3つの組み合わせがあるが、それらは、月曜日/火曜日;月曜日/水曜日;及び火曜日/水曜日であることに留意されたい。ここで、前の日にちの組み合わせのうちのいずれか1つを最新のBGと組み合わせると、3時間区分内に入る3つのBGをもたらすことはない。 Referring back to Table 1, there is no high trend warning for Thursday. For Thursday, two previous BGs and one latest BG are evaluated in a
表1に記載する実施形態において、高閾値を超え、空腹時としてフラグ付けされる、たった1つの1日あたりのグルコース濃度のみが図示されることに留意されたい。他の状況において、高閾値を超え、空腹時としてフラグ付けされる、2つ以上の1日あたりのグルコース濃度が存在する場合がある。そのような場合、論理800によって評価される必要がある3つのBGの組み合わせの数は増加する。 Note that in the embodiment described in Table 1, only one glucose concentration per day, which is above the high threshold and flagged as fasting, is shown. In other situations, there may be more than one daily glucose concentration that exceeds the high threshold and is flagged as fasting. In such a case, the number of three BG combinations that need to be evaluated by
論理ルーチン800の適用性の更なる実証として、本明細書の表2に記載されるように、ユーザーが更に(表1の)金曜日に続く土曜日に最新のBG測定を実施したと考える。 As a further demonstration of the applicability of the
表2中、論理800は、土曜日(11:50AM)に高傾向警告を検出し、それは、最新のBGと共に通知される。論理的質問810において評価され得る前の日にちの6つの組み合わせがあるが、それらは、月曜日/火曜日;月曜日/水曜日;月曜日/木曜日;火曜日/水曜日;火曜日/木曜日;及び水曜日/木曜日であることに留意されたい。3時間区分は、時刻の時系列で、10:49AM(火曜日)、11:30AM(木曜日)、及び11:50AM(土曜日)を含むことができ、最遅時刻と最早時刻との差は、3時間未満である(すなわち、11:50AM−10:49AM=1時間1分)。したがって、火曜日、木曜日、及び土曜日のBGは、3時間区分内に入る。表2に基づき要約すると、ユーザーに、2つのメッセージが、1つは金曜日に、別のメッセージは土曜日に提供される。しかしながら、別の方法としては、傾向データの優先順位付けによって、2つの高傾向を報告する、たった1つのメッセージのみが土曜日に生成されてもよい。高傾向又は低傾向報告の優先順位付けは、以下に基づくことができる:一旦グルコース値が(高又は低)傾向に使用されると、それはもはや他の(高/低)傾向で使用されなくなる;複数の傾向が検出される場合、結果の最も高度なクラスタリングが報告される傾向になる;又は1時間以内に複数の高及び低BG測定結果が存在する場合、最初のもののみが傾向分析に含まれる(すなわち、1時間内に複数の高値あるいは1時間以内に複数の低値が存在する場合、最初のもののみが傾向分析に含まれる)。あるいは、優先順位付けは、時間的近接に基づくか、又はクラスタリングの密接さに基づいてもよく、それは、最新のBG結果に時間が最も近い2つのBG結果、又は最新のBG結果に時間が最も近い3つのBG結果によって決定されてもよい。 In Table 2,
また、ここで図3Bに例示的に示される、高BG傾向を検出するための代替の論理が利用されてもよい。図3B中、論理流れ図は、500において、AMU 10から手持ち式演算器40への1つ以上のBG結果の転送で始まる。HCU 40のプロセッサ52は、502においてBG結果を読み、高パターン傾向検出の分析を開始する。504において、結果がプリセット上限「HIGH」よりも高いかどうかに関する決定が行われる。真である場合、論理は、506において、任意の検出されたパターンの一部として利用されない、前の5日間から収集されたBG結果を読む。508において、論理は、最新の結果がHIGH(上限)を超えるかを確認し、真である場合、510において、前のBG結果が前の日であったか、512において、最新のBG結果が出された時間に及ぶ時間ウィンドウ(例えば、3時間)内に入るか、514において、「食前」測定結果としてタグ又はフラグ付けされたか、並びに516において、少なくとも3つのかかる結果が見られるかが決定され、そのような場合、高いパターンがこれらの結果に対して記録される。本実施例において、最新のBG結果が9:00AMに出された場合、前のBGは、(a)HIGH(上限)よりも高くなければならない、(b)前の日(複数可)において、6:00AM〜正午の任意の時間に測定されなければならない、(c)食前としてフラグ付けされなければならない、(d)これらの閾値に適合する、少なくとも3つのかかる測定結果を伴わなければならない。決定工程508に戻ると、最新の結果がHIGH(上限)を超えない場合、プロセスは、520に流れ、システムは、504〜518の論理プロセスが実行されている間に、更なる結果が転送されたか確認する。520において真である場合、プロセスは、除外工程506に戻り、工程508〜518がもう一度利用される。520において偽であると決定される場合、プロセスは、決定428に流れ、HCU 40中に識別及び記憶されるHIGHパターンがあるか判定する。真の場合、HCU 40は、524において、高パターン傾向警告を通知する。 Also, alternative logic for detecting high BG trends, as illustrated here in FIG. 3B, may be utilized. In FIG. 3B, the logic flow diagram begins at 500 with the transfer of one or more BG results from the
プロセス500に戻ると、プロセスが504で偽を返す場合、流れは526に進み、結果への更新があるか判定する。工程508〜518が実行されている間に、新しい結果が転送されなかったとすれば、論理は、528で終了する。好ましい実施形態では、X時間のウィンドウは、約1〜約6時間(又は分で表される時間)の任意の数値を含み、N日数は、約2〜約21日に及んでもよい。別の好ましい実施形態では、X時間のウィンドウは、約3時間を含み、N日数は、約2〜約30日、及び最も好ましくは、約2〜約5日に及んでもよい。更なる好ましい実施形態では、N日数は、約2日〜約90日に及んでもよい。「日」という用語が、任意の24時間を意味し、それが、ユーザーの一般に理解される開始点(例えば、4AM〜8AM)と一致するその開始時間を有してもよいことに留意されたい。 Returning to process 500, if the process returns false at 504, flow proceeds to 526 to determine if there is an update to the result. If no new results were transferred while steps 508-518 were being executed, the logic ends at 528. In a preferred embodiment, the X hour window comprises any number from about 1 to about 6 hours (or hours expressed in minutes) and the N days may range from about 2 to about 21 days. In another preferred embodiment, the X hour window may comprise about 3 hours and the N days may range from about 2 to about 30 days, and most preferably from about 2 to about 5 days. In further preferred embodiments, the N days may range from about 2 days to about 90 days. Note that the term “day” means any 24 hours and may have its start time consistent with the user's generally understood start point (eg, 4 AM-8AM). .
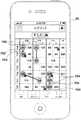
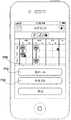
高パターン又は低パターンは、HCU 40中に記憶され、固有の方法でユーザーに通知される。具体的には、図5Aに示すように、HCU 40のディスプレイは、HCU中に記憶される測定結果が1つ以上のパターンの一部であるかどうかを評価するように、そのプロセッサによって制御され得る。結果が任意の高又は低パターンの一部ではない場合、結果(例えば、「食後」測定結果として、「7月26日」の「午前」の列中に値「120」を示す、結果700が本明細書に示される)は、その明度がスクリーン上の他のしるしと実質的に関連して暗くなるように表示される。結果が低傾向の一部である場合(例えば、7月25及び26日の両日に対して、「午前」の期間に低傾向を示す、参照番号702)、結果は、例えば、第1の色の多角形、例えば、ベタの円のそれぞれの間にグラフィックシンボル又はコネクタ703を有する、ベタの円等、第1のしるしとして表示される。測定結果の数値はまた、多角形上のオーバーレイとして提供されてもよい。結果が高傾向の一部である場合(例えば、7月20、21、及び22日に対して、「夕方」の期間に高傾向を示す、参照番号704)、結果は、例えば、第1の色とは異なる第2の色で、第2のしるしとして表示される。グラフィックシンボル、又はコネクタ705は、これらの値が、本明細書に記載する論理に従って高傾向の一部であることを示すために、利用されてもよい。他のしるし(例えば、シンボル、色、マーク)もまた、分析物測定結果に関連する他の文脈的データを提供するために利用され得る。本実施例において、HCU 40のディスプレイは、64の測定結果が得られる前後に、インスリンが摂取されたことを示すために、大文字「I」を表示するように構成され得る。 The high or low pattern is stored in the
図5Cを参照すると、図5Aの高又は低パターンに対する代替のディスプレイが提供され得る。例えば、結果(例えば、「食後」測定結果として、「7月26日」の「午前」の列中に値「120」を示す、結果700aが本明細書に示される)は、その明度がスクリーン上の他のしるしと実質的に関連して暗くなるように表示される。結果が低傾向の一部である場合(例えば、7月24日、25日、及び26日に対して、「午前」の期間中に低傾向を示す、参照番号702a)、結果は、例えば、第1の色の多角形、例えば、7月24日、25日、及び26日の値を接続する、接続かつ統合された一連の正方形703a等、第1のしるしとして表示される。測定結果の数値もまた、多角形の内側に提供され得る。結果が高傾向の一部である場合(例えば、7月24日、25日、及び27日に対して、「夜」の期間に高傾向を示す、参照番号704a)、結果は、例えば、第1の色とは異なる第2の色の多角形等、第2のしるしとして表示される。相互と統合して多角形705aを形成する一連の正方形は、これらの値が、本明細書に記載する論理に従って高傾向の一部であることを示すために、利用されてもよい。 Referring to FIG. 5C, an alternative display for the high or low pattern of FIG. 5A may be provided. For example, a result (e.g., the
ユーザーが傾向に対して更なる詳細を求める場合、ユーザーは、例えば、7月25日及び1日の低傾向パターン等、図5A又は5C中の関連するしるしに触れることができる。これにより、HCU 40は、図5B中の更なる詳細なデータ、例えば、61mg/dLの測定結果が7:00AM、食前に出されたこと(しるしによって表される)、並びに他の文脈的データ、例えば、5グラムの量の7:30AMの炭水化物「C」、6:40AMの軽い運動「E」、及び6:30AMの即効性インスリン「I」を表示する。 If the user seeks further details on the trend, the user can touch the associated indicia in FIG. 5A or 5C, such as the July 25 and 1 day low trend patterns. This allows
例示のシステムはまた、ログブックが介護者若しくは医療提供者と共有されること、又はユーザーがログブックの解釈においてヘルプを求めることを可能にする。この機能は、図6A及び6Bに示される。図6A中、ユーザーがログブックの出力を共有したい場合、ユーザーは、タッチスクリーン40の好適なオープンエリア上で単純にタップする。これは、ユーザーが「ヘルプ」か「共有」かを選択するポップアップ選択708を開始する。 The exemplary system also allows the logbook to be shared with caregivers or health care providers, or allows the user to seek help in interpreting the logbook. This function is illustrated in FIGS. 6A and 6B. In FIG. 6A, if the user wants to share the logbook output, the user simply taps on the preferred open area of the
「ヘルプ」の選択は、経時的により低い傾向を示すグルコース値の影響、若しくは医療提供者からの許可された品目に関する、好適な媒体、例えば、ビデオを起動する。あるいは、「ヘルプ」の選択は、事前に選択された電話番号又はウェブサイトに対するコールを開く。「共有」の選択は、オーバーレイ709を起動し、3つの選択を有する:ログブックデータのコピーを別のユーザーに送信すること;ログブックのテキスト説明を含む、テキストメッセージを送信すること;又はこの機能をキャンセルすること。 Selecting “Help” launches a suitable medium, such as a video, regarding the effects of glucose values that tend to be lower over time, or authorized items from health care providers. Alternatively, selecting “Help” opens a call to a preselected phone number or website. The “Share” selection activates
システムが提供する別の機能は、グラフィック形式で分析物測定結果を表示する能力である。本実施例では、図7Aのスクリーン800において、測定結果は、カーデシアングラフで表示され、50〜400(mg/dLで)の分析物の値に対する、802で参照される数値、及び804で参照される日付の範囲にわたって、高傾向、低傾向、炭水化物、運動、又はインスリンを示す異なるしるしを有する。スクリーン800において、グラフは、例えば、60〜170(mg/dLで)の分析物測定結果に対する許容可能な範囲を示す、半透明の矩形806と重ね合わされる。第1の色のベタの多角形は、測定結果が低傾向パターンに属することを示し得、第2の色のベタの多角形は、測定結果が高傾向パターンに属することを示し得る。図7Bにおいて、808a、808b、及び808cで示される3つの測定結果は、図3A及び3Bの高傾向パターン決定論理のうちの1つ以上を使用して決定される、高傾向の一部として示される。 Another function provided by the system is the ability to display analyte measurement results in a graphical format. In the present example, on the
図7A及び7Bにあるように、数値範囲及び日付に対して表される測定結果を表示する代わりに、HCU 40は、日数に関係なく、数値範囲及び時刻に対して測定された分析物の値を表してもよい。図8に示されるように、複数日にわたって5pm頃に測定された、高傾向の一部である、測定結果800は、第1のしるしを使用した測定結果の群として表示され、それは、ベタの多角形及び第1の色を含んでもよい。複数日にわたって5PM頃の低傾向の一部である、測定結果802はまた、第2のしるしを使用した群として表示され、それは、ベタの多角形、及び第1の色とは異なる第2の色を含んでもよい。フラグ付けされていないが、1日のある特定の時間頃に出された測定結果は、第3のしるしによって表され得、それは、第3の色を有する円を含んでもよい。一例は、参照番号804とともにここに示される。 As shown in FIGS. 7A and 7B, instead of displaying the measurement results expressed for a numerical range and date, the
本明細書に記載するシステム及びプロセスによって、分析物測定ユニットを用いて得られた分析物値の高又は低傾向をユーザーに通知する方法が提供される。本方法は、マイクロプロセッサを用いて、複数の分析物測定を実施する工程と;メモリ中に、複数の分析物測定結果を記憶する工程と;最新の分析物測定結果が第1の閾値未満である、又は第2の閾値を超えるかどうかを決定する工程と;マイクロプロセッサを用いて、N日の期間にわたって、最新の分析物測定結果としてタイムフレーム内で実施される複数の分析物測定結果のうちの少なくとも1つの分析物測定結果が、第1の低閾値よりも低い、又は第2の閾値よりも高いかどうかを評価する工程と;N日数にわたって少なくとも2日の同一のタイムフレームで、複数の分析物測定結果が、低閾値よりも低い傾向又は第2の閾値よりも高い傾向を示すことを通知する工程と、を含んでもよい。 The systems and processes described herein provide a method for notifying a user of high or low trends in analyte values obtained using an analyte measurement unit. The method uses a microprocessor to perform a plurality of analyte measurements; storing a plurality of analyte measurements in memory; and the latest analyte measurement is less than a first threshold value. Determining whether a certain or second threshold is exceeded; using a microprocessor, for a plurality of analyte measurements performed within a time frame as the latest analyte measurement over a period of N days; Assessing whether at least one of the analyte measurements is lower than the first low threshold or higher than the second threshold; and multiple in the same time frame for at least 2 days over N days Informing that the analyte measurement result of the above indicates a tendency to be lower than the low threshold or higher than the second threshold.
更に、本明細書に記載する種々の方法は、既製のソフトウェア開発ツール、例えば、Visual Studio 6.0、C又はC++(及びその変化形)、並びにApple、Blackberry、Google、及び他のそれほど知られていないソフトウェア及びハードウェアプロバイダからの好適なソフトウェア開発キット(「SDK」)を使用して、ソフトウェアコードを生成するために使用され得る。しかしながら、これらの方法は、こうした方法をコードするための新しいソフトウェア言語の必要条件及び入手可能性に応じて、他のソフトウェア言語に変換することもできる。更に、本明細書で述べた様々な方法は、適当なソフトウェアコードに一旦変換されれば、適当なマイクロプロセッサ又はコンピュータによって実行される際に、これらの方法において述べられた工程をあらゆる他の必要な工程とともに実行するように動作する、任意のコンピュータ読み出し可能な記憶媒体として実施することができる。 In addition, the various methods described herein are off-the-shelf software development tools such as Visual Studio 6.0, C or C ++ (and variations thereof), and Apple, Blackberry, Google, and other lesser known methods. A suitable software development kit ("SDK") from non-software and hardware providers can be used to generate software code. However, these methods can also be translated into other software languages, depending on the requirements and availability of new software languages to code such methods. Further, the various methods described herein, once converted to the appropriate software code, perform the steps described in these methods on any other need when executed by a suitable microprocessor or computer. It can be implemented as any computer readable storage medium that operates to execute with various processes.
本発明を特定の変形例及び説明図に関して述べたが、当業者には本発明が上述された変形例又は図に限定されないことが認識されよう。更に、上述の方法及び工程が特定の順序で起こる特定の事象を示している場合、当業者には特定の工程の順序が変更可能であり、そうした変更は本発明の変形例に従うものである点が認識されよう。更に、こうした工程のうちのあるものは、上述のように順次行われるが、場合に応じて並行したプロセスで同時に行われてもよい。したがって、開示の趣旨及び請求項に見出される本発明の同等物の範囲内にある本発明の変形が存在する範囲では、本特許請求がこうした変形例をも包含することが意図されるところである。 Although the present invention has been described with respect to particular variations and illustrations, those skilled in the art will recognize that the present invention is not limited to the variations or figures described above. Further, if the methods and processes described above indicate specific events that occur in a specific order, those skilled in the art can change the order of specific processes, and such changes are subject to variations of the present invention. Will be recognized. Furthermore, some of these steps are performed sequentially as described above, but may be performed simultaneously in parallel processes as the case may be. Accordingly, it is intended that the appended claims cover such modifications as come within the spirit of the disclosure and the scope of equivalents of the present invention as found in the claims.
Claims (26)
Translated fromJapanese前記プロセッサに連結され、複数の分析物測定結果を含むデータを、分析物測定デバイスから受信するように構成される、通信モジュールと、
前記プロセッサに連結される、ディスプレイスクリーンと、
前記プロセッサに連結される、メモリ記憶装置であって、前記メモリが、一例として、
第1の閾値未満である、1日のうちの所与の時間の最新の分析物測定結果と、
前記第1の閾値よりも低い、N日の期間にわたる前記最新の分析物測定結果の前記所与の時間に関して、X時間のタイムフレーム内で実施される少なくとも1つ以上の分析物測定結果と、
を含む、データを受信するように構成される、メモリ記憶装置と、
を備える、モバイルコンピュータデバイスであって、
前記例では、前記プロセッサが、それぞれ行ヘッダ及び列ヘッダを有する複数の行及び複数の列を有する表を表示するように、前記ディスプレイスクリーンを制御するように構成され、前記列ヘッダが、1日のうちの異なる期間を示し、前記1日の各期間内の食前又は食後の分析物測定結果を示す、前記列ヘッダのそれぞれの細分割部を有し、前記行ヘッダが、各分析物測定結果の日付を示し、1つの分析物傾向の一部として識別される分析物値を表す数値が、第1のしるしによって表され、別の分析物傾向の一部として識別される分析物値を表す数値が、前記第1のしるしとは異なる第2のしるしによって表され、
N日の期間にわたる前記最新の分析物測定結果の前記所与の時間に関して、X時間のタイムフレーム内の前記第1の閾値よりも低い分析物測定結果の傾向に対する、記憶された分析物の前記第1のしるしの分配が、グラフィックコネクタにより前記第1のしるしの前記分配のそれぞれに接続される、モバイルコンピュータデバイス。A processor;
A communication module coupled to the processor and configured to receive data comprising a plurality of analyte measurement results from the analyte measurement device;
A display screen coupled to the processor;
A memory storage device coupled to the processor, wherein the memory is, by way of example,
The latest analyte measurement for a given time of the day that is less than the first threshold; and
At least one analyte measurement performed within a time frame of X hours for the given time of the most recent analyte measurement over a period of N days below the first threshold;
A memory storage device configured to receive data, comprising:
A mobile computing device comprising:
In the example, the processor is configured to control the display screen to display a table having a plurality of rows and a plurality of columns, each having a row header and a column header, wherein the column header is Each column has a respective subdivision of the column header, indicating the analyte measurement results before or after the meal within each period of the day, wherein the row header is each analyte measurement result A numeric value representing an analyte value identified as part of one analyte trend and represented by a first indicia and representing an analyte value identified as part of another analyte trend A numerical value is represented by a second indicia different from the first indicia;
For the given time of the most recent analyte measurement over a period of N days, the stored analyte of the stored analyte against the trend of the analyte measurement lower than the first threshold within a time frame of X hours A mobile computing device, wherein a distribution of first indicia is connected to each of the distributions of the first indicia by a graphic connector.
前記プロセッサに連結され、複数の分析物測定結果を含むデータを、分析物測定デバイスから受信するように構成される、通信モジュールと、
前記プロセッサに連結される、ディスプレイスクリーンと、
前記プロセッサに連結される、メモリ記憶装置であって、前記メモリが、一例として、
1日のうちの所与の時間に、N日の期間にわたって、第2の閾値を超える、食前に行われたとしてフラグされている最新の分析物測定結果と、
前記最新の分析物測定結果の前記所与の時間に関して、X時間のタイムフレーム内で実施される、前記第2の閾値よりも高い、前記複数の分析物測定結果のうちの少なくとも1つの分析物測定結果と、
を含む、データを受信するように構成される、メモリ記憶装置と、
を備える、モバイルコンピュータデバイスであって、
前記例では、前記プロセッサが、それぞれ行ヘッダ及び列ヘッダを有する複数の行及び複数の列を有する表を表示するように、前記ディスプレイスクリーンを制御するように構成され、前記列ヘッダが、1日のうちの異なる期間を示し、前記1日の各期間内の食前又は食後の分析物測定結果を示す、前記列ヘッダのそれぞれの細分割部を有し、前記行ヘッダが、各分析物測定結果の日付を示し、1つの分析物傾向の一部として識別される分析物値を表す数値が、第1のしるしによって表され、別の分析物傾向の一部として識別される分析物値を表す数値が、前記第1のしるしとは異なる第2のしるしによって表され、
N日の期間にわたる前記最新の分析物測定結果の前記所与の時間に関して、X時間のタイムフレーム内の前記第2の閾値よりも高い分析物測定結果の傾向に対する、記憶された分析物の前記第2のしるしの分配が、グラフィックコネクタにより前記第2のしるしの前記分配のそれぞれに接続される、モバイルコンピュータデバイス。A processor;
A communication module coupled to the processor and configured to receive data comprising a plurality of analyte measurement results from the analyte measurement device;
A display screen coupled to the processor;
A memory storage device coupled to the processor, wherein the memory is, by way of example,
The latest analyte measurement flagged as done before meals, over a period of N days, over a second threshold, at a given time of day,
At least one analyte of the plurality of analyte measurements higher than the second threshold, performed within a time frame of X hours, for the given time of the latest analyte measurement Measurement results and
A memory storage device configured to receive data, comprising:
A mobile computing device comprising:
In the example, the processor is configured to control the display screen to display a table having a plurality of rows and a plurality of columns, each having a row header and a column header, wherein the column header is Each column has a respective subdivision of the column header, indicating the analyte measurement results before or after the meal within each period of the day, wherein the row header is each analyte measurement result A numeric value representing an analyte value identified as part of one analyte trend and represented by a first indicia and representing an analyte value identified as part of another analyte trend A numerical value is represented by a second indicia different from the first indicia;
For the given time of the most recent analyte measurement over a period of N days, the stored analyte for the trend of the analyte measurement higher than the second threshold within a time frame of X hours A mobile computing device, wherein a second indicia distribution is connected to each of the second indicia distributions by a graphic connector.
前記分析物測定ユニットを用いて、生理学的流体中の分析物を酵素副生成物に変換し、プロセス中に、前記流体中の前記分析物の測定結果を提供する工程と、
前記分析物測定ユニットの前記メモリ中に、前記分析物測定結果のうちの1つ以上を記憶する工程と、
前記モバイル通信デバイスを用いて、1日のうちの所与の時間の最新の分析物測定結果が第1の閾値未満であるかどうかを決定する工程と、
前記モバイル通信デバイスを用いて、N日の期間にわたる前記最新の分析物測定結果の前記所与の時間に関して、X時間のタイムフレーム内で実施される前記複数の分析物測定結果のうちの少なくとも1つの分析物測定結果が、前記第1の閾値よりも低いかどうかを評価する工程と、
N日数にわたる同一タイムフレーム内で、前記複数の分析物測定結果が、前記ディスプレイの表中の第1のしるしで、前記第1の閾値よりも低い分析物傾向を示すことを前記モバイル通信ユニット内で通知する工程であって、前記表が、それぞれ行ヘッダ及び列ヘッダを有する複数の行及び複数の列を有し、前記列ヘッダが、1日のうちの異なる期間を示し、前記1日の各期間内の食前又は食後の分析物測定結果を示す、前記列ヘッダのそれぞれの細分割部を有し、前記行ヘッダが、各分析物測定結果の日付を示し、1つの分析物傾向の一部として識別される分析物値を表す数値が、第1のしるしによって表され、別の分析物傾向の一部として識別される分析物値を表す数値が、第1のしるしとは異なる第2のしるしによって表される、工程と、を含む、方法。A method for notifying a user of high or low trends in analyte values obtained in combination with a mobile communication device using an analyte measurement unit, each connected to a respective display and memory storage device Having a processor, the method comprising:
Using the analyte measurement unit to convert an analyte in a physiological fluid into an enzyme byproduct and providing a measurement result of the analyte in the fluid during the process;
Storing one or more of the analyte measurement results in the memory of the analyte measurement unit;
Using the mobile communication device to determine whether the latest analyte measurement result for a given time of day is below a first threshold;
Using the mobile communication device, at least one of the plurality of analyte measurement results performed within a time frame of X hours for the given time of the latest analyte measurement result over a period of N days. Evaluating whether one analyte measurement is lower than the first threshold;
Within the mobile communication unit, the plurality of analyte measurements within the same time frame over N days indicate an analyte trend that is lower than the first threshold at a first indication in the table of the display. The table includes a plurality of rows and a plurality of columns each having a row header and a column header, wherein the column header indicates a different period of the day, and the one day Each column header has a subdivision that indicates the pre-meal or post-meal analyte measurement results within each period, and the row header indicates the date of each analyte measurement and represents one analyte trend. A numerical value representing an analyte value identified as part is represented by a first indicia and a numerical value representing an analyte value identified as part of another analyte trend is a second different from the first indicia. The process represented by the indicia , Including, method.
前記分析物測定ユニットを用いて、生理学的流体中の分析物の酵素副生成物への変換を開始し、前記プロセス中に、前記流体中の前記分析物の測定結果を提供する、工程と、
前記分析物測定ユニットの前記メモリ中に、前記分析物測定結果のうちの1つ以上を記憶する工程と、
1日のうちの所与の時間の最新の分析物測定結果が第2の閾値を超えるかどうかを決定する工程と、
前記最新の分析物測定値が(a)食前に行われた測定結果、又は(b)空腹期間中に行われた測定結果のうちのいずれか、又は両方としてフラグが付けられたかどうかを確認する工程と、
前記モバイル通信デバイスを用いて、N日の期間にわたる前記最新の分析物測定結果の前記所与の時間に関して、X時間のタイムフレーム内で実施される前記複数の分析物測定結果のうちの少なくとも1つの分析物測定結果が、前記第2の閾値よりも高いかどうかを評価する工程と、
N日数にわたる同一タイムフレーム内で、前記複数の分析物測定結果が、前記ディスプレイの表中の第2のしるしで、第2の閾値よりも高い別の分析物傾向を示すことを通知する工程であって、前記表が、それぞれ行ヘッダ及び列ヘッダを有する複数の行及び複数の列を有し、前記列ヘッダが、1日のうちの異なる期間を示し、前記1日の各期間内の食前又は食後の分析物測定結果を示す、前記列ヘッダのそれぞれの細分割部を有し、前記行ヘッダが、各分析物測定結果の日付を示し、1つの分析物傾向の一部として識別される分析物値を表す数値が、第1のしるしによって表され、別の分析物傾向の一部として識別される分析物値を表す数値が、第1のしるしとは異なる第2のしるしによって表される、工程と、を含む、方法。A method for notifying a user of high or low trends in analyte values obtained in combination with a mobile communication device using an analyte measurement unit, each connected to a respective display and memory storage device Having a processor, the method comprising:
Initiating conversion of an analyte in a physiological fluid to an enzyme byproduct using the analyte measurement unit and providing a measurement result of the analyte in the fluid during the process;
Storing one or more of the analyte measurement results in the memory of the analyte measurement unit;
Determining whether the latest analyte measurement result for a given time of day exceeds a second threshold;
Check if the latest analyte measurement was flagged as either (a) a measurement taken before a meal, or (b) a measurement taken during an empty stomach, or both Process,
Using the mobile communication device, at least one of the plurality of analyte measurement results performed within a time frame of X hours for the given time of the latest analyte measurement result over a period of N days. Evaluating whether two analyte measurements are higher than the second threshold;
Notifying that the plurality of analyte measurement results show another analyte trend higher than a second threshold at a second indication in the table of the display within the same time frame over N days. The table has a plurality of rows and a plurality of columns, each having a row header and a column header, wherein the column header indicates different periods of the day, and the pre-meal within each period of the day Or having each subdivision of the column header indicating post-meal analyte measurements, the row header indicating the date of each analyte measurement and identified as part of one analyte trend A numeric value representing the analyte value is represented by a first indicia and a numeric value representing the analyte value identified as part of another analyte trend is represented by a second indicia that is different from the first indicia. Comprising the steps of:
分析物測定ユニットであって、
前記分析物試験ストリップを受容するように構成される、試験ストリップポートを含む、ハウジングと、
前記試験ストリップ上に配置されるユーザーの生理学的流体中で測定される分析物の量に関するデータを提供するように構成される、前記試験ストリップポートと連結される分析物マイクロプロセッサであって、更にメモリに連結される、分析物マイクロプロセッサと、
を備える、分析物測定ユニットと、
ディスプレイ及びメモリに連結されるモバイルプロセッサを備える、モバイル通信ユニットと、
を備える、慢性疾患管理システムであって、
前記分析物マイクロプロセッサ又はモバイルマイクロプロセッサのうちの1つが、
(a)生理学的流体中の分析物を測定して、分析物測定結果を提供するように、
(b)前記分析物測定結果のうちの1つ以上を記憶するように、
(c)1日のうちの所与の時間の最新の分析物測定結果が第1の閾値未満であるかどうかを決定するように、
(d)N日の期間にわたる前記最新の分析物測定結果の前記所与の時間に関して、X時間のタイムフレーム内で実施される複数の前記分析物測定結果のうちの少なくとも1つの分析物測定結果が、第1の閾値よりも低いかどうかを評価するように、
(e)前記評価の完了後に、前記N日数にわたる少なくとも2日の同一のタイムフレーム内で、複数の前記分析物測定結果が、低閾値よりも低い分析物傾向又は第2の閾値よりも高い傾向を示すことを通知するように、並びに
(f)それぞれ行ヘッダ及び列ヘッダを有する複数の行及び複数の列を有する表中で、モバイル通信デバイスのディスプレイ上に、複数の前記分析物測定結果を表示するように、
プログラムされ、
前記列ヘッダが、1日のうちの異なる期間を示し、前記1日の各期間内の食前又は食後の分析物測定結果を示す、前記列ヘッダのそれぞれの細分割部を有し、前記行ヘッダが、各分析物測定結果の日付を示し、1つの分析物傾向の一部として識別される分析物値を表す数値が、第1のしるしによって表され、別の分析物傾向の一部として識別される分析物値を表す数値が、前記第1のしるしとは異なる第2のしるしによって表される、慢性疾患管理システム。At least one analyte test strip;
An analyte measurement unit comprising:
A housing including a test strip port configured to receive the analyte test strip;
An analyte microprocessor coupled to the test strip port configured to provide data relating to the amount of analyte measured in a user's physiological fluid disposed on the test strip; An analyte microprocessor coupled to the memory;
An analyte measurement unit comprising:
A mobile communication unit comprising a mobile processor coupled to a display and a memory;
A chronic disease management system comprising:
One of the analyte microprocessor or mobile microprocessor is
(A) measuring an analyte in a physiological fluid to provide an analyte measurement result;
(B) storing one or more of the analyte measurement results;
(C) to determine if the latest analyte measurement for a given time of day is below a first threshold;
(D) for the given time of the latest analyte measurement result over a period of N days, at least one analyte measurement result of the plurality of analyte measurement results performed within a time frame of X hours; To evaluate whether is lower than the first threshold,
(E) After completion of the assessment, within a same time frame of at least 2 days over the N days, a plurality of analyte measurement results tend to be lower than a low threshold or higher than a second threshold And (f) displaying a plurality of said analyte measurement results on a display of a mobile communication device in a table having a plurality of rows and a plurality of columns each having a row header and a column header. As shown
Programmed,
The row headers having respective subdivisions of the column headers indicating different periods of the day and indicating analyte measurement results before or after the meal within each period of the day; Indicates the date of each analyte measurement and the numeric value representing the analyte value identified as part of one analyte trend is represented by the first indicia and identified as part of another analyte trend A chronic disease management system, wherein a numerical value representing an analyte value to be displayed is represented by a second indicia different from the first indicia.
1つ以上の試験ストリップ上に配置されるユーザーの生理学的流体からの分析物の量に関するデータを提供するように構成される、試験ストリップポートと、
を備える、分析物測定ユニットと、
複数の分析物測定結果を表すデータを記憶するように構成される、メモリに連結される、分析物マイクロプロセッサと、
ディスプレイ及びメモリに連結される、モバイルプロセッサを備えるモバイル通信ユニットであって、前記分析物マイクロプロセッサ又はモバイルマイクロプロセッサのうちの1つが、N日の期間にわたる最新の分析物測定結果の所与の時間に関して、X時間のタイムフレーム内で実施される前記複数の分析物測定結果のうちの少なくとも1つの分析物測定結果が、第1の閾値よりも低いかどうかを決定し、前記N日数にわたるタイムフレームで、前記第1の閾値よりも低い分析物傾向を表中に表示するように構成され、前記表が、それぞれ行ヘッダ及び列ヘッダを有する複数の行及び複数の列を有し、前記列ヘッダが、1日のうちの異なる期間を示し、前記1日の各期間内の食前又は食後の分析物測定結果を示す、前記列ヘッダのそれぞれの細分割部を有し、前記行ヘッダが、各分析物測定結果の日付を示し、1つの分析物傾向の一部として識別される分析物値を表す数値が、第1のしるしによって表され、別の分析物傾向の一部として識別される分析物値を表す数値が、第1のしるしとは異なる第2のしるしによって表される、モバイル通信ユニットと、
を備える、慢性疾患管理システム。A housing including a test strip port configured to receive an analyte test strip;
A test strip port configured to provide data relating to the amount of analyte from a user's physiological fluid disposed on the one or more test strips;
An analyte measurement unit comprising:
An analyte microprocessor coupled to a memory configured to store data representing a plurality of analyte measurement results;
A mobile communication unit comprising a mobile processor coupled to a display and a memory, wherein one of said analyte microprocessor or mobile microprocessor is a given time of the latest analyte measurement over a period of N days And determining whether at least one analyte measurement result of the plurality of analyte measurement results performed within a time frame of X hours is lower than a first threshold, and the time frame over the N days An analyte trend lower than the first threshold is displayed in a table, the table having a plurality of rows and a plurality of columns, each having a row header and a column header, and the column header Each of the column headers indicating different periods of the day and indicating analyte measurements before or after a meal within each period of the day A subdivision, wherein the row header indicates the date of each analyte measurement result, and a numerical value representing an analyte value identified as part of one analyte trend is represented by a first indicia; A mobile communications unit, wherein a numeric value representing an analyte value identified as part of another analyte trend is represented by a second indicia different from the first indicia;
A chronic disease management system comprising:
1つ以上の試験ストリップ上に配置されるユーザーの生理学的流体からの分析物の量に関するデータを提供するように構成される、試験ストリップポートと、
を備える、分析物測定ユニットと、
複数の分析物測定結果を表すデータを記憶するように構成される、メモリに連結される、分析物マイクロプロセッサと、
ディスプレイ及びメモリに連結される、モバイルプロセッサを備えるモバイル通信ユニットであって、前記分析物マイクロプロセッサ又はモバイルマイクロプロセッサのうちの1つが、N日の期間にわたる最新の分析物測定結果の所与の時間に関して、X時間のタイムフレーム内で実施される前記複数の分析物測定結果の少なくとも1つの分析物測定結果が、第2の閾値よりも高いかどうかを決定し、前記N日数にわたるタイムフレームで前記第2の閾値よりも高い分析物傾向を表中に表示するように構成され、前記表が、それぞれ行ヘッダ及び列ヘッダを有する複数の行及び複数の列を有し、前記列ヘッダが、1日のうちの異なる期間を示し、前記1日の各期間内の食前又は食後の分析物測定結果を示す、前記列ヘッダのそれぞれの細分割部を有し、前記行ヘッダが、各分析物測定結果の日付を示し、1つの分析物傾向の一部として識別される分析物値を表す数値が、第1のしるしによって表され、別の分析物傾向の一部として識別される分析物値を表す数値が、第1のしるしとは異なる第2のしるしによって表される、モバイル通信ユニットと、
を備える、慢性疾患管理システム。A housing including a test strip port configured to receive an analyte test strip;
A test strip port configured to provide data relating to the amount of analyte from a user's physiological fluid disposed on the one or more test strips;
An analyte measurement unit comprising:
An analyte microprocessor coupled to a memory configured to store data representing a plurality of analyte measurement results;
A mobile communication unit comprising a mobile processor coupled to a display and a memory, wherein one of said analyte microprocessor or mobile microprocessor is a given time of the latest analyte measurement over a period of N days And determining whether at least one analyte measurement result of the plurality of analyte measurement results performed within a time frame of X hours is higher than a second threshold, and in the time frame over the N days An analyte trend higher than a second threshold is configured to be displayed in a table, the table having a plurality of rows and a plurality of columns, each having a row header and a column header, and the column header is 1 Each subdivision of the column header showing different periods of the day and showing analyte measurements before or after meals within each period of the day Wherein the row header indicates the date of each analyte measurement result, and a numerical value representing the analyte value identified as part of one analyte trend is represented by a first indicia and another analysis A mobile communication unit, wherein a numeric value representing an analyte value identified as part of a physical trend is represented by a second indicia different from the first indicia;
A chronic disease management system comprising:
Applications Claiming Priority (7)
| Application Number | Priority Date | Filing Date | Title |
|---|---|---|---|
| US41559810P | 2010-11-19 | 2010-11-19 | |
| US61/415,598 | 2010-11-19 | ||
| US201161469046P | 2011-03-29 | 2011-03-29 | |
| US61/469,046 | 2011-03-29 | ||
| US13/192,348US20120130646A1 (en) | 2010-11-19 | 2011-07-27 | Analyte testing method and system with high and low analyte trends notification |
| US13/192,348 | 2011-07-27 | ||
| PCT/US2011/058736WO2012067812A1 (en) | 2010-11-19 | 2011-11-01 | Analyte testing method and system with high and low analyte trends notification |
Publications (1)
| Publication Number | Publication Date |
|---|---|
| JP2014502858Atrue JP2014502858A (en) | 2014-02-06 |
Family
ID=46065123
Family Applications (1)
| Application Number | Title | Priority Date | Filing Date |
|---|---|---|---|
| JP2013539864ACeasedJP2014502858A (en) | 2010-11-19 | 2011-11-01 | Analyte test method and system with high and low analyte trend notification |
Country Status (10)
| Country | Link |
|---|---|
| US (2) | US20120130646A1 (en) |
| EP (2) | EP2640259A4 (en) |
| JP (1) | JP2014502858A (en) |
| KR (1) | KR20140008317A (en) |
| CN (1) | CN103220966A (en) |
| AU (1) | AU2011329357A1 (en) |
| BR (1) | BR112013012501A2 (en) |
| CA (1) | CA2817909A1 (en) |
| RU (1) | RU2013127663A (en) |
| WO (1) | WO2012067812A1 (en) |
Cited By (2)
| Publication number | Priority date | Publication date | Assignee | Title |
|---|---|---|---|---|
| JP2014200405A (en)* | 2013-04-03 | 2014-10-27 | テルモ株式会社 | Component measurement device, method, and program |
| JP2019532682A (en)* | 2016-08-12 | 2019-11-14 | デックスコム・インコーポレーテッド | System and method for visualization of health data and user support tool for continuous glucose monitoring |
Families Citing this family (54)
| Publication number | Priority date | Publication date | Assignee | Title |
|---|---|---|---|---|
| BR112012021572A2 (en)* | 2010-02-25 | 2016-10-25 | Lifescan Scotland Ltd | analyte testing method and system with notification of high and low blood glucose trends. |
| JP5728253B2 (en)* | 2011-03-03 | 2015-06-03 | 株式会社堀場製作所 | measuring device |
| KR102008495B1 (en)* | 2012-02-24 | 2019-08-08 | 삼성전자주식회사 | Method for sharing content and mobile terminal thereof |
| EP2866658A2 (en)* | 2012-07-02 | 2015-05-06 | 3Pdx, Llc | Devices, systems, and methods for diagnostic testing |
| EP2701088A3 (en) | 2012-08-24 | 2017-05-10 | General Electric Company | Monitoring system and method for visually presenting health state of a subject |
| US20140068487A1 (en)* | 2012-09-05 | 2014-03-06 | Roche Diagnostics Operations, Inc. | Computer Implemented Methods For Visualizing Correlations Between Blood Glucose Data And Events And Apparatuses Thereof |
| WO2014140117A1 (en)* | 2013-03-12 | 2014-09-18 | Roche Diagnostics Gmbh | Method for transmitting a glucose measure, method for displaying status during a wireless transmission of a glucose measure and handheld glucose meter |
| USD738889S1 (en)* | 2013-06-09 | 2015-09-15 | Apple Inc. | Display screen or portion thereof with animated graphical user interface |
| US9965587B2 (en) | 2013-07-08 | 2018-05-08 | Roche Diabetes Care, Inc. | Reminder, classification, and pattern identification systems and methods for handheld diabetes management devices |
| US10004435B2 (en)* | 2013-11-14 | 2018-06-26 | Dexcom, Inc. | Devices and methods for continuous analyte monitoring |
| US11035818B2 (en)* | 2014-08-15 | 2021-06-15 | Roche Diabetes Care, Inc. | Blood glucose meter with low cost user interface having programmed graphic indicators |
| USD807394S1 (en)* | 2015-07-07 | 2018-01-09 | Google Inc. | Display screen or portion thereof with a transitional graphical user interface component for identifying current location |
| USD805551S1 (en)* | 2015-07-07 | 2017-12-19 | Google Inc. | Display screen or portion thereof with a transitional graphical user interface component for identifying current location |
| US10127468B1 (en)* | 2015-07-17 | 2018-11-13 | Rocket Innovations, Inc. | System and method for capturing, organizing, and storing handwritten notes |
| US20180374561A1 (en)* | 2015-12-07 | 2018-12-27 | Shenghuo Technology Limited | System for automatically obtaining treatment record |
| HUE059013T2 (en) | 2016-05-03 | 2023-09-28 | Hoffmann La Roche | Sensor device for detecting at least one analyte in a body fluid of a user |
| US10905329B2 (en) | 2016-06-09 | 2021-02-02 | Biosense Webster (Israel) Ltd. | Multi-function conducting elements for a catheter |
| JP6519539B2 (en)* | 2016-06-29 | 2019-05-29 | 京セラドキュメントソリューションズ株式会社 | Display input device and image forming apparatus |
| USD826262S1 (en)* | 2016-07-28 | 2018-08-21 | Banco Bradesco S/A | Display panel with a computer icon |
| AU2017335762B2 (en) | 2016-09-27 | 2022-03-17 | Bigfoot Biomedical, Inc. | Medicine injection and disease management systems, devices, and methods |
| US11400205B2 (en) | 2016-11-23 | 2022-08-02 | Biosense Webster (Israel) Ltd. | Balloon-in-balloon irrigation balloon catheter |
| EP3500161A4 (en) | 2016-12-12 | 2020-01-08 | Bigfoot Biomedical, Inc. | ALARMS AND WARNINGS FOR MEDICINE DELIVERY DEVICES AND RELATED SYSTEMS AND METHODS |
| USD832304S1 (en)* | 2017-01-20 | 2018-10-30 | Lifescan, Inc. | Display screen with icon for a blood glucose management system |
| US12029545B2 (en) | 2017-05-30 | 2024-07-09 | Biosense Webster (Israel) Ltd. | Catheter splines as location sensors |
| USD907654S1 (en)* | 2017-09-11 | 2021-01-12 | Lesley Henegar | Display screen of a computing device with parking assistance graphical user interface |
| USD889477S1 (en) | 2018-03-06 | 2020-07-07 | Google Llc | Display screen or a portion thereof with an animated graphical interface |
| USD859450S1 (en) | 2018-05-07 | 2019-09-10 | Google Llc | Display screen or portion thereof with an animated graphical interface |
| USD894951S1 (en)* | 2018-05-07 | 2020-09-01 | Google Llc | Display screen or portion thereof with an animated graphical interface |
| USD894952S1 (en)* | 2018-05-07 | 2020-09-01 | Google Llc | Display screen or portion thereof with an animated graphical interface |
| USD858556S1 (en) | 2018-05-07 | 2019-09-03 | Google Llc | Display screen or portion thereof with an animated graphical interface |
| USD858555S1 (en) | 2018-05-07 | 2019-09-03 | Google Llc | Display screen or portion thereof with an animated graphical interface |
| US12102781B2 (en) | 2018-06-29 | 2024-10-01 | Biosense Webster (Israel) Ltd. | Reinforcement for irrigated electrophysiology balloon catheter with flexible-circuit electrodes |
| US11071585B2 (en) | 2018-09-14 | 2021-07-27 | Biosense Webster (Israel) Ltd. | Systems and methods of ablating cardiac tissue |
| USD921002S1 (en) | 2019-05-06 | 2021-06-01 | Google Llc | Display screen with animated graphical interface |
| USD921000S1 (en) | 2019-05-06 | 2021-06-01 | Google Llc | Display screen or portion thereof with an animated graphical user interface |
| USD921647S1 (en) | 2019-05-06 | 2021-06-08 | Google Llc | Display screen or portion thereof with an animated graphical user interface |
| USD921001S1 (en) | 2019-05-06 | 2021-06-01 | Google Llc | Display screen or portion thereof with an animated graphical user interface |
| USD968422S1 (en)* | 2019-05-31 | 2022-11-01 | Biosense Webster (Israel) Ltd. | Display screen with transitional graphical user interface |
| USD944291S1 (en)* | 2019-07-15 | 2022-02-22 | Google Llc | Display screen with icon |
| US12369975B2 (en) | 2019-09-12 | 2025-07-29 | Biosense Webster (Israel) Ltd. | Balloon catheter with force sensor |
| US11633228B2 (en) | 2019-10-04 | 2023-04-25 | Biosense Webster (Israel) Ltd. | Identifying pulmonary vein occlusion by dimension deformations of balloon catheter |
| US12369974B2 (en) | 2019-10-10 | 2025-07-29 | Biosense Webster (Israel) Ltd. | Touch indication of balloon-catheter ablation electrode via balloon surface temperature measurement |
| US12137967B2 (en) | 2019-11-12 | 2024-11-12 | Biosense Webster (Israel) Ltd. | Accurate positioning and shape visualization of balloon catheter ablation tags |
| USD1032624S1 (en)* | 2020-03-10 | 2024-06-25 | Beta Bionics, Inc. | Display screen with animated graphical user interface |
| USD938469S1 (en)* | 2020-03-20 | 2021-12-14 | Vyaire Medical, Inc. | Display screen with graphical user interface for communicating health-related messages regarding ventilated patients |
| USD937849S1 (en)* | 2020-03-20 | 2021-12-07 | Vyaire Medical Inc. | Display screen with graphical user interface for communicating health-related messages regarding ventilated patients |
| USD937864S1 (en) | 2020-03-20 | 2021-12-07 | Vyaire Medical, Inc. | Display screen with graphical user interface for communicating health-related messages regarding ventilated patients |
| USD969139S1 (en)* | 2020-09-01 | 2022-11-08 | Nasdaq Technology Ab | Display screen or portion thereof with animated graphical user interface |
| US12239364B2 (en) | 2020-10-07 | 2025-03-04 | Biosense Webster (Israel) Ltd. | Printed proximal electrodes of an expandable catheter for use as a common electrode |
| US11974803B2 (en) | 2020-10-12 | 2024-05-07 | Biosense Webster (Israel) Ltd. | Basket catheter with balloon |
| US11957852B2 (en) | 2021-01-14 | 2024-04-16 | Biosense Webster (Israel) Ltd. | Intravascular balloon with slidable central irrigation tube |
| US11849995B2 (en) | 2021-02-18 | 2023-12-26 | Biosense Webster (Israel) Ltd. | Detection of balloon catheter tissue contact using optical measurement |
| USD986276S1 (en)* | 2021-08-23 | 2023-05-16 | Waymo Llc | Display screen or portion thereof with graphical user interface |
| US12114905B2 (en) | 2021-08-27 | 2024-10-15 | Biosense Webster (Israel) Ltd. | Reinforcement and stress relief for an irrigated electrophysiology balloon catheter with flexible-circuit electrodes |
Citations (11)
| Publication number | Priority date | Publication date | Assignee | Title |
|---|---|---|---|---|
| US20060095225A1 (en)* | 2004-11-02 | 2006-05-04 | Kirk Harmon | Method and computer program for pattern analysis and reporting of chronic disease state management data |
| WO2006120920A1 (en)* | 2005-05-13 | 2006-11-16 | Matsushita Electric Industrial Co., Ltd. | Biometric information transfer system |
| JP2007117434A (en)* | 2005-10-28 | 2007-05-17 | Matsushita Electric Ind Co Ltd | Biological signal measurement value evaluation system |
| JP2008501426A (en)* | 2004-06-03 | 2008-01-24 | メドトロニック ミニメド インコーポレイテッド | System for monitoring physiological characteristics |
| JP2009500744A (en)* | 2005-06-29 | 2009-01-08 | メドトロニック・ミニメッド・インコーポレーテッド | Adaptive glucose analysis using variable time report delta and configurable glucose target range |
| US20090149717A1 (en)* | 2007-12-10 | 2009-06-11 | Jacob Brauer | Interface for a health measurement and monitoring system |
| JP2009178546A (en)* | 2008-01-18 | 2009-08-13 | Lifescan Scotland Ltd | Specimen test method and system |
| JP2010507138A (en)* | 2006-10-16 | 2010-03-04 | メドトロニック・ミニメッド・インコーポレーテッド | Treatment management system |
| JP2010069193A (en)* | 2008-09-22 | 2010-04-02 | Panasonic Corp | System for collecting biological information |
| JP2010082008A (en)* | 2008-09-29 | 2010-04-15 | Terumo Corp | Blood sugar information processor, blood sugar information processing method, and blood sugar information processing program |
| US20100262434A1 (en)* | 2007-12-13 | 2010-10-14 | Shaya Steven A | Method and apparatus to calculate diabetic sensitivity factors affecting blood glucose |
Family Cites Families (10)
| Publication number | Priority date | Publication date | Assignee | Title |
|---|---|---|---|---|
| US5526120A (en)* | 1994-09-08 | 1996-06-11 | Lifescan, Inc. | Test strip with an asymmetrical end insuring correct insertion for measuring |
| US7647237B2 (en)* | 1998-04-29 | 2010-01-12 | Minimed, Inc. | Communication station and software for interfacing with an infusion pump, analyte monitor, analyte meter, or the like |
| US20030036202A1 (en)* | 2001-08-01 | 2003-02-20 | Maria Teodorcyzk | Methods and devices for use in analyte concentration determination assays |
| US7284204B2 (en)* | 2002-03-29 | 2007-10-16 | International Business Machines Corporation | System, method, and visual user interface for evaluating and selecting suppliers for enterprise procurement |
| US20030233257A1 (en)* | 2002-06-13 | 2003-12-18 | Gregor Matian | Interactive patient data report generation |
| US20060034538A1 (en)* | 2004-07-23 | 2006-02-16 | Agfa Corporation | Method and system of automating echocardiogram measurements and reporting |
| US8564544B2 (en)* | 2006-09-06 | 2013-10-22 | Apple Inc. | Touch screen device, method, and graphical user interface for customizing display of content category icons |
| US20080235053A1 (en)* | 2007-03-20 | 2008-09-25 | Pinaki Ray | Communication medium for diabetes management |
| US20090240127A1 (en)* | 2008-03-20 | 2009-09-24 | Lifescan, Inc. | Methods of determining pre or post meal time slots or intervals in diabetes management |
| EP2455875A3 (en)* | 2009-06-30 | 2013-01-16 | Lifescan Scotland Limited | System and method for diabetes management |
- 2011
- 2011-07-27USUS13/192,348patent/US20120130646A1/ennot_activeAbandoned
- 2011-11-01KRKR1020137015583Apatent/KR20140008317A/ennot_activeWithdrawn
- 2011-11-01JPJP2013539864Apatent/JP2014502858A/ennot_activeCeased
- 2011-11-01EPEP11842099.1Apatent/EP2640259A4/ennot_activeWithdrawn
- 2011-11-01WOPCT/US2011/058736patent/WO2012067812A1/enactiveApplication Filing
- 2011-11-01CACA2817909Apatent/CA2817909A1/ennot_activeAbandoned
- 2011-11-01BRBR112013012501Apatent/BR112013012501A2/ennot_activeApplication Discontinuation
- 2011-11-01RURU2013127663/14Apatent/RU2013127663A/ennot_activeApplication Discontinuation
- 2011-11-01AUAU2011329357Apatent/AU2011329357A1/ennot_activeAbandoned
- 2011-11-01CNCN2011800558027Apatent/CN103220966A/enactivePending
- 2011-11-04USUS13/988,306patent/US20130318439A1/ennot_activeAbandoned
- 2011-11-04EPEP11840780.8Apatent/EP2641202A4/ennot_activeWithdrawn
Patent Citations (11)
| Publication number | Priority date | Publication date | Assignee | Title |
|---|---|---|---|---|
| JP2008501426A (en)* | 2004-06-03 | 2008-01-24 | メドトロニック ミニメド インコーポレイテッド | System for monitoring physiological characteristics |
| US20060095225A1 (en)* | 2004-11-02 | 2006-05-04 | Kirk Harmon | Method and computer program for pattern analysis and reporting of chronic disease state management data |
| WO2006120920A1 (en)* | 2005-05-13 | 2006-11-16 | Matsushita Electric Industrial Co., Ltd. | Biometric information transfer system |
| JP2009500744A (en)* | 2005-06-29 | 2009-01-08 | メドトロニック・ミニメッド・インコーポレーテッド | Adaptive glucose analysis using variable time report delta and configurable glucose target range |
| JP2007117434A (en)* | 2005-10-28 | 2007-05-17 | Matsushita Electric Ind Co Ltd | Biological signal measurement value evaluation system |
| JP2010507138A (en)* | 2006-10-16 | 2010-03-04 | メドトロニック・ミニメッド・インコーポレーテッド | Treatment management system |
| US20090149717A1 (en)* | 2007-12-10 | 2009-06-11 | Jacob Brauer | Interface for a health measurement and monitoring system |
| US20100262434A1 (en)* | 2007-12-13 | 2010-10-14 | Shaya Steven A | Method and apparatus to calculate diabetic sensitivity factors affecting blood glucose |
| JP2009178546A (en)* | 2008-01-18 | 2009-08-13 | Lifescan Scotland Ltd | Specimen test method and system |
| JP2010069193A (en)* | 2008-09-22 | 2010-04-02 | Panasonic Corp | System for collecting biological information |
| JP2010082008A (en)* | 2008-09-29 | 2010-04-15 | Terumo Corp | Blood sugar information processor, blood sugar information processing method, and blood sugar information processing program |
Cited By (5)
| Publication number | Priority date | Publication date | Assignee | Title |
|---|---|---|---|---|
| JP2014200405A (en)* | 2013-04-03 | 2014-10-27 | テルモ株式会社 | Component measurement device, method, and program |
| JP2019532682A (en)* | 2016-08-12 | 2019-11-14 | デックスコム・インコーポレーテッド | System and method for visualization of health data and user support tool for continuous glucose monitoring |
| US11141116B2 (en) | 2016-08-12 | 2021-10-12 | Dexcom, Inc. | Systems and methods for health data visualization and user support tools for continuous glucose monitoring |
| JP2021184842A (en)* | 2016-08-12 | 2021-12-09 | デックスコム・インコーポレーテッド | Systems and methods for health data visualization and user support tools for continuous glucose monitoring |
| US11931188B2 (en) | 2016-08-12 | 2024-03-19 | Dexcom, Inc. | Systems and methods for health data visualization and user support tools for continuous glucose monitoring |
Also Published As
| Publication number | Publication date |
|---|---|
| BR112013012501A2 (en) | 2016-09-06 |
| WO2012067812A1 (en) | 2012-05-24 |
| KR20140008317A (en) | 2014-01-21 |
| US20130318439A1 (en) | 2013-11-28 |
| US20120130646A1 (en) | 2012-05-24 |
| CA2817909A1 (en) | 2012-05-24 |
| EP2640259A1 (en) | 2013-09-25 |
| EP2641202A4 (en) | 2014-10-01 |
| EP2641202A2 (en) | 2013-09-25 |
| EP2640259A4 (en) | 2014-05-14 |
| RU2013127663A (en) | 2014-12-27 |
| AU2011329357A1 (en) | 2013-06-06 |
| CN103220966A (en) | 2013-07-24 |
Similar Documents
| Publication | Publication Date | Title |
|---|---|---|
| JP2014502858A (en) | Analyte test method and system with high and low analyte trend notification | |
| JP5855118B2 (en) | Analyte test method and system with high and low analyte trend notification | |
| KR101722417B1 (en) | Analyte testing method and system with high and low blood glucose trends notification | |
| JP5871797B2 (en) | Diabetes management system and method | |
| US20130038453A1 (en) | Blood Sugar Level Measuring Apparatus, Blood Sugar Level Measured Result Display Method and Blood Sugar Level Measured Result Display Control Program | |
| US20150044650A1 (en) | Positive reinforcement messages to users based on analytics of prior physiological measurements | |
| KR20130116290A (en) | Analyte testing method and system with high and low analyte trends notification | |
| HK1170816A (en) | System and method for diabetes management | |
| HK1170817A (en) | System and method for diabetes management | |
| HK1170815A (en) | Method for diabetes management | |
| HK1212068B (en) | Analyte testing method and system with high and low blood glucose trends notification |
Legal Events
| Date | Code | Title | Description |
|---|---|---|---|
| A621 | Written request for application examination | Free format text:JAPANESE INTERMEDIATE CODE: A621 Effective date:20140930 | |
| A977 | Report on retrieval | Free format text:JAPANESE INTERMEDIATE CODE: A971007 Effective date:20150529 | |
| A131 | Notification of reasons for refusal | Free format text:JAPANESE INTERMEDIATE CODE: A131 Effective date:20150609 | |
| A521 | Request for written amendment filed | Free format text:JAPANESE INTERMEDIATE CODE: A523 Effective date:20150908 | |
| A01 | Written decision to grant a patent or to grant a registration (utility model) | Free format text:JAPANESE INTERMEDIATE CODE: A01 Effective date:20160301 | |
| A045 | Written measure of dismissal of application [lapsed due to lack of payment] | Free format text:JAPANESE INTERMEDIATE CODE: A045 Effective date:20160726 |