JP2009252050A - System, method and program for server load management - Google Patents
System, method and program for server load managementDownload PDFInfo
- Publication number
- JP2009252050A JP2009252050AJP2008100846AJP2008100846AJP2009252050AJP 2009252050 AJP2009252050 AJP 2009252050AJP 2008100846 AJP2008100846 AJP 2008100846AJP 2008100846 AJP2008100846 AJP 2008100846AJP 2009252050 AJP2009252050 AJP 2009252050A
- Authority
- JP
- Japan
- Prior art keywords
- server
- cpu usage
- usage rate
- servers
- load management
- Prior art date
- Legal status (The legal status is an assumption and is not a legal conclusion. Google has not performed a legal analysis and makes no representation as to the accuracy of the status listed.)
- Withdrawn
Links
- 238000000034methodMethods0.000titleclaimsdescription60
- 238000012545processingMethods0.000claimsabstractdescription116
- 238000012805post-processingMethods0.000claimsabstractdescription62
- 238000004364calculation methodMethods0.000claimsabstractdescription43
- 230000007423decreaseEffects0.000claimsabstractdescription21
- 238000007726management methodMethods0.000claimsdescription84
- 230000008859changeEffects0.000claimsdescription70
- 230000008569processEffects0.000claimsdescription47
- 230000003247decreasing effectEffects0.000claimsdescription33
- 230000004044responseEffects0.000claimsdescription28
- 239000000284extractSubstances0.000claimsdescription12
- 230000005012migrationEffects0.000claimsdescription12
- 238000012937correctionMethods0.000claimsdescription10
- 238000013508migrationMethods0.000claimsdescription8
- 230000007704transitionEffects0.000claimsdescription2
- 238000010586diagramMethods0.000description13
- 238000009825accumulationMethods0.000description5
- 238000004891communicationMethods0.000description5
- 238000005259measurementMethods0.000description4
- 238000012544monitoring processMethods0.000description4
- 238000012546transferMethods0.000description4
- 230000005540biological transmissionEffects0.000description3
- 238000013404process transferMethods0.000description3
- 235000010627Phaseolus vulgarisNutrition0.000description2
- 244000046052Phaseolus vulgarisSpecies0.000description2
- 238000004458analytical methodMethods0.000description1
- 230000000694effectsEffects0.000description1
- 238000000605extractionMethods0.000description1
- 230000009467reductionEffects0.000description1
- 238000012552reviewMethods0.000description1
Images


Landscapes
- Debugging And Monitoring (AREA)
Abstract
Description
Translated fromJapanese本発明は、複数のサーバの負荷を管理するための技術に関する。特に、本発明は、後処理を考慮して複数のサーバの負荷を管理するための技術に関する。 The present invention relates to a technique for managing loads of a plurality of servers. In particular, the present invention relates to a technique for managing loads of a plurality of servers in consideration of post-processing.
複数のサーバから構成されるコンピュータシステムにおいて、各サーバの負荷を把握することは、サーバ管理、サーバへのリクエストの割り当て、サーバ負荷の分散などの観点から重要である。計算機システムにおける負荷分散に関連する技術として、次のものが知られている。 In a computer system composed of a plurality of servers, grasping the load on each server is important from the viewpoints of server management, allocation of requests to servers, distribution of server loads, and the like. The following are known as techniques related to load distribution in a computer system.
特許文献1(特開2001−109638号公報)には、推定伸長率に基づくトランザクション負荷分散方法が記載されている。この方法によれば、一定時間ごとに、各計算機の処理中トランザクション数、およびCPU系に滞在するプロセス数またはCPU使用率が測定される。次に、これらの測定値を元に、各計算機における処理時間の伸長率が推定される。次に、この推定伸長率に基づいて、各計算機の負荷指標の値が求められる。そして、求められた負荷指標に基づいて、負荷の低い計算機へトランザクションの配分が行われる。 Patent Document 1 (Japanese Patent Application Laid-Open No. 2001-109638) describes a transaction load distribution method based on an estimated expansion rate. According to this method, the number of transactions being processed in each computer and the number of processes staying in the CPU system or the CPU usage rate are measured at regular intervals. Next, based on these measured values, the expansion rate of the processing time in each computer is estimated. Next, based on this estimated expansion rate, the value of the load index of each computer is obtained. Then, based on the obtained load index, the transaction is distributed to a computer with a low load.
特許文献2(特開2000−112909号公報)には、負荷分散管理システムが記載されている。処理履歴保存部は、各処理要求に対する処理履歴からなる処理履歴情報を記憶装置に保存する。処理先決定部は、処理要求元クライアントコンピュータからの処理要求が発生した場合に、当該処理要求に対する処理先サーバコンピュータを、処理履歴情報に基づいて決定する。処理要求管理部は、処理要求を処理先サーバコンピュータに転送し、当該処理先サーバコンピュータによる処理結果を当該処理要求元クライアントコンピュータに転送し、当該処理結果を反映した処理履歴を処理履歴保存部に転送する。 Japanese Patent Application Laid-Open No. 2000-112909 describes a load distribution management system. The processing history storage unit stores processing history information including processing history for each processing request in the storage device. When a processing request from a processing request source client computer occurs, the processing destination determination unit determines a processing destination server computer for the processing request based on the processing history information. The processing request management unit transfers the processing request to the processing destination server computer, transfers the processing result by the processing destination server computer to the processing request source client computer, and stores the processing history reflecting the processing result in the processing history storage unit. Forward.
特許文献3(特開2001−75934号公報)には、負荷分散処理システムが記載されている。負荷レポート送信手段は、処理実行本体の負荷が高くなると負荷通知の発信間隔を長くし、負荷が低くなると発信間隔を短くする。負荷レポート受付手段は、負荷通知の受信間隔の長さから負荷率を算出し記録する。処理要求制御手段は、処理要求を受け付けて、選択された処理実行本体へ送信する。負荷調整手段は、負荷率を処理割り当て時の時刻で補正し、補正後の負荷率が最小な処理実行本体を選択する。 Patent Document 3 (Japanese Patent Laid-Open No. 2001-75934) describes a load distribution processing system. The load report transmission means lengthens the transmission interval of the load notification when the load of the process execution main body is high, and shortens the transmission interval when the load is low. The load report receiving means calculates and records the load factor from the length of the load notification reception interval. The processing request control means receives the processing request and transmits it to the selected processing execution body. The load adjustment unit corrects the load factor at the time when the process is allocated, and selects a process execution body having the smallest corrected load factor.
特許文献4(特開2005−284695号公報)には、情報要求装置からネットワークを介してなされる情報要求に応じて生じる情報提供装置の負荷を分散する負荷分散装置が記載されている。資源情報収集手段は、情報提供装置の1または2以上の資源の使用情報を収集する。情報要求頻度操作手段は、情報要求装置から情報提供装置への情報要求頻度を操作する。反応係数算出手段は、操作による情報要求頻度の変化分と、操作した情報要求頻度に応じて動作した情報提供装置における使用情報の変化分とから、反応係数を算出する。 Japanese Patent Application Laid-Open No. 2005-284695 describes a load distribution device that distributes the load of an information providing device generated in response to an information request made from an information request device via a network. The resource information collecting means collects usage information of one or more resources of the information providing apparatus. The information request frequency operating means operates the information request frequency from the information requesting device to the information providing device. The reaction coefficient calculation means calculates a reaction coefficient from the change in the information request frequency due to the operation and the change in the usage information in the information providing apparatus operated according to the operated information request frequency.
特許文献5(特開2006−259812号公報)には、複数の計算機のキューに処理要求を振り分けて負荷分散を動的に行う動的キュー負荷分散方法が記載されている。その方法は、(1)計算機の負荷のレベルを示す負荷レベルを取得するステップと、(2)キュー管理テーブルのキューの長さを負荷レベルに対応するキューの長さへ変更するステップと、(3)キュー管理テーブル中のキューの長さ及び要求停滞数からキューの使用率を算出するステップと、(4)算出したキューの使用率の情報を通信装置により各計算機間で交換するステップと、(5)交換したキューの使用率に応じて処理要求を振り分けるステップと、を有する。 Patent Document 5 (Japanese Patent Laid-Open No. 2006-259812) describes a dynamic queue load distribution method in which processing requests are distributed to queues of a plurality of computers and load distribution is performed dynamically. The method includes (1) acquiring a load level indicating a load level of a computer, (2) changing a queue length of the queue management table to a queue length corresponding to the load level, and ( 3) a step of calculating the queue usage rate from the queue length and the number of request stagnation in the queue management table, and (4) a step of exchanging information on the calculated queue usage rate between the computers using a communication device; (5) a step of allocating processing requests according to the usage rate of the exchanged queue.
特許文献6(特開平11−110360号公報)には、プロキシサーバ装置によるトランザクション分配方法が記載されている。プロキシサーバ装置は、過去のトランザクションサービスと応答時間の履歴から、トランザクション応答時間の分布を導出する。その導出された分布から、複数のサーバ装置の最大応答待ち時間がそれぞれ動的に決定される。プロキシサーバ装置は、決定された最大応答待ち時間に応じて、クライアント装置からのトランザクションリクエストをいずれかのサーバ装置に分配する。 Patent Document 6 (Japanese Patent Laid-Open No. 11-110360) describes a transaction distribution method by a proxy server device. The proxy server device derives a distribution of transaction response times from the past transaction service and response time history. From the derived distribution, the maximum response waiting times of the plurality of server devices are each dynamically determined. The proxy server device distributes the transaction request from the client device to one of the server devices according to the determined maximum response waiting time.
最近、コンピュータシステム上で動作するアプリケーションの中には「後処理」を行うものが多い。後処理とは、サーバがリクエストを処理し、ユーザあるいは前段階のサーバにレスポンスを返した後に、その処理に関連して行う処理のことである。 Recently, many applications running on computer systems perform “post-processing”. Post-processing is processing performed in connection with the processing after the server processes the request and returns a response to the user or the previous server.
Webサーバ、アプリケーションサーバ及びデータベースサーバの3層構成を有するコンピュータシステムを例に挙げて、後処理を説明する。このコンピュータシステムでは、Webサーバがユーザからのリクエスト(処理要求)を受け取り、受け取ったリクエストをアプリケーションサーバに送る。アプリケーションサーバは、要求された処理を実行する。このとき、アプリケーションサーバは、処理実行に必要なデータをデータベースサーバに要求する。データベースサーバは、要求されたデータを求めて登録データベースを検索し、読み出したデータをアプリケーションサーバに提供する。アプリケーションサーバは、当該処理の結果をWebサーバに送る。ユーザはWebブラウザを利用し、Webサーバからその処理結果を取得する。これらWebサーバ、アプリケーションサーバ及びデータベースサーバのそれぞれにおいて、後処理が発生することがある。 The post-processing will be described by taking a computer system having a three-layer configuration of a Web server, an application server, and a database server as an example. In this computer system, a Web server receives a request (processing request) from a user and sends the received request to an application server. The application server executes the requested process. At this time, the application server requests data necessary for processing execution from the database server. The database server searches the registration database for the requested data and provides the read data to the application server. The application server sends the processing result to the Web server. A user acquires the processing result from a Web server using a Web browser. Post processing may occur in each of these Web server, application server, and database server.
Webサーバでは、ユーザにレスポンスを返した後に実行することが許容される処理がある。例えば、ユーザのアクセス終了時間の記録などである。このように、ユーザへのレスポンス送信後に行なわれる処理が、Webサーバにおける「後処理」である。 In the Web server, there is a process that is allowed to be executed after a response is returned to the user. For example, recording of user access end time. As described above, the processing performed after the response is transmitted to the user is “post-processing” in the Web server.
アプリケーションサーバは、Webサーバから受け取ったリクエストに応答するために必要な処理を行い、Webサーバにレスポンスを返す。Webサーバへのレスポンス送信後に実行が許容される処理が、アプリケーションサーバにおける「後処理」である。アプリケーションサーバで行われる後処理の例は、皆本房幸著、「JBoss入門」、技術評論社、p.202に記載されている。この文献に記載されているように、アプリケーションサーバの実現の一形態であるEJB(Enterprise Java(登録商標) Bean)では、メッセージ駆動型Beanという機能を用いて「後処理」が行われる。 The application server performs processing necessary to respond to the request received from the Web server, and returns a response to the Web server. Processing that is allowed to be executed after the response is transmitted to the Web server is “post-processing” in the application server. Examples of post-processing performed by the application server are written by Fumiyuki Minamoto, “Introduction to JBoss”, Technical Review, p. 202. As described in this document, in “EJB (Enterprise Java (registered trademark) Bean)” which is one form of implementation of an application server, “post-processing” is performed using a function called message-driven bean.
データベースサーバは、アプリケーションサーバから受け取ったリクエストに応答するために必要な処理を行い、アプリケーションサーバにレスポンスを返す。アプリケーションサーバへのレスポンス送信後に実行が許容される処理が、データベースサーバにおける「後処理」である。データベースサーバで行われる後処理の例は、次の論文に記載されている:A. Tanaka et al., “Capacity Planning for Client Server Database Systems: A Case Study”, Proceedings of the 1995 International Workshop on Computer Performance Measurement and Analysis, pp. 110-117。この論文は、データベースサーバOracle(米国オラクル社の登録商標)の内部動作が、ユーザにレスポンスを返すShadowとLGWプロセスと、それらとは非同期に実行されるDBwritersとから構成されていることを開示している。 The database server performs processing necessary for responding to the request received from the application server, and returns a response to the application server. Processing that is allowed to be executed after the response is sent to the application server is “post-processing” in the database server. An example of post-processing performed in a database server is described in the following paper: A. Tanaka et al., “Capacity Planning for Client Server Database Systems: A Case Study”, Proceedings of the 1995 International Workshop on Computer Performance. Measurement and Analysis, pp. 110-117. This paper discloses that the internal operation of the database server Oracle (registered trademark of Oracle Corporation in the United States) is composed of Shadow and LGW processes that return responses to users and DBwriters that are executed asynchronously. ing.
このような後処理が発生する場合、サーバ負荷の判定において次のような問題が生じる。例えば、あるサーバがリクエスト処理後にユーザあるいは前段階のサーバにレスポンスを返し、処理中リクエスト数が減少する場合を考える。その後に発生する後処理は、リクエストを処理したプロセスとは異なるプロセスが担当する。当該サーバがレスポンスを返した時点で、処理中リクエスト数が減少するため、サーバ負荷が減少していると判断される。しかしながら、実際には、後処理に伴う負荷に関しては、その後処理を担当するプロセス内で該当処理が終了するまで減少することにはならない。上述の関連技術では、この後処理に伴う負荷が考慮されていない。従って、サーバ負荷が適切に判断されているとは言えない。その結果、計算機システムを管理する上で、サーバ負荷を均等にすることができないという問題も生じる。 When such post-processing occurs, the following problem occurs in determining the server load. For example, consider a case where a server returns a response to a user or a previous server after processing a request, and the number of requests being processed decreases. The post-processing that occurs thereafter is handled by a process different from the process that processed the request. When the server returns a response, the number of requests being processed decreases, so it is determined that the server load has decreased. However, in practice, the load associated with post-processing does not decrease until the corresponding processing is completed in the process in charge of the subsequent processing. In the related art described above, the load associated with this post-processing is not taken into consideration. Therefore, it cannot be said that the server load is appropriately determined. As a result, there arises a problem that the server load cannot be made equal in managing the computer system.
本発明の1つの目的は、後処理が発生する場合においてサーバ負荷を適切に判定することができる技術を提供することにある。 One object of the present invention is to provide a technique capable of appropriately determining a server load when post-processing occurs.
本発明の第1の観点において、複数のサーバの負荷を管理するサーバ負荷管理システムが提供される。そのサーバ負荷管理システムは、複数のサーバの各々の性能指標の時系列変化を示す性能指標変化テーブルが格納される記憶装置と、性能指標変化テーブルを参照してサーバ負荷を算出する処理装置と、を備える。性能指標は、CPU使用率と、処理中のリクエスト数の指標を与えるリクエストインデックスとを含む。処理装置は、傾向判定部と負荷算出部とを有する。傾向判定部は、リクエストインデックスの時系列変化に基づいて、複数のサーバの各々に関して処理中のリクエスト数が増加傾向か減少傾向かの判定を行う。負荷算出部は、CPU使用率を判定の結果に基づいて修正し、修正後CPU使用率をサーバ負荷として算出する。具体的には、判定結果が増加傾向の場合、負荷算出部はCPU使用率を上方修正する。一方、判定結果が減少傾向の場合、負荷算出部はCPU使用率を下方修正する。 In a first aspect of the present invention, a server load management system for managing loads of a plurality of servers is provided. The server load management system includes a storage device that stores a performance index change table that indicates a time-series change of each performance index of a plurality of servers, a processing device that calculates a server load with reference to the performance index change table, Is provided. The performance index includes a CPU usage rate and a request index that provides an index of the number of requests being processed. The processing apparatus includes a tendency determination unit and a load calculation unit. The trend determination unit determines whether the number of requests being processed is increasing or decreasing with respect to each of the plurality of servers based on the time series change of the request index. The load calculation unit corrects the CPU usage rate based on the determination result, and calculates the corrected CPU usage rate as the server load. Specifically, when the determination result is increasing, the load calculation unit upwardly corrects the CPU usage rate. On the other hand, when the determination result is decreasing, the load calculation unit corrects the CPU usage rate downward.
本発明の第2の観点において、複数のサーバの負荷を管理するサーバ負荷管理方法が提供される。そのサーバ負荷管理方法は、(A)複数のサーバの各々の性能指標の時系列変化を示す性能指標変化テーブルを、記憶装置から読み出すステップと、ここで、性能指標は、CPU使用率と、処理中のリクエスト数の指標を与えるリクエストインデックスとを含み、(B)リクエストインデックスの時系列変化に基づいて、複数のサーバの各々に関して処理中のリクエスト数が増加傾向か減少傾向かの判定を行うステップと、(C)CPU使用率を上記判定の結果に基づいて修正し、修正後CPU使用率をサーバ負荷として算出するステップと、を含む。判定結果が増加傾向の場合、CPU使用率は上方修正される。一方、判定結果が減少傾向の場合、CPU使用率は下方修正される。 In a second aspect of the present invention, a server load management method for managing loads of a plurality of servers is provided. The server load management method includes (A) a step of reading a performance index change table indicating a time series change of each performance index of a plurality of servers from a storage device, wherein the performance index includes a CPU usage rate, a process And (B) determining whether the number of requests being processed is increasing or decreasing with respect to each of the plurality of servers, based on a time-series change of the request index. And (C) correcting the CPU usage rate based on the result of the determination and calculating the corrected CPU usage rate as a server load. If the determination result is increasing, the CPU usage rate is corrected upward. On the other hand, when the determination result is decreasing, the CPU usage rate is corrected downward.
本発明の第3の観点において、複数のサーバの負荷の管理処理をコンピュータに実行させるサーバ負荷管理プログラムが提供される。その管理処理は、(a)複数のサーバの各々の性能指標の時系列変化を示す性能指標変化テーブルを、記憶装置から読み出すステップと、ここで、性能指標は、CPU使用率と、処理中のリクエスト数の指標を与えるリクエストインデックスとを含み、(b)リクエストインデックスの時系列変化に基づいて、複数のサーバの各々に関して処理中のリクエスト数が増加傾向か減少傾向かの判定を行うステップと、(c)CPU使用率を上記判定の結果に基づいて修正し、修正後CPU使用率をサーバ負荷として算出するステップと、を含む。判定結果が増加傾向の場合、CPU使用率は上方修正される。一方、判定結果が減少傾向の場合、CPU使用率は下方修正される。 In a third aspect of the present invention, a server load management program for causing a computer to execute a load management process for a plurality of servers is provided. The management process includes: (a) a step of reading a performance index change table indicating a time series change of each of the performance indexes of the plurality of servers from the storage device, wherein the performance index includes the CPU usage rate, And (b) determining whether the number of requests being processed is increasing or decreasing with respect to each of the plurality of servers, based on a time-series change of the request index, (C) correcting the CPU usage rate based on the determination result, and calculating the corrected CPU usage rate as a server load. If the determination result is increasing, the CPU usage rate is corrected upward. On the other hand, when the determination result is decreasing, the CPU usage rate is corrected downward.
本発明によれば、計算機システムにおいて後処理が発生する場合でも、サーバ負荷を適切に判定することが可能となる。その結果、計算機システムにおいて適切な負荷分散が可能となる。 According to the present invention, it is possible to appropriately determine the server load even when post-processing occurs in the computer system. As a result, appropriate load distribution can be achieved in the computer system.
添付図面を参照して、本発明の実施の形態に係るサーバ負荷管理システム、方法及びプログラムを説明する。 A server load management system, method, and program according to embodiments of the present invention will be described with reference to the accompanying drawings.
1.概要
本発明の実施の形態では、複数のサーバから構成される計算機システムに関して各サーバの負荷を管理するための技術が提供される。この計算機システムにおいて、各サーバは、ユーザあるいは前段のサーバからリクエスト(処理要求)を受け取り、要求された処理を実行する。リクエスト処理後、各サーバは、ユーザあるいは前段階のサーバにレスポンスを返す。このレスポンスの返信後に実行が許容される処理が「後処理」である。尚、後処理は、リクエストを処理したプロセスとは異なるプロセスによって実行される。1. Outline In the embodiment of the present invention, a technique for managing the load of each server with respect to a computer system composed of a plurality of servers is provided. In this computer system, each server receives a request (processing request) from a user or a previous-stage server, and executes the requested processing. After processing the request, each server returns a response to the user or the previous server. Processing that is allowed to be executed after the response is returned is “post-processing”. The post-processing is executed by a process different from the process that processed the request.
あるサーバがレスポンスを返した時点で、当該サーバにおける処理中リクエスト数は減少する。しかしながら、後処理が発生する場合、その後処理に伴う負荷に関しては、その後処理を担当するプロセス内で該当処理が終了するまで減少することにはならない。従って、当該サーバの負荷を適切に判定するためには、処理中リクエスト数だけでなく、後処理に伴う負荷をも考慮することが望ましい。本実施の形態の1つの目的は、後処理を考慮することによって、サーバ負荷をより正確に算出する(見積もる)ことである。 When a server returns a response, the number of requests being processed in the server decreases. However, when post-processing occurs, the load associated with the subsequent processing does not decrease until the corresponding processing ends in the process in charge of the subsequent processing. Therefore, in order to appropriately determine the load on the server, it is desirable to consider not only the number of requests being processed but also the load associated with post-processing. One object of the present embodiment is to more accurately calculate (estimate) the server load by considering post-processing.
サーバ負荷は、例えば「CPU使用率」で表される。CPU使用率とは、CPUが単位時間あたりに処理を行う割合である。例えば、CPUが単位時間のうち30%の時間だけ処理を行い、残りの70%の時間はアイドル状態であったとき、CPU使用率は0.3(30%)である。 The server load is represented by, for example, “CPU usage rate”. The CPU usage rate is a rate at which the CPU performs processing per unit time. For example, when the CPU performs processing for 30% of the unit time and the remaining 70% is idle, the CPU usage rate is 0.3 (30%).
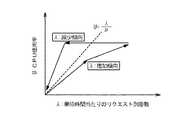
図1Aは、あるサーバに関するCPU使用率と処理中リクエスト数との関係を概念的に示している。縦軸がCPU使用率Uを表し、横軸が処理中リクエスト数Cを表している。図1A中の破曲線は、後処理が発生しない場合のCPU使用率Uと処理中リクエスト数Cとの関係を示している。例えばM/M/1型待ち行列モデルに従うと、その関係はU=1−1/(C+1)で表される。一般には、処理中リクエスト数Cが増加するにつれて、CPU使用率Uも増加する。逆に、処理中リクエスト数Cが減少するにつれて、CPU使用率Uも減少する。 FIG. 1A conceptually shows the relationship between the CPU usage rate and the number of requests being processed for a certain server. The vertical axis represents the CPU usage rate U, and the horizontal axis represents the number C of requests being processed. The broken line in FIG. 1A shows the relationship between the CPU usage rate U and the number C of requests being processed when no post-processing occurs. For example, according to the M / M / 1 type queuing model, the relationship is represented by U = 1−1 / (C + 1). In general, as the number C of requests being processed increases, the CPU usage rate U also increases. Conversely, as the number C of requests being processed decreases, the CPU usage rate U also decreases.
図1A中の矢印は、後処理が発生する場合のCPU使用率Uと処理中リクエスト数Cとの関係を概念的に示している。特に、右向きの矢印は、処理中リクエスト数Cが「増加傾向」にある場合を示し、左向きの矢印は、処理中リクエスト数Cが「減少傾向」にある場合を示している。図1Aに示されるように、概して、減少傾向の場合のCPU使用率Uは、増加傾向の場合のCPU使用率Uよりも高い。これは、次のような理由によると考えられる。処理中リクエスト数Cが増加傾向にある場合、それまでに処理したリクエスト数は比較的少なく、後処理に伴う負荷も比較的小さい。従って、CPU使用率Uが比較的低くなる。一方、処理中リクエスト数Cが減少傾向にある場合、それまでに処理したリクエスト数は比較的多く、後処理に伴う負荷が比較的大きい。従って、CPU使用率Uが比較的高くなる。 The arrows in FIG. 1A conceptually show the relationship between the CPU usage rate U and the number C of requests being processed when post-processing occurs. In particular, a right-pointing arrow indicates a case where the number of requests being processed C is “increasing tendency”, and a left-pointing arrow indicates a case where the number of requests being processed C is “decreasing”. As shown in FIG. 1A, in general, the CPU usage rate U in the case of a decreasing trend is higher than the CPU usage rate U in the case of an increasing trend. This is considered to be due to the following reasons. When the number C of requests being processed tends to increase, the number of requests processed so far is relatively small, and the load associated with post-processing is also relatively small. Therefore, the CPU usage rate U is relatively low. On the other hand, when the number C of requests being processed tends to decrease, the number of requests processed so far is relatively large, and the load associated with post-processing is relatively large. Therefore, the CPU usage rate U is relatively high.
このように、増加傾向の場合と減少傾向の場合とでは、同じCPU使用率Uを与える処理中リクエスト数Cが異なっている。言い換えれば、処理中リクエスト数Cが同じであったとしても、増加傾向の場合と減少傾向の場合とではCPU使用率Uが異なる。すなわち、後処理が発生する場合は、処理中リクエスト数Cから単純にサーバ負荷(CPU使用率)を算出することはできないのである。サーバ負荷を適切に算出するためには、処理中リクエスト数Cが増加傾向にあるか減少傾向にあるかを認識することが重要である。 As described above, the number C of requests being processed that gives the same CPU usage rate U is different between an increasing tendency and a decreasing tendency. In other words, even if the number C of requests being processed is the same, the CPU usage rate U differs between an increasing trend and a decreasing trend. That is, when post-processing occurs, the server load (CPU usage rate) cannot be simply calculated from the number C of requests being processed. In order to calculate the server load appropriately, it is important to recognize whether the number of requests C being processed is increasing or decreasing.
そこで、本実施の形態では、各サーバから、CPU使用率Uと共に処理中リクエスト数Cに関する情報が継続的に収集される。そして、処理中リクエスト数Cの時系列変化に基づいて、処理中リクエスト数Cが増加傾向か減少傾向かの判定が行われる。更に、その判定結果に基づいて、CPU使用率Uの修正(補正)が行われる。このときの修正方針として、本願発明者は次のものを考え出した。 Therefore, in this embodiment, information on the number C of requests being processed is continuously collected from each server together with the CPU usage rate U. Based on the time-series change in the number of requests C being processed, it is determined whether the number C of requests being processed is increasing or decreasing. Further, the CPU usage rate U is corrected (corrected) based on the determination result. As a correction policy at this time, the present inventor has devised the following.
まず、処理中リクエスト数Cが増加傾向にある場合を考える。この場合、上述の通り、それまでに処理したリクエスト数は比較的少なく、後処理に伴う負荷も現在のところは比較的小さい。しかしながら、処理中リクエスト数Cが増加傾向にあるということは、後処理に伴う負荷が将来的に増大することを意味する。言い換えれば、後処理の増大によって、将来的にはCPU使用率Uがより高くなる確率が極めて高い。従って、後処理に伴う負荷の増大を見込んで、CPU使用率Uはより高い方に修正される。すなわち、CPU使用率Uは「上方修正」される。 First, let us consider a case where the number C of requests being processed tends to increase. In this case, as described above, the number of requests processed so far is relatively small, and the load accompanying post-processing is also relatively small at present. However, the fact that the number C of requests being processed tends to increase means that the load accompanying post-processing will increase in the future. In other words, the probability that the CPU usage rate U will become higher in the future due to the increase in post-processing is extremely high. Accordingly, the CPU usage rate U is corrected to a higher value in anticipation of an increase in load accompanying post-processing. That is, the CPU usage rate U is “upwardly revised”.
次に、処理中リクエスト数Cが減少傾向にある場合を考える。この場合、上述の通り、それまでに処理したリクエスト数は比較的多く、後処理に伴う負荷は現在のところは比較的大きい。しかしながら、処理中リクエスト数Cが減少傾向にあるということは、後処理に伴う負荷が将来的に減少することを意味する。言い換えれば、後処理の減少によって、将来的にはCPU使用率Uがより低くなる確率が極めて高い。従って、後処理に伴う負荷の減少を見込んで、CPU使用率Uはより低い方に修正される。すなわち、CPU使用率Uは「下方修正」される。 Next, consider a case where the number C of requests being processed tends to decrease. In this case, as described above, the number of requests processed so far is relatively large, and the load associated with post-processing is currently relatively large. However, the fact that the number C of requests being processed tends to decrease means that the load accompanying post-processing will decrease in the future. In other words, there is a very high probability that the CPU usage rate U will become lower in the future due to the decrease in post-processing. Therefore, the CPU usage rate U is corrected to a lower value in anticipation of a reduction in load accompanying post-processing. That is, the CPU usage rate U is “corrected downward”.
このように、本実施の形態によれば、後処理に伴う負荷を考慮することによって、各サーバから通知されるCPU使用率Uの修正(補正)が実施される。修正により得られるCPU使用率は、以下「修正後CPU使用率U’」と参照される。この修正後CPU使用率U’が、修正前のCPU使用率Uよりも正確なサーバ負荷として扱われる。 As described above, according to this embodiment, the CPU usage rate U notified from each server is corrected (corrected) by taking into account the load associated with post-processing. The CPU usage rate obtained by the correction is hereinafter referred to as “corrected CPU usage rate U ′”. This corrected CPU usage rate U 'is treated as a more accurate server load than the CPU usage rate U before correction.
尚、処理中リクエスト数Cが増加傾向か減少傾向かを判断するにあたり、処理中リクエスト数Cそのもの以外のパラメータを用いることも可能である。 In determining whether the number of requests C being processed is increasing or decreasing, it is possible to use parameters other than the number of requests C being processed itself.
例えば、図1Bは、あるサーバに関するCPU使用率と単位時間あたりのリクエスト到着数との関係を概念的に示している。縦軸がCPU使用率Uを表し、横軸が単位時間あたりのリクエスト到着数λを表している。図1B中の破曲線は、後処理が発生しない場合の関係を示しており、例えばU=λ/μで表される。μは、CPUの単位時間あたりの最大処理数である。また、図1B中の矢印は、後処理が発生する場合の関係を概念的に示している。右向きの矢印は、リクエスト到着数λが増加傾向にある場合を示し、左向きの矢印は、リクエスト到着数λが減少傾向にある場合を示している。この図1Bで示される特性も、図1Aで示された特性と同様であることに留意されたい。従って、リクエスト到着数λが増加傾向か減少傾向かを判定することは、処理中リクエスト数Cが増加傾向か減少傾向かを判定することと同じ意味を持つ。すなわち、リクエスト到着数λの時系列変化に基づいて、処理中リクエスト数Cが増加傾向か減少傾向かの判定が可能である。 For example, FIG. 1B conceptually shows the relationship between the CPU usage rate for a certain server and the number of request arrivals per unit time. The vertical axis represents the CPU usage rate U, and the horizontal axis represents the number of request arrivals λ per unit time. The broken curve in FIG. 1B shows the relationship when no post-processing occurs, and is represented by, for example, U = λ / μ. μ is the maximum number of processes per unit time of the CPU. Moreover, the arrows in FIG. 1B conceptually show the relationship when post-processing occurs. A right-pointing arrow indicates a case where the request arrival number λ tends to increase, and a left-pointing arrow indicates a case where the request arrival number λ tends to decrease. It should be noted that the characteristic shown in FIG. 1B is similar to the characteristic shown in FIG. 1A. Therefore, determining whether the request arrival number λ is increasing or decreasing has the same meaning as determining whether the number of requests C being processed is increasing or decreasing. That is, it is possible to determine whether the number C of requests being processed is increasing or decreasing based on the time series change of the request arrival number λ.
その他、到着リクエストが格納されるキュー(待ち行列)の長さや、リクエストを処理するためのプロセス数を同様に用いることも可能である。更に、リクエスト到着数とリクエスト退去数(レスポンスが返されたリクエストの数)の組み合わせが用いられてもよい。ある時点までのリクエスト到着数の総和から、その時点までのリクエスト退去数の総和を引くことによって、処理中リクエスト数Cを見積もることができる。 In addition, the length of the queue (queue) in which the arrival request is stored and the number of processes for processing the request can be similarly used. Further, a combination of the number of request arrivals and the number of request evictions (the number of requests for which responses have been returned) may be used. The number C of requests being processed can be estimated by subtracting the total number of request evictions up to that point from the total number of request arrivals up to a certain point.
以上に説明されたパラメータは、以下「リクエストインデックスRI」と参照される。リクエストインデックスRIは、処理中のリクエスト数Cの指標を与えるパラメータである。リクエストインデックスRIとしては、上述の処理中リクエスト数Cそのもの、サーバへの単位時間あたりのリクエスト到着数λ、到着リクエストが格納されるキュー(待ち行列)の長さ、リクエストを処理するためのプロセス数、リクエスト到着数λとリクエスト退去数の組み合わせなどが挙げられる。このようなリクエストインデックスRIの時系列変化に基づいて、処理中リクエストCが増加傾向か減少傾向かの判定を行うことが可能である。 The parameter described above is hereinafter referred to as “request index RI”. The request index RI is a parameter that gives an index of the number C of requests being processed. The request index RI includes the number of requests C being processed, the number of request arrivals λ per unit time to the server, the length of the queue (queue) in which the arrival requests are stored, and the number of processes for processing the requests. And a combination of the request arrival number λ and the request withdrawal number. Based on such a time-series change of the request index RI, it is possible to determine whether the request C being processed is increasing or decreasing.
以上に説明された処理を実現するためのサーバ負荷管理システム及びその動作を、以下詳細に説明する。 A server load management system and its operation for realizing the processing described above will be described in detail below.
2.構成
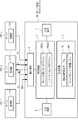
図2は、本実施の形態に係るサーバ負荷管理システム1の構成例を示すブロック図である。サーバ負荷管理システム1は、ネットワークを介して複数のサーバ100−1〜100−nと通信可能に接続されたコンピュータであり、複数のサーバ100−1〜100−nのそれぞれの負荷を管理する。サーバ100の台数はn台である(nは1以上の整数)。2. Configuration FIG. 2 is a block diagram showing a configuration example of the server
例えば、各サーバ100は、Webサーバ、アプリケーションサーバ、あるいはデータベースサーバである。Webサーバの場合、各サーバ100は、ユーザからのリクエストを、ユーザから直接あるいは負荷分散装置などを経由して受け取り、必要な処理を実行し、処理結果(レスポンス)をユーザに返す。アプリケーションサーバの場合、各サーバ100は、前段のWebサーバからリクエストを受け取り、必要な処理を実行し、処理結果(レスポンス)をWebサーバに返す。データベースサーバの場合、各サーバ100は、前段のアプリケーションサーバからリクエスト(データベース処理要求)を受け取り、必要な処理を実行し、処理結果(レスポンス)をアプリケーションサーバに返す。いずれの場合でも、各サーバ100は、何らかのリクエストを受け取り、そのリクエストに対するレスポンスを返す。そして、レスポンスの返信後に「後処理」が発生する。 For example, each
各サーバ100は、自身の「性能指標」を計測するための監視部110を有している。性能指標は、各サーバ100におけるCPU使用率Uと上述のリクエストインデックスRIを含んでいる。例えば、性能指標は、CPU使用率Uと処理中リクエスト数Cである。このような性能指標は、UNIX(登録商標)(もしくはLinux)オペレーティングシステムで用意されている“sysstat”、“vmstat”、“top”などのコマンドを用いることにより計測することができる。あるいは、Windows(登録商標)オペレーティングシステムの場合、“パフォーマンスモニタ”を用いることにより性能指標を計測することができる。各サーバ100は、監視部110を用いて性能指標を計測し、得られた性能指標と計測時刻を示す性能指標データPIをサーバ負荷管理システム1に逐次送信する。 Each
図2に示されるように、本実施の形態に係るサーバ負荷管理システム1は、処理装置2、記憶装置3、通信装置4、入力装置5及び出力装置6を備えている。処理装置2はCPUを含んでおり、各種データ処理を行う。記憶装置3として、HDD(Hard Disk Drive)やRAM(Random Access Memory)等が例示される。通信装置4は、ネットワークに接続されるネットワークインタフェースである。入力装置5として、キーボード、マウス、メディアドライブ等が例示される。出力装置6として、ディスプレイ等が例示される。 As shown in FIG. 2, the server
記憶装置3には、性能指標変化テーブルTBL、サーバグループ管理リストGRPなどが格納される。性能指標変化テーブルTBLは、各サーバ100の性能指標の時系列変化を示すテーブルであり、その詳細は後述される。サーバグループ管理リストGRPは、各サーバをグループ分けして示すリストであり、その詳細は後述される。 The
処理装置2は、記憶装置3に格納された性能指標変化テーブルTBLを参照して、サーバ負荷を算出する。より詳細には、処理装置2は、サーバ負荷判定プログラムPROG1を実行することにより、サーバ負荷算出処理を行う。サーバ負荷判定プログラムPROG1は、処理装置2によって実行されるソフトウェアプログラムである。典型的には、サーバ負荷判定プログラムPROG1は、コンピュータ読み取り可能な記録媒体に記録されている。処理装置2は、その記録媒体からサーバ負荷判定プログラムPROG1を読み出し、実行する。 The
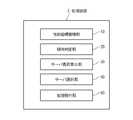
図3は、本実施の形態に係る処理装置2の機能を示すブロック図である。図3に示されるように、処理装置2は、性能指標蓄積部10、傾向判定部20、サーバ負荷算出部30、及びサーバ選択部40を有している。これら性能指標蓄積部10、傾向判定部20、サーバ負荷算出部30、及びサーバ選択部40は、処理装置2とサーバ負荷判定プログラムPROG1との協働によって実現され、それぞれ所定の機能を提供する。以下、本実施の形態に係るサーバ負荷管理システム1(処理装置2)による処理を詳細に説明する。 FIG. 3 is a block diagram illustrating functions of the
3.処理フロー
図4は、本実施の形態に係るサーバ負荷管理システム1による処理を示すフローチャートである。図2〜図4を適宜参照して、本実施の形態に係る処理フローを詳しく説明する。3. Processing Flow FIG. 4 is a flowchart showing processing by the server
ステップS10:
各サーバ100の監視部110は、自身の性能指標を所定の時間間隔で測定する。性能指標は、CPU使用率Uと上述のリクエストインデックスRIを含んでいる。そして、各サーバ100は、得られた性能指標とその測定時刻を示す性能指標データPIを、サーバ負荷管理システム1に逐次送信する。サーバ負荷管理システム1の通信装置4は、各サーバ100から送られてくる性能指標データPIを受け取る。性能指標蓄積部10は、受け取った性能指標データPIを、記憶装置3中の性能指標変化テーブルTBLに登録する。Step S10:
The
図5Aは、本実施の形態に係る性能指標変化テーブルTBLを概念的に示している。図5Aに示されるように、性能指標変化テーブルTBLは、測定時刻(あるいはサーバ負荷管理システム1の受信時刻)と性能指標(CPU使用率U、リクエストインデックスRI)を示している。つまり、性能指標変化テーブルTBLは、性能指標の時系列変化を示している。このような性能指標変化テーブルTBLは、サーバ100毎に作成される。 FIG. 5A conceptually shows the performance index change table TBL according to the present embodiment. As shown in FIG. 5A, the performance index change table TBL shows the measurement time (or the reception time of the server load management system 1) and the performance index (CPU usage rate U, request index RI). That is, the performance index change table TBL indicates the time series change of the performance index. Such a performance index change table TBL is created for each
図5Bは、リクエストインデックスRIが処理中リクエスト数Cである場合の、あるサーバ100に関する性能指標変化テーブルTBLの例を示している。図5Bに示されるように、性能指標変化テーブルTBLは、当該サーバ100のCPU使用率U及び処理中リクエスト数Cの時系列変化を示している。例えば、時刻T1において、CPU使用率はU1であり処理中リクエスト数はC1であり、直近の時刻Tsのおいて、CPU使用率はUsであり処理中リクエスト数はCsである。新たに受け取る性能指標データPIは、テーブルの次の行に追記される。FIG. 5B shows an example of the performance index change table TBL related to a
ステップS15:
サーバ負荷の算出処理は、所定のタイミング毎に実施される。そのタイミングまでは、ステップS10が繰り返され、性能指標変化テーブルTBLにデータが蓄積される。所定のタイミングになると、次のステップS20が実行される。Step S15:
The server load calculation process is performed every predetermined timing. Until that timing, step S10 is repeated and data is accumulated in the performance index change table TBL. When the predetermined timing is reached, the next step S20 is executed.
ステップS20:
傾向判定部20は、各サーバ100に関して、処理中リクエスト数Cが増加傾向か減少傾向かの判定を行う。この判定にあたり、傾向判定部20は、記憶装置3に格納された性能指標変化テーブルTBLで示されるリクエストインデックスRIの時系列変化を参照することができる。つまり、傾向判定部20は、リクエストインデックスRIの時系列変化に基づいて、各サーバ100の処理中リクエスト数Cの変化傾向を判定する。そして、傾向判定部20は、その判定結果に基づいて、サーバ100−1〜100−nのそれぞれをグループ分けする。上記判定結果、すなわち、処理中リクエスト数Cの変化傾向に応じて、次の3種類のサーバグループが考えられる。Step S20:
The
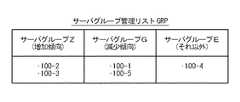
(1)サーバグループZ:処理中リクエスト数Cが増加傾向にある
(2)サーバグループG:処理中リクエスト数Cが減少傾向にある
(3)サーバグループE:それ以外(1) Server group Z: The number C of requests being processed is increasing (2) Server group G: The number C of requests being processed is decreasing (3) Server group E: Other
記憶装置3中のサーバグループ管理リストGRPは、このようなサーバのグループ分けを示す。つまり、サーバグループ管理リストGRPは、サーバグループ(Z,G,E)のそれぞれに属しているサーバのリストを示す。尚、サーバグループEは、必ずしも設定されなくてもよく、必要に応じて設定されればよい。 The server group management list GRP in the
図6は、本ステップS20における処理フローの一例を示している。まず、初期化が行われる(ステップS21)。具体的には、サーバグループ管理リストGRPが初期化され、全てのサーバグループが空に設定される。また、判定対象のサーバ番号iが1に初期化される。サーバ番号iが取り得る値は、1からn(サーバ総数)までである。その後、判定対象のサーバ100−iに関して、次の処理が実施される。 FIG. 6 shows an example of the processing flow in this step S20. First, initialization is performed (step S21). Specifically, the server group management list GRP is initialized and all server groups are set to be empty. In addition, the server number i to be determined is initialized to 1. Possible values of the server number i are 1 to n (total number of servers). Thereafter, the following processing is performed on the determination target server 100-i.
ステップS22:
まず、傾向判定部20は、記憶装置3に格納された性能指標変化テーブルTBLから、サーバ100−iに関する性能指標を読み出す。ここでは、性能指標は、CPU使用率Uと処理中リクエスト数Cであるとする。サーバ100−iに関して、次の(k+1)種類の時刻のそれぞれにおける性能指標が読み出される。kは1以上の整数である。Step S22:
First, the
時刻Tp:CPU使用率Up,処理中リクエスト数Cp
時刻Tp−1:CPU使用率Up−1,処理中リクエスト数Cp−1
・・・
時刻Tp−(k−1):CPU使用率Up−(k−1),処理中リクエスト数Cp−(k−1)
時刻Tp−k:CPU使用率Up−k,処理中リクエスト数Cp−kTime Tp : CPU usage rate Up , number of requests being processed Cp
Time Tp-1 : CPU usage rate Up-1 , number of requests being processed Cp-1
...
Time Tp− (k−1) : CPU usage rate Up− (k−1) , number of requests being processed Cp− (k−1)
Time Tpk : CPU usage rate Upk , number of requests being processed Cpk
時刻Tpは現在時刻に最も近い時刻であり、パラメータkが大きくなるにつれて時刻は過去に遡る。パラメータkは、ユーザによってあらかじめ指定されている。典型的にはパラメータkは1に設定され(k=1)、その場合、直近の時刻Tpとその前の時刻Tp−1のそれぞれにおける性能指標が読み出される。The time Tp is the time closest to the current time, and the time goes back in the past as the parameter k increases. The parameter k is designated in advance by the user. Typically, the parameter k is set to 1 (k = 1), and in this case, the performance index at each of the latest time Tp and the previous time Tp−1 is read.
ステップS23:
次に、傾向判定部20は、読み出された処理中リクエスト数Cp〜Cp−k(リクエストインデックスRI)の時系列変化に基づいて、サーバ100−iの処理中リクエスト数Cの変化率Vを算出する。そのために、傾向判定部20は、時刻Tp−j〜Tp−(j−1)間での処理中リクエスト数Cの単位変化率Vjをそれぞれ算出する(jは、1〜kの整数)。単位変化率Vjは、次の式(1)で表される。Step S23:
Next, tends

更に、傾向判定部20は、算出されたそれぞれの単位変化率Vjの平均値を変化率Vとして算出する。処理中リクエスト数Cの変化率Vは、次の式(2)で表される。Furthermore, the
変化率Vは、単位変化率Vjの重み付け平均であってもよい。この場合、予め指定された重み付けパラメータβjを用いることにより、変化率Vは次の式(3)で表される。Change rate V may be weighted average of the unit change ratio Vj. In this case, the change rate V is expressed by the following equation (3) by using the weighting parameter βj specified in advance.
パラメータkが1の場合、あるいは、時間間隔Tp−(j−1)−Tp−jが一定の場合には、単位変化率Vjは次の式(4)で定義されてもよい。When the parameter k is 1, or when the time interval Tp− (j−1) −Tp−j is constant, the unit change rate Vj may be defined by the following equation (4).
ステップS24:
次に、傾向判定部20は、ステップS23で算出された処理中リクエスト数Cの変化率Vに基づいて、サーバ100−iのグループ分けを行う。例えば、傾向判定部20は、変化率Vを所定の閾値と比較する。変化率Vが所定の正の閾値ε以上である場合、傾向判定部20は、処理中リクエスト数Cが増加傾向にあると判定する。従って、傾向判定部20は、サーバ100−iを、サーバグループ管理リストGRP中のサーバグループZに登録する。一方、変化率Vが所定の負の閾値−ε以下である場合、傾向判定部20は、処理中リクエスト数Cが減少傾向にあると判定する。従って、傾向判定部20は、サーバ100−iを、サーバグループ管理リストGRP中のサーバグループGに登録する。それ以外の場合、傾向判定部20は、サーバ100−iを、サーバグループ管理リストGRP中のサーバグループEに登録する。Step S24:
Next, the
尚、上記閾値(ε,−ε)は、ユーザによってあらかじめ指定される微少量である。閾値(ε,−ε)は0であってもよく、その場合、サーバグループEは設定されない。 The threshold value (ε, −ε) is a small amount specified in advance by the user. The threshold value (ε, −ε) may be 0. In this case, the server group E is not set.
ステップS25,S26:
現在のサーバ番号iがサーバ総数nと等しくない場合(ステップS25;No)、サーバ番号iに1が加算され、次のサーバ100−iが選択される(ステップS26)。その後、ステップS22〜S24が同様に行われる。現在のサーバ番号iがサーバ総数nと等しい場合(ステップS25;Yes)、ステップS20は終了する。このようにして、全てのサーバ100−1〜100−nのグルーピングが完了し、サーバグループ管理リストGRPが完成する。Steps S25 and S26:
When the current server number i is not equal to the total number n of servers (step S25; No), 1 is added to the server number i, and the next server 100-i is selected (step S26). Thereafter, steps S22 to S24 are similarly performed. If the current server number i is equal to the total number n of servers (step S25; Yes), step S20 ends. In this way, the grouping of all the servers 100-1 to 100-n is completed, and the server group management list GRP is completed.
図7Aは、ステップS20で作成されるサーバグループ管理リストGRPの一例を示している。ここでは、サーバ総数nは5である。サーバグループZ(増加傾向)は、サーバ100−2とサーバ100−3を含んでいる。サーバグループG(減少傾向)は、サーバ100−1とサーバ100−5を含んでいる。サーバグループE(それ以外)は、サーバ100−4を含んでいる。 FIG. 7A shows an example of the server group management list GRP created in step S20. Here, the total number n of servers is 5. The server group Z (increasing tendency) includes a server 100-2 and a server 100-3. The server group G (decreasing trend) includes a server 100-1 and a server 100-5. The server group E (other than that) includes the server 100-4.
また、図7Bに示されるように、サーバグループ管理リストGRPは、サーバ100−1〜100−5のそれぞれのCPU使用率U(1)〜U(5)を示していてもよい。ここで示されるCPU使用率U(1)〜U(5)の各々は、直近の時刻TpでのCPU使用率Up、あるいは、所定期間内でのCPU使用率の平均値である。所定期間内でのCPU使用率の平均値は、例えば、本ステップS20で性能指標変化テーブルTBLから読み出されたCPU使用率Up〜Up−kの平均値である。Further, as illustrated in FIG. 7B, the server group management list GRP may indicate the CPU usage rates U (1) to U (5) of the servers 100-1 to 100-5. Each CPU utilization U (1) ~U (5) shown here, CPU utilization in the most recent timeT pU p or an average value of the CPU utilization within a predetermined time period. The average value of the CPU usage rates within the predetermined period is, for example, the average value of the CPU usage rates Up to Up-k read from the performance index change table TBL in step S20.
ステップS30:
サーバ負荷算出部30は、サーバ負荷を算出(推定)する。より詳細には、サーバ負荷算出部30は、上記ステップS20での判定結果に応じてCPU使用率Uを修正(補正)し、修正後CPU使用率U’を算出する。その修正後CPU使用率U’が、サーバ負荷の推定値となる。Step S30:
The server
上記ステップS20での判定結果、すなわち、各サーバ100のグループ分けは、記憶装置3に格納されたサーバグループ管理リストGRPを参照することにより得られる。修正対象のCPU使用率Uは、直近の時刻TpでのCPU使用率Up、あるいは、所定期間内でのCPU使用率の平均値である。そのような修正対象のCPU使用率Uは、記憶装置2に格納されている性能指標変化テーブルTBLを参照することにより得ることができる。あるいは、図7Bで示されたようなサーバグループ管理リストGRPが作成されている場合、性能指標変化テーブルTBLを参照することなく、修正対象のCPU使用率Uを得ることができる。The determination result in step S20, that is, the grouping of each
まず、サーバグループZに関するCPU使用率Uの修正を考える。サーバグループZに含まれるサーバの処理中リクエスト数Cは増加傾向にある。処理中リクエスト数Cが増加傾向にあるということは、後処理に伴う負荷が将来的に増大することを意味する。言い換えれば、後処理の増大によって、将来的にはCPU使用率Uがより高くなる確率が極めて高い。従って、後処理に伴う負荷の増大を見込んで、サーバ負荷算出部30は、CPU使用率Uを「上方修正」する。 First, consider the correction of the CPU usage rate U for the server group Z. The number C of requests being processed by servers included in the server group Z tends to increase. The fact that the number C of requests being processed tends to increase means that the load accompanying post-processing will increase in the future. In other words, the probability that the CPU usage rate U will become higher in the future due to the increase in post-processing is extremely high. Therefore, the server
例えば、サーバ負荷算出部30は、所定の比率だけCPU使用率Uを上方修正することができる。その所定の比率は、後処理が含まれない場合の負荷と後処理も含めた場合の負荷との間の比率を反映していることが望ましい。サーバがリクエストを受け取ってからレスポンスを返すまでのリクエスト処理に使われるCPU時間は“s1”であるとする。また、サーバが当該レスポンスを返した後の後処理に使われるCPU時間は“s2”であるとする。このとき、係数α=s1/(s1+s2)は、後処理が含まれない場合の負荷と後処理も含めた場合の負荷との間の比率を反映していると言える。よって、サーバ負荷算出部30は、CPU使用率Uを係数α(<1)で割ることによって、CPU使用率Uを上方修正することができる。係数αは、ユーザによって予め指定されるとよい。サーバグループZに含まれるあるサーバiのCPU使用率はUZ(i)であるとする。また、上方修正によって得られる修正後CPU使用率はUZ’(i)であるとする。このとき、修正後CPU使用率UZ’(i)は、次の式(5)で与えられる。 For example, the server
次に、サーバグループGに関するCPU使用率Uの修正を考える。サーバグループGに含まれるサーバの処理中リクエスト数Cは減少傾向にある。処理中リクエスト数Cが減少傾向にあるということは、後処理に伴う負荷が将来的に減少することを意味する。言い換えれば、後処理の減少によって、将来的にはCPU使用率Uがより低くなる確率が極めて高い。従って、後処理に伴う負荷の減少を見込んで、サーバ負荷算出部30は、CPU使用率Uを「下方修正」する。 Next, consider the correction of the CPU usage rate U for the server group G. The number of requests C being processed by the servers included in the server group G tends to decrease. The fact that the number C of requests being processed tends to decrease means that the load accompanying post-processing will decrease in the future. In other words, there is a very high probability that the CPU usage rate U will become lower in the future due to the decrease in post-processing. Accordingly, the server
例えば、サーバ負荷算出部30は、所定の比率だけCPU使用率Uを下方修正することができる。その所定の比率は、後処理が含まれない場合の負荷と後処理も含めた場合の負荷との間の比率を反映していることが望ましい。例えば、上述の係数α=s1/(s1+s2)が用いられる。サーバ負荷算出部30は、CPU使用率Uに係数α(<1)を掛けることによって、CPU使用率Uを下方修正することができる。サーバグループGに含まれるあるサーバiのCPU使用率はUG(i)であるとする。また、下方修正によって得られる修正後CPU使用率はUG’(i)であるとする。このとき、修正後CPU使用率UG’(i)は、次の式(6)で与えられる。 For example, the server
それ以外のサーバグループEに関して、サーバ負荷算出部30は特に修正を行わない。サーバグループEに含まれるあるサーバiのCPU使用率はUE(i)であるとする。便宜上、修正後CPU使用率UE’(i)を考えると、その修正後CPU使用率UE’(i)は、次の式(7)で与えられる。 For the other server groups E, the server
尚、サーバ負荷算出部30は、サーバ100−1〜100−nの全てに関してCPU使用率Uの修正を行ってもよいし、そうでなくてもよい。サーバ負荷算出部30は、サーバ100−1〜100−nからいくつかのサーバ100を抽出し、抽出された各サーバ100に関してCPU使用率Uの修正を行うことができる。例えば、サーバ負荷算出部30は、サーバグループ管理リストGRPを参照して、サーバグループ(Z,G,E)の各々から少なくとも1つのサーバ100を抽出することができる。また、負荷分散処理では、サーバ負荷が最大である「最大負荷サーバ」や、サーバ負荷が最小である「最小負荷サーバ」を見つけ出すことがとりわけ重要である。従って、サーバ100−1〜100−nの全てに関してCPU使用率Uの修正を行う必要は必ずしもない。CPU使用率Uが最大あるいは最小であるサーバに着目し、そのサーバに関してCPU使用率Uの修正を行えば十分である場合もある。 Note that the server
本実施の形態が負荷分散処理へ適用される場合、例えば次のようなサーバ抽出が好適である。サーバ負荷算出部30は、CPU使用率UとステップS20での判定結果(サーバグループ管理リストGRP)に基づいて、サーバ100−1〜100−nからいくつかのサーバを抽出する。具体的には、サーバ負荷算出部30は、サーバグループ管理リストGRPで示されるサーバグループ(Z,G,E)の各々から、CPU使用率Uが最大であるサーバ及びCPU使用率Uが最小であるサーバのうち少なくとも一方を抽出する。ここでのCPU使用率Uは、上述の修正対象のCPU使用率Uと同じであり、性能指標変化テーブルTBLあるいは図7Bで示されたサーバグループ管理リストGRPを参照することにより得られる。そして、サーバ負荷算出部30は、抽出された各サーバに関してCPU使用率Uを修正し、修正後CPU使用率U’をサーバ負荷として算出する。 When the present embodiment is applied to load distribution processing, for example, the following server extraction is suitable. The server
以上に説明されたステップS30の結果、すなわち、算出された修正後CPU使用率U’は、ディスプレイ(出力装置6)に表示されてもよい。ユーザは、その表示を参照することにより、後処理に伴う負荷が考慮された正確なサーバ負荷を把握することができる。また、ユーザは、入力装置5を用いて、修正後CPU使用率U’(サーバ負荷)の分析を行うこともできる。 The result of step S30 described above, that is, the calculated post-correction CPU usage rate U 'may be displayed on the display (output device 6). By referring to the display, the user can grasp the accurate server load in consideration of the load associated with the post-processing. The user can also analyze the corrected CPU usage rate U ′ (server load) using the
ステップS40:
サーバ選択部40は、ステップS30で抽出されたサーバ(修正後CPU使用率U’が算出されたサーバ)から、所定の条件に合うサーバを選択する。例えば、サーバ選択部40は、ステップS30で抽出されたサーバから、「最大負荷サーバ」及び「最小負荷サーバ」の少なくとも1つを選択する。ここで、最大負荷サーバは、修正後CPU使用率U’が最大であるサーバであり、最小負荷サーバは、修正後CPU使用率U’が最小であるサーバである。最大負荷サーバが選択される場合、先行するステップS30において、サーバグループ(Z,G,E)の各々からCPU使用率Uが最大であるサーバが少なくとも抽出されていることが望ましい。最小負荷サーバが選択される場合、先行するステップS30において、サーバグループ(Z,G,E)の各々からCPU使用率Uが最小であるサーバが少なくとも抽出されていることが望ましい。Step S40:
The
ステップS40において最大負荷サーバ及び/あるいは最小負荷サーバを選択することは、負荷分散処理に有用である。ステップS40の結果、すなわち、選択されたサーバは、ディスプレイ(出力装置6)に表示されてもよい。ユーザは、その表示を参照することにより、最大負荷サーバや最小負荷サーバを把握することができる。 Selecting the maximum load server and / or the minimum load server in step S40 is useful for load distribution processing. The result of step S40, that is, the selected server may be displayed on the display (output device 6). The user can grasp the maximum load server and the minimum load server by referring to the display.
4.効果
以上に説明されたように、本実施の形態によれば、処理中リクエスト数Cが増加傾向か減少傾向かの判定が行われ、その判定結果に基づいてCPU使用率Uの修正が行われる。これにより、後処理に伴う負荷が、サーバ負荷の推定値に適切に組み込まれる。つまり、計算機システムにおいて後処理が発生する場合のサーバ負荷をより正確に算出することが可能となる。後処理を考慮することによってサーバ負荷が適切に算出されるため、最小負荷サーバ及び/あるいは最大負荷サーバを正しく決定することができる。結果として、計算機システムにおいて適切な負荷分散が可能となる。4). Effect As described above, according to the present embodiment, it is determined whether the number C of requests being processed is increasing or decreasing, and the CPU usage rate U is corrected based on the determination result. . Thereby, the load accompanying post-processing is appropriately incorporated in the estimated value of the server load. That is, it is possible to calculate the server load more accurately when post-processing occurs in the computer system. Since the server load is appropriately calculated by considering the post-processing, the minimum load server and / or the maximum load server can be correctly determined. As a result, appropriate load distribution can be performed in the computer system.
5.第1の応用例(リクエストの割り当て)
本実施の形態は、サーバへのリクエストの割り当て(振り分け)に応用することができる。図8は、既出のサーバ負荷判定処理に加えてリクエスト割当処理を行うための構成例を示している。既出の図2と同じ構成には同一の符号が付され、重複する説明は適宜省略される。5. First application example (request allocation)
This embodiment can be applied to allocation (distribution) of requests to servers. FIG. 8 shows a configuration example for performing a request allocation process in addition to the already-described server load determination process. The same components as those in FIG. 2 described above are denoted by the same reference numerals, and redundant description will be omitted as appropriate.
図8に示されるように、サーバ負荷管理システム1Aは、新規リクエストREQを受け取り、その新規リクエストREQを複数のサーバ100−1〜100−nのうち適切な1台のサーバ100に割り当てる。特に、サーバ負荷管理システム1Aは、複数のサーバ100−1〜100−nのうち最小負荷サーバを選択し、選択された最小負荷サーバに新規リクエストREQを割り当てる。 As illustrated in FIG. 8, the server load management system 1A receives a new request REQ and assigns the new request REQ to an appropriate one
より詳細には、サーバ負荷管理システム1Aの処理装置2は、サーバ負荷判定プログラムPROG1と共にリクエスト割当プログラムPROG2を実行する。リクエスト割当プログラムPROG2は、処理装置2によって実行されるソフトウェアプログラムである。典型的には、リクエスト割当プログラムPROG2は、コンピュータ読み取り可能な記録媒体に記録されている。処理装置2は、その記録媒体からリクエスト割当プログラムPROG2を読み出し、実行する。 More specifically, the
図9は、本例に係る処理装置2の機能を示すブロック図である。図9に示されるように、処理装置2は、既出の性能指標蓄積部10、傾向判定部20、サーバ負荷算出部30及びサーバ選択部40に加えて、リクエスト割当部50を有している。リクエスト割当部50は、処理装置2とリクエスト割当プログラムPROG2との協働によって実現される。 FIG. 9 is a block diagram illustrating functions of the
図10は、本例に係るサーバ負荷管理システム1Aによる処理を示すフローチャートである。ステップS10〜S40は、既出の実施の形態と同様である。但し、ステップS30においてサーバ負荷算出部30によって抽出されるサーバは、各サーバグループ(Z,G,E)のうちCPU使用率Uが最小であるサーバを含んでいる。つまり、サーバ負荷算出部30は、少なくとも、サーバグループZからCPU使用率Uが最小であるサーバを抽出し、サーバグループGからCPU使用率Uが最小であるサーバを抽出し、サーバグループEからCPU使用率Uが最小であるサーバを抽出する。そして、サーバ負荷算出部30は、抽出されたサーバの各々に関して修正後CPU使用率U’を算出する。また、ステップS40において、サーバ選択部40は、上記抽出されたサーバから、修正後CPU使用率U’が最小である最小負荷サーバを選択する。 FIG. 10 is a flowchart showing processing by the server load management system 1A according to this example. Steps S10 to S40 are the same as those in the above-described embodiment. However, the server extracted by the server
ステップS50において、リクエスト割当部50は、新規リクエストREQを受け取る。そして、リクエスト割当部50は、その新規リクエストREQを、ステップS40において選択された最小負荷サーバに割り当てる。そして、リクエスト割当部50は、新規リクエストREQをその最小負荷サーバに送信する。図8で示された例では、最小負荷サーバはサーバ100−2である。ステップS40において選択される最小負荷サーバは、時間経過とともに更新される。それに伴い、新規リクエストREQが送信される最小負荷サーバも変化する。結果として、複数のサーバ100−1〜100−n間での負荷分散が実現される。 In step S50, the
本実施の形態によれば、後処理に伴う負荷を考慮して、最小負荷サーバが正しく選択される。これを利用することによって、後処理に伴う負荷をも考慮した適切な負荷分散が可能となる。尚、サーバ負荷判定処理(ステップS10〜S40)とリクエスト割当処理(ステップS50)は、別々の装置(コンピュータ)により実行されてもよい。 According to the present embodiment, the minimum load server is correctly selected in consideration of the load accompanying post-processing. By using this, appropriate load distribution can be performed in consideration of the load accompanying post-processing. The server load determination process (steps S10 to S40) and the request allocation process (step S50) may be executed by separate devices (computers).
6.第2の応用例(サーバ間の処理の移行)
本実施の形態は、サーバ間の処理の移行に応用することもできる。図11は、既出のサーバ負荷判定処理に加えて移行処理を行うための構成例を示している。既出の図2と同じ構成には同一の符号が付され、重複する説明は適宜省略される。6). Second application example (migration of processing between servers)
This embodiment can also be applied to the transfer of processing between servers. FIG. 11 shows a configuration example for performing the migration process in addition to the already-described server load determination process. The same components as those in FIG. 2 described above are denoted by the same reference numerals, and redundant description will be omitted as appropriate.
本例において、サーバ負荷管理システム1Bの処理装置2は、サーバ負荷判定プログラムPROG1と共に処理移行プログラムPROG3を実行する。処理移行プログラムPROG3は、処理装置2によって実行されるソフトウェアプログラムである。典型的には、処理移行プログラムPROG3は、コンピュータ読み取り可能な記録媒体に記録されている。処理装置2は、その記録媒体から処理移行プログラムPROG3を読み出し、実行する。 In this example, the
図12は、本例に係る処理装置2の機能を示すブロック図である。図12に示されるように、処理装置2は、既出の性能指標蓄積部10、傾向判定部20、サーバ負荷算出部30及びサーバ選択部40に加えて、処理移行部60を有している。処理移行部60は、処理装置2と処理移行プログラムPROG3との協働によって実現される。 FIG. 12 is a block diagram illustrating functions of the
図13は、本例に係るサーバ負荷管理システム1Bによる処理を示すフローチャートである。ステップS10〜S40は、既出の実施の形態と同様である。但し、ステップS30においてサーバ負荷算出部30によって抽出されるサーバは、各サーバグループ(Z,G,E)のうちCPU使用率Uが最大であるサーバと最小であるサーバの両方を含んでいる。つまり、サーバ負荷算出部30は、少なくとも、サーバグループZからCPU使用率Uが最大であるサーバと最小であるサーバを抽出し、サーバグループGからCPU使用率Uが最大であるサーバと最小であるサーバを抽出し、サーバグループEからCPU使用率Uが最大であるサーバと最小であるサーバを抽出する。そして、サーバ負荷算出部30は、抽出されたサーバの各々に関して修正後CPU使用率U’を算出する。また、ステップS40において、サーバ選択部40は、上記抽出されたサーバから、修正後CPU使用率U’が最大である最大負荷サーバ(第1サーバ)と、修正後CPU使用率U’が最小である最小負荷サーバ(第2サーバ)の両方を選択する。 FIG. 13 is a flowchart showing processing by the server load management system 1B according to the present example. Steps S10 to S40 are the same as those in the above-described embodiment. However, the server extracted by the server
ステップS60において、処理移行部60は、最大負荷サーバで実行中の処理のいくつかを、最小負荷サーバに移行(移動)する。このような移行処理は、例えば、特開2004−078465号公報に記載された「プロセスマイグレーション方法」により実現可能である。図11で示された例では、最大負荷サーバはサーバ100−1であり、最小負荷サーバはサーバ100−2である。よって、処理移行部60は、サーバ100−1で実行中の処理のいくつかを、サーバ100−2に移行する。ステップS40において選択される最大負荷サーバ及び最小負荷サーバは、時間経過とともに更新される。それに伴い、移行が行われる最大負荷サーバ及び最小負荷サーバも変化する。結果として、複数のサーバ100−1〜100−n間での負荷分散が実現される。 In step S60, the
本実施の形態によれば、後処理に伴う負荷を考慮して、最大負荷サーバ及び最小負荷サーバが正しく選択される。これを利用することによって、後処理に伴う負荷をも考慮した適切な負荷分散が可能となる。尚、サーバ負荷判定処理(ステップS10〜S40)と移行処理(ステップS60)は、別々の装置(コンピュータ)により実行されてもよい。 According to the present embodiment, the maximum load server and the minimum load server are correctly selected in consideration of the load accompanying post-processing. By using this, appropriate load distribution can be performed in consideration of the load accompanying post-processing. The server load determination process (steps S10 to S40) and the migration process (step S60) may be executed by separate devices (computers).
以上、本発明の実施の形態が添付の図面を参照することにより説明された。但し、本発明は、上述の実施の形態に限定されず、要旨を逸脱しない範囲で当業者により適宜変更され得る。 The embodiments of the present invention have been described above with reference to the accompanying drawings. However, the present invention is not limited to the above-described embodiments, and can be appropriately changed by those skilled in the art without departing from the scope of the invention.
1,1A,1B サーバ負荷管理システム
2 処理装置
3 記憶装置
4 通信装置
5 入力装置
6 出力装置
10 性能指標蓄積部
20 傾向判定部
30 サーバ負荷算出部
40 サーバ選択部
50 リクエスト割当部
60 処理移行部
100 サーバ
110 監視部
PI 性能指標データ
RI リクエストインデックス
TBL 性能指標変化テーブル
GRP サーバグループ管理リスト
PROG1 サーバ負荷判定プログラム
PROG2 リクエスト割当プログラム
PROG3 処理移行プログラム1, 1A, 1B Server
Claims (18)
Translated fromJapanese前記複数のサーバの各々の性能指標の時系列変化を示す性能指標変化テーブルが格納される記憶装置と、
前記性能指標変化テーブルを参照してサーバ負荷を算出する処理装置と
を備え、
前記性能指標は、CPU使用率と、処理中のリクエスト数の指標を与えるリクエストインデックスとを含み、
前記処理装置は、
前記リクエストインデックスの時系列変化に基づいて、前記複数のサーバの各々に関して処理中のリクエスト数が増加傾向か減少傾向かの判定を行う傾向判定部と、
前記CPU使用率を前記判定の結果に基づいて修正し、修正後CPU使用率をサーバ負荷として算出する負荷算出部と
を有し、
前記判定結果が増加傾向の場合、前記負荷算出部は前記CPU使用率を上方修正し、
前記判定結果が減少傾向の場合、前記負荷算出部は前記CPU使用率を下方修正する
サーバ負荷管理システム。A server load management system for managing loads of a plurality of servers,
A storage device storing a performance index change table indicating a time-series change of the performance index of each of the plurality of servers;
A processing device that calculates a server load with reference to the performance index change table,
The performance index includes a CPU usage rate and a request index that gives an index of the number of requests being processed,
The processor is
A trend determination unit that determines whether the number of requests being processed is increasing or decreasing with respect to each of the plurality of servers based on a time-series change of the request index;
A load calculation unit that corrects the CPU usage rate based on the determination result and calculates the corrected CPU usage rate as a server load;
When the determination result is increasing, the load calculation unit corrects the CPU usage rate upward,
When the determination result is decreasing, the load calculation unit corrects the CPU usage rate downward.
前記負荷算出部は、所定の比率だけ前記CPU使用率を上方修正あるいは下方修正する
サーバ負荷管理システム。The server load management system according to claim 1,
The load calculation unit is a server load management system in which the CPU usage rate is corrected upward or downward by a predetermined ratio.
リクエストを受け取ってからレスポンスを返すまでのリクエスト処理に使われるCPU時間がs1であり、前記レスポンスを返した後の後処理に使われるCPU時間がs2であるとき、前記所定の比率はs1と(s1+s2)との間の比率である
サーバ負荷管理システム。The server load management system according to claim 2,
When the CPU time used for request processing from receiving a request to returning a response is s1, and the CPU time used for post-processing after returning the response is s2, the predetermined ratio is s1 ( Server load management system which is a ratio between s1 + s2).
前記傾向判定部は、前記リクエストインデックスの時系列変化に基づいて、前記複数のサーバの各々に関して処理中のリクエスト数の変化率を算出し、
前記変化率が所定の正の閾値以上である場合、前記傾向判定部は、処理中のリクエスト数が増加傾向にあると判定し、
前記変化率が所定の負の閾値以下である場合、前記傾向判定部は、処理中のリクエスト数が減少傾向にあると判定する
サーバ負荷管理システム。A server load management system according to any one of claims 1 to 3,
The trend determination unit calculates a change rate of the number of requests being processed for each of the plurality of servers based on a time series change of the request index,
If the rate of change is greater than or equal to a predetermined positive threshold, the trend determination unit determines that the number of requests being processed is increasing,
The server load management system in which the trend determination unit determines that the number of requests being processed tends to decrease when the change rate is equal to or less than a predetermined negative threshold.
前記リクエストインデックスは、処理中のリクエスト数、単位時間あたりのリクエスト到着数、リクエストが格納されるキューの長さ、リクエストを処理するためのプロセス数のうちいずれかである
サーバ負荷管理システム。The server load management system according to any one of claims 1 to 4,
The server load management system, wherein the request index is one of the number of requests being processed, the number of requests received per unit time, the length of a queue in which requests are stored, and the number of processes for processing requests.
前記負荷算出部は、前記複数のサーバからいくつかのサーバを抽出し、前記抽出されたサーバの各々に関して前記修正後CPU使用率を算出する
サーバ負荷管理システム。A server load management system according to any one of claims 1 to 5,
The load calculation unit extracts several servers from the plurality of servers, and calculates the corrected CPU usage rate for each of the extracted servers.
前記負荷算出部は、前記CPU使用率と前記判定結果に基づいて、前記いくつかのサーバを抽出し、
前記いくつかのサーバは、
前記判定結果が増加傾向であるサーバのうち、前記CPU使用率が最大であるサーバ及び最小であるサーバの少なくとも一方と、
前記判定結果が減少傾向であるサーバのうち、前記CPU使用率が最大であるサーバ及び最小であるサーバの少なくとも一方と
を含む
サーバ負荷管理システム。The server load management system according to claim 6,
The load calculation unit extracts the several servers based on the CPU usage rate and the determination result,
The several servers are
Among the servers whose determination results are increasing, at least one of the server having the maximum CPU usage rate and the server having the minimum CPU usage rate,
A server load management system including at least one of a server having the maximum CPU usage rate and a server having the minimum CPU usage rate among the servers whose determination results are decreasing.
前記処理装置は、前記抽出されたサーバから前記修正後CPU使用率が最大であるサーバ及び最小であるサーバの少なくとも1つを選択するサーバ選択部を更に有する
サーバ負荷管理システム。The server load management system according to claim 6 or 7,
The processing apparatus further includes a server selection unit that selects, from the extracted servers, at least one of a server having the maximum post-correction CPU usage rate and a server having the minimum CPU usage rate.
前記処理装置は、
サーバ選択部と、
リクエスト割当部と
を更に有し、
前記負荷算出部は、前記CPU使用率と前記判定結果に基づいて、前記いくつかのサーバを抽出し、
前記いくつかのサーバは、
前記判定結果が増加傾向であるサーバのうち前記CPU使用率が最小であるサーバと、
前記判定結果が減少傾向であるサーバのうち前記CPU使用率が最小であるサーバと
を含み、
前記サーバ選択部は、前記抽出されたサーバから前記修正後CPU使用率が最小であるサーバを選択し、
前記リクエスト割当部は、新規リクエストを前記選択されたサーバに送信する
サーバ負荷管理システム。The server load management system according to claim 6,
The processor is
A server selector;
A request allocation unit, and
The load calculation unit extracts the several servers based on the CPU usage rate and the determination result,
The several servers are
Among the servers whose determination results are increasing, the server having the lowest CPU usage rate,
Among the servers whose determination results are decreasing, the server with the lowest CPU usage rate, and
The server selection unit selects a server having the smallest corrected CPU usage rate from the extracted servers,
The request allocation unit is a server load management system that transmits a new request to the selected server.
前記処理装置は、
サーバ選択部と、
処理移行部と
を更に有し、
前記負荷算出部は、前記CPU使用率と前記判定結果に基づいて、前記いくつかのサーバを抽出し、
前記いくつかのサーバは、
前記判定結果が増加傾向であるサーバのうち、前記CPU使用率が最大であるサーバ及び最小であるサーバの両方と、
前記判定結果が減少傾向であるサーバのうち、前記CPU使用率が最大であるサーバ及び最小であるサーバの両方と
を含み、
前記サーバ選択部は、前記抽出されたサーバから前記修正後CPU使用率が最大である第1サーバと最小である第2サーバを選択し、
前記処理移行部は、前記第1サーバで実行中の処理のいくつかを前記第2サーバに移行する
サーバ負荷管理システム。The server load management system according to claim 6,
The processor is
A server selector;
And a processing transition unit,
The load calculation unit extracts the several servers based on the CPU usage rate and the determination result,
The several servers are
Among the servers whose determination results are increasing, both the server having the maximum CPU usage rate and the server having the minimum CPU usage rate,
Among the servers whose determination results are declining, both the server with the highest CPU usage rate and the server with the lowest CPU usage rate,
The server selection unit selects, from the extracted servers, the first server having the maximum corrected CPU usage rate and the second server having the minimum CPU usage rate,
The process migration unit is a server load management system that migrates some of the processes being executed on the first server to the second server.
(A)前記複数のサーバの各々の性能指標の時系列変化を示す性能指標変化テーブルを、記憶装置から読み出すステップと、
ここで、前記性能指標は、CPU使用率と、処理中のリクエスト数の指標を与えるリクエストインデックスとを含み、
(B)前記リクエストインデックスの時系列変化に基づいて、前記複数のサーバの各々に関して処理中のリクエスト数が増加傾向か減少傾向かの判定を行うステップと、
(C)前記CPU使用率を前記判定の結果に基づいて修正し、修正後CPU使用率をサーバ負荷として算出するステップと
を含み、
前記判定結果が増加傾向の場合、前記CPU使用率は上方修正され、
前記判定結果が減少傾向の場合、前記CPU使用率は下方修正される
サーバ負荷管理方法。A server load management method for managing loads of a plurality of servers,
(A) reading a performance index change table indicating a time series change of each performance index of the plurality of servers from a storage device;
Here, the performance index includes a CPU usage rate and a request index that gives an index of the number of requests being processed,
(B) determining whether the number of requests being processed is increasing or decreasing with respect to each of the plurality of servers based on a time series change of the request index;
(C) correcting the CPU usage rate based on the result of the determination, and calculating the corrected CPU usage rate as a server load,
When the determination result is increasing, the CPU usage rate is corrected upward;
The server load management method, wherein the CPU usage rate is corrected downward when the determination result is decreasing.
前記(C)ステップは、
(C1)前記複数のサーバからいくつかのサーバを抽出するステップと、
(C2)前記抽出されたサーバの各々に関して前記修正後CPU使用率を算出するステップと
を含む
サーバ負荷管理方法。The server load management method according to claim 11,
The step (C) includes:
(C1) extracting some servers from the plurality of servers;
(C2) calculating the post-correction CPU usage rate for each of the extracted servers.
更に、(D)前記抽出されたサーバから前記修正後CPU使用率が最大であるサーバ及び最小であるサーバの少なくとも1つを選択するステップを含む
サーバ負荷管理方法。The server load management method according to claim 12,
The server load management method further includes the step of: (D) selecting at least one of the server having the maximum corrected CPU usage rate and the server having the minimum CPU usage rate from the extracted servers.
前記(C1)ステップにおいて、前記判定結果が増加傾向であるサーバのうち前記CPU使用率が最小であるサーバと、前記判定結果が減少傾向であるサーバのうち前記CPU使用率が最小であるサーバとが抽出され、
前記(D)ステップにおいて、前記抽出されたサーバから前記修正後CPU使用率が最小であるサーバが選択され、
前記サーバ負荷管理方法は、更に、(E)リクエストを前記選択されたサーバに送信するステップを含む
サーバ負荷管理方法。The server load management method according to claim 13,
In the step (C1), the server having the lowest CPU usage rate among the servers whose determination result is increasing, and the server having the minimum CPU usage rate among the servers whose determination result is decreasing. Is extracted,
In the step (D), a server with the lowest corrected CPU usage rate is selected from the extracted servers.
The server load management method further includes the step of (E) transmitting a request to the selected server.
前記(C1)ステップにおいて、前記判定結果が増加傾向であるサーバのうち前記CPU使用率が最大であるサーバ及び最小であるサーバの両方と、前記判定結果が減少傾向であるサーバのうち前記CPU使用率が最大であるサーバ及び最小であるサーバの両方が抽出され、
前記(D)ステップにおいて、前記抽出されたサーバから前記修正後CPU使用率が最大である第1サーバと最小である第2サーバが選択され、
前記サーバ負荷管理方法は、更に、(F)前記第1サーバに割り当てられた処理のいくつかを前記第2サーバに移行するステップを含む
サーバ負荷管理方法。The server load management method according to claim 13,
In the step (C1), both the server having the highest CPU usage rate and the server having the smallest CPU usage rate among the servers whose determination result is increasing, and the CPU usage among the servers whose determination result is decreasing. Both the server with the highest rate and the server with the lowest rate are extracted,
In the step (D), a first server having the maximum corrected CPU usage rate and a second server having the minimum CPU usage rate are selected from the extracted servers.
The server load management method further includes the step of (F) transferring some of the processes assigned to the first server to the second server.
前記管理処理は、
(a)前記複数のサーバの各々の性能指標の時系列変化を示す性能指標変化テーブルを、記憶装置から読み出すステップと、
ここで、前記性能指標は、CPU使用率と、処理中のリクエスト数の指標を与えるリクエストインデックスとを含み、
(b)前記リクエストインデックスの時系列変化に基づいて、前記複数のサーバの各々に関して処理中のリクエスト数が増加傾向か減少傾向かの判定を行うステップと、
(c)前記CPU使用率を前記判定の結果に基づいて修正し、修正後CPU使用率をサーバ負荷として算出するステップと
を含み、
前記判定結果が増加傾向の場合、前記CPU使用率は上方修正され、
前記判定結果が減少傾向の場合、前記CPU使用率は下方修正される
サーバ負荷管理プログラム。A server load management program for causing a computer to execute load management processing of a plurality of servers,
The management process includes
(A) reading a performance index change table indicating a time series change of each performance index of the plurality of servers from a storage device;
Here, the performance index includes a CPU usage rate and a request index that gives an index of the number of requests being processed,
(B) determining whether the number of requests being processed is increasing or decreasing with respect to each of the plurality of servers based on a time-series change of the request index;
(C) correcting the CPU usage rate based on the result of the determination, and calculating the corrected CPU usage rate as a server load,
When the determination result is increasing, the CPU usage rate is corrected upward;
A server load management program in which the CPU usage rate is revised downward when the determination result is decreasing.
前記(c)ステップは、
(c1)前記複数のサーバからいくつかのサーバを抽出するステップと、
(c2)前記抽出されたサーバの各々に関して前記修正後CPU使用率を算出するステップと
を含む
サーバ負荷管理プログラム。The server load management program according to claim 16, wherein
The step (c) includes:
(C1) extracting some servers from the plurality of servers;
(C2) A server load management program comprising: calculating the corrected CPU usage rate for each of the extracted servers.
前記管理処理は、更に、(d)前記抽出されたサーバから前記修正後CPU使用率が最大であるサーバ及び最小であるサーバの少なくとも1つを選択するステップを含む
サーバ負荷管理プログラム。A server load management program according to claim 17,
The management process further includes a step (d) of selecting at least one of the server having the maximum corrected CPU usage rate and the server having the minimum CPU usage rate from the extracted servers.
Priority Applications (1)
| Application Number | Priority Date | Filing Date | Title |
|---|---|---|---|
| JP2008100846AJP2009252050A (en) | 2008-04-08 | 2008-04-08 | System, method and program for server load management |
Applications Claiming Priority (1)
| Application Number | Priority Date | Filing Date | Title |
|---|---|---|---|
| JP2008100846AJP2009252050A (en) | 2008-04-08 | 2008-04-08 | System, method and program for server load management |
Publications (1)
| Publication Number | Publication Date |
|---|---|
| JP2009252050Atrue JP2009252050A (en) | 2009-10-29 |
Family
ID=41312679
Family Applications (1)
| Application Number | Title | Priority Date | Filing Date |
|---|---|---|---|
| JP2008100846AWithdrawnJP2009252050A (en) | 2008-04-08 | 2008-04-08 | System, method and program for server load management |
Country Status (1)
| Country | Link |
|---|---|
| JP (1) | JP2009252050A (en) |
Cited By (4)
| Publication number | Priority date | Publication date | Assignee | Title |
|---|---|---|---|---|
| JP2011128969A (en)* | 2009-12-18 | 2011-06-30 | Fujitsu Ltd | Program, device, and method for administration management |
| JP2011232968A (en)* | 2010-04-28 | 2011-11-17 | Tokyo Metropolitan Univ | Information processor operation management device, cloud computing system, operation management program, storage medium and information processor operation management method |
| US8968476B2 (en) | 2008-12-29 | 2015-03-03 | K.C. Tech Co., Ltd. | Atomic layer deposition apparatus |
| US20200110735A1 (en)* | 2018-10-04 | 2020-04-09 | Fujitsu Limited | Analysis of time-series data indicating temporal variation in usage states of resources used by multiple processes |
- 2008
- 2008-04-08JPJP2008100846Apatent/JP2009252050A/ennot_activeWithdrawn
Cited By (5)
| Publication number | Priority date | Publication date | Assignee | Title |
|---|---|---|---|---|
| US8968476B2 (en) | 2008-12-29 | 2015-03-03 | K.C. Tech Co., Ltd. | Atomic layer deposition apparatus |
| JP2011128969A (en)* | 2009-12-18 | 2011-06-30 | Fujitsu Ltd | Program, device, and method for administration management |
| JP2011232968A (en)* | 2010-04-28 | 2011-11-17 | Tokyo Metropolitan Univ | Information processor operation management device, cloud computing system, operation management program, storage medium and information processor operation management method |
| US20200110735A1 (en)* | 2018-10-04 | 2020-04-09 | Fujitsu Limited | Analysis of time-series data indicating temporal variation in usage states of resources used by multiple processes |
| US11550770B2 (en)* | 2018-10-04 | 2023-01-10 | Fujitsu Limited | Analysis of time-series data indicating temporal variation in usage states of resources used by multiple processes |
Similar Documents
| Publication | Publication Date | Title |
|---|---|---|
| JP6248560B2 (en) | Management program, management method, and management apparatus | |
| JP5218390B2 (en) | Autonomous control server, virtual server control method and program | |
| CN112835698B (en) | Dynamic load balancing method for request classification processing based on heterogeneous clusters | |
| US10055252B2 (en) | Apparatus, system and method for estimating data transfer periods for job scheduling in parallel computing | |
| US10831387B1 (en) | Snapshot reservations in a distributed storage system | |
| JP4629587B2 (en) | Reservation management program | |
| JP4982578B2 (en) | Resource allocation device, resource allocation method, and resource allocation control program | |
| JP5679256B2 (en) | Distributed task system and distributed task management method | |
| CN110149395A (en) | One kind is based on dynamic load balancing method in the case of mass small documents high concurrent | |
| US7600229B1 (en) | Methods and apparatus for load balancing processing of management information | |
| JP5609730B2 (en) | Information processing program and method, and transfer processing apparatus | |
| US20110145197A1 (en) | Storage system and method for operating storage system | |
| US8914582B1 (en) | Systems and methods for pinning content in cache | |
| JP2015007942A (en) | Program, virtual machine management method, and information processing apparatus | |
| US11204812B2 (en) | Information processing apparatus and distributed processing system | |
| CN110636388A (en) | A service request distribution method, system, electronic device and storage medium | |
| JP5324914B2 (en) | Method and apparatus for allocating storage resources | |
| US20140372353A1 (en) | Information processing system and data update control method | |
| JP2009252050A (en) | System, method and program for server load management | |
| CN105574008A (en) | Task scheduling method and equipment applied to distributed file system | |
| JP2008077281A (en) | Superscheduler, job request method and superscheduler program | |
| JP2007328413A (en) | Load balancing method | |
| JP6679201B1 (en) | Information processing apparatus, information processing system, program, and information processing method | |
| JP2017174038A (en) | Information processing system, information processing method, and program | |
| US20130290669A1 (en) | Physical memory usage prediction |
Legal Events
| Date | Code | Title | Description |
|---|---|---|---|
| A300 | Withdrawal of application because of no request for examination | Free format text:JAPANESE INTERMEDIATE CODE: A300 Effective date:20110705 |