JP2008528064A - Method and apparatus for measuring cancer changes from reflectance spectrum measurements obtained during endoscopic imaging - Google Patents
Method and apparatus for measuring cancer changes from reflectance spectrum measurements obtained during endoscopic imagingDownload PDFInfo
- Publication number
- JP2008528064A JP2008528064AJP2007551525AJP2007551525AJP2008528064AJP 2008528064 AJP2008528064 AJP 2008528064AJP 2007551525 AJP2007551525 AJP 2007551525AJP 2007551525 AJP2007551525 AJP 2007551525AJP 2008528064 AJP2008528064 AJP 2008528064A
- Authority
- JP
- Japan
- Prior art keywords
- tissue
- reflectance spectrum
- scattering
- diffuse reflectance
- light
- Prior art date
- Legal status (The legal status is an assumption and is not a legal conclusion. Google has not performed a legal analysis and makes no representation as to the accuracy of the status listed.)
- Pending
Links
- 238000000985reflectance spectrumMethods0.000titleclaimsabstractdescription75
- 238000000034methodMethods0.000titleclaimsabstractdescription57
- 206010028980NeoplasmDiseases0.000titleclaimsabstractdescription35
- 201000011510cancerDiseases0.000titleclaimsabstractdescription31
- 238000003384imaging methodMethods0.000titleclaimsabstractdescription22
- 238000005259measurementMethods0.000titleclaimsdescription52
- 238000010521absorption reactionMethods0.000claimsabstractdescription38
- 239000008280bloodSubstances0.000claimsabstractdescription31
- 210000004369bloodAnatomy0.000claimsabstractdescription31
- 238000001514detection methodMethods0.000claimsabstractdescription26
- QVGXLLKOCUKJST-UHFFFAOYSA-Natomic oxygenChemical compound[O]QVGXLLKOCUKJST-UHFFFAOYSA-N0.000claimsabstractdescription14
- 229910052760oxygenInorganic materials0.000claimsabstractdescription14
- 239000001301oxygenSubstances0.000claimsabstractdescription14
- 230000035479physiological effects, processes and functionsEffects0.000claimsabstractdescription3
- 239000000523sampleSubstances0.000claimsdescription63
- 230000003287optical effectEffects0.000claimsdescription46
- 230000003211malignant effectEffects0.000claimsdescription40
- 230000005855radiationEffects0.000claimsdescription39
- 238000004422calculation algorithmMethods0.000claimsdescription18
- 230000000877morphologic effectEffects0.000claimsdescription18
- 238000012545processingMethods0.000claimsdescription14
- 210000003097mucusAnatomy0.000claimsdescription13
- 238000001069Raman spectroscopyMethods0.000claimsdescription11
- 238000000799fluorescence microscopyMethods0.000claimsdescription10
- 238000012986modificationMethods0.000claimsdescription10
- 230000004048modificationEffects0.000claimsdescription10
- 238000004611spectroscopical analysisMethods0.000claimsdescription10
- 230000005284excitationEffects0.000claimsdescription9
- 238000007619statistical methodMethods0.000claimsdescription9
- 238000000338in vitroMethods0.000claimsdescription8
- 230000031700light absorptionEffects0.000claimsdescription8
- 238000012014optical coherence tomographyMethods0.000claimsdescription8
- 238000002560therapeutic procedureMethods0.000claimsdescription8
- 238000001506fluorescence spectroscopyMethods0.000claimsdescription6
- 238000004624confocal microscopyMethods0.000claimsdescription5
- 238000013334tissue modelMethods0.000claimsdescription5
- 239000000284extractSubstances0.000claimsdescription2
- 229910052736halogenInorganic materials0.000claimsdescription2
- 150000002367halogensChemical class0.000claimsdescription2
- QSHDDOUJBYECFT-UHFFFAOYSA-NmercuryChemical compound[Hg]QSHDDOUJBYECFT-UHFFFAOYSA-N0.000claimsdescription2
- 229910052753mercuryInorganic materials0.000claimsdescription2
- 229910001507metal halideInorganic materials0.000claimsdescription2
- 150000005309metal halidesChemical class0.000claimsdescription2
- 230000003647oxidationEffects0.000claimsdescription2
- 238000007254oxidation reactionMethods0.000claimsdescription2
- 229910052724xenonInorganic materials0.000claimsdescription2
- FHNFHKCVQCLJFQ-UHFFFAOYSA-Nxenon atomChemical compound[Xe]FHNFHKCVQCLJFQ-UHFFFAOYSA-N0.000claimsdescription2
- 238000002073fluorescence micrographMethods0.000claims4
- 230000007170pathologyEffects0.000claims3
- 230000008878couplingEffects0.000claims1
- 238000010168coupling processMethods0.000claims1
- 238000005859coupling reactionMethods0.000claims1
- 201000010099diseaseDiseases0.000abstractdescription15
- 208000037265diseases, disorders, signs and symptomsDiseases0.000abstractdescription15
- 238000001727in vivoMethods0.000abstractdescription12
- 238000002310reflectometryMethods0.000abstractdescription7
- 230000000694effectsEffects0.000abstractdescription4
- 239000011859microparticleSubstances0.000abstractdescription2
- 210000001519tissueAnatomy0.000description183
- 230000003902lesionEffects0.000description39
- 239000000835fiberSubstances0.000description25
- 238000001228spectrumMethods0.000description21
- 238000009792diffusion processMethods0.000description18
- 238000004458analytical methodMethods0.000description16
- 239000002245particleSubstances0.000description16
- 210000004072lungAnatomy0.000description15
- 210000004027cellAnatomy0.000description14
- 230000003595spectral effectEffects0.000description14
- 238000001574biopsyMethods0.000description9
- 238000005286illuminationMethods0.000description9
- 239000013307optical fiberSubstances0.000description9
- 238000001055reflectance spectroscopyMethods0.000description8
- 230000035945sensitivityEffects0.000description8
- 238000003745diagnosisMethods0.000description7
- 230000004660morphological changeEffects0.000description7
- 238000013459approachMethods0.000description6
- 238000000149argon plasma sinteringMethods0.000description6
- 238000010586diagramMethods0.000description6
- 206010058467Lung neoplasm malignantDiseases0.000description5
- 201000005202lung cancerDiseases0.000description5
- 208000020816lung neoplasmDiseases0.000description5
- 238000010606normalizationMethods0.000description5
- 210000004940nucleusAnatomy0.000description5
- 230000008569processEffects0.000description5
- 230000004044responseEffects0.000description5
- 239000000126substanceSubstances0.000description5
- 210000003855cell nucleusAnatomy0.000description4
- 230000001413cellular effectEffects0.000description4
- 230000008859changeEffects0.000description4
- 238000002059diagnostic imagingMethods0.000description4
- 238000001839endoscopyMethods0.000description4
- 239000011159matrix materialSubstances0.000description4
- 239000000203mixtureSubstances0.000description4
- 238000004088simulationMethods0.000description4
- INGWEZCOABYORO-UHFFFAOYSA-N2-(furan-2-yl)-7-methyl-1h-1,8-naphthyridin-4-oneChemical compoundN=1C2=NC(C)=CC=C2C(O)=CC=1C1=CC=CO1INGWEZCOABYORO-UHFFFAOYSA-N0.000description3
- 206010058314DysplasiaDiseases0.000description3
- 108010064719OxyhemoglobinsProteins0.000description3
- 238000012937correctionMethods0.000description3
- 108010002255deoxyhemoglobinProteins0.000description3
- 238000005315distribution functionMethods0.000description3
- 238000012623in vivo measurementMethods0.000description3
- 238000011835investigationMethods0.000description3
- 108090000623proteins and genesProteins0.000description3
- 102000004169proteins and genesHuman genes0.000description3
- 238000011160researchMethods0.000description3
- 102000008186CollagenHuman genes0.000description2
- 108010035532CollagenProteins0.000description2
- 108010054147HemoglobinsProteins0.000description2
- 102000001554HemoglobinsHuman genes0.000description2
- 206010027146MelanodermaDiseases0.000description2
- 238000013276bronchoscopyMethods0.000description2
- 238000004364calculation methodMethods0.000description2
- 229920001436collagenPolymers0.000description2
- 238000002790cross-validationMethods0.000description2
- 238000011161developmentMethods0.000description2
- 238000012774diagnostic algorithmMethods0.000description2
- 238000002405diagnostic procedureMethods0.000description2
- 210000005081epithelial layerAnatomy0.000description2
- 238000002189fluorescence spectrumMethods0.000description2
- 210000004877mucosaAnatomy0.000description2
- 210000003463organelleAnatomy0.000description2
- 230000001575pathological effectEffects0.000description2
- 238000011002quantificationMethods0.000description2
- 210000004876tela submucosaAnatomy0.000description2
- 238000012360testing methodMethods0.000description2
- 238000011282treatmentMethods0.000description2
- 108010077544ChromatinProteins0.000description1
- 102000016942ElastinHuman genes0.000description1
- 108010014258ElastinProteins0.000description1
- 238000012327Endoscopic diagnosisMethods0.000description1
- 102000004190EnzymesHuman genes0.000description1
- 108090000790EnzymesProteins0.000description1
- 108010043121Green Fluorescent ProteinsProteins0.000description1
- 206010021143HypoxiaDiseases0.000description1
- QIVBCDIJIAJPQS-VIFPVBQESA-NL-tryptophaneChemical compoundC1=CC=C2C(C[C@H](N)C(O)=O)=CNC2=C1QIVBCDIJIAJPQS-VIFPVBQESA-N0.000description1
- OUYCCCASQSFEME-QMMMGPOBSA-NL-tyrosineChemical compoundOC(=O)[C@@H](N)CC1=CC=C(O)C=C1OUYCCCASQSFEME-QMMMGPOBSA-N0.000description1
- 206010051589Large intestine polypDiseases0.000description1
- 238000000342Monte Carlo simulationMethods0.000description1
- BAWFJGJZGIEFAR-NNYOXOHSSA-NNAD zwitterionChemical compoundNC(=O)C1=CC=C[N+]([C@H]2[C@@H]([C@H](O)[C@@H](COP([O-])(=O)OP(O)(=O)OC[C@@H]3[C@H]([C@@H](O)[C@@H](O3)N3C4=NC=NC(N)=C4N=C3)O)O2)O)=C1BAWFJGJZGIEFAR-NNYOXOHSSA-N0.000description1
- 238000001237Raman spectrumMethods0.000description1
- AUNGANRZJHBGPY-SCRDCRAPSA-NRiboflavinChemical compoundOC[C@@H](O)[C@@H](O)[C@@H](O)CN1C=2C=C(C)C(C)=CC=2N=C2C1=NC(=O)NC2=OAUNGANRZJHBGPY-SCRDCRAPSA-N0.000description1
- QIVBCDIJIAJPQS-UHFFFAOYSA-NTryptophanNatural productsC1=CC=C2C(CC(N)C(O)=O)=CNC2=C1QIVBCDIJIAJPQS-UHFFFAOYSA-N0.000description1
- 230000002159abnormal effectEffects0.000description1
- 239000000654additiveSubstances0.000description1
- 230000000996additive effectEffects0.000description1
- 208000009956adenocarcinomaDiseases0.000description1
- 230000003416augmentationEffects0.000description1
- 230000005540biological transmissionEffects0.000description1
- 231100000504carcinogenesisToxicity0.000description1
- 210000000845cartilageAnatomy0.000description1
- 210000003850cellular structureAnatomy0.000description1
- 210000003483chromatinAnatomy0.000description1
- 238000004140cleaningMethods0.000description1
- 238000002591computed tomographyMethods0.000description1
- 238000011109contaminationMethods0.000description1
- 210000000805cytoplasmAnatomy0.000description1
- 230000034994deathEffects0.000description1
- 231100000517deathToxicity0.000description1
- 230000003247decreasing effectEffects0.000description1
- 230000001419dependent effectEffects0.000description1
- 238000010494dissociation reactionMethods0.000description1
- 230000005593dissociationsEffects0.000description1
- 238000005553drillingMethods0.000description1
- 238000002651drug therapyMethods0.000description1
- 229920002549elastinPolymers0.000description1
- 238000005516engineering processMethods0.000description1
- 230000004907fluxEffects0.000description1
- 239000012634fragmentSubstances0.000description1
- 238000001415gene therapyMethods0.000description1
- 230000004313glareEffects0.000description1
- 208000018875hypoxemiaDiseases0.000description1
- 239000007943implantSubstances0.000description1
- 238000011065in-situ storageMethods0.000description1
- 238000002347injectionMethods0.000description1
- 239000007924injectionSubstances0.000description1
- 238000003780insertionMethods0.000description1
- 230000037431insertionEffects0.000description1
- 238000005305interferometryMethods0.000description1
- 210000002977intracellular fluidAnatomy0.000description1
- 238000002647laser therapyMethods0.000description1
- 239000007788liquidSubstances0.000description1
- 239000004973liquid crystal related substanceSubstances0.000description1
- 238000004020luminiscence typeMethods0.000description1
- -1markingSubstances0.000description1
- 239000000463materialSubstances0.000description1
- 230000004060metabolic processEffects0.000description1
- 230000037323metabolic rateEffects0.000description1
- 230000004089microcirculationEffects0.000description1
- 238000000386microscopyMethods0.000description1
- 210000003470mitochondriaAnatomy0.000description1
- 230000002438mitochondrial effectEffects0.000description1
- 230000009854mucosal lesionEffects0.000description1
- 229940101270nicotinamide adenine dinucleotide (nad)Drugs0.000description1
- 208000002154non-small cell lung carcinomaDiseases0.000description1
- 210000000056organAnatomy0.000description1
- 238000006213oxygenation reactionMethods0.000description1
- 230000005449particle theoryEffects0.000description1
- 231100000915pathological changeToxicity0.000description1
- 230000036285pathological changeEffects0.000description1
- 208000022131polyp of large intestineDiseases0.000description1
- 150000004032porphyrinsChemical class0.000description1
- 239000002243precursorSubstances0.000description1
- 238000004393prognosisMethods0.000description1
- 230000001902propagating effectEffects0.000description1
- 230000011514reflexEffects0.000description1
- 208000000649small cell carcinomaDiseases0.000description1
- 239000000243solutionSubstances0.000description1
- 238000012306spectroscopic techniqueMethods0.000description1
- 230000002269spontaneous effectEffects0.000description1
- 206010041823squamous cell carcinomaDiseases0.000description1
- 238000001356surgical procedureMethods0.000description1
- 239000000725suspensionSubstances0.000description1
- 230000001225therapeutic effectEffects0.000description1
- 238000012876topographyMethods0.000description1
- 210000003437tracheaAnatomy0.000description1
- 208000029729tumor suppressor gene on chromosome 11Diseases0.000description1
- OUYCCCASQSFEME-UHFFFAOYSA-NtyrosineNatural productsOC(=O)C(N)CC1=CC=C(O)C=C1OUYCCCASQSFEME-UHFFFAOYSA-N0.000description1
- 238000012795verificationMethods0.000description1
- 210000001835visceraAnatomy0.000description1
- 230000009278visceral effectEffects0.000description1
- XLYOFNOQVPJJNP-UHFFFAOYSA-NwaterSubstancesOXLYOFNOQVPJJNP-UHFFFAOYSA-N0.000description1
Images


Classifications
- G—PHYSICS
- G01—MEASURING; TESTING
- G01N—INVESTIGATING OR ANALYSING MATERIALS BY DETERMINING THEIR CHEMICAL OR PHYSICAL PROPERTIES
- G01N21/00—Investigating or analysing materials by the use of optical means, i.e. using sub-millimetre waves, infrared, visible or ultraviolet light
- G01N21/17—Systems in which incident light is modified in accordance with the properties of the material investigated
- G01N21/47—Scattering, i.e. diffuse reflection
- G01N21/4738—Diffuse reflection, e.g. also for testing fluids, fibrous materials
- G01N21/474—Details of optical heads therefor, e.g. using optical fibres
- A—HUMAN NECESSITIES
- A61—MEDICAL OR VETERINARY SCIENCE; HYGIENE
- A61B—DIAGNOSIS; SURGERY; IDENTIFICATION
- A61B5/00—Measuring for diagnostic purposes; Identification of persons
- A61B5/0059—Measuring for diagnostic purposes; Identification of persons using light, e.g. diagnosis by transillumination, diascopy, fluorescence
- A61B5/0075—Measuring for diagnostic purposes; Identification of persons using light, e.g. diagnosis by transillumination, diascopy, fluorescence by spectroscopy, i.e. measuring spectra, e.g. Raman spectroscopy, infrared absorption spectroscopy
- A—HUMAN NECESSITIES
- A61—MEDICAL OR VETERINARY SCIENCE; HYGIENE
- A61B—DIAGNOSIS; SURGERY; IDENTIFICATION
- A61B5/00—Measuring for diagnostic purposes; Identification of persons
- A61B5/0059—Measuring for diagnostic purposes; Identification of persons using light, e.g. diagnosis by transillumination, diascopy, fluorescence
- A61B5/0082—Measuring for diagnostic purposes; Identification of persons using light, e.g. diagnosis by transillumination, diascopy, fluorescence adapted for particular medical purposes
- A61B5/0084—Measuring for diagnostic purposes; Identification of persons using light, e.g. diagnosis by transillumination, diascopy, fluorescence adapted for particular medical purposes for introduction into the body, e.g. by catheters
- A—HUMAN NECESSITIES
- A61—MEDICAL OR VETERINARY SCIENCE; HYGIENE
- A61B—DIAGNOSIS; SURGERY; IDENTIFICATION
- A61B5/00—Measuring for diagnostic purposes; Identification of persons
- A61B5/145—Measuring characteristics of blood in vivo, e.g. gas concentration or pH-value ; Measuring characteristics of body fluids or tissues, e.g. interstitial fluid or cerebral tissue
- A61B5/14542—Measuring characteristics of blood in vivo, e.g. gas concentration or pH-value ; Measuring characteristics of body fluids or tissues, e.g. interstitial fluid or cerebral tissue for measuring blood gases
- A—HUMAN NECESSITIES
- A61—MEDICAL OR VETERINARY SCIENCE; HYGIENE
- A61B—DIAGNOSIS; SURGERY; IDENTIFICATION
- A61B5/00—Measuring for diagnostic purposes; Identification of persons
- A61B5/145—Measuring characteristics of blood in vivo, e.g. gas concentration or pH-value ; Measuring characteristics of body fluids or tissues, e.g. interstitial fluid or cerebral tissue
- A61B5/1455—Measuring characteristics of blood in vivo, e.g. gas concentration or pH-value ; Measuring characteristics of body fluids or tissues, e.g. interstitial fluid or cerebral tissue using optical sensors, e.g. spectral photometrical oximeters
- A61B5/1459—Measuring characteristics of blood in vivo, e.g. gas concentration or pH-value ; Measuring characteristics of body fluids or tissues, e.g. interstitial fluid or cerebral tissue using optical sensors, e.g. spectral photometrical oximeters invasive, e.g. introduced into the body by a catheter
- G—PHYSICS
- G01—MEASURING; TESTING
- G01J—MEASUREMENT OF INTENSITY, VELOCITY, SPECTRAL CONTENT, POLARISATION, PHASE OR PULSE CHARACTERISTICS OF INFRARED, VISIBLE OR ULTRAVIOLET LIGHT; COLORIMETRY; RADIATION PYROMETRY
- G01J3/00—Spectrometry; Spectrophotometry; Monochromators; Measuring colours
- G01J3/02—Details
- G01J3/0205—Optical elements not provided otherwise, e.g. optical manifolds, diffusers, windows
- G01J3/0243—Optical elements not provided otherwise, e.g. optical manifolds, diffusers, windows having a through-hole enabling the optical element to fulfil an additional optical function, e.g. a mirror or grating having a throughhole for a light collecting or light injecting optical fiber
- G—PHYSICS
- G01—MEASURING; TESTING
- G01J—MEASUREMENT OF INTENSITY, VELOCITY, SPECTRAL CONTENT, POLARISATION, PHASE OR PULSE CHARACTERISTICS OF INFRARED, VISIBLE OR ULTRAVIOLET LIGHT; COLORIMETRY; RADIATION PYROMETRY
- G01J3/00—Spectrometry; Spectrophotometry; Monochromators; Measuring colours
- G01J3/02—Details
- G01J3/0291—Housings; Spectrometer accessories; Spatial arrangement of elements, e.g. folded path arrangements
- G—PHYSICS
- G01—MEASURING; TESTING
- G01N—INVESTIGATING OR ANALYSING MATERIALS BY DETERMINING THEIR CHEMICAL OR PHYSICAL PROPERTIES
- G01N21/00—Investigating or analysing materials by the use of optical means, i.e. using sub-millimetre waves, infrared, visible or ultraviolet light
- G01N21/17—Systems in which incident light is modified in accordance with the properties of the material investigated
- G01N21/47—Scattering, i.e. diffuse reflection
- G01N21/4795—Scattering, i.e. diffuse reflection spatially resolved investigating of object in scattering medium
- A—HUMAN NECESSITIES
- A61—MEDICAL OR VETERINARY SCIENCE; HYGIENE
- A61B—DIAGNOSIS; SURGERY; IDENTIFICATION
- A61B1/00—Instruments for performing medical examinations of the interior of cavities or tubes of the body by visual or photographical inspection, e.g. endoscopes; Illuminating arrangements therefor
- A61B1/04—Instruments for performing medical examinations of the interior of cavities or tubes of the body by visual or photographical inspection, e.g. endoscopes; Illuminating arrangements therefor combined with photographic or television appliances
- A61B1/043—Instruments for performing medical examinations of the interior of cavities or tubes of the body by visual or photographical inspection, e.g. endoscopes; Illuminating arrangements therefor combined with photographic or television appliances for fluorescence imaging
- A—HUMAN NECESSITIES
- A61—MEDICAL OR VETERINARY SCIENCE; HYGIENE
- A61B—DIAGNOSIS; SURGERY; IDENTIFICATION
- A61B1/00—Instruments for performing medical examinations of the interior of cavities or tubes of the body by visual or photographical inspection, e.g. endoscopes; Illuminating arrangements therefor
- A61B1/267—Instruments for performing medical examinations of the interior of cavities or tubes of the body by visual or photographical inspection, e.g. endoscopes; Illuminating arrangements therefor for the respiratory tract, e.g. laryngoscopes, bronchoscopes
- A61B1/2676—Bronchoscopes
- A—HUMAN NECESSITIES
- A61—MEDICAL OR VETERINARY SCIENCE; HYGIENE
- A61B—DIAGNOSIS; SURGERY; IDENTIFICATION
- A61B5/00—Measuring for diagnostic purposes; Identification of persons
- A61B5/0059—Measuring for diagnostic purposes; Identification of persons using light, e.g. diagnosis by transillumination, diascopy, fluorescence
- A61B5/0062—Arrangements for scanning
- A61B5/0066—Optical coherence imaging
- A—HUMAN NECESSITIES
- A61—MEDICAL OR VETERINARY SCIENCE; HYGIENE
- A61B—DIAGNOSIS; SURGERY; IDENTIFICATION
- A61B5/00—Measuring for diagnostic purposes; Identification of persons
- A61B5/0059—Measuring for diagnostic purposes; Identification of persons using light, e.g. diagnosis by transillumination, diascopy, fluorescence
- A61B5/0071—Measuring for diagnostic purposes; Identification of persons using light, e.g. diagnosis by transillumination, diascopy, fluorescence by measuring fluorescence emission
- A—HUMAN NECESSITIES
- A61—MEDICAL OR VETERINARY SCIENCE; HYGIENE
- A61B—DIAGNOSIS; SURGERY; IDENTIFICATION
- A61B5/00—Measuring for diagnostic purposes; Identification of persons
- A61B5/02—Detecting, measuring or recording for evaluating the cardiovascular system, e.g. pulse, heart rate, blood pressure or blood flow
- A61B5/026—Measuring blood flow
- A61B5/0261—Measuring blood flow using optical means, e.g. infrared light
- G—PHYSICS
- G01—MEASURING; TESTING
- G01N—INVESTIGATING OR ANALYSING MATERIALS BY DETERMINING THEIR CHEMICAL OR PHYSICAL PROPERTIES
- G01N21/00—Investigating or analysing materials by the use of optical means, i.e. using sub-millimetre waves, infrared, visible or ultraviolet light
- G01N21/17—Systems in which incident light is modified in accordance with the properties of the material investigated
- G01N21/47—Scattering, i.e. diffuse reflection
- G01N21/4738—Diffuse reflection, e.g. also for testing fluids, fibrous materials
- G01N21/474—Details of optical heads therefor, e.g. using optical fibres
- G01N2021/4742—Details of optical heads therefor, e.g. using optical fibres comprising optical fibres
- G—PHYSICS
- G01—MEASURING; TESTING
- G01N—INVESTIGATING OR ANALYSING MATERIALS BY DETERMINING THEIR CHEMICAL OR PHYSICAL PROPERTIES
- G01N21/00—Investigating or analysing materials by the use of optical means, i.e. using sub-millimetre waves, infrared, visible or ultraviolet light
- G01N21/17—Systems in which incident light is modified in accordance with the properties of the material investigated
- G01N21/25—Colour; Spectral properties, i.e. comparison of effect of material on the light at two or more different wavelengths or wavelength bands
- G01N21/31—Investigating relative effect of material at wavelengths characteristic of specific elements or molecules, e.g. atomic absorption spectrometry
- G01N21/35—Investigating relative effect of material at wavelengths characteristic of specific elements or molecules, e.g. atomic absorption spectrometry using infrared light
- G01N21/359—Investigating relative effect of material at wavelengths characteristic of specific elements or molecules, e.g. atomic absorption spectrometry using infrared light using near infrared light
Landscapes
- Physics & Mathematics (AREA)
- Health & Medical Sciences (AREA)
- Life Sciences & Earth Sciences (AREA)
- Spectroscopy & Molecular Physics (AREA)
- Pathology (AREA)
- General Health & Medical Sciences (AREA)
- General Physics & Mathematics (AREA)
- Animal Behavior & Ethology (AREA)
- Biophysics (AREA)
- Medical Informatics (AREA)
- Molecular Biology (AREA)
- Surgery (AREA)
- Biomedical Technology (AREA)
- Engineering & Computer Science (AREA)
- Public Health (AREA)
- Veterinary Medicine (AREA)
- Heart & Thoracic Surgery (AREA)
- Optics & Photonics (AREA)
- Chemical & Material Sciences (AREA)
- Biochemistry (AREA)
- Immunology (AREA)
- Analytical Chemistry (AREA)
- Investigating Or Analysing Materials By Optical Means (AREA)
- Investigating, Analyzing Materials By Fluorescence Or Luminescence (AREA)
Abstract
Translated fromJapaneseDescription
Translated fromJapanese本発明は光分光法の分野に関し、特に、散乱反射率分光法を使用して組織の生理的及び形態的情報を得る方法に関する。発明の目的は癌検出のための非侵襲的光学的方法を開発することである。The present invention relates to the field of optical spectroscopy, and more particularly to a method for obtaining physiological and morphological information of tissue using scattering reflectance spectroscopy. The object of the invention is to develop a non-invasive optical method for cancer detection.
北アメリカでは肺癌はの癌による死亡の主原因であり、そして、それは男性と女性の両方に2番目に共通の癌発生率を生じている。癌は、早く発見され、病変がより小さく又は組織が前癌状態であれば、より効果的に治療可能であることを医療研究は示している。残念ながら、肺の中央気道の癌病変を検出するのに通常使用される白色光反射率(WLR)画像法に基づく従来の肺の内視鏡検査(気管支鏡検査法)は肺癌のおよそ25パーセントしか検出できない。癌が進行して致命的であるとき、これらの病変の大部分は後期段階である。この検出率は、WLR画像法を伴う検出又は画像診断療法の必要性を創成し、癌検出のためのより良い診断能力を実現した。In North America, lung cancer is the leading cause of cancer deaths, and it is the second most common cancer incidence rate in both men and women. Medical research has shown that cancer can be treated more effectively if it is found early and the lesions are smaller or the tissue is precancerous. Unfortunately, conventional lung endoscopy (bronchoscopy) based on white light reflectance (WLR) imaging, which is commonly used to detect cancer lesions in the central airways of the lung, is approximately 25 percent of lung cancer Can only be detected. When cancer progresses and is fatal, most of these lesions are in late stages. This detection rate created a need for detection or diagnostic imaging therapy with WLR imaging and realized better diagnostic capabilities for cancer detection.
多くの研究グループが癌病変の検出感度を改良するために組織自発螢光の使用を調査した。組織におけるある種のモルホロジー変化がまさに疾病に関連するように、疾病検出、特に疾病の早期検出のために化学変化を利用できる。組織が紫外線(UV)か可視光の特定の波長で照らされ(又は、励起され)るとき、生物学的分子(蛍光発色団)はエネルギーを吸収し、より長い波長(緑色又は赤色波長領域)でそれを螢光として放つ。光のこれらの波長は、疾病又は疾病の過程に関連する組織内のある化学物質を刺激するそれらの波長の能力に基づいて選択される。これらの放射(蛍光)からの画像又はかスペクトルを得て観測及び/又は分析することができる。疾患組織は健全な組織とかなり異なる蛍光信号を持つため、蛍光放射スペクトルを診断手段として使用することができる。 Many research groups have investigated the use of tissue spontaneous fluorescence to improve the sensitivity of cancer lesion detection. Chemical changes can be used for disease detection, particularly early detection of disease, as certain morphological changes in tissues are just related to disease. When tissue is illuminated (or excited) with a specific wavelength of ultraviolet (UV) or visible light, biological molecules (fluorescent chromophores) absorb energy and have longer wavelengths (green or red wavelength region) And release it as a glare. These wavelengths of light are selected based on their ability to stimulate certain chemicals in the tissue associated with the disease or disease process. Images or spectra from these emissions (fluorescence) can be obtained and observed and / or analyzed. Since diseased tissue has a significantly different fluorescence signal than healthy tissue, the fluorescence emission spectrum can be used as a diagnostic tool.
ツエン(Zeng)へ付与された米国公開特許公報No.2004/245350、発明の名称「多重励起発光組を使用する蛍光画像化及び同時マルチチャンネル画像検出のための方法と装置」では、発明者は、赤/近赤外線波長領域での第2の独立蛍光信号の使用を報告する。赤/近赤外線光によって照らされた癌又は前癌病変の組織などの疾患組織は、上で議論した組織特性と異なり、正常組織よりも疾患組織の場合のほうがより高い強度を与える蛍光を放つ。画像正規化と、画像の診断ユーティリティを改良するためにこれらの特性を利用できる。 U.S. Published Patent Publication No. 1 to Zeng. In 2004/245350, the title “Method and Apparatus for Fluorescence Imaging and Simultaneous Multichannel Image Detection Using Multiple Excitation Luminescence Sets”, the inventor states that the second independent fluorescence in the red / near infrared wavelength region. Report signal usage. Unlike tissue characteristics discussed above, diseased tissues such as cancers illuminated by red / near infrared light emit fluorescence that gives higher intensity in the case of diseased tissues than in normal tissues. These properties can be used to improve image normalization and diagnostic imaging utilities.
蛍光画像法は癌などの疾病に対して高い感度を示すが、いくつかのトレードオフもある。商用の蛍光画像法システムは肺癌検出では67パーセントの感度を達成している。しかしながら、そのように検出感度を高めたことは検出無病正診率の低下という犠牲を払うものであり、無病正診率は、WLR画像だけの場合の90パーセントに比べて、66パーセントにまで低下した。その結果は、無病誤診の多大な増加によって引き起こされた生体組織検査の増加に関連する医療費の増加であった。 Fluorescence imaging is highly sensitive to diseases such as cancer, but there are some tradeoffs. Commercial fluorescence imaging systems achieve 67 percent sensitivity for lung cancer detection. However, such an increase in detection sensitivity comes at the cost of a reduced detection-free diagnosis rate, which is reduced to 66 percent compared to 90 percent for WLR images alone. did. The result was an increase in medical costs associated with increased biopsy, caused by a significant increase in disease-free misdiagnosis.
癌組織のより正確な診断を提供するより便利なアプローチは検出無病正診率を高め、医療費を減少させ、かつ、手術の間に医師が組織の癌領域を決めるのを助ける追加的な非侵襲かつリアルタイムの癌診断を実行することである。非侵襲的な癌診断の既知の方法は、反射率分光法や蛍光分光法などのようにわずかしかなく、それらの両方とも疾患組織の生化学的及び形態学的な変化の検出に基づくものである。 A more convenient approach to provide a more accurate diagnosis of cancerous tissue can increase the detection-free diagnosis rate, reduce medical costs, and help surgeons determine the cancer area of the tissue during surgery. To perform invasive and real-time cancer diagnosis. There are few known methods of noninvasive cancer diagnosis, such as reflectance spectroscopy and fluorescence spectroscopy, both of which are based on the detection of biochemical and morphological changes in diseased tissue. is there.
生物組織は入射光を吸収し散乱させる混濁媒体である。光は、組織に衝突すると、通常、多重弾力散乱するが、同時に、また吸収及び蛍光を生じさせる。光が組織表面を出る前に、組織の組成の構造的情報を含むさらなる光の拡散と吸収が起こり得る。例えば、細胞の核細胞質比の変化及び染色質構造の変化といった細胞レベル及び亜細胞レベルでの局部代謝及び構造の変化に伴う前癌病変と早期癌の検出にこの情報を使用できる。これらの変化は組織の弾性散乱特性に影響する。 Biological tissue is a turbid medium that absorbs and scatters incident light. When light strikes tissue, it usually scatters multiple elastically, but at the same time also causes absorption and fluorescence. Before the light exits the tissue surface, further light diffusion and absorption, including structural information on the composition of the tissue, can occur. For example, this information can be used to detect precancerous lesions and early cancers associated with changes in local metabolism and structure at the cellular and subcellular levels, such as changes in cellular nucleocytoplasmic ratio and chromatin structure. These changes affect the elastic scattering properties of the tissue.
反射率分光法は組織から反射する光の分析である。組織反射率分光法は、組織発色団(光を強く吸収する分子)、例えば、ヘモグロビンの情報を引き出すために使用され得る。オキシヘモグロビン/デオキシヘモグロビン比が推測され、癌検出と予後分析に非常に役立つ組織酸化状態を決定するのに使用できる。これはまた、細胞核のサイズ分布と、平均細胞密度などの組織内の散乱体の情報を引き出すのに使用され得る。多くの場合、発色団濃度の数量化が望まれ、これは拡散効果から吸収効果を切り離す能力を必要とする。 Reflectance spectroscopy is the analysis of light reflected from tissue. Tissue reflectance spectroscopy can be used to extract information about tissue chromophores (molecules that absorb light strongly), such as hemoglobin. The oxyhemoglobin / deoxyhemoglobin ratio can be inferred and used to determine tissue oxidation status that is very useful for cancer detection and prognosis analysis. This can also be used to derive information on scatterers in the tissue, such as cell size distribution and average cell density. In many cases, quantification of the chromophore concentration is desired, which requires the ability to decouple the absorption effect from the diffusion effect.
蛍光分光法は組織からの蛍光放射の分析である。自然の組織蛍光発色団(光の適切な波長によって励起されると蛍光を放つ分子)はチロシン、トリプトファン、コラーゲン、エラスチン、フラビン、ポルフィリン及びニコチンアミドアデニンジヌクレオチド(NAD)を含んでいる。組織蛍光は疾病変化に関連している化学的組成変化や化学環境変化に非常に敏感である。病的な領域に優先的に蓄積することが示された外因又は外因によって誘発された発色団もまた使用可能である。 Fluorescence spectroscopy is the analysis of fluorescence emission from tissue. Natural tissue fluorescent chromophores (molecules that fluoresce when excited by the appropriate wavelength of light) include tyrosine, tryptophan, collagen, elastin, flavin, porphyrin, and nicotinamide adenine dinucleotide (NAD). Tissue fluorescence is very sensitive to changes in chemical composition and chemical environment associated with disease changes. Exogenous or exogenous-induced chromophores that have been shown to preferentially accumulate in pathological areas can also be used.
組織を調べるのにこれまで使用されてきた別のタイプの分光技術はラマン分光法の使用を伴っていた。ラマンスペクトルは照らされた試料の振動エネルギ、伸長エネルギ及び解離エネルギに関する特殊情報を伝える。ラマン分光法は分子振動を調べて非常に特定的な指紋のようなスペクトル特徴を与え、悪性組織を良性組織と識別する高精度を持っている。ラマン分光法をまた、悪性組織、その先駆体、正常組織の間のタンパク質及び遺伝物質の構造及び組成の違いを特定するのに使用できる。しかしながら、インビボ(生体内)組織ラマンプローブの開発は技術的には挑戦的なものである。なぜならば、組織のラマン信号は弱く、組織蛍光からの干渉があり、ファイバー自体に発生するバックグラウンドラマン信号及び蛍光信号によってスペクトル汚染が引き起こされるためである。 Another type of spectroscopic technique that has been used to examine tissue has involved the use of Raman spectroscopy. The Raman spectrum conveys special information about the vibration energy, extension energy and dissociation energy of the illuminated sample. Raman spectroscopy examines molecular vibrations to give a very specific fingerprint-like spectral feature and is highly accurate in distinguishing malignant tissue from benign tissue. Raman spectroscopy can also be used to identify differences in the structure and composition of proteins and genetic material between malignant tissues, their precursors, and normal tissues. However, the development of in vivo (in vivo) tissue Raman probes is technically challenging. This is because the Raman signal of the tissue is weak, there is interference from tissue fluorescence, and spectral contamination is caused by the background Raman signal and the fluorescence signal generated in the fiber itself.
別の非侵襲的な画像技術は光コヒーレンストモグラフィー(OCT)である。これは、様々な組織微小構造に関する距離情報が反射率信号の時間遅延から抽出されるという低コヒーレンス干渉法の原理に基づいている。OCTは、原位置における、かつ、リアルタイムで、組織微小構造の高画質「光学的生検」を実行できる。しかしながら、商業OCTシステムの空間分解能はいまだ正確な生体内内視鏡検査診断のための臨床必要条件を満たすことができない。 Another non-invasive imaging technique is optical coherence tomography (OCT). This is based on the principle of low coherence interferometry in which distance information about various tissue microstructures is extracted from the time delay of the reflectance signal. OCT can perform high-quality “optical biopsy” of tissue microstructures in situ and in real time. However, the spatial resolution of commercial OCT systems still cannot meet the clinical requirements for accurate endoscopic diagnosis.
これらの方法の他に、癌細胞の細胞構造の形態変化に基づく非侵襲的な癌診断の領域において継続中の調査研究がある。組織を癌であると診断するのに病理学者によって使用される最も際立った特徴の1つは拡大し混雑している核の存在である。多くの癌のタイプでは、癌細胞の核が正常細胞の核よりかなり大きいので、これらの調査研究の目標は光学システムを介して非侵襲的に細胞の核、ミトコンドリア他の小器官などの散乱体の平均サイズを見積もることである。 In addition to these methods, there is ongoing research in the area of non-invasive cancer diagnosis based on morphological changes in the cell structure of cancer cells. One of the most distinguishing features used by pathologists to diagnose tissue as cancer is the presence of an enlarged and crowded nucleus. For many types of cancer, the nuclei of cancer cells are much larger than the nuclei of normal cells, so the goal of these studies is to scatter nuclei such as cell nuclei, mitochondria and other organelles non-invasively via optical systems. Is to estimate the average size.
光線が調査中の組織に達すると、それ一部が組織の表面によって反射されるが、残りは屈折して組織中に透過される。組織中に透過された光は散乱され吸収される。多重散乱の後、いくらかの透過光線が組織表面に帰還し出現して検出可能になる。生物組織による光の散乱は、細胞核や膠原線維束などの様々な微小構造の境界における組織中の屈折率変動によって引き起こされる。その結果、組織の拡散特性は組織の微小構造の特性及び形態学の変化(これはしばしば組織の病理学的な変化を伴う)に伴って変化する。例えば、正常組織が癌になると、細胞核のサイズと上皮層の厚さは、細胞(マイクロ散乱体)が占領する全容積が増えるように増える。そのような組織微小構造と形態の変化は正常病変と癌病変による変化の光散乱の特性の本質的な違いを引き起こすことがわかった。 When the light reaches the tissue under investigation, a portion is reflected by the surface of the tissue, while the rest is refracted and transmitted into the tissue. Light transmitted into the tissue is scattered and absorbed. After multiple scattering, some transmitted light returns to the tissue surface and becomes detectable. Light scattering by biological tissues is caused by refractive index fluctuations in tissues at the boundaries of various microstructures such as cell nuclei and collagen fiber bundles. As a result, tissue diffusion properties change with changes in tissue microstructure characteristics and morphology, which is often accompanied by pathological changes in the tissue. For example, when normal tissue becomes cancerous, the size of the cell nucleus and the thickness of the epithelial layer increase so that the total volume occupied by the cells (microscatterers) increases. Such tissue microstructure and morphological changes were found to cause substantial differences in the properties of light scattering of changes due to normal and cancerous lesions.
特に、反射率スペクトル測定を使用することで、正常病変と癌病変の拡散特性に関する量的な違いを得るために文献で2つの測定アプローチを特定できた。1つのアプローチは、表面組織層を起源とする単独光拡散スペクトル(LSS)を測定し、細胞レベル及び亜細胞レベルでの拡散構造に関する定量的情報を抽出することである。LSSL技術は細胞小器官の弾性散乱特性の変化を調べ、それらのサイズと他の寸法情報を推論する。組織中の細胞の特徴と他の細胞構造を測定するために、多重散乱され散乱物体に関する容易にアクセス可能な情報をもはや担持していない拡散光から弱くて単独で散乱する光を区別する必要がある。したがって、単独散乱光子の角分布だけから得られた情報を分析できるように懸濁液の散乱体の濃度は低くなければならない。光散乱理論を用いての単独戻り散乱光スペクトルの分析は、組織を除去することなく細胞核のサイズと数密度の情報を提供する。 In particular, by using reflectance spectrum measurements, two measurement approaches could be identified in the literature to obtain quantitative differences regarding the diffusion characteristics of normal and cancerous lesions. One approach is to measure a single light diffusion spectrum (LSS) originating from the surface tissue layer and extract quantitative information about the diffuse structure at the cellular and subcellular levels. LSSL technology examines changes in the elastic scattering properties of organelles and infers their size and other dimensional information. In order to measure the characteristics of cells in cells and other cellular structures, it is necessary to distinguish weakly scattered light from diffuse light that no longer carries multiple scattered and easily accessible information about the scattering object. is there. Therefore, the concentration of scatterers in the suspension must be low so that information obtained from only the angular distribution of single scattered photons can be analyzed. Analysis of a single return scattered light spectrum using light scattering theory provides information on the size and number density of cell nuclei without removing tissue.
それにもかかわらず、これらのLSS測定は限定されている。なぜならば、LSSは、発色団濃度などの組織の吸収特性に関する定量的情報を得ることを可能にしないからである。さらに、LSS測定は、内視鏡検査適用の間に実行不可能であれば、実行は困難である。 Nevertheless, these LSS measurements are limited. This is because LSS does not make it possible to obtain quantitative information regarding tissue absorption properties such as chromophore concentration. In addition, LSS measurements are difficult to perform if they are not feasible during endoscopy applications.
もう1つのアプローチは、拡散反射率スペクトル(DRS)から組織形態学(組織拡散特性)に関する定量的情報を得ることである。拡散反射率は光を試料に入射させそこで反射拡散させ、かつまた、試料物質中に透過させることに依存している。戻り反射率拡散散乱光(そのいくらかは試料によって吸収される)は、次に、付属装置によって集められて検出器光学素子に向けられる。試料中で散乱し表面に帰還するビーム部分だけが拡散反射であると考えられる。 Another approach is to obtain quantitative information about tissue morphology (tissue diffusion properties) from diffuse reflectance spectra (DRS). Diffuse reflectivity relies on light entering a sample where it is reflected and diffused and also transmitted through the sample material. The return reflectance diffuse scattered light (some of which is absorbed by the sample) is then collected by the accessory device and directed to the detector optics. Only the beam portion scattered in the sample and returning to the surface is considered to be diffuse reflection.
拡散反射率測定は実行がより簡単であり、かつ、拡散特性はもちろん、吸収特性に関しても定量的情報を得ることがより簡単にできる。しかしながら、ほとんどの研究では、DRS測定から得られた定量的情報は、組織微小構造と形態学に直接関係する定量的情報を得るよりも、むしろ平均バルク組織光学特性(低下した拡散係数と吸収係数)に関する見積りに制限されていた。この制限は、主として、そのような微小構造と形態学での組織中の光伝搬(多重散乱)の複雑な性質によるものである。したがって、細胞レベルでDRSから拡散特性を特徴付けるのは難しい。 Diffuse reflectance measurement is simpler to perform and makes it easier to obtain quantitative information regarding absorption characteristics as well as diffusion characteristics. However, in most studies, the quantitative information obtained from DRS measurements is rather than obtaining quantitative information directly related to tissue microstructure and morphology, rather than average bulk tissue optical properties (decreased diffusion and absorption coefficients). ) Was limited to estimates. This limitation is mainly due to the complex nature of light propagation (multiple scattering) in tissues with such microstructure and morphology. Therefore, it is difficult to characterize diffusion properties from DRS at the cellular level.
また、戻り反射光を2つのカテゴリ、即ち、拡散反射率と、正反射から派生するように考えることができる。正反射は試料に伝播しないが、むしろ組織の前面で反射する光である。この成分は表面の組織情報を含んでいる。一般に、拡散成分は、正反射成分よりも組織検定と数量化に役に立つと考えられる。 Also, the return reflected light can be considered to be derived from two categories: diffuse reflectance and regular reflection. Regular reflection is light that does not propagate to the sample, but rather reflects off the front of the tissue. This component contains surface tissue information. In general, the diffuse component is considered more useful for tissue verification and quantification than the specular component.
接触光ファイバープローブの使用、小さな収集角度での帰還放射の収集又は正反射率制御装置を使用等の様々なアプローチが正反射成分に対して拡散成分を強調するために提案されてきた。いくつかの組織の場合、例えば、皮膚に関しては、スペクトロメーターに結合された適切な光ファイバ束で単に組織の形態変化に触れることによってそのようなスペクトルを得るのは比較的簡単である。しかしながら、肺などの内臓に関して、そのようなセットアップは生体組織検査か他の治療のツールの器具チャンネルベースのファイバープローブの干渉のために実用的でないだろう。 Various approaches have been proposed to emphasize the diffuse component over the specular component, such as using a contact fiber optic probe, collecting return radiation at a small collection angle, or using a specular reflectance controller. In the case of some tissues, for example with respect to the skin, it is relatively easy to obtain such a spectrum simply by touching the tissue morphological change with a suitable fiber optic bundle coupled to a spectrometer. However, for internal organs such as the lung, such a setup would not be practical due to the interference of instrument channel based fiber probes in biopsy or other therapeutic tools.
組織の癌の変化を検出するために拡散反射率分光法の可能性を研究調査するものはほとんどない。悪性及び良性病変と、正常組織との光学特性の本質的な違いが発見され、癌変化の間に起こった組織生理学及び形態学変化に直接関係づけられた。肺を含む様々な臓器部位に臨床分光器測定及び分析が実行された。特に、バード他は蛍光気管支鏡検査法の間に特定される異常病変のスペクトル測定と分析を実行し、組織が悪性になったときに吸収と拡散の両方に関連する生理的及び形態学的特性の意義ある変化を発見した。彼らはまた、肺癌検出無病正診率を改善するためのそのようなスペクトル測定の可能性を評価した。しかしながら、彼らの測定は、内視鏡器具チャンネルに挿入され測定の間に組織表面に接触する光ファイバプローブをいまだ使用することで行われていた。 Few studies investigate the potential of diffuse reflectance spectroscopy to detect changes in tissue cancer. Essential differences in optical properties between malignant and benign lesions and normal tissue were discovered and directly related to tissue physiology and morphological changes that occurred during cancer changes. Clinical spectroscopic measurements and analyzes were performed on various organ sites including the lung. In particular, Bird et al. Perform spectral measurement and analysis of abnormal lesions identified during fluorescent bronchoscopy, and physiological and morphological characteristics related to both absorption and diffusion when the tissue becomes malignant. I found a significant change. They also evaluated the possibility of such spectral measurements to improve the lung cancer detection disease-free accuracy rate. However, their measurements were still made using fiber optic probes inserted into the endoscopic instrument channel and in contact with the tissue surface during the measurement.
原則として、臨床設定で使用されるDRSは以下の方法で実行される。内視鏡の生検チャンネルに挿入されスペクトロメーターと結合された光ファイバプローブ、即ち、光ファイバーバンドルを組織表面に接触させる。光ファイバプローブは、通常中央コアである照明ファイバー(光ファイバーバンドル)と、帰還放射をキャプチャーする(捕らえる)周囲のファイバー(光ファイバーバンドル)から成る。光は照明ファイバーを出て調査対象の組織に入る。散乱と吸収の過程の後に、組織を去る光は検出ファイバーによって捕らえられスペクトロメーターに向けられる。組織の特徴を決定するためにスペクトルはさらに分析される。 In principle, DRS used in a clinical setting is performed in the following manner. An optical fiber probe, ie, an optical fiber bundle, inserted into the biopsy channel of the endoscope and coupled to the spectrometer is brought into contact with the tissue surface. A fiber optic probe consists of an illumination fiber (fiber optic bundle), usually the central core, and surrounding fibers (fiber optic bundle) that capture (capture) return radiation. The light exits the illumination fiber and enters the tissue under investigation. After the scattering and absorption process, the light leaving the tissue is captured by the detection fiber and directed to the spectrometer. The spectrum is further analyzed to determine tissue characteristics.
接触プローブ形状を使用することは、測定人工産物をより少なくすると共に、より良く管理された拡散反射率測定を与えるという事実にもかかわらず、この種類の測定の制限は内臓の生体内内視鏡画像法に関して無器用で時間がかかるということである。 Despite the fact that using a contact probe geometry reduces measurement artifacts and gives a better controlled diffuse reflectance measurement, the limitations of this type of measurement are visceral in vivo endoscopes It is awkward and time consuming with regard to imaging.
従って、内視鏡検査適用の目標に対して、装置は組織の生理的形態学的特徴に関する定量的情報を拡散反射率測定から直接得る必要がある。従って、本発明は器具チャンネルにファイバープローブを通す必要性をなくす非接触プローブを使用する。従って、本発明は、先行技術で提示された問題を克服し、先行技術に勝る追加の利点を提供する。Therefore, for the goal of endoscopy applications, the device needs to obtain quantitative information about the physiological morphological characteristics of the tissue directly from diffuse reflectance measurements. Accordingly, the present invention uses a non-contact probe that eliminates the need to pass a fiber probe through the instrument channel. Thus, the present invention overcomes the problems presented in the prior art and provides additional advantages over the prior art.
1実施例における本発明は内視鏡画像法の間に生体内で測定された拡散反射率スペクトルから組織に関する情報を得る方法であって、ブロードビーム放射で組織を照らして帰還放射を発生させ;非接触プローブにより帰還放射の拡散反射率スペクトルを測定し;一次元光輸送モデリングによって2層組織モデルのための一次元ので拡散反射率スペクトルを分析し;分析された拡散反射率スペクトルから組織の少なくとも1つの光学特性を抽出し;該光学特性から組織の少なくとも1つの生理学的形態学的情報を引き出す;ことによってなされるものである。 The invention in one embodiment is a method for obtaining information about tissue from diffuse reflectance spectra measured in vivo during endoscopic imaging, illuminating the tissue with broad beam radiation and generating return radiation; Measuring the diffuse reflectance spectrum of the return radiation with a non-contact probe; analyzing the one-dimensional diffuse reflectance spectrum for a two-layer tissue model by one-dimensional light transport modeling; and analyzing at least the tissue from the analyzed diffuse reflectance spectrum Extracting one optical property; extracting at least one physiological morphological information of the tissue from the optical property.
別の実施例では、本発明は拡散反射率スペクトルからの組織に関する情報を得るのための装置であって、帰還している放射を発生させるためにブロードビーム放射で組織を照らす手段と;帰還放射を測定する非接触プローブと;帰還放射の拡散反射率スペクトルを測定する手段と;一次元光輸送モデリングによって2層組織モデルのための拡散反射率スペクトルを分析する手段と;分析された反射率スペクトルから組織の少なくとも1つの光学特性を抽出する手段と;該光学特性から組織の少なくとも1つの生理学的形態学的情報を引き出す手段と;を含んでなる装置である。 In another embodiment, the present invention is an apparatus for obtaining information about tissue from a diffuse reflectance spectrum, and means for illuminating tissue with broad beam radiation to generate returning radiation; A means for measuring the diffuse reflectance spectrum of the return radiation; a means for analyzing the diffuse reflectance spectrum for the two-layer tissue model by one-dimensional light transport modeling; and the analyzed reflectance spectrum Means for extracting at least one optical characteristic of the tissue from the means; and means for extracting at least one physiological morphological information of the tissue from the optical characteristic.
さらに別の実施例では、本発明は拡散反射率スペクトルから組織に関する情報を得るのための装置であって、非接触プローブと;組織を照らして帰還放射を発生させるために前記プローブの遠位端で広帯域尋問放射を発生させる光源と;前記帰還放射をキャプチャーするために結合された検出システムと;処理装置が前記検出システムに結合され前記帰還放射の拡散反射率スペクトルを測定しかつ該拡散反射率スペクトルに基づいて組織を良性又は悪性のいずれか一方に分類する処理装置と;を含んでなるものである。 In yet another embodiment, the present invention is an apparatus for obtaining information about tissue from a diffuse reflectance spectrum; a non-contact probe; and a distal end of said probe to generate return radiation illuminating the tissue A light source generating broadband interrogation radiation; a detection system coupled to capture the return radiation; a processing device coupled to the detection system to measure a diffuse reflectance spectrum of the feedback radiation and the diffuse reflectance And a processing device that classifies the tissue as either benign or malignant based on the spectrum.
添付図面(同様の要素に対して同様の参照番号を付している)に関連して以下の説明を参照することにより、本発明の構造と作動に関する構成と方法をそれらの更なる目的と利点と共に最も良く理解できる。 Reference will now be made to the following description in connection with the accompanying drawings, wherein like elements are provided with like reference numerals, and in accordance with the structure and operation of the present invention, further objects and advantages thereof. And best understand.
本発明を異なった形態の実施の形態として説明するが、図に示し以下に説明するこれらの特定の形態は、本開示による発明の原理の例示であり、発明をそれらに制限することを意図しないものである。 While the invention will be described in different forms of embodiments, these specific forms shown in the drawings and described below are illustrative of the principles of the invention according to the present disclosure and are not intended to limit the invention thereto. Is.
本発明のアプローチは生体内の内視鏡画像法の間に得られた拡散反射率スペクトル(DRS)から吸収関連及び/又は散乱関連特性に関する定量的情報を得ることである。散乱反射は、広帯域光ビームを試料に投射し、そこで光が吸収され、反射され、散乱され及び透過される又は試料物質を通して戻り反射される。戻り反射した(戻り散乱した)光は、次に、付属装置(例えば、光ファイバ)により集められ検出器光学素子に向けられる。試料の中で散乱して表面に帰還されるビームの一部だけが散乱反射であると考えられる。組織の癌の変化を検出するために組織の散乱反射率分光法の可能性を研究調査するものはほとんど無い。しかしながら、従来技術において散乱反射率測定に使用されるプローブは、前癌病変又は癌の活動の結果、生理的変化が疑われる組織を特定するデータを引き出すために組織に接する。そのうえ、真組織における早期癌変化を反映するために光子吸収及び散乱係数の変化を生理的形態的パラメータに関係づけるどんな明確なモデリング法もなかった。 The approach of the present invention is to obtain quantitative information regarding absorption-related and / or scattering-related properties from diffuse reflectance spectra (DRS) obtained during endoscopic imaging in vivo. Scattered reflections project a broadband light beam onto a sample where light is absorbed, reflected, scattered and transmitted or reflected back through the sample material. The back-reflected (back-scattered) light is then collected by an accessory device (eg, an optical fiber) and directed to the detector optics. Only a part of the beam scattered in the sample and returned to the surface is considered to be scattered reflection. Few studies investigate the potential of tissue scattering reflectance spectroscopy to detect changes in tissue cancer. However, probes used in the prior art for scattering reflectance measurements touch tissue to derive data that identifies tissue suspected of physiological changes as a result of precancerous lesions or cancer activity. Moreover, there was no clear modeling method to relate changes in photon absorption and scattering coefficients to physiological morphological parameters to reflect early cancer changes in true tissue.
形状の使用が最も正確な散乱反射率測定を与えるという事実にもかかわらず、この種類の測定の制限は、接触プローブが生体組織検査他の治療に干渉を与えるということである。従って、本発明は、器具チャンネルを通るファイバープローブの必要性を排除する非接触プローブを使用し、この技術の臨床適用をはるかに便利にする。本発明は、また、ブロードビーム照射の測定幾何学を生成し、スポット検出を狭めて測定スペクトルの理論モデリングを簡素化する。 Despite the fact that the use of geometry gives the most accurate scattering reflectance measurement, a limitation of this type of measurement is that the contact probe interferes with biopsy and other treatments. Thus, the present invention uses a non-contact probe that eliminates the need for a fiber probe through the instrument channel, making the clinical application of this technique much more convenient. The present invention also generates a measurement geometry for broad beam illumination and narrows the spot detection to simplify the theoretical modeling of the measured spectrum.
図1は本発明に使用される画像分光法システム12を示している。システムには、光源1、患者に挿入するように設けたプローブ3を備える内視鏡2、イメージキャプチャ装置4(カメラなど)を含んでいる検知システム、スペクトルアタッチメント10及びスペクトロメーター5がある。光源1は照明放射、望ましくは広帯域光を供給する。光は光ファイババンドル(束)7を通して内視鏡2に送られる。照明光ファイバーバンドル7は、調査される組織6に照明放射を向けるために内視鏡2とプローブ3を通照明って延伸する。 FIG. 1 shows an
光源1は望ましくは、白色光画像と反射率スペクトル測定のための白色光(又は光)と、蛍光画像と蛍光スペクトル測定のために弱い近赤外(NIR)光を備える強い青色光(400− 450nm)の両方をに供給するキセノンアーク灯である。NIR光は、緑色蛍光画像を正規化するのに使用されるNIR反射率画像を形成するのに使われる。(本発明の別の実施例は蛍光画像の正規化に使用される第2蛍光画像のための第2励起信号を使う。)光源1は、また、水銀灯、ハロゲン電球、メタルハライドランプ、レーザ又はLEDであってもよい。与えられたセットの波長を選択するために様々なフィルタを加えることができる。 The light source 1 is preferably a strong blue light (400−) comprising a white light image and white light (or light) for reflectance spectrum measurement and a fluorescent image and weak near infrared (NIR) light for fluorescence spectrum measurement. 450 nm) is a xenon arc lamp. NIR light is used to form an NIR reflectance image that is used to normalize the green fluorescent image. (Another embodiment of the present invention uses a second excitation signal for a second fluorescent image that is used to normalize the fluorescent image.) The light source 1 is also a mercury lamp, halogen bulb, metal halide lamp, laser or LED. It may be. Various filters can be added to select a given set of wavelengths.
処理装置8は、イメージキャプチャ装置4とスペクトロメーター5からデータを受け取って、ここに説明されるように計算と処理を実行する。例えば、処理装置8は、以下に説明されるように拡散反射率スペクトルを受けて、ここに説明される分析、分類及び測定機能を実行する、処理装置8は、コンピュータかマイクロプロセッサであり、望ましくは、パーソナルコンピュータである。処理装置8はその結果をモニター、液晶ディスプレー画面又はプリンタなどのユーザが望むどんな出力手段にも出力し、あるいは、さらなる分析のために結果を別のコンピュータに伝えるか又は結果をそれ自身の内部計算と分析に使用する。 The processing device 8 receives data from the
組織6からの帰還放射(これは、反射光、蛍光のための狭帯域放射光、正規化のための他の狭帯域又は他のタイプの光の何らかの組合せであることができる)は様々なレンズによって集められ、イメージ検出装置4によるイメージングとスペクトロメーター5による分光のためにイメージバンドル9を通して検出システムまでリレーされる。 Return radiation from tissue 6 (which can be any combination of reflected light, narrowband emitted light for fluorescence, other narrowband for normalization, or other types of light) is various lenses And relayed through the
スペクトル測定は、内視鏡2と検出システムの間に設けたスペクトルアタッチメント10を使用することで実行される。光ファイバ11は分光分析のため帰還放射の部分を画像平面のスポットからのスペクトロメーター5まで運ぶ。プローブ3の遠位端は図1にさらに詳細に示される。図1Aの断面図に示すプローブ3は、目標物(図1の組織6などの)に尋問放射を運ぶために1つ以上の光ファイバー照明ガイド21と、組織6から帰還放射を運ぶためのイメージバンドル22を通常含む。プローブ3はまた、生体組織検査他の手術方法のための器具チャンネル23、目標の洗浄のための水管24及び吸引のための気管25を含んでいる。さらに、器具チャンネル23は、光学コンピュータトモグラフィー、ラマン分光法、共焦点顕微鏡法、エンド顕微鏡法、レーザ又はドラッグ治療、遺伝子療法、注射、マーキング、インプラントク他の医術などの他の医療のためのアクセスを提供できる。蛍光画像、蛍光分光法、光コヒーレンストモグラフィー法、ラマン分光法、共焦点顕微鏡法又は白色光反射率画像法などの第2画像診断法を散乱反射率分光診断法に組み合わせることができる。 The spectrum measurement is performed by using a
1実施の形態において、図1に示されるように光源26は内視鏡プローブ3の遠位端の近くに置かれる。例えば、少なくとも1つ、望ましくは少なくとも2つのLEDを内視鏡の端に置くことによって、照明光か励振光を運ぶ光ファイバを省略することができる。LEDは低コストで、より信頼でき、より寿命が長く、より軽量で、よりコンパクトで、レーザ光源とランプ光源よりもより効率的であり、イメージングと照明のより良いコントロールを可能にする。さらに、図1Aに示すように、微小イメージキャプチャ装置28を内視鏡3の遠位端に置くことができる。この構成は、帰還放射をイメージキャプチャ装置に伝える光ファイバーバンドルの必要性をなくすことができる。代わりに、微小イメージキャプチャ装置28は処理装置8のようなプロセッサに信号に送る。この構成はより高い解像度と改良された画像の機会を与える。さらに別の実施例では、光源、イメージ検出装置他の高価な光学素子を取り外し可能な先端に配置することができ、米国特許出願No.11/088,561、「取り外し可能な先端を持つ内視鏡装置」で詳細に説明されるように、患者によって変えることができる。この米国特許の開示は参照のためにここに取り入れられる。 In one embodiment, the light source 26 is placed near the distal end of the
図1Bは本発明の内視鏡システムで使用されるスペクトルアタッチメントを示す。このスペクトルアタッチメント10を使う内視鏡31はヘイシャン他に付与された米国特許6,898,458、「蛍光及び反射率画像分光法と多重測定装置による電磁波の同時測定のための方法と装置」で詳細に説明される。その開示は参照のためにここに取り入れられる。この特許は分光法測定と共に同時の白色光と蛍光画像法のための様々な装置と構成を開示する。 FIG. 1B shows a spectral attachment used in the endoscope system of the present invention. An
図1の照らされた組織6から外へ出る光はレンズ36によって焦点を合わせられて、ファイバー鏡アセンブリ32に当座の画像を形成する。鏡のセンターはドリルでセンターに穴を開けることによって変更され、画像の断片をスペクトロメーター35に送るために光ファイバ33を穴に挿入することができる。ファイバー位置は画像でにおいて黒色スポットとして見られ、まさにそこで分光分析が行われることを示す。光ファイバ33は画像平面のスポットから反射率信号を運ぶ(点スペクトル測定)。スポットは、内視鏡プローブの先端が分光分析のために組織表面からスペクトロメーター35の方に10mm離れたところにあるとき、画像平面は組織表面における1mmの直径の領域に相当する。医師は黒色スポットを関心領域に合わせることができ、静止画像に伴うスペクトル測定はコンピュータメモリに節約される。ビデオ画像とスペクトル(WLRモードかフFLモードによる)はライブモードにおいてコンピュータモニタに同時に表示される。白色光画像法及び蛍光画像法又は画像法及び分光法などの複数の診断手段を使用しての帰還放射の処理は上記の特許出願で詳細に説明されており、その内容は参照のためにここに取り入れられる。 Light exiting the illuminated tissue 6 of FIG. 1 is focused by a
画像収集のために光線を元の方向に戻すように折り返し、次にレンズ38に通してカメラ34に到達させるために鏡37をファイバー鏡アセンブリ32と平行に置く。入って来る光線に対して鏡32と37は45度の角度をなしているが、これは図示目的だけのためである。 The ray is folded back to collect the image for image acquisition, and then mirror 37 is placed parallel to fiber mirror assembly 32 to pass through
本発明のシステム12によって実行される反射率測定を図2に示される同等1−D測定幾何学によって表すことができる。そのような幾何学では、連続波面線源が組織を照射し、反射率は組織表面の狭いスポットから検出される。2層の混濁媒質として表された組織は非接触の垂直な光ファイバーバンドル7を通してブロードビームS(z)尋問放射で照らされる。照射ビームの直径は組織6上のおよそ2cmのスポットである。光ファイバーバンドル7の前記直径の場合で、内視鏡プローブ3の先端(チップ)が組織表面6から10mmであるときに、我々は、帰還放射又は反射率信号が組織表面6の1mmのスポットから検出されることを計算した。 The reflectance measurement performed by the
本発明の散乱反射率測定のための方法は今ここで説明される。 The method for scattering reflectance measurement of the present invention will now be described here.
組織から測定された(インビボ)反射率信号Iml(λ)を以下の通り記述できる。The (in vivo) reflectance signal Iml (λ) measured from the tissue can be described as follows:
Iml(λ)=a1I(λ)+b1I(λ)Rtm(λ) (1)
ここで、I(λ)はソーススペクトル地形、ファイバーバンドル透過率及び検出器効率を含む器具スペクトル応答、a1は組織表面正反射率がプローブによって集められる効率に関連する定数、b1は組織からの散乱反射率が測定プローブによって集められる効率に関連する定数、Rtm(λ)は引き出されるべき真の組織散乱反射率である。Iml (λ) = a1 I (λ) + b1 I (λ) Rtm (λ) (1)
Where I (λ) is the instrument spectral response including source spectral topography, fiber bundle transmission and detector efficiency, a1 is a constant related to the efficiency with which the tissue surface specular reflectance is collected by the probe, and b1 is from the tissue A constant, Rtm (λ), related to the efficiency with which the scatter reflectance is collected by the measurement probe is the true tissue scatter reflectance to be derived.
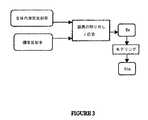
器具応答を取り除くために、既知の反射率を持つ標準反射ディスクを使用して正規化が実行されるべきである。また、器具応答を取り外す過程は図3に図式的に示される。 In order to remove the instrument response, normalization should be performed using a standard reflective disk with a known reflectivity. The process of removing the instrument response is also shown schematically in FIG.
標準ディスクIm2{λ}から測定される反射率信号を以下の通り記載できる。The reflectance signal measured from the standard disc Im2 {λ} can be described as follows.
Im2(λ)=a2I(λ)+b2I(λ)Rs (2)
ここで、a2は正反射がプローブによって集められる効率に関連する定数、b2は散乱反射が集められる効率に関連する定数、Rsは標準ディスクの反射率であり、全可視波長域において定数であり、1に極めて近い。Im2 (λ) = a2 I (λ) + b2 I (λ) Rs (2)
Where a2 is a constant related to the efficiency with which the specular reflection is collected by the probe, b2 is a constant related to the efficiency with which the scattered reflection is collected, Rs is the reflectivity of the standard disk, and is a constant in the entire visible wavelength range Yes, very close to 1.
組織から測定された生体内の射率信号Im1(λ)を反射率標準ディスクから測定された反射率信号Im2によって割って器具スペクトル応答I(λ)を解析することができる。The in-vivo emissivity signal Im1 (λ) measured from the tissue can be divided by the reflectance signal Im2 measured from the reflectivity standard disk to analyze the instrument spectral response I (λ).
式1を式2で割り、式を整理すると、以下を得る。Dividing equation 1 by

私たちは、22人の患者で正常な気管支粘膜と、良性及び悪性の気管支粘膜病変のインビボ測定を実行して、合計100のスペクトルを得た。各測定組織部位を良性又は悪性に分類するに各測定に対して1つの生検標本を得た。生体組織検査の病理学検査は、21の反射率スペクトルが正常組織部位から、29が良性病変から(26が増生、3が軽い形成異常)、そして、50が悪性病変から来ること(7が肺小細胞癌、3が扁平上皮細胞癌、30が非小細胞肺癌、10が腺癌)を明らかにした。私たちの分析はスペクトルを以下の2つのグループに差別化するアルゴリズムを開発することであった。 We performed in vivo measurements of normal bronchial mucosa and benign and malignant bronchial mucosal lesions in 22 patients to obtain a total of 100 spectra. One biopsy specimen was obtained for each measurement to classify each measured tissue site as benign or malignant. The pathological examination of biopsy shows that the reflectance spectrum of 21 comes from normal tissue sites, 29 comes from benign lesions (26 is increased, 3 is mild dysplasia), and 50 comes from malignant lesions (7 is lung) Small cell cancer, 3 squamous cell carcinoma, 30 non-small cell lung cancer, 10 adenocarcinoma). Our analysis was to develop an algorithm that differentiated the spectrum into two groups:
グループ1:中程度の形成異常又はそれより悪い組織病理学状態の悪性病変
グループ2:中程度の形成異常より良かった組織病理学状態の正常組織/良性病変。Group 1: Malignant lesions with moderate dysplasia or worse histopathology group 2: Normal tissue / benign lesions with histopathology better than moderate dysplasia.
このバイナリ分類は、グループ1の病変が処置され又は監視されるべきであり、グループ2の状態を見張ることなくそのままにしておくという臨床業務と一致する。また、通常の臨床内視鏡検査の間に、どんな疑われた悪性病変(グループ1)も生検されるべきであり、一方、グループ2の状態は生検されない。しかしながら、この特別に設計された研究では、私たちが画像診断の実行から独立してスペクトル診断の実行を評価できるように、各患者ために、標準見える領域又は疑われた良性病変のどちらかから追加の生体組織検査をランダムに取った。 This binary classification is consistent with a clinical practice where group 1 lesions should be treated or monitored and left undisturbed in
私たちは、拡散反射率スペクトルの分析から得られた組織の生理的形態的な変化に関する定量的情報を使用する組織分類方法と装置を開発した。これを達成するために、私たちは、組織光学特性(吸収係数、散乱係数及び散乱非等方性)を拡散反射率(計算される)に関係づけるフォワードモデルを開発し、次に、組織拡散反射率から組織の生理的形態的特性に関する定量的情報を抽出する逆アルゴリズムを開発した。 We have developed a tissue classification method and apparatus that uses quantitative information about the physiological morphological changes of tissues obtained from analysis of diffuse reflectance spectra. To achieve this, we have developed a forward model that relates tissue optical properties (absorption coefficient, scattering coefficient and scattering anisotropy) to diffuse reflectance (calculated), and then tissue diffusion An inverse algorithm was developed to extract quantitative information about the physiological morphological characteristics of tissue from reflectance.
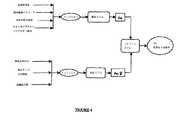
フォワードモデル
フォワードモデルは、計算された拡散反射率Rcを癌の変化に関連する特定の組織生理的形態的パラメータに関連する光輸送理論と離散粒子理論の枠内で開発される。反射率がプローブからの距離や各測定における角度などのように媒体の光学特性と測定条件に依存することが知られている。各組織に関して、組織における光分布を吸収係数、散乱係数及び散乱非等方性(散乱方向)の関数として記述できる。したがって、私たちは光吸収係数が微小血管吸収関連パラメータで表される吸収モデルと、散乱係数が組織微小構造の散布関連のパラメータで表される散乱モデルを開発した。Forward model The forward model is developed within the framework of light transport theory and discrete particle theory where the calculated diffuse reflectance Rc is related to specific tissue physiological and morphological parameters related to cancer changes. It is known that the reflectance depends on the optical characteristics of the medium and the measurement conditions such as the distance from the probe and the angle in each measurement. For each tissue, the light distribution in the tissue can be described as a function of absorption coefficient, scattering coefficient, and scattering anisotropy (scattering direction). Therefore, we have developed an absorption model in which the light absorption coefficient is expressed by parameters related to microvascular absorption, and a scattering model in which the scattering coefficient is expressed by parameters related to scattering of tissue microstructure.
図4はフォワードモデルのブロック図を表す。光吸収係数(インプット1)は血液体積含有率、酸素飽和、生体外肺光学特性(例えば、血液が排出されている状態の生体外測定された肺組織の吸収係数)、オキシ及びデオキシヘモグロビン吸収で表される。散乱係数(インプット2)は散乱体積分率、散乱サイズ分布関数及び組織屈折率で表される。すべての記載されたパラメータは光学特性であり、波長に依存している。 FIG. 4 shows a block diagram of the forward model. Light absorption coefficient (input 1) is blood volume content, oxygen saturation, in vitro lung optical properties (eg, absorption coefficient of lung tissue measured in vitro with blood being drained), oxy and deoxyhemoglobin absorption. expressed. The scattering coefficient (input 2) is expressed by a scatter volume fraction, a scattering size distribution function, and a tissue refractive index. All described parameters are optical properties and are wavelength dependent.
本発明は、既知の光パラメータ(吸収と散乱パラメータ)でシステムをモデリングし、それらのパラメータと関連して散乱反射率信号(Rc)の見積値を計算する。組織中で伝播する光は、組織の形態的構造と化学的組成に関連する組織の見積光学係数を持つ拡散戻り反射率光を分析するのに使用される一般的な拡散近似モデルを使用してモデリングされる。理論的に、各波長での組織反射率スペクトルRc(λ)を記述するのに使用されるフォワードモデルは以下のフィックの法則を使用して得られる。The present invention models the system with known light parameters (absorption and scattering parameters) and calculates an estimate of the scattered reflectance signal (Rc ) in relation to those parameters. The light propagating in the tissue uses a general diffusion approximation model used to analyze diffuse return reflectance light with the estimated optical coefficient of the tissue related to the morphological structure and chemical composition of the tissue. Modeled. Theoretically, the forward model used to describe the tissue reflectance spectrum Rc (λ) at each wavelength is obtained using Fick's law:
z方向に指数関数的に減衰する連続波面線源に関しては、一般的拡散モデルは以下の式によって与えられる。 For a continuous wavefront source that decays exponentially in the z direction, the general diffusion model is given by:
我々は、早期癌変化の大部分が起こる組織粘液浅葉(約0.5mm厚)によってより影響を受ける散乱反射に関心があるので、2層組織(上層の厚みl=0.5mm)幾何学(図2)のための式(5)を解いた。 Since we are interested in scattered reflexes, which are more affected by tissue mucus leaves (about 0.5 mm thick) where most of the early cancer changes occur, the geometry of the two-layered tissue (upper layer thickness l = 0.5 mm) ( Equation (5) for Fig. 2) was solved.
組織の深さzの関数としての光フルエンス分布φ(図2)はモンテカルロシミュレーションを使用することで得られた。このシミュレーションで使用される肺組織の光学特性は、キュー(Qu)他により詳細に説明されている「正常及び癌性の気管支組織の光学特性」、33Appl.Opt.7397−405(1994)から得られ(この開示は参照のためにここに組み入れられる)、そして、4パーセントの血液体積容量を組織モデルに加える。フルエンスφは、λ=470nm、λ=700nmの場合、それぞれ、深さが0.8mm、1.6mmの後に意義が無くなる(要素e−1で低減される)。したがって、測定反射率信号は表面から始めり、光の波長に依存して0.8〜1.6mmの深さまでの組織容積から生じる。The optical fluence distribution φ (FIG. 2) as a function of tissue depth z was obtained using Monte Carlo simulation. The optical properties of lung tissue used in this simulation are described in “Optical properties of normal and cancerous bronchial tissue”, 33 Appl. Opt. 7397-405 (1994) (this disclosure is incorporated herein by reference) and 4 percent blood volume capacity is added to the tissue model. The fluence φ becomes insignificant after the depths of 0.8 mm and 1.6 mm when λ = 470 nm and λ = 700 nm, respectively (reduced by the element e−1 ). Thus, the measured reflectance signal originates from the surface and originates from a tissue volume up to a depth of 0.8-1.6 mm depending on the wavelength of the light.
私たちは(1−D)近似モデルと、層1と層2の2層の幾何学に関して、図2に示されるように、インタフェース221(空気組織界面)での屈折率不整合境界条件と、インタフェース222(2つの組織層間)での屈折率整合境界条件を用いて、z方向に式(5)を解いた。式(5)の解を式(4)に代入することによって、私たちは、吸収係数μa、散乱係数μs及び散乱非等方性gに関する拡散反射スペクトルRc(λ)を得た。We have a (1-D) approximation model and a refractive index mismatch boundary condition at the interface 221 (air tissue interface), as shown in FIG. Equation (5) was solved in the z direction using index matching boundary conditions at interface 222 (two tissue layers). By substituting the solution of equation (5) into equation (4), we obtained the diffuse reflectance spectrum Rc (λ) for the absorption coefficient μa , the scattering coefficient μs and the scattering anisotropy g.
吸収係数μaは、血液が外に出されて生体外測定された肺組織の血液容量と吸収係数に関してモデリングされる。組織中の血液容量を記述するのに使用される2つのパラメータは血液体積分率ρと、血液酸素飽和度αである。The absorption coefficient μa is modeled with respect to the blood volume and absorption coefficient of lung tissue measured in vitro with blood going out. The two parameters used to describe the blood volume in the tissue are the blood volume fraction ρ and the blood oxygen saturation α.
、肺組織生体内の缶で肺組織の生体内吸収特性は以下の式で表される。The in vivo absorption characteristics of lung tissue in a can of lung tissue are expressed by the following formula.
散乱係数μsと散乱非等方性gは微小構造散乱体積分率とサイズ分布に関してモデリングされる。組織散乱モデルはフラクタル法を使用し、一定の屈折率を有するが、異なったサイズの離散的マイクロ散乱粒子の統計的に等価な容積で組織微小構造の屈折率変動を近似できると仮定することで開発されている。The scattering coefficient μs and the scattering anisotropy g are modeled with respect to the microstructure scatter volume fraction and the size distribution. The tissue scattering model uses the fractal method and has a constant refractive index, but assumes that the refractive index variation of the tissue microstructure can be approximated with a statistically equivalent volume of discrete microscattered particles of different sizes. Has been developed.
形が球体であると仮定されるマイクロ散乱粒子に関しては、私たちは、各粒子によって一緒に散乱させられる光波をランダムに加えることによって、バルク組織の輸送散乱係数を計算できる。したがって、以下の積分方程式を使用することで、輸送散乱係数μsと散乱非等方性gをモデル化できる。For micro-scattering particles whose shape is assumed to be spherical, we can calculate the transport scattering coefficient of the bulk tissue by randomly adding light waves that are scattered together by each particle. Therefore, the transport scattering coefficient μs and the scattering anisotropy g can be modeled by using the following integral equation.
体積分率分布η(x)は以下の対数の分布に従うと推定される。 The volume fraction distribution η (x) is estimated to follow the following logarithmic distribution.
背景周囲の媒質(ηbkg)の屈折率は1.36であると仮定される。肺組織の中の散乱体の屈折率は組織のタイプに基づいて以下の関係を使用することで見積もられる。The refractive index of the background surrounding medium (ηbkg ) is assumed to be 1.36. The refractive index of scatterers in lung tissue can be estimated using the following relationship based on the tissue type.
逆アルゴリズム
ニュートン−タイプ繰り返し計画に基づく逆(合わせ)アルゴリズムが測定条件(幾何学形状修正パラメータ(a0、b0)を考慮に入れて、測定反射率スペクトルからの組織吸収及び散乱パラメータの情報を抽出するために開発された。逆は、見積拡散反射率を決定する異なったセットの吸収及び散乱パラメータを持つシミュレーションと、異なったセットの幾何学形状修正パラメータ(a0、b0)のための決定組織拡散反射率を持つシミュレーションとから成る。私たちが最も良いマッチングを得ると、それは、私たちに吸収、散乱及び幾何学パラメータの正しい値を決定させる。Inverse algorithm A newton-type iterative scheme based inverse (matching) algorithm takes into account the measurement conditions (geometry correction parameters (a0 , b0 )) and obtains information on tissue absorption and scattering parameters from the measured reflectance spectrum. The reverse was developed to extract the opposite, for simulations with different sets of absorption and scattering parameters that determine the estimated diffuse reflectance, and for different sets of geometry modification parameters (a0 , b0 ). It consists of a simulation with a deterministic tissue diffuse reflectance, which, when we get the best match, allows us to determine the correct values for absorption, scattering and geometric parameters.
最小二乗最小化機能を介して逆アルゴリズムを記述できる。 The inverse algorithm can be described via the least squares minimization function.
両方の組織層に同じであると仮定した血液体積分率(ρ)、
両方の組織層に同じであると仮定した血中酸素飽和パラメータ(a)、
上層(δ1)と下層(δ2)でのサイズ分布パラメータ(β1)と(β2)、
式(3)における付加的で乗法的な項(幾何学形状修正パラメータ)(ao)と(bo)。Blood volume fraction (ρ), assumed to be the same for both tissue layers,
Blood oxygen saturation parameter (a) assumed to be the same for both tissue layers,
Size distribution parameters (β1) and (β2) in the upper layer (δ1) and the lower layer (δ2),
Additional multiplicative terms (geometric shape correction parameters) (ao) and (bo) in equation (3).
私たちはグラジエントベースサーチ(マルクワルト−タイプ調整計画)を使用して、以下の式からこれらのパラメータのアップデートを得ることができる。 We can use a gradient-based search (Marquardt-type tuning scheme) to obtain updates of these parameters from the following equations:
図5は本発明で開示される手順を示す。上で説明されたフォワードモデルと逆アルゴリズムは真の拡散反射率スペクトルを引き出すために、そして、調査中の組織の癌関連生理的及び形態的な特性を抽出するのに使用された。私たちは、1セットの既知の値の組織光パラメータ(ρ、α、S、β)と共に逆アルゴリズムを使用してシミュレーションし、見積散乱反射率を既知の測定条件(既知の幾何学的な修正パラメータao、bo)に関する測定反射率から得られた真の組織散乱反射率と比べた。私たちは一端最も良いマッチングを手に入れると、散乱反射率に関連する組織光パラメータの実価を持った。マッチングが全くなければ、私たちは新しいセットのパラメータで別のシミュレーションを実行した。私たちは、新しい繰り返しパラメータを見つけるのにグラジエントベースサーチを使用した。 FIG. 5 shows the procedure disclosed in the present invention. The forward model and inverse algorithm described above were used to derive true diffuse reflectance spectra and to extract cancer-related physiological and morphological characteristics of the tissue under investigation. We simulated using an inverse algorithm with a set of known values of tissue light parameters (ρ, α, S, β) and calculated the estimated scatter reflectance to a known measurement condition (known geometric correction). It was compared with the true tissue scattering reflectance obtained from the measured reflectance for the parameters ao, bo). Once we got the best match, we had the real value of tissue light parameters related to scattering reflectance. If there was no match, we ran another simulation with a new set of parameters. We used a gradient-based search to find new iteration parameters.
統計分析
逆アルゴリズムを使用することで得られた実引数は統計分析に使用される。統計分析は、2つのグループ(良性及び悪性)の意義の差を見積り、2つのグループ間でどちらの変数が食い違うかを決定し、そして、最終的に、開発されたモデル予言の分類を評価するために実行される。100のスペクトル測定から得られて合わされたすべての結果が集められ、統計分析のためにグループ毎にセーブされる。私たちは、導かれたパラメータが正規化分布に従うか否かを確認していないので、私たちの合わせ結果から得られたそれぞれの6つのパラメータ(ρ、α、δ1、δ2、β1、β2)に関して2つのグループ(正常/良性組織対悪性病変)の違いの意義を評価するために、Kohriogorov−Srnirnov2試料テストを選択した。判別機能分析(DFA)が次に、組織分類のために診断アルゴリズムを築き上げるために特定された診断に重要なパラメータに適用される。DFAは、グループ間のデータにおける差を最大にした判別機能線を決定すると共に、同じグループのメンバー間の差を最小にする。反射率スペクトルから得られたそれぞれのパラメータセットに横たわる組織状態、(すなわち、正常/良性対悪性)を正しく予測するためにDFAモデルによってなされた診断アルゴリズムのパーフォマンスは、全データセットに関して1つをはじき出す交差妥当化法を使用し不遍法で見積もられている。この方法では、1つのケースがデータセットから取り外され、DFAベースのアルゴリズムは残りのケースに関するデータを使用して再開発され最適化される。最適化されたアルゴリズムが次に使用されて、差し控えられているスペクトルを分類する。この過程はすべての差し控えられたケース(100のスペクトル/ケース)が分類されるまで繰り返される。以下の表記を使用して分類の結果から感度と無病誤診は計算される。The actual argument obtained by using the inversestatistical analysis algorithm is used for statistical analysis. Statistical analysis estimates the difference in significance between the two groups (benign and malignant), determines which variables differ between the two groups, and finally evaluates the classification of the developed model predictions To be executed. All combined results from 100 spectral measurements are collected and saved per group for statistical analysis. Since we have not confirmed whether the derived parameters follow a normalized distribution, each of the six parameters (ρ, α, δ1 , δ2 , β1) obtained from our combined results In order to evaluate the significance of the difference between the two groups (normal / benign tissue vs. malignant lesions) with respect to β2 ), the Kohriogorov-Srnirnov2 sample test was selected. Discriminant function analysis (DFA) is then applied to the identified diagnostic critical parameters to build up a diagnostic algorithm for tissue classification. DFA determines the discriminant function line that maximizes the difference in data between groups and minimizes the difference between members of the same group. The performance of the diagnostic algorithm made by the DFA model to correctly predict the tissue condition lying on each parameter set derived from the reflectance spectrum (ie normal / benign vs. malignant) pops out one for the entire data set Estimated by an inhomogeneous method using the cross-validation method. In this method, one case is removed from the data set and the DFA-based algorithm is redeveloped and optimized using data for the remaining cases. An optimized algorithm is then used to classify the withheld spectrum. This process is repeated until all reserved cases (100 spectra / cases) have been classified. Sensitivity and disease-free misdiagnosis are calculated from the classification results using the following notation:
感度=%(真の正数−偽の負数)/真の正数
無病誤診=%(真の負数−偽の正数)/真の負数
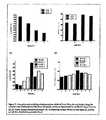
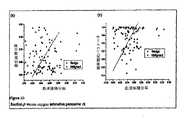
良性及び悪性のグループ間の6つの測定パラメータの意義の差を評価するために実行した統計分析の結果を表1にまとめている。
表に示したように、血液体積分率の平均値は良性病変(0.032 +−0.02)と比べて悪性病変(0.065 +−0.03)はより高い。酸素飽和パラメータの平均値は0.9(良性病変)から0.78(悪性病変)に低下される。散乱関係パラメータに関しては、mucosal層は、悪性病変の場合の0.048と0.91と比較して、上層に関して、正常/良性組織と悪性病変の間の意義ある変化は緩やかであり、良性病変の場合のδ1とβ1の平均値はそれぞれ0.077と0.97である。下層に関する散乱パラメータ(δ2とβ2)は正常/良性組織と悪性病変の間の最小量の違いを示す。βの値が大きければ大きいほど、散乱粒子粒径分布関数における、より小さいサイズ粒子の貢献がより高いことに注意されるべきである。したがって、β値における増大は散乱粒子平均サイズの減少を示す。Kolmogorov−Srnirnov2試料テストを使用した統計分析は、良性グループと比較して、悪性グループが、血液体積分率ρ(p=0.001<0.05)で重要な増大、酸素飽和パラメータα(p=0.022<0.05)で重要な低下及び粘液層の散乱体積分率δ1でかなりの減少があった。結果はまた、良性グループ(p=0.095<0.1)と比べて、悪性グループにおける粘液層(β1)のサイズ分布パラメータは緩やかな意義のある減少を示した。As shown in the table, the mean value of blood volume fraction is higher for malignant lesions (0.065 + -0.03) compared to benign lesions (0.032 + -0.02). The average value of the oxygen saturation parameter is reduced from 0.9 (benign lesion) to 0.78 (malignant lesion). Regarding scatter-related parameters, the mucosal layer has a modest change between normal / benign tissue and malignant lesions for the upper layer compared to 0.048 and 0.91 for malignant lesions, and benign lesions. In this case, the average values of δ1 and β1 are 0.077 and 0.97, respectively. The scattering parameters (δ2 and β2 ) for the lower layer indicate the minimum amount of difference between normal / benign tissue and malignant lesions. It should be noted that the larger the value of β, the higher the contribution of smaller size particles in the scattering particle size distribution function. Therefore, an increase in β value indicates a decrease in the average size of the scattering particles. Statistical analysis using the Kolmogorov-Srnirnov2 sample test shows that the malignant group has a significant increase in blood volume fraction ρ (p = 0.001 <0.05) compared to the benign group, the oxygen saturation parameter α (p = 0.022 <0.05), there was a significant decrease and a considerable decrease in the scatter volume fraction δ1 of the mucus layer. The results also showed a modest and significant decrease in the size distribution parameter of the mucus layer (β1 ) in the malignant group compared to the benign group (p = 0.095 <0.1).
私たちの研究で測定された悪性病変の血液量部分における重要な増大が腫瘍と癌組織が増加する微小血管と従って、増加する血液内容を示すという生物学的観測に一致したことに注意されるべきである。悪性病変における血液酸素投与のかなりの減少が一貫している。低酸素血症関連の変化は、癌の開発の間、起こっていて、組織代謝率における増大、tumoral微小循環のやや劣る品質と、そして、癌細胞の高い増殖速度に関係づけることができた。測定悪性病変で見つけられた散乱体積分率の有意減少は肺の癌病変に得る結果とBard他で大腸ポリープに得る結果と一致している。散乱体積分率のそのような減少のための説明は組織散乱過程の複雑な本質のためまだ不十分に理解されている。しかしながら、この減少がミトコンドリア量の減少に関連し、これは、後方への(反射率)方向の光散乱最も大きく貢献し、又は、増加するタンパク質と酵素内容による細胞質の屈折率の、変化に最もかなり貢献するのがわかった。正常/良性組織と比べて、サイズ分布パラメータ(β1)減少手段は悪性組織の散乱体粒度を平均的に増加させた。これは癌細胞には正常で良性細胞より大きい核があるという事実と一致している。 It is noted that the significant increase in the blood volume fraction of the malignant lesions measured in our study is consistent with the biological observation that tumors and cancerous tissue show increased blood content and therefore increased blood content Should. There is a consistent decrease in blood oxygenation in malignant lesions. Hypoxemia-related changes occurred during cancer development and could be related to an increase in tissue metabolic rate, a somewhat inferior quality of tumor microcirculation, and a high growth rate of cancer cells. The significant decrease in scatter volume fraction found in measured malignant lesions is consistent with the results obtained for lung cancer lesions and those obtained for large intestine polyps in Bard et al. The explanation for such a decrease in scatter volume fraction is still poorly understood due to the complex nature of the tissue scattering process. However, this decrease is associated with a decrease in mitochondrial mass, which contributes most to light scattering in the backward (reflectance) direction, or most changes to changes in the refractive index of the cytoplasm due to increasing protein and enzyme content. I found that it contributed considerably. Compared to normal / benign tissue, the size distribution parameter (β1) reducing means increased the scatterer particle size of malignant tissue on average. This is consistent with the fact that cancer cells have a larger nucleus than normal and benign cells.
上で説明されたモデルと曲線の当てはめを使用することで生体内で測定された100反射率スペクトルを分析することによって得られた結果は図に6〜10に示される。反射率スペクトルに関する例は2つの悪性病変(2つの非小細胞の病変)から生体内で測定した、そして、同じ患者からの2つの良性部位(1つの通常病変と1つの増生で散乱している病変)が図6aに示される。それからわかるように、測定反射率スペクトルは大きい強度差を有し、この違いは正反射信号の変化と内視鏡先端と異なった測定のための組織表面の間の距離に関連する。測定反射率に合うモデルの精度は開発された方法の正当性を示した。 The results obtained by analyzing the 100 reflectance spectrum measured in vivo using the model and curve fitting described above are shown in the figure as 6-10. Examples on reflectance spectra were measured in vivo from two malignant lesions (two non-small cell lesions) and scattered from two benign sites (one normal lesion and one augmentation) from the same patient The lesion) is shown in FIG. 6a. As can be seen, the measured reflectance spectrum has a large intensity difference, which is related to the change in specular signal and the distance between the endoscope tip and the tissue surface for different measurements. The accuracy of the model that fits the measured reflectivity shows the validity of the developed method.
真の組織拡散反射率スペクトル、Rtm(λ) そして、適当な結果を使用することで生体内の測定反射率スペクトルRm(λ)を修正することによって引き出される。修正された真の組織拡散反射率スペクトルRtm(λ)は図6(b)に示される。首尾よく正反射反射コンポーネントを取り外してある、そして、反射率強度は0と1(100パーセント)の間下がり、オリジナルの非修正のスペクトル、図6(a)のRm(λ)には、かなり任意の反射率強度が0〜350パーセントある。True tissue diffuse reflectance spectrum, Rtm (λ) and derived by modifying the measured reflectance spectrum Rm (λ) in vivo using appropriate results. The modified true tissue diffuse reflectance spectrum Rtm (λ) is shown in FIG. The specular reflective component has been successfully removed, and the reflectance intensity has dropped between 0 and 1 (100 percent), and the original unmodified spectrum, Rm (λ) in FIG. The reflectance intensity is 0 to 350 percent.
2つのものの分析から得られた適当な結果、良性、2つの悪性のスペクトルが図7にまとめられる。Appropriate results from the analysis of the two, benign and two malignant spectra are summarized in FIG.
正常/良性グループと悪性グループの両方のための修正された反射率スペクトル(Rtm)の平均は図8に示される。それは、正常/良性グループの平均した反射率スペクトルには測定波長域(470〜700nm)における悪性のグループより高い強度があるのを示す。600nmより高い波長には、この強度差はかなり大きい。さらに、正常又は良性グループスペクトル曲線では、550nmと580nmの周りの2つの血色素吸収谷が悪性のグループスペクトル曲線よりさらに大きくて、明白である。また、平均合わせパラメータ(ρ、α、δ1、β1、δ2、β2)と、2つのグループのためのそれらの標準偏差はまた、表1に示される。The average of the corrected reflectance spectra (Rtm ) for both normal / benign and malignant groups is shown in FIG. It shows that the average reflectance spectrum of the normal / benign group has a higher intensity than the malignant group in the measurement wavelength range (470-700 nm). For wavelengths higher than 600 nm, this intensity difference is quite large. Furthermore, in the normal or benign group spectral curve, two hemoglobin absorption valleys around 550 nm and 580 nm are even larger and more apparent than the malignant group spectral curve. Also, the averaged parameters (ρ, α, δ1 , β1 , δ2 , β2 ) and their standard deviations for the two groups are also shown in Table 1.
図9は、測定された100の良性及び悪性の反射率スペクトルの分析から得た気管支粘膜層(上層)パラメータ(ρ、α、δ、λ、β1)の値を示す。FIG. 9 shows the values of bronchial mucosal layer (upper layer) parameters (ρ, α, δ, λ, β1 ) obtained from analysis of 100 measured benign and malignant reflectance spectra.
DFAから得られた結果は、2つのグループの間の区別に、3つのパラメータ(ρ、α、δ1)が重要であることを示した。図10aは、血液体積分率(ρ)と散乱体積分率(δ1)の測定に基づく分類結果を示し、図10bは、血液体積分率と組織酸素飽和パラメータの測定に基づく分類結果を示す。図に示されるように、私たちは、わずかなオーバラップで、良性及び悪性グループに関して容易に2つのドメイン空間を特定できる。1つをはじき出す交差妥当化法を用いるDFA結果は、私たちが81パーセントの感度と、83パーセントの無病誤診でもって、測定病変を正常/良性と、悪性に区別できることを示す。したがって、ブロードバンド尋問放射によって組織6に照射し、組織6からの帰還放射を非接触内視鏡プローブ3で収集し、帰還放射からのと拡散反射率スペクトルを測定し、かつ、上で説明されたステップを使用して測定拡散反射率スペクトルを分析することを含む本発明の方法は、改良された感度及び無病誤診を伴って組織を良性か悪性として分類することを可能にする結果を生じる。The results obtained from DFA showed that the three parameters (ρ, α, δ1 ) are important for the distinction between the two groups. FIG. 10a shows a classification result based on measurement of blood volume fraction (ρ) and scatter volume fraction (δ1 ), and FIG. 10b shows a classification result based on measurement of blood volume fraction and tissue oxygen saturation parameter. . As shown in the figure, we can easily identify the two domain spaces for the benign and malignant groups with little overlap. DFA results using cross-validation methods that pop out one show that we can distinguish measured lesions from normal / benign and malignant with 81 percent sensitivity and 83 percent disease-free misdiagnosis. Therefore, the tissue 6 is irradiated by broadband interrogation radiation, the return radiation from the tissue 6 is collected by the non-contact
上で説明された方法をまた、以前に説明された画像診断療法の1つ以上に関連して使用できることに注意されたい。Note that the methods described above can also be used in connection with one or more of the previously described diagnostic imaging therapies.
本発明の好適実施例を示し説明したが、当業者が発明の技術的思想とその範囲から逸脱することなく、本発明の様々な実施の態様を工夫できることが理解される。 While the preferred embodiment of the invention has been illustrated and described, it will be appreciated that those skilled in the art can devise various embodiments of the invention without departing from the spirit and scope of the invention.
Claims (69)
Translated fromJapanese帰還放射を発生させるためにブロードビーム放射で組織を照らし;
非接触プローブで前記帰還放射の反射率スペクトルを測定し;
前記測定反射率スペクトルから拡散反射率スペクトルを決定し;
2層組織モデルに関する前記拡散反射率スペクトルを一次元光輸送モデリングにより分析し;
前記分析拡散反射率スペクトルから組織の少なくとも1つの光学特性を抽出し;
前記少なくとも1つの光学特性から前記組織の生理的及び形態的情報を引き出す;
ことを含んでなる方法。A method for obtaining physiological and morphological information of a tissue from a diffuse reflectance spectrum comprising:
Illuminate the tissue with broad beam radiation to generate return radiation;
Measuring the reflectance spectrum of the return radiation with a non-contact probe;
Determining a diffuse reflectance spectrum from the measured reflectance spectrum;
Analyzing the diffuse reflectance spectrum for a two-layer tissue model by one-dimensional light transport modeling;
Extracting at least one optical property of tissue from the analytical diffuse reflectance spectrum;
Deriving physiological and morphological information of the tissue from the at least one optical property;
A method comprising that.
ブロードビーム放射で組織を照らして帰還放射を生成する手段と;
前記帰還放射を測定する非接触プローブ手段と;
前記帰還放射の反射率スペクトルを測定する手段手段と;
前記測定反射率スペクトルから拡散反射率スペクトルを決定する手段と;
一次元光輸送モデリングによって2層組織モデルの前記拡散反射率スペクトルを分析する手段と;
前記分析拡散反射率スペクトルから前記組織の少なくとも1つの光学特性を抽出する手段と;
前記少なくとも1つの光学特性から組織の生理的及び形態的情報を引き出す手段と;
を含む装置。A device for obtaining information about tissue physiology and tissue morphology from diffuse reflectance spectra:
Means for illuminating the tissue with broad beam radiation to produce return radiation;
Non-contact probe means for measuring the return radiation;
Means for measuring the reflectance spectrum of the return radiation;
Means for determining a diffuse reflectance spectrum from the measured reflectance spectrum;
Means for analyzing the diffuse reflectance spectrum of a two-layer tissue model by one-dimensional light transport modeling;
Means for extracting at least one optical property of the tissue from the analytical diffuse reflectance spectrum;
Means for deriving tissue physiological and morphological information from the at least one optical property;
Including the device.
非接触プローブと;
組織を照らしかつ帰還放射を生成するために前記プローブの遠位端でブロードビーム尋問放射を生成する光源と;
前記帰還放射をキャプチャするように結合された検出システムと;
前記検出システムに結合された処理装置であって、前記帰還放射の反射率スペクトルを測定し、前記測定反射率スペクトルの拡散反射率スペクトルを決定し、かつ、前記拡散反射率スペクトルに基づいて組織を良性あるいは悪性のいずれかに分類する処理装置と;
を含んでなる装置。A device that measures quantitative information related to changes in tissue cancer:
A non-contact probe;
A light source that generates broad-beam interrogation radiation at the distal end of the probe to illuminate tissue and generate return radiation;
A detection system coupled to capture the return radiation;
A processing device coupled to the detection system, measuring a reflectance spectrum of the feedback radiation, determining a diffuse reflectance spectrum of the measured reflectance spectrum, and determining a tissue based on the diffuse reflectance spectrum. A processing device that classifies either benign or malignant;
A device comprising:
Applications Claiming Priority (2)
| Application Number | Priority Date | Filing Date | Title |
|---|---|---|---|
| US64600505P | 2005-01-21 | 2005-01-21 | |
| PCT/CA2006/000080WO2006076810A1 (en) | 2005-01-21 | 2006-01-20 | Method And Apparatus For Measuring Cancerous Changes From Reflectance Spectral Measurements Obtained During Endoscopic Imaging |
Publications (1)
| Publication Number | Publication Date |
|---|---|
| JP2008528064Atrue JP2008528064A (en) | 2008-07-31 |
Family
ID=36691955
Family Applications (1)
| Application Number | Title | Priority Date | Filing Date |
|---|---|---|---|
| JP2007551525APendingJP2008528064A (en) | 2005-01-21 | 2006-01-20 | Method and apparatus for measuring cancer changes from reflectance spectrum measurements obtained during endoscopic imaging |
Country Status (7)
| Country | Link |
|---|---|
| US (1) | US20090270702A1 (en) |
| EP (1) | EP1845837B1 (en) |
| JP (1) | JP2008528064A (en) |
| CN (1) | CN101137322B (en) |
| CA (1) | CA2595213C (en) |
| ES (1) | ES2425568T3 (en) |
| WO (1) | WO2006076810A1 (en) |
Cited By (4)
| Publication number | Priority date | Publication date | Assignee | Title |
|---|---|---|---|---|
| JP2011215035A (en)* | 2010-03-31 | 2011-10-27 | Fujifilm Corp | Optical tomographic information generator, light intensity distribution calculation method, and light intensity distribution calculation program |
| JP2014511999A (en)* | 2011-03-24 | 2014-05-19 | エラスムス ユニバーシティ メディカル センター ロッテルダム | Method for determining the absorption coefficient of opaque media |
| JP2015508317A (en)* | 2012-01-27 | 2015-03-19 | コーニンクレッカ フィリップス エヌ ヴェ | Equipment for optical analysis of related tissues |
| JP2015136397A (en)* | 2014-01-20 | 2015-07-30 | 富士フイルム株式会社 | Endoscope system processor device, endoscope system, operating method of endoscope system processor device, operating method of endoscope system |
Families Citing this family (91)
| Publication number | Priority date | Publication date | Assignee | Title |
|---|---|---|---|---|
| US20100022414A1 (en) | 2008-07-18 | 2010-01-28 | Raindance Technologies, Inc. | Droplet Libraries |
| AU2004220870B2 (en) | 2003-03-18 | 2011-03-17 | The General Hospital Corporation | Polarized light devices and methods |
| WO2005027730A2 (en) | 2003-09-19 | 2005-03-31 | The General Hospital Corporation | Fluorescence polarization imaging devices and methods |
| WO2007014188A2 (en) | 2005-07-25 | 2007-02-01 | Duke University | Methods, systems, and computer program products for optimization of probes for spectroscopic measurement in turbid media |
| US20100137163A1 (en) | 2006-01-11 | 2010-06-03 | Link Darren R | Microfluidic Devices and Methods of Use in The Formation and Control of Nanoreactors |
| US9562837B2 (en) | 2006-05-11 | 2017-02-07 | Raindance Technologies, Inc. | Systems for handling microfludic droplets |
| ATE540750T1 (en) | 2006-05-11 | 2012-01-15 | Raindance Technologies Inc | MICROFLUIDIC DEVICE AND METHOD |
| US8045263B2 (en) | 2006-06-30 | 2011-10-25 | The General Hospital Corporation | Device and method for wide-field and high resolution imaging of tissue |
| EP2083687A1 (en)* | 2006-09-29 | 2009-08-05 | Ottawa Health Research Institute | Correlation technique for analysis of clinical condition |
| CN100464692C (en)* | 2006-11-09 | 2009-03-04 | 上海理工大学 | A device for obtaining microscopic tomography and spectrum of tissue and its application method |
| JP5208430B2 (en) | 2007-01-31 | 2013-06-12 | オリンパス株式会社 | Fluorescence observation device for living tissue |
| EP2174118A4 (en)* | 2007-02-01 | 2015-06-24 | Ls Biopath Inc | Optical system for identification and characterization of abnormal tissue and cells |
| WO2008097559A2 (en) | 2007-02-06 | 2008-08-14 | Brandeis University | Manipulation of fluids and reactions in microfluidic systems |
| WO2008130623A1 (en) | 2007-04-19 | 2008-10-30 | Brandeis University | Manipulation of fluids, fluid components and reactions in microfluidic systems |
| US20090076396A1 (en)* | 2007-09-17 | 2009-03-19 | The General Hospital Corporation | Optical wavelength range for high contrast imaging of cancer |
| US9820655B2 (en) | 2007-09-28 | 2017-11-21 | Duke University | Systems and methods for spectral analysis of a tissue mass using an instrument, an optical probe, and a Monte Carlo or a diffusion algorithm |
| WO2009052607A1 (en)* | 2007-10-24 | 2009-04-30 | Perceptronix Medical Inc. | Method and apparatus for microvascular oxygenation imaging |
| US8280471B2 (en) | 2007-12-12 | 2012-10-02 | Kimberly-Clark Worldwide, Inc. | Fiber optic based detection of autofluorescent bacterial pathogens |
| US8280496B2 (en)* | 2007-12-13 | 2012-10-02 | Boston Scientific Scimed, Inc. | Extended spectral sensitivity endoscope system and method of using the same |
| US20110046894A1 (en)* | 2008-01-24 | 2011-02-24 | Jakob Stamnes | Method for discriminating between malignant and benign tissue lesions |
| DK2255173T3 (en)* | 2008-03-18 | 2018-03-26 | Balter Inc | OPTICAL PROCEDURE FOR DETERMINING MORPHOLOGICAL PARAMETERS AND PHYSIOLOGICAL PROPERTIES OF SKIN TISSUE |
| US20110105865A1 (en)* | 2008-04-24 | 2011-05-05 | Duke University | Diffuse reflectance spectroscopy device for quantifying tissue absorption and scattering |
| CA3194784A1 (en) | 2008-05-20 | 2009-11-26 | University Health Network | Device and method for fluorescence-based imaging and monitoring |
| US20090289200A1 (en)* | 2008-05-22 | 2009-11-26 | Fujifilm Corporation | Fluorescent image obtainment method and apparatus, fluorescence endoscope, and excitation-light unit |
| US12038438B2 (en) | 2008-07-18 | 2024-07-16 | Bio-Rad Laboratories, Inc. | Enzyme quantification |
| RU2444976C2 (en)* | 2008-07-21 | 2012-03-20 | Сергей Александрович Габриэль | Device for endoscopic measurements of tumour formations of gastro-intestinal tract |
| EP3415235A1 (en) | 2009-03-23 | 2018-12-19 | Raindance Technologies Inc. | Manipulation of microfluidic droplets |
| EP2432542A4 (en)* | 2009-05-20 | 2013-07-03 | Cornova Inc | Systems and methods for analysis and treatment of a body lumen |
| US9091637B2 (en) | 2009-12-04 | 2015-07-28 | Duke University | Smart fiber optic sensors systems and methods for quantitative optical spectroscopy |
| CA2789425C (en) | 2010-02-12 | 2020-04-28 | Raindance Technologies, Inc. | Digital analyte analysis with polymerase error correction |
| US9399797B2 (en) | 2010-02-12 | 2016-07-26 | Raindance Technologies, Inc. | Digital analyte analysis |
| US9654745B2 (en) | 2010-03-17 | 2017-05-16 | Haishan Zeng | Rapid multi-spectral imaging methods and apparatus and applications for cancer detection and localization |
| JP5484977B2 (en)* | 2010-03-23 | 2014-05-07 | オリンパス株式会社 | Fluorescence observation equipment |
| DE202010010932U1 (en)* | 2010-04-19 | 2011-10-07 | Witec Wissenschaftliche Instrumente Und Technologie Gmbh | Device for imaging a sample surface |
| DE102010024732A1 (en) | 2010-06-23 | 2011-12-29 | Siemens Aktiengesellschaft | Method and device for detecting tumor-bearing tissue in the gastrointestinal tract with the aid of an endocapsule |
| CN101975769A (en)* | 2010-09-17 | 2011-02-16 | 福建师范大学 | Human tissue autofluorescence detection system based on excitation of light sources with different wavelength |
| JP5222934B2 (en)* | 2010-12-21 | 2013-06-26 | 富士フイルム株式会社 | Endoscope system, processor device for endoscope system, and method for operating endoscope system |
| US9063074B2 (en)* | 2010-12-30 | 2015-06-23 | Empire Technology Development Llc | Analyzing tissue morphology in three dimensions |
| CN102103079B (en)* | 2010-12-31 | 2013-12-11 | 聚光科技(杭州)股份有限公司 | Spectrum analysis method |
| WO2012098520A1 (en) | 2011-01-20 | 2012-07-26 | Tel Hashomer Medical Research Infrastructure And Services Ltd. | Methods and devices for providing information useful in the diagnosis of abnormalities of the gastrointestinal tract |
| GB2487940B (en) | 2011-02-09 | 2014-12-17 | Tel Hashomer Medical Res Infrastructure & Services Ltd | Methods and devices suitable for imaging blood-containing tissue |
| EP2675819B1 (en) | 2011-02-18 | 2020-04-08 | Bio-Rad Laboratories, Inc. | Compositions and methods for molecular labeling |
| WO2012144696A1 (en)* | 2011-04-20 | 2012-10-26 | Im Co., Ltd. | Prostate cancer diagnosis device using fractal dimension value |
| EP2714970B1 (en) | 2011-06-02 | 2017-04-19 | Raindance Technologies, Inc. | Enzyme quantification |
| JP6093761B2 (en)* | 2011-06-28 | 2017-03-08 | コーニンクレッカ フィリップス エヌ ヴェKoninklijke Philips N.V. | Apparatus for optical analysis of relevant tissue samples |
| JP5419931B2 (en)* | 2011-07-04 | 2014-02-19 | 富士フイルム株式会社 | Endoscope system, light source device, and operation method of endoscope system |
| JP5502812B2 (en)* | 2011-07-14 | 2014-05-28 | 富士フイルム株式会社 | Biological information acquisition system and method of operating biological information acquisition system |
| US8658430B2 (en) | 2011-07-20 | 2014-02-25 | Raindance Technologies, Inc. | Manipulating droplet size |
| AU2012298253A1 (en)* | 2011-08-21 | 2014-04-03 | Mobile O.C.T Ltd. | Attaching optical coherence tomography systems onto smartphones |
| EP2754378B1 (en)* | 2011-09-05 | 2023-03-22 | FUJIFILM Corporation | ENDOSCOPE SYSTEM and PROCESSOR DEVICE THEREOF |
| WO2013121331A1 (en)* | 2012-02-13 | 2013-08-22 | Koninklijke Philips N.V. | Photonic probe apparatus with integrated tissue marking facility |
| CN104662409B (en)* | 2012-10-26 | 2018-01-19 | 索尼公司 | Light focusing unit, concentrating method and Systems for optical inspection |
| EP2929327B1 (en) | 2012-12-05 | 2019-08-14 | Perimeter Medical Imaging, Inc. | System and method for wide field oct imaging |
| US20140213909A1 (en)* | 2013-01-31 | 2014-07-31 | Xerox Corporation | Control-based inversion for estimating a biological parameter vector for a biophysics model from diffused reflectance data |
| WO2014124531A1 (en)* | 2013-02-14 | 2014-08-21 | British Columbia Cancer Agency Branch | Integrated spectral probe for raman, reflectance and fluorescence spectral measurements |
| US10722292B2 (en)* | 2013-05-31 | 2020-07-28 | Covidien Lp | Surgical device with an end-effector assembly and system for monitoring of tissue during a surgical procedure |
| US8912512B1 (en) | 2013-06-26 | 2014-12-16 | General Electric Company | System and method for optical biopsy tissue characterization |
| TWI509346B (en)* | 2013-06-27 | 2015-11-21 | Etron Technology Inc | Calibration device applied to an image capture system and related calibration method thereof |
| US11901041B2 (en) | 2013-10-04 | 2024-02-13 | Bio-Rad Laboratories, Inc. | Digital analysis of nucleic acid modification |
| US9944977B2 (en) | 2013-12-12 | 2018-04-17 | Raindance Technologies, Inc. | Distinguishing rare variations in a nucleic acid sequence from a sample |
| GB201400415D0 (en)* | 2014-01-10 | 2014-02-26 | Isis Innovation | Bronchial gas analyser |
| JP5977772B2 (en)* | 2014-02-06 | 2016-08-24 | 富士フイルム株式会社 | Endoscope system, processor device for endoscope system, method for operating endoscope system, method for operating processor device |
| EP3127467B1 (en)* | 2014-03-31 | 2018-03-28 | Fujifilm Corporation | Medical image processing device, operation method thereof, and endoscope system |
| JP6769949B2 (en) | 2014-07-24 | 2020-10-14 | ユニバーシティー ヘルス ネットワーク | Data collection and analysis for diagnostic purposes |
| JP6243364B2 (en)* | 2015-01-26 | 2017-12-06 | 富士フイルム株式会社 | Endoscope processor, operation method, and control program |
| DE102015102595B4 (en)* | 2015-02-24 | 2021-01-28 | Karl Storz Se & Co. Kg | Optical observation arrangement, camera, endoscope or exoscope and endoscope or exoscope system |
| JP6634548B2 (en)* | 2015-03-06 | 2020-01-22 | インペリアル・カレッジ・イノベ−ションズ・リミテッドImperial College Innovations Limited | Probe deployment device |
| EP3282928B1 (en)* | 2015-04-17 | 2019-08-07 | Koninklijke Philips N.V. | Detection of anisotropic biological tissue |
| EP3329832A1 (en)* | 2015-07-30 | 2018-06-06 | Olympus Corporation | Camera head for endoscopes, and endoscopic device provided with same |
| KR102345905B1 (en)* | 2015-07-30 | 2021-12-30 | 삼성전자주식회사 | Apparatus and method for repeatability verification of spectroscope, apparatus for spectrum data analysis |
| EP3396308B1 (en)* | 2015-12-25 | 2022-02-02 | Keyence Corporation | Confocal displacement meter |
| US10393652B2 (en)* | 2016-01-26 | 2019-08-27 | Tubitak | Portable optical apparatus for diffuse reflectance spectroscopy |
| CN105996999B (en)* | 2016-05-19 | 2024-01-30 | 南京航空航天大学 | Method and system for measuring sample depth-resolved attenuation coefficient based on OCT |
| WO2019014767A1 (en) | 2017-07-18 | 2019-01-24 | Perimeter Medical Imaging, Inc. | Sample container for stabilizing and aligning excised biological tissue samples for ex vivo analysis |
| US11925308B2 (en)* | 2018-02-16 | 2024-03-12 | Board Of Supervisors Of Louisiana State University And Agricultural And Mechanical College | Ionizing radiation-free dental imaging by near-infrared fluorescence, and related systems |
| ES3015552T3 (en) | 2018-07-16 | 2025-05-06 | Bbi Medical Innovations Llc | Perfusion and oxygenation measurement |
| CN109464115A (en)* | 2018-12-17 | 2019-03-15 | 深圳开立生物医疗科技股份有限公司 | A kind of endoscopic system and a kind of AI diagnostic device |
| WO2020227571A1 (en)* | 2019-05-07 | 2020-11-12 | President And Fellows Of Harvard College | In situ measurement of absolute concentrations by normalized raman imaging |
| KR102758761B1 (en) | 2019-05-08 | 2025-01-21 | 삼성전자주식회사 | Optical sensor, Apparatus and Method for estimating bio-information |
| US11294062B2 (en)* | 2019-06-20 | 2022-04-05 | Cilag Gmbh International | Dynamic range using a monochrome image sensor for hyperspectral and fluorescence imaging and topology laser mapping |
| EP4003139A1 (en)* | 2019-07-30 | 2022-06-01 | The Regents Of The University Of California | Diagnostic tool based health management system |
| CN110946553B (en)* | 2019-11-18 | 2022-06-07 | 天津大学 | Hyperspectral image-based in-vivo tissue optical parameter measurement device and method |
| EP4087474A4 (en) | 2020-01-08 | 2024-03-06 | Activ Surgical, Inc. | Laser speckle force feedback estimation |
| IL295510B2 (en)* | 2020-02-14 | 2025-08-01 | Activ Surgical Inc | Systems and methods for processing laser spot signals |
| CN111281313A (en)* | 2020-03-05 | 2020-06-16 | 中国科学院长春光学精密机械与物理研究所 | On-line focus detection system based on Raman spectrum |
| CN111840810B (en)* | 2020-07-27 | 2022-03-01 | 哈尔滨工业大学 | Biological tissue temperature field passive regulation and control method based on optical phase change nanoparticles |
| EP3964822B1 (en)* | 2020-09-03 | 2023-11-01 | Erbe Elektromedizin GmbH | Device and method for tissue analysis |
| DE102020127424B4 (en) | 2020-10-19 | 2023-01-19 | Erbe Elektromedizin Gmbh | test facility |
| CN112807096A (en)* | 2021-02-23 | 2021-05-18 | 珠海维尔康生物科技有限公司 | Novel optical design fluorescent camera and imaging method thereof |
| CN114366037B (en)* | 2022-02-16 | 2023-11-24 | 北京理工大学 | Spectral diagnosis system for guiding in brain cancer operation and working method thereof |
| CN115839920B (en)* | 2022-11-29 | 2025-04-25 | 中国工程物理研究院激光聚变研究中心 | Spectral endoscopy detection method and corresponding detection device |
Family Cites Families (11)
| Publication number | Priority date | Publication date | Assignee | Title |
|---|---|---|---|---|
| US4661706A (en)* | 1985-02-25 | 1987-04-28 | Spectra-Tech Inc. | Blocker device for eliminating specular reflectance from a diffuse reflection spectrum |
| US7742972B2 (en)* | 1999-07-21 | 2010-06-22 | Longitude Llc | Enhanced parimutuel wagering |
| US7475046B1 (en)* | 1999-10-05 | 2009-01-06 | Bloomberg L.P. | Electronic trading system supporting anonymous negotiation and indications of interest |
| US20040044287A1 (en)* | 2000-03-31 | 2004-03-04 | Wei-Chiang Lin | Identification of human tissue using optical spectroscopy |
| US6826424B1 (en)* | 2000-12-19 | 2004-11-30 | Haishan Zeng | Methods and apparatus for fluorescence and reflectance imaging and spectroscopy and for contemporaneous measurements of electromagnetic radiation with multiple measuring devices |
| US7217266B2 (en)* | 2001-05-30 | 2007-05-15 | Anderson R Rox | Apparatus and method for laser treatment with spectroscopic feedback |
| AU2002337666A1 (en)* | 2001-08-03 | 2003-02-17 | Joseph A. Izatt | Aspects of basic oct engine technologies for high speed optical coherence tomography and light source and other improvements in oct |
| US7697975B2 (en)* | 2003-06-03 | 2010-04-13 | British Colombia Cancer Agency | Methods and apparatus for fluorescence imaging using multiple excitation-emission pairs and simultaneous multi-channel image detection |
| SE0301718L (en)* | 2003-06-13 | 2005-02-11 | Atos Medical Ab | Method and device for determining body condition |
| US20070118455A1 (en)* | 2005-11-18 | 2007-05-24 | Albert William J | System and method for directed request for quote |
| US20070282734A1 (en)* | 2006-05-02 | 2007-12-06 | Huntley Russell G | Method and system for the integration of fixed income financial instruments |
- 2006
- 2006-01-20JPJP2007551525Apatent/JP2008528064A/enactivePending
- 2006-01-20ESES06704094Tpatent/ES2425568T3/enactiveActive
- 2006-01-20CACA2595213Apatent/CA2595213C/ennot_activeExpired - Fee Related
- 2006-01-20CNCN200680007471.9Apatent/CN101137322B/ennot_activeExpired - Fee Related
- 2006-01-20WOPCT/CA2006/000080patent/WO2006076810A1/enactiveApplication Filing
- 2006-01-20USUS11/722,822patent/US20090270702A1/ennot_activeAbandoned
- 2006-01-20EPEP06704094.9Apatent/EP1845837B1/ennot_activeNot-in-force
Cited By (4)
| Publication number | Priority date | Publication date | Assignee | Title |
|---|---|---|---|---|
| JP2011215035A (en)* | 2010-03-31 | 2011-10-27 | Fujifilm Corp | Optical tomographic information generator, light intensity distribution calculation method, and light intensity distribution calculation program |
| JP2014511999A (en)* | 2011-03-24 | 2014-05-19 | エラスムス ユニバーシティ メディカル センター ロッテルダム | Method for determining the absorption coefficient of opaque media |
| JP2015508317A (en)* | 2012-01-27 | 2015-03-19 | コーニンクレッカ フィリップス エヌ ヴェ | Equipment for optical analysis of related tissues |
| JP2015136397A (en)* | 2014-01-20 | 2015-07-30 | 富士フイルム株式会社 | Endoscope system processor device, endoscope system, operating method of endoscope system processor device, operating method of endoscope system |
Also Published As
| Publication number | Publication date |
|---|---|
| EP1845837B1 (en) | 2013-05-29 |
| EP1845837A1 (en) | 2007-10-24 |
| CA2595213C (en) | 2014-10-28 |
| CN101137322A (en) | 2008-03-05 |
| CA2595213A1 (en) | 2006-07-27 |
| CN101137322B (en) | 2014-05-28 |
| WO2006076810A1 (en) | 2006-07-27 |
| US20090270702A1 (en) | 2009-10-29 |
| ES2425568T3 (en) | 2013-10-16 |
| EP1845837A4 (en) | 2011-03-02 |
Similar Documents
| Publication | Publication Date | Title |
|---|---|---|
| CA2595213C (en) | Method and apparatus for measuring cancerous changes from reflectance spectral measurements obtained during endoscopic imaging | |
| CA2658811C (en) | Multi modal spectroscopy | |
| US6377841B1 (en) | Tumor demarcation using optical spectroscopy | |
| US20120245473A1 (en) | Multimodal spectroscopic systems and methods for classifying biological tissue | |
| JP6159743B2 (en) | Instrument for determining tissue characteristics | |
| US9788728B2 (en) | Endoscopic polarized multispectral light scattering scanning method | |
| WO2009052607A1 (en) | Method and apparatus for microvascular oxygenation imaging | |
| US20120302892A1 (en) | Portable optical fiber probe-based spectroscopic scanner for rapid cancer diagnosis | |
| AU9693298A (en) | Method for measuring tissue morphology | |
| JP2008522761A (en) | Systems and methods for normalized fluorescence or bioluminescence imaging | |
| JP2013517485A (en) | Apparatus and method for characterizing lung tissue by Raman spectroscopy | |
| WO2008144760A1 (en) | Optical methods to intraoperatively detect positive prostate and kidney cancer margins | |
| US20100249607A1 (en) | Quantitative spectroscopic imaging | |
| Fawzy et al. | In vivo assessment and evaluation of lung tissue morphologic and physiological changes from<? xpp qa?> non-contact endoscopic reflectance spectroscopy<? xpp qa?> for improving lung cancer detection | |
| WO2013103475A2 (en) | Portable optical fiber probe-based spectroscopic scanner for rapid cancer diagnosis | |
| Perelman | Optical diagnostic technology based on light scattering spectroscopy for early cancer detection | |
| US20100330611A1 (en) | Multimodal Spectroscopic Systems and Methods for Classifying Biological Tissue | |
| Jerjes et al. | Assessment of bony resection margins in oral cancer using elastic scattering spectroscopy: a study on archival material | |
| Georgakoudi et al. | Characterization of dysplastic tissue morphology and biochemistry in Barrett's esophagus using diffuse reflectance and light scattering spectroscopy | |
| Sokolov et al. | Polarized reflectance spectroscopy for pre-cancer detection | |
| Hanchanale et al. | Raman spectroscopy and its urological applications | |
| WO2012127378A1 (en) | An apparatus for optical analysis of an associated tissue sample | |
| McGee | Non-invasive detection of oral cancer using reflectance and fluorescence spectroscopy | |
| AU781659B2 (en) | Method for measuring tissue morphology | |
| Kim | Development of a real time trimodal spectroscopy diagnostic tool for Barrett's esophagus |