JP2007265317A - Visitor number prediction method and system - Google Patents
Visitor number prediction method and systemDownload PDFInfo
- Publication number
- JP2007265317A JP2007265317AJP2006092775AJP2006092775AJP2007265317AJP 2007265317 AJP2007265317 AJP 2007265317AJP 2006092775 AJP2006092775 AJP 2006092775AJP 2006092775 AJP2006092775 AJP 2006092775AJP 2007265317 AJP2007265317 AJP 2007265317A
- Authority
- JP
- Japan
- Prior art keywords
- ticket
- sales
- visit
- tickets
- information
- Prior art date
- Legal status (The legal status is an assumption and is not a legal conclusion. Google has not performed a legal analysis and makes no representation as to the accuracy of the status listed.)
- Withdrawn
Links
Images


Landscapes
- Management, Administration, Business Operations System, And Electronic Commerce (AREA)
Abstract
Translated fromJapaneseDescription
Translated fromJapanese本発明はイベントへの来場人数予測方法およびシステムに関するものである。 The present invention relates to a method and system for predicting the number of visitors to an event.
行楽地の混雑予測をする方法として、例えば特許文献1のような技術がある。特許文献1では、公共の交通手段で行楽地に来場する切符の購入者の来場情報と、行楽地周辺の道路交通情報から、行楽地の来場者数と来場車両数を算出する。 For example, there is a technique as disclosed in
万博等のイベントにおいて、施設の管理および来場者に対するサービス提供の充実のために、予め来場人数を予測する必要性がある。特に、万博やバーゲンなどの来場日が限定されていないチケットに関しては、来場予測は困難である。 In events such as the Expo, there is a need to predict the number of visitors in advance in order to manage facilities and enhance the provision of services to visitors. In particular, it is difficult to predict the arrival of tickets such as expos and bargains that do not have a limited date of visit.
特許文献1では、公共の交通手段の切符購入者の発券情報と、行楽地周辺の道路交通情報から、来場者数と来場車両数を予測している。しかし、特許文献1の方法では、当日の来場予測をするには有効ではあるが、次の日、次の次の日など、複数の日の来場予測をすることは不可能である。 In
また、来場者数は、曜日は祝日平日等の日の区分、イベントによる特性(例えば、バーゲンのように初日に混む傾向があり、万博は初期と終期に混む傾向がある)および実際に売買されたチケットの数、特に売買されたが未使用であるチケットの数によって左右される。 In addition, the number of visitors is the day of the week, such as holidays and holidays, the characteristics of the event (for example, there is a tendency to be crowded on the first day like bargains, and the Expo tends to be crowded at the beginning and the end) Depends on the number of tickets sold, especially the number of tickets sold but unused.
本発明の目的は、上記課題を解決し、イベントの会期中の来場予測を可能とするシステム及び方法を提供することにある。 An object of the present invention is to provide a system and a method that can solve the above-described problems and make it possible to predict a visit during an event.
上記課題を解決する本発明の来場予測システムでは、来場日が限定されていないイベントでの来場者数を予測するシステムであって、過去の類似イベントの実績をデータ処理可能とするために、来場パターンに加工して、蓄積する手段と、入場券の販売情報を販売地域別、販売時期別、年令区分別などに分類して、販売管理サーバに蓄積する手段と、イベント会場の出入り口である入退場ゲートに設置された改札装置で入場した入場券を読取り、ネットワーク介して接続された入退場管理サーバに、入場実績を蓄積する手段と、前記入場券販売情報から入場実績情報の差分で得られる未使用券情報を蓄積する手段と、地域独自の平日/休日カレンダーを持つ、カレンダー情報に前述の来場パターン、未使用券情報を演算することにより、来場者予測データを算出するステップを備える。 The attendance prediction system of the present invention that solves the above problems is a system for predicting the number of visitors at an event where the visit date is not limited, and in order to be able to process data of past results of similar events, A means of processing and storing the information into patterns, a means of classifying sales information on admission tickets by sales region, sales time, age, etc., and storing them in the sales management server, and an entrance to the event venue The entrance ticket entered by the ticket gate installed at the entrance gate is read and stored in the entrance management server connected via the network. To store unused ticket information, and have a unique weekday / holiday calendar unique to the region. Comprising the step of calculating the prediction data.
本発明により、イベントの長期の来場予測において、精度の高い予測が可能となる。 According to the present invention, it is possible to predict with high accuracy in the long-term visit prediction of an event.
以下に、本発明の実施形態について図面を用いて詳細に説明する。
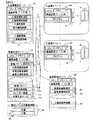
図1は、本実施形態の来場予測システムを構成するネットワーク構成図である。
本実施形態では、一例として、RFID(無線ICタグ)11を内蔵する入場券10を使用し、入場券1枚1枚が個別に管理されている状況を想定する。Embodiments of the present invention will be described below in detail with reference to the drawings.
FIG. 1 is a network configuration diagram constituting the attendance prediction system of the present embodiment.
In the present embodiment, as an example, a situation is assumed in which an
国内、海外を含め販売された入場券10の情報は、ネットワークやファイルなどのデータ記録媒体を介して、販売管理サーバ300に集められ、販売実績取得部307にて、開催前の前および開催期間中などの販売時期、1回のみ入場可能な普通入場券、会期中何度でも入場できる全期間入場などの券種や大人、中人、小人、シニアなどの年令区分、販売された地域の情報に分類した上で、図3(c)に示す入場券販売情報312として、販売実績格納部308により、蓄積される。 Information on
また、開催期間中は、来場者は、RFID(無線ICタグ)11を内蔵する入場券10をイベント会場の出入り口に設置された改札装置400のリーダ20に読取をさせることにより、入退場管理サーバ100が、その入場券10が入場可能な入場券であるかを確認し、会場内への入場が可能となる。その場合には、予め入退場管理サーバに、入場可能な入場券の情報(入場券IDなど)を入場券情報データベースに格納しておき、リーダ20が読取った入場券IDが、入場券情報データベースに有るか否かを検索する処理を行う。 In addition, during the holding period, the visitor makes the
改札装置400で入場処理された入場券の情報は、ネットワークを介して接続されている入退場管理サーバ100に送られ、図4(a)に示す入場実績情報113に蓄積される。 The information on the entrance ticket processed by the
来場予測サーバ200では、来場予測サーバ200に接続された類似イベントの実績情報36記憶装置に格納されている類似イベントの実績情報(来場)データベースおよび類似イベントの実績情報(入場券)データベースを入場券販売情報312と同じように、販売時期別、年令区分別、販売地域別に分類し、来場パターン処理部207で販売時期別、年令区分別、販売地域別に分類し、その結果を来場パターン212として登録する。詳細は図8のフローにて説明する。類似イベントの実績情報(来場)データベースと、類似イベントの実績情報(入場券)データベースは、それぞれ過去のイベントの来場者数履歴と入場券の販売数および実際に入場した数を格納したデータベースである。 In the
また、来場予測サーバ200には、来場者動向に影響を与える要因である、開催地域の大手企業の休日、県民の日、運動会、大規模イベントなどの情報を格納した図4(b)に示すカレンダー情報214を事前に作成し、登録しておく。 Also, the
来場予測にカレンダー情報が必要である理由は、平日か休日かの区分は、イベントの来場者数に影響を与えるからである。例えば平日は、シニアの来場率が高く、中人、小人といった会社または学校に通う人の来場比率が低い。休日にはファミリー形態での来場多いので、中人、小人の来場比率が高くなる一方、混雑をさけるためかシニアの来場率が下がるという傾向がある。 The reason why the calendar information is necessary for the visit prediction is that the classification of weekdays or holidays affects the number of visitors of the event. For example, on weekdays, the attendance rate for seniors is high, and the attendance rate for people attending a company or school, such as juniors and children, is low. There are many families visiting on holidays, so the percentage of middle-aged and dwarf visitors increases, while the senior attendance rate tends to decrease to avoid congestion.
さらに、地元の大手企業などが、平日が工場休業日、休日が工場稼動日である場合には、来場者数に大きな変動が発生する。また、学校においても、運動会、保護者参観などにより、平日が振替で休みになる場合などにも、同様の状況が発生する。これらの傾向を反映するために、一般のカレンダーに加えて、地域のカレンダーも計算に加味することとしている。 Furthermore, if a major local company or the like has a factory holiday on weekdays and a factory operation day on a weekday, the number of visitors will fluctuate. In schools, the same situation occurs when a weekday is a day off due to a sports day or guardian visit. In order to reflect these trends, in addition to the general calendar, local calendars are also included in the calculation.
図2は、本実施形態の全体概要を示す。来場予測の大まかな流れとしては、次のとおりとなる。来場予測サーバ200には、事前に類似イベントの実績情報(来場)、類似イベントの実績情報(入場券)およびカレンダー情報214を登録しておく。 FIG. 2 shows an overall outline of the present embodiment. The general flow of visit prediction is as follows. In the
また、来場の予測に大きな影響を与えるのは入場券に関する情報であり、現時点での未使用券を把握することが重要である。未使用入場券の数は、販売管理サーバ300に蓄積された入場券販売情報312から入退場管理サーバ100の入場実績情報113を引き算することにより算出する。その他に、販売時期、年令区分、販売地域などに細かく分類して算出し、来場管理サーバ200に未使用券情報213として蓄積する。 Moreover, it is important to grasp the unused ticket at the present time, which is information about the admission ticket that greatly affects the visit prediction. The number of unused admission tickets is calculated by subtracting the
来場予測にあたり、カレンダー情報214、地域別来場パターン217および平日/休日来場パターン218により、平日と休日の来場パターンを按分して、日毎の来場パターン219の算出する。詳細は図9において説明する。 In the visit prediction, the
上記のようにして算出した、基本来場パターン216、未使用券情報213、日毎の来場パターン219のデータより、来場者予測データ215を算出する。
また、会期が一定期間経過し(または一定期間毎に)、入退場管理サーバ100に新たに蓄積された入場実績情報113と、類似イベントの実績情報36を元に、来場パターンの補正を行って、来場予測データを算出しなおして、予測精度を高めている。また、類似イベントの実績情報36も、一定期間毎に更新をする。 In addition, after the period of time has passed (or for each predetermined period), the visit pattern is corrected based on the
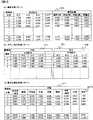
図3は、本実施形態におけるデータ構造を示すものである。
(a)の類似イベントの実績情報(来場)30は、来場者数に関する情報であり、縦軸に開幕後の日数、横軸は、その日の平日または休日の区分と、来場人数の合計、入場者数を入場券の年令区分別、販売時期別、販売地域別に分類したものを想定している。
(b)の類似イベントの実績情報(入場券)33は、販売時期毎の入場券の販売数および、当該入場券での実際の入場者数をまとめたものである。縦軸に、販売時期、横軸に入場券の販売数と入場者数を年令区分別に整理されている。図面には、年令区分別のみを記載しているが、1回のみ入場可能な普通入場券、会期中何度でも入場できる全期間入場などの券種で分類してもよい。FIG. 3 shows a data structure in the present embodiment.
(A) Similar event performance information (visit) 30 is information on the number of visitors, the vertical axis is the number of days after the opening, the horizontal axis is the weekday or holiday classification of the day, the total number of visitors, and admission It is assumed that the number of passengers is categorized by age category, sales period, and sales area.
The result information (admission ticket) 33 of similar events in (b) is a summary of the number of tickets sold for each sales period and the actual number of visitors on the ticket. The vertical axis shows the sales period, and the horizontal axis shows the number of tickets sold and the number of visitors by age category. Although the drawings show only by age category, they may be classified according to ticket types such as ordinary admission tickets that can be entered only once or full-time admission that can be entered as many times as possible during the exhibition.
なお、本発明は類似イベントの会期日数と、来場予測を行うイベントの会期日数がほぼ同日であることを想定して実施例の説明をする。 It should be noted that the present invention will be described by assuming that the number of days for similar events and the number of days for events for which visit prediction is performed are substantially the same.
類似イベントの来場予測を行うイベントで、会期日数に相違がある場合は、来場予測を行うイベントの開催日数にあわせ、類似イベントのデータを間引いたり、同じデータの繰り返しで調整する。例えば、来場予測対象のイベントが185日間で、類似イベントが200日間であった場合、類似イベントのデータを10日で1日の割合で省略したり、逆に類似イベントが170日であった場合には、10日に1日の割で、同じ日のデータを2日間登録するなどして期間の調整を行う。 If there is a difference in the number of days of the event in the event that predicts the arrival of a similar event, the data of the similar event is thinned out or adjusted by repeating the same data according to the number of days of the event for which the event is predicted. For example, if the event to be predicted for visit is 185 days and the similar event is 200 days, the data of the similar event is omitted at the rate of 1 day in 10 days, or conversely, the similar event is 170 days For example, the period is adjusted by registering data for the same day for two days every ten days.
規模の大きなイベントにおいては、開催の約1年半前から入場券の販売を始め、半年単位に区切った、前売1期、前売2期、前売3期と開催期の4つの販売時期を持っている。入場券の販売時期により、購入先や意図が異なり、それにより来場傾向や入場券を購入しても、来場しないという死蔵パターンに違いが出てくる特徴がある。 For large-scale events, sales of admission tickets began approximately one and a half years before the event, and were divided into semi-annual units, with four sales periods: the first sales period, the second sales period, and the third sales period. Yes. Depending on the time of sale of the admission ticket, the purchase destination and intent differ, and as a result, there is a difference in the tendency to visit and the death pattern of not visiting even if the admission ticket is purchased.
前売1期は、開幕の1年半前から販売されるが、割引率が最も高く設定されている。このため、購入層の多くは、地元を中心とした企業、大手旅行会社やそのイベントに関心の高い個人が中心となっている。また、前売3期は、開幕直前で、イベントの内容なども具体的になっている事から、駆け込み購入の個人が主体となっている。 The first sale is sold from one and a half years before the opening, but it has the highest discount rate. For this reason, many buyers are mainly local companies, major travel agencies, and individuals who are interested in the event. In the 3rd period of the pre-sale, the contents of the event are just before the opening of the season, so the individual who made the last purchase is the main subject.
そのため、前売1期は、開催までの期間は長いものの販売数に対する来場率は高くなっている。前売3期も、個人が具体的に来るスケジュールを想定した後に購入しているので、来場率は高くなる。その反面、前売1期と前売3期にはさまれた前売2期は、販売数も多くは無いが、購入の動機がはっきりしていないせいか、未使用のままで終わる率が一番高くなっている。 For this reason, in the first period of advance sales, although the period until the event is long, the attendance rate for the number of sales is high. The pre-sale period is also high, because the purchase is made after assuming a specific schedule for the individual to come. On the other hand, the number of units sold in the first two seasons, which is between the first and third seasons, is not high. It has become.
このように、販売時期によって使用される傾向に違いがあり、これを分けて考えることにより、より細かな予測が可能となってくる。 In this way, there is a difference in the tendency to be used depending on the sales period, and by considering this separately, more detailed prediction becomes possible.
(c)の入場券販売情報312は、縦軸に販売時期を持ち、地域別、券種別、年令区分別の入場券の販売数を持つデータベースである。 The admission
図4も、本実施形態におけるデータ構造を示すものである。 FIG. 4 also shows the data structure in this embodiment.
(a)の入場実績情報113は、毎日、入退場ゲートに設置された改札装置400より得られる入場券10の情報を、販売時期、地域、券種、年令区分などで分類したもので、1日単位での集計結果となっている。合計1131は、当日購入入場者者と当日以前に購入した者の入場者の合わせた数である。 (A)
(b)のカレンダー情報214では、縦軸に来場予測を行うイベントの開催日、横軸に、標準カレンダーと地域別の平日/休日情報とその地域における影響度数を、地域毎に持つものである。 In the
影響度数は、その日が、どのくらいの割合で平日/休日来場パターンに影響を与えるかであり、休日/平日が変更となる対象人数の4倍したものを地域全体の人口で割って求める。これは、1名が休みになる事によって、祖父母、子供などの同行により、1家族4名程度での来場につながると想定した任意の数値であり、地域や時代により数値の見直しは必要である。 The influence frequency is the percentage of the day that affects the weekday / holiday visit pattern. The influence frequency is obtained by dividing the number of people to be changed by holidays / weekdays by the population of the entire region. This is an arbitrary number that assumes that one person will take a day off and that the grandparents, children, etc. will be accompanied by about four members of the family, and the number needs to be revised depending on the region and time. .
図5も、本実施形態におけるデータ構造を示すものである。 FIG. 5 also shows the data structure in this embodiment.
(a)の基本来場パターン216では、前述の類似イベントの実績情報(来場)30と同じように、縦軸に開幕後の日数、横軸に、入場券の年令区分別、販売時期別の入場者数を総入場者数で定数化した値を持つ。算出の方法は図8で説明する。 In the
(b)の平日/休日来場パターン218では、前述の基本来場パターン216と同じようであるが、縦軸の開幕後の日数であったものを週数として、週毎の集計を行っている。横軸には、平日と休日に分け、それぞれに年令区分別、販売時期別の値を持つ。 The weekday /
(c)の販売地域別来場パターン217では、縦軸に開幕後の日数を、横軸には地域別の値を持つ。 In (c) the sales pattern by
図6も、本実施形態におけるデータ構造を示すものである。 FIG. 6 also shows the data structure in this embodiment.
(a)の入場券死蔵パターン220は、販売しても使用されずに閉会を迎える死蔵券の割合を販売時期と入場券の年令区分の表にしたものである。類似イベントの実績情報(入場券)33をから算出するが、詳細は図8で説明する。 The admission
(b)の未使用券情報213は、販売されたが、まだ来場していない入場券の数を未使用券数、およびその未使用券数から使われないままに会期末を迎える死蔵券数を除いた来場見込券数を、販売時期毎に、販売地域、券種、年令区分などに整理したものである。算出方法については、図10で説明する。 The
(c)未使用券情報(当日比率)は、年令区分毎に、当日入場券を購入した人がその日に入場した比率を示している。来場予測を行うイベントの開幕日から前日までの全体入場者数の累積値に占める当日入場券での入場者数累積値の割合である。算出方法については、図10のステップ92に示す。 (c) Unused ticket information (percentage on the day) shows the percentage of people who purchased the same day admission ticket for each age category. This is the ratio of the cumulative value of the number of visitors on the day's admission ticket to the cumulative value of the total number of visitors from the opening day to the previous day of the event for which the visit is predicted. The calculation method is shown in
図7も、本実施形態におけるデータ構造を示すものである。 FIG. 7 also shows the data structure in this embodiment.
(a)日毎の来場パターン219は、来場予測を行う日(来場予測開始日からイベントの閉幕日等)毎の年令区分別、販売時期別の来場パターンをまとめたものである。算出方法については、図9で説明する。 (A)
(b)来場予測データ215は、本発明で算出することを目的とする来場予測のデータである。縦軸には、予測対象日から会期の最終日までの月日、横軸には、予測を行いたい分類をセットする。本実施例では、年令区分で予測を行った。なお他の分類の例としては、販売時期、販売地域などがある。 (B) Visit
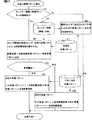
以下、本実施形態における来場予測システムでの処理内容について図に基づいて説明する。図8は、本実施形態の来場パターン抽出・登録のフロー図である。 Hereinafter, the processing content in the visit prediction system in this embodiment is demonstrated based on figures. FIG. 8 is a flowchart of visit pattern extraction / registration of this embodiment.
予め、図3(a)の類似イベント実績情報(来場)データベースが登録されている状態である。ステップ71において、来場パターン216、販売地域別来場パターン217、平日/休日来場パターン218の算出をする。 The similar event record information (visit) database in FIG. 3A is registered in advance. In
類似イベントの実績情報(来場)30の入場実績数31を用いて、「入場実績数31/総入場者数32×1,000」を算出する。算出した値は、入場実績値31の分類により、それぞれ基本来場パターン216、販売地域別来場パターン217の該当欄に登録する。 Using the number 31 of the actual results of the similar event (visit) 30, “the number 31 of actual events / the total number of visitors 32 × 1,000” is calculated. The calculated values are registered in the corresponding fields of the
ステップ71の処理を、図面の数値を用いて具体的に説明する。(a)類似イベントの実績情報(来場)30において、年令区分が大人で、開幕後日数が1日目の入場実績数31は、17,895人となっており、そのイベントの総入場者数は、15,000,000人となっている。従って、来場パターンの値は、「17,895/15,000,000×1,000= 1.193」となり、(c)基本来場パターン216の該当欄である年令区分が大人で、開幕後日数が1日目の欄に、1.193を登録する。 The processing of
上記の演算を、他の年令区分、販売時期、開幕後日数で繰り返し算出し、基本来場パターンの作成を行う。 The above calculation is repeated for other age categories, sales dates, and days after opening, to create a basic visit pattern.
同様の演算を行い、類似イベントの実績情報(来場)30の販売地域別データから販売地域別来場パターン217を作成する。 The same calculation is performed, and the sales
平日/休日パターン218は、(前述の来場パターンは開幕後日数で作成していたが)週単位で作成する。類似イベントの実績情報(来場)30の1週間分、例えば1日目から7日目の平日/休日区分を参照して、平日と休日それぞれの1日当りの平日/休日来場パターンの値を算出する。 The weekday /
例えば、開幕後1週目は、2日目と3日目の2日が休日となっているので、年令区分が大人の場合では、前述の計算を行い、2日目は1.384、3日目は1.399が得られる。これから、「(1.384+1.399) / 2= 1.392」が得られ、開幕後第1週の休日、年令区分が大人の欄に、1.392が登録される。 For example, in the first week after the opening, since the second day and the third day are holidays, the above calculation is performed when the age division is an adult, and the second day is 1.384. On the third day, 1.399 is obtained. From this, “(1.384 + 1.399) /2=1.392” is obtained, and 1.392 is registered in the column for adults in the holiday and age category for the first week after the opening.
このように来場傾向に違いの出る販売時期、販売地域、年令区分、平日/休日などの区分に分けて来場パターンを作成することによって、詳細な分析を可能としている。 In this way, detailed analysis is possible by creating a visit pattern by dividing into sales time, sales area, age category, weekday / holiday, etc., where the visit tendency differs.
ステップ72において、入場券死蔵パターンの算出を行う。図3(b)類似イベントの実績情報(入場券)33より、販売数欄34の販売数と入場者数欄35の入場者数を用いて、次の式で計算する。「(販売数−入場者数)/販売数=入場券死蔵パターン」で、算出する。 In
来場予測において、入場券の当該イベントで売買された入場券の未使用券数でも予測は可能であるが、大きなイベントにおいては、会期終了時に未使用のままで終わる死蔵券は、100万枚近くにのぼり、この死蔵券の数を考慮しなければ、会期末に行くほど、来場予測の誤差が拡大して行くことになる。 In visit prediction, it is possible to predict the number of unused tickets sold and sold at the event concerned, but in large events, nearly 1 million deathly tickets that remain unused at the end of the exhibition period However, if you do not consider the number of stored tickets, the more you go to the end of the meeting, the greater the error in predicting your visit.
具体的な、入場券死蔵パターンの算出は、前売1期の大人のケースでは、販売数5,154,799、入場者数4,938,298であるので、(5,154,799−4,938,298)/5,154,799=0.042である。この計算結果を図5の(c)入場券死蔵パターンの前売1期、年令区分が大人の欄に0.042→4.2%を登録する。これを、販売時期別、年令区分別の分繰り返し計算を行い、登録する。 Specifically, the admission ticket death pattern is calculated as (5,154,799-4,5) because the number of sales is 5,154,799 and the number of visitors is 4,938,298 in the case of adults in the first season of advance sales. 938,298) /5,154,799=0.042. In this calculation result, 0.042 → 4.2% is registered in the column of (c) advance ticket 1st generation of the admission ticket death pattern, age category of adult in FIG. This is repeated for each sales period and age category, and is registered.
類似イベントの実績情報(来場)30や類似イベントの実績情報(入場券)33は、1件だけでなく、複数あると思われるので、その場合には、過去に開催した時期や時代背景、規模、開催地域などを考慮し、ターゲットイベントに応じた重み付けを行って1つの表に集約してもよい。 Similar event results information (visit) 30 and similar event results information (admission ticket) 33 are considered to be not only one, but multiple, so in that case, the time, background, and scale of the event held in the past In consideration of the hosting area, weighting according to the target event may be performed and aggregated in one table.
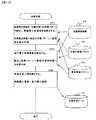
次に、日毎の来場パターン219の算出方法を、図9のフローで説明する。 Next, a method for calculating the
日毎の来場パターン219は、前述したように、一般のカレンダーでは、平日であっても、地元大手企業の工場休業の日や学校の夏休みなど通常の来場パターンと異なる傾向を吸収するために、補正を行うものである。 As mentioned above, the
算出のあたり、カレンダー情報214の地域カレンダー欄2141にデータが登録されているかを確認する。(S81)地域カレンダー欄2141に値が登録されていない場合(S81のNo)には、標準カレンダー欄2142に設定された、「平日」か「休日」を読取って、平日/休日来場パターン218の該当する値を、日毎の来場パターン219として登録する。ここにおいて、平日/休日来場パターン218は週毎であるので、開幕後の週数が同じで、平日/休日の区分が同じ場合は、同じパターン値を登録する。 When calculating, it is confirmed whether or not data is registered in the
以下、具体的な算出例を示す。図4(b)のカレンダー情報214で、3月2日(開幕後2日目)の場合、地域カレンダー欄2141には、値が登録されていないため、標準カレンダー欄2142を参照し、「休日」であることから、平日/休日来場パターン218の開幕後週数が1週目の休日欄2182の値を、日毎の来場パターン219として、登録する。(S86)
また、地域カレンダー欄2141に値か登録されている場合(S81のYes)、該当する地域の影響度数欄2144と販売地域別来場パターン217を読取り、全体影響度数を算出する。(S82)「影響度数×当該地域来場パターン/地域来場パターン合計2171=全体影響度数」
次に、地域カレンダー2141の変更欄2143と平日/休日来場パターン218の平日欄2181と休日欄2182の来場パターンを読取り、日毎の来場パターン219を算出する。変更欄2143が「休日」の場合(S83の休日)は、「平日来場パターン×(1−全体影響度数)+休日来場パターン×全体影響度数=日毎の来場パターン(S84)
変更欄2143が「平日」の場合(S83の平日)は、平日来場パターン×全体影響度数+休日来場パターン×(1−全体影響度数)=日毎の来場パターン(S85)
例えば、3月3日を例として計算してみる。図4(b)カレンダー情報214の中部地域では、本来休日であるが、工場勤務日などの関係で平日扱いとなっており、変更欄2143は「平日」、その影響度数欄2144は0.25となっている場合である。Hereinafter, a specific calculation example will be shown. In the
If a value is registered in the regional calendar column 2141 (Yes in S81), the
Next, the visit pattern of the
When the
For example, let us calculate March 3 as an example. In FIG. 4 (b), the central area of the
また、図5(b)地域別来場パターン217の開幕後3日目の値より、中部地方の来場パターンが1.195であり、その日の合計欄2171が2.058であるので、全体影響度は、「0.25×1.195/2.058=0.145」となる。 In addition, from the value of the third day after the opening of the
次に、図5(a)平日/休日来場パターン218より、開幕後週数が第1週目で、平日の年令区分が大人の来場パターン、1.193と、休日の大人の来場パターン、1.384を得る。カレンダー情報214の変更欄2143は、「平日」であるので、日毎の来場パターンは、「1.193×0.145+1.392×(1−0.145)=1.363」となる。これを、他の年令区分、販売時期などの来場パターンで演算し、日毎の来場パターン219として登録する。 Next, from the weekday /
また、年令区分、販売時期の来場パターンを、予測を行う日から閉幕日までの縦軸方向に合計を求め、会期残日数合計欄に登録する。例えば、年令区分が大人の場合に、会期残日数合計は、157.320であるが、この値は年令区分が大人の列の数字を加算する、すなわち、3/3の1.363、3/4の1.384…3/31の9.125を加算した値である。 In addition, for the age category and the visit pattern of the sales period, the total is calculated in the vertical axis direction from the forecast date to the closing date, and is registered in the total number of days remaining in the session. For example, if the age group is an adult, the total remaining days of the session is 157.320, but this value is calculated by adding the numbers in the column where the age group is an adult, that is, 1/3 of 1.363 and 3/4. 1.384 ... 3/31 9.125 is added.
図10は、未使用券情報213の算出のフローである。ステップ91において、販売管理サーバ300内の入場券販売情報312の販売枚数から、入退場管理サーバ100の入場実績情報113の入場枚数を引き算することにより、未使用券数を算出する。未使用券数は、次の式である。「販売枚数−入場枚数=未使用入場券数」
具体的な算出例は、図3(c)入場券販売情報312、図4(a)入場実績情報113の前売1期、中部地方、普通入場券、大人の場合では、販売枚数が3,976,559枚で、入場実績の累計が、2,315,659枚となっているので、未使用券数は、「3,976,559 − 2,315,659=777,220」となり、図6(b)未使用券情報213の該当欄にセットする。これを、他の販売時期別、地域別、券種・年令区分別に算出し、未使用券情報213に登録する。(S91)
続いて、この未使用券の内、会期終了時までに来場すると思われる来場見込券数の算出を次の式で行う。これは、未使用券数から会期終了時まで使用されない死蔵券数を除いたものである。大きなイベントでは、死蔵券の数が100万枚近くに上り、会期末が近づくにつれ、この死蔵券数が来場予測の誤差を拡大する要素となってくる。算出式は、「販売券数×(1−入場券死蔵パターン)−入場枚数累計=来場見込券数」である。これを、未使用券数と同様に販売時期別、年令区分別に算出し、未使用券情報213に登録する。(S92)
中部地方の前売1期、普通入場券、大人の例で計算すると、図3(c)入場券販売情報312より、販売枚数は、3,092,879枚、図5(c)入場券死蔵パターン220より、入場券死蔵パターンは4.2%、図4(a)入場実績情報113より、入場枚数の累積が2,315,659であるので、「3,092,879×(1−0.042)−2,315,659=647,319」が求められるので、図6(a)未使用券情報213の来場見込券数欄2132に登録する。また、当日の入場者の内、入場券を当日購入、当日入場した数を、その日の入場者数総数で割ったものを当日券比率2133として、未使用券情報213の中に蓄積しておく。「当日購入当日入場数/当日の入場者数合計=当日券比率」
図4(a)入場実績情報113から、合計欄1131の累計欄、年令区分が大人の入場者数合計は9,894,187、当日購入当日入場者欄1132の大人は2,127,250であるので、「9,894,187/2,127,250=0.215」となるので、図6(c)未使用券情報213の当日比率欄2133の大人の欄に登録する。当日券比率は、イベント毎に傾向が異なるため、過去の類似イベントでの実績情報は使用せず、来場予測をおこなうイベントの開幕から、前日までの累積値で算出している。FIG. 10 is a flowchart for calculating the
A specific calculation example is as follows. In the case of FIG. 3 (c) admission
Subsequently, the number of tickets expected to be visited by the end of the session is calculated from the unused tickets by the following formula. This is the number of unused tickets that is not used until the end of the session. In a large event, the number of banknotes rises to nearly 1 million, and as the end of the session approaches, the number of banknotes becomes a factor that increases the error in predicting visits. The calculation formula is “number of sales tickets × (1−admission ticket death pattern) −total number of entrance tickets = number of expected visit tickets”. Similar to the number of unused tickets, this is calculated for each sales period and age category, and is registered in the
In the case of the Chubu region's advance sales, ordinary admission tickets, and adults, the number of sales is 3,092,879 from the admission
From FIG. 4 (a), the total number of visitors in the
以上の処理により、来場予測データの算出が出来るようになる。図11にその来場予測データの算出を行うフロー図を示す。来場予測にあたっては、日毎の来場パターンには、年令区分別、販売時期別で来場パターンを登録しているが、図11に示すフローは、年令区分別による来場予測を行う例である。販売時期別で来場パターンを登録する場合も、同様な処理を行う。 The visit prediction data can be calculated by the above processing. FIG. 11 shows a flowchart for calculating the visit prediction data. In the visit prediction, the visit pattern is registered for each age category and sales period in the daily visit pattern, but the flow shown in FIG. 11 is an example of performing visit prediction by age category. The same process is performed when registering visit patterns by sales period.
ステップ101において、まず、前売券など来場日以前に入場券を購入した人の来場者数である事前購入来場者数を次の式で算出する。図7(a)日毎の来場パターン219の年令区分欄2191の来場パターンと会期残日数合計値2192と図6(b)未使用券情報の来場見込券数合計2133を用いて算出する。「来場見込券数合計×該当日来場パターン/会期残日数合計値」
具体的には、来場見込券数、大人の合計2,163,594、3月3日の大人の来場パターン1.363、大人の会期残日数合計値157.320を用いて計算すると、「2,163,594×1.363/157.320=18,745」となり、図7(c)来場予測データ215の事前購入者欄2151の3月3日の大人に登録する。以下、他の年令区分と月日で計算を繰り返す。In step 101, first, the number of pre-purchased visitors, which is the number of visitors who purchased an admission ticket before the visit date such as an advance ticket, is calculated by the following formula. FIG. 7 (a) is calculated using the visit pattern in the
Specifically, it is calculated using the number of tickets expected to visit, the total number of adults 2,163,594, the March 3rd adult visit pattern 1.363, and the total number of remaining days for adults 157.320. , 163,594 × 1.363 / 157.320 = 18,745 ”, and is registered as an adult on March 3 in the
ステップ102において、当日購入来場者数2152を算出する。当日購入来場者数は、図7(a)日毎の来場パターン219の年令区分欄2191の来場パターンと(c)来場予測データ215の最終来場者総数2154、図6(c)未使用券情報の当日比率2133を用いて計算する。 In
最終来場者総数とは、イベントの会期が終了した時点での来場者数の総合計である。従って、会期途中で、来場予測を行っている場合は、予測を行っている日の前日までの入場実績累計と、予測を行っている当日以降の来場予測累計を合計したものを指す。 The total number of visitors is the total number of visitors at the end of the event. Therefore, when the visit prediction is performed in the middle of the exhibition period, it indicates the sum of the total attendance record up to the day before the day of the prediction and the total visit prediction after the day of the prediction.
最終来場者総数2154は、最初の予測処理時にはデータが無いので、来場目標値を設定して計算を行う。「当該日来場パターン×最終来場者総数×当日券比率/1,000」で、求める。また、来場予測データを算出するにあたり、n回目の予測を立てるのに、n−1回目の予測で算出した最終来場者総数2154を用いて算出する。 Since there is no data at the time of the first prediction process, the final total number of visitors 2154 is calculated by setting a target visit value. It is calculated by “the day visit pattern × the final total number of visitors × the day ticket ratio / 1,000”. In calculating the visit prediction data, the final visitor total number 2154 calculated in the (n−1) th prediction is used to make the nth prediction.
具体的には、3月3日の大人の来場パターン1.363、最終来場者総数20,000,000、年令区分が大人の当日比率0.215を用いて計算すると、「1.363×20,000,000×0.215/1,000=5,861」となり、図7(c)来場予測データ215の当日購入者欄2152の3月3日の大人に登録する。以下、他の年令区分と合計を月日の分、計算を繰り返す。 Specifically, when calculating using the March 3 adult visit pattern 1.363, the final total number of visitors 20,000,000, and the age division of the adult day ratio 0.215, “1.363 × 20,000,000 × 0.215 / 1,000 = 5,861 ”, and registered as an adult on March 3 in the same day purchaser column 2152 of the
ステップ103において、上記で求めた事前購入入場者数と当日購入入場者数を合計し、来場予測欄2153に登録する。来場予測数は、「事前購入来場者数+当日購入来場者数」で算出する。具体的には、3月3日の場合、事前購入者2151の小計値23,949、当日購入者2152の小計値、7,778で計算すると、「23,949+7,778=31,727」この計算を閉幕日まで繰り返し、今後の日毎の来場者数予測を算出すると共に、今後の来場者数の合計値と現時点までの入場実績と加算を行うことにより、このイベントにおける最終来場者総数2154を得ることが出来る。 In step 103, the number of pre-purchased visitors and the number of visitors purchased on the day are totaled and registered in the visit prediction column 2153. The predicted number of visitors is calculated by “the number of visitors purchased in advance + the number of visitors purchased on the day”. Specifically, in the case of March 3, when calculating with the subtotal value 23,949 of the
この処理は、サーバ上での処理であるため、随時実行可能であるが、本実施形態では、1日1回実施するものと想定している。 Since this process is a process on the server, it can be executed at any time. In the present embodiment, it is assumed that the process is executed once a day.
本発明は、RFIDチケットを利用した来場予測をする分野に適応可能である。 The present invention can be applied to the field of performing visit prediction using an RFID ticket.
10…入場券
11…RFID(無線ICタグ)
20…リーダ
30…類似イベントの実績情報(来場)
31…入場実績数
32…総入場者数
33…類似イベントの実績情報(入場券)
34…販売数欄
35…入場者数欄
36…類似イベントの実績情報
100…入退場管理サーバ
113…入場実績情報
1131…合計欄
1132…当日購入当日入場者欄
200…来場予測サーバ
207…来場パターン処理部
212…来場パターン
213…未使用券情報
2131…未使用券数欄
2132…来場見込券数欄
2133…当日比率
214…カレンダー情報
2141…地域カレンダー欄
2142…標準カレンダー欄
2143…変更欄
2144…影響度数欄
215…来場予測情報
2151…事前購入者欄
2152…当日購入者欄
2153…来場予測欄
2154…最終来場者総数
216…基本来場パターン
217…地域別来場パターン
218…平日/休日来場パターン
2181…平日欄
2182…休日欄
219…日毎の来場パターン
2191…年令区分欄
2192…会期残日数合計値
220…入場券死蔵パターン
300…販売管理サーバ
307…販売実績取得部
308…販売実績格納部
312…入場券販売情報
400…改札装置10 ...
20 ...
31 ... Number of visitors 32 ... Total number of
34 ...
Claims (2)
Translated fromJapanese前記入場数Bを過去のイベントの総入場数で除して、開幕後日数毎に基本来場パターン値を算出し、
前記過去のイベントの入場数B及びチケット販売数から、販売されたチケットのうち、未使用であるチケットの割合を示す入場券死蔵パターンを算出し、
前記入退場管理サーバから、前記入場数Aを受信し、
前記販売管理サーバから、前記チケット販売数を受信し、
受信した前記チケット販売数から前記入場数Aを差し引き、未使用券数を算出し、
前記チケット販売数に、1から前記入場券死蔵パターンを引いた値を掛けた値から前記入場数Aを差し引くことにより、前記会期中のイベントに来場する可能性のある来場見込券数を算出し、
前記来場見込券数に前記基本来場パターン値を掛けることにより、開幕後日数毎に、当該会期中のイベントの来場見込数を算出することを特徴とする来場人数予想方法。Connected to the entrance / exit management server that stores the number of entrances A of the event during the exhibition period and the sales management server that stores the number of ticket sales of the event, and stores the number of entrances B and the number of ticket sales for each day after the opening of the past event In the method for predicting the number of attendees for an event during the exhibition period in a visitor number prediction server having a storage device for storing performance information of similar events,
Divide the number of entrances B by the total number of past events, and calculate the basic visit pattern value every day after the opening,
From the number of entrances B and the number of tickets sold in the past event, an admission ticket storage pattern indicating the ratio of unused tickets among the sold tickets is calculated,
The entrance number A is received from the entrance / exit management server,
Receiving the ticket sales number from the sales management server;
Subtract the admission number A from the received ticket sales number to calculate the number of unused tickets,
By subtracting the number of entrances A from the value obtained by multiplying the number of tickets sold by 1 minus the entrance ticket death pattern, the number of tickets expected to be attended at the event during the exhibition period is calculated. ,
A method for predicting the number of visitors, wherein the expected number of visitors for an event during the exhibition period is calculated for each day after the opening by multiplying the number of expected visitors by the basic visit pattern value.
前記入退場管理サーバから前記入場数Aを受信し、前記販売管理サーバから前記チケット販売数を受信する受信手段と、
前記入場数Bを過去のイベントの総入場数で除して、開幕後日数毎に基本来場パターン値を算出し、
前記過去のイベントの入場数B及びチケット販売数から、販売されたチケットのうち、未使用であるチケットの割合を示す入場券死蔵パターンを算出し、
受信した前記チケット販売数から前記入場数Aを差し引き、未使用券数を算出し、
前記チケット販売数に、1から前記入場券死蔵パターンを引いた値を掛けた値から前記入場数Aを差し引くことにより、前記会期中のイベントに来場する可能性のある来場見込券数を算出し、
前記来場見込券数に前記基本来場パターン値を掛けることにより、開幕後日数毎に、当該会期中のイベントの来場見込数を算出する算出手段とを具備することを特徴とする来場人数予測サーバConnected to the entrance / exit management server that stores the number of entrances A of the event during the exhibition period and the sales management server that stores the number of ticket sales of the event, and stores the number of entrances B and the number of ticket sales for each day after the opening of the past event In the visitor number prediction server having a storage device for storing the performance information of similar events to be performed,
Receiving means for receiving the number of entrances A from the entrance / exit management server and receiving the number of ticket sales from the sales management server;
Divide the number of entrances B by the total number of past events, and calculate the basic visit pattern value every day after the opening,
From the number of entrances B and the number of tickets sold in the past event, an admission ticket mortality pattern indicating the proportion of tickets that are not used among the sold tickets is calculated,
Subtract the admission number A from the received ticket sales, calculate the number of unused tickets,
By subtracting the number of entrances A from the value obtained by multiplying the number of tickets sold by 1 minus the entrance ticket death pattern, the number of tickets expected to be attended at the event during the session is calculated. ,
A visitor number prediction server comprising: a calculation means for calculating the expected number of attendances for an event during the exhibition period for each day after the opening by multiplying the expected attendance ticket number by the basic attendance pattern value
Priority Applications (1)
| Application Number | Priority Date | Filing Date | Title |
|---|---|---|---|
| JP2006092775AJP2007265317A (en) | 2006-03-30 | 2006-03-30 | Visitor number prediction method and system |
Applications Claiming Priority (1)
| Application Number | Priority Date | Filing Date | Title |
|---|---|---|---|
| JP2006092775AJP2007265317A (en) | 2006-03-30 | 2006-03-30 | Visitor number prediction method and system |
Publications (1)
| Publication Number | Publication Date |
|---|---|
| JP2007265317Atrue JP2007265317A (en) | 2007-10-11 |
Family
ID=38638202
Family Applications (1)
| Application Number | Title | Priority Date | Filing Date |
|---|---|---|---|
| JP2006092775AWithdrawnJP2007265317A (en) | 2006-03-30 | 2006-03-30 | Visitor number prediction method and system |
Country Status (1)
| Country | Link |
|---|---|
| JP (1) | JP2007265317A (en) |
Cited By (6)
| Publication number | Priority date | Publication date | Assignee | Title |
|---|---|---|---|---|
| JP2010152431A (en)* | 2008-12-24 | 2010-07-08 | Mitsubishi Electric Corp | Unauthorized access detection device, unauthorized access detection program, recording medium and unauthorized access detection method |
| WO2011024379A1 (en)* | 2009-08-24 | 2011-03-03 | ソフトバンクBb株式会社 | Population mobility estimation system, population mobility estimation method, and population mobility estimation program |
| WO2016151639A1 (en)* | 2015-03-26 | 2016-09-29 | 日本電気株式会社 | System for predicting number of people, method for predicting number of people, and program for predicting number of people |
| US10296833B2 (en) | 2015-09-04 | 2019-05-21 | International Business Machines Corporation | System and method for estimating missing attributes of future events |
| WO2024111080A1 (en)* | 2022-11-24 | 2024-05-30 | 三菱電機株式会社 | Information processing device, program, information processing system, and information processing method |
| CN119693038A (en)* | 2024-11-01 | 2025-03-25 | 陕西云上文旅科技有限公司 | An intelligent ticketing system |
- 2006
- 2006-03-30JPJP2006092775Apatent/JP2007265317A/ennot_activeWithdrawn
Cited By (8)
| Publication number | Priority date | Publication date | Assignee | Title |
|---|---|---|---|---|
| JP2010152431A (en)* | 2008-12-24 | 2010-07-08 | Mitsubishi Electric Corp | Unauthorized access detection device, unauthorized access detection program, recording medium and unauthorized access detection method |
| WO2011024379A1 (en)* | 2009-08-24 | 2011-03-03 | ソフトバンクBb株式会社 | Population mobility estimation system, population mobility estimation method, and population mobility estimation program |
| JP5513512B2 (en)* | 2009-08-24 | 2014-06-04 | ソフトバンクBb株式会社 | Liquid population estimation system, liquid population estimation method, and liquid population estimation program |
| WO2016151639A1 (en)* | 2015-03-26 | 2016-09-29 | 日本電気株式会社 | System for predicting number of people, method for predicting number of people, and program for predicting number of people |
| JPWO2016151639A1 (en)* | 2015-03-26 | 2017-10-26 | 日本電気株式会社 | Number prediction system, number prediction method and number prediction program |
| US10296833B2 (en) | 2015-09-04 | 2019-05-21 | International Business Machines Corporation | System and method for estimating missing attributes of future events |
| WO2024111080A1 (en)* | 2022-11-24 | 2024-05-30 | 三菱電機株式会社 | Information processing device, program, information processing system, and information processing method |
| CN119693038A (en)* | 2024-11-01 | 2025-03-25 | 陕西云上文旅科技有限公司 | An intelligent ticketing system |
Similar Documents
| Publication | Publication Date | Title |
|---|---|---|
| Garrow | Discrete choice modelling and air travel demand: theory and applications | |
| Trépanier et al. | Individual trip destination estimation in a transit smart card automated fare collection system | |
| Ball et al. | Total delay impact study: a comprehensive assessment of the costs and impacts of flight delay in the United States | |
| Kreindler et al. | Optimal Public Transportation Networks: Evidence from the World's Largest Bus Rapid Transit System in Jakarta | |
| Ball et al. | Total delay impact study | |
| US10019671B2 (en) | Learning mobility user choice and demand models from public transport fare collection data | |
| EP2667334A1 (en) | System and method for estimating a dynamic origin-destination matrix | |
| Zhao | The planning and analysis implications of automated data collection systems: rail transit OD matrix inference and path choice modeling examples | |
| Yang et al. | Modeling taxi demand and supply in New York city using large-scale taxi GPS data | |
| Patil et al. | Variation in the value of travel time savings and its impact on the benefits of managed lanes | |
| Liu et al. | Highways and firms' exports: Evidence from China | |
| Chen et al. | RFM Model and K‐Means Clustering Analysis of Transit Traveller Profiles: A Case Study | |
| CN114399099A (en) | A method and device for predicting passenger flow in urban rail transit section | |
| JP2007265317A (en) | Visitor number prediction method and system | |
| JP2021067982A (en) | Passenger flow prediction apparatus, passenger flow prediction method, and passenger flow prediction program | |
| Chen et al. | Understanding passenger travel choice behaviours under train delays in urban rail transits: a data-driven approach | |
| Yagi et al. | Joint models of home-based tour mode and destination choices: applications to a developing country | |
| van der Hurk | Passengers, information, and disruptions | |
| Hwang et al. | Game Day Traffic and Sports: Evidence From Yankee Stadium in the Bronx | |
| CN110245788B (en) | A short-term prediction method of subway passenger flow based on credit card data | |
| Yu et al. | A data-driven approach to manpower planning at US–Canada border crossings | |
| Ekici et al. | Testing the Forecasting Power of Statistical Models for Intercity Rail Passenger Flows in Turkey | |
| Gaduh et al. | Optimal Public Transportation Networks: Evidence from the World’s Largest Bus Rapid Transit System in Jakarta | |
| Kuo et al. | Modeling the spatial effects on demand estimation of Americans with disabilities act paratransit services | |
| Najafabadi | Designing an On-demand Dynamic Crowdshipping Model and Evaluating Its Ability to Serve Local Retail Delivery in New York City |
Legal Events
| Date | Code | Title | Description |
|---|---|---|---|
| A621 | Written request for application examination | Free format text:JAPANESE INTERMEDIATE CODE: A621 Effective date:20080806 | |
| A761 | Written withdrawal of application | Free format text:JAPANESE INTERMEDIATE CODE: A761 Effective date:20081119 |