JP2006520948A - Method, system and data structure for searching for 3D objects - Google Patents
Method, system and data structure for searching for 3D objectsDownload PDFInfo
- Publication number
- JP2006520948A JP2006520948AJP2006502981AJP2006502981AJP2006520948AJP 2006520948 AJP2006520948 AJP 2006520948AJP 2006502981 AJP2006502981 AJP 2006502981AJP 2006502981 AJP2006502981 AJP 2006502981AJP 2006520948 AJP2006520948 AJP 2006520948A
- Authority
- JP
- Japan
- Prior art keywords
- search
- dimensional
- skeleton
- feature vector
- query
- Prior art date
- Legal status (The legal status is an assumption and is not a legal conclusion. Google has not performed a legal analysis and makes no representation as to the accuracy of the status listed.)
- Granted
Links
Images


Classifications
- G—PHYSICS
- G06—COMPUTING OR CALCULATING; COUNTING
- G06F—ELECTRIC DIGITAL DATA PROCESSING
- G06F16/00—Information retrieval; Database structures therefor; File system structures therefor
- G—PHYSICS
- G06—COMPUTING OR CALCULATING; COUNTING
- G06V—IMAGE OR VIDEO RECOGNITION OR UNDERSTANDING
- G06V20/00—Scenes; Scene-specific elements
- G06V20/60—Type of objects
- G06V20/64—Three-dimensional objects
- G—PHYSICS
- G06—COMPUTING OR CALCULATING; COUNTING
- G06F—ELECTRIC DIGITAL DATA PROCESSING
- G06F16/00—Information retrieval; Database structures therefor; File system structures therefor
- G06F16/20—Information retrieval; Database structures therefor; File system structures therefor of structured data, e.g. relational data
- G06F16/24—Querying
- G06F16/248—Presentation of query results
- G—PHYSICS
- G06—COMPUTING OR CALCULATING; COUNTING
- G06F—ELECTRIC DIGITAL DATA PROCESSING
- G06F16/00—Information retrieval; Database structures therefor; File system structures therefor
- G06F16/50—Information retrieval; Database structures therefor; File system structures therefor of still image data
- G06F16/58—Retrieval characterised by using metadata, e.g. metadata not derived from the content or metadata generated manually
- G06F16/583—Retrieval characterised by using metadata, e.g. metadata not derived from the content or metadata generated manually using metadata automatically derived from the content
- G06F16/5854—Retrieval characterised by using metadata, e.g. metadata not derived from the content or metadata generated manually using metadata automatically derived from the content using shape and object relationship
- G—PHYSICS
- G06—COMPUTING OR CALCULATING; COUNTING
- G06F—ELECTRIC DIGITAL DATA PROCESSING
- G06F30/00—Computer-aided design [CAD]
- G06F30/10—Geometric CAD
- G—PHYSICS
- G06—COMPUTING OR CALCULATING; COUNTING
- G06F—ELECTRIC DIGITAL DATA PROCESSING
- G06F30/00—Computer-aided design [CAD]
- G06F30/20—Design optimisation, verification or simulation
- G06F30/27—Design optimisation, verification or simulation using machine learning, e.g. artificial intelligence, neural networks, support vector machines [SVM] or training a model
- G—PHYSICS
- G06—COMPUTING OR CALCULATING; COUNTING
- G06V—IMAGE OR VIDEO RECOGNITION OR UNDERSTANDING
- G06V10/00—Arrangements for image or video recognition or understanding
- G06V10/20—Image preprocessing
- G06V10/34—Smoothing or thinning of the pattern; Morphological operations; Skeletonisation
- G—PHYSICS
- G06—COMPUTING OR CALCULATING; COUNTING
- G06V—IMAGE OR VIDEO RECOGNITION OR UNDERSTANDING
- G06V30/00—Character recognition; Recognising digital ink; Document-oriented image-based pattern recognition
- G06V30/10—Character recognition
- G06V30/19—Recognition using electronic means
- G06V30/196—Recognition using electronic means using sequential comparisons of the image signals with a plurality of references
- G06V30/1983—Syntactic or structural pattern recognition, e.g. symbolic string recognition
- G06V30/1988—Graph matching
- G—PHYSICS
- G06—COMPUTING OR CALCULATING; COUNTING
- G06F—ELECTRIC DIGITAL DATA PROCESSING
- G06F2111/00—Details relating to CAD techniques
- G06F2111/02—CAD in a network environment, e.g. collaborative CAD or distributed simulation
- G—PHYSICS
- G06—COMPUTING OR CALCULATING; COUNTING
- G06F—ELECTRIC DIGITAL DATA PROCESSING
- G06F2111/00—Details relating to CAD techniques
- G06F2111/20—Configuration CAD, e.g. designing by assembling or positioning modules selected from libraries of predesigned modules
- G—PHYSICS
- G06—COMPUTING OR CALCULATING; COUNTING
- G06F—ELECTRIC DIGITAL DATA PROCESSING
- G06F2119/00—Details relating to the type or aim of the analysis or the optimisation
- G06F2119/20—Design reuse, reusability analysis or reusability optimisation
Landscapes
- Engineering & Computer Science (AREA)
- Theoretical Computer Science (AREA)
- Physics & Mathematics (AREA)
- General Physics & Mathematics (AREA)
- General Engineering & Computer Science (AREA)
- Multimedia (AREA)
- Data Mining & Analysis (AREA)
- Databases & Information Systems (AREA)
- Computer Vision & Pattern Recognition (AREA)
- Library & Information Science (AREA)
- Evolutionary Computation (AREA)
- Geometry (AREA)
- Computer Hardware Design (AREA)
- Computational Linguistics (AREA)
- Mathematical Analysis (AREA)
- Pure & Applied Mathematics (AREA)
- Mathematical Optimization (AREA)
- Computational Mathematics (AREA)
- Artificial Intelligence (AREA)
- Medical Informatics (AREA)
- Software Systems (AREA)
- Processing Or Creating Images (AREA)
- Image Processing (AREA)
Abstract
Translated fromJapaneseDescription
Translated fromJapanese (優先権)
本出願は、米国仮出願第60/442、373号、2003年1月25日出願の、”3D形状探索システムのアーキテクチャおよび記述(Architecture and Description for 3D Shape Search System)”の優先権を主張する。この開示はここに引例として組み込まれている。(priority)
This application claims the priority of “Architecture and Description for 3D Shape Search System” filed on US Provisional Application No. 60 / 442,373, filed Jan. 25, 2003. . This disclosure is incorporated herein by reference.
(技術分野)
本発明の実施の形態は一般に、探索および検索に関し、特に詳しくは、3次元オブジェクトに基づく探索および検索に関する。(Technical field)
Embodiments of the present invention generally relate to searching and searching, and more particularly to searching and searching based on three-dimensional objects.
(背景情報)
テキストおよび画像のサーチエンジンは、過去10年の間に相当開発されてきた。本発明は、コンピュータコンピュータ支援設計(CAD)モデルのリポジトリから3次元(3D)モデルを探索することを扱う。(Background information)
Text and image search engines have been developed considerably over the past decade. The present invention deals with searching for a three-dimensional (3D) model from a repository of computer computer aided design (CAD) models.
CADおよびコンピュータ支援製造(CAM)ソフトウェアは、独立型環境からネットワークベースの協働環境へと成長してきた。3Dグラフィックスハードウェアにおける進歩は、3DCADモデルの使用がますます増加していることに大きく寄与している。3Dジオメトリの使用が増加することは、内部設計リポジトリにつながっていくことになる。これは、CADモデル等製品関連情報および仕様書、製造プラン等のコンテキスト固有の文書を含むものである。通常、設計リポジトリは、企業内の各種の部署/人員に拡大する分散型データベースに類似するものである。 CAD and computer-aided manufacturing (CAM) software has grown from a stand-alone environment to a network-based collaborative environment. Advances in 3D graphics hardware have greatly contributed to the increasing use of 3D CAD models. Increasing use of 3D geometry will lead to internal design repositories. This includes product-related information such as CAD models and context-specific documents such as specifications and manufacturing plans. Typically, a design repository is similar to a distributed database that extends to various departments / people within an enterprise.
設計者はしばしば、コストおよび時間の要件に拘束されるので、設計を再利用することは魅力的な選択肢である。設計を再利用するには、部品や組み立て品の過去の設計を探索することが必要になる。また、設計者が企業内で交代するので、多くの”ナレッジ”が過去の設計者と共に失われる。この”失われたコーポレートナレッジ”の大抵のものは、過去の設計を探索することにより、取り戻すことができる。明らかに、大量の設計リポジトリから過去の設計およびナレッジ再利用することは、製品開発時間を短縮する重要な要因となり、企業に効果のある戦略的な利点を与えることができる。 Reusing designs is an attractive option because designers are often bound by cost and time requirements. To reuse a design, it is necessary to search for past designs of parts and assemblies. Also, as designers take turns in the enterprise, much “knowledge” is lost along with past designers. Most of this "lost corporate knowledge" can be recovered by exploring past designs. Clearly, reusing past design and knowledge from a large number of design repositories can be an important factor in reducing product development time and can provide an effective strategic benefit to the enterprise.
従って、次の問題に向けた技術を開発する必要がある。
・設計の再利用:企業内の過去の設計を探索することにより、設計を再利用することができる。クラスタマップインターフェースまたは3D簡易形状生成インターフェースを用いて、設計されたものに最も類似している部品を選択またスケッチすることができる。
・コスト見積もり:検索した部品の設計履歴を利用可能にするので、コスト見積もり処理が可能になる。設計者は最も類似の部品を探すことができるので、エラーを減らし、コスト見積もりにかかる時間を短縮することができる。
・見積もり処理の支援:見積もり要求を受け取ると、過去の設計を探索するのにしばしば時間がかかる。従って、見積もり要求(RFQ)に対応する時間を短縮する必要がある。
・部品分類システム:大抵の企業では、データベース内の部品を分類する人員を特に雇用している。これには時間はかからないが、人間の精度に依存していることにもなる。従って、この処理を合理化して、所望の基準値に基づいて部品を分類する必要がある。
・重複する部品の低減:部品を設計する前に、類似の部品がすでに設計されているかどうか、設計者はデータベースの利用可能な部品を探索して調べることができるようにする必要がある。
・3D形状のためのサーチエンジン:現在利用可能な3D形状サーチエンジンでは良い結果が得られない。従って、従来の3D形状サーチエンジンを改良する必要がある。Therefore, it is necessary to develop a technology for the following problems.
-Design reuse: Designs can be reused by searching for past designs in the enterprise. The cluster map interface or 3D simplified shape generation interface can be used to select or sketch the part that most closely resembles the designed one.
Cost estimation: Since the design history of the searched parts can be used, cost estimation processing becomes possible. Designers can search for the most similar parts, reducing errors and reducing cost estimation time.
• Support for quote processing: When a quote request is received, it often takes time to explore past designs. Therefore, it is necessary to shorten the time corresponding to the request for quotation (RFQ).
• Parts classification system: Most companies specifically employ personnel to classify parts in the database. This takes less time, but it also depends on human accuracy. Therefore, it is necessary to rationalize this process and classify parts based on a desired reference value.
• Duplicate part reduction: Before designing a part, the designer needs to be able to search the database for available parts to see if similar parts have already been designed.
• Search engines for 3D shapes: currently available 3D shape search engines do not give good results. Therefore, there is a need to improve the conventional 3D shape search engine.
現在利用可能なデータベース探索技術は、キーワードまたは自然言語ベースの方法を用いている。しかしながら、3DCADデータベースの場合は、コンテキストがCADモデルから切り離されているので、キーワードを用いてCADモデルを探索することが困難である。また、モデルファイルネームを用いるキーワード探索等のアプローチが非効率的であるのは、大抵の企業は経時的に変化するネーミング方法を有しているからである。さらに、大抵の設計者は、製品コンテキストよりも形状を記憶する傾向があるので、キーワードベースの探索はユーザにとって魅力のあるものではない。 Currently available database search techniques use keywords or natural language based methods. However, in the case of the 3D CAD database, since the context is separated from the CAD model, it is difficult to search for the CAD model using keywords. Moreover, the reason for the inefficient approach such as keyword search using the model file name is that most companies have a naming method that changes over time. Furthermore, keyword-based searches are not attractive to users because most designers tend to remember shapes rather than product context.
また、新薬発見およびドッキング等に応用するための3Dタンパク質構造を探索することを改良する必要がある。 There is also a need to improve the search for 3D protein structures for applications in new drug discovery and docking.
(発明の要約)
本発明の実施の形態は、3D探索および検索の技術を提供する。特に詳しくは、またある実施の形態では、3D形状(オブジェクト)をグラフィックデータ構造として表現して、1つ以上の探索可能なデータ記憶装置に格納する。各3D形状または特定の3D形状の部品を、特徴ベクトルを用いてデータ記憶装置から検索することができる。特徴ベクトルは、位相情報および3D形状または3D形状の部品内のエンティティに対応付けられたローカル幾何情報を含む。(Summary of the Invention)
Embodiments of the present invention provide 3D search and search techniques. In particular, and in some embodiments, 3D shapes (objects) are represented as graphic data structures and stored in one or more searchable data storage devices. Each 3D shape or a specific 3D shape part can be retrieved from the data store using the feature vector. The feature vector includes topological information and local geometric information associated with a 3D shape or an entity in a 3D shape part.
実施の形態のあるものでは、3D形状または3D形状の一部を、1つ以上の探索可能なデータ記憶装置に対する探索要求として用いることができる。探索要求として組み込まれた3D形状または部分を、対話形式でゼロから構成したり、3D形状または部品のデータ記憶装置を閲覧することにより選択したり、あるいは既存の3D形状または部品からペーストしたり選択したりすることができる。 In some embodiments, a 3D shape or a portion of a 3D shape can be used as a search request for one or more searchable data storage devices. Select a 3D shape or part embedded as a search request interactively from scratch, select by browsing the 3D shape or part data store, or paste or paste from an existing 3D shape or part You can do it.
さらに別の実施の形態では、3D探索要求から返送されたアンサーセットを、1つ以上の関連クラスタに構成することができる。各クラスタは、アンサーセットの特定の部分に対応付けられた1つ以上の3D形状または部品を含む。返送された結果およびクラスタを、対話形式で関連性または非関連性を評価して、変更した探索要求として再送信することができる。サーチャーが結果に満足するまで、対話回数および再送信して変更した探索要求数を続けることができる。また、関連性情報をサーチャーに対応付けて、サーチャーが発行した任意の次の探索要求をコンピュータで変更することができる。 In yet another embodiment, an answer set returned from a 3D search request can be configured into one or more related clusters. Each cluster includes one or more 3D shapes or parts associated with a particular part of the answer set. The returned results and clusters can be interactively evaluated for relevance or non-relevance and retransmitted as a modified search request. Until the searcher is satisfied with the results, the number of interactions and the number of search requests modified by re-transmission can continue. Also, the relevance information can be associated with the searcher, and any next search request issued by the searcher can be changed by the computer.
(詳細な説明)
各種の本発明の実施の形態では、”ユーザ”という用語を提示している。ユーザはサーチャーであり、サーチャーは、エージェント、サービス、アプリケーション、物理ユーザ、その他等のコンピュータがアクセス可能な媒体として表される任意のエンティティとすることができる。また、各種の実施の形態ではデータベースの仕様が述べられているが、データベースを、電子ファイルになったもの、ディレクトリ、リレーショナルデータベース、オブジェクト指向データベース、データウェアハウス等の、任意のデータ記憶装置またはデータ記憶装置の集合とすることができることを理解されたい。最後に、3Dオブジェクトとは3D形状または3D形状の部分の電子表現であって、場合によっては3Dオブジェクトのあるのもを3Dモデルとして表示することができる。(Detailed explanation)
In various embodiments of the present invention, the term “user” is presented. A user is a searcher, and a searcher can be any entity represented as a computer-accessible medium such as an agent, service, application, physical user, etc. In addition, in various embodiments, the specifications of the database are described. However, any data storage device or data such as an electronic file, a directory, a relational database, an object-oriented database, or a data warehouse is used as the database. It should be understood that it can be a collection of storage devices. Finally, a 3D object is an electronic representation of a 3D shape or a portion of a 3D shape. In some cases, a 3D object can be displayed as a 3D model.
図1は、3D形状探索システム100を示す図である。システム100はユーザに、3Dモデルの大量のリポジトリから類似のモデルを探索するプラットフォームを提供する。複雑な3Dモデルを、スケルトンと呼ばれるより簡単な表現に縮小する。3Dモデルおよびスケルトンとから重要な際立った特徴を抽出して、データベース内に特徴ベクトルとして保存する。最後に、データベースを探索して、結果をクラスタ化した出力として示す。複雑な3Dモデルを簡易なスケルトン形式(以下、”スケルトン化”という)に変換して、スケルトン表現を探索して、出力をクラスタ化するという処理の間、図1に示すようにたくさんの中間ステップが発生する。 FIG. 1 is a diagram illustrating a 3D
探索システム100を、以下を含むように構成する。
・形状の小変更に反応しない。
・ジオメトリおよび位相の組み合わせ。
・形状のマルチレベルおよびマルチカテゴリ表現。
・精度および計算効率。
・簡単で、ユーザがカスタマイズ可能なクエリー構成。The
-Does not respond to small changes in shape.
• A combination of geometry and phase.
• Multi-level and multi-category representation of shapes.
• Accuracy and computational efficiency.
• Simple and user customizable query structure.
(動的なクエリー生成および変更)
3D探索システム100は、ユーザにインテリジェントインターフェースを提供する。ユーザがモデルのスケルトンをスケッチしてこれをクエリーとして実行するだけでなく、ユーザが検索したモデルのスケルトンを動的に変更して、さらにユーザの意図する部品を発見する機会を向上させるように、3Dスケルトンモデリングインターフェースを実行する。システム100は、3Dスケルトンの生成および3D操作が可能な最初のものである。モデルのスケルトンの位相に対して変更が行われた場合は、システム100は再び探索を行うが、スケルトンのジオメトリに対する変更だけであれば、検索をやり直すだけである。この相互作用を介して、クエリーはさらにユーザの意図に近いものになり、システム100はその性能を効率的に向上させることができる。(Dynamic query generation and modification)
The
(ローカルクエリー)
従来、ユーザが生成できるのは1種類のクエリーだけで、入力CADモデルを特定することにより類似のCADモデルを検索していたが、ユーザの要件を最適に満たすことはない。例えば、ユーザが特定の特徴により重要性(または強調)を与えたいと所望したり、彼/彼女の主な探索対象がモデル全体自体ではなくCADモデルのローカルな特徴であったりすることがある。このような柔軟性は、過去の装置およびそれらのインターフェースでは不可能である。各探索は異なるものであり、ユーザインターフェースは異なる要件を処理するのに十分な柔軟性を持つ必要がある。さらに、より良いクエリー処理は、各種の要求に対応する必要がある。システム100は、ユーザ要件により適切に合致するように設計され、これを達成するのに必要なクエリー処理を向上させるように設計されている。(Local query)
Conventionally, a user can generate only one type of query, and a similar CAD model is searched by specifying an input CAD model. However, the user's requirement is not optimally satisfied. For example, the user may wish to give importance (or emphasis) to a particular feature, or his / her primary search target may be a local feature of the CAD model rather than the entire model itself. Such flexibility is not possible with past devices and their interfaces. Each search is different and the user interface needs to be flexible enough to handle different requirements. In addition, better query processing needs to accommodate various requests. The
(探索基準の柔軟性/普遍性)
過去の技術は一般に、2つの形状の比較に重点が置かれていた。しかし、アプリケーション分野に特有のたくさんの問題がある。主たる問題の1つは、CADモデルの類似性の解釈である。例えば、製造分野では、CADモデルの各種の機械加工特徴が非常に重要であると考えられている。任意の形状記述子の数字を計算するにあたって、確率論的形状分散方法では、特定のドメインをカスタマイズ可能することができないので、ユーザのニーズに適切に答えることができない。(Search criteria flexibility / university)
Past technology has generally focused on comparing two shapes. However, there are a number of problems specific to the application field. One of the main problems is the interpretation of CAD model similarity. For example, in the manufacturing field, various machining features of the CAD model are considered very important. In calculating the number of arbitrary shape descriptors, the probabilistic shape distribution method cannot customize a specific domain, and therefore cannot appropriately answer the user's needs.
(類似性の測定)
最後に、ユーザが入力と結果との間の形状の類似性を定量化したい場合がある。これは、形状関数方法ではある程度可能である。しかし、類似性自体の定義がユーザに依存している。従って、インターフェースは、形状の類似性に対するユーザの考え方を学習するようにする必要がある。これは、既存のリサー利技術では不可能なことである。(Measurement of similarity)
Finally, the user may want to quantify the shape similarity between the input and the result. This is possible to some extent with the shape function method. However, the definition of similarity itself depends on the user. Therefore, the interface needs to learn the user's view of shape similarity. This is not possible with existing Lisa technology.
(形状:ジオメトリおよび位相の組み合わせ)
任意の3Dモデルの形状は、位相とその構成要素エンティティのジオメトリとの組み合わせである。ジオメトリはエンティティの形状、サイズおよび位置の定量的な大きさであるが、位相はモデルの幾何エンティティの間の関係情報である。従って、任意の写実的な形状表現は、これら2つの考えを十分に反映する必要がある。これらの特性を別々に表現することにより、類似の形状について階層的探索方法が行えるようになる。(Shape: combination of geometry and phase)
The shape of any 3D model is a combination of the phase and the geometry of its component entities. Geometry is a quantitative measure of entity shape, size and position, while phase is the relationship information between the geometric entities of the model. Therefore, any realistic shape representation needs to fully reflect these two ideas. By expressing these characteristics separately, a hierarchical search method can be performed for similar shapes.
従来技術のアプローチは、形状をこれらの量の1つとして、あるいは’複合の程度’のいずれかとして表現しており、ジオメトリと位相とをまったく区別していない。例えば、モーメント不変量および形状分散等の形状記述子は形状の’複合の程度’であって、モデルのジオメトリと位相とをまったく区別していない。ユーザの意図に基づく探索が可能でなければ、特定のアプローチは総じてまったく記述できない。グラフ/木等の関連構造で3Dモデルを表現することにより、ジオメトリと位相との間の違いをさらに維持することができる。しかしながら、グラフ表現だけでは、ユーザの意図を把握する問題を解決することはできない。従って、探索/索引処理の間に幾何情報を効率的に活用するには、さらにリサーチを行うことが必要である。 The prior art approach expresses the shape as either one of these quantities or as a 'complex degree' and makes no distinction between geometry and phase. For example, shape descriptors such as moment invariants and shape variances are the 'complexity degree' of the shape and do not distinguish between model geometry and phase at all. If the search based on the user's intention is not possible, a specific approach cannot be described as a whole. By representing the 3D model with related structures such as graphs / trees, the difference between geometry and phase can be further maintained. However, the problem of grasping the user's intention cannot be solved only by the graph expression. Therefore, further research is required to efficiently utilize geometric information during search / index processing.
(木データ構造に代わるグラフデータ構造)
ここに新規の方法、システム、およびデータ構造について述べることで、なぜ従来の技術が機械工学等のある環境に応用できないかという理由を説明することにより、本発明を過去のアプローチから区別する。(Graph data structure instead of tree data structure)
Discussing the novel methods, systems, and data structures herein, the present invention is distinguished from past approaches by explaining why the prior art is not applicable to certain environments such as mechanical engineering.
従来のスケルトン/ショックグラフベースの3D形状照合システムは、マルチメデイア検索のために開発された。飛行機(全体の、概略の3Dモデル)、自動車、果物等のモデルが一般的である3Dオブジェクトは、ドメイン固有のものではない。従来のアプローチのあるものでは、位相にホールのないモデルについてテストが行われていたのは、閉じたホールを構成するサーフェス集合を有するソリッド形状を従来の木構造で取り込むことができないからである。しかしながら、このような閉ループエンティティに遭遇することはよくあり、特に機械工学分野で顕著である。これはそれらの表現のグラフ構造と呼ばれるものである。また、他の従来のアプローチは、ローカルジオメトリまたは部分的照合を比較するのには適応できないものである。ここに示すシステム100および他の新規の技術は、スケルトンをグラフデータ構造に変換して、ループをソリッド形状に取り込むものである。 Conventional skeleton / shock graph based 3D shape matching systems have been developed for multimedia search. 3D objects, commonly modeled as airplanes (overall, rough 3D models), cars, fruits, etc., are not domain specific. In some of the conventional approaches, the test was performed on a model having no holes in the phase because a solid shape having a set of surfaces constituting a closed hole cannot be captured by the conventional tree structure. However, such closed loop entities are often encountered, particularly in the mechanical engineering field. This is called the graph structure of their representation. Also, other conventional approaches are not adaptable to compare local geometry or partial matching. The
(多段階探索方法)
従来技術では、1つのクエリーしか生成できず、この1つのクエリーを改良することができない。またその探索は、事前に定義した、特徴ベクトルの固定集合に基づくものであり、該当する形状の検索を保証するものではない。システム100により、ユーザが多段階探索インターフェースを連続して用いて、探索結果を選別することができるようになる。このアプローチは該当する形状の検索を保証するものではないが、該当する形状を検索する機会を増やすので、従来のアプローチに比べて基本的な改良をもたらす。モーメント不変量、ボリューム、アスペクト比、および固有値を含む多数の特徴をユーザに提供して、多段階クエリーを生成する際の支援を行うことができる。(Multi-stage search method)
In the prior art, only one query can be generated, and this one query cannot be improved. The search is based on a fixed set of feature vectors defined in advance, and does not guarantee a search for the corresponding shape. The
(計算効率)
計算効率により、システムが莫大なボリュームを処理する能力を制御する。境界表現グラフに関する従来の方法のなかには、境界表現グラフが簡易3Dモデルのサイズとしては非常に大きくなると、非効率的なものがある。正確なグラフ照合アルゴリズムはNP困難となる。従って、境界表現グラフ方法を用いて任意のCADモデルをデータベース内の何百万もの部品と比較することは、スーパーコンピュータでも不可能と思われる。(Calculation efficiency)
Computational efficiency controls the ability of the system to handle huge volumes. Some conventional methods for boundary representation graphs are inefficient when the boundary representation graph is very large in size as a simple 3D model. An accurate graph matching algorithm becomes NP-hard. Therefore, it seems impossible for a supercomputer to compare an arbitrary CAD model with millions of parts in a database using the boundary representation graph method.
図2は、CADおよび境界表現グラフを示す図200である。図200は、簡易部品とその対応する境界表現グラフとを示す。3Dモデルの比較のために開発された大抵の従来のアプローチは、ドメインナレッジを用いることに失敗している。この方向ではショック/スケルトングラフベースのアプローチが1歩先んじているが、モデルに存在する情報を適切に検索してグラフ/木照合問題の計算量を低減していない。本発明は、エンティティ(ループ/稜線)の種類、ローカルジオメトリおよびボリューム情報を含むドメイン固有のナレッジを用いて、探索の計算量を低減して、ドメイン固有の探索システムを開発する。 FIG. 2 is a diagram 200 illustrating a CAD and boundary representation graph. FIG. 200 shows a simplified part and its corresponding boundary representation graph. Most conventional approaches developed for comparison of 3D models have failed to use domain knowledge. In this direction, the shock / skeleton graph-based approach is one step ahead, but it does not reduce the amount of computation of the graph / tree matching problem by appropriately searching for information that exists in the model. The present invention develops a domain specific search system using domain specific knowledge including entity (loop / edge) type, local geometry and volume information, reducing the computational complexity of the search.
(ディスクI/O効率)
ディスクI/Oに関する従来の効率は、けして満足の行くものではない。CADモデルの数が非常に多くなると、ディスクI/O時間がクエリー時間の大きな部分をしめるようになる。例えば、データベースに百万個のモデルがあり、ディスクI/O時間が15ミリ秒で、および各CADモデルが1つのディスクページ(あるリサーチでは、照合から得られるディスクファイルは平均、1MBのディスク空間を占める)とすると、データベース内のレコードを柔軟にスキャンするのに4時間かかる。従って、データに索引を付けて探索速度を上げることが重要である。しかしながら、非常に成果を収めているB+木等の現在のデータベースシステムの索引構造は、これら多次元データには適当でない。従って、不要なディスクI/Oを選別する新しい索引が非常に重要である。しかしながら、この問題には十分重点が置かれていなかった。この理由の1つは、現在の3D形状探索の大抵のものが、効率的なアプローチのために、今だ非常に少ない数のCADモデルを探索することに重点が置いているからである。(Disk I / O efficiency)
Conventional efficiencies associated with disk I / O are far from satisfactory. When the number of CAD models becomes very large, the disk I / O time becomes a large part of the query time. For example, there are million models in the database, disk I / O time is 15 milliseconds, and each CAD model is one disk page (in one research, the disk file obtained from matching averages 1 MB of disk space It takes 4 hours to flexibly scan the records in the database. Therefore, it is important to increase the search speed by indexing data. However, the index structures of current database systems such as B + trees that have been very successful are not suitable for these multidimensional data. Therefore, a new index that sorts out unnecessary disk I / O is very important. However, this issue was not stressed enough. One reason for this is that most of the current 3D shape searches are still focused on searching a very small number of CAD models for an efficient approach.
(システム処理)
3Dモデルの探索処理について、次の動作シーケンスにより説明することができる:
(1.ユーザインターフェース側)
(1.1.クエリースケッチインターフェース)
・必要な形状を3Dでスケッチする。または、
・必要な3D形状のスケルトン(棒線画)をスケッチする。または、
・モデルクラスタからモデルを選択する。または、
・ローカルハードドライブから3Dソリッドモデルを選択する。または、
・3Dモデルのオーソグラフィックビューを実行するかスケッチする。(System processing)
The 3D model search process can be described by the following operational sequence:
(1. User interface side)
(1.1. Query sketch interface)
・ Sketch the required shape in 3D. Or
・ Sketch the required 3D shape skeleton. Or
-Select a model from the model cluster. Or
Select a 3D solid model from the local hard drive. Or
Perform or sketch an orthographic view of the 3D model.
(1.2.特徴ベクトルインターフェース)
・探索およびクラスタ化のための特徴ベクトルの必要な組み合わせを選択する。(1.2. Feature vector interface)
Select the required combination of feature vectors for searching and clustering.
(2.サーバまたはサービス処理)
(2.1.ボクセル化)
・3Dモデルをニュートラルの離散ボクセル表現に変換する。
・3Dモデルおよびボクセル特徴ベクトルを抽出して保存する。(2. Server or service processing)
(2.1. Voxelization)
Convert the 3D model into a neutral discrete voxel representation.
Extract and
(2.2.スケルトン化)
ボクセルモデルの検出した位相により、3つのスケルトン化動作を実行する(詳細は後で示す)。(2.2. Skeletonization)
Three skeletonization operations are executed according to the detected phase of the voxel model (details will be given later).
(2.2.1.角柱状スケルトン化)
(2.2.2.管状スケルトン化)
・簡易型ワイヤフレーム。
・スケルトン特徴ベクトルを抽出して保存する。(2.2.1. Prismatic skeletonization)
(2.2.2. Tubular skeletonization)
・ Simple wire frame.
-Extract and store skeleton feature vectors.
(2.3.グラフの生成)
・スケルトンタイプにより、スケルトンからエンティティを検出する(ループ、稜線またはサーフェス)。
・グラフ特徴ベクトルを抽出して保存する。(2.3. Generation of graph)
• Detect entities from the skeleton (loop, edge or surface) by skeleton type.
Extract and save graph feature vectors.
(2.4.2D図の3Dモデルへの変換)
・ノイズ消去。
・次元およびタイトルブロックの抽出および消去。
・2Dシンニングまたは2Dスケルトン化。
・稜線およびエンティティの認識。
・オーソグラフィックビューにおいて連続閉セグメントループを得る。
・内部独立ループの識別。
・MATを用いた非独立ループのスケルトン化。
・スケルトンの3Dスケルトンへの変換。
・任意の上記スケルトン化方法を用いた3Dモデルのスケルトンへの変換。(Conversion of 2.4.2D figure to 3D model)
・ Noise elimination.
• Extraction and elimination of dimensions and title blocks.
-2D thinning or 2D skeletonization.
• Recognition of ridgelines and entities.
Obtain a continuous closed segment loop in the orthographic view.
• Identification of inner independent loops.
-Skeletonization of non-independent loops using MAT.
-Conversion of skeleton to 3D skeleton.
Conversion of the 3D model into a skeleton using any of the above skeletonization methods.
(3.データベース、探索およびクラスタ化)
(3.1.グラフの比較)
・グラフ/サブグラフ同定、対応付けグラフ技術または確率論的グラフ照合技術のいずれかによる。(3. Database, search and clustering)
(3.1. Comparison of graphs)
• By either graph / subgraph identification, association graph technology or probabilistic graph matching technology.
(3.2.多次元索引構造の生成)
・R−木、R+木、KD−木、X−木または任意の他の空間パーティショニング技術を用いて、データベースに索引を付ける。(3.2. Generation of multidimensional index structure)
Index the database using R-tree, R + tree, KD-tree, X-tree or any other spatial partitioning technique.
(3.3.特徴ベクトルの比較)
・特徴ベクトルのデフォルトの組み合わせを用いない場合は、1.2に記載のユーザ基本設定に基づく。(3.3. Comparison of feature vectors)
When the default combination of feature vectors is not used, it is based on the user basic setting described in 1.2.
(3.4.データベース内のクラスタモデル)
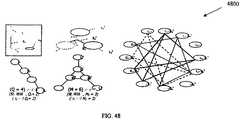
・自己組織化マップ(SOM)または任意の他の階層型クラスタ化技術を用いる。(3.4. Cluster model in the database)
Use a self-organizing map (SOM) or any other hierarchical clustering technique.
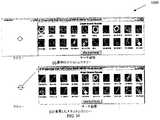
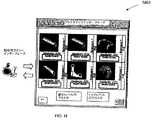
(3.5.クラスタマップディスプレイを介したユーザへの結果の提示)
・各クラスタから典型的なモデルを選んで、ユーザ一フレンドリーインターフェースを介して部品画像を表示する。
・モデルを選んで閲覧できるようにする。(3.5. Presenting the results to the user via the cluster map display)
Select a typical model from each cluster and display the part image via a user-friendly interface.
・ Select a model so that it can be viewed.
(3.6.関連性フィードバック)
・ユーザが該当する部品、該当しない部品を選ぶ。
・サーバを介して結果をデータベースに返送する。
・ユーザ関連性フィードバック結果を用いて、クラスタマップを更新する。
・結果をユーザに再表示する。(3.6. Relevance feedback)
-The user selects a relevant part or a non-relevant part.
-Send the result back to the database via the server.
-Update the cluster map using the user relevance feedback results.
-Redisplay the result to the user.
(3.7.学習エージェント)
・ニューラルネットワーク等の学習アルゴリズムが、ユーザ関連性フィードバック基本設定を”学習”して、ユーザプロファイルに保存する。(3.7. Learning Agent)
A learning algorithm such as a neural network “learns” user relevance feedback basic settings and stores them in the user profile.
(3.8.多段階探索)
・連続または段階的なやり方で、ユーザが異なる特徴ベクトルおよびスケルトングラフを用いて探索結果を絞り込めるようにする。類似性比較は、上記3.1および3.3に述べたものと同じである。システム100のアーキテクチャについては、図1に高レベルで最もよく説明する事ができる。以下のセクションでは、本発明の実施の形態についてより詳細に説明する。(3.8. Multi-step search)
• Allow users to refine search results using different feature vectors and skeleton graphs in a continuous or stepwise manner. Similarity comparison is the same as described in 3.1 and 3.3 above. The architecture of the
(1.ユーザインターフェース側)
再び図1を参照すると、ユーザインターフェースは基本的に3つのインターフェースから成る。すなわち、スケッチによるクエリー(Query−by−sketch:QBS)、例示によるクエリー(Query−by−example:QBE)、および特徴ベクトルインターフェースである。QBSインターフェースは、2つの異なるバージョンを実行する。(i)3Dソリッドモデルスケッチインターフェースと、(ii)3Dスケルトンスケッチインターフェースとである。QBEインターフェースは、(i)クラスタマップインターフェースと、(ii)ローカルハードドライブと、(iii)2D図インターフェースとから成る。(1. User interface side)
Referring again to FIG. 1, the user interface basically consists of three interfaces. That is, a query by sketch (Query-by-sketch: QBS), a query by example (Query-by-example: QBE), and a feature vector interface. The QBS interface runs two different versions. (I) a 3D solid model sketch interface and (ii) a 3D skeleton sketch interface. The QBE interface consists of (i) a cluster map interface, (ii) a local hard drive, and (iii) a 2D diagram interface.
(1.1.クエリーインターフェース)
次のサブセクションでは、本発明のシステム(QBSおよびQBE)において、3Dソリッドモデル、3Dスケルトンモデルとして直接に、または3Dモデルの2Dビューからのいずれかからクエリーを構成するために用いられる各種の方法およびモジュールについて説明する。(1.1. Query interface)
In the next subsection, various methods used to construct a query either directly as a 3D solid model, 3D skeleton model, or from a 2D view of a 3D model in the system of the present invention (QBS and QBE). The module will be described.
(1.1.1.3Dソリッドモデルスケッチ)
(モジュールの説明)
このモジュールは、概略の幾何形状をできるだけ素早く生成する、ウェブベースでプラットフォーム独立型システムを提供する。これは、ハイブリッドアプローチを形状生成に用いる。例えば、特徴ベースでスケッチベースのソリッドモデリングを用いる。スケッチインターフェースにより、マウスストロークを解釈して、これら離散ストロークを、ベクトル化アルゴリズムを用いて線、点、円弧といったプリミティブエンティティに変換する。次に、変換したスケッチを用いて、ソリッドジオメトリを形成することができる。また、ユーザは、ブロック、円柱ホール等の事前に定義した形状特徴をプリミティブ構成ブロックとして用いることもできる。次に、これら特徴のフェースをキャンバスとして用いて、さらにスケッチを行うことができる。(1.1.1.3D solid model sketch)
(Description of the module)
This module provides a web-based, platform-independent system that generates a rough geometry as quickly as possible. This uses a hybrid approach for shape generation. For example, feature-based and sketch-based solid modeling is used. The sketch interface interprets mouse strokes and converts these discrete strokes into primitive entities such as lines, points, and arcs using a vectorization algorithm. The transformed sketch can then be used to form a solid geometry. The user can also use a pre-defined shape feature such as a block or a cylindrical hole as a primitive building block. You can then sketch further using the faces of these features as canvases.
システム100は以下のように動作する。
・形状探索ウェブサイトにログインした後、ユーザは新しいセッションを開始する。
・ユーザはすでに存在するCADファイルをアップロードするか、または開く。
・モデリングを開始する別の方法は、ブロック、円柱といった、事前に生成したソリッド形状特徴をドラッグアンドドロップしたり、マウスまたはペンをドラッグして概略のスケッチプロファイルをスケッチしたりすることにより行う。
・スケッチを生成したならば、これをサーバに送って押し出しを行う。個別のボタンを用いるか、押し出しを示すマウスまたはペンストロークを介するかのいずれかにより、これを行うことができる。
・サーバはコマンドを受信して、これにより、スケッチを押し出しソリッドに変換して、ファセット化オブジェクトをクライアントに返送する。
・新たに生成したソリッドを、クライアントウインドウで表示する。
・ユーザはソリッドのフェースを選択して、この上でスケッチを行う。
・ドラッグした、事前に定義した形状特徴を編集して、概略の形状を得ることができる。この編集には、特徴の次元または位置の変更、特徴のコピーや特徴の削除または表示しないこと等が含まれる。
・概略の幾何形状により、ソリッドに不要のぶら下がりや突き出した部分がある場合がある。ユーザは次に、3Dイレーザを用いて不要の部分を消去することができる。
・計算集約型機能の大部分、例えばソリッドモデリング、特徴生成および変更を、クライアントのサイズを小さくするために、サーバに移行する。
After logging into the shape search website, the user starts a new session.
The user uploads or opens a CAD file that already exists.
Another way to start modeling is by dragging and dropping pre-generated solid shape features, such as blocks or cylinders, or by sketching a sketch sketch profile by dragging the mouse or pen.
・ If you have created a sketch, send it to the server for extrusion. This can be done either using individual buttons or via a mouse or pen stroke indicating extrusion.
The server receives the command, which converts the sketch into an extruded solid and sends the faceted object back to the client.
-The newly generated solid is displayed in the client window.
The user selects a solid face and sketches on it.
• Edit the pre-defined shape features that you dragged to get a rough shape. This editing includes changing the dimension or position of the feature, copying the feature, deleting or not displaying the feature, and the like.
• Depending on the approximate geometry, the solid may have unwanted hanging or protruding parts. The user can then erase unwanted portions using a 3D eraser.
Move most of the computationally intensive functions, such as solid modeling, feature generation and modification, to the server to reduce client size.
(モジュールアーキテクチャ)
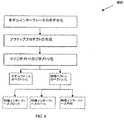
図3は、モジュールインビューアーキテクチャ(Module−in−View Architecture:MVA)で発生する相互作用を示す図300である。提案したインターフェースは、ツールCADアーキテクチャに基づく。これは、モデルビューコントローラ(Model−View−Controller:MVC)アーキテクチャから成る。これがモジュールの要を形成する。
・モデルはアプリケーションオブジェクトである。この場合のジオメトリオブジェクトである。これは、生成したジオメトリの詳細を含む。この場合のジオメトリは、生成したソリッド形状から成る。
・ビューは、モデルの画面表現である。マジシャンライブラリを用いて、それらの対応する相対変換を用いてファセット化ジオメトリオブジェクトを表示する。
・コントローラはユーザインターフェースがユーザ入力に反応する手段である。マジシャンライブラリを用いて、選択、ドラッグ等のユーザ入力を取り込む。(Module architecture)
FIG. 3 is a diagram 300 illustrating the interactions that occur in a module-in-view architecture (MVA). The proposed interface is based on a tool CAD architecture. This consists of a Model-View-Controller (MVC) architecture. This forms the heart of the module.
A model is an application object. The geometry object in this case. This includes the details of the generated geometry. The geometry in this case consists of the generated solid shape.
A view is a screen representation of a model. The magician library is used to display faceted geometry objects using their corresponding relative transformations.
A controller is a means by which a user interface reacts to user input. Use the magician library to capture user inputs such as selection and dragging.
図4は、MVA300の機能を示す図400である。この場合、図400は生成した特徴およびスケッチのリストを有する。特徴は事前に定義したオブジェクトで、フェース、稜線のリストといったデータを有する。押し出されたスケッチを特徴に変換する。元となるスケッチに対してポインタを有している場合に限り、これらは事前に定義した特徴と同じである。図400は、ユーザに提示するファセット化データから成る。ユーザはこのデータで対話して、これを変更することができる。 FIG. 4 is a diagram 400 illustrating the functions of the
図5は、特徴インターフェースオブジェクト500を示す図である。これによりさらに、モデルが複数の生成物を保つことができる階層へのもう1段階を表すこともできる。各生成物は個別のジオメトリオブジェクトを有し、生成した、または事前に定義した特徴を順に有することになる。ジオメトリはまた、特徴にブール演算を行った後で形成したソリッドモデルのファセット化表現も有することになる。ユーザに表示するために、このファセット化構造500を、ビューオブジェクトで用いる。 FIG. 5 is a diagram illustrating the
特徴モジュール:特徴は事前に定義した3D形状で、ソリッドモデルの生成に直接用いることができる。しばしば、ユーザは同じ形状を何回もモデルに保ちたいことがある。最も共通する例は、矩形ソリッドブロック、円柱、ホール、スロット等があげられる。ジオメトリ生成速度を向上するには、作業空間に配置できるようにこのような形状をいつも準備する。これら形状は、作業空間に最初に配置された時に、デフォルトサイズを有している。しかしながら、特徴の各フェースは、特徴のサイズおよび位置を操作するためのハンドルを有する。特徴を選択すると、これらのハンドルを表示して、ユーザがこれらのハンドルをドラッグして、対話形式で特徴のサイズを変更する。ACISソリッドモデルを用いて特徴を生成する。これはサーバに送られて、次にファセット化されてフェースのリストを生成する。各特徴を用いて、これらフェースの稜線を抽出して保存する。すべての特徴は、単に稜線のリストとして表される。従って、ユーザが特徴を選択すると、それはワイヤフレーム方式で示される。しかしながら、特徴の実際の3Dモデルをサーバ側に保存して、次にこれを用いて、前に生成した全形状についてブール演算を行って、最終的な形状モデルを得る。各スケッチして押し出した形状もまたユーザ生成の特徴で、後で用いるために別々に保存することができる。従って、インターフェースは非常にカスタマイズ可能なものである。これらのユーザ生成の特徴は、これらを生成した元となるスケッチに対してポインタを有している。 Feature module: Features are predefined 3D shapes that can be used directly to generate a solid model. Often, the user may want to keep the same shape in the model many times. The most common examples are rectangular solid blocks, cylinders, holes, slots and the like. To improve geometry generation speed, always prepare such shapes for placement in the workspace. These shapes have a default size when they are first placed in the workspace. However, each face of the feature has a handle for manipulating the size and position of the feature. When a feature is selected, these handles are displayed and the user drags these handles to resize the features interactively. Features are generated using an ACIS solid model. This is sent to the server and then faceted to generate a list of faces. Using each feature, the ridgelines of these faces are extracted and stored. All features are simply represented as a list of edges. Thus, when the user selects a feature, it is shown in a wireframe manner. However, the actual 3D model of the feature is stored on the server side and then used to perform a Boolean operation on all previously generated shapes to obtain the final shape model. Each sketched and extruded shape is also a user-generated feature that can be saved separately for later use. The interface is therefore very customizable. These user-generated features have a pointer to the sketch from which they were generated.
スケッチモジュール:ユーザがスケッチ面を定義した後で、スケッチは、画面に対して並列になるようにスケッチ面を自動的に回転することにより開始する。ユーザは次に、アウトラインまたはプロファイルをスケッチする。プロファイルを次に、ベクトル化アルゴリズムによりベクトルに解釈する。例示だけであるが、ダブ・ドリ(Dov Dori)およびリュー・インウェン(Liu Wenyin)のベクトル化アルゴリズム等である。これらのベクトルでワイヤのプロファイルを形成して、押し出しによりソリッドを形成する。 Sketch module: After the user defines a sketch plane, the sketch begins by automatically rotating the sketch plane to be parallel to the screen. The user then sketches the outline or profile. The profile is then interpreted into a vector by a vectorization algorithm. For example, Dov Dori and Liu Wenyin vectorization algorithms. These vectors form a wire profile and form a solid by extrusion.
形状生成ツール:処理を簡単にするため、ツールをいくつか選択として用意する。これらのツールは以下のものとすることができる。 Shape generation tools: Several tools are available for selection to simplify processing. These tools can be:
スケッチ面:ユーザはソリッド形状の任意のフェースを選択して、次の方法のいずれかでスケッチ面を生成する。例示のスケッチ面ツール600を図6に示す。このツールで次の処理を実行することができる:
1.すでに生成したソリッドのフェースに対するオフセット
2.3つの点を選択して、それを介して面を送る
3.既存のソリッドの任意の稜線を選択して、それを介して面を生成する
4.ソリッドの任意の稜線でスケッチ面を回転する。Sketch plane: The user selects any face in a solid shape and generates a sketch plane in one of the following ways. An exemplary
1. Offset to already generated
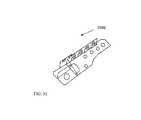
切断面:切断面は、スケッチ面と同様である。しかしながら、ユーザが対話形式で用いてソリッドに切り込みを入れる。面は、任意のスケッチしたプロファイルとすることができる。例示の切断面ツール700を図7に示す。図7は、切断面ツール700の動作を示している。このツール700はフェースをドラッグする機能を用い、次にACISを用い、最後にソリッドに切り込みを形成する。 Cut plane: The cut plane is the same as the sketch plane. However, the user cuts into the solid for interactive use. The face can be any sketched profile. An exemplary
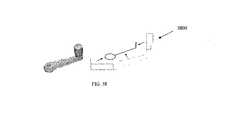
デジタルペンまたはマウスストロークを介する押し出し:この機能は、2D形状プロファイルから押し出しを形成するために重要である。一旦スケッチループが完成すれば、ユーザがマウスまたはデジタルペンといった同じ装置を用いてプロファイルの押し出しを行えることは、直感での使用を超えるものになる。従って、ユーザがループを完成させた後、ユーザに次のマウスストロークまたはドラッグを介する押し出しの実行を促し、彼/彼女が所望するプロファイルの押し出しを行うまで、対話形式でデプスを指定する。これは切断面を用いることにいっそう類似している。例示の押し出しツール800を、図8に示す。 Extrusion via digital pen or mouse stroke: This function is important for creating extrusions from 2D shape profiles. Once a sketch loop is completed, the ability for a user to push out a profile using the same device, such as a mouse or digital pen, goes beyond intuitive use. Thus, after the user completes the loop, the user is prompted to perform an extrusion via the next mouse stroke or drag, and the depth is specified interactively until he / she performs the desired profile extrusion. This is more similar to using a cut surface. An
3Dイレーザ:この機能を用いて、ソリッド特徴のぶら下がり部分を消去することができる。このために、ソリッド形状のボクセル化モデルを用いる。図9の例示の3Dイレーザツール900に示すように、ユーザは選択により消去するボクセルを選択して、次にこれが終わったら、ソリッドモデルを用いて選択したボクセルのブール減算を行って、結果をユーザに表示する。ユーザは、元となるボクセルモデルを見ることもできるし、見なくても良い。このツール900を用いて、モデル内の任意の不一致を消去する。 3D eraser: This feature can be used to eliminate hanging portions of solid features. For this purpose, a solid voxel model is used. As shown in the exemplary
(1.1.2.3Dスケルトン生成および変更インターフェース)
ユーザがモデルのスケルトンをスケッチして、これをクエリーとして実行するだけでなく、ユーザが検索したモデルのスケルトンを動的に変更させることができるように、3Dスケルトンモデリングインターフェースを実行する。モデルの位相に対して変更が行われた場合は、システムは再び探索を行うが、スケルトンのジオメトリに対する変更だけであれば、検索結果を整理し直すだけである。クエリーはさらにユーザの意図に近いものになり、システムはその性能を効率的に向上させることができる。(1.1.2.3D Skeleton creation and modification interface)
The 3D skeleton modeling interface is executed so that the user can not only sketch the model skeleton and execute it as a query, but also dynamically change the model skeleton retrieved by the user. If changes are made to the model's phase, the system searches again, but if only changes to the skeleton's geometry are made, the search results are simply rearranged. Queries are further closer to the user's intention and the system can efficiently improve its performance.
ユーザがクエリーのための適した例を見つけられないという事実により、このインターフェースを起動する。システムにより、ユーザはまず、プリミティブ形状を組み立てることにより3Dスケルトンを構成して、次に3D空間で形状を操作することができる(図10の、3D形状操作のビューを示す図1000を参照のこと)。得られた”スケルトン”は、ちょうどスケルトン化から得られたスケルトンファイルのように、基本的な位相および幾何情報を含む。現在、プリミティブ形状は、直線および曲線等の稜線と、円および矩形等のループとを含む。3D操作の注釈は、回転、パン、スケーリング、ズーム等を含む。これらは、個別の形状プリミティブおよびグローバルアセンブリの両方のために設計されている。また、インターフェースにより、ユーザが選択した形状を削除し、現在の構成をクリアし、スケルトングラフファイルをインポートしてこれをビジュアル化し、構築したスケルトンクエリーとして実行して類似の形状を探索することが可能になる。 This interface is invoked by the fact that the user cannot find a suitable example for the query. The system allows the user to first construct a 3D skeleton by assembling primitive shapes and then manipulate the shapes in 3D space (see FIG. 1000, which shows a view of 3D shape manipulation in FIG. 10). ). The resulting “skeleton” contains basic topological and geometric information, just like the skeleton file obtained from skeletonization. Currently, primitive shapes include ridgelines such as straight lines and curves, and loops such as circles and rectangles. Annotations of 3D operations include rotation, panning, scaling, zooming, etc. They are designed for both individual shape primitives and global assemblies. The interface also allows you to delete user-selected shapes, clear the current configuration, import a skeleton graph file, visualize it, and run it as a built skeleton query to find similar shapes become.
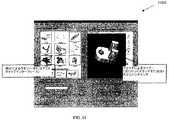
(1.1.3.クラスタマップインターフェース)
セクション3.5の記載と以下の記載を参照のこと。(1.1.3. Cluster map interface)
See description in section 3.5 and below.
(1.1.4.ローカルハードドライブインターフェース)
すでに生成したCADファイルを選択する選択肢をユーザに与える。ファイルは、ユーザがファイルにアクセス可能な場所ならばいずれの場所にも配置できる。ファイルは、本発明でサポートされる任意のCADフォーマットとすることができる。標準のポップアップウインドウをユーザに用意して、CADファイルを選択できるようにする。(1.1.4. Local hard drive interface)
The user is given the option of selecting a CAD file that has already been generated. The file can be placed anywhere that the user can access the file. The file can be in any CAD format supported by the present invention. A standard pop-up window is prepared for the user so that a CAD file can be selected.
(1.1.5.2D図インターフェース)
ユーザには、それらのスキャンした図をサーバに送信する選択肢を用意する。(1.1.5.2D diagram interface)
The user is provided with an option to send those scanned diagrams to the server.
(1.2.特徴ベクトルインターフェース)
本発明は、図11の図1100に示すように、ユーザがユーザの探索意図を正確に記述することにより、特徴ベクトルを部分的または全体的にカスタム化する技術を含む。探索クエリーを複数のレベル/段階で実行して、より良い結果を得る。このインターフェースにより、ユーザが異なる特徴ベクトルを探索処理内のこれら各種の層に割り当てることが可能になる。これにより、ユーザがユーザの探索意図をより正確に記述することを支援する。ユーザはさらに、ユーザの探索を向上させるのに適用できるように、重みをこれら特徴ベクトルに再割り当てすることができる。インターフェース内で各種の選択肢を実行することによりシステムに命令して、正確な、または部分的な探索を行うことができる。部分的探索クエリーはサブグラフ同定を含み、これはスケルトングラフレベルで処理される。また、ユーザは、ニューラルネットワークを用いて効率的なクエリー結果を得ることができる。ユーザは、自分の探索基本設定を設定して、これを自分のプロファイルに保存することもできる。ユーザは、自分の頻繁に用いる要件ごとに、複数のプロファイルを各種の探索状況に定義することができる。また、このインターフェースにより、ユーザがこれらのプロファイルを管理して、関連性フィードバックをシステムに備えることも可能になる。(1.2. Feature vector interface)
As shown in FIG. 1100 of FIG. 11, the present invention includes a technique for partially or wholly customizing a feature vector by allowing a user to accurately describe a user's search intention. Perform search queries at multiple levels / stages to get better results. This interface allows the user to assign different feature vectors to these various layers in the search process. This assists the user in describing the user's search intention more accurately. The user can further reassign weights to these feature vectors so that they can be applied to improve the user's search. The system can be commanded by executing various options within the interface to perform an accurate or partial search. Partial search queries include subgraph identification, which is processed at the skeleton graph level. In addition, the user can obtain an efficient query result using a neural network. Users can also set their own search preferences and save them in their profile. The user can define a plurality of profiles in various search situations according to his / her frequently used requirements. This interface also allows the user to manage these profiles and provide relevance feedback to the system.
(2.サーバまたはサービス側)
(2.1.ボクセル化)
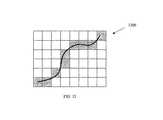
ボクセル化は、3D幾何オブジェクトをそれらの連続幾何表現からボクセルの集合に変換する処理である。これにより、連続オブジェクトを3D離散空間に最もよく近似する。3D離散空間は、デカルト座標(x,y,z)で定義される3Dユークリッド空間の一体化したグリッド点の集合である。ボクセルは、一体化したグリッド点を中心とした空間格子ボリュームである。ボクセル値を{0,1}にマッピングする。”1”が割り当てられたボクセルを”ブラック”ボクセルと呼び、不透明なオブジェクトを表し、”0”が割り当てられたものを”ホワイト”ボクセルとして、透明な背景を表す。図12は、2D空間の離散化の一例を示す図1200である。(2. Server or service side)
(2.1. Voxelization)
Voxelization is the process of converting 3D geometric objects from their continuous geometric representation into a set of voxels. This best approximates continuous objects to 3D discrete space. The 3D discrete space is a set of integrated grid points in the 3D Euclidean space defined by Cartesian coordinates (x, y, z). A voxel is a spatial grid volume centered on an integrated grid point. Map the voxel values to {0,1}. A voxel to which “1” is assigned is called a “black” voxel and represents an opaque object. FIG. 12 is a diagram 1200 illustrating an example of discretization in 2D space.
頂点、稜線またはフェースを共有している場合は(図12を参照のこと)、2つのボクセルは”26隣接”である。各ボクセルは26個のこのような隣接ボクセルを有する。8個は頂点(角)を中心ボクセルと共有し、12個は稜線を共有し、6個はフェースを共有している。フェース共有ボクセルを”6隣接”と定義して、稜線共有およびフェース共有ボクセルを”18隣接”と定義する。ボクセル化の従来のアプローチでは、多角形モデル、パラメトリック曲線または陰関数表面を入力として用いる。スキャン充填または反復細分アルゴリズムを、ボクセル化に用いる。ボクセル化の前に、モデルを変換およびスケーリングに対して正規化する。スケール要因をデータベースに保存して、さらに計算を行う。 When sharing vertices, edges or faces (see FIG. 12), the two voxels are “26 neighbors”. Each voxel has 26 such adjacent voxels. 8 share vertices (corners) with central voxels, 12 share ridgelines, and 6 share faces. Face sharing voxels are defined as “6 neighbors”, and edge sharing and face sharing voxels are defined as “18 neighbors”. Traditional approaches to voxelization use polygonal models, parametric curves or implicit surfaces as inputs. A scan filling or iterative subdivision algorithm is used for voxelization. Prior to voxelization, the model is normalized to transformation and scaling. Store the scale factor in the database for further calculations.
一実施の形態では、3Dモデルのボクセル化のACISソリッドモデリングカーネルを用いる。ACISカーネルに対する入力は、境界表現モデルである。図13は、ボクセル化アルゴリズムの例示の疑似コードを示す図1300である。一実施の形態では、3Dモデルの境界ボックスを構築して、最小境界ボックス次元により選択したボクセルサイズ、またはユーザ指定のボクセルサイズを用いる。次に、離散境界ボックスの次元を計算する。3Dモデルの全フェースおよび稜線にはそれぞれ、フェースIDと稜線IDとが割り当てられていて、スタックを各フェースおよび各稜線に生成する。各種のプログラム条件やメモリ等により、フェースおよび稜線スタックを独立させることも、依存させることもできる。ボクセルサイズを増分することにより3Dモデルをループして、モデルとの各ボクセルの交点を調べる。’1’を、ボクセルを含む位置でテキストファイルに追加して’0’をボクセルを含まない位置にそれぞれ追加する。ボクセルを含むすべての位置には、モデルと交差するすべてのフェースおよび稜線が与えられて、対応するフェースおよび稜線のフェースIDと稜線IDとを検討中のボクセルに保存する。ボクセルと交差するフェースおよび稜線については、検討中のボクセルをフェースおよび稜線スタックに保存する。従って、現時点では、フェース/稜線からボクセルを参照したり、その逆を行ったりすることができる。この文書のいずれかに記載の簡易型ワイヤレームアルゴリズムへの入力としてこれを用いることができる。多角形モデルのボクセル化についても行うことができることに留意することは重要である。多角形モデルのボクセル化処理について、次のセクションで示す。 In one embodiment, a 3D model voxelized ACIS solid modeling kernel is used. The input to the ACIS kernel is a boundary representation model. FIG. 13 is a drawing 1300 illustrating exemplary pseudo code for a voxelization algorithm. In one embodiment, a bounding box of the 3D model is constructed and a voxel size selected by the minimum bounding box dimension or a user specified voxel size is used. Next, the dimensions of the discrete bounding box are calculated. A face ID and a ridge line ID are assigned to all faces and ridge lines of the 3D model, and a stack is generated for each face and each ridge line. The face and ridge line stack can be made independent or dependent depending on various program conditions, memories, and the like. Loop through the 3D model by incrementing the voxel size and examine the intersection of each voxel with the model. '1' is added to the text file at the position including the voxel, and '0' is added to the position not including the voxel. All positions and ridgelines that intersect the model are given to all locations that contain the voxel, and the face ID and ridgeline ID of the corresponding face and ridgeline are stored in the voxel under consideration. For faces and edges that intersect a voxel, the voxel under consideration is stored in the face and edge stack. Therefore, at present, it is possible to refer to the voxel from the face / ridgeline and vice versa. This can be used as input to the simplified wireframe algorithm described in any of this document. It is important to note that voxelization of polygonal models can also be done. The voxelization process of the polygon model is shown in the next section.
3Dモデルは、フェースオブジェクトのリストから成る。フェースオブジェクトは、得られる3次元ソリッドのフェースを表す。フェースは、フェースの頂点の整列したリストと、図14に示す例示の3Dモデル1400に示すようなファセットオブジェクトのリストとから成る。ファセットリストは、ソリッドのフェースを三角形にすることにより生成した三角形のリストを含む。この構造は、ソリッドモデルの正しいワイヤフレームビューを示すことができるので、ファセット三角形のリストだけを保存することよりも良い。この構造はまた、フェースに属するすべての三角形の情報を維持する。これにより、クライアント側でフェースを選ぶことができるようになる。図15は、立方体1500のこのデータ構造の一例を示す。立方体1500は、6つのフェースオブジェクトから成る。フェースオブジェクトは、点およびファセットオブジェクトから成る。例えば、フェース2は4点(A、B、C、およびD)と2つのファセットオブジェクトから成る。図15に示すように、ファセットオブジェクトの1つは、3つの点A、BおよびCと、ファセットに対する法線と、およびファセットが属するフェース数とを保存する。ファセットとフェースとの間のマッピングがわかっているので、多角形モデルのボクセル化を行って、上記図13の例示の疑似コード1300で述べたように、フェースIDを各ボクセルに保存することができる。 The 3D model consists of a list of face objects. The face object represents a face of the obtained three-dimensional solid. A face consists of an ordered list of face vertices and a list of facet objects as shown in the
例示のボクセル化アルゴリズムと前述のアプローチとの間の大きな違いについて、以下に列挙する。 The major differences between the exemplary voxelization algorithm and the above approach are listed below.
並列化:ボクセル化は簡易ドメイン分解問題なので、並列計算の対象となる。各スレーブ処理装置にドメイン範囲を割り当てることができ、マスタ処理装置は結果を集めることができる。 Parallelization: Since voxelization is a simple domain decomposition problem, it is subject to parallel computation. Each slave processor can be assigned a domain range, and the master processor can collect the results.
ボクセルサイズ:3Dエンジニアリングモデルのボクセル化のサイズ範囲を拡大する。大抵のエンジニアリング形状に対する理想的なボクセルサイズは、最小境界ボックス次元の1/32〜1/64倍の範囲にある。”理想的な”ボクセルサイズの条件は、部品の大きな特徴がボクセルモデルに取り込まれていることである。すなわち、非常に小さな特徴がボクセル化する間に失われてしまうのは、特徴サイズがボクセルサイズよりも小さいからである。 Voxel size: Extends the size range of voxelization of 3D engineering models. The ideal voxel size for most engineering shapes is in the range of 1/32 to 1/64 times the minimum bounding box dimension. The “ideal” voxel size requirement is that a large part feature is incorporated into the voxel model. That is, very small features are lost during voxelization because the feature size is smaller than the voxel size.
適応ボクセル化:3Dモデルの適応ボクセル化を実行する。適応ボクセル化は、3Dモデルをボクセル化して、ボクセルモデルを3Dモデルとの正確度について評価して、および最後に許容できるボクセルモデルが得られるまで、前のボクセルサイズをより小さいボクセルサイズに成るまで再びボクセルかするという反復処理である。 Adaptive voxelization: Perform adaptive voxelization of the 3D model. Adaptive voxelization voxels the 3D model, evaluates the voxel model for accuracy with the 3D model, and until the last acceptable voxel model is obtained until the previous voxel size is a smaller voxel size It is an iterative process of voxeling again.
フェース/稜線情報のボクセルへの保存:3Dモデルはフェース/稜線情報を各サーフェスボクセルに保存している。ボクセルに保存にしたフェースIDの一例を、図16の図1600に示す。ボクセル化の前に、フェースおよび稜線IDを、3Dモデルの各フェースおよび稜線に割り当てる。ボクセル化が実行されているので、各ボクセルに対するフェース/稜線の交点を調べて、フェース/稜線IDを交差しているボクセルに保存する。稜線ID保存処理は、図16に示すフェースIDの保存処理と同様である。フェース/稜線ID情報を簡易型ワイヤフレームに用いる。これは本発明で後からより詳細に説明する。 Saving face / edge information in voxels: The 3D model saves face / edge information in each surface voxel. An example of the face ID stored in the voxel is shown in FIG. Prior to voxelization, face and edge IDs are assigned to each face and edge in the 3D model. Since voxelization is performed, the intersection of the face / edge line for each voxel is examined, and the face / edge ID is stored in the intersecting voxel. The ridge line ID storage process is the same as the face ID storage process shown in FIG. The face / ridge line ID information is used for the simplified wire frame. This will be explained in more detail later in the present invention.
ソリッドモデリングカーネルを用いるボクセル化:各種の本発明の実施の形態では、任意の利用可能なアルゴリズムを用いてボクセル化を実行するのとは反対に、ACISソリッドモデリングカーネルを用いてボクセル化を実行している。これが重要な理由は、従来利用可能なアルゴリズムでは、フェースおよび稜線IDをボクセルモデルに保存することが不可能だからである。 Voxelization using a solid modeling kernel: In various embodiments of the invention, voxelization is performed using an ACIS solid modeling kernel, as opposed to performing voxelization using any available algorithm. ing. This is important because conventionally available algorithms cannot store face and edge IDs in a voxel model.
他にも本ボクセル化アルゴリズムをいろいろ用いることができる。例えば、
距離ボリューム生成:距離ボリュームを、ボリュームデータセット内で表現する。特定のボクセルに保存にした特定の値はそれを表す3Dモデルのサーフェスまでの最短距離を表している。距離ボリューム表現は、多数のグラフィックスアプリケーションにとって重要なデータセットであり、製造における視覚化領域では最も顕著である。モデルのサーフェスからの距離を計算して、ボクセルデータ構造にそれを保存することができるので、距離ボリュームは、ボクセル化にACISを用いることでの自然の成り行きである。距離ボリュームを用いるアプリケーションのいくつかとして、CSGサーフェス評価、オフセットサーフェス生成、実形状製造における最大または最小厚さの範囲の決定、および3Dモデルモルフィングがあげられる。Various other voxelization algorithms can be used. For example,
Distance volume generation: A distance volume is represented in a volume data set. The particular value stored in a particular voxel represents the shortest distance to the surface of the 3D model that represents it. Distance volume representation is an important data set for many graphics applications and is most prominent in the visualization area of manufacturing. The distance volume is a natural consequence of using ACIS for voxelization because the distance from the surface of the model can be calculated and stored in a voxel data structure. Some applications that use range volumes include CSG surface evaluation, offset surface generation, determination of maximum or minimum thickness ranges in real shape manufacturing, and 3D model morphing.
(2.2.スケルトン化)
(2.2.1.スケルトン化の定義)
各種の本発明の実施の形態では、スケルトン表現(以下”スケルトン”)を、3D部品の主形状の最小表現”として定義している。言い換えれば、スケルトンは、小さな円弧やホール等の形状の”小さな”特徴は無視しているが、”主な”特徴は保持して、部品の”主な”位相関係を保っている簡易型表現である。スケルトン化は、このようなスケルトンを生成する任意の処理である。(2.2. Skeletonization)
(2.2.1. Definition of skeletonization)
In various embodiments of the present invention, a skeleton representation (hereinafter “skeleton”) is defined as a “minimum representation of the main shape of a 3D part. In other words, a skeleton has a shape such as a small arc or a hole”. A simplified representation that ignores small "features" but retains "main" features and preserves the "main" topological relationship of the part.Skeletonization is an arbitrary way to generate such skeletons. It is processing of.
スケルトンは、
a.境界から生成され、
b.接続性を保ち、
c.境界ノイズが無く、
d.回転不変量で、
e.計算が簡易である。Skeleton
a. Generated from the boundary,
b. Stay connected,
c. There is no boundary noise,
d. Rotation invariant,
e. Calculation is simple.
(2.2.2.スケルトンの数学的モデルおよびスケルトン化)
(スケルトンの正規の定義)
スケルトンは、タプルS=〈G,T〉ただし、
G={g1,g2,…,gn}はスケルトンを構成する幾何エンティティの有限集合で、且つ、
Tが、要素Gの間の位相接続性を定義する、n×n隣接関係行列である。(2.2.2. Mathematical model of skeleton and skeletonization)
(Regular definition of skeleton)
The skeleton is a tuple S = <G, T> where
G = {g1 , g2 ,..., Gn } is a finite set of geometric entities constituting the skeleton, and
T is an nxn adjacency matrix that defines the phase connectivity between elements G.
スケルトンが存在するには、Gを以下の集合として定義する:
G=E∪L∪S∪H、ただし、
E={e1,e2,…,ep}は稜線の集合で、
L={l1,l2,…,lq}はループの集合で、
S={s1,s2,…,sr}はサーフェスの集合で、
H={h1,h2,…,hs}はホールの集合である。
しかしながら、集合E,L,S,およびHは、インスタンスSについてすべてがゼロ以外である必要はない。For a skeleton to exist, define G as the following set:
G = E∪L∪S∪H, where
E = {e1 , e2 ,..., Ep } is a set of edges,
L = {l1 , l2 ,..., Lq } is a set of loops,
S = {s1 , s2 ,..., Sr } is a set of surfaces,
H = {h1 , h2 ,..., Hs } is a set of holes.
However, the sets E, L, S, and H need not all be non-zero for instance S.
行列Tを次のように定義する:
T=[tij]n×n、ただし、
tij=giがgjに隣接しているならばN
そうでないならば0
且つ、Nは、エンティティgiとgjとの間の接続性を記述するゼロ以外の数である。Define the matrix T as follows:
T = [tij ]n × n where
tij = N if gi is adjacent to gj
0 otherwise
And N is a non-zero number describing the connectivity between entities gi and gj .
スケルトンが存在するには、GとTとはゼロ以外でなければならない。 For a skeleton to exist, G and T must be non-zero.
(幾何特徴の正規の定義)
形状Ψの幾何特徴γを、スケルトンSたった1つの幾何エンティティに縮小する幾何エンティティei(i=1..n)の集合として定義する。場合によっては、全形状を1つの幾何特徴とすることが可能である。(Regular definition of geometric features)
Define the geometric feature γ of the shape Ψ as a set of geometric entities ei (i = 1... N) that reduce to a single skeleton S geometric entity. In some cases, the entire shape can be a single geometric feature.
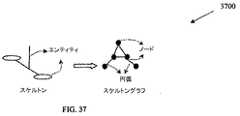
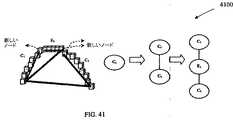
図17に示す例示の形状1700では、Ψ内の幾何エンティティが3つ以上であっても、形状Ψに2つの幾何特徴が示されている。スケルトンSは2つの幾何エンティティを有する。ループおよび稜線である。 In the
(形状の正規の定義)
形状は、タプルΨ<γ,τ>である。ただし、γ={γ1,γ2,…,γm}形状を構成する幾何特徴の集合で、且つ、
τは、要素γの間の位相接続性を定義するm×mの隣接関係である。(Regular definition of shape)
The shape is a tuple Ψ <γ, τ>. Where γ = {γ1 , γ2 ,..., Γm } is a set of geometric features constituting the shape, and
τ is an m × m adjacency that defines the phase connectivity between elements γ.
行列τ=[τuv]m×m、ただし、
τij=γuがγvに隣接しているならば1
そうでないならば0
形状が存在するには、γとτとが共にゼロ以外である。Matrix τ = [τuv ]m × m , where
1 if τij = γu is adjacent to γv
0 otherwise
For a shape to exist, both γ and τ are non-zero.
(スケルトン化の正規の定義)
スケルトン化を、マッピングO:Ψk→Sk−□と定義する。ただし、
Skは、形状Ψkをスケルトン化演算子にかけて生成したもので、□はスケルトン化の間に除去したノイズ係数である。(Regular definition of skeletonization)
Skeletonization is defined as mapping O: Ψk → Sk − □. However,
Sk is generated by applying the shape Ψk to the skeletonization operator, and □ is a noise coefficient removed during the skeletonization.
スケルトン化マッピングの一例である図18に示すように、本コンテキストスケルトン化は多対1マッピングであることが容易にわかる。 As shown in FIG. 18 as an example of the skeletonization mapping, it can be easily understood that the context skeletonization is a many-to-one mapping.
(2.2.3.形状のカテゴリ分類)
工学的形状を、次のカテゴリに分類することができる:
i.ソリッド:ソリッド様形状は通常、そのサイズと比較して、素材の使用率が高い。大抵、一定でない壁の厚さを有し、特徴がほとんどない。ソリッド形状は通常、機械加工または鍛造で製造される。成形または鋳造等の実形状処理で製造されるソリッド部品は非常に少ない。
ii.シェル:シェル様形状は通常、そのサイズと比較して、素材の使用率はきわめて小さい。大抵、一定の厚さを有し、簡易な形状である。ソリッド形状は通常、シート状金属または成形または鋳造等の実形状処理で製造される。管状形状についても、シェル様形状のカテゴリに入る。
iii.ハイブリッド:名称が示唆するように、ハイブリッド形状は、上記2つの形状の組み合わせである。形状のある部分はソリッド様特徴を有し、ある部分はシェル様特徴を有する。通常、成形または鋳造により製造される。(2.2.3. Shape category classification)
Engineering shapes can be divided into the following categories:
i. Solid: Solid-like shapes usually have higher material usage compared to their size. Usually, it has a non-constant wall thickness and few features. Solid shapes are usually manufactured by machining or forging. Very few solid parts are produced by actual shape processing such as molding or casting.
ii. Shell: Shell-like shapes usually have very little material usage compared to their size. Usually, it has a certain thickness and has a simple shape. The solid shape is usually produced by sheet metal or actual shape processing such as molding or casting. Tubular shapes also fall into the category of shell-like shapes.
iii. Hybrid: As the name suggests, the hybrid shape is a combination of the above two shapes. Some parts of the shape have solid-like features and some parts have shell-like features. Usually produced by molding or casting.
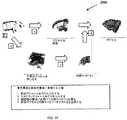
図19に例示の各タイプの形状を示す。 FIG. 19 shows each type of shape illustrated.
(2.2.4.スケルトン化方法)
上記の形状の3つのカテゴリに対するスケルトン化方法は互いに異なることがわかる。また図19は、形状の異なるカテゴリに対するスケルトン化方法を示す。例えば、ソリッド形状のための角柱状スケルトン化方法、特別なカテゴリである管状形状(これはシェル様である)のための管状スケルトン化方法、残りの形状(シェル様またはハイブリッドである)のための簡易型ワイヤフレーム方法である。角柱状、管状および簡易型ワイヤフレームスケルトンの任意の組み合わせを、ユーザが適切に相互作用させてスケルトンとして形成することもできる。(2.2.4. Skeletonization method)
It can be seen that the skeletonization methods for the three categories of the above shapes are different from each other. FIG. 19 shows a skeletonization method for categories having different shapes. For example, prismatic skeletonization methods for solid shapes, tubular skeletonization methods for a special category of tubular shapes (which are shell-like), and for the remaining shapes (shell-like or hybrid) This is a simplified wire frame method. Any combination of prismatic, tubular and simplified wireframe skeletons can also be formed as skeletons with appropriate interaction by the user.
(2.2.4.1.角柱状スケルトン化)
スケルトンの概念は、形状の一意の記述子である。従って、本発明の実施の形態のあるものでは、スケルトンは、類似の工学的特性を持つ形状の種類について説明している。各種の本実施の形態は、類似のスケルトンを探索する。これにより、類似の形状を導く。画像処理の関連領域では、スケルトン化処理を用いて、複雑なピクセル(2D)またはボクセル(3D)離散ジオメトリをワイヤ(1D)表現に単純化する。スケルトンから3Dジオメトリを生成する3つのアプローチは次の通りである:
i.距離変換:距離変換は、スケルトン化で広く用いられている。早く簡単に計算を行う。しかしながら、遠くからスケルトンを変換するには、かなりのノイズ除去が必要となり、しばしば位相が不安定になる。すなわち、位相を保てない。
ii.ユークリッドスケルトン:ユークリッドスケルトンは、内側軸変換とも呼ばれる。これらは計算上複雑で、スケルトン化の間に不要の付属物を生成する。これらの理由により、ユークリッドスケルトンを本発明の各種の実施の形態で用いることは、好ましくない。しかしながら、さらに簡潔化処理を発展させて、本発明で用いることができる。ユークリッドスケルトンの一例を図20に示す。
iii.シンニングアルゴリズム:シンニングアルゴリズムは、医用画像作成分野で広く用いられている。シンニングは、ボクセルモデルをボクセルの厚さであるスケルトン表現に縮小する処理である。条件位相保存する条件を調べた後で、ボクセルを消去する。6つの方向は通常、位相接続性を調べるために定義される。上下東西南北である。シンニングアルゴリズムには、従来2つのタイプがある。直列と並列である。(2.2.4.1. Prismatic skeletonization)
The skeleton concept is a unique descriptor of a shape. Thus, in some of the embodiments of the present invention, the skeleton describes types of shapes with similar engineering characteristics. The various embodiments search for similar skeletons. This leads to a similar shape. In the relevant area of image processing, a skeletonization process is used to simplify complex pixel (2D) or voxel (3D) discrete geometry into a wire (1D) representation. The three approaches to generating 3D geometry from a skeleton are as follows:
i. Distance transformation: Distance transformation is widely used in skeletonization. Perform calculations quickly and easily. However, converting the skeleton from a distance requires significant noise removal and often results in an unstable phase. That is, the phase cannot be maintained.
ii. Euclidean skeleton: Euclidean skeleton is also called inner axis transformation. These are computationally complex and produce unwanted appendages during skeletonization. For these reasons, it is not preferred to use the Euclidean skeleton in various embodiments of the present invention. However, further simplification processing can be developed and used in the present invention. An example of the Euclidean skeleton is shown in FIG.
iii. Thinning algorithm: The thinning algorithm is widely used in the field of medical image creation. Thinning is a process of reducing the voxel model to a skeleton representation that is the thickness of the voxel. After checking the condition for preserving the condition phase, the voxel is erased. Six directions are usually defined to examine phase connectivity. It is up, down, east, west, south, and north. There are two conventional thinning algorithms. Series and parallel.
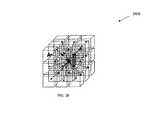
名称が示唆するように、直列アルゴリズムは、ボクセルを6つの方向の任意の1つから別々に消去することにより、シンニングを実行する。並列アルゴリズムは、ボクセルを6つの方向すべてから同時に消去する。実際には、これらアルゴリズムのいずれもシンニングに用いられる。本発明では、任意の並列シンニングアルゴリズムはいずれも、中間サーフェスを用いるというよりもむしろ、3Dボクセルモデルを内側軸に縮小する。その中間サーフェスおよびその中間の、例示の3Dボクセルモデルを図21に示す。位相接続性、小変更下での安定性、および計算効率の要件のバランスが最もよくとれているので、シンニングは、本発明でスケルトン化方法として用いる方法である。また、距離変換とシンニングとの組み合わせを用いて、角柱状スケルトンを得ることができる。 As the name suggests, the serial algorithm performs thinning by erasing the voxels separately from any one of the six directions. The parallel algorithm erases voxels from all six directions simultaneously. In practice, any of these algorithms is used for thinning. In the present invention, any arbitrary parallel thinning algorithm reduces the 3D voxel model to the inner axis rather than using an intermediate surface. An example 3D voxel model of the middle surface and the middle is shown in FIG. Thinning is the method used as the skeletonization method in the present invention because it best balances the requirements of phase connectivity, stability under small changes, and computational efficiency. Moreover, a prismatic skeleton can be obtained by using a combination of distance conversion and thinning.
(2.2.4.2.管状スケルトン化)
管状モデルを、1つ以上の管構造を有する3Dジオメトリモデルとして定義する。シンニングアルゴリズムは、角柱状部品に基づいて、3D管状部品のシンニングを行うと、不測の結果が生じることが間々ある。例示の図22の管状部品に示すように、部品が複数の管から成る場合は、シンニングアルゴリズムはうまく作用しない。この場合は、内部キャビティボリューム充填(Filling Internal Cavity Volume:FICV)と呼ばれる前処理工程を部品ボクセルに用いて、管状部品ボクセルを角柱状部品ボクセルに変換することができる。(2.2.4.2. Tubular skeletonization)
A tubular model is defined as a 3D geometry model having one or more tube structures. The thinning algorithm often produces unexpected results when thinning 3D tubular parts based on prismatic parts. As shown in the exemplary tubular part of FIG. 22, the thinning algorithm does not work well if the part consists of multiple tubes. In this case, a tubular part voxel can be converted to a prismatic part voxel using a pre-processing step called Filling Internal Cavity Volume (FICV) for the part voxel.
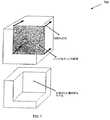
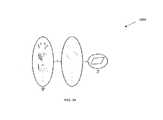
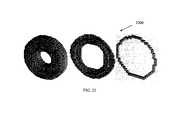
図23は、充填して管状部品ボクセルを角柱状部品ボクセルに変換する必要があるボリュームを示す。図23の陰影の付いたボリュームを、管状キャビティボリュームと呼ぶ。FICVに基本的な概念は、管状キャビティボリュームの充填である。管状キャビティボリュームを充填するには、キャビティボリュームのどの部分を充填するのか、モデルの境界ボリューム内の全キャビティボリュームから識別する必要がある。ボクセルモデルを介してキャビティボリュームを得ることができる。ボクセル化の後、ボクセルがモデル内に存在する場合は、各ボクセルは”1”の値を有し、ボクセルがモデルの外にあれば、”0”の値を有する。図24の画像2はボクセル化の結果を示し、図24の画像4はキャビティボリュームを表す逆のボクセル化の結果を示す。しかしながら、キャビティボリュームが常にキャビティボリュームを意味するわけではないのは、キャビティボリュームが境界ボリューム内の余分なボリュームも含んでいるからである。ボクセルの位置に基づいて、キャビティボリュームを、内部キャビティボリュームおよび外部キャビティボリュームとして分類することができる。内部キャビティボリュームは、部分が囲むキャビティボリュームの一部である。管状構造では、この内部キャビティボリュームにより管のキャビティボリュームを表すことができる。内部キャビティボリュームとは逆に、外部キャビティボリュームは、モデル境界の外側に位置するキャビティボリュームの一部である。FICV処理は、キャビティボリュームの内部キャビティボリュームと呼ばれる管状のボリュームをどのように識別するかということに大きく寄与している。 FIG. 23 shows a volume that needs to be filled to convert a tubular part voxel to a prismatic part voxel. The shaded volume in FIG. 23 is referred to as a tubular cavity volume. The basic concept for FICV is the filling of the tubular cavity volume. To fill the tubular cavity volume, it is necessary to identify which part of the cavity volume to fill from the total cavity volume within the boundary volume of the model. The cavity volume can be obtained via the voxel model. After voxelization, if a voxel is present in the model, each voxel has a value of “1”, and if the voxel is outside the model, it has a value of “0”.
内部キャビティの主な特性の1つは、その視認性である。大抵の場合、内部キャビティボリュームはモデルに隠れているか、遮られているので、外部ボリュームよりも見えにくくなっている。ボリュームがどの程度見えているかを測定するには、視認性の度合を定義する。視認性の度合は、ボリュームがどの程度見えているか識別するものである。ボリュームが全方向から完全に見えている場合は、その視認性の度合は1である。ボリュームが完全に他のオブジェクトから遮断されている場合はどの方向からも見えないので、その視認性の度合は0である。”A”のキャビティボクセル(図25に図示)の場合、管状ボリュームの入り口にあるので、ボクセル半分見えているためその視認性は0.5である。FICV処理の基本的なやり方は、その視認性を用いて内部キャビティボリュームを識別することである。まず、FICVによりキャビティボリュームをボクセル化して、各キャビティボクセルの視認性の度合を測定して、その視認性の度合いが低い場合はキャビティボクセルを内部キャビティとして決定する。 One of the main characteristics of the internal cavity is its visibility. In most cases, the internal cavity volume is hidden or obstructed by the model, making it less visible than the external volume. To measure how much the volume is visible, define the degree of visibility. The degree of visibility identifies how much the volume is visible. When the volume is completely visible from all directions, the degree of visibility is 1. When the volume is completely blocked from other objects, it cannot be seen from any direction, so the degree of visibility is zero. In the case of an “A” cavity voxel (shown in FIG. 25), it is at the entrance of the tubular volume, so that half the voxel is visible and its visibility is 0.5. The basic way of FICV processing is to identify the internal cavity volume using its visibility. First, the cavity volume is voxeled by FICV, the degree of visibility of each cavity voxel is measured, and when the degree of visibility is low, the cavity voxel is determined as an internal cavity.
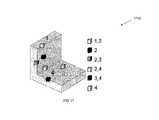
数学的な形式で視認性の度合いを表すには、ソリッド角度の概念を本発明の実施の形態に用いる。ソリッド角度を、半径の二乗に数値的に等しいそのサーフェス状の領域により、球体の中心に振られた角度として定義する。図26は、ソリッド角度の概念を示す。図からわかるように、図26以外に、形状の領域はまったく問題ではない。同じ領域を持たない球体のサーフェス状の任意の形状により、同じサイズのソリッド角度を定義する。また、図2600はソリッド角度を定義する要素を示すだけで、ソリッド角度それ自体ではない。ソリッド角度は円すい形に切り取られた空間の定量的なもので、その頂点として球体の中心と、その球状断面の1つとして球体サーフェス状の領域とを持ち、無限に伸びている。最大ソリッド角度は約12.57で、単位球面の全領域に対応し、4πである。ソリッド角度の標準単位は、ステラジアン(sr)である(数学的に、ソリッド角度に単位はないが、実用上ステラジアンを割り当てている)。すべての可視方向を単位球面に投影すると、視認性の度合は次のようになる。
視認性の度合=単位球面の可視領域/単位球面のサーフェス領域
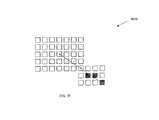
指向性の視認性を、ある方向でボクセルが見えるか見えないかによって定義する。ボクセルのすべての指向性の視認性がわかれば、次に視認性の度合を計算することができる。ボクセルからの方向の数無限なので、ボクセルのすべての指向性の視認性を計算する計算コストは非常に高くなる。計算コストを節約するには、離散指向性の視認性を計算する。離散指向性の視認性という発想は、ボクセル内の有限数の可視方向を等しく分散して定義して、可視領域に対し可視方向の全数をマッピングすることである。N個の等しく分散した方向を定義して、M個の可視方向が存在するとすると、視認性の度合いを、M/Nと表すことができる。分散型等しく分散した方向を集めるには、本発明では、マスクと呼ぶN×N×Nサイズの立方体を用いる。図27は、3×3×3マスクを示す。図27では、各境界ボクセルはボクセルからの可能な可視方向を表す。例えば、指向性のマスクボクセル”A”は、デカルト座標の方向(−1,−1,l)を表す。ボクセルが方向”A”からみえるならば、次にマスクボクセル”A”が見えると印をつける。そうでなければ、見えないと印をつける。この場合、各マスクボクセルは、単位球面を4π/26(全単位球面サーフェス領域/可能な方向の数)ステラジアン占めているものと考えられる。26方向の視認性をすべて得た後で、視認性の度合を以下の計算式の定義から計算することができる。
視認性の度合=単位球面内の可視領域/単位球面のサーフェス領域
=可視マスクボクセル数/全マスクボクセル数
この発想は、N×N×N個のマスクに発展させることができる。例えば、5×5×5マスクは、53−33=98個の指向性マスクボクセルをマスクの境界に有し、N×N×N個のマスクは、N3−(N−2)3=6N2−12N+8個の指向性マスクボクセルを有することになる。In order to express the degree of visibility in mathematical form, the concept of solid angle is used in the embodiment of the present invention. The solid angle is defined as the angle swung to the center of the sphere by its surface-like region that is numerically equal to the square of the radius. FIG. 26 illustrates the concept of solid angle. As can be seen, the region of the shape is not a problem at all other than FIG. A solid angle of the same size is defined by any shape of the surface of a sphere that does not have the same area. Also, the diagram 2600 shows only the elements that define the solid angle, not the solid angle itself. The solid angle is a quantitative amount of a space cut into a conical shape, and has a spherical center as a vertex and a spherical surface area as one of its spherical cross sections, and extends infinitely. The maximum solid angle is about 12.57, corresponding to the entire area of the unit sphere, and 4π. The standard unit of solid angle is steradian (sr) (Mathematically, there is no unit for solid angle, but practically assigns steradian). When all visible directions are projected onto the unit sphere, the degree of visibility is as follows.
Degree of visibility = visible area of unit sphere / surface area of unit sphere The visibility of directivity is defined by whether a voxel is visible or not visible in a certain direction. Once the visibility of all voxel directivities is known, the degree of visibility can then be calculated. Since the number of directions from the voxel is infinite, the computational cost of calculating the visibility of all directivity of the voxel is very high. In order to save calculation cost, the visibility of discrete directivity is calculated. The idea of discrete directivity is to define a finite number of visible directions in a voxel that are equally distributed and map the total number of visible directions to the visible region. If N equally distributed directions are defined and there are M visible directions, the degree of visibility can be expressed as M / N. In order to collect distributed and equally dispersed directions, the present invention uses an N × N × N size cube called a mask. FIG. 27 shows a 3 × 3 × 3 mask. In FIG. 27, each boundary voxel represents a possible visible direction from the voxel. For example, the directional mask voxel “A” represents the Cartesian coordinate direction (−1, −1, l). If the voxel is seen from direction “A”, then mark that the mask voxel “A” is visible. Otherwise, mark it as invisible. In this case, each mask voxel is considered to occupy a unit sphere of 4π / 26 (total unit sphere surface area / number of possible directions) steradians. After obtaining all the visibility in the 26 directions, the degree of visibility can be calculated from the definition of the following calculation formula.
Degree of visibility = visible region in unit sphere / surface region of unit sphere = number of visible mask voxels / total number of mask voxels This idea can be developed into N × N × N masks. For example, a 5 × 5 × 5 mask has 53 −33 = 98 directional mask voxels at the mask boundary, and N × N × N masks have N3 − (N−2)3. = 6N2 -12N + 8 directional mask voxels.
方向(a,b,c)の指向性の視認性を、光線追跡法を用いて計算することができる。光線(a,b,c)を中心ボクセルに放射する。任意のモデルボクセルを通過したならば、次にボクセルは(a,b,c)方向で見えなくなる。言い換えれば、光線が全キャビティボクセルを通過して、最後にその境界当たるなら、次にボクセルは方向(a,b,c)で見えることになる。(a,b,c)方向の指向性の視認性をN×N×Nマスクについて決定するには、マスクの中心から光線(a,b,c)が通過したボクセルのすべての位置を知る必要がある。3Dベルセンハムアルゴリズムは、個の問題を解決する最も一般的に用いられているアルゴリズムである。 The visibility of the directivity in the direction (a, b, c) can be calculated using a ray tracing method. Rays (a, b, c) are emitted to the central voxel. If it passes through any model voxel, then the voxel becomes invisible in the (a, b, c) direction. In other words, if a ray passes through all the cavity voxels and finally hits its boundary, the voxel will then be visible in direction (a, b, c). In order to determine the visibility of the directivity in the (a, b, c) direction for the N × N × N mask, it is necessary to know all the positions of the voxels through which the light beam (a, b, c) has passed from the center of the mask. There is. The 3D Bersenham algorithm is the most commonly used algorithm that solves the individual problem.
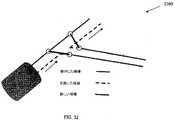
本発明の実施の形態では、ボクセルを通過して、3D空間に展開するために2Dブレセンハムアルゴリズムをどのように応用するか、示している。図28は、ブレセンハムアルゴリズムが2次元空間でどのように作用するか示している。2D面のにuy=vx線があり、ペンを原点から”P”の位置まで引いたと仮定する。次のステップは2つ考えられる。点Aへの対角線と、点Bへの水平のステップである。The embodiment of the present invention shows how to apply the 2D Bresenham algorithm to pass voxels and expand into 3D space. FIG. 28 shows how the Bresenham algorithm works in a two-dimensional space. Assume that there is uy = vx- ray on the 2D surface and the pen is drawn from the origin to the position of “P”. There are two possible next steps. A diagonal line to point A and a horizontal step to point B.

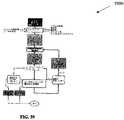
図29は、2Dの7×5マスクにブレセンハムアルゴリズムを用いて、どのように指向性の視認性が得られるかを示している。ボクセルA(0,0)と方向マスクボクセルB(3,−2)がある。ボクセル”A”の視認性の方向(3,−2)を調べるには、処理”FICV”で、光線A−Bが充填モデルボクセルで遮られているかどうか、光線A−Bの全ボクセルを調べる。ブレセンハムアルゴリズムを適用した後、ボクセル”A”と指向性のマスクボクセル”B”との間に位置する全ボクセル”c”および”d”{c(1,−1)、d(2,−1)、B(3,−2)}を計算することができる。ボクセルが充填されているかどうか、各ボクセルを調べる。ボクセル”c”、”d”または”B”がモデルボクセルならば、方向AB(3,−2)を、不可視方向と考える。そうでなければ、ベクトル(3,−2)をボクセルc(1,−1)−>c’(4,−33)、d(2,−1)−>d’(5,−3)、B(3,−2)−>B’(6,−4)に進めることにより、テストを次のパターンに展開する。次に、c’,d’,B’ボクセルがモデルボクセルかどうか調べる。ボクセルの範囲が境界から出るまで、このテストを展開する。計算コストを低減するには、各キャビティボクセルの冗長計算を避けることができるように、3Dブレセンハムアルゴリズムの変数を各方向マスクに保存する。 FIG. 29 shows how directivity visibility can be obtained using the Bresenham algorithm on a 2D 7 × 5 mask. There is a voxel A (0,0) and a direction mask voxel B (3, -2). To check the visibility direction (3, -2) of voxel “A”, in process “FICV”, check all voxels of ray AB, whether ray AB is blocked by the filled model voxel. . After applying the Bresenham algorithm, all voxels “c” and “d” {c (1, −1), d (2,2) located between the voxel “A” and the directional mask voxel “B”. -1), B (3, -2)} can be calculated. Check each voxel to see if it is filled. If the voxel “c”, “d” or “B” is a model voxel, the direction AB (3, −2) is considered as an invisible direction. Otherwise, the vector (3, -2) is converted into the voxel c (1, -1)-> c '(4, -33), d (2, -1)-> d' (5, -3), By proceeding to B (3, -2)-> B '(6, -4), the test is developed to the next pattern. Next, it is checked whether the c ', d', and B 'voxels are model voxels. Deploy this test until the voxel extent is out of bounds. To reduce the computational cost, the 3D Bresenham algorithm variables are stored in each directional mask so that redundant computation of each cavity voxel can be avoided.
一旦、全指向性の視認性情報を計算したならば、ボクセルが内部キャビティなのか外部キャビティなのか、視認性の度合から決定することが可能になる。これは、N×N×Nマスクのすべての可能な方向の全数で分割した、N×N×Nマスクのすべての可視方向の数である。統計的分析によれば、視認性の度合が0.30より少なければボクセルを内部キャビティとして決定することが可能である。 Once the omnidirectional visibility information is calculated, it is possible to determine from the degree of visibility whether the voxel is an internal cavity or an external cavity. This is the number of all visible directions of the N × N × N mask divided by the total number of all possible directions of the N × N × N mask. According to statistical analysis, if the degree of visibility is less than 0.30, the voxel can be determined as the internal cavity.
内部キャビティボリュームの識別結果は、いろいろと応用することができる。応用例の1つは、鋳造領域におけるコアおよび分割コア候補を検出することである。本発明では、各内部キャビティボリュームが、分割方向によりコア候補部品を表している。分割方向を構成した後、本発明を適用して、コアの数を検出して、コアの形状の複雑性を計算することもできる。 The identification result of the internal cavity volume can be applied in various ways. One application is to detect core and split core candidates in the casting region. In the present invention, each internal cavity volume represents a core candidate part by a division direction. After configuring the split direction, the present invention can be applied to detect the number of cores and calculate the complexity of the core shape.
(2.2.4.3.簡易型ワイヤフレーム)
簡易型ワイヤフレームスケルトンは、ボクセル化したモデルから開始する。これは、3Dモデルのフェースおよび稜線に対する基準を有する簡易型ワイヤフレームの目的は、3Dモデルのすべての’主な’特徴/部分を保持して、3Dモデルの’主な’位相を保持することである。また詳細さのレベルの単純化を行うことができる。図31に示すように、ボクセルに保存したフェースIDが2つ以上あるすべてのボクセルを保持することにより、ボクセルワイヤフレームモデルを構成する。(2.2.2.3. Simple wire frame)
A simplified wireframe skeleton starts with a voxelized model. This is because the purpose of the simplified wireframe with reference to the faces and edges of the 3D model is to preserve all the 'main' features / parts of the 3D model and to maintain the 'main' phase of the 3D model It is. It can also simplify the level of detail. As shown in FIG. 31, a voxel wireframe model is configured by holding all voxels having two or more face IDs stored in the voxel.
簡易型ワイヤフレームを得る第1の工程は、データの前処理を行ってフェースループを識別することである。すべてのフェーススタックを考慮して、ボクセルを降順にソートする。ボクセルの降順に、スタックを選ぶ。各スタックは、ボクセルから開始して、隣接ボクセルとの隣接関係を調べて、連結リストタイプのデータ構造を’前’および’次の’ポインタで形成する。再び第1のボクセルになったら、ループを終了する。スタックのすべてのボクセルが横断していない場合は、フェースは内部ループを有している。横断していないボクセルから開始して、連結リストタイプのデータ構造を生成する前の工程を繰り返す。この様に、フェース内の全ループ(連結または非連結の)を識別することができる。残りの作業は、どのループが内部または外部であるか識別することである。別の方法を用いることができるが、フェースの各ループのボクセル数を調べるアプローチを用いることは、利点があって最適である。上位の数のボクセルは’外部’ループで、他のものはすべて、内部に含まれている。すなわち、’内部’ループである。従って、各ループが内部または外部であるか区別されて、フェーススタック内のすべてのループを得ることになる。識別したループが3Dモデルの稜線に沿って傾斜していることが容易にわかる。 The first step in obtaining a simplified wireframe is to perform preprocessing of the data to identify the face loop. Sort voxels in descending order, taking into account all face stacks. Select the stack in descending order of voxels. Each stack starts with a voxel and examines the adjacency relationship with neighboring voxels to form a linked list type data structure with 'previous' and 'next' pointers. When it becomes the first voxel again, the loop is terminated. If all the voxels in the stack are not traversed, the face has an inner loop. Starting with voxels that have not been traversed, the process before generating a linked list type data structure is repeated. In this way, all loops (connected or unconnected) in the face can be identified. The remaining task is to identify which loop is internal or external. Although other methods can be used, using an approach that examines the number of voxels in each loop of the face is advantageous and optimal. The upper number of voxels is the 'outer' loop, everything else is contained inside. That is, an 'inner' loop. Thus, each loop is distinguished as being internal or external to obtain all loops in the face stack. It can be easily seen that the identified loop is inclined along the edge of the 3D model.
次のステップは、図30に示すように、ボクセルワイヤフレーム内のループを横断させることである。すべてのボクセルおよびループが3Dモデル内の稜線に属しているので、モデルを稜線に沿って横断させることができるモデルの最も長い稜線、すなわち、最も大きい数値のボクセルを選ぶ。N×N×Nマスクを構築する。N=2n+1(i=0,1,2…,n)である。3Dモデルの次元および他のヒューリスティックによる。マスク内に有り、且つ3Dモデルの稜線を横断する任意のボクセルを’D’(削除を意味する)と印をつけるループを完全に横断させた後、ボクセルの削除により位相が大きく変化するかどうか調べる。図32に示すように、位相の変更を、方向を速やかに変更する方向ベクトルにより識別する。削除の際に位相が大きく変化するボクセルを、横断させた際に削除したボクセルに連結する。ボクセルを削除する際に、削除したボクセルのフェースIDおよび稜線IDを、それらを削除したボクセルに渡す。すべてのループを使うまでこの処理を繰り返す。これにより、図33に示すように、第1のディテールのレベル(LOD)の単純化が行われる。 The next step is to traverse the loop in the voxel wire frame, as shown in FIG. Since all voxels and loops belong to a ridge in the 3D model, the longest ridge of the model that can traverse the model along the ridge, i.e., the highest numerical voxel is selected. Construct an N × N × N mask. N = 2n + 1 (i = 0, 1, 2,..., N). Depending on the dimensions of the 3D model and other heuristics. Whether any phase changes significantly due to deletion of a voxel after completely traversing a loop marking any voxel in the mask and crossing the edge of the 3D model as 'D' (meaning deletion) Investigate. As shown in FIG. 32, the phase change is identified by a direction vector that quickly changes the direction. Voxels whose phase changes greatly upon deletion are connected to the voxels deleted when traversed. When deleting a voxel, the face ID and edge line ID of the deleted voxel are passed to the deleted voxel. Repeat this process until all loops are used. As a result, as shown in FIG. 33, the first detail level (LOD) is simplified.
さらにLOD単純化を行うには、各保持したループのボクセル数を数えて、ループ間の関係を識別する。すなわち、交差するループ、または共通稜線を共有するループである。これにより、ボクセルに保存にした稜線IDおよびフェースIDから識別することができる。モデルとして可能なLOD単純化の一例を、図34に示す。 To further simplify LOD, the number of voxels in each retained loop is counted to identify the relationship between the loops. That is, they are loops that intersect or loops that share a common edge. Thereby, it is possible to identify from the edge line ID and face ID stored in the voxel. An example of LOD simplification possible as a model is shown in FIG.
CADシステム製造業者がCADモデルにモデル特徴履歴を格納して、およびCADモデルを再実行できる場合は、本発明のようなLOD縮小を有することが可能である。このようなLOD縮小を、スケルトンとして用いることができる。 If the CAD system manufacturer can store the model feature history in the CAD model and re-execute the CAD model, it is possible to have LOD reduction as in the present invention. Such LOD reduction can be used as a skeleton.
(2.2.5.ディテールのレベル)
エンジニアリング部品の異なるディテールを、異なるレベルでスケルトングラフで取り込んで、同じ部品の解像度とする。各種の実施の形態では、スケルトングラフの階層型集合により、3Dモデルを異なるレベルの解像度で表す。ここで述べる3Dモデルのボクセル解像度を変更することにより、各種の階層型スケルトングラフを生成する3Dモデルのボクセル数を、その境界ボックスの最も小さな大きさに基づいて決定する。ボクセルサイズをs/2”として計算する。sが最も小さな境界ボックスで、nが所望の解像度のレベルである。図35は、nの値を変更して生成したいくつかのスケルトンを生成するための例示の疑似コードを示す。(2.2.5 Detail level)
Capture different details of engineering parts in skeleton graphs at different levels to get the same part resolution. In various embodiments, the 3D model is represented at different levels of resolution by a hierarchical set of skeleton graphs. By changing the voxel resolution of the 3D model described here, the number of voxels of the 3D model for generating various hierarchical skeleton graphs is determined based on the smallest size of the bounding box. Calculate the voxel size as s / 2 ". S is the smallest bounding box and n is the desired level of resolution. Example pseudo code for
階層型構造は、人の認知の研究で十分サポートされている。このような研究の1つは、形状組織に対する知覚アプローチが動的なものであることを示唆している。半順序は形状記述の一体部分である仮説的発展または形態形成に基づいていることが明白である。従来のアプローチでは、差異が視覚的にすべて見えない形状は、結局概算に終わってしまう。一般にオブジェクトの形状についての人の理解は、”遠くから近くへ”、”外側から内側へ”、”全体から細部へ”という原理にしたがっている。 Hierarchical structures are well supported by human cognitive research. One such study suggests that the perceptual approach to shape tissue is dynamic. It is clear that the partial order is based on hypothetical evolution or morphogenesis that is an integral part of the shape description. With conventional approaches, shapes that do not have all the differences visually visible end up being approximate. In general, a person's understanding of the shape of an object follows the principles of "from far to near", "from outside to inside", and "from whole to detail".
階層型スケルトングラフ構造は、形状記述に対する動的なアプローチの一例である。動的なアプローチを用いる利点は、異なる解像度で類似の形状を検出できることである。例えば、図36の形状を考える。これら形状は視覚的に類似であるが、従来のアプローチにより非常に異なる形状記述子を持っている。同じボクセル解像度でのこれら形状のスケルトンも、やはり異なる。しかしながら、それぞれボクセル解像度が異なる類似のスケルトンを生成する。従って、あるディテールのレベルでは、それらは類似のものとして検出できる。 A hierarchical skeleton graph structure is an example of a dynamic approach to shape description. The advantage of using a dynamic approach is that similar shapes can be detected at different resolutions. For example, consider the shape of FIG. These shapes are visually similar, but have very different shape descriptors due to conventional approaches. The skeletons of these shapes at the same voxel resolution are also different. However, similar skeletons with different voxel resolutions are generated. Thus, at some level of detail they can be detected as similar.
(2.3.グラフ生成)
上述の方法から得られたスケルトンを処理して高レベルのエンティティを識別できる。稜線、ループ、ノードである。稜線はボクセルの集合で、基本的な幾何エンティティを構成する。ループは、閉経路から成る1つの稜線または稜線群を構成する。ノードは、稜線/ループの終端/交点に記されるボクセルである。スケルトングラフの用語の一例を図37に示す。ボリューム分散した例示のスケルトン稜線を図38に示す。また、例示のスケルトンを有するCADモデルの一例を図39に示す。(2.3. Graph generation)
The skeleton obtained from the above method can be processed to identify high level entities. Edge lines, loops, and nodes. A ridge is a set of voxels and constitutes a basic geometric entity. The loop constitutes one ridge line or ridge line group composed of closed paths. Nodes are voxels marked at the edge / end of loop / intersection. An example of a skeleton graph term is shown in FIG. An example skeleton ridgeline with volume distribution is shown in FIG. An example of a CAD model having an exemplary skeleton is shown in FIG.
各種の本発明の実施の形態では、これらエンティティをスケルトンから識別するスケルトンマーチングアルゴリズムを図40の例示の疑似コード4000として示している。図40に示すこのマーチングアルゴリズム4000は、マスクの集合を用いてスケルトン内の各ボクセルについて隣接ボクセルの種類を識別する。アルゴリズム4000は、マーチングの開始ボクセルを選択する。通常のボクセルは2つの近傍を持つ。各ボクセルの近傍の数を、訪れたものとして計算する。ボクセルが3つ以上の近傍を持つ場合は、それは可能なノード候補である。また、ボクセルがその26ボクセルの近隣で近傍を1つしか持たない場合は、それは終端ノードである。これらボクセル近傍域でさらに処理を行って、正しいノードを識別する。2つのノードの間の訪れたボクセルの集合が、稜線を構成する。次に、稜線を構成しているこのボクセルの集合に、エンティティIDを割り当てて、エンティティスタックに保存する。曲線フィッティングサブルーチンを用いて、稜線のジオメトリを近似する。これは、探索処理での正確な照合に用いることができる。 In various embodiments of the present invention, a skeleton marching algorithm that identifies these entities from a skeleton is shown as exemplary
マーチングアルゴリズム4000がその任意のノードを再訪する場合は、ループが横断したことを意味する。次に、エンティティスタックを処理して稜線、またはループを形成する稜線の集合を識別する。アルゴリズム4000は、ノードスタックを維持して、各ノードの分岐を1つ1つ処理する。一旦、すべてのボクセルを訪ねて関連稜線/ループ処理を行ったならば、アルゴリズム4000を終了する。複数のループが同じスケルトンに存在する場合は、ループのいくつかが1つまたは多数の稜線を他のループと共有している。任意の稜線またはノードを他のループと共有しているループを簡易ループと呼ぶ。マーチングアルゴリズム4000は、すべての簡易ループを識別する。スケルトン内のすべての非簡易ループを得るには、後処理をいくつか行う必要がある。スケルトングラフを深さ優先技術に基づいて分析して、稜線またはノードを共有している複数のループを識別する。 If the
稜線セグメント化は、連結頂点の間で識別された稜線を、容易に比較できる簡易幾何エンティティに変換することを扱う。これには、ねじれのない直線または平面曲線に属しているかどうか、調べることが含まれる。ボクセルが平面曲線を構成していなければ、曲線を2つの直交面に投影して、ねじれ値を用いて曲線を平面曲線にセグメント化する。集合内の各ボクセルを、3空間の離散点として扱う。線をはじめに、ボクセルの集合の2つの新たに検出した終点の間に構成する。このような直線の間の距離で、且つ、集合の最も遠いボクセルを用新しい頂点を決定して、新しいより簡易のエンティティを生成する。これにより、順に新しいノードおよび稜線を形成して、スケルトングラフを生成する。この処理が簡易エンティティを出力して、低レベルグラフマッチャーで曲率を用いて、2Dで容易に比較することができるようになる。図41は、新しい頂点を検出して、曲線を簡易セグメントの集合(2つの平面曲線c1およびC2、および直線稜線E3)に変換する際の、次のステップを示す。図41の右側の図は、新しいエンティティの生成による、グラフ構造での必然的な変更を示す。Edge segmentation deals with converting edge lines identified between connected vertices into simple geometric entities that can be easily compared. This includes examining whether it belongs to an untwisted straight or planar curve. If the voxel does not constitute a planar curve, the curve is projected onto two orthogonal planes and the curve is segmented using the twist value. Each voxel in the set is treated as a discrete point in 3 spaces. A line is first constructed between two newly detected endpoints of the set of voxels. A new vertex is determined by using a distance between such straight lines and using the farthest voxel of the set to generate a new simpler entity. Thereby, new nodes and edge lines are formed in order, and a skeleton graph is generated. This process outputs a simple entity that can be easily compared in 2D using curvature in a low level graph matcher. FIG. 41 shows the next step in detecting new vertices and converting the curve into a set of simplified segments (two planar curves c1 and C2 , and a straight edge E3 ). The diagram on the right side of FIG. 41 shows the necessary changes in the graph structure due to the creation of new entities.
最後に、スケルトングラフの稜線ループのリストをスケルトンノードに対するポインタで構成する。このグラフをデータベースに保存して、後の探索に用いる。従って、3Dモデルのジオメトリを、スケルトンの個別のエンティティ(図38および図39)およびスケルトングラフの位相に取り込む。 Finally, a list of edge loops of the skeleton graph is constructed with pointers to the skeleton nodes. This graph is saved in a database and used for later searches. Therefore, the geometry of the 3D model is incorporated into the individual entities of the skeleton (FIGS. 38 and 39) and the skeleton graph phase.
(2.4.特徴ベクトルの抽出)
スケルトングラフをさらに処理して、探索に用いることができるグラフ関連特徴ベクトル成分を識別する。主な成分いくつかは、稜線ループ、ノード等の数である。スケルトングラフをさらに処理して、ノードのエンティティの間の位相連結の度合いを識別する。異なるタイプの位相連結を、スケルトングラフから計算されるエンティティ隣接関係行列内の適したラプラシアン係数で表す。さらに属性をスケルトングラフから導出して、以下に述べるグラフ比較で用いる。(2.4. Extraction of feature vectors)
The skeleton graph is further processed to identify graph-related feature vector components that can be used for searching. Some of the main components are the number of edge loops, nodes, etc. The skeleton graph is further processed to identify the degree of phase connectivity between the node entities. Different types of topological connections are represented by suitable Laplacian coefficients in the entity adjacency matrix calculated from the skeleton graph. Furthermore, the attribute is derived from the skeleton graph and used in the graph comparison described below.
(2.5.2D図面の3Dスケルトンへの変換)
製造業企業の第1の課題は、より短い時間フレームとより低いコストとで、より良い製品を設計することである。近年、2DCAD設計技術を、3Dソリッドモデリングの利点を持つ技術へ移行することが顕著になっている。より低いコストと、コンピュータ支援ツールへのユニバーサルアクセスが可能なこととから、ほとんどすべての製造業企業は、何らかの種類のCADシステムを設置している。機械工学マガジンによる1998年の調査によると、96%の機械工学のプロが現在CADシステムを使用している。しかし、入手可能で使用が簡単な3Dモデリング技術の出現にも関わらず、製造業企業の大部分が、いまだにそれらの設計処理を2DCAD技術と図面データとに基づいている。コンピュータ援用工学マガジンの1998年の調査によると、60パーセントを超えるCADエンジニアリング作業を2Dで行っていることがわかった。従って、設計者が、類似の3Dモデルと任意の2D図面の2D図面とを探索できる探索機構が必要である。このような探索システムにより、企業が受け継がれたデータを最大に再利用できるようになる。この分野の大抵の該当する作業は類似の部品および画像を検索するコンテンツ/コンテキストベースの探索機構に焦点がおかれている。ジオメトリベースの探索機構も提案されている。類似/照合2D画像および2D図面をデータベースから検索するものである。このようなシステムの1つが提案されている。抽出した線パターンまたはグラフから計算した属性のヒストグラムに基づく属性グラフを用いて、画像(図面)を表すものである。検索を、ヒストグラム比較またはグラフ照合を用いることのいずれかで実行する。このアプローチを適用した方法は形状情報を含んでいるが、3つのオーソグラフィックビューが互いに関連しているという事実が最大限に用いられていないこれら技術は、異なるビューを比較して、2つの図面が一致しているかいないか決定している。本発明の実施の形態では、2D図面を3Dモデルに変換して、類似のモデルを3Dで探索するアプローチを用いている。得られた3D表現を用いて3Dモデルの照合を探索することができるので、従って、CAD図面/モデルのデータベースから2D図面および3Dモデルを探索することが可能になる。これにより、受け継がれたデータの再利用が可能になる。3D形状探索アプリケーションはすでに提示されていて、再構築した3Dモデルを用いて類似のモデルを探索することができる。3Dモデルをまず3Dスケルトンに変換して、次にそれを用いて探索する。従って、この技術では、3D形状サーチエンジンで用いることができる3Dスケルトンを編み出すことになる。(Conversion of 2.5.2D drawing to 3D skeleton)
The first challenge for manufacturers is to design better products with shorter time frames and lower costs. In recent years, it has become prominent to shift 2D CAD design technology to technology having the advantages of 3D solid modeling. Almost all manufacturing companies have installed some sort of CAD system because of the lower cost and the universal access to computer-aided tools. According to a 1998 survey by the Mechanical Engineering Magazine, 96% of mechanical engineering professionals now use CAD systems. However, despite the advent of 3D modeling technology that is available and easy to use, the majority of manufacturing companies are still based on 2D CAD technology and drawing data. A 1998 survey of a computer-aided engineering magazine found that over 60 percent of CAD engineering work was done in 2D. Therefore, there is a need for a search mechanism that allows designers to search for similar 3D models and 2D drawings of any 2D drawing. Such a search system makes it possible to reuse the data inherited by the company to the maximum. Most relevant work in this area focuses on content / context-based search mechanisms that search for similar parts and images. Geometry-based search mechanisms have also been proposed. The similarity / collation 2D image and 2D drawing are retrieved from the database. One such system has been proposed. An image (drawing) is represented using an attribute graph based on an attribute histogram calculated from the extracted line pattern or graph. The search is performed either by using histogram comparison or graph matching. Methods that apply this approach include shape information, but the fact that the three orthographic views are related to each other is not used to the fullest, these techniques compare two views Has been determined whether or not. The embodiment of the present invention uses an approach of converting a 2D drawing into a 3D model and searching for a similar model in 3D. The resulting 3D representation can be used to search for a 3D model match, thus allowing 2D drawings and 3D models to be searched from a CAD drawing / model database. As a result, the inherited data can be reused. A 3D shape search application has already been presented, and similar models can be searched using the reconstructed 3D model. The 3D model is first converted to a 3D skeleton and then searched using it. Thus, this technique creates a 3D skeleton that can be used in a 3D shape search engine.
エンジニアリング図面からソリッドモデルを構成することは、興味のある問題につながっている。この領域の研究は、約30年前にさかのぼる。この30年の間、多数の異なるアプローチを採用してこの問題を解決しているが、まずまず成功している。しかし、事実上問題はいまだ存在し、関心のあるトピックは問題の計算量の表示である。この分野での主な推進要因は、設計再利用、複雑な図面の整合性の自動的な確認、広い応用範囲である。これら生成したソリッドモデルは、FEA、CFD、または設計を分析し、最適化しあるいは評価するシミュレーション、製造の際の素早い試作品製造およびNCパスプランニングに応用されている。図面をソリッドモデルに変換する2つの広いアプローチがある。ソリッドモデルを2D図面から再構築する既存の方法は、おおまかに2つのタイプに分類できる。
>ワイヤフレーム指向アプローチまたはボトムアップアプローチ。
>ボリューム指向アプローチまたはトダウンアプローチ。Constructing solid models from engineering drawings has led to problems of interest. Research in this area goes back about 30 years. During the last thirty years, a number of different approaches have been adopted to solve this problem, but it has been fairly successful. However, in practice the problem still exists and the topic of interest is the display of the computational complexity of the problem. The main drivers in this area are design reuse, automatic verification of the consistency of complex drawings, and a wide range of applications. These generated solid models have been applied to FEA, CFD, or simulations that analyze, optimize or evaluate designs, rapid prototype manufacturing during manufacturing, and NC path planning. There are two broad approaches to converting a drawing to a solid model. Existing methods for reconstructing solid models from 2D drawings can be roughly classified into two types.
> Wireframe-oriented approach or bottom-up approach.
> Volume-oriented approach or to down approach.
ボトムアップアプローチは、ソリッドモデルを構成する順序で候補となる頂点、稜線およびフェースを組み立てたものである。トップダウンアプローチは、2D投影でパターンを認識することにより基本のソリッドを生成して、それらを組み立てて解を得るものである。 The bottom-up approach is an assembly of candidate vertices, edges, and faces in the order in which the solid model is constructed. The top-down approach is to generate basic solids by recognizing patterns in 2D projection and assemble them to obtain a solution.
従って、本発明の実施の形態は、2D図面を3Dスケルトンに変換する。 Accordingly, embodiments of the present invention convert 2D drawings into 3D skeletons.
(方法論)
2D図面を3Dスケルトンに変換することは、多数の異なるやり方で達成できる。方法のいくつかを次に列挙する:
a)ワイヤフレームベースのアプローチ:受け継いだデータはほとんど、スキャン図面として存在する。従って、入力するものはスキャン図面であると考えられる。以下の説明では、入力するものはスキャン図面であると仮定する。ワイヤフレームベースのアプローチ以下のようになる:
・前処理:このステップで、スキャンした2D図面をベクトル形式に変換する。ベクトル化した出力は、3つのオーソグラフィックビューに関係するデータを含む
・3Dワイヤ一フレームに対してベクトル化した図面:3つのオーソグラフィックビューを合成して、3Dワイヤフレームモデルを得る
・3Dモデルに対する3Dワイヤフレーム:次に、3Dワイヤフレームモデルをボリュームベースの3Dモデルに変換する
・3Dスケルトンに対する3Dモデル:次に、3Dモデルを正規化してスケルトン化して、3Dスケルトンを得る。3Dスケルトンを得た後の処理は、セクションl.2.で述べた
b)ボリュームベースのアプローチ:ボリュームベースのアプローチは次の処理のようになる:
・前処理:このステップで、スキャンした2D図面をベクトル形式に変換する。ベクトル化した出力は、3つのオーソグラフィックビューに関係するデータを含む
・3Dモデルに対してベクトル化したビュー:次に、3つのオーソグラフィックビューモデルをボリュームベースの3Dモデルに変換する
・3Dスケルトンに対する3Dモデル:次に3Dモデルを正規化してスケルトン化して、3Dスケルトンを得る。3Dスケルトンを得た後の処理は、セクション1.2.で述べた
c)中間3Dモデルを得ない3Dスケルトンへの直接変換:
・前処理:このステップで、スキャンした2D図面をベクトル形式に変換する。ベクトル化した出力は、3つのオーソグラフィックビューに関係するデータを含む
・ベクトル化したオーソグラフィックビュー3Dスケルトンに直接変換する:この処理は、上記セクション2.3で説明した。前処理が完了してすぐに、正規化を行って、エラーに関するサイズをすべて消去することに留意することが重要である
(用いられる用語:)
ここに示す各種の実施の形態を容易に理解するために、用いられる用語について説明する。
1)共通座標軸:1対のビューで共通の座標軸である。
2)基本稜線およびビュー−稜線:ビューGに頂点が全くない場合は、ビューGの2D稜線GEを基本稜線という。これはIN稜線GEに存在する。そうでなければ、ビュー稜線という。
3)ループ:同一平面稜線の簡易閉路を、ループと定義する。
4)接頂点:1次連続の1対の稜線を分割する2Dビューの頂点を接(tangency)頂点という。接頂点の概念が1対の稜線に対応付けられているので、これをループの頂点に用いる。
5)影頂点:その頂点での稜線の接線がG1とG2との間の共通座標軸に対して垂直ならば、2DビューG1の接頂点G1Vを、隣接ビューG2に対する影という。従って、頂点を1対のビューに対して定義する。
6)ループの分類:ループGL2を、次のようにループGL1に対して分類することができる:
・GL2に属するすべての稜線GEがループGL1の内側にあるならば、ループGL1はINループGL2を持つといえる
・GL2に属する稜線のいくつかが領域Pの外側にあって、その他が内側にある場合は、GL1はON−INループGL2を持つといえる
・GL1はON−OUTループGL2を持つといえる
7)ドットループおよびソリッドループ:その稜線のすべてをビュー内のソリッドラインタイプで表すならば、2Dビューのループをソリッドループという。そうでなければドットループという。
8)隣接ループ:ビュー内の2つのループが2つ以上の共通稜線を持つ場合は、次にこれらループを隣接ループという。
9)基本ループおよび非基本ループ:基本ループは、ビュー内にON−INループはないがINループを持つような稜線ループである他のループはすべて、非基本ループという。図42は、例示のループの分類を示す。図42では、ビューlの{1,2,3,9,8,7,5,6,1}、{8,9,10,7,8}および{3,4,5,7,10,9,3}が基本ループである。
10)独立ループ:独立ループは、ビュー内にON−OUTループはないが、OUTループがありうる基本ループである。
11)照合頂点:共通座標軸に沿って同じ座標値を持つ場合は、ビュー内の頂点G1Vを、別のビューG2内の頂点G2Vと一致するという。照合頂点をG1V<−>G2Vと記すことができる。ビュー内に、他のビューの頂点と一致する2つ以上の照合頂点が存在することもある。
12)照合ループ:各頂点G2V⊂G2LがG1V⊂G1L内の少なくとも1つの頂点と一致する場合は、G1に属するループG1Lは、G2に属する照合ループG2Lを持つという(G1!=G2)。1対のビューの影頂点でないすべての接頂点を消去することにより、G2Vを得る。G2LもG1Lを照合ループとして持つ必要はない。しかし持つ場合は、2つのループは上への照合ループとしてわかる。G1L<−>G2Lと記す。
13)上への形成:上への形成は、次の特性を満たすループの集合(l)である:
a.iに対し、j=1,…n(i!=j),GiLi<−>GjLj
ただし、GiLiではGLjは集合lに属する
b.|l|=n、ただし、nは入力2Dビューの数である。
14)所望の稜線:入力オーソグラフィックビュー内の稜線で、現在のソリッドの2D投影にない稜線である。(methodology)
Converting a 2D drawing to a 3D skeleton can be accomplished in a number of different ways. Some of the methods are listed below:
a) Wireframe-based approach: Most of the inherited data exists as scan drawings. Therefore, what is input is considered to be a scan drawing. In the following description, it is assumed that what is input is a scan drawing. A wireframe based approach looks like this:
Pre-processing: In this step, the scanned 2D drawing is converted into a vector format. Vectorized output contains data related to 3 orthographic views. • Vectorized drawing for a 3D wire single frame: 3 orthographic views are combined to obtain a 3D wireframe model. 3D wireframe: Next, convert the 3D wireframe model to a volume-based 3D model. 3D model for 3D skeleton: Next, normalize and skeletonize the 3D model to obtain a 3D skeleton. The processing after obtaining the 3D skeleton is described in section l. 2. B) Volume-based approach as described in: Volume-based approach looks like this:
Pre-processing: In this step, the scanned 2D drawing is converted into a vector format. Vectorized output contains data related to three orthographic views • Vectorized view for 3D model: Next, convert three orthographic view models to volume-based 3D model • For
Pre-processing: In this step, the scanned 2D drawing is converted into a vector format. The vectorized output contains data related to the three orthographic views. • Converts directly to the vectorized
In order to easily understand the various embodiments shown here, terms used will be described.
1) Common coordinate axis: A common coordinate axis for a pair of views.
2) Basic ridge line and view-ridge line: When the view G has no vertices, the 2D ridge lineGE of the view G is referred to as a basic ridge line. This exists at the IN ridge lineGE . Otherwise, it is called a view ridgeline.
3) Loop: A simple cycle of the same plane edge is defined as a loop.
4) Tangent vertex: A vertex of a 2D view that divides a pair of ridges of a linear sequence is referred to as a tangency vertex. Since the concept of the tangent vertex is associated with a pair of ridge lines, this is used as the vertex of the loop.
5) Shadow vertex: If the tangent of the edge line at that vertex is perpendicular to the common coordinate axis between G1 and G2, the tangent vertexG1 V of the 2D view G1 is called a shadow with respect to the adjacent view G2. Thus, vertices are defined for a pair of views.
6) Classification of loop: LoopG L2 can be classified with respect to loopG L1 as follows:
If, all edgesG E belonging toG L2 is inside the loop GL1, loopG L1 is be outside of some of the regions P of the ridge line that belongs to-GL2 be said to have a IN loopG L2 When the others are inside, it can be said thatG L1 has an ON-IN loopG L2.G L1 can be said to have an ON-OUT loopG L2. 7) Dot loop and solid loop: If all the edges are represented by the solid line type in the view, the loop of the 2D view is called a solid loop. Otherwise it is called a dot loop.
8) Adjacent loops: If two loops in the view have two or more common edges, then these loops are called adjacent loops.
9) Basic loop and non-basic loop: The basic loop is an edge loop that has no IN-IN loop in the view but has an IN loop. All other loops are called non-basic loops. FIG. 42 illustrates an exemplary loop classification. In FIG. 42, {1,2,3,9,8,7,5,6,1}, {8,9,10,7,8} and {3,4,5,7,10, 9, 3} is a basic loop.
10) Independent loop: An independent loop is a basic loop where there is no ON-OUT loop in the view but there can be an OUT loop.
11) matching vertices: If having the same coordinate value along a common axis, the vertex G1V in the view, that coincides with the vertexG2 V in another view G2. The verification vertex can be written asG1 V <->G2 V. There may be more than one matching vertex in the view that matches the vertices of other views.
12) Matching loop: If each vertexG2 VG G2 L matches at least one vertex inG1 VG G1 L, the loopG1 L belonging toG1 is said to have a matching loopG2 L belonging toG2 (G1 ! = G2).G2 V is obtained by eliminating all tangent vertices that are not shadow vertices in a pair of views.G2 L need not haveG1 L as a matching loop. But if you have it, you can see the two loops as a matching loop up.G1 L <->G2 L
13) Formation on top: Formation on top is a set of loops (l) that satisfy the following properties:
a. For i, j = 1,... n (i! = j),Gi Li <->Gj Lj
However, inGi Li,G Lj belongs to the set l b. | L | = n, where n is the number of input 2D views.
14) Desired ridgeline: a ridgeline in the input orthographic view that is not in the 2D projection of the current solid.
(方法の例示の実施の形態)
次のセクションでは、で参照した方法論の処理について述べる:
(1.前処理)
2D形状探索の問題を解決するために、まず書類を電子フォーマットに移す。最も広く用いられている方法はスキャンで、”ラスタ画像”を生成する。スキャンした図面を、ピクセル行列に分解する。書類に含まれる語義情報を電子ファイルには移せない。すなわち、符号の意味を解釈しない。従って、”ベクトル化”として知られる前処理ステップがいくつか必要となる。これにより、幾何エンティティ(直線、円弧等)および符号(文字等)の定義に必要な情報をラスタ画像から得る。従って、電子ファイルに保存した情報を解釈して用いて、特徴に基づいて探索して、ソリッドモデル/スケルトン再構成に基づいて再利用することができる。(Exemplary Embodiment of Method)
The next section describes the processing of the methodology referenced in:
(1. Pre-processing)
To solve the 2D shape search problem, the document is first moved to an electronic format. The most widely used method is scanning, which produces a “raster image”. Decompose the scanned drawing into a pixel matrix. Semantic information contained in documents cannot be transferred to electronic files. That is, the meaning of the code is not interpreted. Therefore, some pre-processing steps known as “vectorization” are required. Thereby, information necessary for defining geometric entities (straight lines, arcs, etc.) and codes (characters, etc.) is obtained from the raster image. Therefore, the information stored in the electronic file can be interpreted and used, searched based on the features, and reused based on the solid model / skeleton reconstruction.
・
・
・スキャンタイプ
大抵のエンジニアリング図面は、1ビットモノクロームとしてスキャンできる。記憶空間をほとんど取らず、表示や処理が速い。古い青写真等の汚れがあって背景にしみのある図面ならば、8ビットグレースケールでスキャンして、画像作成ソフトウェアを用いて拡大して、背景やノイズを消去することができる(自動ベクトル化の前に、1対のグレーレベル閾値を用いてノイズおよび他のアーチファクトを取り除くことができる)。・
・
Scan type Most engineering drawings can be scanned as 1-bit monochrome. It takes up little storage space and is fast to display and process. If it is a dirty blueprint or other background-stained drawing, it can be scanned in 8-bit grayscale and enlarged using image creation software to remove background and noise (automatic vectorization). A pair of gray level thresholds can be used to remove noise and other artifacts).
・ラスタベクトル変換
スキャンしたラスタ画像を得た後、これをベクトルフォーマットに変換して、さらに操作を行う。完全なラスタベクトル変換処理には、画像取得、前処理、ライントレース、テキスト抽出、形状認識、位相生成および属性割り当てである。パッケージのいくつかは、各種のタイプのアプリケーションとして販売されている。エンジニアリング図面変換では、ベクトルをラスタ画像から抽出するために、画像のどの部分が線からなり、これらの線がどこから開始してどこで終わるか決定する必要がある。通常、2つの処理が含まれる:
1.画像処理(背景およびノイズの消去)。
2.1ピクセル幅の線へのラスタ画像のシンニング。
3.ベクトル化(ピクセル線から稜線の抽出)。
4.エンティティ認識(直線、円弧円、線ループ等の定義)。-Raster vector conversion After obtaining a scanned raster image, it is converted into a vector format and further operations are performed. Complete raster vector conversion processing includes image acquisition, preprocessing, line tracing, text extraction, shape recognition, phase generation and attribute assignment. Some of the packages are sold as various types of applications. In engineering drawing transformation, in order to extract a vector from a raster image, it is necessary to determine which part of the image consists of lines and where these lines start and end. Usually two processes are involved:
1. Image processing (background and noise removal).
2.1 Raster image thinning to a pixel wide line.
3. Vectorization (extract edge from pixel line).
4). Entity recognition (definition of straight lines, arc circles, line loops, etc.).
厚みがあったり、しみがあったりする領域を1つのピクセル幅を持つアイテムに縮小して、画像をピクセル線に変換するアプローチが、シンニングである。多数の現在利用可能なシンニングおよび稜線検出方法は多数あって、それぞれ異なる数学的アルゴリズムを用いて、異なる結果を生成する。 Thinning is an approach in which an image is converted into a pixel line by reducing an area having a thickness or a stain to an item having one pixel width. There are a number of currently available thinning and edge detection methods, each using a different mathematical algorithm to produce different results.
これら前処理ステップはすべて、該当する形状情報を抽出するために、画像に含まれる情報を理解する画像処理を含む。 All these preprocessing steps include image processing to understand the information contained in the image in order to extract the relevant shape information.
(2.ボトムアップアプローチを用いたオーソグラフィックビューの3Dモデルへの変換:)
ワイヤフレームアプローチはまた、ボトムアップアプローチとして知られている。この方法に含まれる各種の処理は次の通りである:
・各ビュー内の2D頂点から3D候補頂点を生成する。
・3D候補頂点から3D候補稜線を生成する。
・同じサーフェス上の3D候補稜線から3D候補フェースを構成する。
・候補フェースから3Dオブジェクトを構成する。(2. Conversion of orthographic view to 3D model using bottom-up approach :)
The wire frame approach is also known as a bottom-up approach. The various processes involved in this method are as follows:
Generate 3D candidate vertices from 2D vertices in each view.
Generate 3D candidate ridge lines from 3D candidate vertices.
Construct a 3D candidate face from 3D candidate edges on the same surface.
Construct a 3D object from candidate faces.
(このアプローチのメリット)
・より正確である。
・通常ACISから得られる他の基準値についてもあることができる。(Advantages of this approach)
-More accurate.
There can also be other reference values usually obtained from ACIS.
(このアプローチのデメリット)
・入力ビューにおける不一致の結果として問題が発生する事がある。
・計算上非常に高価である。特に、バックトラッキングおよびヒューリスティックを行う可能性のある探索を行って、非常に多くの数の可能なソリッドから解となるソリッドを選ぶ探索を含むからである。(Disadvantages of this approach)
Problems can occur as a result of inconsistencies in the input view.
・ It is very expensive in calculation. In particular, it includes searches that can perform backtracking and heuristics, and that selects a solid that is a solution from a very large number of possible solids.
(3.トップダウンアプローチを用いたオーソグラフィックビューの3Dモデルへの変換)
このアプローチに含まれる一般的な処理について以下に述べる:
1)疑似頂点スケルトンを構成する。
2)疑似ワイヤフレームを構成する。
3)仮想フェースを構成する。
4)切断稜線を導入する。
5)仮想ブロックを構成する。
6)決定する。(3. Conversion of orthographic view to 3D model using top-down approach)
The general processing involved in this approach is described below:
1) Construct a pseudo-vertex skeleton.
2) Construct a pseudo wire frame.
3) Configure a virtual face.
4) Introduce cutting edges.
5) Construct a virtual block.
6) Determine.
図43は、この処理の詳細をさらに示す。他の方法もある。別の実施の形態では、セルベースの再構成を用いる。同様に、2位相再構成についても開発されている。 FIG. 43 further shows details of this process. There are other ways. In another embodiment, cell-based reconstruction is used. Similarly, two-phase reconstruction has been developed.
(このアプローチのメリット)
・常に入力ビューに一致した有効なソリッドモデルがある。
・ワイヤフレーム方法と比較して、計算上安価である。
・形状探索には、概略の3Dモデルだけで十分である。(Advantages of this approach)
There is always a valid solid model that matches the input view.
・ Compared to the wire frame method, it is inexpensive in calculation.
• A rough 3D model is sufficient for shape search.
(このアプローチのデメリット)
・このアプローチは、処理可能なオブジェクトドメインだけに限られている。(Disadvantages of this approach)
• This approach is limited to processable object domains only.
(4.中間3Dモデルのない3Dスケルトンへの直接変換)
上述のように、3D形状探索には、有効な3Dスケルトンで十分である。従って、任意のセットの2Dオーソグラフィックビューを直接3Dスケルトンに変換する方法を提示する。3つのオーソグラフィックビューそれぞれに、2Dスケルトンを得る。次に、オーソグラフィックビューを合成して、所望の3Dスケルトンを得る。この方法を、2Dスケルトン化処理によりさらに2つのアプローチに細分化する。第1のアプローチは、画像処理方法を用いてスケルトン化を実行ととで、第2のアプローチはジオメトリベースの方法を用いてスケルトン化を実行することである。次の説明では、2Dスケルトンを得るジオメトリベースのアプローチを前提としているが、このアプローチを適切に変更して第1のアプローチと共に実行することもできる。(4. Direct conversion to 3D skeleton without intermediate 3D model)
As described above, an effective 3D skeleton is sufficient for 3D shape search. Thus, a method is presented for converting any set of 2D orthographic views directly into a 3D skeleton. Obtain a 2D skeleton for each of the three orthographic views. The orthographic view is then synthesized to obtain the desired 3D skeleton. This method is further subdivided into two approaches by a 2D skeletonization process. The first approach is to perform skeletonization using an image processing method, and the second approach is to perform skeletonization using a geometry-based method. The following description assumes a geometry-based approach to obtain a 2D skeleton, but this approach can be modified appropriately and performed with the first approach.
(二重接続連結リストおよびフェース構造の生成)
次に、3つのオーソグラフィックビューを構成する線セグメントを、二重接続連結リスト構造で表す。この方法を行って、二重接続連結リスト構造を構成する。二重接続連結リスト構造は、線セグメント配列の効率的な表現である。(Generate double connection linked list and face structure)
Next, the line segments constituting the three orthographic views are represented by a double connection linked list structure. This method is performed to construct a double connection linked list structure. A double connected linked list structure is an efficient representation of a line segment array.
頂点のデータ構造を次のように表す:
・頂点のX座標。
・頂点のY座標。
・入射稜線のリスト(反時計回り方向の順の傾き)。Express the vertex data structure as follows:
-The X coordinate of the vertex.
-Y coordinate of the vertex.
A list of incident ridge lines (slope in the counterclockwise order).
ハーフ稜線のデータ構造を次のように表す。
・原点の頂点。
・ツインハーフ稜線(一方は入射)。
・入射フェース(各ハーフ稜線は正確に1つのフェースに属する)。
・次のハーフ稜線(フェースに属する次の連結ハーフ稜線)。
・前のハーフ稜線(フェースに属する前の連結ハーフ稜線)。
・傾き角度(0から360度の間)。The data structure of the half ridge line is expressed as follows.
・ The vertex of the origin.
-Twin half ridge (one is incident).
• Incident face (each half ridge belongs to exactly one face).
The next half ridge line (next connected half ridge line belonging to the face).
The front half ridge line (the previous connected half ridge line belonging to the face).
-Tilt angle (between 0 and 360 degrees).
フェースのデータ構造を次のように表す。
・外側ループの開始稜線。
・内側稜線の開始稜線のリスト。The data structure of the face is expressed as follows.
-The starting edge of the outer loop.
A list of starting ridgelines of the inner ridgeline.
従って、反時計回り方向で頂点の入射稜線を移動するには、上記データ構造を最大に活かすように用いることができる。稜線が頂点に入射しているとすると、そのハーフ稜線の対をとって、そのハーフ稜線に対する次のハーフ稜線を検出することができる。これにより、任意の頂点から入射ハーフ稜線を得ることができる。得られたハーフ稜線が反時計回り方向の次のものであるのは、反時計回り方向に稜線をたどることによりフェースを構成するハーフ稜線を得たからである。同じ手順を繰り返して、この配列内のすべてのフェース/ループを検出することができる。データ構造およびアルゴリズムは、従来利用可能である。線セグメントのセットの配列をO(nLogn)時間で構成することができる。 Therefore, in order to move the incident ridge line in the counterclockwise direction, the above data structure can be used to the maximum. If the ridge line is incident on the apex, the next half ridge line for the half ridge line can be detected by taking a pair of the half ridge lines. Thereby, an incident half ridge line can be obtained from an arbitrary vertex. The reason why the obtained half ridge line is the next in the counterclockwise direction is that the half ridge line constituting the face is obtained by tracing the ridge line in the counterclockwise direction. The same procedure can be repeated to detect all faces / loops in this array. Data structures and algorithms are conventionally available. An array of sets of line segments can be constructed in O (nLogn) time.
(3つのオーソグラフィックビューの頂点、稜線およびループの照合の識別)
頂点、稜線およびループの照合の識別について、従来詳細に説明されており、当業者が容易に利用できるようになっている。照合ループおよび頂点を検出する方法についても、説明されている:
1.頂点およびループの照合:ループおよび頂点の照合は、3Dソリッド内の同じエンティティに対応するエンティティをグルーピングすることを意味する。影頂点以外に接頂点を用いないが、異なるビュー内の1対の2つのループの照合を行う。また、共通座標の値により、頂点の照合を行う。ループが互いに一致しているならば、次に、上への照合としてフラグを立てる。
2.上への生成:上への生成を検出するには、ループ照合独立ループまたは基本ループと一致するループを検討する。ビュー内のループは、隣接ビュー内に基本または非基本照合ループを有することができる。まず始めに、検討中のすべての基本ループ照合ループが上への照合かどうか調べる。得られた任意の上への照合ループを、リストに保存する。次に、隣接基本ループの合成により、それぞれ検討中の他のビュー内の基本ループに一致する非基本の上への照合ループを得ることが可能かどうか調べる。これらを保存してさらに処理を行う。これらエンティティの保存に用いるデータ構造は、グラフである。(Identification of vertices, edges and loops in the three orthographic views)
Identification of vertex, ridge and loop matching has been described in detail in the past and is readily available to those skilled in the art. The matching loop and vertex detection methods are also described:
1. Vertex and Loop Matching: Loop and vertex matching means grouping entities that correspond to the same entity in a 3D solid. Although no tangent vertex is used other than the shadow vertex, a pair of two loops in different views are matched. Vertices are collated based on the value of the common coordinates. If the loops match each other, then a flag is set as a match up.
2. Up generation: To detect up generation, consider loop matching independent loops or loops that match the base loop. Loops in views can have basic or non-basic matching loops in adjacent views. First, check if all the basic loop matching loops under consideration are matching up. Save the resulting upward matching loop in the list. Next, it is examined whether the synthesis of adjacent elementary loops can obtain a matching loop on the non-basic that respectively matches the elementary loops in the other views under consideration. These are stored for further processing. The data structure used to store these entities is a graph.
一般に、上への生成を、任意のセットのビューで識別する。図44では、ループを、ノードおよび2つのノードと連結する稜線として表している。2つのループは上への照合である。これは、n個に分かれたグラフのループとして見ることができる。nはループの数である。従って、上への生成の検出は、基数nのサブグラフの検出と同等である。幅優先探索を用いて、nlog(n)内にこれを検出する。nは検討中のループの平均の数である。ループの上への照合は、すべてのビュー内のループのセットで、互いに一致している。 In general, the up generation is identified by an arbitrary set of views. In FIG. 44, a loop is represented as a ridgeline connecting a node and two nodes. The two loops are up matching. This can be seen as a loop of n divided graphs. n is the number of loops. Thus, the detection of the upward generation is equivalent to the detection of the radix-n subgraph. This is detected in nlog (n) using breadth-first search. n is the average number of loops under consideration. Matches on top of the loop are consistent with each other in the set of loops in all views.
(3つのオーソグラフィックビューの整理)
上への照合ループのセットを得た後、小特徴を記述する上への照合ループのセットを消去する。上への照合ループのセットは独立または基本ループのみであるよう注意する。またこれらループを消去した結果、得られるビューが分離しないようにする必要がある。(Organization of three orthographic views)
After obtaining the set of up matching loops, we erase the set of up matching loops describing the subfeatures. Note that the set of matching loops up is only an independent or basic loop. It is also necessary to ensure that the views obtained as a result of eliminating these loops are not separated.
(2Dスケルトン化)
次のステップでは、これらループまたはフェースをスケルトン化して図面を簡略化するが、位相は保持する。多角形図形のスケルトンを得るのに、各種の方法が提案されている。これら方法の大部分は、内軸変換(Medial Axis Transformation:MAT)を決定するものである。これら方法の大部分は、ボロノイ図またはデローネイ三角形分割手法のいずれかを利用している。ボロノイまたはデローネイ三角形分割手法を用いずにスケルトンまたはMATを得る、他のアプローチがある。また、適応細分アルゴリズムが提案されている。これは、デローネイ三角形分割手法を利用している。2D領域のスケルトンを、その内点として定義する。これは2つ以上の最も近傍を有する。多角形図形のスケルトンを、最悪でもO(nlogn)時間で得ることができる。多角形図形の境界ノードの数である。図45は、一般的な2D多角形図形のスケルトンを示す。(2D skeletonization)
In the next step, these loops or faces are skeletonized to simplify the drawing but preserve the phase. Various methods have been proposed for obtaining polygonal skeletons. Most of these methods determine the medial axis transformation (MAT). Most of these methods use either Voronoi diagrams or Delaunay triangulation techniques. There are other approaches that obtain skeletons or MATs without using Voronoi or Delaunay triangulation techniques. An adaptive subdivision algorithm has been proposed. This uses the Delaunay triangulation technique. Define the skeleton of the 2D region as its interior point. This has two or more nearest neighbors. A skeleton of a polygon figure can be obtained in O (nlogn) time at worst. The number of boundary nodes of the polygon figure. FIG. 45 shows a general 2D polygon figure skeleton.
(スケルトンの消去)
得られた2Dスケルトンのある部分が必要ないことが、図45からわかる。入力ビューの境界/頂点と接しているスケルトンの稜線を、消去する。従って、簡易型スケルトンが得られる(図46に図示)。(Erasing the skeleton)
It can be seen from FIG. 45 that some portion of the resulting 2D skeleton is not necessary. Erase the edges of the skeleton that touches the boundaries / vertices of the input view. Therefore, a simplified skeleton is obtained (shown in FIG. 46).
(照合ループおよび隣接ループ関係を用いて3つのビュー内のスケルトンの稜線を連結して3Dスケルトンを得る)
一旦、各種のフェースのスケルトンを消去したならば、次のステップは、3つのビュー内のスケルトンを連結して3Dスケルトンを得ることである。図44を参照すると、図44Aは実際の3Dモデルを示し、図44Bは任意のオブジェクトの2Dオーソグラフィックビューを示している。図44Cは、それぞれのビューのスケルトンを消去したものを示している。最初の第2のステップで得られた照合ループを用いて、2Dスケルトン稜線の各種の稜線の接続性を決定する。接続性を維持するとは、すべての照合ループの連結であって、また、3Dスケルトンの各稜線が1つのものとして確かに現れることになる。例えば、ビュー正面図では、縦線が図形の奥行き/高さを表す。また、側面図では、5本の縦線が図形の奥行き/高さを表す。従って、最終のスケルトンでは、たった一本の稜線を保持して図形の奥行きを表す。(
Once the various face skeletons have been erased, the next step is to concatenate the skeletons in the three views to obtain a 3D skeleton. Referring to FIG. 44, FIG. 44A shows an actual 3D model, and FIG. 44B shows a 2D orthographic view of an arbitrary object. FIG. 44C shows an erased skeleton for each view. Using the matching loop obtained in the first second step, connectivity of various ridge lines of the 2D skeleton ridge line is determined. Maintaining connectivity is a concatenation of all the matching loops and will ensure that each edge of the 3D skeleton appears as one. For example, in the view front view, the vertical line represents the depth / height of the figure. In the side view, five vertical lines represent the depth / height of the figure. Therefore, in the final skeleton, only one ridge line is retained to represent the depth of the figure.
(3Dスケルトンの稜線のボクセル化)
一旦、3D稜線が得られたならば、次にボクセル化表現に変換する。基本的に、ボクセル化表現は、3Dスケルトンの稜線の離散化表現である。このステップは簡単な処理ステップである。ボクセル化および正規化についてさらに詳しくは、上記サブセクション2.1を参照のこと。(Voxelization of 3D skeleton edge)
Once the 3D ridge is obtained, it is then converted to a voxelized representation. Basically, the voxelized representation is a discretized representation of the edge of the 3D skeleton. This step is a simple processing step. See subsection 2.1 above for more details on voxelization and normalization.
(データ構造の各種のループおよび稜線の接続性の保存)
最後に、3Dスケルトンが得られたら、サブセクション2.2で説明したように、各種のループ、稜線等をスケルトングラフデータ構造に保存する。次に、これをグラフ比較モジュールの入力として提供する。(Preserving connectivity of various loops and edges of data structures)
Finally, once the 3D skeleton is obtained, the various loops, edges, etc. are stored in the skeleton graph data structure as described in subsection 2.2. This is then provided as input to the graph comparison module.
(3.データベース、探索およびクラスタ化)
(3.1.グラフの比較)
探索システムでデータベースにあるグラフを探索する。このグラフは、クエリー3Dモデルのスケルトングラフに類似している。システムにより、クエリーグラフとデータベースの各モデルとの間の照合の度合いに基づく類似性の程度を評価する。本発明は、間接グラフの形式のスケルトンで表す。グラフのノードがスケルトンの稜線/エンティティを表し、グラフの2つのノードに連結する任意の円弧が対応するスケルトンエンティティの間の連結を表す。従って、スケルトンは、基本的に稜線グラフとして表される。グラフの各ノードは、スケルトン稜線の次の幾何特性を保持する:
(1)稜線タイプ(直線、曲線、サーフェスループまたはホール)。
(2)サーフェスループの曲率情報(凸面/凹面/面)。
(3)曲線のパラメトリック計算式。
(4)特定のエンティティに収束する特徴のローカルボリューム。
(5)特定のエンティティに収束する特徴のローカルモーメント。
(6)サーフェスからのローカル距離。(3. Database, search and clustering)
(3.1. Comparison of graphs)
Search graphs in database with search system. This graph is similar to the skeleton graph of the
(1) Edge type (straight line, curved line, surface loop or hole).
(2) Curvature information of surface loop (convex / concave / surface).
(3) Parametric calculation formula of the curve.
(4) A local volume whose characteristics converge to a specific entity.
(5) Local moments of features that converge to a particular entity.
(6) Local distance from the surface.
従って、スケルトンの位相をグラフの位相によって取り込み、ジオメトリをグラフのノードに保存する。図47は、現在の本システムのグラフ照合モジュールのフローチャートを示す。 Therefore, the skeleton's phase is taken by the graph's phase and the geometry is stored in the graph's nodes. FIG. 47 shows a flowchart of the current graph matching module of the present system.
(高レベルグラフ照合)
上記最初の2つの特性(1および2)を、高レベルグラフ照合ステップ(図47を参照のこと)に用いる。この後、類似のモデルを有するデータベースのサブセットを検索する。これらモデルは、クエリーモデルに全体的な幾何および位相類似性を有する。続くステップでは、上述の個別の幾何特性(3)、(4)および(5)の類似性に基づいて、検索したモデルをさらに分類する(低レベルグラフマッチャー)。従って、高レベルマッチャーによリサーチ空間を選別して、該当する部品を検出する。この選別で用いるグラフ特性は、スケルトン内の最も高い度合いのノード、サーフェスループの数、直線および曲線稜線の数、およびホールの数を含み、クエリーモデル(またはクエリーグラフ)に類似していないグラフを除去する。(High level graph matching)
The first two characteristics (1 and 2) are used for the high level graph matching step (see FIG. 47). After this, a subset of databases with similar models is searched. These models have an overall geometric and topological similarity to the query model. In the following step, the retrieved models are further classified based on the similarity of the individual geometric characteristics (3), (4) and (5) described above (low level graph matcher). Therefore, the research space is selected by the high-level matcher and the corresponding part is detected. The graph characteristics used in this selection include graphs that are not similar to the query model (or query graph), including the highest degree of nodes in the skeleton, the number of surface loops, the number of straight and curved edges, and the number of holes. Remove.
高レベルグラフマッチャーで検索したモデルより小さなセットを、次に低レベルグラフマッチャーに渡す。低レベルグラフマッチャーは、上記のグラフ照合アルゴリズムに基づいて、クエリーモデルとこれらモデルとの間の類似性の度合いを検出する。しかしながら、ユーザはまた、位相および高レベル幾何特性を用いて、より高いレベルの抽象化だけで照合を行うことを選ぶこともある。この照合を可能にするには、グラフの隣接関係行列を、これら幾何特性を表現するように設計する。行列のゼロ以外のエントリは、2つの幾何エンティティの間の連結を表す(位相)。エントリの値は、連結の種類を一意に表す(稜線ループ、ループ−ループ、サーフェス−サーフェス、稜線稜線等)。この隣接関係行列を用いて、決定理論的サブグラフ同定アルゴリズムと共に対応付けグラフ技術を含む任意のグラフ照合方法を実行することができる。 A smaller set than the model searched by the high level graph matcher is then passed to the low level graph matcher. The low level graph matcher detects the degree of similarity between the query models and these models based on the graph matching algorithm described above. However, the user may also choose to match only at a higher level of abstraction using topological and high level geometric properties. To enable this matching, the graph adjacency matrix is designed to represent these geometric properties. A non-zero entry in the matrix represents a connection between two geometric entities (topology). The value of the entry uniquely represents the type of connection (edge loop, loop-loop, surface-surface, edge ridge, etc.). This adjacency matrix can be used to perform any graph matching method, including association graph techniques, along with decision-theoretic subgraph identification algorithms.
(低レベルグラフ照合)
従来技術のセクションで、グラフを比較して類似性の度合いを評価するために、各種のアルゴリズムが提案されている。これらアルゴリズムを、正確および不正確なグラフ照合アルゴリズムにおおまかに分類することができる。前者の分類のアルゴリズムは、2つのグラフの間のまたは2つのグラフのサブグラフの間の正確な一致を検出する(すなわち、ノイズがない)。後者のセットのアルゴリズムは、たとえノイズが存在しているとしても、距離測定の形式で2つのグラフの間のあいまいな類似性の度合いを与える。本発明のシステムの要件は、類似の部品を検出することである(正確に同じでない)。本発明のシステムは、グラフ比較のために不正確なアルゴリズムを用いる。(Low level graph matching)
In the prior art section, various algorithms have been proposed to compare the graphs and evaluate the degree of similarity. These algorithms can be roughly classified into accurate and inaccurate graph matching algorithms. The former classification algorithm detects an exact match between two graphs or between subgraphs of two graphs (ie, no noise). The latter set of algorithms gives an ambiguous degree of similarity between the two graphs in the form of distance measurements, even in the presence of noise. The requirement of the system of the present invention is to detect similar parts (not exactly the same). The system of the present invention uses an inaccurate algorithm for graph comparison.
グラフ比較のための従来のグラフ同定は、NP完全問題を導く。すなわち、小さなグラフ以外を用いてコンピュータで解を検出することが不可能である。不正確なグラフ照合の分野(エラー許容グラフ照合とも言う)について長年にわたって研究され、解についての多数の異なるフレーム構造が導かれている。場面グラフの類似性を含む各種のアプリケーションで、グラフの比較に対応付けグラフ技術が適用されて効果を上げている。現在のシステムでは、グラフ照合問題を、クエリーおよびモデルグラフに対応付けグラフを生成することにより、最大重み付クリーク問題に変換する。本発明の確率論的重みは、対応付けグラフノードを含む。これら重みを、次のエンティティのローカル幾何特徴類似性に基づいて評価する。(1)曲率、(2)ローカルボリューム、および(3)ローカルモーメントである。これにより、該当するモデルを除外せずに、モデル間の類似性の度合いにおけるあいまいさが可能になる。 Conventional graph identification for graph comparison leads to NP-complete problems. That is, it is impossible to detect a solution using a computer other than a small graph. The field of inaccurate graph matching (also called error-tolerant graph matching) has been studied for many years, leading to many different frame structures for solutions. In various applications including the similarity of scene graphs, matching graph technology is applied to compare graphs, which is effective. In current systems, the graph matching problem is transformed into a maximum weighted clique problem by generating a correspondence graph for the query and model graph. The probabilistic weight of the present invention includes an association graph node. These weights are evaluated based on the local geometric feature similarity of the next entity. (1) curvature, (2) local volume, and (3) local moment. This allows ambiguity in the degree of similarity between models without excluding the relevant models.
(対応付けグラフ技術)
対応付けグラフ法は、コンピュータビジョンおよびパターン認識のグラフ照合分野では周知であるが、本発明の問題に適するように変更すると共に、完全性のために、この方法についてここで説明する(本発明の問題の文脈で)。対応付けグラフ(または割り当てグラフ)のノードは、比較されるグラフの頂点対(vQ,vM)を表す(例えば、GQ=(VQ,EQ)およびGM=(VM,EM))。ノードvQおよびvMが同じノード特性記述を有する場合は、vQ∈VQ,vM∈VM等の頂点対(vQ,vM)を、アサインメントと呼ぶ。(さらに)すべてのvQとvQ’との間の関係がすべてvMおよびvM’に成り立つならば、2つのアサインメント(vQ,vM)および(vQ’,vM’)に互換性がある。アサインメントのセットが、アサインメントグラフGaのノードVaのセットを定義する。Ga2つのノード,VaおよびVa’は、これら2つのノードに互換性があれば、アサインメントグラフ、Gaの円弧により連結している(図48を参照のこと)。従って、2つのグラフGQおよびGMの最大照合サブグラフの探索は、対応付けグラフGaの最大クリーク(全体的に連結したサブグラフ)の探索である。その代わりに、アサインメントが、vQとvMとの間の類似性の度合いも重みとして表している場合は、次にグラフ照合を最大重み付クリーク問題に変換する。従って、対応付けグラフ内の最も大きい最大重み付クリークが、2つのグラフGQとGMとの間の最も良い一致を表すことになる。(Association graph technology)
The mapping graph method is well known in the field of graph matching in computer vision and pattern recognition, but is modified here to suit the problem of the present invention and for completeness, the method is described here (see the present invention). In the context of the problem). The nodes of the association graph (or assignment graph) represent vertex pairs (vQ , vM ) of the graphs to be compared (eg, GQ = (VQ , EQ ) and GM = (VM , EM )). Nodev ifQ andthe v M have the same node characteristics description,v Q ∈ VQ,v M ∈ V vertex pairs such asM(v Q,v M), and is referred to as assignment. (Further) compatible with two assignments (vQ , vM ) and (vQ ′, vM ′) if all the relations between vQ and vQ ′ all hold in vM and vM ′ There is sex. The set of assignments defines the set of nodes Va in the assignment graph Ga. Ga2 one node, Va and Va ', these two nodes if compatible, assignment graph (see FIG. 48) which are connected by an arc of Ga. Therefore, the maximum search for matching subgraph two graphs GQ and GM is the search for the maximum clique of the association graph Ga (generally linked subgraph). Instead, assignment, v If the degree of similarity betweenQ and vM are expressed as weights, then converts the chart collation clique problem with the maximum weight. Thus, the largest maximum weighted clique association graph will represent the best match between the two graphs GQ and GM.
(ローカル類似性基準値)
このセクションは、形状照合アルゴリズム詳細に説明することにあてられている。これは、対応付けグラフ技術に基づいている。用語’ノード’および’頂点’と共に’稜線’および’円弧’がグラフ理論で区別なく用いられているが、理解しやすいように、ノードおよび稜線を用いてスケルトングラフを説明して、頂点および円弧で対応付けグラフを構成する。対応付けグラフの頂点は、2つのオリジナルグラフのノード間の相関性を表す。ノード間の相関性を決定するこの処理を対応付けという。また対応付けグラフの2つの頂点をつなぐ円弧は、対応するノード間の互換性を表す。(Local similarity standard value)
This section is devoted to describing the shape matching algorithm in detail. This is based on the association graph technique. The terms 'node' and 'vertex' are used in conjunction with 'edge' and 'arc' interchangeably in graph theory, but for ease of understanding, the skeleton graph is described using nodes and edges, and vertex and arc The association graph is configured with. The vertex of the association graph represents the correlation between the nodes of the two original graphs. This process of determining the correlation between nodes is referred to as association. An arc connecting two vertices of the association graph represents compatibility between corresponding nodes.
グラフAは、頂点Aiのセット、稜線Aijのセット、頂点属性のセットν(Ai)、および稜線属性として表されている。Graph A is represented as a set of vertices Ai, a set of ridges Aij, a set of vertex attributes ν (Ai ), and a ridge line attribute.
ここに示す各種の実施の形態では、スケルトングラフ構造は、稜線とループとを区別している。同じ種類のエンティティ間で対応付けが可能であるで、1つのグラフのループを他のスケルトン等のループとだけ対応付ける。長さの類似性と共に類似性の度合いに基づいて、対応するノード(例えば、A1およびB2)間の類似性を決定する。重みを、これら2つの基準値に対応付ける。 In the various embodiments shown here, the skeleton graph structure distinguishes between edges and loops. Correspondence is possible between entities of the same type, and a loop of one graph is associated only with a loop such as another skeleton. Based on the similarity in length and the degree of similarity, the similarity between corresponding nodes (eg, A1 and B2) is determined. A weight is associated with these two reference values.
従ってグラフAのノードA1とグラフBのB2との間の類似性を、ノードの重み付けとして表す。これは、計算式(1)から得られる。 Therefore, the similarity between node A1 of graph A and B2 of graph B is expressed as a node weight. This is obtained from the calculation formula (1).
同様に、対応付けグラフの円弧は、対応するエンティティが連結しているかどうかを表す。もし連結していれば、エンティティ間の相対類似性である。例えば、ノード(A1−B2)および(A2−B3)をつなぐ円弧は、A1がA2に連結しているかどうか、B2がB3に連結しているかどうか記述する。また、対応するエンティティ間の連結をさらによく記述する他のヒューリスティックも含む。連結したエンティティ間の角度等である。ある実施例では、円弧の重み付けの決定に計算式(2)を用いて度合いを得た。 Similarly, the arc of the association graph indicates whether or not corresponding entities are connected. If connected, it is a relative similarity between entities. For example, the arc connecting nodes (A1-B2) and (A2-B3) describes whether A1 is connected to A2 and whether B2 is connected to B3. It also includes other heuristics that better describe the connections between corresponding entities. For example, the angle between connected entities. In an embodiment, the degree is obtained by using the calculation formula (2) for determining the weight of the arc.
Wlrは長さに比に与えられた重みで、Wθは角度に与えられた重みである。有効なグラフ照合を得るためには、制約の数に注意することに留意のこと。例えば、モデルAの任意のスケルトンエンティティがモデルBの2つ以上のエンティティと一致しない、またはその逆の場合である。これら制約について、図48に楕円で示す。対応付けグラフの円弧を、これら制約を考慮して生成する。Wlr is a weight given to the ratio to the length, and Wθ is a weight given to the angle. Note the number of constraints to get a valid graph match. For example, if any skeleton entity in model A does not match two or more entities in model B, or vice versa. These restrictions are indicated by ellipses in FIG. The arc of the association graph is generated in consideration of these restrictions.
次に、これでモデルAとモデルBとの間のグラフ照合問題が、最大クリーク問題になる。アプリケーションの対応付けグラフに重みが存在しているので、問題を、最大重み付クリーク問題として表す。従って、最も大きい重みを持つクリークは、2つのグラフ間の最も良い類似性を表す。従って、類似性は、任意のクリークに対するノードの重みと円弧の重みとの合計である。従って、2つのモデル間の’最も良い類似性照合’を検出する問題は、基本的に、目的関数が類似性の度合いである組み合わせ最適化問題である。 Next, the graph matching problem between model A and model B becomes the maximum clique problem. Since weights exist in the application association graph, the problem is represented as a maximum weighted clique problem. Thus, the clique with the highest weight represents the best similarity between the two graphs. Thus, similarity is the sum of the node weight and arc weight for any clique. Therefore, the problem of detecting the “best similarity check” between two models is basically a combinatorial optimization problem in which the objective function is the degree of similarity.
ヒューリスティックベースの遺伝的アルゴリズムを用いて、上述の対応付けグラフの最大重み付クリークを活用する。しかしながら、任意の組み合わせ最適化アルゴリズムを用いて、最大重み付クリークを得ることができる。近似アルゴリズムで大きなグラフのグローバルで最適の解が得られる保証はないが、これにより、大きなグラフサイズでは処理しにくい全数探索を回避する。従って、近似アルゴリズムは、このアプローチを用いて各種の実施の形態で最適化を行うのに利点がある。 The heuristic-based genetic algorithm is used to take advantage of the maximum weighted clique of the above association graph. However, the maximum weighted clique can be obtained using any combinational optimization algorithm. Although there is no guarantee that an approximate algorithm will provide a globally optimal solution for large graphs, this avoids exhaustive searches that are difficult to process with large graph sizes. Thus, the approximation algorithm is advantageous for performing optimization in various embodiments using this approach.
(計算量)
対応付けグラフ技術を用いる主な利点は、それが簡易グラフ理論構造で、最大クリーク検出等の純粋グラフ理論アルゴリズムに適用可能であることである。しかしながら、対応付けグラフの構成は純粋にドメイン依存である。従って、このアプローチの有効性は、このグラフの構成および続いて用いるグラフ理論アルゴリズムに依存している。最大クリーク検出問題はNP完全であることに留意されたい。しかしながら、本発明のスケルトングラフには幾何情報が豊富に存在するので、多数の不要の比較を除去することにより、最大クリーク検出問題(MC問題)の平均計算量を相当低減することができるようになる。アルゴリズムを、次のヒューリスティックを用いることができるように設計する。a)辞書式順序のノードと、b)前のクリークサイズと、c)高レベル幾何エンティティの数(サーフェスループ/ホール/稜線)とである。これによリサーチ空間を小さくする。例えば、ループを直線稜線および曲線と比較することを、または曲線を直線稜線と比較することを省くことができる。スケルトンのループは基本的に、元の3Dモデルの大きなホールを表す。従って、これら特徴のあるものは、元の3Dモデルの製造特徴を暗黙に表す。これは、グラフ照合のドメインナレッジを用いるとどのくらい平均計算量を相当低減することができるかについて、説明するものである。対応付けグラフ技術を変更することにより、適当な時間で3Dモデルの探索が行えるようになる。この技術について、次に詳しく説明する。(Calculation amount)
The main advantage of using the association graph technique is that it is a simple graph theory structure and can be applied to pure graph theory algorithms such as maximum clique detection. However, the configuration of the association graph is purely domain dependent. Thus, the effectiveness of this approach depends on the construction of this graph and the graph theory algorithm used subsequently. Note that the maximum clique detection problem is NP-complete. However, since the skeleton graph of the present invention has abundant geometric information, the average calculation amount of the maximum clique detection problem (MC problem) can be considerably reduced by removing many unnecessary comparisons. Become. The algorithm is designed so that the following heuristics can be used. a) nodes in lexicographic order, b) previous clique size, and c) number of high-level geometric entities (surface loop / hole / edge). This reduces the research space. For example, comparing loops with straight ridges and curves, or comparing curves with straight ridges can be omitted. The skeleton loop basically represents a large hole in the original 3D model. Therefore, these features implicitly represent the manufacturing features of the original 3D model. This explains how much the average amount of computation can be significantly reduced by using domain knowledge for graph matching. By changing the association graph technology, it is possible to search for a 3D model in an appropriate time. This technique will be described in detail next.
ノードを表す直線を表すQ1個のノードのうち、クエリーグラフがQ個のノードから成ると仮定する。Q2個のノードがループを表す。同様に、M1およびM2が、それぞれモデルグラフの直線稜線およびループを表すノードの数とする(全部でM個のノードである)。さらに、M1,M2,およびMはそれぞれ、Q1,Q2,Qより大きいと仮定する。従って、サブグラフ同定に必要な比較の回数を、次のように検出する。Of for Q1 nodes representing the straight line representing the node, it is assumed that the query graph consists of Q-number of nodes. QTwo nodes represent a loop. Similarly, let M1 and M2 be the number of nodes representing a straight edge and a loop, respectively, in the model graph (a total of M nodes). Further assume that M1 , M2 , and M are greater than Q1 , Q2 , and Q, respectively. Therefore, the number of comparisons necessary for subgraph identification is detected as follows.
(幾何特徴照合)
高レベル照合から検索したモデル間の類似性/距離の度合いをさらに正確にするために、スケルトンエンティティの幾何特徴属性を比較する。上述のように、非類似のエンティティタイプはグラフ類似性基準値と比較しない。(Geometric feature matching)
To further refine the degree of similarity / distance between models retrieved from high-level matching, the geometric feature attributes of skeleton entities are compared. As mentioned above, dissimilar entity types are not compared to the graph similarity criterion value.
(角柱状の形状)
ベジェ曲線を用いて、角柱状スケルトンエンティティのパラメトリック計算式を得る。これにより、曲線形状のアフィン不変量の程度を与える。曲線類似性比較の曲率に基づくアルゴリズムを用いる。類似の曲線は、類似の曲率プロファイルを持つ。2つの曲線を比較するには、曲線を定義した数のエンティティに分割して、曲線の曲率プロファイルが、曲線の一方の端からもう一方までの曲率シーケンスとなる。類似性のあいまいさの程度を、これら2つの曲率プロファイル間の距離から導出する。ベジェ曲線の計算式曲線の任意の点の曲率は、次のように与えられる:
・5次ベジェ曲線フィッティング(Rectangular shape)
A parametric calculation formula of a prismatic skeleton entity is obtained by using a Bezier curve. This gives the degree of the affine invariant of the curve shape. An algorithm based on the curvature of the curve similarity comparison is used. Similar curves have similar curvature profiles. To compare two curves, divide the curve into a defined number of entities and the curvature profile of the curve is the curvature sequence from one end of the curve to the other. The degree of similarity ambiguity is derived from the distance between these two curvature profiles. The curvature of an arbitrary point on a Bezier curve is given as follows:
・ 5th order Bezier curve fitting
Pi−制御点
Pi-control point
(シェル様およびハイブリッド形状)
シェル様およびハイブリッド形状は、異なる種類のスケルトンエンティティを生成するので、異なる処理が比較のために必要となる。パラメトリックベジェサーフェスを、サーフェスを構成するボクセルのセットに当てはめた後、凸面およびサーフェス曲率等のエンティティのグローバル幾何特徴を類似性基準値に用いる。さらに詳細に比較するには、角柱状スケルトンで説明したものを、シェル様スケルトンのサーフェスエンティティまたはワイヤフレームスケルトンエンティティに用いることができる。サーフェスを、標準の数の分割に離散化して、曲率プロファイルと共に個別のサーフェス領域をこれらサーフェスと比較することもできる。(Shell-like and hybrid shape)
Since shell-like and hybrid shapes generate different types of skeleton entities, different processing is required for comparison. After fitting a parametric Bezier surface to the set of voxels that make up the surface, the entity's global geometric features, such as convexity and surface curvature, are used for similarity criteria. For a more detailed comparison, the prismatic skeleton described can be used for a shell-like skeleton surface entity or a wireframe skeleton entity. Surfaces can also be discretized into a standard number of divisions and individual surface areas can be compared to these surfaces along with the curvature profile.
(ローカル強調および関連性フィードバック)
Wl,Wd,Wθ,Wlr等のローカル幾何特徴の重み(計算式1および2)を用いることで、関連性フィードバックからユーザ基本設定を学習することができるので、システムとユーザとの間の意味的ギャップを低減する。セクション3.6に記載の標準重み再構成機構を介して、重みを学習することができる。また、ユーザは、3Dソリッドモデルまたは3Dスケルトンモデルのローカル特徴を強調することもできる。重みを特定のスケルトンエンティティに期することができるので、照合の際に類似性の基準値によりより高い重みを特定のローカル特徴に与えることができる。(Local emphasis and relevance feedback)
By using local geometric feature weights (calculation formulas 1 and 2) such as Wl , Wd , Wθ , and Wlr , user basic settings can be learned from relevance feedback. Reduce the semantic gap between them. The weights can be learned via the standard weight reconstruction mechanism described in Section 3.6. The user can also highlight local features of the 3D solid model or the 3D skeleton model. Since weights can be attributed to specific skeleton entities, higher locality weights can be given to specific local features during matching.
(異なるディテールのレベルの比較)
角柱状およびシェル様スケルトンの異なるディテールのレベルを、次のやり方で用いる。データベースモデルの各ディテールのレベルをクエリースケルトンと比較して、最も高い類似性の値を得るディテールのレベルをクエリー3Dモデルとデータベースからの特定のモデルとの間の類似性と考える。スケルトングラフに基づく3Dモデルのクラスタ化は、すべての2つのモデルの4つのディテールのレベルすべてを互いに比較して、2つのモデル間の最も良い類似性を得る。これら類似性の値を用いて、モデルのデータベース類似のモデル群にクラスタ化する。あるいは、ユーザは、クラスタ化に用いるすべてのモデルのディテールの特定のレベルを指定することもできる。この場合は、特定のLODを用いてクラスタ化を行う。(Comparison of different detail levels)
Different levels of detail of prismatic and shell-like skeletons are used in the following manner. The level of each detail in the database model is compared to the query skeleton, and the level of detail that yields the highest similarity value is considered the similarity between the
(並列化)
この処理は、クエリーグラフおよびデータベースからのグラフを扱って別々に比較するので、グラフ照合ステップは並列化可能である。高レベルグラフ照合ステップでは、自動クラスタを用いて比較の回数を減らすこともできる。従って、各クラスタのプロトタイプモデルをそれぞれクエリーグラフと比較する。続いて、そのプロトタイプがクエリーグラフと最も近いクラスタを用いてさらに探索する。従って、階層型クラスタを用いて探索空間を小さくすることができる。探索が、次のクラスタのモデルの数が妥当である適当な状態になったら(リアルタイム探索が可能)、低レベルグラフ照合を並列化できるので、探索時間を最適化することになる。(Parallelization)
This process handles the query graph and the graph from the database and compares them separately, so the graph matching step can be parallelized. In the high level graph matching step, the number of comparisons can be reduced by using an automatic cluster. Therefore, the prototype model of each cluster is compared with the query graph. Subsequently, the prototype is further searched using the cluster closest to the query graph. Therefore, the search space can be reduced using hierarchical clusters. When the search is in an appropriate state where the number of models of the next cluster is reasonable (real-time search is possible), the low-level graph matching can be parallelized, so that the search time is optimized.
(従来のシステムとの相違)
・ジオメトリおよび位相の分離。
・階層型グラフ照合。
・高レベル幾何特徴の隣接関係行列への包含。
・自動クラスタに関するグラフ照合の並列化。(Differences from conventional systems)
• Geometry and phase separation.
-Hierarchical graph matching.
• Inclusion of high-level geometric features in the adjacency matrix.
-Parallel graph matching for automatic clusters.
(3.2.多次元索引)
企業に3Dモデルが普及するにつれて、データベースに索引を付けて効率的な検索を可能にしたいという差し迫った要求がある。市販のデータベースシステムで広く用いられているが、B+木およびハッシュテーブル等の幅広く使える索引構造が、3Dモデル探索の際の効率を十分改良することは、残念ながら現在のところ不可能なことである。3Dモデル類似性を使って仕事をするエンジニアは、データベースでの形状探索よりも、少数のモデルの3D形状照合に注目している。それらのアプローチでは、データベースを基準化することは困難である。(3.2. Multidimensional index)
As 3D models become more prevalent in businesses, there is an urgent need to index the database to enable efficient searching. Although widely used in commercial database systems, it is unfortunately not possible at the present time that widely used index structures such as B + trees and hash tables can sufficiently improve the efficiency of 3D model searches. . Engineers who work with 3D model similarity focus on 3D shape matching of a small number of models rather than shape search in a database. With these approaches, it is difficult to standardize the database.
従って、ここに示す実施の形態は、モデルの類似性によりデータベースに索引を付けることができる索引構造を開発した。この構造は、同時に特徴ベクトルの各要素の情報を用いて、形状類似性を評価した。革新的で新規の方法では、異なる特徴の索引から供給した類似性を合成することにより、全体的な類似性を計算する。合成方法により、各索引の探索の規則数列を協働させる。 Thus, the embodiment shown here has developed an index structure that can index the database by model similarity. This structure was evaluated for shape similarity using information on each element of the feature vector at the same time. In an innovative and novel method, the overall similarity is calculated by combining the similarities supplied from different feature indexes. By the synthesis method, the rule numbers of search for each index are made to cooperate.
索引構造を、木ベースの多次元索引として実行する。多次元性が3Dモデルデータベースで重要であるのは、全体的な類似性をこれら特徴要素の組み合わせで定義するからである。また、特徴要素を選別として用いることは、3Dモデル探索の文脈では不適切である。 The index structure is implemented as a tree-based multidimensional index. Multidimensionality is important in a 3D model database because the overall similarity is defined by a combination of these feature elements. Also, using feature elements as a selection is inappropriate in the context of 3D model search.
索引構造の構造を、図49および図50に示す。葉ノードは、3Dモデルの表現を含み、内部ノードが葉ノードへの短い経路の検出を支援する。3Dモデルを表す特徴ベクトルが、それらの類似性によって葉データノードにグループ化される。各データノードは、モデルの全体的な情報を保存する収容ボックスとして表される。内部ノードを構築して、葉ノードに索引を付ける。各ノードの抽象情報により、類似のモデルこのデータノードにある可能性があるかどうか決定する。従って、ノードを簡潔にして、探索段階の間に全副木をこれらノードに根付かせる。 The structure of the index structure is shown in FIG. 49 and FIG. Leaf nodes contain a representation of the 3D model, and internal nodes help detect short paths to leaf nodes. Feature vectors representing 3D models are grouped into leaf data nodes according to their similarity. Each data node is represented as a storage box that stores the overall information of the model. Build internal nodes and index leaf nodes. The abstract information of each node determines whether a similar model can be present in this data node. Therefore, the nodes are concise and the entire subtree is rooted in these nodes during the search phase.
図51Aは、39個のモデルの予備の索引構造である。図51Bは、2つの葉データノードのコンテンツを示す。この索引が類似性により十分にモデルをグループ化していることを示している。また、複数の多次元索引を効率的に用いて類似性を計算するアルゴリズムを開発する。3Dモデルは、複数の特徴として表される。各特徴は、対応する多次元索引を有する。各索引から検索した類似性により、全体的な類似性を計算する。探索木を簡素化する能力により、多次元索引の効率を決定する。簡素化能力は、探索基準に依存する。それは、クエリー点からの半径である。アルゴリズムは各索引内の探索を協働させて、各索引内の探索半径を最小にしようとする。これらアルゴリズムは、簡素化能力および多次元索引の効率を大幅に向上させたものである。 FIG. 51A is a preliminary index structure of 39 models. FIG. 51B shows the contents of two leaf data nodes. This index shows that the models group the models well by similarity. In addition, we develop an algorithm that calculates the similarity using multiple multi-dimensional indexes efficiently. A 3D model is represented as a plurality of features. Each feature has a corresponding multidimensional index. The overall similarity is calculated from the similarity retrieved from each index. The ability to simplify the search tree determines the efficiency of the multidimensional index. The simplification capability depends on the search criteria. It is the radius from the query point. The algorithm attempts to coordinate the search within each index to minimize the search radius within each index. These algorithms greatly improve the simplification capability and the efficiency of multidimensional indexes.
類似のモデルを確実にグループ化するためには、SOMを用いて特徴ベクトルの前処理を行い、類似のモデルをクラスタ化する。これらクラスタ化したモデルを一括でロードするように、索引を構築する。これにより、この多次元索引の質を大幅に向上させるのは、索引内のデータノードが、類似性により確実にモデルをグループ化するからである。十分な数のモデルがデータベースにセットされて、索引の質を損なう場合は、SOMを再び用いて索引を再構築する。 In order to reliably group similar models, feature vectors are pre-processed using SOM to cluster similar models. An index is constructed so that these clustered models are loaded together. This greatly improves the quality of this multi-dimensional index because the data nodes in the index reliably group models by similarity. If a sufficient number of models are set in the database and the index quality is compromised, the index is rebuilt using SOM again.
(3.3.特徴ベクトル比較)
現在の探索システムは通常、1種類の特徴を用いていて、3Dモデルの固有の特性を十分にを取り込むものではない。組み合わせ特徴ベクトルを用いる技術がいくつかあるとしても、これら特徴間の内部関係を完全に理解していなかった。1次結合は簡易であるが、これを共通に用いて、それらの関係を無視して、各特徴に基づく全体的な類似性を計算するものである。(3.3. Feature vector comparison)
Current search systems typically use one type of feature and do not fully capture the unique properties of the 3D model. Even though there are several techniques that use combination feature vectors, they did not fully understand the internal relationships between these features. Although the primary combination is simple, it is used in common to ignore the relationship between them and calculate the overall similarity based on each feature.
従って、本発明の実施の形態では、および固有の特徴ベクトルをさらに多く抽出して、3Dモデルの重要な特性を取り込む。特徴ベクトルの関係をより良く理解することにより、個別の特徴について定義したことに基づく全体的な類似性を計算する、さらに進んだ方法を開発することが可能になる。 Therefore, in the embodiment of the present invention, more unique feature vectors are extracted to capture important characteristics of the 3D model. A better understanding of the relationship between feature vectors allows the development of more advanced methods for calculating the overall similarity based on what is defined for individual features.
本発明は、特徴ベースの3Dモデル探索システムを利用するシステムを用いる。これは、高レベルのキーワードの代わりに低レベルの特徴を用いて、複雑なジオメトリを表す。元の3Dモデルを処理すると、異なるディテールのレベルを持つ異なるモデルを生成した。これらモデルから、統計的、空間的、および時間的情報を、3Dモデルを表す特徴として抽出する。図52は、本システムの実施の形態で現在用いられる特徴ベクトルである。これら特徴ベクトルは、元の3Dモデルの数字の指紋である。3Dモデルの比較および探索をこれら指紋に適用するのは、元のモデルでは探索しにくいからである。 The present invention uses a system that utilizes a feature-based 3D model search system. This represents complex geometry, using low-level features instead of high-level keywords. Processing the original 3D model produced different models with different levels of detail. From these models, statistical, spatial and temporal information is extracted as features representing the 3D model. FIG. 52 shows feature vectors currently used in this embodiment of the system. These feature vectors are numeric fingerprints of the original 3D model. The comparison and search of the 3D model is applied to these fingerprints because the original model is difficult to search.
特徴要素を座標と考えると、3Dモデルは、多次元特徴空間内の点として表される。図53に、一例として2次元空間を用いてこれを示す。 Considering feature elements as coordinates, a 3D model is represented as a point in a multidimensional feature space. FIG. 53 shows this using a two-dimensional space as an example.
モデルを特徴空間内のデータ点として考えると、座標上で定義された異なる距離を用いて、類似性モデルの類似性を計測することができる。例えば、ユークリッド距離L2、最大基準値L∞およびマンハッタン基準値L1を用いる。これら距離を計算する計算式について、次のように列挙する。 Considering the model as a data point in the feature space, the similarity of the similarity model can be measured using different distances defined on the coordinates. For example, the Euclidean distance L2, the maximum reference value L∞, and the Manhattan reference value L1 are used. The formulas for calculating these distances are listed as follows.
これら類似性の定義に基づいて、各特徴の類似性の程度を計算する特徴ベースの画像探索と異なり、システム内の特徴のいくつかは完全に独立していない。従って、特徴類似性に基づいて全体的な類似性を計算すると、1次結合の他にさらに複雑な結合方法を用いることになる。これら方法は、2次、3次、およびニューラルネットワークで表されるさらに複雑な関数を含む。また、グラフ照合を特徴ベースの類似性探索と共に用いる。特徴表現についてここで説明して、グラフ照合セクションにグラフ表現を導入する。 Unlike feature-based image search, which calculates the degree of similarity of each feature based on these similarity definitions, some of the features in the system are not completely independent. Therefore, if the overall similarity is calculated based on the feature similarity, a more complicated combination method is used in addition to the primary combination. These methods include more complex functions represented by quadratic, cubic and neural networks. Graph matching is also used with feature-based similarity searches. The feature representation will now be described and the graph representation is introduced in the graph matching section.
すべての特徴ベクトルを同時に用いてデータベースを探索するワンステップ探索方法を用いる代わりに、決定木として探索をシミュレーションする。認知心理学リサーチに基づいて、選択的特徴をいくつか含むアスペクト比および対称情報等である。他の実施の形態では、他のさらに進んだ特徴をいくつか用いることもできる。また、以前に用いた特徴を続いて用いることもできる。 Instead of using a one-step search method that searches the database using all feature vectors simultaneously, the search is simulated as a decision tree. Based on cognitive psychology research, aspect ratio and symmetry information including some selective features. In other embodiments, some other more advanced features may be used. Also, previously used features can be used subsequently.
この検索システムの利点は次のものである。(1)すべての特徴は、システムが客観的に計算した固有の値なので、客観的なアプローチである。データベース内のモデルの表現を、特徴抽出アルゴリズムにより決定するシステム内のCADモデル表現がどのユーザからも偏りがない。従って、システムは、すべてのユーザに対して中立の特徴を持つ。(2)すべての情報が客観的なので、容易に自動化できる。ユーザが全く関わることなくアルゴリズムを発展させて、CADモデルから計算するようにできる。(3)キーワードベースの検索システムよりも、類似性の度合いがより正確に定量化する。各特徴を目盛の数字(通常0−1)で表しているので、類似性をある数学的演算で容易に特徴づけることができる。システムがCADモデルから情報を十分抽出する限り、システムは類似のモデルを正常に検索することになる。 The advantages of this search system are: (1) All features are objective approaches because they are unique values calculated objectively by the system. The CAD model representation in the system that determines the representation of the model in the database by the feature extraction algorithm is free from any user. Thus, the system has neutral features for all users. (2) Since all information is objective, it can be easily automated. The algorithm can be developed and calculated from the CAD model without any user involvement. (3) The degree of similarity is more accurately quantified than the keyword-based search system. Since each feature is represented by a scale number (usually 0-1), the similarity can be easily characterized by a certain mathematical operation. As long as the system extracts enough information from the CAD model, the system will successfully search for similar models.
主な欠点は、特徴ベクトルを定義するのが難しいことである。特徴ベクトルはすべての非類似のモデルの選別には適しているが、類似のものをすべて保持している。しかしながら、本発明の実施の形態に適用した多段階探索方法(セクション3.8に記載)により、ユーザが異なる特徴ベクトルを試して所望のモデルのセットを得ることができる。 The main drawback is that it is difficult to define feature vectors. Feature vectors are suitable for selecting all dissimilar models, but retain all similar ones. However, the multi-stage search method (described in Section 3.8) applied to the embodiments of the present invention allows the user to try different feature vectors to obtain a desired set of models.
(3.4.クラスタ化技術)
本発明の実施の形態により、ユーザがデータベース内の異なるモデルを容易に閲覧して、彼/彼女の要件に類似の部品を検出できる。ビジュアルクエリーインターフェースの一部は、この機能を促進するようになっている。インターフェースをビジュアル化して、2つの異なるシナリオで動作させることができる(図54を参照のこと)。第1の場合では、ユーザは頭で考えた3Dモデルだけが有り、データベース内の利用可能な部品を閲覧して、該当する部品を選ぶ場合である。この探索を効率的にするためには、データベースのすべてのモデルの階層型部品クラスタマップを用意して、データベースに新しいモデルが加わると動的にこれを更新する。より高いレベルのクラスタ内の各部品クラスタが、次のレベルの多数のクラスタを指し示し、これを繰り返す。他のシナリオでは、ユーザがクエリーモデルをスケッチインターフェースから入力して、クエリーと類似していると検出されたすべての部品を検索する。各検索したモデルは、それが属するクラスタへのリンクを示しているので、さらに閲覧が可能になる。対応するリンクをたどって、モデルが属するクラスタを閲覧することができる。(3.4. Clustering technology)
Embodiments of the present invention allow a user to easily browse different models in the database and detect parts similar to his / her requirements. Part of the visual query interface is designed to facilitate this functionality. The interface can be visualized and operated in two different scenarios (see FIG. 54). In the first case, the user has only the 3D model considered in his / her head, browses the available parts in the database, and selects the relevant part. In order to make this search efficient, a hierarchical part cluster map of all models in the database is prepared, and this is dynamically updated when a new model is added to the database. Each part cluster in the higher level cluster points to the next number of clusters and repeats. In other scenarios, the user enters a query model from the sketch interface and retrieves all parts that are found to be similar to the query. Each searched model shows a link to the cluster to which it belongs, so that further browsing is possible. You can browse the cluster to which the model belongs by following the corresponding link.
クラスタ化アルゴリズムを、知識発見およびデータ発掘の分野で広範囲に用いる。最も重要なものは、階層型クラスタ化、k−クラスタ化および自己組織化マップ(SOM)である。これら異なるアルゴリズムでは、SOMは最も簡単に実行することができ、クラスタを容易にビジュアル化して解釈することができる。SOMはニューラルネットワークアルゴリズムで、教師なし学習に基づくものである。しばしばニューロンと呼ばれる計算単位のレイヤから成り、入力パターンの母集団に適応させる。入力パターンを提示するとすぐに、このパターンに最も近いニューロンを決定して(獲得ニューロンと呼ぶ)、次に更新して新しいパターン取り入れるが、隣接ノードのいくつかについても更新して、獲得ニューロンに近づける。SOMは、ベクトル量子化およびベクトル投影アルゴリズムの特性を共に有するので、より高い次元でのデータ投影をより低い次元にすることができる(通常2次元)。これはビジュアル化に適用可能である。この特徴が本発明の実施の形態で利点があるのはユーザがモデルを閲覧するための有益なビジュアルインターフェースを開発する支援となるからである。また、SOMは、新しい部品をデータベースに追加して、クラスタマップを動的に更新することも可能にする。 Clustering algorithms are used extensively in the fields of knowledge discovery and data discovery. The most important are hierarchical clustering, k-clustering and self-organizing maps (SOM). With these different algorithms, SOM can be most easily performed and the clusters can be easily visualized and interpreted. SOM is a neural network algorithm and is based on unsupervised learning. It consists of layers of computation units, often called neurons, and is adapted to the population of input patterns. As soon as you present the input pattern, determine the neuron that is closest to this pattern (called the acquisition neuron) and then update it to incorporate the new pattern, but also update some of the neighboring nodes to get closer to the acquisition neuron . Since SOM has the characteristics of both vector quantization and vector projection algorithms, data projection in higher dimensions can be made lower (usually two dimensions). This is applicable to visualization. This feature is advantageous in embodiments of the present invention because it helps the user develop a useful visual interface for browsing the model. SOM also allows new parts to be added to the database to dynamically update the cluster map.
従来、特徴ベクトルだけでSOMを用いていた。やっと最近になって、SOMをグラフおよび木等のより強力なデータ構造と共に用いて、パターン認識作業に用いようとする試みがある。これらの試みは、SOMのニューロンの更新に用いるグラフ編集距離に基づくグラフ距離基準値を用いていた。逆に、本発明の実施の形態では次の組み合わせを用いる。(a)3Dモデルから得られた特徴ベクトル、および(b)グラフ比較から得られたグラフ距離程度である。従って、ニューロンを設計して、すべての特徴ベクトルと共に3Dスケルトンの典型的なグラフを含むようにさせる(図55を参照のこと)。SOMを更新して、次の新しいクラスタマップを提示する。(1)ユーザが構成した異なる類似性定義を持ち、(2)新しいモデルをシステムへ追加するクラスタマップである。このインターフェースは、次のことを素早く評価するのに有益である。(1)本発明で提案する類似性の基準値と、(2)従来技術が3Dモデルの比較のために提案した基準値である。2つのニューロン間の距離基準値は、ユークリッド、マンハッタン距離等の、任意の標準ベクトル距離とすることができる。 Conventionally, SOM has been used only with feature vectors. Only recently have there been attempts to use SOM with more powerful data structures such as graphs and trees for pattern recognition tasks. These attempts have used graph distance reference values based on graph edit distances used to update SOM neurons. Conversely, the following combinations are used in the embodiment of the present invention. (A) a feature vector obtained from a 3D model, and (b) a graph distance obtained from graph comparison. Therefore, the neuron is designed to include a typical graph of a 3D skeleton with all feature vectors (see FIG. 55). Update the SOM to present the next new cluster map. (1) A cluster map having different similarity definitions configured by the user and (2) adding a new model to the system. This interface is useful for quickly assessing: (1) A reference value of similarity proposed in the present invention, and (2) a reference value proposed by the prior art for comparison of 3D models. The distance reference value between two neurons can be any standard vector distance such as Euclidean or Manhattan distance.
(従来技術との相違)
1.グラフ特性のSOMニューロンデータ構造への包含。
2.3Dモデルスケルトングラフに基づくクラスタ化のためのSOMの使用。
3.クラスタ化のための類似性の定義生成の際のユーザとの相互作用。(Differences from conventional technology)
1. Inclusion of graph properties into the SOM neuron data structure.
2. Use of SOM for clustering based on 3D model skeleton graph.
3. User interaction when generating similarity definitions for clustering.
(3.5.クラスタマップインターフェース)
クラスタマップインターフェースは、探索システムのメインビジュアル出力インターフェースである。インターフェースは、1)自動2)双方向の2つのシナリオで動作する。図56は、2つの状況の2つの異なる経路を示す。自動方式では、システムが定義したデフォルト類似性基準値に基づいて、データベースモデルを各種のクラスタに自動的に分類するクラスタマップ(図57)は、典型的な3Dモデルをユーザに部品クラスタウインドウ上で提示する。これにより、ユーザはボタンやマウスの動きでモデルをパンし、ズームし、回転することができる。各図の右側には、特定のクラスタ内に提示されているモデル数の棒グラフを示している。類似のモデル”ボタンをクリックすることにより、クラスタをさらにを閲覧するすることができる。双方向方式では、ユーザは次のことを行う。1)特徴ベクトルを再構成することにより、ユーザの類似性の程度を伝えることと、2)階層型データベースを閲覧して、ユーザが考えているモデルを探索することである。部品クラスタマップを更新することにより、クラスタマップインターフェースを介してユーザに提示する。(3.5. Cluster map interface)
The cluster map interface is the main visual output interface of the search system. The interface operates in two scenarios: 1) automatic 2) bidirectional. FIG. 56 shows two different paths in two situations. In the automatic method, a cluster map (FIG. 57) that automatically classifies a database model into various clusters based on a system-defined default similarity criterion value allows a typical 3D model to be displayed to the user on the part cluster window. Present. This allows the user to pan, zoom and rotate the model with button and mouse movements. On the right side of each figure, a bar graph of the number of models presented in a specific cluster is shown. By clicking the “similar model” button, you can browse further clusters. In the interactive method, the user does the following: 1) User similarity by reconstructing feature vectors 2) Browsing the hierarchical database and searching for the model that the user thinks, and updating the part cluster map to present it to the user via the cluster map interface.
また、探索クエリーを実行した後、クラスタマップインターフェースを用いて検索した類似のモデルを表すことができる(図58)。類似性クエリーから探索した各モデルは、”類似のモデル”ボタンを介してそれが属するクラスタへのリンクを持つ。各検索したモデルの類似性の度合いについても、百分率の程度としてユーザに提示する。また、各モデルはスライドバーを持ち、ニューラルネットワーク学習のためのシステムに関連性フィードバックを行う。 Further, after executing the search query, a similar model searched using the cluster map interface can be represented (FIG. 58). Each model searched from the similarity query has a link to the cluster to which it belongs via a “similar model” button. The degree of similarity of each searched model is also presented to the user as a percentage. Each model also has a slide bar that provides relevance feedback to the neural network learning system.
(3.6.関連性フィードバック)
検索システムは、低レベルの特徴ベクトルに関する類似性しか測定しない。しかしながら、ユーザの類似性は、ユーザの認識に基づいている。3Dモデルは複雑なオブジェクトなので、3Dモデルを正確に表す特徴を抽出することは、大きな課題である。低レベル特徴ベクトルの類似性定義と高レベル3Dモデルとの間に”意味的ギャップ”がある。(3.6. Relevance feedback)
The search system only measures similarity for low level feature vectors. However, user similarity is based on user perception. Since 3D models are complex objects, extracting features that accurately represent 3D models is a major challenge. There is a “semantic gap” between the low-level feature vector similarity definition and the high-
従来の3D形状探索システムの探索モデルは、事前に定義した類似性の程度およびワンショット機構に基づいている。ユーザとシステムとの間の類似性の意味的ギャップは、これら従来のシステムの性能を大きく損なっている。 The search model of the conventional 3D shape search system is based on a predefined degree of similarity and a one-shot mechanism. The semantic gap in similarity between the user and the system greatly impairs the performance of these conventional systems.
しかしながら、関連性フィードバックは、ユーザとシステムとの間の通信を向上させる重要な方法である。それは、システムおよびユーザ類似性の定義がそれぞれ存在する2つの意味上の面の間の掛け橋である。関連性フィードバックにより、ユーザが正確にクエリーを構築して、類似性の程度の特徴を選ぶ負担を大幅に低減する。また、探索システムが対話から学習して、対話に基づいてシステムを再構成することができる。 However, relevance feedback is an important way to improve communication between users and systems. It is a bridge between the two semantic aspects where system and user similarity definitions each exist. Relevance feedback greatly reduces the burden on the user to construct queries accurately and select features with similarities. Also, the search system can learn from the dialogue and reconfigure the system based on the dialogue.
例示の手順は、次のステップから成る。(a)システムがモデルクエリーの例示に基づいてモデルをいくつか検索すると、特徴ベクトルの類似性の程度によりモデルを順序立てて、ユーザに提示する。(b)ユーザは該当するグループと該当しないグループとに分類して、システムに知らせる。(c)システムは、今度はシステム自体を構成してユーザの嗜好を考慮して再び探索を行う。(d)ユーザが満足するか、もしくはシステムがこれ以上優れたものにならないと考えるまで、この処理を何回か繰り返す。 The exemplary procedure consists of the following steps: (A) When the system searches several models based on the model query, the models are ordered according to the degree of similarity of the feature vectors and presented to the user. (B) The user classifies the group into a corresponding group and a non-applicable group and notifies the system. (C) The system now configures the system itself and searches again in consideration of user preferences. (D) This process is repeated several times until the user is satisfied or the system is not considered better.
図59は、関連性フィードバックの手順を示す。また、ユーザの関連性フィードバック内の情報を用いる異なる方法を実行することもできる。これを、本発明の広い範囲に入るようにする。これらの方法は、計算ジオメトリおよび粒子群等の社会的行動しシミュレートする事に基づいている。 FIG. 59 shows the procedure of relevance feedback. Different methods using information in the user's relevance feedback can also be implemented. This is within the broad scope of the present invention. These methods are based on simulating social behavior such as computational geometry and particle swarms.
本方法により、ユーザとシステムとの対話が可能になるので、類似性の意味的ギャップをつなぐ。また、クエリーベクトルを再構築して関連性フィードバックに基づくシステムを再構成するアルゴリズムを、開発する。 This method allows the user to interact with the system, thus bridging the semantic gap in similarity. We also develop algorithms to reconstruct query vectors and reconstruct systems based on relevance feedback.
ユーザが彼/彼女の視点からどれが該当するモデルでどれが該当しないモデルかシステムに知らせることができるように、探索結果をインターフェースに提示する。 The search results are presented to the interface so that the user can tell the system which one is his / her model and which is not.
関連性フィードバック情報に基づいて探索システムを再構成するアルゴリズムを、開発する。これが効果のある探索システムに重要なのは、別々のユーザが3Dモデルの類似性について異なる認識を持つこともあるからである。始めに、システムを構成して、大部分のユーザの類似性を反映するようにする。例えば、90%のユーザが類似していると考えられるモデルである。ユーザがこのシステムを用いて探索を行うと、彼/彼女の関連性フィードバックを用ちいてシステムを良いものに構成する。フィードバックから、システムはユーザがさらに関心を持つ特徴ベクトルを用いてシステムを再構成して、ユーザの好みを反映させることができる。また、初期クエリーベクトルおよび関連性フィードバックに基づいて、システムはクエリーベクトルを再構築することができる。 Develop an algorithm to reconstruct the search system based on relevance feedback information. This is important for effective search systems because different users may have different perceptions of 3D model similarity. First, configure the system to reflect the similarity of most users. For example, it is a model in which 90% of users are considered to be similar. When a user searches using this system, he uses his / her relevance feedback to configure the system to be good. From feedback, the system can reconfigure the system with feature vectors that the user is more interested in to reflect the user's preferences. Also, based on the initial query vector and relevance feedback, the system can reconstruct the query vector.
(3.7.学習エージェント)
関連性フィードバックは意味的ギャップをつなぐ効果的な方法であるが、時間がかかるものである。たとえ、ユーザがクエリーモデルとして再び実行する同じモデルであっても、時間がかかる関連性フィードバックを再び実行しなければならない。(3.7. Learning Agent)
Relevance feedback is an effective way to bridge semantic gaps, but it takes time. Even if the user is the same model that runs again as a query model, time-consuming relevance feedback must be run again.
従って、本発明の実施の形態の技術は、人工知能、ニューラルネットワークを実行して、ユーザの関連性フィードバックを学習する。この技術により、データベースおよび索引構造の内容を変更することなく、異なるユーザおよび入力クエリーモデルに対してシステムのカスタム化が可能になる。これは、学習およびカスタム化を行う索引の上位のレイヤである。図600は、このような方法の1つを示す。 Therefore, the technology of the embodiment of the present invention executes artificial intelligence and neural network to learn user relevance feedback. This technique allows system customization for different user and input query models without changing the contents of the database and index structure. This is the upper layer of the index that performs learning and customization. Diagram 600 illustrates one such method.
ニューラルネットワークを導入して、ユーザの関連性フィードバックのパターンを学習し、識別する。重要な点は、ニューラルネットワーク等の素早く学習するネットワークシステムを実行することである。多層フィードフォワードニューラルネットワークシステムを、本発明の実施の形態のいくつかに用いた。社会的行動の粒子システム、およびバックプロパゲーションからのアルゴリズムを用いて、はじめにニューラルネットワークを訓練する。 A neural network is introduced to learn and identify user relevance feedback patterns. The important point is to run a network system that learns quickly, such as a neural network. A multi-layer feedforward neural network system was used in some of the embodiments of the present invention. Train neural networks first using particle systems of social behavior and algorithms from backpropagation.
学習エージェントを用いて、特定のユーザの意図をより良く表すクエリーベクトルを素早く再構築することができる。意味的ギャップのために、ユーザが低レベルの特徴要素を持つクエリーを実行することが難しい。例示のクエリーだけが、ユーザに彼/彼女の意図についてのおおまかな考えを与えさせることになる。従って、ユーザの意図をよりよく解釈するように、クエリーベクトルをさらに良いものにする。ユーザが学習エージェントを起動する場合は、訓練の例としてユーザが行った関連性フィードバックを用いる。ゴールは、直接に基づくユーザの探索履歴および現在次に実行したクエリーに基づいてクエリーベクトルを再構築することである。重要な点は、ニューラルネットワークの成熟度の検出および過剰学習の回避である。 A learning agent can be used to quickly reconstruct a query vector that better represents a particular user's intention. Because of the semantic gap, it is difficult for users to execute queries with low-level features. Only the example query will allow the user to give a rough idea of his / her intention. Therefore, the query vector is made better so as to better interpret the user's intention. When the user activates the learning agent, relevance feedback performed by the user is used as an example of training. The goal is to reconstruct the query vector based on the user's search history based directly on and the currently executed query. The important point is the detection of the maturity level of the neural network and the avoidance of over-learning.
また、学習エージェントを用いて探索システムを再構成することもできる。すなわち、特徴要素の重みの再構成である。安定したパターンを識別するならば、次にシステムを再構成して、特徴の相対重要性についてのユーザの見方を反映させることができる。また、ここでのゴールは、関連性フィードバックの時間を短縮することである。学習エージェントを導入する利点は次のことである。a)関連性フィードバックの間に、クエリー再構成と重み付け再構成とを分離することと、b)異なるユーザおよび/または同じユーザが実行した異なるクエリーのためにシステムをカスタマイズすることである。 It is also possible to reconfigure the search system using a learning agent. That is, reconstruction of the weights of the feature elements. If a stable pattern is identified, the system can then be reconfigured to reflect the user's view of the relative importance of features. The goal here is to reduce the relevance feedback time. The advantages of introducing a learning agent are as follows. a) separating query reconstruction and weighting reconstruction during relevance feedback; and b) customizing the system for different users and / or different queries executed by the same user.
ニューラルネットワークの寄与が重要なものとなっているのはシステムをユーザとクエリー入力との両方に対してカスタマイズできることである。以下は、場合によっては、重みの設定が入力に依存することの1例である。 The contribution of neural networks is important because the system can be customized for both user and query input. The following is an example of how the weight setting depends on the input in some cases.
特徴ベクトルが2つの要素からなると仮定する。1つはF1で、もう一方はF2である。図61は、データベースの特徴ベクトルを表の左側に示している。ユーザのクエリーベクトルは表の右側である。矢印は、ユーザのクエリー入力とデータベースのものとの照合である。この照合をユーザの関連性フィードバックから発見することができる。 Assume that a feature vector consists of two elements. One is F1 and the other is F2. FIG. 61 shows database feature vectors on the left side of the table. The user's query vector is on the right side of the table. The arrow is a match between the user's query input and the database. This match can be found from the user's relevance feedback.
第1の木関連性フィードバックに基づくと、重みを再構成することが理にかなっている。W1(1)=W1(0)およびW2(1)=3×W2(0)である。しかしながら、第2の木関連性フィードバックに基づくと、システムを再構成することになる。W1(1)=W1(0)およびW2(1)=10×W2(0)である。言い換えれば、再構成は、F1の存在する範囲に依存している。1つの重みを単純に代入すると、システムの精度が他のものではよいが、モデルのいくつかからはほとんど満足の行くものではなくなってしまう。Based on the first tree relevance feedback, it makes sense to reconstruct the weights. W1(1) = W1(0) and W2(1) = 3 × W2(0) . However, based on the second tree relevance feedback, the system will be reconfigured. W1(1) = W1(0) and W2(1) = 10 × W2(0) . In other words, the reconstruction depends on the range in which F1 exists. If you simply substitute one weight, the accuracy of the system is good for others, but some of the models are almost unsatisfactory.
(3.8.多段階探索処理)
真の探索システムは、事前に定義した類似性基準値に基づくモデルのセットではなく、彼/彼女が探しているモデルをユーザが検出できるようなものでなければならない。この目的のために、本発明の実施の形態は多段階探索方法を組み込んで、異なる照合基準を用いてユーザが部品を探索できるようにする。例えば、ユーザは探索の第1の段階でスケルトングラフを用いてデータベースを探索できる。これにより、位相的に類似のモデルを検索することになる。続いて、異なる基準値、例えば、全ボリュームを用いて、検索したモデルを除外することもできる。これにより、ユーザが探索基準にブール演算を用いることができるので、該当する部品を素早く検索する。(3.8. Multi-stage search processing)
A true search system should be such that the user can detect the model he / she is looking for, rather than a set of models based on predefined similarity criteria. For this purpose, embodiments of the present invention incorporate a multi-step search method to allow a user to search for parts using different matching criteria. For example, the user can search the database using the skeleton graph in the first stage of the search. As a result, topologically similar models are searched. Subsequently, the retrieved models can be excluded using different reference values, for example, all volumes. Thereby, since the user can use a Boolean operation as a search criterion, a corresponding part is quickly searched.
多段階アプローチは、汎用および特に工学分野用に、3D形状探索システムのために提案されたものの最初のものである。 The multi-stage approach is the first of those proposed for 3D shape search systems for general purpose and especially in the engineering field.
本発明の実施の形態のシステムにより、類似性不変量と共にfor多段階探索のスケルトングラフを組み込むことができる。このような多段階探索処理の一例を、図62に示す:
a.各種の特徴ベクトル(すなわち、モーメント不変量、スケルトングラフの固有値、幾何パラメータ)を用いて、探索空間(N個のモデルを持つデータベース)を小さな数M0に低減する。ただし、M0<Nである。
b.スケルトングラフ不変量(<ノードの度合い>、<数L,E,C>、<数L−L,L−E,E−Eの接続性>等)を用いてさらに探索空間を低減する。例えばM1である。ただし、M1<M0である。
c.不正確なグラフ照合を行って、探索空間を低減して、探索結果をモデルのより小さなセットに並べる。M2<M1である。
d.ユーザが以下のステップのようにシステムと対話して、(必要ならば)探索空間を低減する:
i.不変量ベースの基準を指定して、探索空間を低減する
ii.ブール演算を探索基準に用いる
iii.類似性閾値基準を指定して、最終結果を得る。The system of the embodiment of the present invention can incorporate a skeleton graph of for multi-stage search with similarity invariants. An example of such a multi-stage search process is shown in FIG.
a. The search space (database with N models) is reduced to a small number M0 using various feature vectors (ie moment invariants, skeleton graph eigenvalues, geometric parameters). However, M0 <N.
b. The search space is further reduced using skeleton graph invariants (<node degree>, <number L, E, C>, <number L-L, LE, EE connectivity>, etc.). For example,M 1. However, M1 <M0.
c. Inaccurate graph matching is performed to reduce the search space and to arrange the search results into a smaller set of models. M2 <M1 .
d. The user interacts with the system as follows to reduce the search space (if necessary):
i. Specify invariant based criteria to reduce search space ii. Use Boolean operations as search criteria iii. Specify the similarity threshold criteria to get the final result.
図63は、多段階絞込みからの特定の探索結果を示す。スケルトングラフベースの類似性を用いて初期クエリーを実行して、モーメント不変量を用いて結果を絞り込んで、該当するモデルを検索した。 FIG. 63 shows a specific search result from multi-stage narrowing. An initial query was performed using skeleton graph-based similarity and the results were refined using moment invariants to find the appropriate model.
特定の実施の形態について、ここに説明し述べてきたが、当業者ならば、同じ目的を達成するために計算する任意の構成を、示した特定の実施の形態と置換できることが理解できるであろう。この開示は本発明の各種の実施の形態を適用例または変形例をすべて含むことを意図している。上記の記載が説明のためだけになされたことを理解されたい。ここで特に記載されていない上記の実施の形態の組み合わせ、および他の実施の形態については、上記の記載を検討すれば、当業者に明らかになるであろう。本発明の各種の実施の形態の範囲は、上記構造および方法を用いた他のいずれの応用例についても含むものである。従って、各種の本発明の実施の形態の範囲については、このような請求の範囲に与えられる同等物の全範囲と共に、添付の請求の範囲を参照して決められるものである。 Although specific embodiments have been described and described herein, one of ordinary skill in the art will understand that any configuration calculated to accomplish the same purpose can be substituted for the specific embodiments shown. Let's go. This disclosure is intended to cover all applications and variations of various embodiments of the invention. It should be understood that the above description has been made for illustrative purposes only. Combinations of the above embodiments not specifically described herein and other embodiments will be apparent to those of skill in the art upon reviewing the above description. The scope of the various embodiments of the present invention includes any other applications using the structures and methods described above. Accordingly, the scope of various embodiments of the invention should be determined with reference to the appended claims, along with the full scope of equivalents to which such claims are entitled.
米国特許法§1.72(b)に基づいて要約が用意されていることを強調する。要約により、読む者が本質および技術開示の要旨を簡単に把握できるように規定したものである。これを用いて請求の範囲あるいは意味を解釈したり限定したりしないという認識の元で、これを提出する。 Emphasize that a summary is provided under US Patent Act § 1.72 (b). The summary is provided so that readers can easily grasp the essence and gist of the technical disclosure. This is submitted with the understanding that it will not be used to interpret or limit the scope or meaning of the claims.
前述の詳細な説明では、説明のために各種の特徴を共に1つの実施の形態まとめていた。この開示の方法を、各請求項に特に記載した以上の特徴を必要とするという意図を反映するものとして、請求の本発明の実施の形態を解釈するべきではない。むしろ、以下の請求の範囲が反映するように、発明の内容は、1つの開示の実施の形態のすべての特徴に包含されるといえない。これにより、各請求項はそれ自体個別の好適な実施の形態として、以下の請求の範囲は詳細な説明に組み込まれる。 In the foregoing detailed description, various features have been grouped together in one embodiment for purposes of explanation. The disclosed embodiments of the invention should not be construed as reflecting an intention that the disclosed features require more features than are expressly recited in each claim. Rather, as the following claims reflect, inventive subject matter is not encompassed by all features of one disclosed embodiment. Thus, the following claims are hereby incorporated into the Detailed Description, with each claim standing on its own as a preferred embodiment.
Claims (74)
Translated fromJapanese3次元オブジェクトを受け取り、
第1の探索クエリーとして、3次元オブジェクトで1つ以上のデータ記憶装置を探索し、
アンサーセットを含む結果を探索から提示して、
アンサーセット内の1つ以上の項目についての変更または関連性情報を受け取り、
第2の探索クエリーとして、1つ以上の項目に対応付けられた、変更した情報または関連性情報を有する1つ以上のデータ記憶装置を再探索する。Search method, including:
Receive 3D objects,
Searching for one or more data storage devices in a three-dimensional object as a first search query;
Present the results including the answer set from the search,
Receive changes or relevance information for one or more items in the answer set,
As a second search query, one or more data storage devices having changed or related information associated with one or more items are re-searched.
2次元オブジェクトを受け取り、
2次元オブジェクトを3次元表現にマッピングし、
第1の探索クエリーとして、3次元表現で1つ以上のデータ記憶装置を探索し、
1つ以上のデータ記憶装置の第1の探索クエリーに応答するアンサーセット内の1つ以上の項目を提示する。Search method, including:
Accepts 2D objects,
Map 2D objects to 3D representations,
Searching for one or more data storage devices in a three-dimensional representation as a first search query;
Present one or more items in the answer set in response to the first search query of the one or more data storage devices.
2次元オブジェクトを2次元スケルトンとして提示し、
2次元スケルトンを3次元スケルトンに変換し、
3次元スケルトンを第1の探索クエリーとして用いられる3次元グラフ構造として提示することを含む、請求項8に記載の方法。The mapping is further
Present a 2D object as a 2D skeleton,
Convert 2D skeleton to 3D skeleton,
9. The method of claim 8, comprising presenting the three-dimensional skeleton as a three-dimensional graph structure that is used as the first search query.
1つ以上の項目の選択数と、第2の探索クエリーとして関連性指示で1つ以上のデータ記憶装置を探索することをさらに含む、請求項8に記載の方法。Receive a relevance indication of the number of selections of one or more items in the answer set,
9. The method of claim 8, further comprising searching one or more data storage devices with a selection number of one or more items and a relevance indication as a second search query.
2次元オブジェクトを2次元スケルトンに変換して、
2次元スケルトンの2つの次元それぞれの、候補の3次元頂点を生成し、
候補の3次元稜線を候補の3次元頂点から生成し、
候補の3次元フェースを同じサーフェス上の3次元稜線から生成し、
1つ以上の3次元オブジェクトを候補の3次元フェースから生成し、
3次元スケルトンとして、1つ以上の3次元オブジェクトを受け取った2次元オブジェクトに対応付ける、請求項8に記載の方法。The mapping is further
Convert a 2D object to a 2D skeleton,
Generate candidate 3D vertices for each of the 2 dimensions of the 2D skeleton,
Generate candidate 3D ridges from candidate 3D vertices,
Candidate 3D faces are generated from 3D edges on the same surface,
Generate one or more 3D objects from candidate 3D faces,
9. The method of claim 8, wherein one or more three-dimensional objects are associated with the received two-dimensional object as a three-dimensional skeleton.
第1の探索クエリーに応答して、アンサーセットとして1つ以上の関連クラスタ内の3次元オブジェクトを提示して、
3次元オブジェクトの選択肢または関連クラスタの選択肢に対応付けられた関連性情報を対話形式で受け取って、
受け取った関連性情報に基づいて1つ以上の第2の探索クエリーを対話形式で発行して、多数の3次元オブジェクトをアンサーセットから消去して、アンサーセットから多数の関連クラスタを減らす。A method for presenting search results, including:
Responsive to the first search query, presenting three-dimensional objects in one or more related clusters as an answer set;
Receiving relevance information associated with 3D object options or related cluster options interactively,
One or more second search queries are interactively issued based on the received relevance information to delete multiple 3D objects from the answer set and reduce multiple related clusters from the answer set.
3次元オブジェクトに対応付けられた位相を導出し、
3次元オブジェクトの成分に対応付けられたローカルジオメトリを導出し、
位相およびローカルジオメトリを探索要求に生成する。A method for generating a three-dimensional search request including:
Derive the phase associated with the 3D object,
Deriving local geometry associated with 3D object components,
Generate topological and local geometry in the search request.
3次元モデルを3次元スケルトンに縮小し、
各3次元スケルトンについて、そのスケルトンに定義された各幾何エンティティに対応付けられた位相およびローカルジオメトリを導出し、
各3次元スケルトンと、その対応する位相と、対応するローカルジオメトリとに特徴ベクトルを生成し、
各3次元スケルトンとそれらの対応する特徴ベクトルとの間に対応付けを生成し、
各対応付けを3次元データ記憶装置に格納する。A method of storing in a searchable three-dimensional data storage device comprising: :
Reduce the 3D model to a 3D skeleton,
For each 3D skeleton, derive the topology and local geometry associated with each geometric entity defined in that skeleton,
Generate feature vectors for each 3D skeleton, its corresponding phase, and its corresponding local geometry;
Generate a correspondence between each 3D skeleton and their corresponding feature vectors;
Each association is stored in a three-dimensional data storage device.
スケルトンの各幾何エンティティのローカル幾何特性としてローカルジオメトリを表現することを含む、請求項24に記載の方法。The derivation further expresses the phase as a relationship between each geometric entity of the skeleton,
25. The method of claim 24, comprising representing local geometry as a local geometric property of each geometric entity of the skeleton.
2次元以上のオブジェクトを受け取り、
2次元以上のオブジェクトを3次元スケルトンに変換し、
3次元スケルトンの部品の選択を受け取り、
その部品を特徴ベクトル変換し、
特徴ベクトルを探してデータ記憶装置を探索する。Search method, including:
Accepts two or more dimension objects,
Convert 2D or higher objects to 3D skeletons,
Receive selection of 3D skeleton parts,
Convert the part into feature vectors,
Search the data store by searching for feature vectors.
2次元以上のオブジェクトを受け取り、
2次元以上のオブジェクトを3次元スケルトンに変換し、
2次元以上のオブジェクトテキスト情報から導出し、
位相および3次元スケルトンに対応付けられたローカルジオメトリからと、テキスト情報とから、特徴ベクトルを生成し、
データ記憶装置に対する探索要求として特徴ベクトルを送信する。Search method, including:
Accepts two or more dimension objects,
Convert 2D or higher objects to 3D skeletons,
Derived from object text information of two or more dimensions,
Generate feature vectors from local geometry associated with topologies and 3D skeletons, and text information,
A feature vector is transmitted as a search request to the data storage device.
3次元探索要求の関連性の基本設定を取得し、
3次元探索要求を関連性基本設定で変更して、
3次元探索要求を1つ以上のデータ記憶装置に送信する。How to perform a search, including:
Get basic settings of relevance of 3D search request,
Change the 3D search request in the relevance basic settings,
Send a three-dimensional search request to one or more data storage devices.
アンサーセットの関連性基本設定をさらに受け取って、
関連性基本設定をさらに関連性基本設定で変更して、
変更した関連性基本設定を探索要求に対応付けられたサーチャーに対応付けることをさらに含む、請求項38に記載の方法。In response to a 3D search request, presenting one or more clusters having one or more 3D models from an answer set returned from one or more data storage devices;
Receive more answer set basic preferences,
Change the relevance basic setting further in the relevance basic setting,
40. The method of claim 38, further comprising associating the modified relevance preference with a searcher associated with the search request.
新しい3次元探索要求をサーチャーに対応付けられた変更した関連性基本設定で変更して、
新しい3次元探索要求を1つ以上のデータ記憶装置に送信することをさらに含む、請求項39に記載の方法。Receive a new 3D search request from the searcher,
Change the new 3D search request with the changed relevance preference associated with the searcher,
40. The method of claim 39, further comprising sending a new three-dimensional search request to one or more data storage devices.
3次元クエリーインターフェースと、
クエリーインターフェースと対話するスケルトンコンバータと、
スケルトンコンバータと対話する特徴ベクトルコンストラクタとを備え、
クエリーインターフェースが2以上の次元のオブジェクトの探索要求を受け取って、スケルトンコンバータが3次元グラフィックデータ構造としてオブジェクトを表現して、特徴ベクトルコンストラクタがグラフィックデータ構造を1つ以上のデータ記憶装置に対する探索要求として用いられる特徴ベクトルに変換して、特徴ベクトルが3次元グラフィックデータ構造から導出した位相およびローカル幾何情報を含む。Search system, including:
A 3D query interface,
A skeleton converter that interacts with the query interface;
With a feature vector constructor to interact with the skeleton converter,
The query interface receives a search request for an object of two or more dimensions, the skeleton converter expresses the object as a three-dimensional graphic data structure, and the feature vector constructor uses the graphic data structure as a search request for one or more data storage devices. Converting to the feature vector used, the feature vector includes the topological and local geometric information derived from the three-dimensional graphic data structure.
1つ以上のデータ記憶装置に索引付けした候補の特徴ベクトルに対する特徴ベクトルのローカル幾何情報部分を比較する、1つ以上のデータ記憶装置のインターフェースとなる低レベルマッチャーとをさらに含む、請求項41に記載の探索システム。A high-level matcher that interfaces with one or more data storage devices to compare the phase information portion of the feature vector against candidate feature vectors indexed into one or more data storage devices;
42. A low level matcher that interfaces one or more data storage devices to compare local geometric information portions of the feature vectors against candidate feature vectors indexed to one or more data storage devices. The described search system.
3次元データ記憶装置と、
インデクサと、
コンペアラとを備え、
インデクサが特徴ベクトルを3次元グラフデータ構造に対応付けて、特徴ベクトルが各グラフデータ構造のエンティティの位相およびローカル幾何情報を含み、特徴ベクトルとグラフデータ構造とを互いに対応付けてデータ記憶装置に格納して、コンペアラが探索要求を探索ベクトルとして受け取って、少なくとも探索ベクトルと部分的に一致する候補の特徴ベクトルを探してデータ記憶装置を探索して、対応するグラフデータ構造を探索ベクトルのアンサーセットとして返送する。Search system, including:
A three-dimensional data storage device;
With the indexer,
With a comparer,
The indexer associates feature vectors with a three-dimensional graph data structure, the feature vector includes the phase and local geometric information of each graph data structure entity, and the feature vector and the graph data structure are associated with each other and stored in the data storage device. The comparer receives the search request as a search vector, searches the data storage device for a candidate feature vector that at least partially matches the search vector, and uses the corresponding graph data structure as an answer set of the search vector Return it.
探索ベクトルに対応付けられた位相をデータ記憶装置に格納した候補の特徴の位相情報と照合する、高レベルマッチャーと、
探索ベクトルに対応付けられたローカルジオメトリをデータ記憶装置に格納した候補の特徴ベクトルのローカル幾何情報と照合する低レベルマッチャーとを含む、請求項50に記載の探索システム。Comparer further
A high-level matcher that matches the phase associated with the search vector with the phase information of the candidate features stored in the data store;
51. The search system of claim 50, comprising: a low level matcher that matches local geometry associated with the search vector with local geometric information of candidate feature vectors stored in the data storage device.
3次元探索構築インターフェースと、
3次元プリミティブのプリミティブデータ記憶装置と、
クラスタインターフェースとを備え、
探索構築インターフェースを対話させて、プリミティブデータ記憶装置から1つ以上の3次元プリミティブを組み立てて3次元探索クエリーを生成して、クラスタインターフェースが探索クエリーの結果に対応付けられた探索結果を組織して、類似の結果にグループ化する。Query interface system, including:
A 3D search construction interface;
A primitive data storage device for three-dimensional primitives;
With a cluster interface,
Interact with the search construction interface, assemble one or more 3D primitives from the primitive data store to generate a 3D search query, and the cluster interface organizes the search results associated with the search query results. Group into similar results.
3次元候補コンストラクタと、
特徴ベクトルコンストラクタとを備え、
3次元候補コンストラクタが、2次元オブジェクトを受け取って、3次元グラフデータ構造で表現される3次元オブジェクトとして変換し、特徴ベクトルコンストラクタが3次元グラフ構造から位相およびローカル幾何情報を導出して、3次元探索の探索ベクトルを構築する。Search generation system, including:
A 3D candidate constructor,
With a feature vector constructor,
A 3D candidate constructor receives a 2D object and converts it as a 3D object represented by a 3D graph data structure, and a feature vector constructor derives topological and local geometric information from the 3D graph structure, Construct a search vector for the search.
1つ以上の幾何エンティティと、
1つ以上の幾何エンティティ間の位相結合を定義する位相行列と、
1つ以上の幾何エンティティに対応付けられた幾何特徴を有する1つ以上の幾何形状であって、それぞれ1以上の幾何エンティティに縮小できる幾何特徴とを備え、
幾何グラフデータ構造を2以上の次元を有するオブジェクトから生成して、幾何データ構造の特徴ベクトルを導出して、特徴ベクトルは位相行列および特徴の一部を含む。A geometric graph data structure for execution on a computer readable medium, the graph data structure used for searching and searching to define a three-dimensional object, comprising:
One or more geometric entities;
A topological matrix defining a topological coupling between one or more geometric entities;
One or more geometric shapes having geometric features associated with the one or more geometric entities, each of which can be reduced to one or more geometric entities;
A geometric graph data structure is generated from an object having two or more dimensions to derive a feature vector of the geometric data structure, the feature vector including a phase matrix and a part of the feature.
3次元オブジェクトに対応付けられた幾何エンティティ間の接続性および関係を定義する位相情報と、
各幾何エンティティの特性に対応付けられたローカルジオメトリとを備える。A feature vector that is executed on a computer-readable medium and defines a searchable attribute of a three-dimensional object, and is searchable as a search key associated with the generation of a search request or a three-dimensional object A feature vector used for storage in a data storage device comprising:
Topological information defining connectivity and relationships between geometric entities associated with a three-dimensional object;
Local geometry associated with the characteristics of each geometric entity.
3次元以上で表現されるオブジェクトに対応付けられた特徴を選択して、
特徴を選択的に重み付けして、
選択的に重み付けした特徴を探索要求として送信する。Search method, including:
Select the features associated with the object represented in 3D or higher,
Selectively weight features,
The selectively weighted feature is transmitted as a search request.
Applications Claiming Priority (2)
| Application Number | Priority Date | Filing Date | Title |
|---|---|---|---|
| US44237303P | 2003-01-25 | 2003-01-25 | |
| PCT/US2004/001962WO2004068300A2 (en) | 2003-01-25 | 2004-01-23 | Methods, systems, and data structures for performing searches on three dimensional objects |
Publications (2)
| Publication Number | Publication Date |
|---|---|
| JP2006520948Atrue JP2006520948A (en) | 2006-09-14 |
| JP4516957B2 JP4516957B2 (en) | 2010-08-04 |
Family
ID=32825208
Family Applications (1)
| Application Number | Title | Priority Date | Filing Date |
|---|---|---|---|
| JP2006502981AExpired - LifetimeJP4516957B2 (en) | 2003-01-25 | 2004-01-23 | Method, system and data structure for searching for 3D objects |
Country Status (4)
| Country | Link |
|---|---|
| US (2) | US8429174B2 (en) |
| EP (1) | EP1586020A2 (en) |
| JP (1) | JP4516957B2 (en) |
| WO (1) | WO2004068300A2 (en) |
Cited By (25)
| Publication number | Priority date | Publication date | Assignee | Title |
|---|---|---|---|---|
| JP2008077594A (en)* | 2006-09-25 | 2008-04-03 | Fujitsu Ltd | Design support apparatus, design support method, design support program, and design support system |
| JP2008197776A (en)* | 2007-02-09 | 2008-08-28 | Fujitsu Ltd | 3D model shape simplification device, 3D model shape simplification method, and 3D model shape simplification program |
| JP2009528604A (en)* | 2006-02-28 | 2009-08-06 | シーオークリエイト ソフトウェア ゲーエムベーハー | Method for comparing a first computer-aided 3D model with a second computer-aided 3D model |
| JP2011503757A (en)* | 2007-11-19 | 2011-01-27 | コースティック グラフィックス、インク. | Ray tracing rendering system and method |
| JP2011048791A (en)* | 2009-08-28 | 2011-03-10 | Fujitsu Ltd | Device, method and program for providing information |
| JP2011514995A (en)* | 2008-02-25 | 2011-05-12 | アティジオ リミテッド ライアビリティ カンパニー | Determining relevant information about the area of interest |
| JP2011158932A (en)* | 2010-01-29 | 2011-08-18 | Hitachi Ltd | Work instruction generation system, method and program |
| JP2013120395A (en)* | 2011-12-06 | 2013-06-17 | Celsys:Kk | Attitude control method for skeleton model, and program |
| JP2013222464A (en)* | 2012-04-12 | 2013-10-28 | Rathod Nainesh | Visual clustering method |
| JP2014021980A (en)* | 2012-07-13 | 2014-02-03 | Boeing Co | Method of optimizing toolpaths using medial axis transformation |
| KR101358321B1 (en) | 2008-10-08 | 2014-02-04 | 이엑스비 에셋 매니지먼트 게엠베하 | Distance dependent selection of information entities |
| JP2014517957A (en)* | 2011-04-29 | 2014-07-24 | マイクロソフト コーポレーション | Inferring spatial object descriptions from spatial gestures |
| JP2015522191A (en)* | 2012-07-06 | 2015-08-03 | シーメンス プロダクト ライフサイクル マネージメント ソフトウェアー インコーポレイテッドSiemens Product Lifecycle Management Software Inc. | Integration of discovered geometric relationships with user-defined geometric relationships |
| EP2924599A1 (en) | 2014-03-28 | 2015-09-30 | Fujitsu Limited | Computing program, computing apparatus and computing method |
| WO2017122467A1 (en)* | 2016-01-13 | 2017-07-20 | 株式会社日立製作所 | Model creation assistance system, model creation assistance method, and model creation assistance program |
| US9898859B2 (en) | 2014-03-31 | 2018-02-20 | Fujitsu Limited | Apparatus and method for managing structure data |
| WO2020105752A1 (en)* | 2018-11-21 | 2020-05-28 | 주식회사 일 | Product customizing method via terminal |
| JP2020537271A (en)* | 2017-10-16 | 2020-12-17 | モビディウス リミテッド | Density coordinate hashing of volume data |
| JP6833150B1 (en)* | 2020-06-30 | 2021-02-24 | 三菱電機株式会社 | Machining program search device and machining program search method |
| JP6833114B1 (en)* | 2019-11-28 | 2021-02-24 | 三菱電機株式会社 | Work image search device and work image search method |
| JP2021177381A (en)* | 2020-05-05 | 2021-11-11 | ダッソー システムズDassault Systemes | Improvement of similarity search of industrial component model |
| JP2021196805A (en)* | 2020-06-12 | 2021-12-27 | 3D Nest株式会社 | Image display method, program, and data generation method |
| JP2022075139A (en)* | 2020-11-06 | 2022-05-18 | 富士通株式会社 | Shape data output program, shape data output method and information processing device |
| JP2023013863A (en)* | 2021-07-16 | 2023-01-26 | ヤフー株式会社 | Information processing device, information processing method, and information processing program |
| JP2023025174A (en)* | 2018-03-05 | 2023-02-21 | ケーエルエー コーポレイション | Computer-readable storage medium for visualizing three-dimensional semiconductor structures |
Families Citing this family (317)
| Publication number | Priority date | Publication date | Assignee | Title |
|---|---|---|---|---|
| US9704128B2 (en)* | 2000-09-12 | 2017-07-11 | Sri International | Method and apparatus for iterative computer-mediated collaborative synthesis and analysis |
| US7356805B2 (en)* | 2003-01-02 | 2008-04-08 | University Of Rochester | Temporal affinity analysis using reuse signatures |
| US8429174B2 (en) | 2003-01-25 | 2013-04-23 | Purdue Research Foundation | Methods, systems, and data structures for performing searches on three dimensional objects |
| US7239989B2 (en)* | 2003-07-18 | 2007-07-03 | Oracle International Corporation | Within-distance query pruning in an R-tree index |
| US20050149258A1 (en)* | 2004-01-07 | 2005-07-07 | Ullas Gargi | Assisting navigation of digital content using a tangible medium |
| JP4267475B2 (en)* | 2004-02-13 | 2009-05-27 | 富士通株式会社 | Drawing verification device |
| US7679615B2 (en)* | 2004-05-04 | 2010-03-16 | Iucf-Hyu (Industry-University Cooperation Foundation Hanyang University) | Calculating three-dimensional (3D) Voronoi diagrams |
| US7548650B2 (en)* | 2004-06-30 | 2009-06-16 | Iowa State University Research Foundation, Inc. | Geometric search engine |
| GB2415876B (en)* | 2004-06-30 | 2007-12-05 | Voxar Ltd | Imaging volume data |
| US7346382B2 (en) | 2004-07-07 | 2008-03-18 | The Cleveland Clinic Foundation | Brain stimulation models, systems, devices, and methods |
| EP1617326A1 (en)* | 2004-07-14 | 2006-01-18 | Sap Ag | Technique for handling hierarchical application data |
| EP1617355A1 (en)* | 2004-07-14 | 2006-01-18 | Sap Ag | Technique for flexible path optimization |
| US8126907B2 (en)* | 2004-08-03 | 2012-02-28 | Nextengine, Inc. | Commercial shape search engine |
| JP2006099385A (en)* | 2004-09-29 | 2006-04-13 | Fujitsu Ltd | Shape design support program |
| US7856413B2 (en)* | 2004-10-14 | 2010-12-21 | International Business Machines Corporation | Dynamic search criteria on a search graph |
| US7158853B2 (en)* | 2004-10-25 | 2007-01-02 | Amada Company, Limited | Pattern recognition for sheet metal part models |
| WO2006058292A2 (en)* | 2004-11-29 | 2006-06-01 | Purdue Research Foundation | Methods for retrieving shapes and drawings |
| JP2006163894A (en)* | 2004-12-08 | 2006-06-22 | Hitachi Software Eng Co Ltd | Clustering system |
| KR20060066340A (en)* | 2004-12-13 | 2006-06-16 | 삼성전자주식회사 | Computer-readable recording medium for storing 3D structure sketch manufacturing method and method and computer program |
| CA2543980A1 (en)* | 2005-04-18 | 2006-10-18 | Steve Tsang | Method, system and computer program for using a suggestive modeling interface |
| WO2006124878A2 (en)* | 2005-05-12 | 2006-11-23 | Mark Lawson Palmer | Method for achieving virtual resolution enhancement of a diagnostic imaging modality by using coupled fea analyses |
| WO2006124719A2 (en)* | 2005-05-12 | 2006-11-23 | Mark Benjamin Willis | Method for using coupled fea analyses of different levels of organization within an entity to analyze the entity |
| US20070198588A1 (en)* | 2005-10-17 | 2007-08-23 | Siemens Corporate Research Inc | Automatic Qualification of Plant Equipment |
| US8429184B2 (en) | 2005-12-05 | 2013-04-23 | Collarity Inc. | Generation of refinement terms for search queries |
| US8903810B2 (en) | 2005-12-05 | 2014-12-02 | Collarity, Inc. | Techniques for ranking search results |
| US7756855B2 (en)* | 2006-10-11 | 2010-07-13 | Collarity, Inc. | Search phrase refinement by search term replacement |
| EP1796009A3 (en)* | 2005-12-08 | 2007-08-22 | Electronics and Telecommunications Research Institute | System for and method of extracting and clustering information |
| US20070179760A1 (en)* | 2006-01-06 | 2007-08-02 | Intel Corporation | Method of determining graph isomorphism in polynomial-time |
| US7584179B2 (en)* | 2006-01-27 | 2009-09-01 | William Derek Finley | Method of document searching |
| US20070192181A1 (en)* | 2006-02-10 | 2007-08-16 | Microsoft Corporation | Automatically modifying web pages to integrate advertising without changing UI |
| JP4990917B2 (en)* | 2006-02-23 | 2012-08-01 | イマジネスティクス エルエルシー | A method that allows a user to draw a component as input to search for the component in the database |
| JP4878178B2 (en)* | 2006-02-28 | 2012-02-15 | 株式会社日立製作所 | Data processing method and apparatus, and processing program therefor |
| KR101195942B1 (en)* | 2006-03-20 | 2012-10-29 | 삼성전자주식회사 | Camera calibration method and 3D object reconstruction method using the same |
| JP2007299238A (en)* | 2006-04-28 | 2007-11-15 | Toshiba Corp | CAD system and design / analysis method |
| US7970746B2 (en)* | 2006-06-13 | 2011-06-28 | Microsoft Corporation | Declarative management framework |
| US7840388B2 (en)* | 2006-06-26 | 2010-11-23 | Yokogawa Electric Corporation | Engineering device |
| US8015125B2 (en)* | 2006-08-31 | 2011-09-06 | Drexel University | Multi-scale segmentation and partial matching 3D models |
| US20080086324A1 (en)* | 2006-09-14 | 2008-04-10 | Junichi Yamagata | Parts managing system, parts managing method, and computer program product |
| US8103547B2 (en)* | 2006-09-18 | 2012-01-24 | Microsoft Corporation | Logocons: AD product for brand advertisers |
| US7969434B2 (en) | 2006-09-19 | 2011-06-28 | Caustic Graphics, Inc. | Method, apparatus, and computer readable medium for accelerating intersection testing in ray-tracing rendering |
| US7830379B2 (en)* | 2006-09-19 | 2010-11-09 | Caustic Graphics, Inc. | Architectures for parallelized intersection testing and shading for ray-tracing rendering |
| US8018457B2 (en)* | 2006-09-19 | 2011-09-13 | Caustic Graphics, Inc. | Ray tracing system architectures and methods |
| US9665970B2 (en) | 2006-09-19 | 2017-05-30 | Imagination Technologies Limited | Variable-sized concurrent grouping for multiprocessing |
| US9478062B2 (en) | 2006-09-19 | 2016-10-25 | Imagination Technologies Limited | Memory allocation in distributed memories for multiprocessing |
| US8674987B2 (en) | 2006-09-19 | 2014-03-18 | Caustic Graphics, Inc. | Dynamic ray population control |
| US7627542B2 (en)* | 2006-09-22 | 2009-12-01 | Microsoft Corporation | Group identification in large-scaled networks via hierarchical clustering through refraction over edges of networks |
| US8442972B2 (en)* | 2006-10-11 | 2013-05-14 | Collarity, Inc. | Negative associations for search results ranking and refinement |
| JP2008117031A (en)* | 2006-11-01 | 2008-05-22 | Fujitsu Ltd | Design support apparatus, design support method, design support program, and CAD system |
| US8417502B1 (en) | 2006-12-28 | 2013-04-09 | Scientific Components Corporation | Mixer harmonics calculator |
| US7739260B1 (en)* | 2006-12-28 | 2010-06-15 | Scientific Components Corporation | Database search system using interpolated data with defined resolution |
| US7688318B2 (en) | 2007-02-02 | 2010-03-30 | Dassault Systemes Solidworks Corporation | Reusable data constructs for a modeling system |
| FI20075084A0 (en)* | 2007-02-06 | 2007-02-06 | Tekla Corp | Computer-aided model design |
| US8374829B2 (en) | 2007-03-16 | 2013-02-12 | Lego A/S | Automatic generation of building instructions for building element models |
| US7979251B2 (en)* | 2007-03-16 | 2011-07-12 | Lego A/S | Automatic generation of building instructions for building element models |
| US20080294368A1 (en)* | 2007-03-23 | 2008-11-27 | Jun Wan | System and method for calculating the internal volume of a solid model |
| CA2681147A1 (en)* | 2007-04-19 | 2008-10-30 | D-Wave Systems Inc. | Systems, methods, and apparatus for automatic image recognition |
| US20080269942A1 (en)* | 2007-04-26 | 2008-10-30 | David Mitchell Free | Computer system and method for providing real-world market-based information corresponding with a theoretical cad model and/or rfq/rfp data |
| US20080297503A1 (en)* | 2007-05-30 | 2008-12-04 | John Dickinson | System and method for reconstructing a 3D solid model from a 2D line drawing |
| US20110206248A1 (en)* | 2007-08-16 | 2011-08-25 | Koninklijke Philips Electronics N.V. | Imaging method for sampling a cross-section plane in a three-dimensional (3d) image data volume |
| US9063979B2 (en)* | 2007-11-01 | 2015-06-23 | Ebay, Inc. | Analyzing event streams of user sessions |
| JP2009129337A (en)* | 2007-11-27 | 2009-06-11 | Hitachi Ltd | 3D similar shape search device |
| JP5309570B2 (en)* | 2008-01-11 | 2013-10-09 | 株式会社リコー | Information retrieval apparatus, information retrieval method, and control program |
| US8122442B2 (en)* | 2008-01-31 | 2012-02-21 | Oracle America, Inc. | Method and system for array optimization |
| US9220889B2 (en) | 2008-02-11 | 2015-12-29 | Intelect Medical, Inc. | Directional electrode devices with locating features |
| US8019440B2 (en) | 2008-02-12 | 2011-09-13 | Intelect Medical, Inc. | Directional lead assembly |
| US20090222446A1 (en)* | 2008-03-03 | 2009-09-03 | Emmanuel Goldschmidt | Three-dimensional object identification through resonance frequencies analysis |
| JP5192055B2 (en)* | 2008-03-04 | 2013-05-08 | コードエスイー カンパニー リミテッド | Three-dimensional application program framework structure and application implementation method based thereon, and three-dimensional application software framework-based automatic test system and method |
| WO2009124139A1 (en)* | 2008-04-01 | 2009-10-08 | The Government Of The United States Of America, As Represented By The Secretaty Of The Navy | Methods and systems of comparing face models for recognition |
| US9272153B2 (en) | 2008-05-15 | 2016-03-01 | Boston Scientific Neuromodulation Corporation | VOA generation system and method using a fiber specific analysis |
| WO2009154479A1 (en) | 2008-06-20 | 2009-12-23 | Business Intelligence Solutions Safe B.V. | A method of optimizing a tree structure for graphical representation |
| US8438178B2 (en) | 2008-06-26 | 2013-05-07 | Collarity Inc. | Interactions among online digital identities |
| CN102164734B (en)* | 2008-07-25 | 2014-06-11 | 康奈尔大学 | Apparatus and methods for digital manufacturing |
| US8463053B1 (en) | 2008-08-08 | 2013-06-11 | The Research Foundation Of State University Of New York | Enhanced max margin learning on multimodal data mining in a multimedia database |
| US8421801B2 (en)* | 2008-09-09 | 2013-04-16 | Caustic Graphics, Inc. | Ray tracing using ray-specific clipping |
| US8521757B1 (en) | 2008-09-26 | 2013-08-27 | Symantec Corporation | Method and apparatus for template-based processing of electronic documents |
| US8204340B2 (en)* | 2008-09-29 | 2012-06-19 | Two Pic Mc Llc | Methods and apparatus for dot marker matching |
| JP4806706B2 (en)* | 2008-12-18 | 2011-11-02 | 株式会社日立製作所 | Analytical model deformation method and computer |
| US9607052B2 (en)* | 2008-12-29 | 2017-03-28 | Technion Research & Development Foundation Limited | Query networks evaluation system and method |
| US20100194778A1 (en)* | 2009-01-30 | 2010-08-05 | Microsoft Corporation | Projecting data dimensions on a visualization data set |
| US8380644B2 (en)* | 2009-02-10 | 2013-02-19 | Siemens Audiologische Technik Gmbh | System and method for prototyping by learning from examples wherein a prototype is calculated for each shape class cluster |
| US8260583B2 (en)* | 2009-03-12 | 2012-09-04 | Siemens Product Lifecycle Management Software Inc. | System and method for identifying wall faces in an object model |
| WO2010121863A1 (en) | 2009-04-20 | 2010-10-28 | International Business Machines Corporation | A method and system for facilitating object searches in virtual worlds |
| US9330204B2 (en) | 2009-05-29 | 2016-05-03 | Siemens Product Lifecycle Management Software Inc. | CAD system and method for wireframe coupling |
| US8952961B2 (en)* | 2009-06-29 | 2015-02-10 | Imagination Technologies, Limited | Systems and methods for photon map querying |
| CN101599077B (en)* | 2009-06-29 | 2011-01-05 | 清华大学 | Method for retrieving three-dimensional object |
| WO2011025865A1 (en) | 2009-08-27 | 2011-03-03 | The Cleveland Clinic Foundation | System and method to estimate region of tissue activation |
| US8447576B2 (en)* | 2009-10-23 | 2013-05-21 | Siemens Product Lifecycle Management Software Inc. | System and method for producing editable three-dimensional models |
| WO2011068997A1 (en) | 2009-12-02 | 2011-06-09 | The Cleveland Clinic Foundation | Reversing cognitive-motor impairments in patients having a neuro-degenerative disease using a computational modeling approach to deep brain stimulation programming |
| KR101626384B1 (en)* | 2009-12-04 | 2016-06-13 | 한국전자통신연구원 | Apparatus and method for search of 3d model data |
| US9009163B2 (en) | 2009-12-08 | 2015-04-14 | Intellectual Ventures Fund 83 Llc | Lazy evaluation of semantic indexing |
| WO2011078698A1 (en)* | 2009-12-14 | 2011-06-30 | Business Intelligence Solutions Safe B.V. | A method and system for optimizing the arrangement of spatial elements |
| US8875038B2 (en) | 2010-01-19 | 2014-10-28 | Collarity, Inc. | Anchoring for content synchronization |
| TWI393071B (en)* | 2010-02-12 | 2013-04-11 | Nat Univ Tsing Hua | Image processing method for feature retention and the system of the same |
| US20110202326A1 (en)* | 2010-02-17 | 2011-08-18 | Lockheed Martin Corporation | Modeling social and cultural conditions in a voxel database |
| JP5430456B2 (en)* | 2010-03-16 | 2014-02-26 | キヤノン株式会社 | Geometric feature extraction device, geometric feature extraction method, program, three-dimensional measurement device, object recognition device |
| US8463756B2 (en)* | 2010-04-21 | 2013-06-11 | Haileo, Inc. | Systems and methods for building a universal multimedia learner |
| GB201008228D0 (en)* | 2010-05-18 | 2010-06-30 | Univ Edinburgh | Command interface |
| US8913804B2 (en) | 2010-06-14 | 2014-12-16 | Boston Scientific Neuromodulation Corporation | Programming interface for spinal cord neuromodulation |
| US8443300B2 (en)* | 2010-08-24 | 2013-05-14 | Ebay Inc. | Three dimensional navigation of listing information |
| US9177041B2 (en)* | 2010-09-03 | 2015-11-03 | Robert Lewis Jackson, JR. | Automated stratification of graph display |
| US10394778B2 (en) | 2010-09-03 | 2019-08-27 | Robert Lewis Jackson, JR. | Minimal representation of connecting walks |
| US8704824B2 (en)* | 2010-09-29 | 2014-04-22 | Siemens Product Lifecycle Management Software Inc. | Integrated history-free and history-based modeling |
| EP2474930B1 (en)* | 2010-12-30 | 2018-10-24 | Dassault Systèmes | Updating a modeled object |
| EP2474928A1 (en) | 2010-12-30 | 2012-07-11 | Dassault Systèmes | Merging of modeled objects |
| EP2474929A1 (en) | 2010-12-30 | 2012-07-11 | Dassault Systèmes | Modeled object updating |
| JP5625920B2 (en)* | 2011-01-06 | 2014-11-19 | セイコーエプソン株式会社 | Image processing apparatus, image processing method, and program thereof |
| US9286671B2 (en)* | 2011-01-20 | 2016-03-15 | Medtronic Bakken Research Center B.V. | Method for determining at least one applicable path of movement for an object in tissue |
| CN103649905B (en)* | 2011-03-10 | 2015-08-05 | 特克斯特怀茨有限责任公司 | Method and system for unified information representation and applications thereof |
| JP2014518516A (en) | 2011-03-29 | 2014-07-31 | ボストン サイエンティフィック ニューロモデュレイション コーポレイション | System and method for atlas alignment |
| JP5790874B2 (en)* | 2011-05-03 | 2015-10-07 | 富士通株式会社 | Shape change method |
| EP2521056A1 (en)* | 2011-05-06 | 2012-11-07 | Dassault Systèmes | Cad design with primitive closed shapes |
| EP2521057A1 (en) | 2011-05-06 | 2012-11-07 | Dassault Systèmes | Determining a parameter of a geometrical cad operation |
| EP2521058A1 (en) | 2011-05-06 | 2012-11-07 | Dassault Systèmes | Determining a geometrical CAD operation |
| EP2521055B1 (en) | 2011-05-06 | 2019-07-10 | Dassault Systèmes | Selection of three-dimensional parametric shapes |
| EP2521059B1 (en) | 2011-05-06 | 2019-10-16 | Dassault Systèmes | Design operations on shapes divided in portions |
| EP2523130B1 (en)* | 2011-05-11 | 2024-12-25 | Dassault Systèmes | Method for designing a geometrical three-dimensional modeled object |
| US9592389B2 (en) | 2011-05-27 | 2017-03-14 | Boston Scientific Neuromodulation Corporation | Visualization of relevant stimulation leadwire electrodes relative to selected stimulation information |
| US9227074B2 (en) | 2012-08-28 | 2016-01-05 | Boston Scientific Neuromodulation Corporation | Parameter visualization, selection, and annotation interface |
| JP2012256109A (en)* | 2011-06-07 | 2012-12-27 | Sony Corp | Information processor, program, and information processing method |
| GB2529075A (en) | 2011-06-16 | 2016-02-10 | Imagination Tech Ltd | Graphics processor with non-blocking concurrent architecture |
| US10061618B2 (en) | 2011-06-16 | 2018-08-28 | Imagination Technologies Limited | Scheduling heterogenous computation on multithreaded processors |
| EP2541437A1 (en)* | 2011-06-30 | 2013-01-02 | dimensio informatics GmbH | Data base indexing |
| WO2013019961A2 (en)* | 2011-08-02 | 2013-02-07 | Design Play Technologies Inc. | Real-time collaborative design platform |
| EP2742450A2 (en) | 2011-08-09 | 2014-06-18 | Boston Scientific Neuromodulation Corporation | Systems and methods for stimulation-related volume analysis, creation, and sharing |
| US8768921B2 (en) | 2011-10-20 | 2014-07-01 | International Business Machines Corporation | Computer-implemented information reuse |
| JP5654438B2 (en)* | 2011-11-29 | 2015-01-14 | 株式会社日立製作所 | Similar Design Structure Search Device and Similar Design Structure Search Method |
| US20130275903A1 (en)* | 2012-04-13 | 2013-10-17 | Christine Marie Kennefick | Method and Device to Design, Store and Analyze Patterns of Three Dimensional Structural Elements at the Atomic, Nanoscale, Microscale and Larger Scale Levels |
| DE102012208999A1 (en) | 2012-05-29 | 2013-12-05 | Siemens Aktiengesellschaft | Editing a dataset |
| US10002164B2 (en)* | 2012-06-01 | 2018-06-19 | Ansys, Inc. | Systems and methods for context based search of simulation objects |
| US9442959B2 (en)* | 2012-06-28 | 2016-09-13 | Adobe Systems Incorporated | Image search refinement using facets |
| EP2879757B1 (en) | 2012-08-04 | 2019-06-26 | Boston Scientific Neuromodulation Corporation | Systems and methods for storing and transferring registration, atlas, and lead information between medical devices |
| US9390174B2 (en) | 2012-08-08 | 2016-07-12 | Google Inc. | Search result ranking and presentation |
| US9514522B2 (en)* | 2012-08-24 | 2016-12-06 | Microsoft Technology Licensing, Llc | Depth data processing and compression |
| US9372871B2 (en)* | 2012-08-24 | 2016-06-21 | Google Inc. | Combining unstructured image and 3D search results for interactive search and exploration |
| US9836483B1 (en)* | 2012-08-29 | 2017-12-05 | Google Llc | Using a mobile device for coarse shape matching against cloud-based 3D model database |
| US9501869B2 (en)* | 2012-10-31 | 2016-11-22 | Gulfstream Aerospace Corporation | Systems and methods for presenting vehicle component information |
| US9792412B2 (en) | 2012-11-01 | 2017-10-17 | Boston Scientific Neuromodulation Corporation | Systems and methods for VOA model generation and use |
| US20140188768A1 (en)* | 2012-12-28 | 2014-07-03 | General Electric Company | System and Method For Creating Customized Model Ensembles On Demand |
| EP2750106B1 (en) | 2012-12-31 | 2021-09-15 | Dassault Systèmes | Geometrical elements transformed by rigid motions |
| EP2750107B1 (en) | 2012-12-31 | 2017-03-15 | Dassault Systèmes | Groups of faces that form a geometrical pattern |
| IL224482B (en) | 2013-01-29 | 2018-08-30 | Verint Systems Ltd | System and method for keyword spotting using representative dictionary |
| US10127196B2 (en) | 2013-04-02 | 2018-11-13 | 3M Innovative Properties Company | Systems and methods for managing notes |
| KR102234688B1 (en) | 2013-04-02 | 2021-03-31 | 쓰리엠 이노베이티브 프로퍼티즈 컴파니 | Systems and methods for managing notes |
| EP2981932B1 (en) | 2013-04-02 | 2018-11-14 | 3M Innovative Properties Company | Systems and methods for note recognition |
| US10776978B2 (en)* | 2013-04-08 | 2020-09-15 | Holcomb Technologies, L.L.C. | Method for the automated identification of real world objects |
| US9836879B2 (en)* | 2013-04-16 | 2017-12-05 | Autodesk, Inc. | Mesh skinning technique |
| CN103198522B (en)* | 2013-04-23 | 2015-08-12 | 清华大学 | Three-dimensional scene models generation method |
| IL226056A (en)* | 2013-04-28 | 2017-06-29 | Verint Systems Ltd | Systems and methods for keyword spotting using adaptive management of multiple pattern matching algorithms |
| US9147125B2 (en) | 2013-05-03 | 2015-09-29 | Microsoft Technology Licensing, Llc | Hand-drawn sketch recognition |
| EP2808810B1 (en) | 2013-05-28 | 2017-01-11 | Dassault Systèmes | Compression and decompression of 3d modeled object |
| GB2515833A (en)* | 2013-07-05 | 2015-01-07 | Recipero Ltd | System for generating a security document |
| WO2015006275A1 (en) | 2013-07-09 | 2015-01-15 | 3M Innovative Properties Company | Systems and methods for note content extraction and management using segmented notes |
| EP2823952A1 (en)* | 2013-07-09 | 2015-01-14 | Siemens Aktiengesellschaft | Adaptation method and production method for components produced by means of SLM |
| US9355123B2 (en) | 2013-07-19 | 2016-05-31 | Nant Holdings Ip, Llc | Fast recognition algorithm processing, systems and methods |
| DE102013015239A1 (en)* | 2013-09-13 | 2015-03-19 | Liebherr-Verzahntechnik Gmbh | Process for setting up a gear cutting machine and gear cutting machine |
| US10175845B2 (en) | 2013-10-16 | 2019-01-08 | 3M Innovative Properties Company | Organizing digital notes on a user interface |
| US9274693B2 (en) | 2013-10-16 | 2016-03-01 | 3M Innovative Properties Company | Editing digital notes representing physical notes |
| US9047509B2 (en) | 2013-10-16 | 2015-06-02 | 3M Innovative Properties Company | Note recognition and association based on grouping indicators |
| US9310983B2 (en) | 2013-10-16 | 2016-04-12 | 3M Innovative Properties Company | Adding, deleting digital notes from a group of digital notes |
| US10573059B2 (en)* | 2018-03-27 | 2020-02-25 | Desprez, Llc | Methods of secret sharing for secure collaborative graphical design |
| WO2015057793A1 (en) | 2013-10-16 | 2015-04-23 | 3M Innovative Properties Company | Multi-color channel detection for note recognition and management |
| EP3644224B1 (en) | 2013-10-16 | 2023-09-27 | 3M Innovative Properties Company | Note recognition for overlapping physical notes |
| WO2015061689A1 (en)* | 2013-10-24 | 2015-04-30 | Ramos Olivia | System and method for mining data using haptic feedback |
| KR101512084B1 (en)* | 2013-11-15 | 2015-04-17 | 한국과학기술원 | Web search system for providing 3 dimensional web search interface based virtual reality and method thereof |
| US10307961B2 (en)* | 2013-11-21 | 2019-06-04 | Siemens Product Lifecycle Management Software Inc. | Intelligent 3D printer and method |
| KR101912794B1 (en)* | 2013-11-27 | 2018-10-29 | 한화테크윈 주식회사 | Video Search System and Video Search method |
| US9165100B2 (en)* | 2013-12-05 | 2015-10-20 | Honeywell International Inc. | Methods and apparatus to map schematic elements into a database |
| US11886493B2 (en) | 2013-12-15 | 2024-01-30 | 7893159 Canada Inc. | Method and system for displaying 3D models |
| US20170004621A1 (en)* | 2013-12-15 | 2017-01-05 | 7893159 Canada Inc. | Method and System for comparing 3D Models |
| US11010593B2 (en)* | 2013-12-15 | 2021-05-18 | 7893159 Canada Inc. | Method and system for comparing 3D models |
| IN2013MU04141A (en)* | 2013-12-31 | 2015-08-07 | Dassault Systemes | |
| US10037403B2 (en)* | 2014-01-13 | 2018-07-31 | The Boeing Company | Method and system for managing aircraft parts |
| EP3100208B1 (en) | 2014-01-31 | 2021-08-18 | 3M Innovative Properties Company | Note capture and recognition with manual assist |
| WO2015123647A1 (en) | 2014-02-14 | 2015-08-20 | Nant Holdings Ip, Llc | Object ingestion through canonical shapes, systems and methods |
| US20150253974A1 (en) | 2014-03-07 | 2015-09-10 | Sony Corporation | Control of large screen display using wireless portable computer interfacing with display controller |
| US11501042B2 (en) | 2014-03-24 | 2022-11-15 | Imagars Llc | Decisions with big data |
| US9727784B2 (en)* | 2014-06-03 | 2017-08-08 | Digitalglobe, Inc. | Some automated and semi-automated tools for linear feature extraction in two and three dimensions |
| US10817526B2 (en)* | 2014-07-16 | 2020-10-27 | Machine Research Corporation | Systems and methods for searching a machining knowledge database |
| US9959388B2 (en) | 2014-07-24 | 2018-05-01 | Boston Scientific Neuromodulation Corporation | Systems, devices, and methods for providing electrical stimulation therapy feedback |
| US10272247B2 (en) | 2014-07-30 | 2019-04-30 | Boston Scientific Neuromodulation Corporation | Systems and methods for stimulation-related volume analysis, creation, and sharing with integrated surgical planning and stimulation programming |
| US10265528B2 (en) | 2014-07-30 | 2019-04-23 | Boston Scientific Neuromodulation Corporation | Systems and methods for electrical stimulation-related patient population volume analysis and use |
| US10402067B2 (en)* | 2014-08-01 | 2019-09-03 | Autodesk, Inc. | Bi-directional search and sorting |
| ES2899960T3 (en)* | 2014-08-29 | 2022-03-15 | Microsoft Technology Licensing Llc | Manufacture of three-dimensional objects |
| US10466681B1 (en) | 2014-09-02 | 2019-11-05 | Machine Research Corporation | Systems and methods for machining knowledge reuse |
| US9974959B2 (en) | 2014-10-07 | 2018-05-22 | Boston Scientific Neuromodulation Corporation | Systems, devices, and methods for electrical stimulation using feedback to adjust stimulation parameters |
| US9026407B1 (en) | 2014-10-16 | 2015-05-05 | Christine Marie Kennefick | Method of making and using a material model of elements with planar faces |
| CN104298758A (en)* | 2014-10-22 | 2015-01-21 | 天津大学 | Multi-perspective target retrieval method |
| WO2016122663A1 (en) | 2015-01-30 | 2016-08-04 | Hewlett-Packard Development Company, L.P. | A physical document for navigation |
| CN107209956A (en)* | 2015-04-20 | 2017-09-26 | 惠普发展公司有限责任合伙企业 | Create voxel representations of three-dimensional (3D) objects |
| US10780283B2 (en) | 2015-05-26 | 2020-09-22 | Boston Scientific Neuromodulation Corporation | Systems and methods for analyzing electrical stimulation and selecting or manipulating volumes of activation |
| CN107530542B (en) | 2015-05-26 | 2020-10-13 | 波士顿科学神经调制公司 | System for analyzing electrical stimulation and selecting or manipulating activation volume |
| EP3098735A1 (en) | 2015-05-28 | 2016-11-30 | Dassault Systèmes | Querying a database with thickness criterion |
| EP3098734A1 (en) | 2015-05-28 | 2016-11-30 | Dassault Systèmes | Querying a database with likeness criterion |
| US11356451B2 (en)* | 2015-06-12 | 2022-06-07 | Miblok/Sheryldene-Anne Valente | Cube-based user interface for online community |
| ES2940303T3 (en) | 2015-06-29 | 2023-05-05 | Boston Scient Neuromodulation Corp | Stimulation parameter selection systems by use of targets and direction |
| EP3280490B1 (en) | 2015-06-29 | 2021-09-01 | Boston Scientific Neuromodulation Corporation | Systems for selecting stimulation parameters based on stimulation target region, effects, or side effects |
| US9721356B2 (en) | 2015-08-18 | 2017-08-01 | Honeywell International Inc. | Methods and systems for programatically identifying shapes in graphical artifacts |
| WO2017062378A1 (en) | 2015-10-09 | 2017-04-13 | Boston Scientific Neuromodulation Corporation | System and methods for clinical effects mapping for directional stimulations leads |
| IL242219B (en) | 2015-10-22 | 2020-11-30 | Verint Systems Ltd | System and method for keyword searching using both static and dynamic dictionaries |
| IL242218B (en) | 2015-10-22 | 2020-11-30 | Verint Systems Ltd | System and method for maintaining a dynamic dictionary |
| TW201719572A (en)* | 2015-11-19 | 2017-06-01 | 國立交通大學 | Method for analyzing and searching 3D models |
| CN105701142A (en)* | 2015-11-26 | 2016-06-22 | 中国传媒大学 | Keyword based three-dimensional model retrieving method |
| KR102431194B1 (en) | 2015-12-11 | 2022-08-11 | 한화디펜스 주식회사 | Method for obstacle collision determination using object moving path and apparatus for the same |
| US9799106B2 (en) | 2015-12-16 | 2017-10-24 | Dropbox, Inc. | Enhancing a digital image |
| US9875258B1 (en)* | 2015-12-17 | 2018-01-23 | A9.Com, Inc. | Generating search strings and refinements from an image |
| US10127333B2 (en)* | 2015-12-30 | 2018-11-13 | Dassault Systemes | Embedded frequency based search and 3D graphical data processing |
| US10049479B2 (en) | 2015-12-30 | 2018-08-14 | Dassault Systemes | Density based graphical mapping |
| US10360438B2 (en) | 2015-12-30 | 2019-07-23 | Dassault Systemes | 3D to 2D reimaging for search |
| WO2017131771A1 (en) | 2016-01-29 | 2017-08-03 | Hewlett-Packard Development Company, L.P. | Identify a model that matches a 3d object |
| US10192000B2 (en)* | 2016-01-29 | 2019-01-29 | Walmart Apollo, Llc | System and method for distributed system to store and visualize large graph databases |
| US10108637B2 (en)* | 2016-03-08 | 2018-10-23 | International Business Machines Corporation | Spatial-temporal storage system, method, and recording medium |
| US10824638B2 (en)* | 2016-03-25 | 2020-11-03 | Microsoft Technology Licensing, Llc | Enhancing object representations using inferred user intents |
| US10719193B2 (en)* | 2016-04-20 | 2020-07-21 | Microsoft Technology Licensing, Llc | Augmenting search with three-dimensional representations |
| US10716942B2 (en) | 2016-04-25 | 2020-07-21 | Boston Scientific Neuromodulation Corporation | System and methods for directional steering of electrical stimulation |
| US20170316004A1 (en)* | 2016-04-28 | 2017-11-02 | Microsoft Technology Licensing, Llc | Online engine for 3d components |
| US10163252B2 (en)* | 2016-05-03 | 2018-12-25 | Affera, Inc. | Anatomical model displaying |
| WO2017197114A1 (en) | 2016-05-11 | 2017-11-16 | Affera, Inc. | Anatomical model generation |
| WO2017197294A1 (en) | 2016-05-12 | 2017-11-16 | Affera, Inc. | Three-dimensional cardiac representation |
| US11468111B2 (en)* | 2016-06-01 | 2022-10-11 | Microsoft Technology Licensing, Llc | Online perspective search for 3D components |
| EP3458152B1 (en) | 2016-06-24 | 2021-04-21 | Boston Scientific Neuromodulation Corporation | Systems and methods for visual analytics of clinical effects |
| EP3264286B1 (en) | 2016-06-28 | 2020-11-18 | Dassault Systèmes | Querying a database with morphology criterion |
| ES2941259T3 (en)* | 2016-08-12 | 2023-05-19 | Packsize Llc | Systems and methods for automatically generating metadata for media documents |
| WO2018044881A1 (en) | 2016-09-02 | 2018-03-08 | Boston Scientific Neuromodulation Corporation | Systems and methods for visualizing and directing stimulation of neural elements |
| US10780282B2 (en) | 2016-09-20 | 2020-09-22 | Boston Scientific Neuromodulation Corporation | Systems and methods for steering electrical stimulation of patient tissue and determining stimulation parameters |
| US20180089260A1 (en)* | 2016-09-26 | 2018-03-29 | Illinois Institute Of Technology | Heterogenous string search structures with embedded range search structures |
| US11741137B2 (en)* | 2016-09-26 | 2023-08-29 | Sanjiv Kapoor | Biased string search structures with embedded range search structures |
| ES2869184T3 (en) | 2016-10-14 | 2021-10-25 | Boston Scient Neuromodulation Corp | Systems to determine in closed loop the configuration of the stimulation parameters of an electrical stimulation system |
| JP2019532851A (en)* | 2016-10-27 | 2019-11-14 | ヒューレット−パッカード デベロップメント カンパニー エル.ピー.Hewlett‐Packard Development Company, L.P. | Generate additive manufacturing instructions |
| US10417523B2 (en) | 2016-11-07 | 2019-09-17 | Ayasdi Ai Llc | Dimension grouping and reduction for model generation, testing, and documentation |
| EP3321817B1 (en) | 2016-11-14 | 2025-04-02 | Dassault Systèmes | Querying a database based on a parametric view function |
| US10275909B2 (en)* | 2016-11-23 | 2019-04-30 | 3Dsystems, Inc. | Systems and methods for an integrated system for visualizing, simulating, modifying and 3D printing 3D objects |
| JP6834005B2 (en) | 2017-01-03 | 2021-02-24 | ボストン サイエンティフィック ニューロモデュレイション コーポレイション | Systems and methods for selecting MRI-matched stimulus parameters |
| EP3519043B1 (en) | 2017-01-10 | 2020-08-12 | Boston Scientific Neuromodulation Corporation | Systems and methods for creating stimulation programs based on user-defined areas or volumes |
| US11059229B2 (en)* | 2017-01-27 | 2021-07-13 | Hewlett-Packard Development Company, L.P. | Rules for printing three-dimensional parts |
| US10872178B2 (en) | 2017-01-29 | 2020-12-22 | Hewlett-Packard Development Company, L.P. | Processing 3D objects |
| US10325413B2 (en)* | 2017-02-28 | 2019-06-18 | United Technologies Corporation | Generating smooth optimized parts |
| US10625082B2 (en) | 2017-03-15 | 2020-04-21 | Boston Scientific Neuromodulation Corporation | Visualization of deep brain stimulation efficacy |
| US11357986B2 (en) | 2017-04-03 | 2022-06-14 | Boston Scientific Neuromodulation Corporation | Systems and methods for estimating a volume of activation using a compressed database of threshold values |
| US10962958B2 (en)* | 2017-06-05 | 2021-03-30 | Raytheon Technologies Corporation | Library of predefined shapes for additive manufacturing processes |
| US10380175B2 (en)* | 2017-06-06 | 2019-08-13 | International Business Machines Corporation | Sketch-based image retrieval using feedback and hierarchies |
| JP6932835B2 (en) | 2017-07-14 | 2021-09-08 | ボストン サイエンティフィック ニューロモデュレイション コーポレイション | Systems and methods for estimating the clinical effects of electrical stimulation |
| EP3634569A1 (en) | 2017-08-15 | 2020-04-15 | Boston Scientific Neuromodulation Corporation | Systems and methods for controlling electrical stimulation using multiple stimulation fields |
| US10956510B2 (en)* | 2017-10-05 | 2021-03-23 | International Business Machines Corporation | Generate a knowledge graph using a search index |
| JP2019075062A (en)* | 2017-10-12 | 2019-05-16 | 株式会社エプコ | Design support apparatus and design support method |
| EP3483755B1 (en)* | 2017-11-09 | 2022-07-13 | Dassault Systèmes | Additive manufacturing of a 3d part |
| US11074486B2 (en) | 2017-11-27 | 2021-07-27 | International Business Machines Corporation | Query analysis using deep neural net classification |
| CN108021683B (en)* | 2017-12-11 | 2021-06-22 | 首都航天机械公司 | Three-dimensional labeling-based similar model retrieval implementation method |
| US11281824B2 (en) | 2017-12-13 | 2022-03-22 | Dassault Systemes Simulia Corp. | Authoring loading and boundary conditions for simulation scenarios |
| PL423917A1 (en) | 2017-12-15 | 2019-06-17 | General Electric Company | Indicator for qualification of a turbine vane condition |
| US10628703B2 (en) | 2017-12-19 | 2020-04-21 | International Business Machines Corporation | Identifying temporal changes of industrial objects by matching images |
| US10902053B2 (en)* | 2017-12-21 | 2021-01-26 | Adobe Inc. | Shape-based graphics search |
| EP3506160B1 (en) | 2017-12-28 | 2022-06-01 | Dassault Systèmes | Semantic segmentation of 2d floor plans with a pixel-wise classifier |
| US20190251744A1 (en)* | 2018-02-12 | 2019-08-15 | Express Search, Inc. | System and method for searching 3d models using 2d images |
| US12086520B2 (en)* | 2018-02-16 | 2024-09-10 | Coventor, Inc. | System and method for multi-material mesh generation from fill-fraction voxel data |
| US10794839B2 (en) | 2019-02-22 | 2020-10-06 | Kla Corporation | Visualization of three-dimensional semiconductor structures |
| CN110309332A (en)* | 2018-03-09 | 2019-10-08 | 中国空空导弹研究院 | A kind of CAD model partial retrieval method merging Engineering Semantics |
| CN108717424B (en)* | 2018-04-25 | 2021-06-11 | 鹰霆(天津)科技有限公司 | Three-dimensional model retrieval method based on decomposition type graph matching |
| US11298553B2 (en) | 2018-04-27 | 2022-04-12 | Boston Scientific Neuromodulation Corporation | Multi-mode electrical stimulation systems and methods of making and using |
| US12204085B2 (en)* | 2018-04-27 | 2025-01-21 | Hewlett-Packard Development Company, L.P. | Nonrotating nonuniform electric field object rotation |
| EP3784332B1 (en) | 2018-04-27 | 2023-04-26 | Boston Scientific Neuromodulation Corporation | Systems for visualizing and programming electrical stimulation |
| US11657297B2 (en)* | 2018-04-30 | 2023-05-23 | Bank Of America Corporation | Computer architecture for communications in a cloud-based correlithm object processing system |
| US10789288B1 (en)* | 2018-05-17 | 2020-09-29 | Shutterstock, Inc. | Relational model based natural language querying to identify object relationships in scene |
| US11537719B2 (en) | 2018-05-18 | 2022-12-27 | Deepmind Technologies Limited | Deep neural network system for similarity-based graph representations |
| US10520923B2 (en) | 2018-05-22 | 2019-12-31 | Mantle Inc. | Method and system for automated toolpath generation |
| CN109272013B (en)* | 2018-08-03 | 2021-09-14 | 天津大学 | Similarity measurement method based on learning |
| EP3614281A1 (en)* | 2018-08-20 | 2020-02-26 | Bricsys NV | Improved geometry-based detail propagation in cad models |
| CN110880006B (en)* | 2018-09-05 | 2024-05-14 | 广州视源电子科技股份有限公司 | User classification method, device, computer equipment and storage medium |
| US12093614B2 (en) | 2018-09-13 | 2024-09-17 | Nutech Ventures | Simulating heat flux in additive manufacturing |
| EP3623968A1 (en)* | 2018-09-17 | 2020-03-18 | Bricsys NV | Automated block generation in cad |
| EP3637319B1 (en)* | 2018-10-11 | 2022-05-25 | Honda Research Institute Europe GmbH | Method for generating shape descriptors for two- or three-dimensional geometric shapes |
| US10957117B2 (en)* | 2018-10-15 | 2021-03-23 | Adobe Inc. | Intuitive editing of three-dimensional models |
| CN109726442B (en)* | 2018-12-05 | 2022-03-15 | 电子科技大学 | Three-dimensional solid model reconstruction method based on ACIS platform |
| US11429756B2 (en)* | 2018-12-24 | 2022-08-30 | Dassault Systemes Solidworks Corporation | CAD models by creating best-fit approximate 3D B-rep geometry |
| EP3675063A1 (en)* | 2018-12-29 | 2020-07-01 | Dassault Systèmes | Forming a dataset for inference of solid cad features |
| EP3675062A1 (en) | 2018-12-29 | 2020-07-01 | Dassault Systèmes | Learning a neural network for inference of solid cad features |
| EP3675061A1 (en) | 2018-12-29 | 2020-07-01 | Dassault Systèmes | Forming a dataset for inference of editable feature trees |
| US12268456B2 (en) | 2019-01-23 | 2025-04-08 | Affera, Inc. | Systems and methods for therapy annotation |
| US11494377B2 (en)* | 2019-04-01 | 2022-11-08 | Nec Corporation | Multi-detector probabilistic reasoning for natural language queries |
| US11983832B2 (en)* | 2019-04-25 | 2024-05-14 | Hewlett-Packard Development Company, L.P. | Compensating for dimensional variation in 3D printing |
| WO2020250101A1 (en)* | 2019-06-13 | 2020-12-17 | Caja Elastic Dynamic Solutions Ltd | Methods and systems for path planning in a known environment |
| US11341727B2 (en) | 2019-06-18 | 2022-05-24 | The Calany Holding S. À R.L. | Location-based platform for multiple 3D engines for delivering location-based 3D content to a user |
| US11546721B2 (en) | 2019-06-18 | 2023-01-03 | The Calany Holding S.À.R.L. | Location-based application activation |
| CN112102498A (en)* | 2019-06-18 | 2020-12-18 | 明日基金知识产权控股有限公司 | System and method for virtually attaching applications to dynamic objects and enabling interaction with dynamic objects |
| US11516296B2 (en) | 2019-06-18 | 2022-11-29 | THE CALANY Holding S.ÀR.L | Location-based application stream activation |
| US11397742B2 (en)* | 2019-06-21 | 2022-07-26 | Microsoft Technology Licensing, Llc | Rescaling layer in neural network |
| US11204968B2 (en) | 2019-06-21 | 2021-12-21 | Microsoft Technology Licensing, Llc | Embedding layer in neural network for ranking candidates |
| US11386667B2 (en)* | 2019-08-06 | 2022-07-12 | Cisco Technology, Inc. | Video analysis using a deep fusion reasoning engine (DFRE) |
| CN110807797B (en)* | 2019-10-22 | 2022-03-22 | 中国测绘科学研究院 | Multi-source heterogeneous surface entity and point entity matching method considering global optimization and storage medium thereof |
| US11615542B2 (en)* | 2019-11-14 | 2023-03-28 | Panasonic Avionics Corporation | Automatic perspective correction for in-flight entertainment (IFE) monitors |
| CN111079208B (en)* | 2019-11-20 | 2024-01-23 | 杭州电子科技大学 | Particle swarm algorithm-based CAD model surface corresponding relation identification method |
| US11429662B2 (en)* | 2019-12-20 | 2022-08-30 | SWATCHBOOK, Inc. | Material search system for visual, structural, and semantic search using machine learning |
| WO2021145852A1 (en) | 2020-01-13 | 2021-07-22 | Hewlett-Packard Development Company, L.P. | Similarity-based additive manufacturing alterations |
| JP7262655B2 (en)* | 2020-02-13 | 2023-04-21 | 三菱電機株式会社 | DIMENSIONING DEVICE, DIMENSIONING METHOD AND PROGRAM |
| US12165003B2 (en) | 2020-03-26 | 2024-12-10 | D-Wave Systems Inc. | Systems and methods for implementing finite element modelling |
| US11182980B1 (en) | 2020-03-26 | 2021-11-23 | Apple Inc. | Procedural generation of computer objects |
| US11199940B1 (en)* | 2020-04-21 | 2021-12-14 | Corel Corporation | Three-dimensional operations based on planar projections in graphic user interfaces |
| JP7143368B2 (en)* | 2020-05-26 | 2022-09-28 | 株式会社ミスミ | Quotation System, Quotation Method, and Quotation Program |
| US12161422B2 (en) | 2020-05-29 | 2024-12-10 | Affera, Inc. | Medical device visualization |
| CN111709252B (en)* | 2020-06-17 | 2023-03-28 | 北京百度网讯科技有限公司 | Model improvement method and device based on pre-trained semantic model |
| US11308693B2 (en)* | 2020-06-26 | 2022-04-19 | Lucasfilm Entertainment Company Ltd. | Smart edge loop selection |
| US20220075833A1 (en)* | 2020-09-09 | 2022-03-10 | Royal Bank Of Canada | Web services for data aggregation and application for path traversal in knowledge graphs |
| CN112149691B (en)* | 2020-10-10 | 2021-10-15 | 北京鹰瞳科技发展股份有限公司 | Neural network search method and device for binocular vision matching |
| US12373616B2 (en) | 2020-10-12 | 2025-07-29 | Nutech Ventures | Thermal modeling of additive manufacturing using graph theory |
| US11947491B2 (en) | 2020-12-22 | 2024-04-02 | Paperless Parts, Inc. | Apparatus and methods for geometric searching |
| US12403315B2 (en) | 2021-04-27 | 2025-09-02 | Boston Scientific Neuromodulation Corporation | Systems and methods for automated programming of electrical stimulation |
| US12403313B2 (en) | 2021-06-15 | 2025-09-02 | Boston Scientific Neuromodulation Corporation | Methods and systems for estimating neural activation by stimulation using a stimulation system |
| WO2023095956A1 (en)* | 2021-11-26 | 2023-06-01 | 삼인이엔에스 주식회사 | Method, apparatus, and system for searching for and providing shape relationship information about 3d model |
| US20230177224A1 (en)* | 2021-12-07 | 2023-06-08 | Autodesk, Inc. | Computer aided generative design with feature thickness control to facilitate manufacturing and structural performance |
| JP7627235B2 (en)* | 2022-01-17 | 2025-02-05 | 株式会社日立製作所 | Manufacturing support system and manufacturing support method |
| CN115170842B (en)* | 2022-07-03 | 2025-07-15 | 西北工业大学 | A similar structure retrieval method for 3D CAD models based on local feature expression |
| US12205363B2 (en)* | 2022-08-04 | 2025-01-21 | Rockwell Automation Technologies, Inc. | Computer vision model drawing interface |
| US12174808B2 (en) | 2023-02-02 | 2024-12-24 | Bank Of America Corporation | Reducing a number of units in a data population based on predefined constraints |
| WO2025089981A1 (en)* | 2023-10-23 | 2025-05-01 | Huawei Cloud Computing Technologies Co., Ltd. | Method for finding similar parts |
| US12411891B2 (en) | 2023-11-22 | 2025-09-09 | Truist Bank | Systems and methods for data asset access governance |
| US12373468B2 (en)* | 2023-11-22 | 2025-07-29 | Truist Bank | Systems and methods for a data ecosystem |
| CN118112576B (en)* | 2024-04-29 | 2024-07-12 | 广州大学 | A method for locating and searching submarine equipment based on sonar positioning and intelligent algorithm |
| CN118967989B (en)* | 2024-07-05 | 2025-09-26 | 吉林动画学院 | Three-dimensional character model appearance transformation method, device, equipment, medium and product |
Citations (3)
| Publication number | Priority date | Publication date | Assignee | Title |
|---|---|---|---|---|
| JPH04246772A (en)* | 1991-02-01 | 1992-09-02 | Nippon Telegr & Teleph Corp <Ntt> | Image search method using sketches |
| WO2001046857A2 (en)* | 1999-12-22 | 2001-06-28 | National Research Council Of Canada | Method of searching 3-dimensional images |
| JP2001338294A (en)* | 2000-05-24 | 2001-12-07 | Monolith Co Ltd | Shape analyzer focusing on topology |
Family Cites Families (26)
| Publication number | Priority date | Publication date | Assignee | Title |
|---|---|---|---|---|
| US5760778A (en)* | 1995-08-15 | 1998-06-02 | Friedman; Glenn M. | Algorithm for representation of objects to enable robotic recongnition |
| IL126142A0 (en)* | 1996-03-15 | 1999-05-09 | Zapa Digital Art Ltd | Programmable computer graphic objects |
| US6133921A (en)* | 1996-05-24 | 2000-10-17 | University Of Washington | Constructing shape skeletons of 3D objects using generalized Voronoi diagrams |
| US6026409A (en)* | 1996-09-26 | 2000-02-15 | Blumenthal; Joshua O. | System and method for search and retrieval of digital information by making and scaled viewing |
| US6070176A (en)* | 1997-01-30 | 2000-05-30 | Intel Corporation | Method and apparatus for graphically representing portions of the world wide web |
| US6016487A (en)* | 1997-03-26 | 2000-01-18 | National Research Council Of Canada | Method of searching three-dimensional images |
| US6148095A (en)* | 1997-09-08 | 2000-11-14 | University Of Iowa Research Foundation | Apparatus and method for determining three-dimensional representations of tortuous vessels |
| US6381346B1 (en)* | 1997-12-01 | 2002-04-30 | Wheeling Jesuit University | Three-dimensional face identification system |
| JPH11232291A (en)* | 1998-02-16 | 1999-08-27 | Seibutsu Bunshi Kogaku Kenkyusho:Kk | Search method for protein 3D structure database |
| US20030069873A1 (en)* | 1998-11-18 | 2003-04-10 | Kevin L. Fox | Multiple engine information retrieval and visualization system |
| US6347313B1 (en)* | 1999-03-01 | 2002-02-12 | Hewlett-Packard Company | Information embedding based on user relevance feedback for object retrieval |
| GB2349493B (en) | 1999-04-29 | 2002-10-30 | Mitsubishi Electric Inf Tech | Method of representing an object using shape |
| KR100605050B1 (en)* | 1999-09-08 | 2006-07-26 | 주식회사 팬택앤큐리텔 | Human 3D posture search method and device |
| US6549201B1 (en)* | 1999-11-23 | 2003-04-15 | Center For Advanced Science And Technology Incubation, Ltd. | Method for constructing a 3D polygonal surface from a 2D silhouette by using computer, apparatus thereof and storage medium |
| US6807290B2 (en)* | 2000-03-09 | 2004-10-19 | Microsoft Corporation | Rapid computer modeling of faces for animation |
| US7274810B2 (en)* | 2000-04-11 | 2007-09-25 | Cornell Research Foundation, Inc. | System and method for three-dimensional image rendering and analysis |
| US6879322B2 (en)* | 2000-05-30 | 2005-04-12 | Fujitsu Limited | Three-dimensional object display system, three-dimensional object display method and recording medium recording a three-dimensional object display program |
| US7353188B2 (en)* | 2000-06-30 | 2008-04-01 | Lg Electronics | Product selling system and method for operating the same |
| US7039630B2 (en)* | 2000-07-27 | 2006-05-02 | Nec Corporation | Information search/presentation system |
| AU2001291175A1 (en)* | 2000-09-21 | 2002-04-02 | Md Online Inc. | Medical image processing systems |
| US7099860B1 (en) | 2000-10-30 | 2006-08-29 | Microsoft Corporation | Image retrieval systems and methods with semantic and feature based relevance feedback |
| KR100516289B1 (en)* | 2000-11-02 | 2005-09-21 | 주식회사 케이티 | Content based image reference apparatus and method for relevance feedback using fussy integral |
| EP1425718B1 (en)* | 2001-08-31 | 2011-01-12 | Dassault Systemes SolidWorks Corporation | Simultaneous use of 2d and 3d modeling data |
| US6816629B2 (en)* | 2001-09-07 | 2004-11-09 | Realty Mapping Llc | Method and system for 3-D content creation |
| US6825838B2 (en)* | 2002-10-11 | 2004-11-30 | Sonocine, Inc. | 3D modeling system |
| US8429174B2 (en) | 2003-01-25 | 2013-04-23 | Purdue Research Foundation | Methods, systems, and data structures for performing searches on three dimensional objects |
- 2004
- 2004-01-23USUS10/763,741patent/US8429174B2/enactiveActive
- 2004-01-23JPJP2006502981Apatent/JP4516957B2/ennot_activeExpired - Lifetime
- 2004-01-23EPEP04704957Apatent/EP1586020A2/ennot_activeWithdrawn
- 2004-01-23WOPCT/US2004/001962patent/WO2004068300A2/enactiveApplication Filing
- 2013
- 2013-04-22USUS13/867,503patent/US9348877B2/ennot_activeExpired - Lifetime
Patent Citations (4)
| Publication number | Priority date | Publication date | Assignee | Title |
|---|---|---|---|---|
| JPH04246772A (en)* | 1991-02-01 | 1992-09-02 | Nippon Telegr & Teleph Corp <Ntt> | Image search method using sketches |
| WO2001046857A2 (en)* | 1999-12-22 | 2001-06-28 | National Research Council Of Canada | Method of searching 3-dimensional images |
| JP2003518294A (en)* | 1999-12-22 | 2003-06-03 | ナショナル・リサーチ・カウンシル・オブ・カナダ | 3D image search method |
| JP2001338294A (en)* | 2000-05-24 | 2001-12-07 | Monolith Co Ltd | Shape analyzer focusing on topology |
Cited By (41)
| Publication number | Priority date | Publication date | Assignee | Title |
|---|---|---|---|---|
| JP2009528604A (en)* | 2006-02-28 | 2009-08-06 | シーオークリエイト ソフトウェア ゲーエムベーハー | Method for comparing a first computer-aided 3D model with a second computer-aided 3D model |
| US8422763B2 (en) | 2006-02-28 | 2013-04-16 | Parametric Technology Corporation | Method for comparing first computer-aided 3D model with a second computer-aided 3D model |
| JP2008077594A (en)* | 2006-09-25 | 2008-04-03 | Fujitsu Ltd | Design support apparatus, design support method, design support program, and design support system |
| JP2008197776A (en)* | 2007-02-09 | 2008-08-28 | Fujitsu Ltd | 3D model shape simplification device, 3D model shape simplification method, and 3D model shape simplification program |
| JP2011503757A (en)* | 2007-11-19 | 2011-01-27 | コースティック グラフィックス、インク. | Ray tracing rendering system and method |
| JP2013218727A (en)* | 2008-02-25 | 2013-10-24 | Atigeo Llc | Determining relevant information about domains of interest |
| JP2011514995A (en)* | 2008-02-25 | 2011-05-12 | アティジオ リミテッド ライアビリティ カンパニー | Determining relevant information about the area of interest |
| US8706664B2 (en) | 2008-02-25 | 2014-04-22 | Atigeo Llc | Determining relevant information for domains of interest |
| KR101358321B1 (en) | 2008-10-08 | 2014-02-04 | 이엑스비 에셋 매니지먼트 게엠베하 | Distance dependent selection of information entities |
| JP2011048791A (en)* | 2009-08-28 | 2011-03-10 | Fujitsu Ltd | Device, method and program for providing information |
| JP2011158932A (en)* | 2010-01-29 | 2011-08-18 | Hitachi Ltd | Work instruction generation system, method and program |
| JP2014517957A (en)* | 2011-04-29 | 2014-07-24 | マイクロソフト コーポレーション | Inferring spatial object descriptions from spatial gestures |
| US9613261B2 (en) | 2011-04-29 | 2017-04-04 | Microsoft Technology Licensing, Llc | Inferring spatial object descriptions from spatial gestures |
| JP2013120395A (en)* | 2011-12-06 | 2013-06-17 | Celsys:Kk | Attitude control method for skeleton model, and program |
| JP2013222464A (en)* | 2012-04-12 | 2013-10-28 | Rathod Nainesh | Visual clustering method |
| JP2015522191A (en)* | 2012-07-06 | 2015-08-03 | シーメンス プロダクト ライフサイクル マネージメント ソフトウェアー インコーポレイテッドSiemens Product Lifecycle Management Software Inc. | Integration of discovered geometric relationships with user-defined geometric relationships |
| JP2014021980A (en)* | 2012-07-13 | 2014-02-03 | Boeing Co | Method of optimizing toolpaths using medial axis transformation |
| EP2924599A1 (en) | 2014-03-28 | 2015-09-30 | Fujitsu Limited | Computing program, computing apparatus and computing method |
| US9898859B2 (en) | 2014-03-31 | 2018-02-20 | Fujitsu Limited | Apparatus and method for managing structure data |
| WO2017122467A1 (en)* | 2016-01-13 | 2017-07-20 | 株式会社日立製作所 | Model creation assistance system, model creation assistance method, and model creation assistance program |
| JP2017126156A (en)* | 2016-01-13 | 2017-07-20 | 株式会社日立製作所 | Model creation support system, model creation support method, and model creation support program |
| US11532117B2 (en) | 2017-10-16 | 2022-12-20 | Movidius Ltd. | Density coordinate hashing for volumetric data |
| JP2020537271A (en)* | 2017-10-16 | 2020-12-17 | モビディウス リミテッド | Density coordinate hashing of volume data |
| JP7250784B2 (en) | 2017-10-16 | 2023-04-03 | モビディウス リミテッド | Density coordinate hashing of volume data |
| JP7553533B2 (en) | 2018-03-05 | 2024-09-18 | ケーエルエー コーポレイション | COMPUTER READABLE STORAGE MEDIUM FOR VISUALIZING THREE-DIMENSIONAL SEMICONDUCTOR STRUCTURES - Patent application |
| JP2023025174A (en)* | 2018-03-05 | 2023-02-21 | ケーエルエー コーポレイション | Computer-readable storage medium for visualizing three-dimensional semiconductor structures |
| WO2020105752A1 (en)* | 2018-11-21 | 2020-05-28 | 주식회사 일 | Product customizing method via terminal |
| JP6833114B1 (en)* | 2019-11-28 | 2021-02-24 | 三菱電機株式会社 | Work image search device and work image search method |
| WO2021106154A1 (en)* | 2019-11-28 | 2021-06-03 | 三菱電機株式会社 | Workpiece image searching device, workpiece image searching method, and machine learning device |
| US11580156B2 (en) | 2019-11-28 | 2023-02-14 | Mitsubishi Electric Corporation | Workpiece image search apparatus and workpiece image search method |
| JP2021177381A (en)* | 2020-05-05 | 2021-11-11 | ダッソー システムズDassault Systemes | Improvement of similarity search of industrial component model |
| JP7740895B2 (en) | 2020-05-05 | 2025-09-17 | ダッソー システムズ | Improved Similarity Search for Industrial Component Models |
| JP2021196805A (en)* | 2020-06-12 | 2021-12-27 | 3D Nest株式会社 | Image display method, program, and data generation method |
| CN115702400B (en)* | 2020-06-30 | 2023-11-24 | 三菱电机株式会社 | Machining program search device and machining program search method |
| CN115702400A (en)* | 2020-06-30 | 2023-02-14 | 三菱电机株式会社 | Processing program retrieval device and processing program retrieval method |
| WO2022003828A1 (en)* | 2020-06-30 | 2022-01-06 | 三菱電機株式会社 | Processing program retrieval device and processing program retrieval method |
| JP6833150B1 (en)* | 2020-06-30 | 2021-02-24 | 三菱電機株式会社 | Machining program search device and machining program search method |
| JP7606076B2 (en) | 2020-11-06 | 2024-12-25 | 富士通株式会社 | Shape data output program, shape data output method, and information processing device |
| JP2022075139A (en)* | 2020-11-06 | 2022-05-18 | 富士通株式会社 | Shape data output program, shape data output method and information processing device |
| JP2023013863A (en)* | 2021-07-16 | 2023-01-26 | ヤフー株式会社 | Information processing device, information processing method, and information processing program |
| JP7353330B2 (en) | 2021-07-16 | 2023-09-29 | ヤフー株式会社 | Information processing device, information processing method, and information processing program |
Also Published As
| Publication number | Publication date |
|---|---|
| JP4516957B2 (en) | 2010-08-04 |
| WO2004068300A2 (en) | 2004-08-12 |
| US8429174B2 (en) | 2013-04-23 |
| US9348877B2 (en) | 2016-05-24 |
| US20040249809A1 (en) | 2004-12-09 |
| WO2004068300A3 (en) | 2005-09-22 |
| US20130311450A1 (en) | 2013-11-21 |
| EP1586020A2 (en) | 2005-10-19 |
Similar Documents
| Publication | Publication Date | Title |
|---|---|---|
| JP4516957B2 (en) | Method, system and data structure for searching for 3D objects | |
| US12043280B2 (en) | Systems and methods for graph-based AI training | |
| EP3179407B1 (en) | Recognition of a 3d modeled object from a 2d image | |
| US20230089148A1 (en) | Systems and methods for interactive image scene graph pattern search and analysis | |
| CN108710628B (en) | Visual analysis method and system for multi-modal data based on sketch interaction | |
| Bespalov et al. | Scale-space representation of 3d models and topological matching | |
| US20220189070A1 (en) | Machine-learning for 3d object detection | |
| Hallot | Model for Semantically Rich Point Cloud Data | |
| de Mauro et al. | Similarity learning for graph-based image representations | |
| Malott et al. | Fast computation of persistent homology with data reduction and data partitioning | |
| Fonseca et al. | Content-based retrieval of technical drawings | |
| Hu et al. | Curve skeleton extraction from 3D point clouds through hybrid feature point shifting and clustering | |
| US20100185672A1 (en) | Techniques for spatial representation of data and browsing based on similarity | |
| Mohan et al. | Room layout estimation in indoor environment: a review | |
| CN116452842A (en) | Clustering Algorithm and Device for Simplified Point Cloud Dataset Based on Attention Mechanism | |
| JP7017852B2 (en) | Positioning of 3D objects using descriptors | |
| JP4166678B2 (en) | Perceptually recognizable 3D shape description method and 3D graphic model database search method and apparatus using the same | |
| Joaquim et al. | Towards 3D modeling using sketches and retrieval | |
| Biasotti et al. | 3D object comparison based on shape descriptors | |
| Jiménez-Badillo et al. | Application of computer vision techniques for 3D matching and retrieval of archaeological objects | |
| Pizarro Riffo | Wall polygon retrieval from architectural floor plan images using vectorización and Deep Learning methods | |
| Jung et al. | A Transfer Function Design Using A Knowledge Database based on Deep Image and Primitive Intensity Profile Features Retrieval | |
| Ochmann | Automatic reconstruction of parametric, volumetric building models from 3D point clouds | |
| Gondra et al. | Learning spatial relations for object-specific segmentation using Bayesian network model | |
| Weindorf | Structure based interpretation of unstructured vector maps |
Legal Events
| Date | Code | Title | Description |
|---|---|---|---|
| A621 | Written request for application examination | Free format text:JAPANESE INTERMEDIATE CODE: A621 Effective date:20061206 | |
| A131 | Notification of reasons for refusal | Free format text:JAPANESE INTERMEDIATE CODE: A131 Effective date:20090831 | |
| A521 | Request for written amendment filed | Free format text:JAPANESE INTERMEDIATE CODE: A523 Effective date:20091127 | |
| A131 | Notification of reasons for refusal | Free format text:JAPANESE INTERMEDIATE CODE: A131 Effective date:20100118 | |
| A521 | Request for written amendment filed | Free format text:JAPANESE INTERMEDIATE CODE: A523 Effective date:20100330 | |
| TRDD | Decision of grant or rejection written | ||
| A01 | Written decision to grant a patent or to grant a registration (utility model) | Free format text:JAPANESE INTERMEDIATE CODE: A01 Effective date:20100427 | |
| A01 | Written decision to grant a patent or to grant a registration (utility model) | Free format text:JAPANESE INTERMEDIATE CODE: A01 | |
| A61 | First payment of annual fees (during grant procedure) | Free format text:JAPANESE INTERMEDIATE CODE: A61 Effective date:20100517 | |
| R150 | Certificate of patent or registration of utility model | Ref document number:4516957 Country of ref document:JP Free format text:JAPANESE INTERMEDIATE CODE: R150 Free format text:JAPANESE INTERMEDIATE CODE: R150 | |
| FPAY | Renewal fee payment (event date is renewal date of database) | Free format text:PAYMENT UNTIL: 20130521 Year of fee payment:3 | |
| R250 | Receipt of annual fees | Free format text:JAPANESE INTERMEDIATE CODE: R250 | |
| R250 | Receipt of annual fees | Free format text:JAPANESE INTERMEDIATE CODE: R250 | |
| R250 | Receipt of annual fees | Free format text:JAPANESE INTERMEDIATE CODE: R250 | |
| R250 | Receipt of annual fees | Free format text:JAPANESE INTERMEDIATE CODE: R250 | |
| R250 | Receipt of annual fees | Free format text:JAPANESE INTERMEDIATE CODE: R250 | |
| R250 | Receipt of annual fees | Free format text:JAPANESE INTERMEDIATE CODE: R250 | |
| R250 | Receipt of annual fees | Free format text:JAPANESE INTERMEDIATE CODE: R250 | |
| R250 | Receipt of annual fees | Free format text:JAPANESE INTERMEDIATE CODE: R250 | |
| R250 | Receipt of annual fees | Free format text:JAPANESE INTERMEDIATE CODE: R250 | |
| R250 | Receipt of annual fees | Free format text:JAPANESE INTERMEDIATE CODE: R250 | |
| R250 | Receipt of annual fees | Free format text:JAPANESE INTERMEDIATE CODE: R250 | |
| EXPY | Cancellation because of completion of term |