JP2005538437A - Prediction with likelihood set from emerging patterns - Google Patents
Prediction with likelihood set from emerging patternsDownload PDFInfo
- Publication number
- JP2005538437A JP2005538437AJP2004530722AJP2004530722AJP2005538437AJP 2005538437 AJP2005538437 AJP 2005538437AJP 2004530722 AJP2004530722 AJP 2004530722AJP 2004530722 AJP2004530722 AJP 2004530722AJP 2005538437 AJP2005538437 AJP 2005538437A
- Authority
- JP
- Japan
- Prior art keywords
- data
- class
- emerging
- list
- patterns
- Prior art date
- Legal status (The legal status is an assumption and is not a legal conclusion. Google has not performed a legal analysis and makes no representation as to the accuracy of the status listed.)
- Pending
Links
Images


Classifications
- G—PHYSICS
- G16—INFORMATION AND COMMUNICATION TECHNOLOGY [ICT] SPECIALLY ADAPTED FOR SPECIFIC APPLICATION FIELDS
- G16H—HEALTHCARE INFORMATICS, i.e. INFORMATION AND COMMUNICATION TECHNOLOGY [ICT] SPECIALLY ADAPTED FOR THE HANDLING OR PROCESSING OF MEDICAL OR HEALTHCARE DATA
- G16H50/00—ICT specially adapted for medical diagnosis, medical simulation or medical data mining; ICT specially adapted for detecting, monitoring or modelling epidemics or pandemics
- G16H50/20—ICT specially adapted for medical diagnosis, medical simulation or medical data mining; ICT specially adapted for detecting, monitoring or modelling epidemics or pandemics for computer-aided diagnosis, e.g. based on medical expert systems
- G—PHYSICS
- G06—COMPUTING OR CALCULATING; COUNTING
- G06F—ELECTRIC DIGITAL DATA PROCESSING
- G06F16/00—Information retrieval; Database structures therefor; File system structures therefor
- G06F16/20—Information retrieval; Database structures therefor; File system structures therefor of structured data, e.g. relational data
- G06F16/24—Querying
- G06F16/245—Query processing
- G06F16/2458—Special types of queries, e.g. statistical queries, fuzzy queries or distributed queries
- G06F16/2465—Query processing support for facilitating data mining operations in structured databases
- G—PHYSICS
- G06—COMPUTING OR CALCULATING; COUNTING
- G06F—ELECTRIC DIGITAL DATA PROCESSING
- G06F16/00—Information retrieval; Database structures therefor; File system structures therefor
- G06F16/20—Information retrieval; Database structures therefor; File system structures therefor of structured data, e.g. relational data
- G06F16/28—Databases characterised by their database models, e.g. relational or object models
- G06F16/284—Relational databases
- G06F16/285—Clustering or classification
- G—PHYSICS
- G06—COMPUTING OR CALCULATING; COUNTING
- G06F—ELECTRIC DIGITAL DATA PROCESSING
- G06F18/00—Pattern recognition
- G06F18/20—Analysing
- G06F18/21—Design or setup of recognition systems or techniques; Extraction of features in feature space; Blind source separation
- G—PHYSICS
- G06—COMPUTING OR CALCULATING; COUNTING
- G06N—COMPUTING ARRANGEMENTS BASED ON SPECIFIC COMPUTATIONAL MODELS
- G06N20/00—Machine learning
- G—PHYSICS
- G16—INFORMATION AND COMMUNICATION TECHNOLOGY [ICT] SPECIALLY ADAPTED FOR SPECIFIC APPLICATION FIELDS
- G16B—BIOINFORMATICS, i.e. INFORMATION AND COMMUNICATION TECHNOLOGY [ICT] SPECIALLY ADAPTED FOR GENETIC OR PROTEIN-RELATED DATA PROCESSING IN COMPUTATIONAL MOLECULAR BIOLOGY
- G16B40/00—ICT specially adapted for biostatistics; ICT specially adapted for bioinformatics-related machine learning or data mining, e.g. knowledge discovery or pattern finding
- G16B40/20—Supervised data analysis
- G—PHYSICS
- G16—INFORMATION AND COMMUNICATION TECHNOLOGY [ICT] SPECIALLY ADAPTED FOR SPECIFIC APPLICATION FIELDS
- G16B—BIOINFORMATICS, i.e. INFORMATION AND COMMUNICATION TECHNOLOGY [ICT] SPECIALLY ADAPTED FOR GENETIC OR PROTEIN-RELATED DATA PROCESSING IN COMPUTATIONAL MOLECULAR BIOLOGY
- G16B25/00—ICT specially adapted for hybridisation; ICT specially adapted for gene or protein expression
- Y—GENERAL TAGGING OF NEW TECHNOLOGICAL DEVELOPMENTS; GENERAL TAGGING OF CROSS-SECTIONAL TECHNOLOGIES SPANNING OVER SEVERAL SECTIONS OF THE IPC; TECHNICAL SUBJECTS COVERED BY FORMER USPC CROSS-REFERENCE ART COLLECTIONS [XRACs] AND DIGESTS
- Y02—TECHNOLOGIES OR APPLICATIONS FOR MITIGATION OR ADAPTATION AGAINST CLIMATE CHANGE
- Y02A—TECHNOLOGIES FOR ADAPTATION TO CLIMATE CHANGE
- Y02A90/00—Technologies having an indirect contribution to adaptation to climate change
- Y02A90/10—Information and communication technologies [ICT] supporting adaptation to climate change, e.g. for weather forecasting or climate simulation
Landscapes
- Engineering & Computer Science (AREA)
- Theoretical Computer Science (AREA)
- Data Mining & Analysis (AREA)
- Physics & Mathematics (AREA)
- Databases & Information Systems (AREA)
- Health & Medical Sciences (AREA)
- Medical Informatics (AREA)
- Life Sciences & Earth Sciences (AREA)
- Software Systems (AREA)
- Public Health (AREA)
- General Physics & Mathematics (AREA)
- General Engineering & Computer Science (AREA)
- Artificial Intelligence (AREA)
- Computer Vision & Pattern Recognition (AREA)
- Evolutionary Computation (AREA)
- Evolutionary Biology (AREA)
- Epidemiology (AREA)
- Bioinformatics & Computational Biology (AREA)
- General Health & Medical Sciences (AREA)
- Bioinformatics & Cheminformatics (AREA)
- Biomedical Technology (AREA)
- Biophysics (AREA)
- Mathematical Physics (AREA)
- Spectroscopy & Molecular Physics (AREA)
- Biotechnology (AREA)
- Bioethics (AREA)
- Computing Systems (AREA)
- Pathology (AREA)
- Primary Health Care (AREA)
- Fuzzy Systems (AREA)
- Probability & Statistics with Applications (AREA)
- Computational Linguistics (AREA)
- Management, Administration, Business Operations System, And Electronic Commerce (AREA)
- Information Retrieval, Db Structures And Fs Structures Therefor (AREA)
- Measuring Or Testing Involving Enzymes Or Micro-Organisms (AREA)
Abstract
Translated fromJapaneseDescription
Translated fromJapanese本発明は、一般的に、データマイニング方法(データ発掘法)に関し、更に、特にそれらの分類におけるデータ知識に基づいた2個あるいはそれ以上の可能な分類の1つに試験サンプルを正しく分類する規則(ルール)を基準とした方法に関連する。 特に本発明はエマージングパターン手法を使っている。 The present invention relates generally to data mining methods (data mining methods), and more particularly to rules for correctly classifying test samples into one of two or more possible classifications based on data knowledge in those classifications. It is related to the method based on (rule). In particular, the present invention uses an emerging pattern technique.
デジタルの時代の到来はダムの崩壊に近かった:情報の本流が解き放されて、私たちは今データの上げ潮に洗い流されている。情報、結果、計測及び計算データは、一般的に、磁気記録、あるいは光学的媒体上に、現在大量にあり、そしてすぐに利用可能である。計算能力は引き続き増大しているので、膨大なデータを効率的に分析出来るという約束は、しばしば果たされるが、更なる大きな量を分析できるという期待は、更に複雑な分析的方法を開発するための原動力を提供している。従って、常にデータに意味を与える必要があり、それによって、それを有用な知識に変えることが、統計分析、パターン認識、データマイニング方法においての、相当の研究努力になっている。 The arrival of the digital age was close to the collapse of the dam: the mainstream of information has been unleashed and we are now washed away by the rising tide of data. Information, results, measurement and calculation data are generally present in large quantities and are readily available on magnetic recording or optical media. As computing power continues to grow, the promise of being able to analyze massive amounts of data efficiently is often fulfilled, but the expectation of being able to analyze larger quantities is the key to developing more complex analytical methods. Provides the driving force. Therefore, it is always necessary to give meaning to the data, and turning it into useful knowledge is a considerable research effort in statistical analysis, pattern recognition and data mining methods.
データは数、値、あるいは構成されている述部以上のものです。データは ただ奇妙で複雑で、しかも、人間の脳によってすぐには理解できないリッチハーバや多彩な風景である、多次元空間に住んでいる。最も複雑なデータは、多くの明らかな独立変数に依存する測定や計算から生じる。何百もの変数を持つデータセットが、今日、以下を含む多くの階梯で生じます; ゲノムとそれが暗号化する様々なタンパク質間のリンクを明らかにするための遺伝子表現データ、潜在的な社会学的、経済学的傾向性を獲得することのための人口統計と消費者のプロファイリングデータ、そして、汚染、気象の変化及び影響問題の源のような現象を理解するための環境測定。 Data is more than numbers, values, or constructed predicates. The data is just strange and complex, and it lives in a multidimensional space, rich herba and a variety of landscapes that cannot be readily understood by the human brain. The most complex data comes from measurements and calculations that depend on many obvious independent variables. Data sets with hundreds of variables occur today in many levels, including: gene expression data to reveal links between the genome and the various proteins it encodes, potential sociology Demographics and consumer profiling data to capture global and economic trends, and environmental measurements to understand phenomena such as pollution, weather changes and the source of impact problems.
回帰、クラスタリング(群化)、要約、従属化モデリングおよび変化と偏差の検出のようなデータに関して達成されるであろう基本的運用の間では、分類が極めて重要である。特別な変数間に明らかな相関がないところでは、潜在的なパターンと規則(ルール)を推論する必要がある。データマイニング分類は、パターンあるいは規則のような、正確で効率的な分類器を構築することに狙いを定める。過去、これは可能であった、それは、大きなデータセットに対して骨の折れる学習でした、それゆえ、何年にもわたって、それが機械学習(マシーン・ラーニング)の分野をもたらした。 Classification is extremely important among the basic operations that will be achieved with data such as regression, clustering, summarization, dependent modeling and change and deviation detection. Where there is no obvious correlation between special variables, it is necessary to infer potential patterns and rules. Data mining classification is aimed at building accurate and efficient classifiers, such as patterns or rules. In the past, this was possible, it was painstaking learning for large data sets, and for many years it has led to the field of machine learning.
従って、簡単な調査による、パターン、関係及び潜在的法則の抽出は、自動化分析ツールの使用によって長い間取ってかわられている。それにもかかわらず、理想的にパターンを推論することは、複雑さの征服のみならず、また極めて重要なそれらのパラメーターと、新しい有利な実験への道に向かうポイントを示す推論原理を提示する。これが有用なデータマイニングの本質です;パターンは、データに構成を課するのみならず、また、新しいデータが常に獲得されるところの価値あるものに出来る予測の役割を提供する。この意味において、広く評価されたパラダイムは、よく訓練セット(トレーニング・セット)と呼ばれる何らかの初期データセットを用いて、パターンが、学習プロセスからもたらす1つである。しかし、今日用いられる多くの技術は、法則やパターンの構築をせずに新しいデータの特徴を予測するか、あるいは、予測されるが、特にわかりにくい分類規則を構築する。更に、これら方法の多くは、大きいデータに対しては非常に効率が悪い。 Thus, the extraction of patterns, relationships and potential laws through simple research has long been replaced by the use of automated analysis tools. Nevertheless, inferring patterns ideally presents not only the conquest of complexity, but also the inference principles that point to those parameters that are crucial and the point towards the path to new and advantageous experiments. This is the essence of useful data mining; patterns not only impose composition on the data, but also provide a predictive role that can be valuable where new data is always acquired. In this sense, the widely evaluated paradigm is one that patterns result from the learning process, using some initial data set, often referred to as a training set. However, many techniques used today predict new data features without constructing rules or patterns, or construct classification rules that are predicted but are particularly difficult to understand. Furthermore, many of these methods are very inefficient for large data.
近年、パターンの4つの望ましい属性が明確になった(参照:ドン& リー:「エマージングパターンの効率的マイニング:傾向と差異の発見」、ACM SIGKDD、International Conference on Knowledge Discovery and Data Mining, San Diego, 43-52 (1999年8月)、尚、これらは、この中に完全に参照されている)。(a) それらは、有効である、すなわち、それらは、また、高い確定で新しいデータに観測される。(b)それらは、機械(マシーン)によって得られたパターンが専門家にとって明白ではなく、新しい洞察を提供するという意味で、斬新である。(c)それらは、有用である、すなわち、それらは、信頼性の高い予測を可能にする。そして(d)それらは、わかりやすい、すなわち、それらの表現は、それらの解釈への障害を引き起さない。 In recent years, four desirable attributes of patterns have become clear (see: Don & Lee: “Efficient mining of emerging patterns: finding trends and differences”, ACM SIGKDD, International Conference on Knowledge Discovery and Data Mining, San Diego, 43-52 (August 1999), which are fully referenced in this). (A) They are valid, ie they are also observed in new data with high definition. (B) They are novel in the sense that the patterns obtained by machines (machines) are not obvious to the expert and provide new insights. (C) They are useful, i.e. they enable reliable prediction. And (d) they are straightforward, ie their representation does not cause an obstacle to their interpretation.
機械学習の分野において、最も広く使われた予測方法は、次のようなものである:K-ニアレストネイバー法(参照:例えば、カバー&ハート、「Nearest neighborsパターン分類」、IEEE Transactions on Information Theory、13: 21-27、(1967))、ニューラルネットワーク法(参照:例えば、ビショップ、「パターン認識のためのニューラルネットワーク」、オックスフォード大学出版(1995))、サポート・ベクター・マシーン法(参照:バジャー、「パターン認識のためのサポート・ベクター・マシーンの上の学習」、Data Mining and Knowledge Discovery、2:121-167、(1998))、ナイーブベイズ法(参照:例えば、ラングリー 他、「ベイズ系分類器の解析」、Proceedings of the Tenth National Conference on Artificial Intelligence、223-228、(AAAI出版、1992):原本:ヂューダ&ハート、「パターン分類及び場面分析」、(John Wiley & Sons, NY, 1973))、そして C4. 5法 (参照:クインラン、C4. 5:「機械学習のためのプログラム」、(Morgan Kaufmann、San Mateo、CA、1993))。それらの人気にもかかわらず、これらの方法の各々が、上記で述べた4つの望ましい属性を有するパターンを作成しないことを意味する何らかの欠点で苦しんでいる。 The most widely used prediction methods in the field of machine learning are: K-Nearest Neighbors (see, eg, Cover & Heart, “Nearest neighbors pattern classification”, IEEE Transactions on Information Theory 13: 21-27, (1967)), neural network methods (see: Bishop, "Neural networks for pattern recognition", Oxford University Press (1995)), support vector machine method (see: Badger) , "Learning on Support Vector Machines for Pattern Recognition", Data Mining and Knowledge Discovery, 2: 121-167, (1998)), Naive Bayes method (see, for example, Langley et al., "Bayesian classification" Analyzing instruments ", Proceedings of the Tenth National Conference on Artificial Intelligence, 223-228 (AAAI Publishing, 1992): Original: Judah & Hart," Pattern Classification and Scenes " Analysis, (John Wiley & Sons, NY, 1973)), and the C4.5 method (see: Quinlan, C4.5: "Program for machine learning", (Morgan Kaufmann, San Mateo, CA, 1993)) . Despite their popularity, each of these methods suffers from some drawbacks meaning that it does not create patterns with the four desirable attributes mentioned above.
k-ニアレストネイバー法(K-nearest neighbors method)(以下、K-NN法と呼ぶ)は、実例の例あるいは、ラジー学習法(Lazy-learning method)である。ラジー学習法において、データの新しい実例は、決して明快なパターンを得ることなく、訓練セットの項目との直接比較によって分類される。K-NN法は、試験サンプルを、いくらかのメートルの距離の間で近隣度が測られる所の訓練サンプルの中のそのkニアレストネイバー(kの最も近い隣人)の分類に割り当てる。 The k-nearest neighbors method (hereinafter referred to as the K-NN method) is an example or a lazy-learning method. In the razy learning method, new instances of data are classified by direct comparison with items in the training set, never getting a clear pattern. The K-NN method assigns a test sample to the classification of its k nearest neighbors (k's closest neighbors) in the training sample where the proximity is measured between some meter distance.
ニューラルネット(参照:例えば、ミンスキー&パペート、"知覚:計算幾何学の導入、"MIT出版、Cambridge、MA、(1969))は、また新しいデータの分類を予測するツールの例であるが、人が理解できる規則を作成しない。ニューラルネット(神経網)は、ブラック・ボックス法の使用を好む人々に人気がある。 Neural nets (see: Minsky & Papato, for example, “Perception: Introduction of Computational Geometry”, MIT Publishing, Cambridge, MA, (1969)) are also examples of tools that predict new data classifications. Do not create rules that can understand. Neural networks are popular with people who prefer to use the black box method.
ナイーブベイズ(Naive Bayes)「以下NBと呼ぶ」は、データセットの各々のクラスのデータに対して、確率的要約を計算するためにベイズ系規則を用いる。試験サンプルが与えられた時、NBは、それらの確率的要約に基づくクラスを並べるための評価関数を用い、そして、サンプルを最高スコアのクラスに割り当てる。しかしながら、NBは、与えられた実例の試験データに対して確率をもたらすだけであり、そして一般に、認識可能な規則あるいはパターンには導かない。更に、NBにおいて利用される重要な仮定は、機能が統計的に独立であることです、ところが、多くのタイプのデータに対しては、これはケースではない。 例えば、遺伝子表現プロファイルに含まれる多くの遺伝子は、独立していないように現れるが、しかし、それらのいくつかは密接に関連する。 (参照:例えば、シェーナ他、「相補的DNAマイクロアレイを持つ遺伝子表現パターンの量的監視」、サイエンス、270、467-470、(1995)、ロックハート他、「高密度オリゴヌクレオチドアレイへのハイブリダイゼーションによる表現監視」、ネイチャー、バイオテック、14:1675-1680、(1996)、ベルカレシュウ他、「遺伝子表現の直列分析」、サイエンス、270: 484-487、(1995)、チュウ他、「発芽イースト菌の胞子の転写プログラム」、サイエンス、282:699-705、(1998)、デリシ他、「ゲノムスケール上での遺伝子表現の遺伝子コントロールと新陳代謝の探求」、サイエンス、278:680-686、(1997)、ロバート他、「広範囲の遺伝子表現プロファイルの行列によって明かされた多重MAPK経路の信号と回路」、サイエンス、287: 873-880、(2000)、アロン他、「オリゴヌクレオチドアレイ・プローブによる、腫瘍と正常な結腸組織のクラスタリング分析よって明らかにされた遺伝子表現の広範囲パターン」、Proc. NATL. ACAD. SCI. U.S.A.、96: 6745-6750、(1999)、ゴルブ他、「癌の分子の分類:遺伝子表現の監視によるクラス発見とクラス予測」、サイエンス、286:531-537、(1999)、ぺロウ他、「人間の乳房の上皮細胞と乳癌の独特な遺伝子表現パターン」、Proc. NATL. ACAD. SCI. U.S.A, 96: 9212-9217、(1999)、ワング他、「cdnaマイクロアレイを用いる卵巣癌腫における遺伝子表現変化プロファイル変化の監視」 GENE、 229:101-108,、(1999))。 Naive Bayes “hereinafter NB” uses Bayesian rules to compute probabilistic summaries for each class of data in the data set. Given a test sample, the NB uses an evaluation function to order classes based on their probabilistic summary and assigns the sample to the class with the highest score. However, NB only provides probabilities for given example test data and generally does not lead to recognizable rules or patterns. Furthermore, an important assumption used in NB is that the functions are statistically independent, but for many types of data this is not the case. For example, many genes included in gene expression profiles appear to be independent, but some of them are closely related. (See, eg, Schona et al., “Quantitative monitoring of gene expression patterns with complementary DNA microarrays”, Science, 270, 467-470, (1995), Lockhart et al., “Hybridization to high-density oligonucleotide arrays. "Expression monitoring by", Nature, Biotech, 14: 1675-1680, (1996), Belkareshu et al., "Serial expression of gene expression", Science, 270: 484-487, (1995), Chu et al., "Sprouting yeast "Spore Transcription Program", Science, 282: 699-705, (1998), Delici et al., "Gene Control of Gene Expression and Metabolism on the Genome Scale," Science, 278: 680-686, (1997), Robert et al., “Multiple MAPK pathway signals and circuits revealed by a matrix of a wide range of gene expression profiles,” Science, 287: 873-880, (2000), Aron et al., “Oligonnucleotides. Wide range of gene expression revealed by clustering analysis of tumors and normal colon tissue with a dearray probe, "Proc. NATL. ACAD. SCI. USA, 96: 6745-6750, (1999), Golb et al.," Molecular Classification of Cancer: Class Discovery and Class Prediction by Monitoring Gene Expression ", Science, 286: 531-537, (1999), Peru et al.," Unique gene expression pattern of human breast epithelial cells and breast cancer " Proc. NATL. ACAD. SCI. USA, 96: 9212-9217, (1999), Wang et al., “Monitoring gene expression change profile changes in ovarian carcinoma using cdna microarrays” GENE, 229: 101-108, ( 1999)).
サポート・ベクター・マシーン(Support Vector Machines)(以下SVMと呼ぶ)は、線形方法によって効率的にモデル化されないデータに対処する。SVMは、サンプルとそれらクラス属性間の複雑なマッピングを構築するためにカーネル関数を用いる。それらが多次元空間のデータのクラスを分けるために最適な超面(hyper-plane)を定義する実例にハイライトをあてるので、結果としてのパターンは有益なものです。SVMは、複素データに対処することができる、しかし、ブラック・ボックス(フリー他、「サポート・ベクトル・マシーン分類とマイクロアレイ表現データを用いた癌組織サンプルの確認」、Bioinformatics、16: 906-914、(2000))と同様に振舞い、計算的に高価になる。加えるに、必ずしも出てくるわけではないが、適切な非線形のカーネル関数を選ぶためにデータの変数の何らかの理解があることが望ましい。 Support Vector Machines (hereinafter referred to as SVM) deal with data that is not efficiently modeled by linear methods. SVM uses kernel functions to build complex mappings between samples and their class attributes. The resulting patterns are useful because they highlight examples that define optimal hyper-planes to divide classes of data in multidimensional space. SVM can deal with complex data, however, black box (Free et al., “Verification of cancer tissue samples using support vector machine classification and microarray representation data”, Bioinformatics, 16: 906-914, (2000)) and be computationally expensive. In addition, although not necessarily coming out, it is desirable to have some understanding of the data variables in order to choose an appropriate non-linear kernel function.
従って、データマイニングの視点から、外見上異種の情報をはっきりと理路整然とした規則に濃縮する技術がより好ましい。規則を基礎とするデータの構造パターンを明らかにする2つの原理手段は、デシジョンツリー(意思決定樹)と規則誘導(rule- induction)です。デシジョンツリーは、データセットを仕切る役に立って、有用で直観的な枠組みを提供する、しかし、選ばれた出発点に非常になりやすい。だから、数種類の規則が訓練セットにおいて明らかであると仮定すれば、直ちに、デシジョンツリーの構造を通して明らかになる規則は、決定的に、どの分類器がツリーの種を撒くのに使われるかに依存するだろう。だから、それはしばしば重要な規則であり、それゆえ、データに対する重要な分析的フレームワークは、デシジョンツリーに到達することで見渡せる。更に、ツリーからセットの規則への翻訳は、通常まっすぐに向かうが、それら規則は、通常最も明確かあるいは最も簡単なものではない。 対照的に、それらは、可能な限り多くの規則を明らかにすべく捜し求め、1個またはそれ以上の規則によりデータセットの全ての実例を分類するので、規則誘導法は優れている。数多くの規則誘導法とデシジョンツリー法の結合が工夫されているにもかかわらず、ツリー法の使用のたやすさと規則誘導方法の徹底のそれぞれに投資が試みられている。 Therefore, from the viewpoint of data mining, a technique for concentrating apparently dissimilar information into rules that are clearly organized is more preferable. Two principle means of revealing the structure pattern of rule-based data are decision trees and rule-induction. Decision trees help partition data sets and provide a useful and intuitive framework, but are very likely to be the starting point of choice. So, assuming that several types of rules are obvious in the training set, the rules that are immediately revealed through the structure of the decision tree depend decisively on which classifier is used to seed the tree. will do. So it is often an important rule, and therefore an important analytical framework for data can be seen by reaching the decision tree. In addition, the translation from tree to set rules is usually straight, but the rules are usually not the clearest or simplest. In contrast, rule derivation is superior because they seek to reveal as many rules as possible and classify all instances of the data set by one or more rules. Despite the devised combination of numerous rule derivation methods and decision tree methods, investments have been made in each of the ease of use of the tree method and the thorough rule derivation method.
C4. 5法は、今日用いられる最も成功したデシジョンツリー法の1つです。それは、デシジョンツリーを、連続変化データを含むデータセットへのアプローチに適応させる。デシジョンツリーのリーフノード(葉の節)に対してまっすぐな規則は、簡単に、ルートノード(根の節)からリーフへのツリーを通じての経路を横切って直面した全ての状態の連携であるのに対して、C4. 5法は、中間ポイントのツリーを刈り込むことによってこれらの規則の簡略化を試み、そして可能な刈り込みに対して誤差見積りを導入する。C4. 5法は、理解容易な規則を作成するが、決定境界が直線でない場合、ツリーの異なるポイントで特別変数を異なって区分けする必要の有る現象の場合は、良い性能を有しないであろう。 The C4.5 method is one of the most successful decision tree methods used today. It adapts the decision tree to an approach to data sets that contain continuously changing data. The straight rule for a leaf node in a decision tree is simply the linkage of all states encountered across the path through the tree from the root node to the leaf. In contrast, the C4.5 method attempts to simplify these rules by pruning the midpoint tree and introduces error estimates for possible pruning. The C4.5 method creates easy-to-understand rules, but will not perform well if the decision boundary is not a straight line, or a phenomenon that requires a special variable to be partitioned differently at different points in the tree. .
近年、上に述べた4つの好ましい特質を有するクラス予測法(class prediction method)が提案されている。それは、エマージングパターンのアイデアを基礎としている(参照:ドン&リー:ACM SIGKDD、International Conference on Knowledge Discovery and Data Mining, San Diego, 43-52(1999年8月))。エマージングパターン(以下EPと呼ぶ)は、データのクラスを比較するのに有用である、それは、第1クラスのデータ内の主に有る特徴、しかし、第2クラスの相補データ、つまり、第1クラスと重ならないデータ、内の主に無い特徴を指し示す。大きなデータセットからEP’s(EPのもの)を得るアルゴリズムが開発され、遺伝子表現データの分類に応用されている、(参照:リー&ワン、「エマージングパターン及び遺伝子表現データ」、Genome Informatics、12: 3-13、(2001)、 リー&ワン、「エマージングパターン概念を用いた遺伝子表現プロファイルからの良い診断遺伝子グループの確認」、Bioinformatics、18:725-734、(2002)、及びヤオ他、「分類、サブタイプ発見及び遺伝子表現プロファイルによる小児劇症リンパ腺白血病の結果の予測」、Cancer Cell、1:133-143、(2002)、尚、これらは、全てこの中に完全に参照されている)。 In recent years, class prediction methods have been proposed that have the four preferred characteristics described above. It is based on the idea of an emerging pattern (see: Don & Lee: ACM SIGKDD, International Conference on Knowledge Discovery and Data Mining, San Diego, 43-52 (August 1999)). Emerging patterns (hereinafter referred to as EPs) are useful for comparing classes of data, which are mainly features in the first class of data, but the second class of complementary data, ie the first class Points to data that does not overlap with the main feature. Algorithms for obtaining EP's (EP's) from large data sets have been developed and applied to the classification of gene expression data (see: Lee & One, “Emerging Patterns and Gene Expression Data”, Genome Informatics, 12 : 3-13, (2001), Lee & One, “Confirming good diagnostic gene groups from gene expression profiles using the emerging pattern concept”, Bioinformatics, 18: 725-734, (2002), Yao et al., “ Predicting Childhood Fulminant Lymphoblastic Leukemia Results by Classification, Subtype Discovery, and Gene Expression Profiles ", Cancer Cell, 1: 133-143, (2002), all of which are fully referenced herein ).
一般的に、与えられたデータセットから何千ものEP’sを発生させることが可能である、そのようなケースでは、新しい実例データの分類に対してのEP’sの使用は、扱いにくいかもしれない。この問題に対処する今までの試みを以下に示す:エマージングパターン集合による分類(Classification by Aggregating Emerging Patterns)「以下CAEPと呼ぶ」、(ドン他、「エマージングパターン集合による分類」、DS-99にて: Proceedings of Second International Conference on Discovery Science, 東京、日本、(1999年12月6日から8日)、また、Setsuo Arikawa & Koichi Furukawa、人工知能(Artificial Intelligence)での講演ノート: (Eds.)、1721: 30-42, (1999年春))、及び「ジャンピング EP's」の使用 (リー他、「分類に対して、最も表現的なジャンピング・エマージングパターンの使用」、Knowledge and Information Systems、3:131-145、(2001)、及びリー他、「ジャンピング・エマージングパターンの空間及びその漸増的な保守アルゴリズム」、Proceedings of 17th International Conference on Machine Learning、552-558、(2000))、 全ては、完全にここで参照されている。CAEPにおいて、与えられたEPは、与えられたデータセットの小さな数の実例を分類することが出来るのみであると認識され、試験データのサンプルは、そのエマージングパターンの集合スコアを構築することで分類される。ジャンピングEP(以下J- EPと呼ぶ)は、特別なEPであり、そのサポートが1個のクラスのデータでゼロであり、しかし、そのサポートが相補クラスのデータでゼロでないものである。だから、J-EPは、それらが、パターンを提示し、そのものの変化が最も大きいので、分類に有用である、しかし、分析が、まだ厄介であることを意味する、そこにまだ非常に大きい数のそれらがあるかもしれない。 In general, it is possible to generate thousands of EP's from a given data set. In such cases, the use of EP's for classification of new instance data may be cumbersome. Previous attempts to deal with this problem are as follows: Classification by Aggregating Emerging Patterns (hereinafter referred to as CAEP), (Don et al., “Classification by Emerging Pattern Set”, DS-99) : Proceedings of Second International Conference on Discovery Science, Tokyo, Japan, (December 6th to 8th, 1999), and also Setsuo Arikawa & Koichi Furukawa, Artificial Intelligence (Artificial Intelligence) lecture notes: (Eds.), 1721: 30-42, (Spring 1999)), and the use of “jumping EP's” (Lee et al., “Use of the most expressive jumping emerging pattern for classification”, Knowledge and Information Systems, 3: 131- 145, (2001), and Lee et al., “Jumping and Emerging Pattern Space and Its Incremental Maintenance Algorithm”, Proceedings of 17th International Conference on Machine Learning, 552 -558, (2000)), all of which are hereby fully referenced. In CAEP, it is recognized that a given EP can only classify a small number of instances of a given data set, and a sample of test data is classified by constructing a set score for its emerging pattern. Is done. A jumping EP (hereinafter referred to as J-EP) is a special EP whose support is zero for one class of data, but whose support is non-zero for complementary class data. So J-EP is useful for classification because they present patterns and the change in itself is the largest, but the analysis is still cumbersome, there are still very large numbers There may be them.
全ての上述の考察により、あるいは新しいデータを分類する時の非常に大きい数のEP’sにより、CAEP とJ-EP’sの両方の利用は、労働集約的である。非常に大きなデータセットに取り組むときの効率は、今日の応用において最高である。従って、方法は、それが有効で、新しく、有用で、かつ、わりやすい規則を導き、しかし、安価であることが望まれ、そして、分類に本当に有用である少ない数の規則の確認に対して、効率的アプローチの利用による、方法が望まれる。 The use of both CAEP and J-EP's is labor intensive, with all the above considerations, or with a very large number of EP's when classifying new data. Efficiency when working with very large data sets is highest in today's applications. Thus, the method leads to rules that are effective, new, useful, and easy to understand, but that are desired to be inexpensive, and for confirmation of a small number of rules that are really useful for classification. A method is desired that utilizes an efficient approach.
本発明は、複数のクラスのひとつに、試験データTを有する試験サンプルが分類されるかどうかを決定するための方法、コンピュータプログラム製品及びシステムを提案するものである。 The present invention proposes a method, a computer program product and a system for determining whether a test sample having test data T is classified into one of a plurality of classes.
好ましくは、クラスのn数は2あるいはそれ以上であり、方法は、少なくとも、各々のn個のクラスのデータの1個の実例を有する訓練データセットDから、複数のエマージングパターンを抽出すること、と、n個のリストを作成すること、そこでは、n個のリストのi番目のリストが、i番目のクラスのデータのゼロでない頻度を有する複数のエマージングパターンから各々のエマージングパターンEPi(m)の発生頻度fi(m)を含む、と、kは、複数のエマージングパターンでのエマージングパターンの総数よりも本質的に少ない数である、固定数kのエマージングパターンを用いて、n個のスコアの計算すること、そこでは、n個のスコアのi番目のスコアを、また試験データで発生する前記i番目のスコアのk個のエマージングパターンの頻度から得る、と、そしてn個のスコアのもっとも高いものを選ぶことにより、試験データが、前記n個のクラスのデータのどこに分類されるかを推論すること、とから成る。Preferably, the n number of classes is 2 or more, and the method extracts a plurality of emerging patterns from a training data set D having at least one instance of each n classes of data; N lists, where the i-th list of the n lists is derived from a plurality of emerging patterns having a non-zero frequency for the i-th class of data, and each emerging pattern EPi (m ) Occurrence frequency fi (m), and k is a number that is essentially less than the total number of emerging patterns in a plurality of emerging patterns, using a fixed number k of emerging patterns, n Calculating the score, where the i-th score of the n scores is also obtained from the frequency of the k emerging patterns of the i-th score generated in the test data, And inferring where in the n classes of data the test data is classified by choosing the highest of the n scores.
特に、本発明は、また、第1クラスあるいは第2クラスに、試験データTを有する試験サンプルが分類されるかどうかを決定する方法を提供し、それは、少なくとも、第1クラスデータの1個の実例と第2クラスデータの1個の実例を有する訓練データセットDから、複数のエマージングパターンを抽出すること、と、第1及び第2リストを作成すること、そこでは、第1リストは、第1クラスのデータのゼロでない頻度を有する複数のエマージングパターンから各々のエマージングパターンEP1(m)の発生頻度f1(m)を含み、第2リストは、第2クラスのデータのゼロでない頻度を有する複数のエマージングパターンから各々のエマージングパターンEP2(m)の発生頻度f2(m)を含む、と、kが、複数のエマージングパターンでのエマージングパターンの総数よりも本質的に少ない数である、固定数kのエマージングパターンを用いて、また試験データで発生する前記第1リストのk個のエマージングパターンの頻度から得られる第1スコアと、また前記試験データで発生する前記第2リストのk個のエマージングパターンの頻度から得られる第2スコアと、を計算すること、と、第1および第2スコアの高いものを選ぶことにより、試験データが、第1クラスあるいは第2クラスのデータに分類されるかどうかを推論すること、と、から成る。In particular, the present invention also provides a method for determining whether a test sample having test data T is classified into a first class or a second class, which comprises at least one of the first class data. Extracting a plurality of emerging patterns from a training data set D having one instance of an instance and a second class data, and creating first and second lists, wherein the first list is the first list The occurrence frequency f1 (m) of each emerging pattern EP1 (m) from a plurality of emerging patterns having a non-zero frequency of one class of data, and the second list shows the non-zero frequencies of the second class of data K represents the occurrence frequency f2 (m) of each emerging pattern EP2 (m) from the plurality of emerging patterns, and k is the margin of the plurality of emerging patterns A first score obtained using a fixed number k of emerging patterns, which is essentially less than the total number of active patterns, and from the frequency of the k emerging patterns of the first list generated in the test data, and Calculating the second score obtained from the frequency of the k emerging patterns of the second list generated in the test data, and selecting the one with the higher first and second scores, Inferring whether the data is classified into the first class data or the second class data.
更に、本発明は、試験データが存在する試験サンプルが、第1のクラスあるいは第2のクラスに分類されるかどうかを決定するためのコンピュータプログラム製品を提供し、コンピュータプログラム製品は、コンピュータシステムに関連して用いられるものであり、コンピュータプログラム製品は、コンピュータの読み出し可能な蓄積媒体とそこにはめ込まれたコンピュータプログラム機構から成り、コンピュータプログラム機構は、少なくとも1個の統計分析ツール、と、少なくとも1個のソーティングツール、と、少なくとも第1クラスのデータの1個の実例と、少なくとも第2クラスのデータの1個の実例とを有するデータセットにアクセスするための制御命令、と、データセットから複数のエマージングパターンを抽出すること、と、第1リストと第2リストの作成、そこでは、各々の複数のエマージングパターンに対して、第1リストは、第1クラスのデータの中でゼロでない発生を有する複数のエマージングパターンから各々のエマージングパターンiの発生頻度fi(1)を含み、第2リストは、第2クラスのデータの中でゼロでない発生を有する複数のエマージングパターンから各々のエマージングパターンiの発生頻度fi(2)を含む、と、kが、複数のエマージングパターンでのエマージングパターンの総数よりも本質的に少ない数である、固定数kのエマージングパターンを用いて、また試験データで発生する第1リストのk個のエマージングパターンの頻度から得られる第1スコアと、また試験データで発生する第2リストのk個のエマージングパターンの頻度から得られる第2スコアと、を計算すること、と、第1および第2スコアの高いものを選ぶことにより、試験データが、第1クラスあるいは第2クラスのデータに分類されるかどうかを推論すること、と、から成る。Furthermore, the present invention provides a computer program product for determining whether a test sample for which test data is present is classified into a first class or a second class, the computer program product being included in a computer system. As used in conjunction, a computer program product comprises a computer readable storage medium and a computer program mechanism embedded therein, the computer program mechanism comprising at least one statistical analysis tool, and at least one A sorting tool, a control instruction for accessing a data set having at least one instance of data of the first class and at least one instance of data of the second class, and a plurality from the data set Extracting the emerging pattern of Creation of a first list and a second list, wherein for each of the plurality of emerging patterns, the first list is generated from the plurality of emerging patterns having non-zero occurrences in the first class of data. the occurrence frequency fi(1) ofi , and the second list includes the occurrence frequency fi(2) of each emerging pattern i from a plurality of emerging patterns having non-zero occurrences in the second class of data. , And k is a number that is essentially less than the total number of emerging patterns in a plurality of emerging patterns, using a fixed number k of emerging patterns, and the first list of k emergings generated in the test data Obtained from the first score obtained from the pattern frequency and the frequency of the k emerging patterns in the second list generated in the test data. Inferring whether the test data is classified as first class or second class data by calculating a second score and selecting a higher first and second score , And.
本発明は、また、試験データが存在する試験サンプルが、第1のクラスあるいは第2のクラスに分類されるかどうかを決定するためのシステムを提供し、システムは、少なくとも1個のメモリ、と、少なくとも1個のプロセッサー、と、少なくとも1個のユーザーインターフェース、とから成り、全ては、少なくとも1個のバスで互いに接続され、そこでは、少なくとも1個のプロセッサーは、少なくとも第1クラスのデータの1個の実例と少なくとも第2クラスのデータの1個の実例を有するデータセットをアクセス、と、データセットから複数のエマージングパターンを抽出、と、第1リストと第2リストの作成とを行うことを特徴とし、そこで、各々の複数のエマージングパターンに対して、第1リストは、第1クラスのデータの中でゼロでない発生を有する複数のエマージングパターンから各々のエマージングパターンiの発生頻度fi(1)を含み、第2リストは、第2クラスのデータの中でゼロでない発生を有する複数のエマージングパターンから各々のエマージングパターンiの発生頻度fi(2)を含み、kが、複数のエマージングパターンでのエマージングパターンの総数よりも本質的に少ない数である、固定数kのエマージングパターンを用い、また試験データで発生する第1リストのk個のエマージングパターンの頻度から得られる第1スコアと、また試験データで発生する前記第2リストのk個のエマージングパターンの頻度から得られる第2スコアと、を計算し、第1および第2スコアの高いものを選ぶことにより、試験データが、第1クラスあるいは第2クラスのデータに分類されるかどうかを推論すること、を特徴とする。The present invention also provides a system for determining whether a test sample for which test data is present is classified into a first class or a second class, the system comprising at least one memory; , At least one processor, and at least one user interface, all connected to each other by at least one bus, wherein at least one processor has at least a first class of data Accessing a data set having one instance and at least one instance of second class data, extracting a plurality of emerging patterns from the data set, and creating a first list and a second list Where, for each of the plurality of emerging patterns, the first list is among the first class of data. Wherein the frequency fi(1) of each of the emerging pattern i from a plurality of emerging patterns with generating non-B, the second list, each of a plurality of emerging patterns with generating non-zero in the data of the second class Using a fixed number k of emerging patterns, including the frequency fi(2) of the emerging pattern i, and k is essentially less than the total number of emerging patterns in the plurality of emerging patterns, and the test data The first score obtained from the frequency of the k emerging patterns in the first list generated in step S2 and the second score obtained from the frequency of the k emerging patterns in the second list generated in the test data are calculated. However, by selecting the one with the first and second high scores, the test data will be the first class or second class data. Inferring whether classified into, characterized by.
本発明の方法、システム及びコンピュータプログラム製品の更に詳細な具体例において、kは、約5から約50であり、好ましくは約20である。更に、本発明の他の好ましい具体例において、左側境界エマージングパッターンのみが利用される。更に他の好ましい具体例において、データセットは、遺伝子表現データ、患者の医療記録、金融取引、国勢調査、製造品の特徴、食品の特徴、原材料の特徴、気象データ、環境データ及び有機体(生物)母集団の特徴から成るグループから選定されたデータから成る。 In more detailed embodiments of the method, system and computer program product of the present invention, k is from about 5 to about 50, preferably about 20. Furthermore, in another preferred embodiment of the present invention, only the left boundary emerging pattern is utilized. In yet another preferred embodiment, the dataset includes gene expression data, patient medical records, financial transactions, census, product characteristics, food characteristics, raw material characteristics, weather data, environmental data and organisms (biologicals). ) Consists of data selected from groups consisting of characteristics of the population.
本発明のエマージンパターンを基礎とした方法、システム及びコンピュータプログラム製品は、例えば、遺伝子表現プロファイルの分類に応用した際、高精度と簡単な解釈の両方の利点を有する。また、全てのサンプルの大きな集合に関する試験に際して、方法、システム及びコンピュータプログラム製品は、正確に全てのそのサブタイプを分類し、そして、C4.5、NB、SVM及びK-NN方法に比較して、きわめて小さな誤差率を達成する。 The methods, systems and computer program products based on the margin pattern of the present invention have the advantages of both high accuracy and simple interpretation when applied to classification of gene expression profiles, for example. Also, when testing on a large set of all samples, methods, systems and computer program products correctly classify all their subtypes and compare to C4.5, NB, SVM and K-NN methods. Achieve a very small error rate.
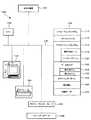
本発明の方法は、図1に示すように、コンピュータシステム100で達成されることが望ましい。コンピュータシステム100は、スパーコンピュータ、卓上ワークステーションコンピュータあるいはパーソナルコンピュータのような高性能マシーンが良い、あるいは、ラップトップまたはノートブックのような携帯コンピュータでも良い、あるいは、分散型計算アレイあるいはネットワークコンピュータのクラスター(群)でも良い。 The method of the present invention is preferably accomplished with a
システム100は、1個あるいはそれ以上のデータ処理ユニット(CPU)102、と、典型的に(1個またはそれ以上の磁気的デイスクドライブのような)不揮発性メモリと高速度ランダムアクセスメモリの両方を有するメモリ108、と、モニター、キーボード、マウス(と/又は)タッチパネル表示から成るユーザーインターフェース104、と、他のコンピュータ、または他の装置と通信するためのネットワークあるいは他の通信インターフェース134、と、CPU102を少なくともメモリ108、ユーザーインターフェース104及びネットワークインターフェース134に内部接続する1個またはそれ以上の通信バス106から構成される。 The
システム100は、また、データを直接メモリにダウンロードする研究所機器140に直接接続される。研究所機器は、データサンプリング装置、1個またはそれ以上の分光計、遺伝子表現分析に利用するマイクロアレイデータを集めるための装置、操作機器あるいはフィールドで用いる携帯機器を含む。 The
システム100は、また、ネットワークインターフェース134経由で遠隔データベース136に蓄積されたデータをアクセスする。遠隔データベース136は、1個またはそれ以上の他のコンピュータ、ディスク、ファイルシステムあるいはネットワークに分配される。遠隔データベース136は、リレーショナルデータベースあるいは、大きなデータアレイを処理する能力があるデータ蓄積のいかなる形式でも良く、例えば、限定しないが、マイクロソフトのエクセル、フラットファイル及びXMLデータベースなどのプログラムで作成されるスプレッドシートのようなものでも良い。 The
システム100は、また、随意的に、プリンター、あるいは、限定しないがCD-R、CD-RW、フラッシュカード、スマートメディア、メモリースティック、フロッピーディスク、Zipディスク、磁気テープあるいは光学メディアを含む他の書き込み装置などの出力装置150に接続される。 The
コンピュータシステムメモリ108は、手順とデータを蓄積する、そして、典型的に、基本システムサービスを提供するオペレーションシステム110、と、ファイルとデータを分類し構成化するファイルシステム112、と、統計分析118及びソーティング120に対するユーザーレベルツールなどの1個あるいはそれ以上のアプリケーションプログラム114、を含む。オペレーションシステム110は、次のどれかである:ULTRIX、Irix、SOLARIS及びAixなどのUNEベースシステム、Linux システム、 Windows 3.1、 Windows NT、Windows 95、Windows 98、Windows ME、Windows XPあるいはそれらの応用などのWindowsベースシステム、MacOS 8.x、MacOS 9.x及び MacOS XなどのMacintoshオペレーションシステムあるいは、VMSベースシステム、あるいは全ての互換オペレーションシステム。統計分析ツール118は、限定されないが、チイ―スクワード(chi-squared)分析、エントロピー・ベース離散化及びリーフ・ワン・カットクロスバリデーション(leave-one-out cross validation)などの相関基礎の機能選択を達成するためのツールを含む。 The
加えるに、メモリ108は、データセット126から得られたエマージングパターン122のセットと同様に、それらそれぞれの発生頻度124を蓄積する。データセット126は、好ましくは、少なくともD1として示される第1クラス128とD2として示される第2クラス130のデータ及び追加のクラスDi、ここで、i>2 に分割される。データセット126は、リレーショナルデータベース、スプレッドシートあるいはプレインテキストなどを含むあらゆる便利な形式で蓄積される。試験データ132は、また、メモリ108に蓄積され、そして、それは直接研究所機器140から、あるいは、ユーザーインターフェース104から、あるいは136などの遠隔データベースから抽出され、あるいは、限定はしないが、フロッピーディスク、CD-Rom、CD-R、CD-RW あるいはフラッシュカードなどの外部メディアから提供される。In addition, the
データセット126は、無制限の数と様々な供給源に対するデータを構成する。好ましい本発明の具体例では、データセット126は、遺伝子表現データから成り、その場合、第1クラスのデータは、正常セル(細胞)などの第1タイプのセルに対応し、第2クラスのデータは、腫瘍セルなどの第ニタイプのセルに対応する。データセット126が遺伝子表現データから成る時、それは、また、第1クラスのデータは、第1対象母集団のデータに対応し、第2クラスのデータは、第ニ対象母集団に対応する、でもよい。
データセット126からの他のタイプのデータは、以下に含まれるものから取り出せる:患者の医療記録、金融取引、国勢調査データ、人口統計のデータ、農産物などの食品の特徴、自動車やコンピュータあるいは衣類品などの製造品の特徴、例えば1箇所かそれ以上の場所で長期にわたって集められた情報を表すあるいは与えられた時間でたくさんの異なる場所に対する情報を表示する気象データ、有機体(生物)の母集団の特徴、例えばセールスや広告数字などのマーケットデータ、および、異なる時間あるいは異なる場所の異なる化学物質のための有毒な廃棄物数字の編集物あるいは地球温暖化傾向、森林伐採レベルや種の絶滅率などの環境データ。 Other types of data from data set 126 can be retrieved from: patient medical records, financial transactions, census data, demographic data, food characteristics such as agricultural products, cars, computers or clothing Product features such as meteorological data representing information collected over time in one or more locations or displaying information for many different locations at a given time, organism (organism) population Characteristics, such as market data such as sales and advertising figures, and compilation of toxic waste figures or global warming trends for different chemicals at different times or different locations, deforestation levels and species extinction rates, etc. Environmental data.
データセット126は、リレーショナルデータベース(関連データベース)形式で蓄積されるのが望ましい。本発明の方法は、リレーショナルデータベースに限られるものではなく、また、データセットが何らかの適切な手順でリレーショナル形式に変換できる限りにおいて、XML、 Excel、スプレッドシートあるいはいかなる形式にも適用可能である。例えば、スプレッドシートに蓄積したデータは、普通の行列形式を有し、それ故、列Xと行Yが、記録X‘と属性Y’としてそれぞれ通訳され得る。対応して、列Xと行Yでセルのデータは、記録X‘の属性Y’の値Vとして通訳され得る。データセットをリレーショナル形式に変換する他の手段は、また、特別なデータセットに対する適切な通訳によって可能である。形式変換に対する適切な解釈と対応手順は、技術に優れた人の能力の範疇である。 The
データベースおよびデータマイニングにおける知識の発見
従来、データベースの知識の発見は、データの有効性、新しい、有用性及び最終的に理解可能なパターンを確認するつまらなくないプロセスであるべきと定義されていた。(参照:例えば、フロリー他、「データベースの知識の発見:概要」、 書籍(Knowledge Discovery in Databases)中、p1-27、G. Piatetsky-Shapiro&W. J. Frawley、EDS、 (AAAI/MIT出版、1991))。 本発明の方法によれば、「エマージングパターン」として参照されたあるタイプのパターンが、特別な興味である。Knowledge Discovery in Databases and Data Mining Traditionally, discovery of database knowledge was defined to be a trivial process of validating data, new, usefulness and ultimately understandable patterns. (See, eg, Flory et al., “Discovery of Database Knowledge: An Overview”, in Knowledge Discovery in Databases, p1-27, G. Piatetsky-Shapiro & W. J. Frawley, EDS, (AAAI / MIT Publishing, 1991 )). According to the method of the present invention, one type of pattern referred to as an “emerging pattern” is of particular interest.
パターン確認のプロセスは、一般的に、「データマイニング」として参照され、そして、それは、受け入れ可能な計算の効率限界下のアルゴリズムの使用から成り、必要パターンの特別な一覧を作成する。データマイニングの主な側面は、データ間の従属関係を発見することであり、アソシエーション規則(協会規則)の利用で達成される着地点である、しかし同様に、現在、他のタイプの分類器に対しても実用的になっている。 The process of pattern confirmation is commonly referred to as “data mining” and it consists of the use of algorithms under acceptable computational efficiency limits, creating a special list of required patterns. The main aspect of data mining is to discover dependencies between data and is the landing point achieved through the use of association rules (association rules), but also to other types of classifiers now It is also practical.
リレーショナルデータベースは、リレーションと呼ばれる表の集合からなると考えられる、各々の表は、記録セットからなり、そして、各々の記録は、従属値ペア(対)のリストである。(参照:例えば、コッド、「大きな共用データバンクに対するリレーショナルモデル」、Communications of the ACM、13、(6): 377-387、(1970))。最も初歩的な関係は、特別な特性あるいは分類に対する単なる名前である、「属性」(または、「特徴」と呼ぶ)である。値は、特性あるいは分類を取ることができる特別な実例である。例えば、取引データベース(transactional databases)において、ビジネスの背景で用いられるように、属性は、ミルク、パン、チーズ、コンピュータ、車、本などの分類名であってよい。 A relational database is considered to consist of a collection of tables called relations, each table consisting of a record set, and each record is a list of dependent value pairs. (See: Cod, “Relational Model for Large Shared Data Banks”, Communications of the ACM, 13, (6): 377-387, (1970)). The most rudimentary relationship is an “attribute” (or “feature”), which is simply a name for a particular property or classification. A value is a special example that can take a characteristic or a classification. For example, in a transactional database, the attribute may be a classification name such as milk, bread, cheese, computer, car, book, etc., as used in the business context.
属性は、区分できる(例えば、絶対的な)あるいは、つながることが出来る領域値を有する。個別の属性の例は、赤、黄色、青、緑などの値を取る色である。つながった属性の例は、同意範囲でいろいろな値、[0,120]など、を取る年齢である。取引データベースにおいて、例えば、属性は、0または1の二進数である、ここで、値1を持つ属性は、特別な品物を購入したことを意味する。属性値ペア(対)は、「アイテム(又は品目)」あるいは、代わりに「コンデイション(または状態)」と呼ばれる。だから、「色−緑」及び「ミルク−1」は、アイテム(あるいはコンディション)の例である。 Attributes have region values that can be distinguished (eg, absolute) or connected. Examples of individual attributes are colors that take values such as red, yellow, blue, and green. An example of a connected attribute is an age that takes various values, such as [0,120], within the consent range. In the transaction database, for example, the attribute is a binary number of 0 or 1, where the attribute having the
アイテムのセットは、一般的に、含まれるアイテムの数に無関係に「アイテムセット」として参照される。データベースDは、多くの記録からなる。各々の記録は、多くのアイテムから成り、各々のアイテムは、データ内の属性の数に等しい基数を有する。記録は、質問の属性のなりゆきに従い、「取引(transaction)」あるいは「実例(instance)」と呼ばれる。特に、用語「取引」は、二進数属性値を有するデータベースの参照に典型的に用いられる、一方、用語「実例」は、多重値(あるいはマルチ価値)属性を含むデータベースの参照に普通は用いられる。だから、データベースあるいは「データセット」は、取引あるいは実例セットである。データベースの全ての実例に対して正確に同じ属性を持たす必要はない。属性値ペアとしての実例あるいは取引の定義は、自動的に、単一データセット内で混合した実例を提供する。 A set of items is generally referred to as an “item set” regardless of the number of items included. Database D consists of many records. Each record consists of a number of items, each item having a radix equal to the number of attributes in the data. Records are called “transactions” or “instances” depending on the nature of the question attributes. In particular, the term “transaction” is typically used to refer to a database that has binary attribute values, while the term “example” is commonly used to refer to a database that contains multi-value (or multi-value) attributes. . So a database or “data set” is a transaction or example set. It is not necessary for all instances of a database to have exactly the same attributes. Instance or transaction definitions as attribute-value pairs automatically provide mixed instances within a single data set.
データベースDの「ボリューム(volume)」は、D内の実例の数である、正常セットとしてDを取り扱い、そして、|D|と表記される。Dの「デイメンジョン(dimension)」は、Dに使われた属性の数である、そして、しばしば基数として参照される。アイテムセットXの「カウント(count)」は、countD(X)と表記される、そして、Xを含むD内の取引Tの数であるとして定義される。Xを含む取引は、X⊆Tとして記述される。D内のXの「サポート(support)」は、suppD(X)と表記され、Xを含むD内の取引の比率である、つまり、
D内の「アソシエーション規則 (association rule)」は、形式X→Yの意味(または含意 (implication))であり、X とYは、D内の2個のアイテムセットで、X∩Y=0である。アイテムセットXは、「前件(antecedent)」の規則であり、アイテムセットYは、「後件(consequent)」の規則である。D内のアソシエーション規則X→Yの「サポート」は、X∪Y を含むD内の取引比率である。だから、サポートの規則は、suppD(X∪Y)で表示される。アソシエーション規則の「コンフィデンス(confidence)」は、Xを含み、またYを含むD内の取引の比率である。だから、コンフィデンスの規則X→Yは、
マイニングアソシエーション規則の問題は、それぞれ、ユーザ特定最小サポートminsup及び最小コンフィデンスminconf より大きいかあるいは等しいかのサポートとコンフィデンスを有する全てのアソシエーション規則をいかに発生するかの1つになる。一般的に、この問題は、2つの補助問題に分解することで解決される、それは、minsupに関して全ての大きいアイテムセットを発生させる、及び、与えた大きいアイテムセットに対して、全てのアソシエーション規則を発生させ、コンフィデントがminconfを超えるそれらの規則のみを出力するものである、(参照:アグラワル他、(1993))。これら補助問題の二番目が容易であるが判明するので、効率よいマイニングアソシエーション規則への鍵は、それらのサポートが与えられた閾値を超える全ての大きいアイテムセットを発見することです。 The problem of mining association rules is one of how to generate all association rules with support and confidence that are greater than or equal to the user specific minimum support minsup and minimum confidence minconf, respectively. In general, this problem is solved by breaking it down into two auxiliary problems, which generate all large itemsets with respect to minsup, and for all large itemsets given all association rules Only those rules whose confident exceeds minconf are output (see: Agrawal et al. (1993)). Since the second of these sub-problems turns out to be easy, the key to efficient mining association rules is to find all large itemsets whose support exceeds the given threshold.
これら大きいアイテムセットの発見へのナイーブアプローチは、D内の全ての可能なアイテムセットを発生し、そして、それぞれのサポートを確かめることです。デイメンジョンがnであるデータベースに対して、これは、2n−1個のアイテムセットのサポートを確認することを要する(すなわち、空のセットは含まれない)、nの増加により急速に手に負えなくなる方法。ナイーブ法が持つこの困難さを部分的に克服する2つのアルゴリズムが開発されている:アプリオリ(アグラワル&スリカン、「マイニングアソシエーション規則のための高速アルゴリズム」、Proceedings of the 20th International Conference on Very Large Data Bases、487-499、(サンチアゴ、チリ、1994)) 及び MAX-MINER (バヤルド、「データベースからのロングパターンの効率的マイニング」、Proceedings of the 1998 ACM- SIGMOD International Conference on Management of Data、85-93、(ACM出版、1998))、 両方ともここで完全に参照されています。A naive approach to the discovery of these large itemsets is to generate all possible itemsets in D and verify their support. For databases whose dimensions are n, this requires checking for support of 2n -1 itemsets (ie, empty sets are not included), and increasing n quickly How to become unbearable. Two algorithms have been developed that partially overcome this difficulty of the naïve method: Apriori (Agrawal & Surikan, “Fast Algorithms for Mining Association Rules”, Proceedings of the 20th International Conference on Very Large Data Bases 487-499, (Santiago, Chile, 1994)) and MAX-MINER (Bajardo, "Efficient mining of long patterns from databases", Proceedings of the 1998 ACM- SIGMOD International Conference on Management of Data, 85-93, (ACM Publishing, 1998)), both are fully referenced here.
アソシエーション規則の利用にもかかわらず、追加の分類器は、データマイニング応用に利用を見出している。非公式に、分類は、実例を基礎とした意思決定プロセスであり、それにより、新しい実例が多数の可能なグループの1つに指名される。グループは、それぞれ分類が、「教師有り(supervised)」あるいは「教師無し(unsupervised)」分類かどうかに従って、クラス又はクラスターのどちらかで呼ばれる。クラスタリング方法は、そこで実例のクラスターが定義され、決定される教師無し分類の例である。対照的に、教師有り分類においては、全ての与えられた実例のクラスが、最初から知られ、そして主要目的は、与えられた実例から規則あるいはパターンなどの知識を得ることである。本発明の方法は、教師有り分類の問題に適用することが好ましい。 Despite the use of association rules, additional classifiers have found use in data mining applications. Informally, classification is an instance-based decision-making process whereby new instances are nominated for one of many possible groups. Each group is called either a class or a cluster, depending on whether the classification is a “supervised” or “unsupervised” classification. The clustering method is an example of unsupervised classification in which an example cluster is defined and determined. In contrast, in supervised classification, all given example classes are known from the beginning, and the main purpose is to obtain knowledge such as rules or patterns from the given examples. The method of the present invention is preferably applied to the supervised classification problem.
教師有り分類において、知識の発見は、事前定義クラスの1つに新しい実例の分類を案内する。典型的に、分類問題は、「学習フェーズ(learning phase)」と「試験フェーズ(testing phase)」の2つのフェーズ(局面)からなる。教師有り分類において、学習フェーズは、パターンあるいは規則のセットを作成するために、与えられた実例の集合から知識の学習を伴う。試験フェーズは、そこで、作成されたパターンあるいは規則は新しい実例を分類するために利用することにつながる。「パターン」は簡単には、コンデイションのセットである。データマイニング分類は、学習フェーズで、パターン及び頻度や従属などが関連付けられた特徴を利用する。提示すべき2個の主要な問題は、パターンの定義及び発見のための効率的アルゴリズムの設計である。しかし、ボリュームのあるデータセットの場合、パターンの数は非常に大きいことがたびたびであるので、第三の重要な問題は、意思決定に対していかに効率的にパターンを選定するかである。第三の問題提示において、あまり複雑でなくかつ人が理解容易な分類器の到来が最も望まれている。 In supervised classification, knowledge discovery guides a new example classification to one of the predefined classes. Typically, a classification problem consists of two phases: a “learning phase” and a “testing phase”. In supervised classification, the learning phase involves learning knowledge from a given set of examples to create a set of patterns or rules. The test phase then leads to the created patterns or rules being used to classify new instances. A “pattern” is simply a set of conditions. Data mining classification uses features associated with patterns, frequencies, subordinates, and the like in the learning phase. Two major issues to be presented are the design of efficient algorithms for pattern definition and discovery. However, for volumetric data sets, the number of patterns is often very large, so a third important issue is how to efficiently select patterns for decision making. In the third problem presentation, the arrival of a classifier that is not very complicated and easy for humans to understand is most desired.
教師有り分類問題において、「訓練実例(training instance)」は、クラス ラベル(標札)が知られている実例である。例えば、健康と病気の母集団データに関するデータから成るデータセットにおいて、訓練実例は、健康として知られる人用データであってよい。対照的に、「試験実例(testing instance)」は、クラス ラベルが知られていない実例である。「分類器(classifier)」は、試験実例をクラス ラベルに位置づける機能である。広く使われている分類器の例を以下に示す:CBA (「アソシエーションを基礎とした分類」)、 分類器、(リユー他、「分類とアソシエーション規則マイニングの統合」、Proceedings of the fourth International Conference on Knowledge Discovery and Data Mining、80-86、New York, USA, AAAI 出版 (1998))、大きいベイズ分類器(「LB」)、(メレタキス&ウスリッチ、「長いアイテムセットを用いたナイーブベイズ分類器の拡張」、Proceedings of the Fifth ACM SIGKDD International Conference on Knowledge Discovery and Data Mining、165-174、San Diego, CA, ACM出版(1999))、C4. 5 (デシジョンツリーを基礎とした)分類器、(クインラン、C4. 5:Programs for machine Learning、Morgan Kaufmann、San Mateo、CA、(1993))、 K-NN (k-ニアレストネイバー)分類器、(フィックス&ホッジ、「差別的な分析、非母数の区別、一貫特徴」、Technical Report 4、Project Number 21-49-004、USAF School of Aviation Medicine、Randolph Field、TX、(1957))、 パーセプトロン (ローゼンブラット、ニューロ工学理論:パーセプトロンと脳の機構理論、Spartan Books, Washington D. C、(1962))、ニューラルネットワーク (ローゼンブラット、1962)、及び、NB (ナイーブベイズ)分類器、(ラングリー他、「ベイズ分類器の解析」、Proceedings of the Tenth National Conference on Artificial Intelligence、223-228、AAAI 出版、(1992))。 In a supervised classification problem, a “training instance” is an example in which a class label is known. For example, in a data set consisting of data relating to health and illness population data, the training example may be human data known as health. In contrast, a “testing instance” is an instance where the class label is unknown. The “classifier” is a function that positions test examples as class labels. Examples of widely used classifiers include: CBA (“association-based classification”), classifier, (Reu et al., “Integration of classification and association rule mining”, Proceedings of the fourth International Conference on Knowledge Discovery and Data Mining, 80-86, New York, USA, AAAI Publishing (1998)), Large Bayesian Classifier (“LB”), (Meletakis & Usrich, “Naive Bayesian Classifier Extension with Long Item Sets” `` Proceedings of the Fifth ACM SIGKDD International Conference on Knowledge Discovery and Data Mining, 165-174, San Diego, CA, ACM Publishing (1999)), C4.5 (based on decision tree), (Quinlan, C4.5: Programs for machine learning, Morgan Kaufmann, San Mateo, CA, (1993)), K-NN (k-nearest neighbor) classifier, (fix & hodge, “discriminatory analysis, non-parametric Distinction, consistent features ", Technical Report 4, Project Number 21-49-004, USAF School of Aviation Medicine, Randolph Field, TX, (1957)), Perceptron (Rosenblatt, Neuro Engineering Theory: Perceptron and Brain Mechanism Theory, Spartan Books, Washington D. C, (1962)), neural networks (Rosenblatt, 1962), and NB (Naive Bayes) classifiers, (Lungry et al., `` Analysis of Bayesian classifiers '', Proceedings of the Tenth National Conference on Artificial Intelligence, 223-228, AAAI Publishing, (1992).
分類器の精度は、典型的に複数の手段の1つのなかで決定される。例えば、1手段において、訓練データのある比率は、保留され、分類器は、残りのデータ上で訓練され、そしてそれから分類器は、保留データに適用される。正しく分類された保留データの比率は、分類器の精度としてとられる。別の手段では、n-fold クロスバリデーション戦略が用いられる。このアプローチにおいて、訓練データは、n個のグループに分割される。それから、第1のグループは保持される。分類器は、他の(n−1)個の上で訓練され、そして保持グループに適用される。それから、このプロセスは、n番目のグループを通して、第2グループに対して繰り返される。分類器の精度は、これらn個のグループに対して得られた全ての平均精度としてとられる。第三の手段は、リーフ・ワン・カット戦略が用いられる、そこでは、第1訓練実例は保持され、そして残りの実例は、分類器の訓練に使われる、それから、保持された実例に適用される。そして、プロセスは、第2実例、第三実例そして第四と最後に達するまで繰り返される。この手段で正しく分類された実例の比率は、分類器の精度としてとられる。 The accuracy of the classifier is typically determined in one of a plurality of means. For example, in one means, a proportion of training data is reserved, the classifier is trained on the remaining data, and then the classifier is applied to the reserved data. The ratio of correctly classified pending data is taken as the accuracy of the classifier. Another approach uses an n-fold cross-validation strategy. In this approach, the training data is divided into n groups. The first group is then retained. The classifier is trained on the other (n−1) and applied to the holding group. The process is then repeated for the second group through the nth group. The accuracy of the classifier is taken as all average accuracy obtained for these n groups. The third measure uses a leaf-one-cut strategy, where the first training example is retained, and the remaining examples are used for classifier training, and then applied to the retained examples. The The process is then repeated until the second instance, the third instance and the fourth and last are reached. The proportion of examples correctly classified by this means is taken as the accuracy of the classifier.
本発明は、好ましくは、上に記載の3つの手段の測定精度の全て、あるいはデータマイニング、マシーン学習及び診断及び知られた技術の分野に共通の他の手段の測定精度より、良く実行する分類器を得ることである。 The present invention preferably performs a classification that performs better than all of the measurement accuracy of the three means described above or the measurement accuracy of other means common to the fields of data mining, machine learning and diagnosis and known technology. Is to get a vessel.
エマージングパターン(EP)
本発明の方法は、データベースから知識の発見のために、エマージングパターンと呼ばれる一種のパターンを用いる。一般的に述べれば、エマージングパターンは、2あるいはそれ以上のデータセットあるいはクラスのデータに結びつけ、そして、あるデータセットと別のデータセットあるいは他のものの間の著しい変化(例えば、差異あるいは動向)を記述することに使われる。EP’sは、次の文献に記載されている:J. リー、正確で効率的な分類器の構築のためのエマージングパターン、博士論文、Department of Computer Science and Software Engineering、メルボルン大学、オーストラリア、(2001)、これは、ここに完全に参照されている。エマージングパターンは、基本的に簡単なコンデイションの結合である。好ましくは、エマージングパターンは、4つの特質、つまり、有効性、斬新さ、潜在的な有用性及び理解可能、をもっている。Emerging pattern (EP)
The method of the present invention uses a kind of pattern called an emerging pattern for finding knowledge from a database. Generally speaking, emerging patterns are tied to two or more datasets or classes of data, and can cause significant changes (eg, differences or trends) between one dataset and another. Used for describing. EP's is described in: J. Lee, Emerging Patterns for Building Accurate and Efficient Classifiers, Doctoral Dissertations, Department of Computer Science and Software Engineering, University of Melbourne, Australia, (2001) This is fully referenced here. An emerging pattern is basically a combination of simple conditions. Preferably, the emerging pattern has four attributes: effectiveness, novelty, potential utility and understandability.
パターンの有効性は、新しいデータへのパターンの適用性に関係する。理想的には、発見されたEPは、新しいデータに適用するとき、いくらかの確実の程度をもって有効であるべきである。この特性を調査するひとつの手段は、少ない比率の新しいデータを加えることでオリジナルなデータベースを更新した後、EPの有効性を試験することである。大きな比率の新しいデータが前の処理データに組み入れられるときでさえ、それが有効であれば、EPは、特に強いかもしれない。 The effectiveness of the pattern is related to the applicability of the pattern to new data. Ideally, the discovered EP should be valid with some degree of certainty when applied to new data. One way to investigate this property is to test the effectiveness of the EP after updating the original database by adding a small percentage of new data. The EP may be particularly strong if it is valid, even when a large proportion of new data is incorporated into the previous processed data.
斬新さは、パターンは、伝統的な統計方法あるいは専門家により前に発見されていなかったかどうかに関係する。普通、そのようなパターンは、多くのコンディションあるいは低サポートレベルを伴う、理由は、専門家は、多少は知っているが全ては知らない故、あるいは専門家は、しばしば起きるそれらパターンに注意を向けるが、ほとんど起きないものには向けない故であえる。例えば、いくつかのEP‘sは、データセットの属性の数が1000のように大きいとき、15個以上のコンディションを含む、5個以上から構成する驚くほど長いパターンからなる、それにより、新しいそして前によく理解されている問題への思いがけない洞察を提供する。 The novelty relates to whether the pattern has been previously discovered by traditional statistical methods or experts. Usually, such patterns involve many conditions or low support levels, because the experts know a little but not all, or the experts turn their attention to those patterns that often occur But it's because it doesn't turn to things that rarely happen. For example, some EP's consist of a surprisingly long pattern consisting of 5 or more, including 15 or more conditions, when the number of attributes in the dataset is as large as 1000, thereby new and Provide unexpected insight into previously well-understood issues.
パターンの潜在的有用性は、もしそれが予測的に使うことが出来れば、生じる。エマージングパターンは、いかなる2個あるいはそれ以上の重ならない時間データセット内の動向と2個あるいはそれ以上の空間データ内の著しい差異を記述することが出来る。この文脈のなかで、「差異」は、ほとんどのクラスのデータが満足するが他のクラスは一切満足しないコンデイションのセットを参照する。「動向」は、1個の時間ポイントに対してデータセット内のほとんどのデータが満足するが別の時間ポイントに対してデータセット内のデータが満足しないコンディションのセットを参照する。従って、EP’sは、予測ビジネス市場、異なる民族グループ間のいくつかの特別な病気の隠された原因を確認すること、手書き文字認識用、リボソームタンパク質の暗号を指定する遺伝子と他のたんぱく質の暗号を指定する遺伝子間の識別用および正の実例と負の実例、例えば離散データにおける「健康」あるいは「病気」、の区別用などの応用において相当利用されることが見出されるかもしれない。 The potential utility of a pattern arises if it can be used predictively. An emerging pattern can describe trends in any two or more non-overlapping temporal data sets and significant differences in two or more spatial data. Within this context, "difference" refers to a set of conditions that most classes of data are satisfied but other classes are not satisfied at all. “Trend” refers to a set of conditions in which most data in a data set is satisfied for one time point but data in the data set is not satisfied for another time point. Thus, EP's code for genes and other proteins that specify the predictive business market, identifying the hidden causes of some special illnesses between different ethnic groups, for handwritten character recognition, and coding for ribosomal proteins. It may be found to be used significantly in applications such as for identifying between specified genes and for distinguishing between positive and negative examples, eg “health” or “disease” in discrete data.
パターンは、もしその意味がそれを調べることから直感的に明らかであるならば、理解可能である。EPが簡単なコンデイイションの結合である事実は、通常理解するのが簡単であることを意味する。EPの解釈は、2個のクラスのデータ間を識別するその能力に関する事実が知られるとき、特に助力される。 A pattern is understandable if its meaning is intuitively obvious from examining it. The fact that EP is a combination of simple conditioning means that it is usually easy to understand. The interpretation of EP is particularly helpful when facts about its ability to distinguish between two classes of data are known.
データセットのペアD1及びD2を仮定する、EPは、そのサポートが1個のデータセットD1から別のD2に著しく増加するアイテムセットとして定義される。データベースDiのアイテムセットXのサポートをsuppi(X)により表示し、D1からD2までのアイテムセットXの「成長率(growth rate)」は次の式で定義される、
だから、成長率は、D1のそのサポートに対するD2のアイテムXのサポートの比である。EPの成長率は、そのサポート内の変化の程度を測定し、そして本発明の方法での興味の初期量である。成長率の代替定義は、アイテムセットの計算の区間に表現されることができる、2つのデータセットが非常な不釣合いな母集団を有する状況に特別な適用可能性を見つける定義。Assuming a pair of data sets D1 and D2 , an EP is defined as an item set whose support increases significantly fromone data set D1 to another D2 . Display support for item set X in database Di by suppi (X), and the “growth rate” of item set X from D1 to D2 is defined by:
So, the growth rate is the ratio of D2 item X support to its D1 support. The growth rate of EP measures the degree of change in its support and is the initial amount of interest in the method of the present invention. An alternative definition of growth rate is a definition that finds special applicability in situations where two datasets have very disproportionate populations, which can be expressed in the calculation interval of the item set.
ここに提示した公式は、2個のクラスのデータの場合に制限されるものではなく、特別にそれと反対に示されるところを除いて、従来技術の1つによってデータセットが3個あるいはそれ以上のクラスのデータを持つ場合に一般化(拡張)され得る、ことは理解される。従って、ここに提示された様々な方法の議論は、2個のクラスのデータからなる状況への応用による実証で、3個あるいはそれ以上のクラスのデータが検討される状況へ技術の1つにより一般化され得る、ことは更に理解される。データのクラスは、ここでは、大きいデータセット内のデータのサブセットであるとみなし、そしてサブセットがいくつかの共通の特徴をもつそのような手段において典型的に選択される。例えば、ある手段で試験された全員の横断データにおいて、1個のクラスは、それらの人あるいは特別な性別に関する、あるいは特別な処置を受けた人のデータであり得る。 The formula presented here is not limited to the case of two classes of data, except that it is specifically indicated to the contrary, and one of the prior art has three or more data sets. It is understood that it can be generalized (extended) when it has class data. Therefore, the discussion of the various methods presented here is a demonstration by application to a situation consisting of two classes of data, and one of the techniques to a situation where three or more classes of data are considered. It is further understood that it can be generalized. The class of data is considered here to be a subset of the data in a large data set, and the subset is typically selected in such a way that has some common characteristics. For example, in the cross-sectional data of all who have been tested by some means, a class can be the data for those persons or for special genders or who have received special treatment.
EP’sは、その成長率が与えられた閾値ρよりも大きいアイテムセットであることがより特に望まれる。特に、成長率閾値として、ρ>1を与える、アイテムXは、もし、以下であれば、D1からD2までのρ―エマージングパターンと呼ばれる。
growth_rateD1→D2(X)≧ρMore particularly, EP's is an item set whose growth rate is greater than a given threshold ρ. In particular, an item X that gives ρ> 1 as a growth rate threshold is called a ρ-emerging pattern from D1 to D2 if:
growth_rateD1 → D2 (X) ≧ ρ
D1からD2までのρ−EPは、ρ=∞のとき、D1からD2までの「ジャンピングEP」と呼ばれる。だから、D1からD2までのジャンピングEPは、D2に有り、D1に無い1つである。もし、D1およびD2が理解されれば、それは、ジャンピングJPあるいはJ-EPということは妥当である。本発明のエマージングパターンは、好ましくは、J-EP’sである。Ρ-EP from D1 to D2, when the ρ = ∞, is referred to as a "jumping EP" from D1 to D2. Therefore, the jumping EP from D1 to D2 isone that is in D2 but not in D1 . If D1 and D2 are understood, it is reasonable to say jumping JP or J-EP. The emerging pattern of the present invention is preferably J-EP's.
次の様に2個のパターンXとYを与える、全ての可能な実例dに対して、Yがdで起きればいつもXがdで起きる、そのとき、それはXがYより一般的と言われる。それは、また、もしXがYより一般的である場合、YはXより特定的と言われる。 For every possible instance d that gives two patterns X and Y as follows, whenever Y occurs at d, X always occurs at d, then it is said that X is more general than Y . It is also said that Y is more specific than X if X is more general than Y.
D1からD2までのEP’sの集合Cを与え、EPは、もしそれより一般的であるCで他のEPが無ければ、C内で最も一般的と言われる。同様に、EPは、もしそれより特定的であるCで他のEPが無ければ、C内で最も特定的と言われる。与えられたD1、D2及びCに対して、最も特定的として参照されるEPは1つ以上ある、そして最も一般的として参照されるEPは1つ以上ある。Cの最も一般的及び最も特定的EP’sは、双方とも、Cの「境界(border)」と呼ばれる。最も一般的EP’sは、また、Cの「左側境界EP’s(left boundary EP’s)」と呼ばれる。また、最も特定的なEP’sは、Cの右側境界EP’sと呼ばれる。文脈が明確であるところで、境界EP’sが、Cに言及せずに左側境界EP’sの意味に取られる。それらは最も一般的であるので、左側境界EP’sは、特別の興味である。Given a set C of EP's from D1 to D2 , the EP is said to be the most common in C if it is more general and there are no other EPs. Similarly, an EP is said to be most specific within C if it is more specific and there are no other EPs. For a given D1 , D2 and C, there is one or more EPs referred to as the most specific, and one or more EPs referred to as the most general. C's most common and most specific EP's are both referred to as C's "border". The most common EP's are also called C's "left boundary EP's". The most specific EP's are also called C right boundary EP's. Where the context is clear, the boundary EP's is taken to mean the left boundary EP's without mentioning C. The left border EP's are of special interest because they are the most common.
D1からD2のEP’sの集合Cを与え、CのサブセットC’は、もしそれがCの左側境界およびXを含む場合、「プラトー(plateau)」と呼ばれる、そしてC’の全てのEP’sは、XとしてD2で同じサポートを有し、そして、C’でないCでの他の全てのEP’sは、Xのそれと異なるD2でサポートを有する。C’内のEPは、Cの「プラトーEP’s」と呼ばれる。もしCが理解されるならば、それは、プラトーEP’sというに十分である。Given a set C of EP's from D1 to D2 , the subset C 'of C is called a "plateau" if it contains the left boundary and X of C, and all EP's of C' are , Have the same support at D2 as X, and all other EP's at C that are not C 'have support at D2 different from that of X. EPs within C 'are called C's "plateau EP's". If C is understood, it is enough to be a plateau EP's.
D1とD2の1対のデータセットに対して、好まれた慣習は次をふくむ:EPのサポートとしてD2内のサポートを参照、「バックグランド」データとしてD1を、及び「ターゲット」データセットとしてD2を参照、ここでは、例えば、データは時間順序である、「負(negative)」クラスとしてD1を及び「正(positive)」クラスとしてD2を参照、ここでは、例えば、データはクラス関係である。For a pair of D1 and D2 data sets, preferred conventions include: see support in D2 for EP support, D1 as “background” data, and “target” data See D2 as a set, where, for example, the data is in time order, see D1 as the “negative” class and D2 as the “positive” class, where, for example, the data Is a class relationship.
従って、エマージングパターンは、データセット間の著しい変化と差異を捕らえる。時間刻印データベースに適用したとき、EP’sは、母集団の行動におけるエマージング動向を捕らえることができる。これは、例えば、時間の異なるポイントでビジネスあるいは人口統計データの比較部分を含むデータベース内の連続時間ポイントでのデータセット間の差異は、動向を突き止めるために使うことができるからである。加えるに、離散クラスを有するデータセットに適用したとき、EPは、クラス間の有用な相違を捕らえることができる。そのようなクラスの例は、限定しないが、生物の母集団に関するデータの雄対雌、酵母菌の母集団の毒対食用、治療中の患者の母集団の治った対治らなかった、などを含む。EPは、例えば、多くのデータセットに対するC4. 5及びCBAより更に精度がよい非常に力強い分類器を構築する能力を証明した。1%から20%の低から中程度のサポートを有するEPは、「よくわかる」状況においてさえ、専門家に有用で新しい洞察と案内を与えることができる。 Thus, emerging patterns capture significant changes and differences between data sets. When applied to a time stamp database, EP's can capture emerging trends in population behavior. This is because, for example, the differences between data sets at continuous time points in a database that includes a comparison portion of business or demographic data at different points in time can be used to track trends. In addition, when applied to datasets with discrete classes, EP can capture useful differences between classes. Examples of such classes include, but are not limited to, male versus female data on the population of organisms, venom versus edible yeast populations, cured versus untreated patients population being treated, etc. Including. EP, for example, has demonstrated the ability to build very powerful classifiers that are even more accurate than C4.5 and CBA for many data sets. EPs with 1% to 20% low to moderate support can provide professionals with useful new insights and guidance, even in “well understood” situations.
ある特別なタイプのEP’sを見出すことができる。他で議論されているように、成長率が無限大(∞)である、つまり、バックグラウンドデータセットにおけるサポートがゼロである、EPは、「ジャンピング・エマージングパターン」あるいはJ−EPと呼ばれる(参照:例えば、リー他、「ジャンピング・エマージングパターンの空間とその漸増的な保守アルゴリズム」、Proceedings of 17th International Conference on Machine Learning、552-558 (2000)、ここに完全に参照されている)。本発明の好ましい具体例は、「ジャンピング・エマージングパターン」を用いる。代替的具体例は、高い成長率を持つ最も一般的なEP’sを用いる、しかし、それは、それらの抽出がJ−EPより複雑である理由により及びそれらは、J−EPより、よい結果を与えないという理由で、好ましさは低下する。しかしながら、J−EPが可能ではない場合、(つまり、すべてのパターンが両方のクラスで観測される場合)、他の高い成長率のEPを使う必要がある。 A special type of EP ’s can be found. As discussed elsewhere, an EP with an infinite growth rate (∞), ie zero support in the background dataset, is called a “jumping emerging pattern” or J-EP (see : Lee et al., “Jumping and Emerging Pattern Space and Its Incremental Maintenance Algorithm,” Proceedings of 17th International Conference on Machine Learning, 552-558 (2000), fully referenced here). A preferred embodiment of the present invention uses a “jumping emerging pattern”. Alternative embodiments use the most common EP's with high growth rates, but that is why they do not give better results than J-EP because of their complexity being more complicated than J-EP For this reason, preference is reduced. However, if J-EP is not possible (ie if all patterns are observed in both classes), other high growth rate EPs need to be used.
EPがEP’s「ホーム(home)」クラスあるいはそれ自身のクラスとしてゼロでない頻度を有する、クラスを参照することが普通である。EPがゼロあるいは著しく低い頻度を有する他のクラスは、EP’s「カウンターパート(counterpart)」クラスと呼ばれる。2個以上のクラスがある状況では、ホームクラスは、EPが最も高い頻度を有するクラスであると取りえる。 It is common for an EP to refer to a class that has a non-zero frequency as an EP's “home” class or its own class. Other classes where the EP has zero or significantly lower frequency are called EP's “counterpart” classes. In situations where there are more than two classes, the home class can be taken to be the class with the highest frequency of EPs.
加えるに、別の特別なタイプのEPは、「強いEP(strong EP)」として参照、その空でないサブセットの全てがまたEP’sであるサブセット・閉鎖特徴を満足するものである。一般的に、セットCの集合は、全てのセットX、(X∈C、つまり、XがCの要素(element)である)のアブセットの全てがまたCに属する場合のみ、サブセット・閉鎖を示す。もし、その要素の数(つまり、その基数)が少なくともkである全てのサブセットがまたEPであれば、EPは、「強いk−EP」と呼ばれる。強いEP’sの数は、少ないけれども、1個あるいはそれ以上の実例を訓練データに加えたとき、それらは他のEP’sよりも更に強い傾向(つまり、それらは有効のまま)があるので、強いEP’sは重要である。 In addition, another special type of EP is referred to as “strong EP”, which satisfies the subset closure feature, all of which are non-empty subsets are also EP's. In general, the set C is a subset / close only if all the sets X, all of the abset of X set (XεC, ie X is an element of C) also belong to C . If all subsets whose number of elements (ie, their radix) is at least k are also EPs, the EP is called a “strong k-EP”. Although the number of strong EP's is small, when they add one or more instances to the training data, they tend to be stronger than other EP's (ie, they remain valid), so strong EP's are is important.
EP’sの図式表現を図2に示す。成長率閾値ρおよび2個のデータセットD1とD2に対して、supp1(X)とsupp2(X)が、直行座標(デカルト座標)のそれぞれX軸とY軸上に表されることができる。座標面は、「サポート面」と呼ばれる。だから、横座標は、目的のデータセットD2内の全てのアイテムセットのサポートを計量する。また、グラフに示すものは、原点Aを通る傾き(1/ρ)の直線であり、そして直線supp2(X)=1とCで交わる。supp2(X)=1の横軸上の点は、Bとして記述される。D1からD2の全てのエマージングパターンは、ポイント(supp1(X)、supp2(X))によって表現される。その成長率がρに等しいかあるいは超える場合、それは、三角形ABCの内部あるいは周囲に位置しなければならない。ジャンピング・エマージングパターンは、図2の水平軸上に位置する。A schematic representation of EP's is shown in FIG. For the growth rate threshold ρ and the two data sets D1 and D2 , supp1 (X) and supp2 (X) are represented on the X and Y axes of Cartesian coordinates (Cartesian coordinates), respectively. be able to. The coordinate plane is called a “support plane”. So abscissa, weigh the support of all of the items set in the data set D2 purposes. Also, what is shown in the graph is a straight line with an inclination (1 / ρ) passing through the origin A, and the straight line supp2 (X) = 1 and C intersect. A point on the horizontal axis of supp2 (X) = 1 is described as B. All emerging patterns from D1 to D2 are represented by points (supp1 (X), supp2 (X)). If its growth rate is equal to or exceeds ρ, it must be located inside or around the triangle ABC. The jumping / emerging pattern is located on the horizontal axis of FIG.
境界及びプラトーエマージングパターン
2個のクラスのデータを分離する境界規則の特徴を探索することは、エマージングパターンの更に多くの様相(facet)に導く。多くのEP’sは、それらのホームのクラスで非常に低い頻度(例えば、1または2)を有する。境界EP’sは、2個のクラス間の大きな差異を捕らえる目的のために提案される。「境界(boundary)」EPは、その固有のサブセットの全てがEP’sでない、EPである。明らかに、パターンが含むアイテムが少ないほど、与えられたクラスのその発生頻度が大きい。しかしながら、境界EPの定義から、これがなされるとき、カウンターパートのその頻度は、ゼロにならない、あるいは、EPが閾値比ρの値をもはや満足しないような手段で増加する。これは、定義により常に真である。Boundary and plateau emerging patterns
Searching for features of boundary rules that separate two classes of data leads to more facets of emerging patterns. Many EP's have a very low frequency (
例えば、(ホームのクラスでゼロでない頻度、カウンターパートのクラスでゼロ頻度を有する)ジャンピング境界EPの場合にこれを見ると、そのサブパターンのどの1つもジャンピングEPではない。サブパターンは、ジャンピングEPではないので、それは、カウンターパートのクラスでゼロ頻度を持たなければならず、それ以外では、それは、またジャンピングEPであろう。ρ-EPの場合、ホームのクラス内のその頻度とカウンターパート内の頻度の比率は、ρより大きくなければならない。しかし、ρ-EPからアイテムを取り除くことは、両方のクラスのデータのより多くの実例にそれを満足させる、だから、比率ρは、もはや満足されえない、いくつかの状況の中にであってもそうであろう。従って、境界EP’sは、大きい頻度を持つことが出来きる境界EPのスーパーセットが無いので、それらホームのクラス内で最大頻度である。更に、上記で論じたように、しばしば、1個またはそれ以上のアイテムを存在する境界EPに加えた場合、結果としてのパターンは、最初のEPよりも小さい頻度になる。だから、境界EP’sは、それらが非-EP’sからEP’sを分離する特徴を有する。それらは、また低頻度のEP’sから高頻度のEP’sを識別する、だから、データのクラス間の大きい差異を捕らえるのに有用である。境界EP’sの効率的発見は、他に記載されている(参照:リー他、「ジャンピング・エマージングパターンの空間及びその漸増的な保守アルゴリズム」、Proceedings of 17th International Conference on Machine Learning、552-558、(2000))。 For example, in the case of a jumping boundary EP (which has a non-zero frequency in the home class and a zero frequency in the counterpart class), looking at this, none of the sub-patterns is a jumping EP. Since the sub-pattern is not a jumping EP, it must have zero frequency in the counterpart class, otherwise it will also be a jumping EP. In the case of ρ-EP, the ratio of its frequency in the home class to the frequency in the counterpart must be greater than ρ. However, removing the item from ρ-EP satisfies it with more instances of both classes of data, so the ratio ρ can no longer be satisfied and in some situations That would be the case. Therefore, the boundary EP's has the highest frequency in the home class because there is no superset of boundary EPs that can have a high frequency. Further, as discussed above, often when one or more items are added to an existing boundary EP, the resulting pattern will be less frequent than the first EP. So boundary EP's have the feature that they separate EP's from non-EP's. They also distinguish high frequency EP's from low frequency EP's, so they are useful for catching large differences between classes of data. Efficient discovery of boundary EP's has been described elsewhere (see: Lee et al., “Jumping and Emerging Pattern Space and Its Incremental Maintenance Algorithm”, Proceedings of 17th International Conference on Machine Learning, 552-558, ( 2000)).
先の例とは対照的に、更にもう一個のコンディション(アイテム)を境界EPに付加すると、それにより、EPのスーパーセットを発生し、スーパーセットEPは、ホームのクラス内の境界EPとしてまだ同じ頻度を有しているであろう。この特徴をもつEP’sは、「プラトーEP’s」と呼ばれる、そして次の手段で定義される:境界EPを与える、それ自身として同一頻度を有するそのスーパーセットの全てがその「プラトーEP’s」である。もちろん、境界EP’sは、通称それ自身のプラトーEP’sである。EPの頻度がゼロで無い限り、この特徴をもつスーパーセットEPは、また必然的にEPである。 In contrast to the previous example, adding one more condition (item) to the boundary EP, thereby generating a superset of EPs, which is still the same as the boundary EP in the home class Will have a frequency. EP's with this feature are called "plateau EP's" and are defined by the following means: all of its supersets that have the same frequency as themselves, giving a boundary EP, are "plateau EP's". Of course, the boundary EP's is commonly called its own plateau EP's. Unless the frequency of EP is zero, a superset EP with this feature is also necessarily an EP.
全体としてのプラトーEP’sは、空間(space)を定義するのに用いることが出来る。お互いとして同じ頻度を持つ全境界EP’sの全のプラトーEP’sは、「プラトー空間(plateau space)」(あるいは簡単にP-空間)と呼ばれる。だから、P-空間内の全EP’sは、それらホームのクラス及びそれらカウンターパートのクラスの双方のそれらの発生の区間内の同じ著しいレベルにある。ホームの頻度がnであるとすれば、P-空間は、「Pn-空間」と表記される。The plateau EP's as a whole can be used to define a space. All plateau EP's of all boundary EP's that have the same frequency as each other are called "plateau spaces" (or simply P-spaces). So all the EP's in P-space are at the same significant level in their occurrence interval in both their home class and their counterpart class. If the home frequency is n, the P-space is denoted as “Pn -space”.
全P-空間は、P空間が、その最も一般的で最も特定的な要素によって簡素に表現できることを意味する、「コンベキシテイ(凸状、convexity)」と呼ばれる。P-空間の最も特定的な要素は、EP’sを基礎とした分類システムの高い精度に寄与する。コンベキシテイは、あるタイプの大きな集合のデータの重要な特徴である、そして簡素にそのような集合を現すために利用することができる。もし集合が凸の空間であれば、「コンベキシテイ」は、成立するといえる。定義により、全てのパターンX、YおよびZに対して、コンデイションX⊆Y⊆Z 及びX, Z∈C がそのY∈Cを含むならば、パターンの集合Cは、「凸の空間」である。コンベキシテイに関する更なる考察は次の文献にある(グンター他、「バージョン空間の共通オーダーの理論的な構造及びATMS's」, Artificial Intelligence、95: 357-407、(1997))。 The total P-space is called “convexity”, which means that the P-space can be simply expressed by its most common and most specific elements. The most specific elements of P-space contribute to the high accuracy of EP's-based classification systems. Convexity is an important feature of certain types of large sets of data, and can be used to simply represent such sets. If the set is a convex space, it can be said that “convexity” is established. By definition, for all patterns X, Y and Z, if the condition X⊆Y⊆Z and X, Z∈C contains that Y∈C, then the set of patterns C is a `` convex space '' is there. Further discussion on convexity can be found in the following literature (Gunter et al., "Theoretical structure and ATMS's of common order in version space", Artificial Intelligence, 95: 357-407, (1997)).
P-空間の定理を次に示す:正の実例のセットDPと負の実例のセットDNを与える、全てのPn-空間(n≧1)は、凸の空間である。この定理の証明は、次である:定義により、Pn-空間は、同じホームのクラス内の同じ頻度nを有する全ての境界EP'sの全てのプラトーEP'sのセットである。一般性を失わないで、2個のパターンXとZが(i)X⊆Z;及び(ii) XとZが、Dp内でn個の発生を有する境界EP’sであることを仮定する、それから、X⊆Y⊆Zを満足する全てのパターンYに対して、それは、Dp内で同じn個の発生を有するプラトーEPである。これが理由である。The P-space theorem is as follows: All Pn -spaces (n ≧ 1) giving a set of positive examples DP and a set of negative examples DN are convex spaces. The proof of this theorem is: By definition, Pn -space is the set of all plateaus EP's of all boundaries EP's with the same frequency n in the same home class. Without loss of generality, assume that the two patterns X and Z are (i) X⊆Z; and (ii) X and Z are boundary EP's with n occurrences in Dp , Then, for every pattern Y that satisfies X⊆Y⊆Z, it is a plateau EP with the same n occurrences in Dp . This is the reason.
1.Xは、DNで発生しない、だから、XのスーパーセットYは、またDNで発生しない。1. X does not occur atDN , so superset Y of X does not occur atDN again.
2. パターンZは、Dpでn個の発生を有する、だからZのサブセットYはDpでゼロでない頻度を有する。2. Pattern Z has n occurrences at Dp , so the subset Y of Z has a non-zero frequency at Dp .
3. Dp内のYの頻度は、Xの頻度に等しいかそれより小さいに違いない、しかしZの頻度に等しいかそれより大きいに違いない。XとZの双方の頻度がnであるとき、Dp内のYの頻度はまたnである。3. The frequency of Y in Dp must be less than or equal to the frequency of X, but must be greater than or equal to the frequency of Z. When both the frequency of X and Z is n, the frequency of Y in the Dp is also a n.
4. Xは、境界EPのスーパーセットである、だから、Yは、X⊆Yとしてどこかの境界EPのスーパーセットである。 4. X is a superset of boundary EP, so Y is a superset of boundary EP somewhere as X⊆Y.
最初の2個のポイントから、YがDpのEPであることが推論できる。第三のポイントから、DP内のY’sの発生がnである。ゆえに、第四のポイントで、YはプラトーEPである。ゆえに、全てのPn-空間は、凸の空間であることが証明された。From the first two points, Y can be inferred to be an EP of Dp. From the third point, the occurrence of Y's in the DP is n. Hence, in the fourth point, Y is a plateau EP. Hence, all Pn -spaces proved to be convex spaces.
例えば、パッターン{a}、{a, b}、{a, c}、{a, d}、{a, b, c}および{a, b, d}は、凸の空間である。この空間の最も一般的要素からなるセットLは、{{a}}である。この空間の最も特定的要素からなるセットRは、{{a,b,c}、{a, b, d}}である。他の全ての要素は、LとRの間に有ると考えることができる。セットLは、境界EP’sから成る。これらEP’sは、P-空間の最も一般的要素である。通常、R内のパターンに含まれた機能は、L内のパターンより更に膨大な数である。これは、いくつかの機能グループがそれらの重要さを持ち続けながら拡大できることを示す。 For example, patterns {a}, {a, b}, {a, c}, {a, d}, {a, b, c} and {a, b, d} are convex spaces. The set L consisting of the most general elements of this space is {{a}}. The set R consisting of the most specific elements of this space is {{a, b, c}, {a, b, d}}. All other elements can be considered to be between L and R. Set L consists of boundaries EP's. These EP's are the most common elements of P-space. Usually, the number of functions included in the pattern in R is much larger than that in the pattern in L. This shows that several functional groups can expand while still having their importance.
プラトー空間の中央位置のパターンは、通常より面白い, 理由は、それら隣接パターン(中央パターンよりもアイテムが1個多いかあるいは少ない、空間のそれらパターン)は、全てEP'sである故。この状況は境界EP'sには生じない、理由は、それら特有のサブセットは、EP'sでない故。これらアイデアの全ては、プラトー空間の境界EP'sが最高頻度EP'sであるとき、特別に意味がある。 The pattern at the center of the plateau space is more interesting than usual, because the adjacent patterns (the one pattern with one or more items than the center pattern, those patterns in the space) are all EP's. This situation does not occur at boundary EP's because their unique subset is not EP's. All of these ideas are particularly meaningful when the plateau space boundary EP's is the highest frequency EP's.
好ましくは、全てのEP'sが、それらのホームのクラスからそれらのカウンターパートのクラスに同じ無限頻度の成長率を有することである。しかし、境界EPの全ての特有のサブセットは、それらが2個のクラスの双方に起きるが故に、有限の成長率を有する。これらサブセットが2個のクラス間のそれら頻度を変えるやり方は、それら成長率を研究することにより確かめることができる。 Preferably, all EP's have the same infinite growth rate from their home class to their counterpart class. However, all unique subsets of the boundary EP have a finite growth rate because they occur in both of the two classes. The way in which these subsets change their frequency between the two classes can be verified by studying their growth rate.
シャドウパターンは、すぐ隣接のサブセットである、つまり、境界EPよりアイテムが1個少ない、そのような特別な特徴を有するもの。境界EPの存在確率は、境界EPのシャドウパターンの試験により、おおまかに見積もることが出来る。シャドウパターンはすぐ隣接のサブセットであるというアイデアを基礎に、境界EP’sは、「妥当(reasonable)」と「逆の注目 (adversely interesting)」の2個のタイプに分類することができる。 A shadow pattern is an immediately adjacent subset, that is, has such special features that there is one less item than the boundary EP. The existence probability of the boundary EP can be roughly estimated by testing the shadow pattern of the boundary EP. Based on the idea that shadow patterns are immediately adjacent subsets, boundary EP's can be classified into two types: "reasonable" and "adversely interesting".
シャドウパターンは、境界EP’sの注目度を計測するために利用することができる。最も注目の境界EP’sは、高い発生頻度を有するそれらでしょう。しかし、また、「妥当」なそれら及び以下で論じるような「予期せぬ(unexpected)」それらを含むであろう。境界EPを与える、そのシャドウパターンの成長率が+∞あるいはρ-EP’sの場合のρに近づくならば、この境界EPの存在は、妥当である。これは、シャドウパターンが、EPそれ自身より認識がたやすい故である。だから、多くのシャドウパターンは、認識されうる、その場合、そのX自身がまた発生の高い頻度を持つことを推測することは、妥当である。それ以外で、シャドウパターンの成長率が、もし平均的に1あるいは2のような小さな数上であるならば、パターンXは、「逆の注目」である。これは、境界EPであるXの可能性が低いとき、その存在が「予期せぬ」であるからである。言い換えれば、もし多くのシャドウパターンが低頻度を有し、しかし、それらカウンターパート境界EPが高頻度を持ったならば、それは、驚くことであろう。 The shadow pattern can be used to measure the attention level of the boundary EP's. The most notable boundary EP's will be those with a high frequency of occurrence. However, it will also include those that are “reasonable” and those that are “unexpected” as discussed below. If the growth rate of the shadow pattern that gives the boundary EP approaches ρ in the case of + ∞ or ρ-EP's, the existence of this boundary EP is reasonable. This is because the shadow pattern is easier to recognize than the EP itself. So it is reasonable to infer that many shadow patterns can be recognized, in which case the X itself also has a high frequency of occurrence. Otherwise, if the growth rate of the shadow pattern is on average a small number such as 1 or 2, then pattern X is “opposite attention”. This is because when the possibility of the boundary EP X is low, its existence is “unexpected”. In other words, it will be surprising if many shadow patterns have a low frequency, but if their counterpart boundaries EP have a high frequency.
2個のクラスに対して、正と負、境界EP、Zは、正のクラスでゼロでない発生を持つと仮定する。{Z}∪AとしてZを表す、ここで、Xはアイテムであり、Aは空でないパターンである、AがZのすぐ隣のサブセットであることを観察する。定義により、パターンAは、正と負のクラスの双方でゼロでない発生を持つ。負のクラスのAの発生が小さい(1あるいは2)ならば、Zの存在は、妥当である。それ以外で、境界EP、Zは、逆の注目である。これは、以下ゆえである、
P (X, A) = P (A) * P (X | A)
ここで、P(pattern)は、「パターン」の確率、そして、それは、「パターン」の発生により近似できることを前提とする。負のクラスのP(A)が大きい場合、そのときは、負のクラスのP(X, A)もまた大きい。それから、境界EPになるパターンの機会 {X}∪A = Zは、小さい。従って、Zが確かに境界EPであれば、この結果は、逆の注目である。For two classes, suppose positive and negative, boundaries EP, Z have a non-zero occurrence in the positive class. Represent Z as {Z} ∪A, where X is an item, A is a non-empty pattern, and observe that A is a sub-adjacent subset of Z. By definition, pattern A has a non-zero occurrence in both positive and negative classes. If the occurrence of the negative class A is small (1 or 2), the presence of Z is reasonable. Otherwise, the boundaries EP, Z are the opposite attention. This is because:
P (X, A) = P (A) * P (X | A)
Here, it is assumed that P (pattern) is a probability of “pattern” and that it can be approximated by occurrence of “pattern”. If the negative class P (A) is large, then the negative class P (X, A) is also large. Then the pattern opportunity {X} ∪A = Z that becomes a boundary EP is small. Thus, if Z is indeed a boundary EP, this result is the opposite attention.
エマージングパターンは、双方ともが異なるデータセット間の相違を捕らえる意図である意味で、判別式規則(discriminant rules)にいくらか表面的に類似している。しかし、判別式規則はそうではないが、エマージングパターンは、ある成長率閾値を満足する、そして、判別式規則は、主にクラス間の高いサポートの比較対照に向けられるが、エマージングパターンは、低いサポート、クラス間の高成長率相違を発見することが可能である。 Emerging patterns are somewhat superficially similar to discriminant rules in the sense that both are intended to capture differences between different data sets. However, the discriminant rule is not, but the emerging pattern satisfies a certain growth rate threshold, and the discriminant rule is mainly directed to a high support comparison between classes, but the emerging pattern is low It is possible to find high growth rate differences between support and classes.
本発明の方法は、大きい成長率を有するJ-EP’s及び他のEP’sに適用できる。方法は、また、例えば、入力EP’sが2,3,4,5を超えるあるいは全ての他の数の最も一般的EP’sであるときに適用できる。しかし、そのような状況で、データセットからのEP’sの抽出に対するアルゴリズムは、J-EP’sに対する利用と異なる。J-EP’sに対しては、好ましい抽出アルゴリズムは次の中で与えられている、(リー他、「ジャンピング・エマージングパターンの空間とその漸増的な保守アルゴリズム」、Proc. 17th International Conference on Machine Learning、552-558 (2000)、その全ては、ここに参照されている。非・J-EP’sに対しては、好ましくは次に記載されるような、更に複雑なアルゴリズムが利用される、(ドン& リー:“エマージングパターンの効率的マイニング:傾向と差異の発見”、Proc. 5th ACM SIGKDD、International Conference on Knowledge Discovery & Data Mining、15-18、(1999))、その全ては、ここに参照されている。 The method of the present invention can be applied to J-EP's and other EP's having a large growth rate. The method can also be applied, for example, when the input EP's are over 2, 3, 4, 5 or all other numbers of the most common EP's. However, in such a situation, the algorithm for extracting EP's from the data set is different from the use for J-EP's. For J-EP's, the preferred extraction algorithm is given in (Lee et al., “Jumping and Emerging Pattern Space and its Incremental Maintenance Algorithm”, Proc. 17th International Conference on Machine Learning, 552-558 (2000), all of which are referenced here: For non-J-EP's, a more complex algorithm is preferably used, as described below (don & Lee: “Efficient Mining of Emerging Patterns: Finding Trends and Differences”, Proc. 5th ACM SIGKDD, International Conference on Knowledge Discovery & Data Mining, 15-18, (1999)), all of which are referenced here Yes.
尤度集合による予測(PCL)の概要
「尤度集合による予測」、PCL(Prediction by Collective Likelihood)分類アルゴリズムとして引用される、本発明の方法の概要は、図3から5に関連して提供される。図3に示す全体のアプローチにおいて、Dで表記されたデータセット126で始める、そして、しばしば「訓練データ」あるいは「訓練セット」あるいは「なまデータ」として参照されるデータセット126は、第1クラスD1128と 第2クラスD2130に分割される。第1クラスおよび第2クラスから、エマージングパターンとD1とD2のそれらそれぞれの発生頻度がステップ202で決定される。別々に、試験データ132のエマージングパターンとそれらそれぞれの発生頻度、Tで表記、また試験サンプルとして参照される、がステップ204で決定される。データセットからのエマージングパターンの抽出の方法は、ここで引用した文献に記載されている。D1とD2及びTのエマージングパターンの発生頻度から、D1あるいはD2にあるTの尤度集合予想の計算は、ステップ 206で達成される。これは、Tのクラスの予測208、つまり、TがD1あるいはD2に分類されるべきかどうか、に帰着する。Prediction by likelihood set (PCL) overview “Prediction by likelihood set”, cited as a PCL (Prediction by Collective Likelihood) classification algorithm, an overview of the method of the present invention is provided in connection with FIGS. The In the overall approach shown in FIG. 3, a
図4において、データセットDからエマージングパターンを得るプロセスは、DからクラスD1とD2を持って300で開始する、エントロピー分析などの技術が、ステップ302で、データセットDの属性に対して、カットポイント304を作成するために適用される。カットポイントは、クラス1、ステップ308及びクラス2、ステップ312に対してエマージングパターンを抽出するために用いられる、エマージングパターンの特徴を満足するための規準から、パターンの確認を許す。クラス1に対するエマージングパターンは、好ましくは、ステップ312で、D1内の頻度の昇順に並べ替えられ、そしてクラス2に対するエマージングパターンは、好ましくは、ステップ314で、D2内の頻度の昇順に並べ替えられる。In FIG. 4, the process of obtaining an emerging pattern from data set D starts at 300 with classes D1 and D2 from D, and techniques such as entropy analysis are performed on attributes of data set D at
図5において、固定数のエマージングパターンからスコアを計算する方法が、記述される。ステップ400で、kの数が選定される、そしてT内の頻度に従ってトップKエマーギングパターンが、ステップ402で選定される。スッテプ408で、またD1内で見出されるT内のトップkエマージングパターン上で、D1内の発生頻度を用いて404、スコアS1が計算される。同様に、スッテプ410で、またD2内で見出されるT内のトップkエマージングパターン上で、D2内の発生頻度を用いて406、スコアS2が計算される。S1とS2の値は、ステップ412で比較される。S1とS2の値が、互いに異なる場合、S1とS2の大きいものから416、ステップ414でTのクラスが推論される。In FIG. 5, a method for calculating a score from a fixed number of emerging patterns is described. In
図3から5で示しはしないが、本発明の方法とコンピュータプログラム製品内及び方法を達成するためのシステム上の実際の形式へのその変形は、以下に記述されるように3あるいはそれ以上のクラスのデータからなるデータセットに適用可能なことは明らかである。 Although not shown in FIGS. 3-5, the method and computer program product of the present invention and its variations to the actual form on the system for accomplishing the method may include three or more as described below. Obviously, it is applicable to datasets consisting of class data.
データの用意
ボリュームたっぷりのデータを分析することの主な挑戦は、属性あるいは機能の圧倒的な数である。例えば、遺伝子表現データにおいて、主な挑戦は、伴う膨大な数の遺伝子に伴うものである。いかに有益な機能を抽出するか、及びいかに雑音データ効果を避けるかが大量のデータの扱いにおいて重要な問題である。本発明の好ましい具体例は、離散化と機能選定を実行するために、それぞれ、エントロピー基礎の方法 (参照: U. フェヤド&K. イラニ、「分類学習用連続・値属性の多区間(multi-interval)離散化」、Proceedings of the 13th International Joint Conference on Artificial Intelligence、1022-1029、(1993) 及び R. カハビ、G. ジョン、R. ロング、D. マンリー及び K. プレジャー、「MLC++ : C++内の機械学習ライブラリー」、Tools with Artificial Intelligence、740-743、(1994))、及び、相関基礎の機能選定(「CFS(Correlation based Feature Selection)」)アルゴリズム(H. ウイッテン& E. フランク、データマイニング: ジャバ装備を有する実務的機械学習ツールと技術、Morgan Kaufmann、San Mateo、CA、(2000))を用いる。Data preparation The main challenge of analyzing generous data is the overwhelming number of attributes or functions. For example, in gene expression data, the main challenge is with the enormous number of genes involved. How to extract useful functions and how to avoid noise data effects are important issues in handling large amounts of data. Preferred embodiments of the present invention are respectively entropy-based methods (see U. Fayado & K. Irani, “Multi-interval for classification learning, multi-interval for performing discretization and function selection”). ) Discretization, "Proceedings of the 13th International Joint Conference on Artificial Intelligence, 1022-1029, (1993) and R. Kahabi, G. John, R. Long, D. Manly and K. Pleasure," MLC ++: Within C ++ Machine learning library ", Tools with Artificial Intelligence, 740-743, (1994)) and correlation-based function selection (" CFS (Correlation based Feature Selection) ") algorithm (H. Witten & E. Frank, data mining) : Using practical machine learning tools and techniques with Java equipment, Morgan Kaufmann, San Mateo, CA, (2000)).
多くのデータマイニングの仕事(task)は、離散化のために連続機能を必要とする。エントロピー基礎の離散化方法は、異なるクラスのラベルを持つランダム分布の値を含むそれら機能を無視する。それは、ほとんど同じクラスのポイントを含む大きな区間を有するそれら機能を見出す。CFS方法は、個々の機能にスコアを付ける(及びランク付け)よりは、むしろ離散化の後・プロセスである、方法は、離散化された機能のサブセットの価値にスコアを付ける(ランクを付ける)。 Many data mining tasks require a continuous function for discretization. Entropy-based discretization methods ignore those functions involving values of random distribution with different classes of labels. It finds those functions with large intervals that contain almost the same class of points. The CFS method is a post-discretization process rather than scoring (and ranking) individual functions. The method scores (ranks) the value of a subset of the discretized functions. .
従って、本発明の好ましい具体例において、エントロピー基礎の離散化方法が、実数値の範囲を離散化するために利用される。この方法の基本的なアイデアは、区間のエントロピーを最小にするように、実数値の範囲を多数のばらばらの区間に分割することである。この離散化プロセスにおけるカットポイントの選定は、きわめて重要である。最小エントロピーアイデアで、区間は、1個のクラスのデータからの値及び他のクラスのデータからの値間で「最大(maximally)」及び信頼的に差別的である。この方法は、双方のクラスのデータから比較的に一様に混ぜられた値を含むそれら範囲を自動的に無視する。だから、多くの雑音データ及び雑音パターンが効果的に削除でき、残りの差別的な機能の調査を許すことができる。これを説明するために、次のテーブルAに示す2個のクラスのラベルC1とC2を持つポイントの範囲の3つの可能な分布を考察する:
表A
Table A
全てのポイントがクラスのラベルに関係する実数の範囲に対して、ラベルの分布は、3つの主要な形状(shape)を有することができる、それは、(1)各々が同じクラスのポイントを含む広い重ならない範囲(2)少なくとも1つが同じクラスのポイントを含む広い重ならない範囲、(3)全体の範囲上でランダムに混合されたクラスのポイント。2個のクラス間の真ん中のポイント(中点)を用いて、エントロピー基礎の離散化方法(U. フェヤド&K. イラニ、1993)は、第1の場合の範囲を2個の区間に分割する。そのような分割のエントロピーは、0(ゼロ)である。範囲が少なくとも2個の区間に分割されるものは、「離散化」と呼ばれる。テーブルAの第2の場合、方法は、右側区間が可能な限り多くのC2ポイントを含むそして可能な限り少ないC1を含む、そのような手段で範囲を分割する。この目的は、エントロピーを最小にすることである。
テーブルAの第三の場合、双方のクラスからのポイントが全範囲上で分布する、方法は、機能を無視する、理由は範囲上の混合ポイントは、分類用の信頼性の高い規則を提供しない故である。For a real range where all points relate to a class label, the distribution of labels can have three main shapes: (1) a wide each containing the same class of points Non-overlapping range (2) Wide non-overlapping range where at least one contains points of the same class, (3) Class points randomly mixed over the entire range. Using the middle point between the two classes (midpoint), the entropy-based discretization method (U. Feyad & K. Irani, 1993) divides the range of the first case into two intervals. The entropy of such a division is 0 (zero). What the range is divided into at least two sections is called “discretization”. In the second case of Table A, the method divides the range in such a way that the right leg contains as many C2 points as possible and as few C1 as possible. The purpose is to minimize entropy.
In the third case of Table A, the points from both classes are distributed over the entire range, the method ignores the function, because the mixed points on the range do not provide reliable rules for classification That's why.
エントロピー基礎の離散化方法は、エントロピー最小化問題解決法(heuristic)を使用する離散化方法である。もちろん、全ての範囲のポイントは、それらの各々が同じクラスのポイントを含むように、ある数の区間に普通に分割できる。そのような分割のエントロピーは、0であるが、それらの適用範囲が非常に小さい時、区間(あるいは規則)は、役立たない。エントロピー基礎の方法は、区間の信頼性が高くして、それらが十分な適用範囲を有することを保証するために、繰り返し分割手順および、効果的分割停止規準を用いることによって、この問題を克服する。 The entropy-based discretization method is a discretization method that uses an entropy minimization problem heuristic. Of course, the entire range of points can usually be divided into a number of intervals so that each of them contains the same class of points. The entropy of such partitioning is 0, but intervals (or rules) are not useful when their coverage is very small. Entropy-based methods overcome this problem by using iterative splitting procedures and effective split stop criteria to ensure that the intervals are reliable and have sufficient coverage .
次に示す表示法を付加する(J. ダゥガーテイ、R. コハビ & M. サハミ、「連続機能の教師あり及び教師無し」、Proceedings of the 12th International Conference on Machine learning、94-202、(1995))、Tに、例のセットSをサブセットS1及びS2に分割させる。kクラスを、C1,…,Ckとし、P(Ci, Sj) をクラスCiを持つSj 内の例の割合とする。サブセットSj, j=1,2の「クラスエントロピー」は、次で定義される。
そのとき、分割の「クラス情報エントロピー」は、E(A, T; S)と表示され、次で与えられる。
At that time, the “class information entropy” of the division is displayed as E (A, T; S) and is given as follows.
Aに対する2進数離散化は、カットポイントの全候補間でE(A, T; S)が最小であるカットポイントTAを選ぶことで、決定される。同じプロセスは、何らかの停止規準に達するまで、繰り返し、S1及びS2に適用できる。The binary discretization forA is determined by selecting the cut point TA that has the smallest E (A, T; S) among all candidates for cut points. The same process until it reaches some stopping criterion, repeatedly, can be applied to S1 and S2.
「最長記述長原理」は、好ましくは、分割を止めるために用いられる。この技術に従い、S値のセット内の繰り返し分割は、次の場合にのみ、停止する:
この2進数離散化方法は、MLC++が装備されている、そして実行可能なコードは、次のWebページから利用可能である、http://www. sgi. com/tech /mlc /。遺伝子表現プロファイルに適用したとき、エントロピー基礎の選定方法は、非常に有効であるというということが見出される。例えば、一般的にデータセットに10%しかない遺伝子は、技術によって選定され、だから、そのような選定比率は、重要な分類規則を得るためのより容易なプラットフォームを提供する。 This binary digitization method is equipped with MLC ++, and executable code is available from the following web page, http://www.sgi.com/tech/mlc/. When applied to gene expression profiles, entropy-based selection methods are found to be very effective. For example, genes that are typically only 10% in the data set are selected by technology, so such selection ratios provide an easier platform for obtaining important classification rules.
エントロピー基礎の方法などの離散化方法は、顕著である、それは、自動的に大きいデータセットから機能の90%ほどを取り除く、これは、まだ1,000くらいもの機能がまだあることを意味するかもしれません。手でそれほど多くの機能を検査することはまだ退屈な仕事です。従って、本発明の好ましい具体例では、相関基礎の機能選定(CFS)法(ホール、相関基礎の機能選定機械学習、博士論文、 Department of Computer Science、University of waikato、Hamilton、New Zealand、(1998)と、H.ウイッテン& E.フランク、データマイニング: ジャバ装備を有する実務的機械学習ツールと技術、Morgan Kaufmann、San Mateo、CA、(2000)) 及び「チイ・スクワード」 (χ2) 法(H.リュー & R.セチオノ、「Chi2 : 機能選定と数値属性の離散化」、Proceedings of the IEEE 7thInternational Conference on Tools with Artificial Intelligence、 338-391、(1995))、ウイッテン&フランク2000)が、更に重要な機能の検索を狭めるのに用いられる。そのような方法は、離散化後、残りの機能の数が扱いにくくてもいつでも、採用することは好ましい。Discretization methods such as entropy based methods are prominent, it automatically removes as much as 90% of the functions from a large data set, which may mean that there are still as many as 1,000 functions Hmm. Testing so many functions by hand is still a tedious task. Accordingly, in a preferred embodiment of the present invention, the correlation-based function selection (CFS) method (Hall, correlation-based function selection machine learning, doctoral dissertation, Department of Computer Science, University of waikato, Hamilton, New Zealand, (1998) And H. Witten & E. Frank, Data Mining: Practical Machine Learning Tools and Techniques with Java Equipment, Morgan Kaufmann, San Mateo, CA, (2000)) and “Chi-Squad” (χ2 ) Method (H . Liu & R. Sechiono, "Chi2: discretization of the function selection and numericattributes", Proceedings of the IEEE 7 th International Conference on Tools with Artificial Intelligence, 338-391, the (1995)), Uitten & Frank 2000), It is also used to narrow down the search for important functions. Such a method is preferably employed anytime after discretization, even if the number of remaining functions is cumbersome.
CFS法では、むしろ個々の機能へのスコア付け(ランク付け)より、方法は、機能のサブセットの価値にスコアを付ける(ランクを付ける)。機能として、サブセット空間は、常に巨大である、CFSは、最良優先探索問題解決法を用いる。この問題解決法アルゴリズムは、良い機能サブセットが、まだ互いの相関はないが、高度にクラスと相関した機能を含んでいる、という信念で、それらの間の相互相関のレベルに従って、クラスを予測するために個々の機能の有用性を勘定に入れる。CFSは、訓練データから、最初、機能―クラス行列及び機能―機能相関を計算する。そして、問題解決法により割り当てられたサブセット機能のスコアは、次で定義される:
χ2(「チイ・スクアード」)法は、機能選定への他のアプローチである。それは、クラスに関してチイ・スクアード(χ2)統計を計測することで、個別に属性(機能を含む)を評価するために使われる。数値属性に対して、方法は、まず、離散化すべきその範囲に数個の区間を必要とする、例えば、上記記載のエントロピー基礎の離散化方法を用いる。属性の値χ2は、次で定義される:
離散化と選定の論議は、互いに分離されているが、離散化方法は、また選定に役割をはたす、理由は、1個の区間に離散化された全ての機能は、選定を達成する際に、無視出来るからである、このことは留意すべきである。研究分野に依存して、エマージングパターンは、つまりCFS方法により得られた全ての機能を用いて、あるいは、これらがおびただしい数と証明されれば、方法によってトップにランク付けされた選定機能を用いて、得ることが出来る。好ましい具体例では、20個の選定された機能が用いられる。他の具体例では、トップ10、25、30、50あるいは100個の選定された機能、あるいは、0から100の間の全ての他の便利な数が用いられる。記載されたやりかたや適当な方法で、100個以上の機能が、また用いられることは、理解されるべきである。 The discussion of discretization and selection is separated from each other, but the discretization method also plays a role in selection, because all functions discretized in one interval are responsible for achieving selection. This should be noted because it can be ignored. Depending on the field of study, the emerging pattern can be used with all the functions obtained by the CFS method, or with the selection function ranked at the top by the method if these prove to be numerous. , You can get. In the preferred embodiment, 20 selected functions are used. In other embodiments, the top 10, 25, 30, 50 or 100 selected functions, or all other convenient numbers between 0 and 100, are used. It should be understood that more than 100 functions can also be used in the manner described and in an appropriate manner.
エマージングパターンの発生
データベースから強いエマージングパターンの効率的マイニングの問題は、アプリオリ (アグラワル&スリカン、「マイニングアソシエーション規則のための高速アルゴリズム」、Proceedings of the 20th International Conference on Very Large Data Bases、487-499、 (サンチアゴ、チリ、1994))及び MAX-MINER(バヤルド、「データベースからのロングパターンの効率的マイニング」、Proceedings of the 1998 ACM- SIGMOD International Conference on Management of Data、85-93、(ACM出版、1998)) 両方とも個々に完全に参照されている、などのようにマイニング頻度アイテムセットの問題に何らかの類似がある。しかしながら、一般的に、EP’sの効率的マイニングは、2つの主な理由により、挑戦的な問題である。第1は、アプリオリ特徴、つまり、長いパターンがしばしば発生するために、そのサブパターンの全てが、また、しばしば発生しなければならないので、もはやEP’sを保持しない、そして第2は、高いデイメンジョンのデータベースあるいは0.5%のような低いサポート閾値に対する大きな数のEP’s候補は、常にある。本発明と結合して用いて好ましいEP’s決定の効率的な方法は、ドン& リー:「エマージングパターンの効率的マイニング:傾向と差異の発見」、ACM SIGKDD、International Conference on Knowledge Discovery and Data Mining, San Diego, 43-52 (1999年8月)に記載されている、これは、ここで完全に参照されている。Emerging pattern generation The problem of efficient mining of strong emerging patterns from the database is a priori (Agrawal & Srikan, “Fast Algorithms for Mining Association Rules”, Proceedings of the 20th International Conference on Very Large Data Bases, 487-499, (Santiago, Chile, 1994)) and MAX-MINER (Bajardo, `` Efficient mining of long patterns from databases '', Proceedings of the 1998 ACM- SIGMOD International Conference on Management of Data, 85-93, (ACM Publishing, 1998 )) There is some similarity to the problem of mining frequency itemsets, such as both are fully referenced individually. However, in general, efficient mining of EP's is a challenging problem for two main reasons. First, since a priori features, that is, long patterns often occur, all of its sub-patterns must also occur, so they no longer hold EP's, and second, high dimensions There is always a large number of EP's candidates for a low support threshold such as 0.5% database. An efficient method of determining EP's preferred to be used in conjunction with the present invention is Don & Lee: “Efficient mining of emerging patterns: finding trends and differences”, ACM SIGKDD, International Conference on Knowledge Discovery and Data Mining, San Diego, 43-52 (August 1999), which is hereby fully referenced.
伴う挑戦を説明するために、データセットD1からD2でEP'sを発見するためにナイーブアプローチを考察する:最初に、全ての可能なアイテムに対して、D1およびD2双方のサポートを計算する、それから、各々のアイテムセットの成長率が、与えた閾値に等しいかあるいは大きいかどうかの確認に着手する。関係は次で記述される、つまり、3つの分類的属性、例えば、色(color)、形(shape)及び大きさ(size)、ここで、各々の属性は、アイテムセット2個の可能な値を持つ、アイテムセットの可能な数の総和は、26である、つまり、
この問題を解決するために、(a)それら簡素な境界(最小のペアセットで、集合内の最大のアイテムセット)を用いて、アイテムセットの大きな集合の記述をすすめることが好ましい、(b)EPマイニング アルゴリズムは、それが、集合の境界のみで操作する(特に、多・境界・差分 アルゴリズムを用いて)、及びそれが境界を用いて発見したEP’sを表す、ように設計される。
制約を満足する全てのEP'sは、効率的に、MAX-MINER(参照:バヤルド、「データベースからのロングパターンの効率的マイニング」、Proceedings of the 1998 ACM- SIGMOD International Conference on Management of Data、85-93、(ACM出版、1998)) などのプログラムによって得られた、入力としての大きいアイテムセットの境界を取る、境界基礎のアルゴリズム、により発見できる。To solve this problem, it is preferable to (a) describe a large set of itemsets using these simple boundaries (the smallest pairset and the largest itemset in the set), (b) The EP mining algorithm is designed so that it operates only on the boundary of the set (especially using the multi-boundary-difference algorithm) and represents the EP's it finds using the boundary.
All EP's that satisfy the constraints are effectively MAX-MINER (see: Bayard, “Efficient mining of long patterns from databases”, Proceedings of the 1998 ACM-SIGMOD International Conference on Management of Data, 85-93. , (ACM Publishing, 1998)), etc., which can be found by boundary-based algorithms that bound large item sets as input.
マイニングEP’sの方法は、技術の1つとして取り付きやすい。本発明を有する使用に適したマイニングEP’sの好ましい方法の特別な記述は、「エマージングパターンの効率的マイニング:傾向と差異の発見」、ACM SIGKDD、International Conference on Knowledge Discovery and Data Mining, San Diego、43-52、(1999年8月)と「ジャンピング・エマージングパターンの空間及びその漸増的な保守アルゴリズム」、Proceedings of 17th International Conference on Machine Learning、552-558、(2000年) の中に見出される、尚、双方とも、ここで完全に参照されている。 The mining EP's method is easy to attach as one of the technologies. A special description of a preferred method of mining EP's suitable for use with the present invention is “Efficient mining of emerging patterns: finding trends and differences”, ACM SIGKDD, International Conference on Knowledge Discovery and Data Mining, San Diego, 43 -52, (August 1999) and “Jumping and Emerging Pattern Space and its Incremental Maintenance Algorithm”, Proceedings of 17th International Conference on Machine Learning, 552-558, (2000), Both are fully referenced here.
分類におけるEP’sの利用:尤度集合による予測(PCL)
しばしば、境界EP’sの数は、大きい。そのようなパターンのランキングと視覚化は、重要な問題である。本発明の方法に従えば、境界EP’sはランク付けされる。特に、本発明の方法は、分類に対してトップ・ランクの頻度を用いる。トップ・ランクパターンは、ユーザがアプリケーションをより良く、より簡単に理解することを助けることができる。Use of EP's in classification: Prediction with likelihood sets (PCL)
Often the number of boundary EP's is large. Ranking and visualization of such patterns is an important issue. According to the method of the present invention, the boundary EP's are ranked. In particular, the method of the present invention uses the top rank frequency for classification. Top rank patterns can help users to better and easier understand the application.
境界EP’sを含むEP’sは、次の方法でランク付けされうる。 The EP's that contain the boundary EP's can be ranked in the following manner.
1.2個のEP’s Xi と Xj を与える、もし、Xiの頻度がXjのそれより大きければ、リスト中で、XiがXjより高い優先度とする。Give the 1.2 one of the EP's Xi and Xj, if the frequency of the Xi is greater than that of the Xj, in the list, Xi is a higher priority than Xj.
2.Xiの頻度がXjの頻度と同じであるとき、もし、Xiの基数がXjのそれより大きければ、リスト中で、XiがXjより高い優先度とする。2. When the frequency of Xi is the same as the frequency of Xj , if the radix of Xi is greater than that of Xj , then Xi has a higher priority than Xj in the list.
3.XiとXjの頻度及び基数の双方が同じであれば、XiがXjに優先し、そしてEP’sを印刷・表示するコンピュータシステムあるいは方法によって、最初にXiが作成される。3. If both the frequency and radix of Xi and Xj are the same, Xi takes precedence over Xj and Xi is first created by a computer system or method that prints and displays EP's.
実務において、試験サンプルは、それ自信のクラスからのEP’sだけでなく、カウンタ−パートのクラスからのEP’sも含む。これは、予測をより複雑にする。試験サンプルは、それ自信のクラスからの多くのトップ・ランクのEP’sを含むべきである、そしてカウンタ−パートのクラスからの好ましくは・数個の低い・ランク・でない・EP’sを含むのが好ましい。しかし、多種・広範囲のデータでの経験から、試験サンプルは、しばしば、まれではあるが、カウンタ−パートのクラスからの約1から約20個のトップ・ランクのEP’sを含むことが出来る。信頼性の有る予測を作るために、カウンタ−パートEP’sからの混乱信号を避けるためにホームのクラス内の高い頻度である多重(multiple)EP’sを用いることは妥当である。 In practice, a test sample includes not only EP's from its confident class, but also EP's from the counter-part class. This makes the prediction more complex. The test sample should contain a number of top-ranked EP's from the class of confidence, and preferably contains a few low-rank non-EP's from the counter-part class. However, from experience with a wide variety of data, test samples can often contain from about 1 to about 20 top rank EP's from the counter-part class, although rare. In order to make a reliable prediction, it is reasonable to use multiple EP's that are high in frequency within the home class to avoid confusion signals from the counter-part EP's.
好ましい予測方法は、次のように、2個のクラスのデータを含む試験サンプルTと境界EP’sのために実証される。少なくとも第1クラスのデータの1個の実例と少なくとも第2クラスのデータの1個の実例を持つ訓練データセットDを考察する、そして、Dを2個のデータセットD1およびD2に分割する。D1とD2から複数の境界EP’sを抽出する。D1のランクn1の境界EP’sは、それらの頻度の降順に、{EP1(i), i = 1, . . . n1 }として示され、そして、各々が、D1でのゼロでない(non-zero)発生を有する。同様に、D2のランクn2の境界EP’sは、また、それらの頻度の降順に、{EP2(j), j = 1, . . . n2 }として示され、そして、各々が、D2でのゼロでない(non-zero)発生を有する。境界EP’sのこれらセットの双方は、リスト形式に簡単に蓄積されうる。D1のi番目のEPの頻度は、f1(i) で示し、D2のj番目のEPの頻度は、f2(j) で示す。双方のリスト内のEP’sは、もし望めば、頻度の昇順に蓄積されうることは、また、理解されよう。A preferred prediction method is demonstrated for a test sample T and boundary EP's containing two classes of data as follows. Consider a training data set D having at least one instance of first class data and at least one instance of second class data, and split D intotwo data sets D1 and D2 . From D1 andD 2 extracts a plurality of boundary EP's. The boundary EP's of rank n1 of D1 are denoted as {EP1 (i), i = 1,... N1 } in descending order of their frequency, and each is not zero at D1 (Non-zero) occurrence. Similarly, D2 rank n2 boundary EP's is also denoted as {EP2 (j), j = 1,... N2 } in descending order of their frequency, and each is represented by D having a non-zero at2 (non-zero) occurs. Both of these sets of boundary EP's can easily be stored in list form. The frequency of the i-th EP of D1 is denoted by f1 (i), and the frequency of the j-th EP of D2 is denoted by f2 (j). It will also be appreciated that the EP's in both lists can be accumulated in ascending order of frequency if desired.
Tが、D1の次のEP’sを含むと仮定する、それは、境界EP’sでありえる:
{EP1(i1), EP1(i2), . . . . , EP1(ix) }
ここで、i1<i2<. . . .<ix≦n1 及び x≦n1。 また、Tが、D2の次のEP’sを含むと仮定する、それは、境界EP’sでありえる:
{EP2(j1), EP2(j2), . . . . , EP2(jy) }
ここで、j1<j2<. . . .<jy≦n2 及び y≦n2。実務において、第三リスト及び第四リストを作成することが便利である、ここで、第三リストは、f3(m)で示される、ここで、m番目のアイテムは、また試験データに発生し、そしてD1内でゼロでない発生を有する複数のエマージングパターンimから各々のエマージングパターンの第1クラスのデータ内に、発生頻度f1(im)を含む、そして、ここで、第四リストは、f4(m)で示される、ここで、m番目のアイテムは、また試験データに発生し、そしてD2内でゼロでない発生を有する複数のエマージングパターンimから各々のエマージングパターンの第1クラスのデータ内に、発生頻度f2(jm)を含む。だから、第三リストのエマージングパターンは、D1内のそれらそれぞれの発生頻度の降順に並べられる、そして同様に、第四リストのエマージングパターンは、D2内のそれらそれぞれの発生頻度の降順に並べられる、ことが好ましい。T is assumed to include the following EP's of D1, it can be a boundary EP's:
{EP1 (i1 ), EP1 (i2 ),..., EP1 (ix )}
Here, i1 <i2 <... <Ix ≦ n1 and x ≦ n1 . Also, T is assumed to include the following EP's of D2, it can be a boundary EP's:
{EP2 (j1 ), EP2 (j2 ),..., EP2 (jy )}
Here, j1 <j2 <... <Jy ≦ n2 and y ≦ n2 . In practice, it is convenient to create a third list and a fourth list, where the third list is denoted by f3 (m), where the m th item also occurs in the test data and, and in a first class of data for each emerging patterns from a plurality of emerging patterns im with generating non-zero in the D1, including frequency f1 of the(im), and wherein the fourth list is represented by f 4(m), where, m-th item, also occurs in the test data, and each of the emerging pattern from a plurality of emerging patterns im with generating non-zero in the D2 The occurrence frequency f2 (jm ) is included in the first class data. So, emerging pattern of the third list are ordered in decreasing order of the respective frequency thereof in D1, and similarly, emerging pattern of the fourth list in descending order of the respective frequency thereof in D2 It is preferable that
次のステップは、Tのクラスのラベルを予測するために2個のスコアを計算する、ここで、各々のスコア(score)は、2個のクラスの1つに対応する。D1とD2のkトップ・ランクEP’sが使われると仮定する。そうすると、D1クラスのTのスコアは、次で定義される。
もし、score(T)_D1 > score (T)_D2 であれば、サンプルTは、クラスD1にあると予測される。
それ以外で、Tは、クラスD2にあると予測される。もし、score(T)_D1 = score (T)_D2であれば、D1とD2のサイズが、好ましくは、決着をつけるために利用される、つまり、TがD1とD2の大きいほうに割り当てられる。もちろん、T内の最高発生頻度のEP’sは、D1とD2のどちらにおいてもトップ・ランクEP’sと同じである必要はない。If score (T) _D1 > score (T) _D2 , the sample T is predicted to be in class D1 .
Otherwise, T is, is expected to be in Class D2. If score (T) _D1 = score (T) _D2 , then the sizes of D1 and D2 are preferably used for settlement, ie T is D1 and D2 Assigned to the larger one. Of course, EP's of the highest frequency of occurrence of the T is, need not be the same as the top-ranked EP's in both the D1 and D2.
score(T)_D1 > score (T)_D2 は、双方とも商の総和であることに留意。もし、与えたクラスのトップi EP’sの各々が、T内で見出されば、i番目の商の値は、ただ1.0であるかもしれない。Note that score (T) _D1 > score (T) _D2 is the sum of both quotients. If each of the top i EP's of a given class is found in T, the value of the i th quotient may only be 1.0.
一般的に、kは、エマージングパターンの総数より本質的に少なく選ばれた数、つまり、kは普通、k≪n1 とk≪n2のどちらかより更に少ないけれども、特に好ましいkの値は、20である。他のkの適当な値は、5、10、15、25、30、50及び100である。一般的に、好ましいkの値は、約5から約50の間にある。In general, k is a number that is selected to be essentially less than the total number of emerging patterns, ie, k is usually less than either k << n1 or k << n2 , but a particularly preferred value for k is , 20. Other suitable values for k are 5, 10, 15, 25, 30, 50 and 100. In general, preferred values of k are between about 5 and about 50.
代わりの具体例において、それぞれD1とD2のエマージングパターンn1とn2があるところで、kは、n1とn2のどちらかがより小さい固定比率に選ばれる。更に別の代わりの具体例では、kは、n1とn2の合計あるいはn1とn2の1つの固定比率に選ばれる。そのような具体例では、好ましい固定比率は、1%から5%の範囲である、そしてkは、kに対する固定比率が整数にならない場合において、最も近い整数値に丸められる。In an alternative embodiment, where there are emerging patterns n1 and n2 for D1 and D2 respectively, k is chosen to be a fixed ratio with either n1 or n2 being smaller. In yet another alternative embodiment, k is chosen to one fixed ratio of n1 and the sum or n1 and n2 of n2. In such embodiments, the preferred fixed ratio is in the range of 1% to 5%, and k is rounded to the nearest integer value when the fixed ratio to k is not an integer.
上記に記載したスコアの計算方法は、マルチ・クラスデータの並列分類に一般化しうる。例えば、それは、他のサブタイプの全てから1つのサブタイプ区別するためのマルチ・遺伝子判別器やランク付けされた遺伝子リストの発見のために、特に有用である。そのような区別は、規則がそれ以下の残りのサブセットに対して1個のサブセットに基づいて表現されるので区別がローカル(局所)である階級的なツリー分類戦略とは対照的に、全部に対する1つであるので「グローバル(広範囲)」である。 The score calculation method described above can be generalized to parallel classification of multi-class data. For example, it is particularly useful for the discovery of multi-gene discriminators and ranked gene lists to distinguish one subtype from all other subtypes. Such a distinction is for all, as opposed to a hierarchical tree classification strategy where the distinction is local because the rules are expressed on the basis of one subset relative to the remaining subsets below it. Because it is one, it is “global”.
cクラスのデータ、(c > 2) があり、D1, D2, . . . Dc で示されると仮定する。最初に、本発明の一般化された方法が、cグループのEP’sを発見する、そこで、n番目のグループ(1<n≦c)が、Dn対(∪i≠n Di)に対してである。機能選定と離散化は、典型的な2個のクラスデータを扱った同じ方法で達成しうる。例えば、Dnのランク付けされたEP’sは、
{EPn(i1), EPn(i2), . . . . , EPn(ix)}
で示され、そして、頻度の降順にリストされることが出来る。Suppose that there is c-class data, (c> 2), denoted by D1 , D2 ,... Dc . First, the generalized method of the present invention finds c's EP's, where the n th group (1 <n ≦ c) is for Dn pairs (∪i ≠ n Di ) It is. Function selection and discretization can be accomplished in the same way dealing with two typical class data. For example, Dn's ranked EP's
{EPn (i1 ), EPn (i2 ),..., EPn (ix )}
And can be listed in descending order of frequency.
次に、一対のスコアの代わりに、cスコアがTのクラスのラベルを予想するために計算できる。それは、クラスDn内のスコアTは、次の式で表される。
本発明の方法の根底にある原理は、与えられたクラスのトップK EP’sからTに含まれたトップK EP’sがどれほど離れているかを計測するものである。1個以上のトップ・ランクEP’sを使うことで、更に信頼性のある尤度「集合」が用いられる。従って、この方法は、尤度集合による予測(「PCL(prediction by collective likelihood)」)と呼ばれる。 The principle underlying the method of the present invention is to measure how far the top K EP's contained in T are from a given class of top K EP's. By using one or more top rank EP's, a more reliable likelihood "set" is used. Therefore, this method is called prediction by likelihood set (“PCL (prediction by collective likelihood)”).
k=1の場合、score(T)_D1は、Tに含まれた第1ランクのEPが、D1の最高発生頻度EPから離れているかどうかを示す。この状況で、score(T)_D1が、その最大値1を持てば、そのとき、「距離(distance)」は非常に近い、つまり、D1の最も共通の特徴は、また試験サンプルにある。スコアが小さいことは、距離が大きいことを示す、だから、TがD1のクラスに属することが、よりありそうでなくなる。一般的に、それぞれのk トップ・ランクEP’sがTにある場合、score(T)_D1あるいはscore(T)_D2は、その最大値kを取る。When k = 1, score (T) _D1 indicates whether the first rank EP included in T is far from the highest occurrence frequency EP of D1 . In this situation, if score (T) _D1 has its
本発明の方法は、一般的に以下のエマージングパターンで達成される、ただ限定はされないが;境界エマージングパターン、左側境界エマージングパターンのみ、プラトーエマージングパターン、最も特定的プラトーエマージングパターンのみ、及び成長率が閾値ρより大きいエマージングパターン、ここでは、閾値は1より大きい全ての数、好ましくは2あるいは∞(ジャンピングEPでのように)あるいは2から10の数。 The method of the present invention is generally achieved with the following emerging patterns, but not limited to: boundary emerging patterns, left boundary emerging patterns only, plateau emerging patterns, most specific plateau emerging patterns only, and growth rates An emerging pattern greater than the threshold ρ, where the threshold is any number greater than 1, preferably 2 or ∞ (as in jumping EP) or a number between 2 and 10.
本発明の代わりの具体例では、プラトー空間(P-空間、上記に記載)が分類に利用され得る。特に、P-空間の最も特定の要素が利用される。PCLにおいて、ランク付けされた境界EP’sは、データセット内の全P-空間の最も特定的要素で置き換えられる、そして上記記載のPCLの他のステップで、達成される。 In an alternative embodiment of the present invention, a plateau space (P-space, described above) can be used for classification. In particular, the most specific element of P-space is used. In PCL, the ranked boundaries EP's are replaced with the most specific elements of the total P-space in the data set and are achieved in other steps of the PCL described above.
この具体例の有効性に対する理由は、P-空間の最も特定的要素の近隣は、ほとんどの場合で全てEP’sである。しかし、EP’sではない境界EP’sの隣接で多くのパターンがある。二番目は、P-空間の最も特定的要素に含まれたコンデイションは、通常、境界EP’sより更に多い。だから、コンデイション数が大きいほど、反対のクラスからEP’sを含む試験サンプルに対しての機会はより低い。それ故、正しく分類される確率は、高くなる。 The reason for the effectiveness of this example is that the most specific elements of the P-space are almost always EP's. However, there are many patterns adjacent to the boundary EP's that are not EP's. Second, the conditions contained in the most specific elements of P-space are usually more than the boundary EP's. Thus, the greater the number of conditions, the lower the opportunity for test samples containing EP's from the opposite class. Therefore, the probability of being correctly classified increases.
分類においてのEP’sを用いる他の方法
PCLは、分類においてのEP’sを用いる方法のみではない。同じく信頼性が高くそして健全な結果を与える他の方法が現在の発明の目的と一致し、ここに述べられる。Other methods of using EP's in classification
PCL is not only a method that uses EP's in classification. Other methods that also provide reliable and sound results are consistent with the objectives of the present invention and are described herein.
従って、与えた試験実例を、Tで示す、そして、それは訓練データDに対応する、Tのクラスを予測するための第2方法は、次のスッテプから成る、ここで、表示法と用語が制限にならないように解釈する。 Thus, the given test example is denoted by T, which corresponds to the training data D, the second method for predicting the class of T consists of the following steps, where the notation and terminology are limited It is interpreted not to become.
1.Dを2個のサブデータセットに分ける、それらをD1とD2と表示し、それぞれは、2個のクラスの1つからなる、そして、空リスト、ファイナルEP’s (finalEP’s)、を作成する。1. Divide D into two sub-data sets, labeled D1 and D2 , each consisting of one of two classes and creating an empty list, final EP's (finalEP's).
2.D1のEP’sを発見、同様に、D2のEP’sを発見する。2. Discovering EP's of D1, likewise, to discover the EP's of D2.
3.頻度と長さ(パターンのアイテム数)に応じて、EP’s(D1とD2双方から)を降順に並べる。ランク付けの規準は、以下である、
(a) 2個のEP’s、Xi とXj を与える、もし、XiがXjより大きければ、そのとき、Xiは、リスト内でXjに優先する。
(b) Xi とXjの頻度が同一の時、もし、XiがXjより大きければ、そのとき、Xiは、リスト内でXjに優先する。
(c) それらの頻度と長さが同一の時、2個のパターンは、同等に扱われる。ランク付けされたEPリストは、オーダーEP’s (ordered EP’s) として表示される。3. Depending on the frequency and length (number of items of the pattern), arranged EP's and (D1 and D2 from both) in descending order. The ranking criteria are:
(a) Give two EP's, Xi and Xj , if Xi is greater than Xj , then Xi takes precedence over Xj in the list.
(b) When the frequency of Xi and Xj is the same, if Xi is greater than Xj , then Xi takes precedence over Xj in the list.
(c) When the frequency and length are the same, the two patterns are treated equally. The ranked EP list is displayed as ordered EP's (ordered EP's).
4. オーダーEP’sの最初のEPをファイナルEP’s に入れる。 4. Place the first EP of the order EP's into the final EP's.
5.もし、最初のEPがD1(あるいはD2)からであれば、新しいD1(あるいは新しいD2)を設定する、それは、最初のEP を含まないD1(あるいはD2)のそれら実例からなる。5. If any first EP from D1 (or D2), to set a new D1 (or a new D2), which, from their examples of D1 (or D2) that it does not include the first EP Become.
6.新しいD1あるいは新しいD2が空になるまで、ステップ2からステップ5を繰り返す。6). Until the new D1 or a new D2 is empty, repeat Step 2 through Step 5.
7.Tに含まれた、あるいはすぐ隣の特有のEPのサブセットの1つがTに含まれたファイナルEP’s内の最初のEPを見出す。もし、EPが、第1クラスからであれば、試験実例は、第1クラスとして予想される。それ以外では、試験実例は、第2クラスとして予想される。 7). Find the first EP in the final EP's that is included in T or one of a subset of unique EPs immediately adjacent to it. If the EP is from the first class, the test instance is expected as the first class. Otherwise, test examples are expected as the second class.
第三の方法によれば、システムが更に精度よく作られるかどうかを確かめるために強いEP’sが使われ、模範的なステップは以下の通りである、 According to the third method, strong EP's are used to see if the system can be made more accurate, the exemplary steps are as follows:
1.Dを2個のサブデータセットに分ける、それらをD1とD2と表示し、それらは、それぞれ第1と第2クラスから成る。1. Divide D into two sub-data sets, labeled D1 and D2, which consist of first and second classes, respectively.
2.D1内で強いEP’sを発見、同様にD2内で強いEP’sを発見する。2. They discovered strong EP's in the D1, likewise discover strong EP's in the D2.
3.頻度に応じて、各々の2個のEP’sのリストを降順に並べ替える。D1とD2内の強いEP’s対して、それぞれ、オーダーEPs1とオーダーEPs2としてオーダーEPリストを表示する。3. Depending on the frequency, the list of each two EP's is sorted in descending order. For strong EP's within the D1 and D2, respectively, to display the order EP list as an order EPs1 and order EPs2.
4.それらが必ずTに含まれるように、オーダーEPs1から、トップk EP’s を見出す、そしてそれらを EP1(1), . . . . ,EP1(k) として表示する。同様に、それらが必ずTに含まれるように、オーダーEPs2から、トップk EP’s を見出す、そしてそれらを EP2(1), . . . . ,EP2(j)として表示する。4). Find the top k EP's from the order EPs1 so that they are always included in T, and display them as EP1 (1),..., EP1 (k). Similarly, find top k EP's from order EPs2 so that they are always included in T, and display them as EP2 (1),..., EP2 (j).
5.EP1(1)の頻度とEP2(1)の頻度を比較する、そして、もし前のものが大きければ、試験実例は、第1クラスのデータと予測される。それ以外では、もし後のものが大きければ、試験実例は、第2クラスのデータと予測される。同点状況は強い2-EP’s、つまり、その成長率が2より大きいEP’s、を用いることで壊される。5. Compare the frequency of EP1 (1) with the frequency of EP2 (1), and if the previous one is large, the test instance is predicted as the first class of data. Otherwise, if the later one is large, the test instance is predicted as second class data. The tie situation is broken by using strong 2-EP's, that is, EP's whose growth rate is greater than 2.
分類におけるEP’sの有用性の評価
エマージングパターンの有用性は、「リーフ・ワン・アウト・クロスバリデーション」(LOOCV)分類研究の実施により試験することが出来る。LOOCVでは、データセットの最初の実例は、試験実例としてみなされ、残りの実例は、訓練データとして扱われる。最初の実例から最後の1つまで、この手順を繰り返す、それは、精度、つまり、正しく予想された実例のパーセント、を評価可能である。精度評価の他の方法は、従来技術の1つとして知られており、本発明の方法と互換性がある。Evaluating the usefulness of EP's in classification The usefulness of emerging patterns can be tested by conducting a “Leaf One Out Cross Validation” (LOOCV) classification study. In LOOCV, the first example of the data set is considered as a test example and the remaining examples are treated as training data. This procedure is repeated from the first instance to the last one, which can evaluate the accuracy, i.e. the percentage of correctly expected instances. Another method of accuracy evaluation is known as one of the prior art and is compatible with the method of the present invention.
本発明の実践は、今、数個の例によって示される。これらの例が、どのような形でも、現在の発明の範囲を制限するものではなく、単に代表的な具体例を示すだけであり、技術の1つとして理解されるべきである。 The practice of the present invention is now illustrated by a few examples. These examples are not meant to limit the scope of the present invention in any way, but are merely representative examples and should be understood as one of the techniques.
例、例1.エマージングパターン、例1.1: 生物学的なデータ
2.5の成長率閾値に対して、多くのEP’sが、UCI貯蔵庫(C.ブレーク&P. マーフィー、「UCI機械学習貯蔵庫」、http://www.cs.uci.edu/〜mlearn/MLRepository.html、あるいは、Department of Information and Computer Science, University of California, Irvine, USAから利用可能である) からのキノコのデータセット内に見出すことができる、以下は、2個の典型的なEP’sであり、各々は3個のアイテムからなる、
X = {(匂い = 無), (ひだ_サイズ = 広い), (リング_数 = 1)}
Y = {(傷 = 無), (ひだ_間隔 =接近), (ベール_色 = 白)} 。Example, Example 1. Emerging Patterns, Example 1.1: Biological Data For a growth rate threshold of 2.5, many EP's are found in UCI reservoirs (C. Blake & P. Murphy, “UCI Machine Learning Repository”, http: // can be found in the mushroom dataset from www.cs.uci.edu/~mlearn/MLRepository.html, or from the Department of Information and Computer Science, University of California, Irvine, USA), The following are two typical EP's, each consisting of three items:
X = {(scent = none), (folds_size = wide), (rings_number = 1)}
Y = {(scratch = none), (folds_spacing = approach), (veils_color = white)}.
キノコの2個のクラス内のそれらサポート、毒(poisonous)と食用(edible)は、次である。
非常に大きい成長率を有するそれらEP’sは、食用と毒のキノコのクラス間の注目に値する区別特性を明らかにし、そして、それらは、強力な分類器(参照:例えば、J. リー、 G. ドン&K. ラマモハナラロ, 「分類用の最も顕示的ジャンピング・エマージングパターンの使用」、Knowledge an Information Systems、3: 131-145, (2001))の構築に有用であった。興味を引くのは、8個以上のアイテムを含むいくらかがあるが、単独個体アイテム{匂い = 無}、{ひだ_サイズ = 広い}及び{リング_数 = 1}のどの1つもEPではない。 Those EP's with very large growth rates reveal remarkable distinguishing properties between the edible and poisonous mushroom classes, and they are powerful classifiers (see eg, J. Lee, G. Don & K. Ramamo Hanararo, “Use of the Most Prominent Jumping and Emerging Pattern for Classification”, Knowledge an Information Systems, 3: 131-145, (2001)). Of interest are some that contain more than 8 items, but none of the single item {scent = none}, {fold_size = wide} and {ring_number = 1} is an EP.
例1.2:人口統計データ
13個以上のアイテムを含むEP’sの約120の集合は、アメリカで、国勢調査データセット「PUMS」(www. census. govで利用可)で発見された。これらEP’sは、成長率閾値1.2を使って、テキサスの人口をミシガンのそれと比較することにより得られる。そのようなEPの1つは、以下である。
{Disabl 1: 2. Langl: 2, Means: l, Mobili: 2, Perscar: 2, Rlabor:1, Travtim: [1.. 59], Work89: 1}Example 1.2: Demographic data Approximately 120 collections of EP's containing more than 13 items were found in the United States in the census data set “PUMS” (available at www.census.gov). These EP's are obtained by comparing the Texas population to that of Michigan using a growth threshold of 1.2. One such EP is:
{Disabl 1: 2. Langl: 2, Means: l, Mobili: 2, Perscar: 2, Rlabor: 1, Travtim: [1 .. 59], Work89: 1}
アイテムは、それぞれ、障害(Disabl)、自宅での言語(Langl)、交通(mobili)の手段(means)、個人医療(Perscar)、雇用状況(Rlabor)、通勤時間(Travtim)及び1989年の就労あるいは非就労(Work89)を表す、ここで、各々の属性値は領域値の列挙リスト内のアイテムに対応する。そのようなEP’sは、異なる社会と地理的グループ間の人口特性の差異を記述することが出来る。 Items are Disabl, Language at Home (Langl), Means of Transportation (mobili), Personal Care (Perscar), Employment Status (Rlabor), Commuting Time (Travtim) and Working in 1989, respectively Or represents non-working (Work89), where each attribute value corresponds to an item in the enumerated list of region values. Such EP's can describe differences in population characteristics between different societies and geographic groups.
例1.3:購買動向データ
1985年に2000万取引記録から1000個の購入パターン{コンピュータ, モデム, EDU-ソフトウェア}、そして1986年には、2000万取引記録から2100個のその購入があったと仮定する。この購入パターンは、1985年から1986年の成長率2のEPである、だから、成長率閾値が2以下で設定されたいかなる分析においても確認される。この場合、アイテムセットのサポートは、1986年でさえ非常に小さい。だから、低いサポートを有するパターンの重要性に感謝する価値さえある。Example 1.3: Purchasing Trend Data Assume 1000 purchase patterns from 20 million transaction records in 1985 {Computer, Modem, EDU-Software}, and that in 1986 there were 2100 purchases from 20 million transaction records . This purchase pattern is an EP with a growth rate of 2 from 1985 to 1986, so it can be confirmed in any analysis where the growth rate threshold is set at 2 or less. In this case, the item set support is very small even in 1986. So it is even worthy to appreciate the importance of patterns with low support.
医療記録データ
癌患者の研究を考察する、ここで、1個のデータセットは、治った患者の記録を含み、他のデータは、治らなかった患者のデータを含む、そしてデータは、症状S及び治療Tに関する情報を含む。治らずから治ったの成長率9を有する仮定的に有効なEP {S1, S2, T1, T2, T3}は、そのように言えるであろう、つまり、双方の症状S1とS2を持った全ての癌患者とT1, T2 及び T3の全ての治療を受けた癌患者の間で、治った患者の数は、治らなかった患者の9倍である。これは、治療の組み合わせが、症状の組み合わせが生じるといつでも(良い方法が無ければ)、ほどこされるべきであることを示しているのかもしれない。EPは、ただ1%などの低いサポートを有しているが、それは、そのような低いサポートを有し及び非常に多くのアイテムからなるEP’sを見出すための効率的方法の不足ゆえ、おそらく、医療分野への新しい知識である。このEPは、例えば、症状Siに関する各々の治療の効果に関する支配的な知識を否定さえするかもしれない。だから、そのようなEP’sの選ばれたセットは、例えば、症状セットで示されるような、与えられた医療状況に対してどのような治療を用いるべきかの決定において、医者に有用な案内が出来る。Medical Record Data Consider a study of cancer patients, where one data set includes records of patients who have been cured, the other data includes data of patients who have not been cured, and the data includes symptoms S and Contains information about Treatment T. A hypothetically effective EP {S1 , S2 , T1 , T2 , T3 } with a growth rate of 9 that has not healed would be said that, that is, both symptoms S1 Between all cancer patients with S2 and cancer patients with all treatments of T1 , T2 and T3 , the number of patients cured is nine times that of patients who did not cure. This may indicate that a combination of treatments should be done whenever a combination of symptoms occurs (if there is no good way). EP has a low support, such as only 1%, but it is probably due to the lack of an efficient way to find EP's with such a low support and so many items New knowledge in the field. This EP may even deny, for example, the dominant knowledge about the effect of each treatment on symptoms Si . So, such a chosen set of EP's can provide a useful guide to the doctor in deciding what treatment should be used for a given medical situation, for example as shown in the symptom set .
説明的遺伝子表現データ
遺伝子のDNA配列をRNAに書き換えるプロセスは、遺伝子表現と呼ばれる。翻訳後、RNAは、アミノ酸配列から成るタンパク質のため、コード化する。遺伝子表現レベルは、セル(細胞)で生産されたその遺伝子のRNAのおおよそのコピー数である。通常、以下に記載のマイクロアレイのような技術を用いて高度な平行実験により得られた遺伝子表現データは、特定の実験条件の下、遺伝子表現レベルを記録する:マイクロアレイ (参照:例えば、M. シェーナ、D. シャロン、R. デービス&P. ブラウン「相補的DNAマイクロアレイを持つ遺伝子表現パターンの量的監視」、サイエンス、270、467-470、(1995))、オリゴヌクレオチド「チップ」(参照:例えば、D. J. ロックハート、H. ドン、M. C. バヤン、M. T. フォレテイ、M. V. ガロ、M. S. チー、M. ミットマン、C. ワン、M. 小林、H. ホートン及びE. L. ブラウン、「高密度オリゴヌクレオチドアレイへのハイブリダイゼーションによる表現監視」、ネイチャー、バイオテック、14:1675-1680、(1996))、及び遺伝子表現の直列分析(参照:V. ベルカレシュウ、L. ツァン、B. ボーゲルスタイン&K. カインツラー、遺伝子表現の直列分析、サイエンス、270: 484-487、(1995))。Descriptive gene expression data The process of rewriting a gene's DNA sequence into RNA is called gene expression. After translation, RNA is encoded because it is a protein consisting of an amino acid sequence. The gene expression level is the approximate number of copies of RNA of that gene produced in the cell. Typically, gene expression data obtained by highly parallel experiments using techniques such as microarrays described below record the level of gene expression under specific experimental conditions: microarray (see, eg, M. Schonaer D. Sharon, R. Davis & P. Brown “Quantitative monitoring of gene expression patterns with complementary DNA microarrays”, Science, 270, 467-470, (1995)), oligonucleotide “chips” (see, eg, DJ Lockhart, H. Dong, MC Bayan, MT Foresty, MV Gallo, MS Chi, M. Mitman, C. One, M. Kobayashi, H. Horton and EL Brown, “By hybridization to high-density oligonucleotide arrays Expression monitoring ", Nature, Biotech, 14: 1675-1680, (1996)), and tandem analysis of gene expression (see: V. Berkareshu, L. Tsang, B. Bo . Rusutain & K Kaintsura, series analysis of gene expression, Science, 270: 484-487, (1995)).
2個のクラスのデータ間の著しい差異の知識は、生物学において有用である。例えば、何がしかの遺伝子表現実験において、医者あるいは生物学者は、ある遺伝子あるいは遺伝子グループの表現レベルが正常セルと病気のセル間で急激に変化することを知ることを望む。そこで、これら遺伝子あるいはそれらのたんぱく質製品が、診断インジケータあるいは特定の病気対象の薬として用いることができる。 Knowledge of significant differences between the two classes of data is useful in biology. For example, in some gene expression experiments, a doctor or biologist wants to know that the expression level of a gene or group of genes changes rapidly between normal and diseased cells. Therefore, these genes or their protein products can be used as diagnostic indicators or drugs for specific diseases.
遺伝子表現データは、一般的に、行列として整理される。n列m行のマトリックスに対して、nは、通常、考えられた遺伝子の数を表現し、mは、実験の数を表現する。2つの主なタイプの実験がある。第1のタイプの実験は、コンデイションの変化の直列下で、同時にn個の遺伝子をm回の監視に向けられる(参照:例えば、J. L. デリシ、V. R. イヤー&P. O. ブラウン、「ゲノムスケール上での遺伝子表現の遺伝子コントロールと新陳代謝の探求」、サイエンス、278:680-686、(1997))。このタイプの実験は、コンデイションの直列下で、全ての単一の遺伝子の規則あるいは全ての可能な動向を提供するように意図される。結果としてのデータは、一般的に、時間的である。第2のタイプの実験は、単一環境、しかし、m個の異なるセルでn個の遺伝子を試験するために用いられる(参照:例えば、U. アロン、N. バーカイ、D. A. ノッタマン、K. ギシュ、S. イェバラ、D. マック&A. J. レビン、「オリゴヌクレオチドアレイ・プローブによる、腫瘍と正常な結腸組織のクラスタリング分析よって明らかにされた遺伝子表現の広範囲パターン」、Proc. NATL. ACAD. SCI. U.S.A.、96: 6745-6750、(1999))。このタイプの実験は、新しいセルの分類を補助し、その表現が良い診断インジケータ[1, 8]である有用な遺伝子の確認用に期待される。結果としてのデータは、一般的に、空間的である。 Gene expression data is generally organized as a matrix. For a matrix of n columns and m rows, n typically represents the number of genes considered, and m represents the number of experiments. There are two main types of experiments. The first type of experiment is directed to monitoring n genes at the same time, m times under a series of conditioning changes (see, eg, JL Delici, VR Year & P. O. Brown, “Genome Scale”). Exploring Gene Control and Metabolism of Gene Expression in Science, Science, 278: 680-686, (1997)). This type of experiment is intended to provide all single gene rules or all possible trends under tandem conditioning. The resulting data is generally temporal. The second type of experiment is used to test n genes in a single environment, but in m different cells (see, eg, U. Aron, N. Berkai, DA Nottaman, K. Gish). , S. Yevara, D. Mac & A. J. Levin, “A wide range of gene expression patterns revealed by clustering analysis of tumor and normal colon tissue with oligonucleotide array probes”, Proc. NATL. ACAD. SCI USA, 96: 6745-6750, (1999)). This type of experiment is expected to help identify new genes that help classify new cells and whose expression is a good diagnostic indicator [1, 8]. The resulting data is generally spatial.
遺伝子表現値は、連続的である。遺伝子を与える、genesで表示、コンデイションの直列下で、あるいは、単一コンデイション、しかし異なるタイプのセルの下で、その遺伝子表現値は、実数の範囲で形成する。この範囲は、[a, b] である、[c, d]は、[a, b]に含まれると仮定する。genej@[c, d]をアイテムと呼ぶ、genejの値は、cとd間に包括的に限定されることを意味する。1個の単一のアイテムのセット、あるいは異なる遺伝子からくる数個のアイテムセットは、パターンと呼ばれる。だから、パターンは、次の形式である、
{genei1@[ai1, bi1], . . . ., geneik@[aik, bik]
ここで、it≠is, 1≦k 。パターンは、常に、データセット内に頻度を有する。この例は、パターン、だから、エマージングパターンの頻度をいかに計算するかを示す。
表B
{Genei1 @ [ai1 , bi1 ],... , Geneik @ [aik , bik ]
Here, it ≠ is , 1 ≦ k. The pattern always has a frequency in the data set. This example shows how to calculate the frequency, and therefore the frequency of the emerging pattern.
Table B
表-Bは、3個が正常で、3個が癌である6個のセル内の4個の遺伝子の表現値から成る。表-Bの各々の6行は、「実例」である。パターン{gene1@[0.1, 0.3]}は、全データセット内で50%の頻度を有する、理由は、最初の3個の実例に対する遺伝子表現値が区間[0.1, 0.3]にあるからである。別のパッターン{gene1@[0.1, 0.3]}、{gene3@[0.30, 1.21]}は、全データセット内で0%の頻度を有する、理由は、2つの条件:(i)gene1’s値が範囲[0.1, 0.3]内でなければならない(ii)gene3’s値が範囲[0.30, 1.21]内でなければならない、を満足する単一の実例がないゆえである。しかしながら、パターン{gene1@[0.4, 0.6]}、{gene4@[0.41, 0.82]}は、50%の頻度を有すると見ることができる。Table-B consists of expression values for 4 genes in 6 cells, 3 normal and 3 cancer. Each of the six rows in Table-B is an “example”. The pattern {gene1 @ [0.1, 0.3]} has a frequency of 50% in the entire data set because the gene expression values for the first three instances are in the interval [0.1, 0.3] . Another pattern {gene1 @ [0.1, 0.3]}, {gene3 @ [0.30, 1.21]} has a frequency of 0% in the entire data set, because there are two conditions: (i) gene1 This is because there is no single instance that satisfies the 's value must be in the range [0.1, 0.3] (ii) the gene3 ' s value must be in the range [0.30, 1.21]. However, the patterns {gene1 @ [0.4, 0.6]}, {gene4 @ [0.41, 0.82]} can be seen as having a frequency of 50%.
エマージングパターンを説明するために、表-Bのデータセットは、2個のサブデータセットに分割される:1個は、3個の正常セルの値から成り、他は、3個の癌セルの値から成る。与えられたパターンの頻度は、1個のサブデータセットから他のサブデータセットに変化することができる。エマージングパターンは、その頻度が、2個のサブセット間で、著しく変化するそれらパターンである。 To illustrate the emerging pattern, the data set in Table-B is divided into two sub-data sets: one consists of three normal cell values and the other consists of three cancer cells. Consists of values. The frequency of a given pattern can vary from one subdata set to another. Emerging patterns are those patterns whose frequency varies significantly between the two subsets.
パターン{gene1@[0.1, 0.3]}は、エマージングパターンである、理由は、それが、正常セルから成るサブデータセットでは頻度100%を有し、しかし、癌セルのサブセットでは頻度0%を有するからである。The pattern {gene1 @ [0.1, 0.3]} is an emerging pattern because it has a frequency of 100% for a sub-data set consisting of normal cells, but a frequency of 0% for a subset of cancer cells. It is because it has.
パターン{gene1@[0.4, 0.6]}、{gene4@[0.41, 0.82]}は、また、エマージングパターンである、理由は、正常セルを有するサブデータセット内で頻度0%を有するからである。The patterns {gene1 @ [0.4, 0.6]}, {gene4 @ [0.41, 0.82]} are also emerging patterns because they have a frequency of 0% in sub-data sets with normal cells. is there.
次の例に使われた2個の一般にアクセス可能な遺伝子表現データ、白血病データセット(ゴルブ他、「癌の分子の分類:遺伝子表現の監視によるクラス発見とクラス予測」、サイエンス、286:531-537、(1999))、及び結腸腫瘍データセット(U. アロン、N. バーカイ、D. A. ノッタマン、K. ギシュ、S. イェバラ、D. マック&A. J. レビン、「オリゴヌクレオチドアレイ・プローブによる、腫瘍と正常な結腸組織のクラスタリング分析よって明らかにされた遺伝子表現の広範囲パターン」、Proc. NATL. ACAD. SCI. U.S.A.、96: 6745-6750、(1999))が表-Cに記載される。遺伝子表現データの共通特性は、サンプルの数が、商業的な市場データと比較して、少ないことである。
表C
Table C
別の表示法で、遺伝子Xの表現レベルは、gene(X)で与えることができる。正常組織のその0%の頻度を、この結腸腫瘍データセットから取られた癌組織の75%の頻度に変えるエマージングパターンの例は、次の3個のアイテムを含む:
{gene (K03001)≧89. 20, gene (R76254)≧127.16, gene (D31767) 63. 03}
ここで、K03001, R76254およびD31767は、特別な遺伝子である。このエマージングパターンによれば、新しいセル実験で、もし、遺伝子K03001の表現値が89. 20より小さくない及び遺伝子R76254の表現値が127.16より小さくない及び遺伝子D31767の表現値が63. 03より小さくないであれば、このセルは、正常なセルであるよりも癌のセルであることが見込まれる。Alternatively, the expression level of gene X can be given by gene (X). An example of an emerging pattern that changes that 0% frequency of normal tissue to 75% frequency of cancer tissue taken from this colon tumor dataset includes the following three items:
{Gene (K03001) ≧ 89.20, gene (R76254) ≧ 127.16, gene (D31767) 63. 03}
Here, K03001, R76254 and D31767 are special genes. According to this emerging pattern, in a new cell experiment, the expression value of gene K03001 is not less than 89.20 and the expression value of gene R76254 is not less than 127.16 and the expression value of gene D31767 is not less than 63.03 If so, this cell is expected to be a cancer cell rather than a normal cell.
例2:腫瘍データセットからのエマージングパターン
このデータセットは、正常セルと癌セルの遺伝子表現レベルを含み、それは、例1.4で論議した実験の第2タイプの1つにより得られる。データは、Affymetrix HUM6000から得られた22の正常組織サンプルと40の結腸腫瘍組織サンプルの約6500の遺伝子に対しての遺伝子表現値からなる(参照:アロン他、「オリゴヌクレオチドアレイ・プローブによる、腫瘍と正常な結腸組織のクラスタリング分析よって明らかにされた遺伝子表現の広範囲パターン」、Proceedings of National Academy of Science of the United State of America、96: 6745-6750、(1999))。これらサンプル2000の表現レベルは、それらサンプルにまたがる最小の強さに従い選ばれた、そして最小の強さ以下のそれら遺伝子は、無視された。減らされたデータセットは、インターネットサイト、http://microarray.princeton.edu/onocology/affydata/index.html、
で公に利用可能である。Example 2: Emerging Patterns from Tumor Data Set This data set contains gene expression levels of normal and cancer cells, which is obtained by one of the second types of experiments discussed in Example 1.4. The data consist of gene expression values for approximately 6500 genes in 22 normal tissue samples and 40 colon tumor tissue samples obtained from Affymetrix HUM6000 (see: Aron et al. And a broad pattern of gene expression revealed by clustering analysis of normal colon tissue, "Proceedings of National Academy of Science of the United State of America, 96: 6745-6750, (1999)). The expression level of these samples 2000 was chosen according to the minimum strength across the samples, and those genes below the minimum strength were ignored. The reduced dataset can be found on the internet site http://microarray.princeton.edu/onocology/affydata/index.html,
Is publicly available.
このサンプルは、本質的に以下の問題に関する: This sample essentially concerns the following issues:
1.どの遺伝子の表現値の区間、あるいは多重遺伝子のどの区間の組み合わせ、のみが、正常組織ではなく癌組織で起きるのか、あるいは、癌組織ではなく正常組織で起きるのか? 1. Which gene expression value interval, or which interval combination of multiple genes, only occurs in cancer tissue instead of normal tissue, or does it occur in normal tissue instead of cancer tissue?
2.上記の対照的な区間あるいは全てのEP’sの組み合わせ区間が有益で、信頼性が高いように、いかに遺伝子の表現値の範囲を多重区間に離散化することが可能か? 2. How can the range of gene expression values be discretized into multiple sections so that the above contrasting sections or all EP's combined sections are useful and reliable?
3.発見したパターンは、分類のタスクを実行するに利用できるか、つまり、同じタイプの表現実験の実施後、新しいセルが正常か癌であるかどうかを予測する? 3. Can the found patterns be used to perform classification tasks, ie predict whether a new cell is normal or cancer after performing the same type of expression experiment?
これらの問題は、いくつかの技術で解決される。結腸癌データセットに対して、その2000個の遺伝子のうち35個の適切な遺伝子のみが、残りの1965個の遺伝子が方法により無視される間に、2個の区間に離散化される。この結果は、ほとんどの遺伝子が「取るに足らない(trivial)」ものとして見られるので非常に重要である、結果として、小さな数の良い診断インジケータが集中した簡単なプラットフォームをもたらす。 These problems are solved by several techniques. For the colon cancer data set, only 35 of the 2000 genes are discretized into two intervals while the remaining 1965 genes are ignored by the method. This result is very important as most genes are seen as “trivial”, resulting in a simple platform with a small number of good diagnostic indicators concentrated.
離散化に対して、データは、MLC++の利用により得られたフォーマットに応じて再編成される(参照:R. カハビ、G. ジョン、R. ロング、D. マンリー及び K. プレジャー、「MLC++ : C++内の機械学習ライブラリー」、Tools with Artificial Intelligence、740-743、(1994))。簡単に、再編成データセットは、当初のデータセットに対角対称である。この例では、私たちは、どの遺伝子が選ばれ、どの遺伝子が捨てられるかを見るために、離散化結果を提示する。エントロピー基礎の離散化方法は、正常なセルからの表現値と癌のセルからの表現値の間で「最高の」、信頼の高い差別的である区間を発生する。だから、エントロピー基礎の離散化方法は、自動的に、ほとんどの遺伝子を無視し、数個の最も差別的な遺伝子を選ぶ。 For discretization, the data is reorganized according to the format obtained by using MLC ++ (see R. Kahabi, G. John, R. Long, D. Manly and K. Pleasure, “MLC ++: Machine learning library in C ++ ", Tools with Artificial Intelligence, 740-743, (1994)). Simply, the reorganization data set is diagonally symmetric with respect to the original data set. In this example, we present the discretization results to see which genes are selected and which genes are discarded. The entropy-based discretization method generates a “best”, reliable and discriminating interval between the representation value from normal cells and the representation value from cancer cells. So the entropy-based discretization method automatically ignores most genes and picks some of the most discriminatory genes.
離散化方法は、2000の35のおのおのを2個のばらばらの区間に分割する、一方、残りの1965遺伝子にカットポイントはない。これは、遺伝子の1.75%(= 35/2000)のみが特別の差別的遺伝子として考察され、その他は分類用としては相対的に重要でないとして考察することができることを示す。良い診断遺伝子の少ない数を得る、だから、離散化方法は、信頼の高いエマージングパターンの効率的発見のための基盤を置く、それ故、膨大な数のうるさいパターンの発生を取り除く。 The discretization method divides each of the 35 of 2000 into two discrete sections, while the remaining 1965 genes have no cut points. This indicates that only 1.75% (= 35/2000) of the genes can be considered as specially discriminating genes and the others can be considered relatively unimportant for classification. Obtaining a small number of good diagnostic genes, so the discretization method lays the foundation for the efficient discovery of reliable emerging patterns and therefore eliminates the generation of huge numbers of annoying patterns.
離散化結果は、最初の行が35個の遺伝子のリストを含み、2行目は、遺伝子番号を示す、区間は3行目に示す、そして遺伝子の手順と名前は、それぞれ4行目と5行目に示される表ーDに要約される。表-Dの区間は、よく知られた数学的表記法で示される、ここで、角括弧[は、範囲の境界数を包括するであり、丸括弧(は、境界数の除外を意味する。
総計70個の区間がある。従って、アイテムは区間にリンクした遺伝子から成るペア(対)である70個のアイテムを伴う。70個のアイテムは次のようにインデックス(索引)をつける:第1の遺伝子の2個の区間は、1番及び2番アイテムとして、i番目の遺伝子の2個の区間は、(i*1)番、(i*2)アイテムとして、そして35番目の遺伝子の2個の区間は、69番、70番アイテムとして索引がつけられる。この索引は、ェマージングパターンを書いたり読んだりする時、便利である。例えば、パターン{2}は、{geneT51560@[101.3719, +∞]} を表す。There are a total of 70 sections. Thus, an item is accompanied by 70 items that are pairs of genes linked to a section. The 70 items are indexed as follows: the two segments of the first gene are the first and second items, and the two segments of the i-th gene are (i* 1 ) Number, (i* 2) item, and the two segments of the 35th gene are indexed as the 69th and 70th item. This index is useful when writing and reading emerging patterns. For example, the pattern {2} represents {geneT51560 @ [101.3719, + ∞]}.
離散化したデータを基礎のエマージングパターンは、次の2個の効率的境界-基礎アルゴリズムの利用により発見された、境界-差異及びJEP-作成器(Border-Diff and JEP-Producer)(参照:ドン& リー:“エマージングパターンの効率的マイニング:傾向と差異の発見”、Proc. 5th ACM SIGKDD、International Conference on Knowledge Discovery & Data Mining、43-52、(1999);リージェイ、正確で効率的な分類器の構築のためのエマージングパターン、博士論文、Department of Computer Science and Software Engineering、メルボルン大学、オーストラリア、(2001);J. リー、 G. ドン&K. ラマモハナラロ、「分類用の最も顕示的ジャンピング・エマージングパターンの使用」、Knowledge an Information Systems、3: 131-145, (2001);J. リー、K. ラマモハナラロ&G. ドン、「ジャンピング・エマージングパターンの空間及びその漸増的な保守アルゴリズム」、Proceedings of 17th International Conference on Machine Learning、551-558、(2000))。アルゴリズムは、「ジャンピング・エマージングパターン」―1個のクラス内の最大頻度である(つまり、正常組織あるいは、癌組織の場合)、しかし他のクラスの全てで起きない、それらEP’sを得ることが出来る。結腸腫瘍データセットの正常組織内のゼロでない頻度を有する19,501のEP’sの合計は、発見された、そして、癌組織内のゼロでない頻度を有する2,165のEP’sの合計は、これらアルゴリズムによって得られた。 Emerging patterns based on discretized data are found by using the following two efficient boundary-basic algorithms: Border-Diff and JEP-Producer (see: Don & Lee: “Efficient Mining of Emerging Patterns: Finding Trends and Differences”, Proc. 5th ACM SIGKDD, International Conference on Knowledge Discovery & Data Mining, 43-52, (1999); Lee Jay, an accurate and efficient classifier Emerging Patterns for Construction, Doctoral Dissertation, Department of Computer Science and Software Engineering, University of Melbourne, Australia, (2001); J. Lee, G. Don & K. Lamamo Nalarro, “The most obvious jumping emerging pattern for classification ”, Knowledge an Information Systems, 3: 131-145, (2001); J. Lee, K. Ramamohanalaro & G. Don,“ Jumping Emerging Patterns ” Space and its incremental maintenance algorithm, "Proceedings of 17th International Conference on Machine Learning, 551-558, (2000)). The algorithm is “jumping-emerging patterns” —you can get those EP's that are the most frequent in one class (ie in the case of normal or cancerous tissue), but do not occur in all other classes . A total of 19,501 EP's with non-zero frequencies in normal tissues of the colon tumor data set was found, and a total of 2,165 EP's with non-zero frequencies in cancer tissues was calculated by these algorithms. Obtained.
表-E及び表-Fは、発生頻度の降順に並べられた、22個の正常組織と40個の癌組織に対する、トップ20のEP’sと強いEP’sのリストである。各々の場合、1行目は、EP’sを示す。パターン内の数は、例えば、パターン{16, 58, 62}の16、58及び62は、上記で論議し索引をつけたアイテムである。
表E
Table E
エマージングパターンから推論できるいくつかの主要な洞察は、次に要約する。第1は、境界―基礎のアルゴリズムは、全てのエマージングパターンの発見を補償する。 Some key insights that can be inferred from emerging patterns are summarized below. First, boundary-based algorithms compensate for the discovery of all emerging patterns.
いくつかのエマージングパターンは、驚くほど面白い、特に相対的に大きい数の遺伝子を含むものに対してである。例えば、パターン{2, 3, 6, 7,13, 17, 33}は、7個の遺伝子を互いに結合するけれど、それは、いまだ、正常組織において、非常に大きい頻度(90. 91%)を有することができる、つまり、ほとんど全ての正常セルの表現値は、7個のアイテムによって暗示された全てのコンデイションを満足する。しかしながら、単一の癌セルが全てのコンデイションを満足はしない。単独及び6個の組み合わせを含む、パターン{2, 3, 6, 7,13, 17, 33}の固有のサブパターンの全ては、正常及び癌組織の双方でゼロでない頻度を有しなければならないことを観察する。これは、{2, 3, 6, 7,13, 17, 33}の全てのサブパターンによって暗示されたコンデイションを満足する正常及び癌組織の双方から少なくとも1個のセルが存在しなければならないことを意味する。 Some emerging patterns are surprisingly interesting, especially those involving a relatively large number of genes. For example, the pattern {2, 3, 6, 7, 13, 17, 33} binds 7 genes to each other, but it still has a very high frequency (90. 91%) in normal tissues That is, the representation value of almost all normal cells satisfies all the conditions implied by the seven items. However, a single cancer cell does not satisfy all conditions. All unique subpatterns of the pattern {2, 3, 6, 7,13, 17, 33}, including single and 6 combinations, must have a non-zero frequency in both normal and cancerous tissues Observe that. This means that there must be at least one cell from both normal and cancerous tissue that satisfies the conditions implied by all subpatterns of {2, 3, 6, 7,13, 17, 33} Means that.
{5}のような単独のエマージングパターンの頻度は、1個以上のアイテムを含むエマージングパターン、例えば、{16, 58, 62}、の頻度より大きい必要はない。だから、パターン{5}は、パターン{16, 58, 62}の頻度(75%)より約2.3倍小さい32.5%の頻度を持つ癌組織内のエマージングパターンである。これは、遺伝子表現データの分析に対して、遺伝子グループとそれら相関が単一の遺伝子より良く、更に重要であることを示す。 The frequency of a single emerging pattern such as {5} need not be greater than the frequency of an emerging pattern that includes one or more items, eg, {16, 58, 62}. Therefore, the pattern {5} is an emerging pattern in cancer tissue having a frequency of 32.5%, which is about 2.3 times smaller than the frequency (75%) of the pattern {16, 58, 62}. This shows that for analysis of gene expression data, gene groups and their correlation are better and more important than single genes.
離散化方法及び境界-基礎EP発見アルゴリズム無しでは、大きな頻度を有するそれら信頼度の高いエマージングパターンを発見することは非常に難しい。1,965の他の遺伝子が、同様に各々2個の区間に分割されることを前提にして、そのとき、7の長さを有する7C2000*27個の可能なパターンがある。そのような膨大な数のパッターンの列挙とそれら頻度の計算は、今回、実際的に不可能である。たとえ、離散化方法でも、7C35*27個のパターンのナイーブ列挙は、まだ、パターン{2, 3, 6, 7, 13, 17, 33}の発見に対して、高価すぎる。いくつかの発見されたEP‘s(ここにはリストされていない)が、7個の遺伝子を含むことを認識する時、実際には、問題は更に複雑であることを理解することができる。Without discretization methods and boundary-based EP discovery algorithms, it is very difficult to find those reliable emerging patterns with large frequencies. Given that 1,965 other genes are similarly divided into two sections each, there are then7 possible patterns of7 C2000 * 2 with a length of7 . It is practically impossible at this time to enumerate such a large number of patterns and calculate their frequency. Even with the discretization method, naive enumeration of7 C35 * 27 patterns is still too expensive for the discovery of the pattern {2, 3, 6, 7, 13, 17, 33}. When recognizing that some discovered EP's (not listed here) contain 7 genes, in practice it can be understood that the problem is even more complex.
2個の境界-基礎のアルゴリズムの使用を通して、固有サブセットがエマージングパターンでないそれらEP’sのみが発見される。興味深く、その他EP’sは、発見したEP’sを用いて得ることができる。一般的に、発見したEPの全ての固有スーパーセットは、また、エマージングパターンである。例えば、カウント20のEP’s(表-E参照)を用いて、同じカウント20を持つ、12個の遺伝子から成る非常に長いエマージングパターン{2, 3, 6, 7, 9, 11,13, 17, 23, 29,3 3, 35}を得ることが出来る。 Through the use of two boundary-based algorithms, only those EP's whose unique subsets are not emerging patterns are found. Interestingly, other EP's can be obtained using the discovered EP's. In general, every unique superset of discovered EPs is also an emerging pattern. For example, using EP's with a count of 20 (see Table-E), a very long emerging pattern consisting of 12 genes with the same count of 20 {2, 3, 6, 7, 9, 11, 13, 17, 23, 29,3 3, 35}.
62個の組織の全てが、それ自身のクラスから少なくとも1個のエマージングパターンに適合しなければならない、しかし他のクラスからの全てのEP’sは含まないことに留意する。従って、システムは、データの全てのアイテムが、システムによって発見されたパターンによって発見されるので、うまく全部のデータを学習する。 Note that all 62 organizations must conform to at least one emerging pattern from their own class, but do not include all EP's from other classes. Thus, the system learns all the data well because every item of data is found by the pattern found by the system.
要約すると、発見したエマージングパターンは、いつも、小さな数の遺伝子を含む。この結果は、ユーザに小さな数の良い診断遺伝子に焦点をあてさせるのみでなく、より重要なことは、遺伝子の区間の組み合わせ及び組み合わせ頻度で発生された遺伝子のいくつかの相互作用を明らかにすることである。発見したエマージングパターンは、新しいセルの特徴を予測するために使うことができる。 In summary, the emerging patterns found always contain a small number of genes. This result not only allows the user to focus on a small number of good diagnostic genes, but more importantly reveals several combinations of genes generated with combinations of gene segments and frequency of combinations. That is. The discovered emerging pattern can be used to predict new cell features.
次に、エマージングパターンは、新しいセルが正常あるいは癌のどちらかの予測でパターンがいかに有用であるかを示すために、分類タスクを実行するために使われる。 The emerging pattern is then used to perform a classification task to show how useful the pattern is in predicting whether a new cell is normal or cancerous.
表-E、表-Fに示すように、EP’sの頻度は、非常に大きい、だから、遺伝子のグループは、新しい組織を分類するために良いインジケータである。「リーフ・ワン・カット・バリデーション」(LOOCV)分類タスクを実施することによりパターンの有用性を試験することは有用である。LOOCVによって、62個の組織の最初の実例は、試験実例として確認され、残りの61個の実例は、訓練データとして取り扱われる。この手順を、最初の実例から62番目のものまで繰り返す、正しく予測された実例のパーセントによって与えられた、正確さ(精度)を得ることが可能である。 As shown in Table-E and Table-F, the frequency of EP's is very large, so the group of genes is a good indicator for classifying new tissues. It is useful to test the usefulness of a pattern by performing a “leaf one cut validation” (LOOCV) classification task. With LOOCV, the first instance of 62 tissues is identified as a test instance and the remaining 61 instances are treated as training data. It is possible to obtain the accuracy (accuracy) given by the percentage of correctly predicted examples, repeating this procedure from the first example to the 62nd.
この例で、2個のサブデータセットはそれぞれ正常訓練組織と癌訓練組織から成る。バリデーションは、正しく62個組織の57を予想する。3個の正常組織(N1, N2 及び N39)のみが癌組織として間違って分類された、そして、2個の癌組織(T28 及び T33)が正常組織として間違って分類された。この結果は、文献の結果と比較することができる。フリー他(参照:T. S. フリー、N. クリスチアンニ、N. ダフィー、D. W. ベッドナアスキー、 M. シューマー及びD. ハウスラー、「サポート・ベクトル・マシーン分類とマイクロアレイ表現データを用いた癌組織サンプルの確認」、Bioinformatics、16: 906-914、(2000)) 分類ミスの6個の組織(T30, T33, T36, N8, N34, 及びN36)、1000個の遺伝子とSVMアプローチ使用。興味深いことは、ここで提示した方法による全ての分類ミスの例は、SVM法による分類ミスのそれらと、1個(T33は双方で分類ミス)を除いて異なることである。だから、ここに提示の分類方法の性能は、SVM法より優れている。 In this example, the two sub-data sets consist of normal training tissue and cancer training tissue, respectively. Validation correctly predicts 57 of 62 tissues. Only three normal tissues (N1, N2 and N39) were misclassified as cancer tissues, and two cancer tissues (T28 and T33) were misclassified as normal tissues. This result can be compared with literature results. Free et al. (Reference: TS Free, N. Christianiani, N. Duffy, DW Bednasky, M. Schumer and D. Hausler, “Verification of Cancer Tissue Samples Using Support Vector Machine Classification and Microarray Representation Data” Bioinformatics, 16: 906-914, (2000)) 6 misclassified tissues (T30, T33, T36, N8, N34, and N36), 1000 genes and SVM approach. Interestingly, the examples of all misclassifications by the method presented here differ from those of the SVM method misclassification except for one (T33 is misclassification on both sides). So the performance of the classification method presented here is superior to the SVM method.
結腸腫瘍データセットは、非常に複雑であることを強調するものである。通常的にそして理想的に、試験正常(または癌)組織は、正常(または癌)訓練組織から大きい数のEP’sを、そして他のタイプの組織から小さな数のEP’sを含むべきである。しかしながら、ここに提示した方法を基礎にして、試験組織は、組織の双方のクラスから、多くのEP’s、トップ・ランクの高頻度EP’sさえ含むことができる。 The colon tumor dataset emphasizes that it is very complex. Normally and ideally, the test normal (or cancer) tissue should contain a large number of EP's from normal (or cancer) training tissue and a small number of EP's from other types of tissue. However, based on the method presented here, a test tissue can include many EP's, even top-ranked high frequency EP's from both classes of tissue.
上記に提示した第三の方法の使用により、62個組織の58個が正しく予測される。4個の正常組織(N1, N12, N27 及び N39)は、癌組織として間違って分類された。だから、分類の結果は、強いEP’sが使用されたとき、改善する。 By using the third method presented above, 58 of 62 tissues are correctly predicted. Four normal tissues (N1, N12, N27 and N39) were misclassified as cancerous tissues. So the classification results improve when strong EP's are used.
同じデータセットの分類結果に従うと、私たちの方法は、SVN法及びクラスタリング法より優れている。 According to the classification results of the same data set, our method is superior to the SVN method and the clustering method.
境界EP’sあるいは、CFS法が、最も重要である2000個のオリジナル遺伝子から23個の機能を選定した。23個の機能の全ては、2個の区間に分割される。 23 functions were selected from the 2000 original genes for which boundary EP's or CFS methods are most important. All 23 functions are divided into two sections.
合計371個の境界EP’sは、正常セルのクラス内に、そして、これら23個の機能を用いて、癌セル内の131個の境界EP’sは、発見された。合計502個のパターンは、上記に記載の方法に従ってランク付けされる。いくらかのトップ・ランク境界EP’sは、表-Gに示される。
表G
Table G
ALL/AMLデータと異なり、以下例3で論議されて、結腸腫瘍データに、正常と癌セルを明確に分離するためのアビトレーター(調停物)として働く単一遺伝子はない。代わりに、遺伝子グループは、2個のクラス間の相違を明らかにする。留意、また新しい、これら境界EP’s、特に、多くのコンデイションを有するそれらは、生物学者と医者には明らかではない。だから、それらは、新しい生物学的な機能を明らかにする可能性があり、そして新しい道(pathway)を見出す可能性を持ち得る。 Unlike ALL / AML data, as discussed in Example 3 below, there is no single gene in the colon tumor data that acts as an agitator to clearly separate normal and cancer cells. Instead, the gene group reveals the differences between the two classes. Note that these new boundary EP's, especially those with many conditions, are not obvious to biologists and doctors. So they can reveal new biological functions and have the potential to find new pathways.
P-空間
正常セルのクラスで同じ18の最高頻度を持つ合計10個の境界EP’sがあることを見ることが出来る。これら境界EP’sを基礎として、P18-空間は、唯一の最も特定の要素がZ = {2, 6, 7, 9,11, 15, 21, 23, 25, 31}内で発見することが出来る。凸状によって、また、10個の境界EP’sのどれか1つのスーパーセットであるZの全てのサブセットは、正常クラスないで18個の発生を有する。あるいは、凸状によって、この空間が、表-Hに示すように、11個のEP’sのみを用いて簡素に表示されることが出来る。
表H
Table H
表-Hにおいて、最初の10個のEP’sは、最も一般的要素で、そして最後の1つが、空間内の最も特定の要素である。EP’sの全部は、それぞれ、頻度18と0で正常及び癌クラスの双方内で同じ発生を有する。 In Table H, the first 10 EP's are the most common elements and the last one is the most specific element in space. All of EP's have the same occurrence in both normal and cancer classes with
このP-空間から、重要な遺伝子グループ(境界EP’s)が、重要性を失うことなくいくつかの他の遺伝子を加えることにより拡張することが出来る、つまり、1個のクラス内で高い発生を保持する、しかし、他のクラス内では存在しない、を見ることが出来る。これは、生物学的道の最大長を確認するに有用であり得る。 From this P-space, important gene groups (boundary EP's) can be expanded by adding several other genes without losing importance, ie keeping high incidence within one class Yes, but you can see that it does not exist in other classes. This can be useful to ascertain the maximum length of the biological tract.
同様に、P30-空間は、癌クラスで発見された。この空間内で最も一般的なEPは、{14, 34, 38}のみであり、最も特定のEPは、{14, 30, 34, 36, 38, 40, 41, 44, 45}のみである。それ故、境界EPは、その発生を変えずに、6個以上の遺伝子を加えることができる。Similarly, P30 - space was found in cancer class. The most common EP in this space is {14, 34, 38}, and the most specific EP is only {14, 30, 34, 36, 38, 40, 41, 44, 45} . Therefore, boundary EP can add more than 6 genes without changing its occurrence.
シャドウパターン
それは、また、シャドウパターンの発見に向かう。表-Jは、一列目に示すように、境界EP及びそのシャドウパターンを報告する。これらシャドウパターンは、また、境界EPの固有サブセットがゼロでない頻度で2個のクラス内で発生しなければならないポイントの説明に使うことができる。
表J
Table J
結腸データセットに対して、PCL法を用いて、C4. 5、ナイーブベイズ、k-NN及びサポート・ベクター・マシーンなどの他の分類方法より、良いLOOCV誤差率を得ることができる。結果は、表-Kに要約される、ここでは、誤差率は、失敗予想の絶対数として表現される。
表K
Table K
加えるに、P-空間は、分類用に使われることができる。例えば、結腸データセットに関して、ランク付けされた境界EP’sは、P-空間の最も特定の要素によって置き換えられた。言い換えれば、境界EP’sを抽出する代わりに、最も特定のプラトーEP’sは、抽出される。PCLを用いる残りのステップは、変化しない。LOOCVによって、6個のみの誤った分類の誤差率が得られる。この削減は、表-Kのそれらへの比較で重要です。 In addition, P-space can be used for classification. For example, for the colon dataset, the ranked boundary EP's have been replaced by the most specific elements of P-space. In other words, instead of extracting the boundary EP's, the most specific plateau EP's are extracted. The remaining steps using PCL do not change. LOOCV gives an error rate of only 6 misclassifications. This reduction is important in comparison to those in Table-K.
例3:最初の遺伝子表現データセット(白血病患者のために)
白血病データセット(T. R. ゴルブ、D. K. スロニム、P. タマヨ、C. ヒュアード、M. ガセンビーク、J. P. メシロフ、H. コラー、M.L. ロー、J.ダウニング、M. A. カリギュリ、C. D. ブルームフィールド及びE. S. ランダー、「癌の分子の分類:遺伝子表現の監視によるクラス発見とクラス予測」、サイエンス、286:531-537、(1999))は、上記の表-Cに示すように、劇症リンパ球白血病(ALL)の27個のサンプルの訓練セット及び劇症骨髄腫白血病(AML)の11個のサンプルを含む。(ALL及びAMLは、白血病の2個の主なサブタイプである。)この例は、20個のALLと14個のAMLの目隠し試験セットを使用した。高密度オリゴヌクレオチド・マイクロアレイは、6,817個の人間遺伝子の7,129個のプローブを使用した。このデータは、次のURLで公に利用可能である、http ://WWW. genome. wi. mit. edu/MPR。Example 3: First gene expression dataset (for leukemia patients)
Leukemia datasets (TR Golb, DK Slonim, P. Tamayo, C. Huard, M. Gasenvik, JP Messilov, H. Koller, ML Law, J. Downing, MA Caliguri, CD Bloomfield and ES Lander, “Cancer Molecule Classification: Class Discovery and Class Prediction by Monitoring Gene Expression ”, Science, 286: 531-537, (1999)), 27 of fulminant lymphocyte leukemia (ALL) as shown in Table C above. A training set of two samples and eleven samples of fulminant myeloma leukemia (AML). (ALL and AML are the two main subtypes of leukemia.) This example used a blinded test set of 20 ALL and 14 AML. The high density oligonucleotide microarray used 7,129 probes of 6,817 human genes. This data is publicly available at the following URL: http: // WWW. Genome. Wi. Mit. Edu / MPR.
例3.1:白血病データから得られたパターン
CFS方法は、7,129個の機能の全体から1個の遺伝子、Zyxinのみを選ぶ。離散化方法は、994でカットポイントを用いて、この機能を2個の区間に分割する。それから、それらホームクラス内で100%発生を有する、2個の境界EP’s、gene_zyxin@(-∞, 994)及びgene_zyxin@[ 994, -∞)は、発見された。Example 3.1: Patterns derived from leukemia data
The CFS method selects only one gene, Zyxin, from a total of 7,129 functions. The discretization method uses a cut point at 994 to divide this function into two sections. Then, two boundary EP's, gene_zyxin @ (-∞, 994) and gene_zyxin @ [994, -∞) with 100% occurrence within their home class were discovered.
生物学的に、これら2個のEP’sは、サンプルセル内のZyxinの表現が994より小さければ、このセルがALLクラスに有ることを示す。それ以外、このセルは、AMLクラス内である。この規則は、例外なく38個の訓練サンプル全てを規制する。この規則をが34個の目隠し試験サンプルに適用すれば、3個のミス分類のみが得られる。この結果は、ゴルブ他、サイエンス、286: 531-537、(1999)に報告されたシステムの正確さより優れている。 Biologically, these two EP's indicate that this cell is in the ALL class if the Zyxin representation in the sample cell is less than 994. Otherwise, this cell is in the AML class. This rule regulates all 38 training samples without exception. If this rule is applied to 34 blind test samples, only 3 miss classifications are obtained. This result is superior to the accuracy of the system reported in Golb et al., Science, 286: 531-537, (1999).
生物学的及び技術的雑音は、データを作成する実験要綱内の多くの段階で、機械的及び人的双方の起源で、たびたび発生する。例は、以下を含む:DNAアレイの生産、サンプルの用意、表現レベルの抽出、また、不純物あるいは組織の誤った分類から。これら可能な誤差-同等、どこ-小さい、を克服するために、以下に論議するように、分類方法を強化するために1つ以上の遺伝子をことに使うことを提案する。 Biological and technical noise often occurs at both the mechanical and human origins at many stages within the experimental schedule for generating data. Examples include: DNA array production, sample preparation, expression level extraction, and misclassification of impurities or tissues. In order to overcome these possible errors—equivalent, where—small, we propose to use one or more genes to enhance the classification method, as discussed below.
エントロピー基礎の離散化方法により分割された時、エントロピー値が他の7,127の機能全てのそれらより著しく小さい4個の遺伝子が発見された。これら4個の遺伝子、これらの名前、カットポイント及びアイテム索引が表-Lにリストされる、がパターン発見に対して選ばれた。表-L内の各々機能は、2行目のカットポイントを用いて、2個の区間に分割される。アイテム索引(インデックス)は、EPを示す。
表L
Table L
合計6個の境界EP’sが発見された、3個ずつがALLとAMLクラス。表-Mは、全クラス内の境界EPと一緒にそれら発生と発生のパーセントを示す。パターン内に含まれる参照番号は、表-2の区間索引を参照する。
表M
Table M
生物学的に、例としてEP {5, 7}は、CST3の表現が1419.5より小さく、Tropomysinが83. 5より小さいならば、このサンプルは、100%正確にALLである、といえる。だから、本発明の方法により得られた境界EP’sを伴うそれら遺伝子の全ては、ALLとAMLを分類するために、非常に良い診断インジケータである。 Biologically, for example, EP {5, 7} is said to be 100% accurate ALL if CST3 expression is less than 1419.5 and Tropomysin is less than 83.5. So, all of those genes with boundary EP's obtained by the method of the present invention are very good diagnostic indicators for classifying ALL and AML.
P-空間は、また、2個の境界EP’s {5, 7} と {1}を基準に、発見された。このP27-空間は、5個のプラトーEP’s: {1}、{1, 7}、{1, 5}、{5, 7} 及び {1, 5, 7}から成る。最も特定のプラトーEPは、{1, 5, 7}である。このEPは、まだ、ALLクラスで27個の完全発生を有することに留意。P-space was also discovered on the basis of two boundaries EP's {5, 7} and {1}. This P27 -space consists of five plateaus EP's: {1}, {1, 7}, {1, 5}, {5, 7} and {1, 5, 7}. The most specific plateau EP is {1, 5, 7}. Note that this EP still has 27 complete occurrences in the ALL class.
PCL法の精度は、白血病データセット(ゴルブ他、1999)の34個の目隠し試験サンプルにそれを適用により、及び結腸データセットに関してリーフ・ワン・アウトクロスバリデーション(LOOCV)の実施により、試験された。白血病訓練データに適用した時、CFS法は、2個の区間に離散化された1個の遺伝子、Zyxinを正確に選んだ、それゆえ、簡単な規則を形成し、サンプル内のZyxinのレベルが994以下であれば、サンプルはALLである、それ以外は、サンプルはAMLである、として表現可能。従って、1つの規則しかないように、それを使うことに曖昧さはない。この規則は、訓練データに関して100%正確である。しかし、目隠し試験データのセットに適用した時、いつかの分類誤差をもたらした。精度を上げるために、いくつかの追加遺伝子を用いることが妥当である。白血病データの4個の遺伝子が、エントロピー基礎の離散化法により、最も重要なものとして選定されたことを思い出そう。これら4個の遺伝子から得られた境界EP’sに関してPCLを使って、2個のミス分類の試験誤差率が得られた。この結果は、Zyxin遺伝子のみを用いて得られた結果より1エラー少ない。 The accuracy of the PCL method was tested by applying it to 34 blindfold test samples of the leukemia data set (Golb et al., 1999) and by performing Leaf One Outcross Validation (LOOCV) on the colon data set. . When applied to leukemia training data, the CFS method selected exactly one gene, Zyxin, which was discretized into two intervals, thus forming a simple rule and the level of Zyxin in the sample If 994 or less, the sample can be expressed as ALL, otherwise the sample can be expressed as AML. Thus, there is no ambiguity in using it, as there is only one rule. This rule is 100% accurate with respect to training data. However, some classification errors were introduced when applied to the blindfold test data set. In order to increase accuracy, it is reasonable to use several additional genes. Recall that the four genes in the leukemia data were selected as the most important by the entropy-based discretization method. Using PCL on the boundary EP's obtained from these four genes, two misclassified test error rates were obtained. This result is one error less than the result obtained using only the Zyxin gene.
例4: 第2遺伝子表現データセット(劇症リンパ球白血病)
この例は、聖ジュード小児研究病院(A. E. -J ヤオ他、「診断での小児劇症リンパ球白血病(ALL)ブラストの表現プロファイリングは、再発リスクと治療による誘発劇症骨髄腫白血病(AML)の双方を正確に予測する」、Plenary talk at アメリカ血液学会43回年度会議、オランドー、フロリダ、(2001年12月))から得られた遺伝子表現プロファイルの大きい集合を使用する。データは、劇症リンパ球白血病(ALL)サンプルの327個の遺伝子表現プロファイルから成る。これらプロファイルは、12558に対するプローブを含むAffymetrix U95A GeneChipに関する交配により得られた。交配データは、(a) 3以下の全ての遺伝子「Pと呼ぶ」は、1で置き換えられる、(b) 全ての強度値「Aと呼ぶ」は、1で置き換えられる、(c) 全ての100以下の強度値は、1で置き換えられる、(d) 全ての45000以上の強度値は、45000で置き換えられる、(e) 最大及び最小強度値が100以下で異なる全ての遺伝子は1で置き換える、のようにクリーンアップされる。これら327遺伝子表現プロファイルは、T-cell (T-ALL)、E2A-PBX1、TEL-AML1、MLL、 BCR-ABL、及び hyperdiploid (Hyperdip>50) を含む全ての既知の劇症リンパ球白血病サブタイプを含む。Example 4: Second gene expression dataset (fulminant lymphocyte leukemia)
An example of this is St. Jude Children's Research Hospital (AE-J Yao et al., “Expression profiling of pediatric fulminant lymphocytic leukemia (ALL) blast in diagnosis of relapse risk and treatment-induced fulminant myeloma leukemia (AML) Use a large set of gene expression profiles obtained from Plenary talk at the 43rd Annual Meeting of the American Society of Hematology, Orlando, Florida, (December 2001). The data consists of 327 gene expression profiles of a fulminant lymphocyte leukemia (ALL) sample. These profiles were obtained by mating on an Affymetrix U95A GeneChip containing the probe for 12558. The mating data are: (a) all 3 or fewer genes "call P" are replaced with 1, (b) all intensity values "call A" are replaced with 1, (c) all 100 The following intensity values are replaced with 1, (d) all intensity values greater than 45000 are replaced with 45000, (e) all genes with maximum and minimum intensity values less than 100 are replaced with 1. To be cleaned up. These 327 gene expression profiles represent all known fulminant lymphocyte leukemia subtypes including T-cell (T-ALL), E2A-PBX1, TEL-AML1, MLL, BCR-ABL, and hyperdiploid (Hyperdip> 50) including.
図6に示すように、ツリー構造決定システムがこれらサンプルの分類に使われた。与えたサンプルに対して、それがT-ALLあるいは他のサブタイプのサンプルであるかどうかを分類するために最初に規則が用いられる。それが、T-ALLとして分類されるならば、処理は終える。それ以外は、プロセスは、サンプルがE2A-PBX1として、あるいは残りの他のサブタイプの1つかどうかを見るため、ツリーのレベル2に移動する。同様の理由で、このツリー基礎の決定プロセスは、サンプルがHyperdip>50 あるいは簡単に「OTHERS(その他)」.であるかを決定するレベル6で終わることができる。 A tree structure determination system was used to classify these samples, as shown in FIG. For a given sample, a rule is first used to classify whether it is a T-ALL or other subtype sample. If it is classified as T-ALL, the process ends. Otherwise, the process moves to level 2 of the tree to see if the sample is E2A-PBX1 or one of the other remaining subtypes. For similar reasons, this tree-based decision process can end at level 6 to determine if the sample is Hyperdip> 50 or simply “OTHERS”.
サンプルは、215個のサンプルの「訓練セット」と112個の目隠し「試験セット」に分割される。図6によれば、更に各々の2セットを6個のペアのサブセットに分割する必要がある、1個は、ツリーの各々のレベルに対応する。
表N
Table N
表-Nの「OTHERS1」、「OTHERS2」、「OTHERS3」、「OTHERS4」、「OTHERS5」及び「OTHERS」は、表の2行目に示すように、1個以上のALLのサブタイプから成る。“OTHERS1”, “OTHERS2”, “OTHERS3”, “OTHERS4”, “OTHERS5” and “OTHERS” in Table-N are composed of one or more ALL subtypes as shown in the second row of the table.
例4.1:EP発生
エマージングパターンは、2個のステップで作成される。最初のステップは、訓練セットの12,558個の遺伝子の間から最も差別的遺伝子を選定する。第2ステップは、選定された遺伝子を基礎にエマージングパターンを作成する。Example 4.1: EP generation An emerging pattern is created in two steps. The first step selects the most discriminating genes from among the 12,558 genes in the training set. In the second step, an emerging pattern is created based on the selected gene.
エントロピー基礎の遺伝子選定法が、遺伝子表現プロファイルに適用された。12,558個の遺伝子のほとんどが無視されるので、それは非常に有効であることを証明した。約1000個の遺伝子のみが分類に利用されるものとみなされた。10%選定率は、重要な規則を得るためのより簡単なプラットフォームを提供する。それにしても、1,000個ぐらいの遺伝子を手で検査することは、まだ退屈な仕事である。チイ・スクワード (χ2) 法、H.リュー & R. セチオノ、「Chi2 : 機能選定と数値属性の離散化」、Proceedings of the IEEE 7thInternational Conference on Tools with Artificial Intelligence、 338-391、(1995)、 H. ウイッテン& E. フランク、データマイニング: ジャバ装備を有する実務的機械学習ツールと技術、Morgan Kaufmann、San Mateo、CA、(2000)、及び相関基礎の機能選定(CFS)法、(ホール、相関基礎の機能選定機械学習、博士論文、 Department of Computer Science、University of waikato、Hamilton、New Zealand、(1998)及びウイッテン&フランク2000)が、重要遺伝子のための検索を更に狭めるために使われる。この研究で、もしCFS方法が20より大きくない数の遺伝子を返せば、そのとき、CFS-選定遺伝子は、エマージングパターンを得るために使用される。それ以外に、方法によるトップ20ランクの遺伝子が、使われる。Entropy-based gene selection methods have been applied to gene expression profiles. Since most of the 12,558 genes were ignored, it proved very effective. Only about 1000 genes were considered to be used for classification. The 10% selection rate provides a simpler platform for obtaining important rules. Even so, testing about 1,000 genes by hand is still a tedious task. Lichen-Sukuwado (χ2) method, H Liu & R. Sechiono,. "Chi2: discretization of the function selection and numericattributes", Proceedings of the IEEE 7 th International Conference on Tools with Artificial Intelligence, 338-391, (1995 ), H. Witten & E. Frank, Data Mining: Practical Machine Learning Tools and Technologies with Java Equipment, Morgan Kaufmann, San Mateo, CA, (2000), and Correlation-Based Function Selection (CFS) Method, (Hall Correlation-based function selection machine learning, doctoral dissertation, Department of Computer Science, University of waikato, Hamilton, New Zealand, (1998) and Witten & Frank 2000) are used to further narrow the search for important genes . In this study, if the CFS method returns a number of genes not greater than 20, then the CFS-selected genes are used to obtain an emerging pattern. In addition, the top 20 rank genes by method are used.
この例では、特別なタイプのEP’s、ジャンピング「左側境界」EP’sと呼ぶ、が発見された。2個のデータセットD1とD2を与える、これらEP’sは、次の条件の満足を要求する:(i) D1(あるいはD2)内のそれら頻度は、ゼロでない、しかし、別のデータセットは、ゼロである。(ii) 固有サブセットは全てEPでない。ジャンピング左側境界EP’sは、EP’s間の大きい頻度を有するEP’sであることに留意。更に、ジャンピング左側境界EP’sのほとんどは、D1とD2双方内でゼロ頻度を持っていない限り、EP’sである。In this example, a special type of EP's, called jumping “left boundary” EP's, was discovered. Given two data sets D1 and D2 , these EP's require that the following conditions be satisfied: (i) their frequency in D1 (or D2 ) is not zero, but another data The set is zero. (ii) All unique subsets are not EPs. Note that the jumping left boundary EP's is an EP's with a large frequency between EP's. Furthermore, most of the jumping left boundary EP's, unless you have a zero frequency by D1 and D2 both in a EP's.
最も差別的な遺伝子を選んで、離散化した後、BORDER-DIFF 及びJEP-PRODUCERアルゴリズム(ドン& リー、ACM SIGKDD、International Conference on Knowledge Discovery and Data Mining, San Diego, 43-52 (1999)、リー、正確で効率的な分類器の構築のためのマイニングエマージングパターン、博士論文、メルボルン大学、オーストラリア、(2001)、リー他、「ジャンピング・エマージングパターンの空間及びその漸増的な保守アルゴリズム」、Proceedings of 17th International Conference on Machine Learning、552-558、(2000))が、処理データセットからEP’sを発見するために利用された。ほとんどの操作は、境界であり、これらアルゴリズムは非常に効率的である。 After selecting and discretizing the most discriminatory genes, the BORDER-DIFF and JEP-PRODUCER algorithms (Don & Lee, ACM SIGKDD, International Conference on Knowledge Discovery and Data Mining, San Diego, 43-52 (1999), Lee Mining Emerging Patterns for Building Accurate and Efficient Classifiers, Doctoral Dissertations, University of Melbourne, Australia, (2001), Lee et al., "Jumping Emerging Pattern Space and Its Incremental Maintenance Algorithm", Proceedings of 17th International Conference on Machine Learning, 552-558, (2000)) was used to discover EP's from the processing data set. Most operations are boundaries, and these algorithms are very efficient.
例4.2 EP’sから得られた規則(ルール)
この章は、訓練データセットから発見したEP’sを報告する。パターンは、ALLの種々の遺伝子表現プロファイルを識別するために規則の形成に拡張されることが出来る。
T-ALL 対 OTHERS 1 に対する規則:Example 4.2. Rules obtained from EP's
This chapter reports EP's found from the training data set. The pattern can be extended to rule formation to identify various gene expression profiles of ALL.
Rules for T-ALL vs. OTHERS 1:
最初のデータセットペアーT-ALL 対 OTHERS1に対して、CFS法は、最も重要なものとして、ただ1個の遺伝子38319_atを選定した。離散化法は、この遺伝子の表現範囲を2個の区間(-∞, 15975.6) 及び [15975.6, +∞)に分割した。EP発見アルゴリズムを用いて、2個のEP’s {gene_38319_at@(-∞, 15975. 6)} 及び{ gene_38319_at@(15975. 6, +∞)}が得られた。先のものはT-ALLクラス内に100%頻度を、しかしOTHERS 1クラス内にゼロ頻度を有する、後のものは、T-ALLクラス内にゼロ頻度を、しかしOTHERS 1クラス内に100%頻度を有する。だから、私たちは、次の規則を有する。For the first data set pair T-ALL vs. OTHERS1, the CFS method selected only one gene 38319_at as the most important one. In the discretization method, the expression range of this gene was divided into two intervals (−∞, 15975.6) and [15975.6, + ∞). Using the EP discovery algorithm, two EP's {gene_38319 _at @ (-∞, 15975. 6)} and {gene_38319 _at @ (15975. 6, + ∞)} was obtained. The former has 100% frequency in the T-ALL class, but zero frequency in the
もし、38319_atの表現が、15975.6,以下であれば、
このALLサンプルは、T-ALLでなければならない、
それ以外、
OTHERS1内のサブタイプでなければならない。If the expression of 38319_at is below 155975.6,
This ALL sample must be T-ALL,
other than that,
Must be a subtype in OTHERS1.
この簡単な規則は、例外なく、215 ALLサンプル(28個のT-ALL + 187このOTHERS1)を規制する。 This simple rule regulates 215 ALL samples (28 T-ALL + 187 this OTHERS1) without exception.
E2A-PBX1対OTHERS2に関する規則
また、E2A-PBX1対OTHERS2に対する簡単な規則がある。方法は、1個の遺伝子33355_atを拾い上げ、そして、それを2個の区間(-∞, 10966) 及び [10966, +∞)に離散化した。
{gene_33355_at@(-∞, 10966) } 及び{gene_33355_at@(10966, +∞)}が、それぞれE2A-PBX1 及び OTHERS2内で頻度100%を有するEP’sであると発見された。だから、これら187 個のALLのサンプル(18 個のE2A-PBX1 + 169 個のOTHERS2)に対する規則は、Rules for E2A-PBX1 vs. OTHERS2 There are also simple rules for E2A-PBX1 vs. OTHERS2. The method picked up one gene 33355_at and discretized it into two intervals (−∞, 10966) and [10966, + ∞).
{gene_ 33355 _ at @ (- ∞, 10966)} and{gene_ 33355 _ at @ (10966 , + ∞)} it has been discovered to be EP's, each having a 100% frequency in the E2A-PBX1 and OTHERS2. So the rule for these 187 ALL samples (18 E2A-PBX1 + 169 OTHERS2) is
もし、33355_atの表現が、10966以下であれば、
このALLのサンプルは、E2A-PBX1でなければならない、
それ以外、
OTHERS2内のサブタイプでなければならない。If the expression of 33355_at is 10966 or less,
This ALL sample must be E2A-PBX1,
other than that,
Must be a subtype in OTHERS2.
残りの4個のペアデータセットに対して、CFS法は、20個以上の遺伝子を返す。だから、方法は、各々の4個のペアデータセットに対して、20個のトップ・ランク遺伝子が選ぶために使われる。表O、表P、表Q及び表Rは、それぞれ、選ばれた遺伝子、それらの区分及び4個のペアデータセットに対する区間への索引をリストする。索引は、遺伝子の名前及びそれら区間に一致し、結合するので、索引を用いてEP’sを読み、書きするにより便利である。
表O
Table O
選ばれた遺伝子の離散化後、4個のペアデータのそれぞれにEP’sの2個のグループが発見された。表-Sは、発見されたエマージングパターンの数を示す。表-Sの4行目は、発見されたエマージングパターンの数が比較的大きいことを示す。私たちは、それら頻度に従って、トップ10個のEP’sをリストするために、別の4個の表、表-T、表-U、表-V及び表-Wを用いる。それらトップ10のEP’sの頻度は、98. 94%に達することが出来、それらのほとんどは、80%付近である。トップにランク付けされたEPは、全てのクラスのサンプルをカバーしていないけれども、それはクラス全体を支配する。カウンターパートクラス内のそれらの不在は、トップにランク付けされたエマージングパターンが、クラスの性質を捕らえることが出来ることを実証する。
表S
Table S
どのようにEP’sを規則に通訳すべきかの実証として、TEL-AML1クラスの最初のEP、つまり、{2, 33}を検討する。表-Oの索引によれば、このEP内の2番目が38652_atの右側区間に合致する、そして38652_atの表現は、8,997. 35に等しいかそれより大きい条件にある。同様に33番は、36937_s_atの左側区間に合致する、そして36937_s_atの表現は、13,617. 05より小さい条件にある。ゆえに、パターン{2, 33}は、TEL-AML1クラスの92. 31%(52個のサンプルの内の48個)が上記の2つの条件を満足するが、OTHERS3からは1個もこれら双方の条件を満足しないことを意味する。従って、この場合、全てのクラスは、トップ10のEP’sのすこしの数で全部がカバーされる。これらEP’sは、望まれる規則である。 As a demonstration of how EP's should be translated into rules, consider the first EP in the TEL-AML1 class, {2, 33}. According to the index in Table-O, the second in this EP matches the right section of 38652_at, and the representation of 38652_at is in a condition equal to or greater than 8,997.35. Similarly, No. 33 matches the left side section of 36937_s_at, and the expression of 36937_s_at is under a condition smaller than 13,617.05. Therefore, in pattern {2, 33}, 92.31% of the TEL-AML1 class (48 out of 52 samples) satisfies the above two conditions, but OTHERS3 has one of both. It means that the condition is not satisfied. Thus, in this case, all classes are all covered with a few of the top 10 EP's. These EP's are the desired rules.
規則の信頼性をテストする重要な方法論は、それらを前もって不明のサンプル(つまり、目隠し試験サンプル)に適用することである。この例では、112個の目隠し試験サンプルが前もって用意された。試験結果の要約は次の通りである: An important methodology for testing the reliability of the rules is to apply them to previously unknown samples (ie blindfold test samples). In this example, 112 blindfold test samples were prepared in advance. A summary of the test results is as follows:
レベル1で、15個のT-ALLサンプル全てが、正しくT-ALLとして予測された、97個のOTHERS1サンプル全てが、正しくOTHERS1として予測された。 At
レベル2で、9個のE2A-PBX1サンプル全てが、正しくE2A-PBX1として予測された、88個のOTHERS2サンプル全てが、正しくOTHERS2として予測された。 At level 2, all 9 E2A-PBX1 samples were correctly predicted as E2A-PBX1, and all 88 OTHERS2 samples were correctly predicted as OTHERS2.
レベル3から6で、用いたEP’sの数に依存して、4−7個のサンプルのみに分類ミスがあった。大きな数のEP’sを用いることにより、誤差率は減少する。 At levels 3 to 6, depending on the number of EP's used, only 4-7 samples had misclassifications. By using a large number of EP's, the error rate is reduced.
レベル1及びレベル2の各々で1個の規則が発見された、これらの2つの規則を使うことに曖昧さはない。しかしながら、大きい数のEP’sが、ツリーの残りのレベルで見出された。従って、試験サンプルが、それ自身のクラスでEP’sを含むのみならずそのカウンターパートからもEP’sを含むので、信頼性のある予測には、カウンターパートEP’sから混乱信号を避ける「ホーム」クラスの多重高頻度EP’sを用いることが妥当である。だから、PCL法がレベル3から6に適用される。 There is no ambiguity in using these two rules where one rule was found at each of
複数の規則が用いられ、kを変えた時、試験精度が表-Xに示される。結果から、多重高頻度EP’s(あるいは多重の強い規則)がコンパクトで強力な尤度予測を提供することが出来ることを見ることが出来る。20、25及び30のkで、合計4個の分類ミスが作られた。4個の試験サンプルのIDは、ヤオ他、アメリカ血液学会43回年度会議、2001の表現方法を用いて、94-0359-U95A、 89-0142-U95A、 91-0697-U95A 及び 96-0379-U95Aである。
表X
Table X
多重・クラス予測への一般化
BCR-ABLテストサンプルは、トップ20のBCR-ABL判別器の全てのほとんどを含んでいた。そして、19.6のスコアがそれに割り当てられた。いくつかのトップ20「OTHERS」判別器と一緒にトップ20リストを越えるいくつかが、また、この試験サンプルに含まされた。そして、別のスコア6.97が割り当てられた。この試験サンプルは、E2A-PBXL、 Hyperdip>50 あるいは T-ALLの判別器は一切含まれなかった。そして、スコアは次の表-Yになる。
表Y
The BCR-ABL test sample contained most of all of the top 20 BCR-ABL discriminators. A score of 19.6 was then assigned to it. Some over the Top 20 list along with some Top 20 “OTHERS” discriminators were also included in this test sample. Then another score of 6.97 was assigned. This test sample did not include any E2A-PBXL, Hyperdip> 50 or T-ALL discriminator. And the score becomes the following table-Y.
Table Y
従って、このBCR-ABLサンプルは、非常に高い信頼性で、正しくBCR-ABLとして予測された。この方法によって、kを15から35まで変えた時、総数112個の試験サンプルに対して6から8個のみの分類ミスであった。しかしながら、C4.5、SVM、NB, 及び 3-NNは、それぞれ 27、26、29及び11個のミスがあった。 Therefore, this BCR-ABL sample was predicted as BCR-ABL correctly with very high reliability. With this method, when k was varied from 15 to 35, there were only 6 to 8 misclassifications for a total of 112 test samples. However, C4.5, SVM, NB, and 3-NN had 27, 26, 29, and 11 mistakes, respectively.
分類への改善
レベル1及びレベル2で、1個のみの遺伝子が分類及び予測に使用された。記録データ中の人的誤差や、まれだが存在するDNAチップによる機械的誤差などの可能な誤差を克服するために、1個以上の遺伝子が、システムを強力にするために使われ得る。Improvement to classification At
離散化方法によって分割される時、レベル1で、事前に選定された1個の遺伝子38319_atは、ゼロのエントロピーを有する。ゼロのエントロピーを有する他の遺伝子は無いことがわかる。そして、χ2法によりランク付けされたトップ20の遺伝子が、T-ALL及び OTHERS 1試験サンプルを分類するために選ばれた。これから、96個のEP’sと146個のEP’sが、それぞれT-ALL及び OTHERS 1クラス内で発見された。予測方法を用いて、目隠し試験サンプルに関して同じ完全精度100%が、単一の遺伝子が用いられた時のように達せられる。When divided by the discretization method, one gene 38319_at preselected at
レベル2で、離散化方法によって分割された時、ゼロ エントロピーを有する総計5個の遺伝子がある。5個の遺伝子の名前は、430_at、1287_at、33355_at、41146_at及び 32063_atである。33355_atは、事前選定の1個の遺伝子であることに留意。5個の遺伝子全ては、それぞれ次のカットポイント、30,246.05、34,313.9、10,966.25、842.15及び 4,068.7、で2個の区間に分割される。エントロピー ゼロとして、頻度100%を有するE2A-PBX1クラス及び OTHERS2クラス内で5個のEP’sがある。PCL予測法を用いて、全試験サンプル(レベル2で)がミス無しで正しく分類された、再度完全100%制度が達成した。 At level 2, when divided by the discretization method, there are a total of 5 genes with zero entropy. The names of the five genes are 430_at, 1287_at, 33355_at, 41146_at and 32063_at. Note that 33355_at is a pre-selected gene. All five genes are divided into two sections at the following cut points: 30,246.05, 34,313.9, 10,966.25, 842.15 and 4,068.7, respectively. As entropy zero, there are 5 EP's in the E2A-PBX1 class and OTHERS2 class with a frequency of 100%. Using the PCL prediction method, the complete 100% system was achieved again, with all test samples (at level 2) correctly classified without error.
他の方法との比較
表-Zにおいて、予想精度が、同じ選定された遺伝子及び同じ訓練及び試験サンプルを用いて、k-NN、C4.5、NB及び SVM法によって達成された精度と比較される。PCL法は、C4.5の 14から71 %、NBの8から50%、k-NNの7から43%及びSVMの6.1から33%の分類ミスを減じた。医療取り扱いの観点から、この誤差の減少は、大いに患者のためになる。
表Z
Table Z
最初に議論したように、SVM、NB及びk- NNに対してPCL方法の明らかな利点は、意味ある及び信頼性のあるパターンと規則が得られることである。それらのエマージングパターンは、新しい洞察を遺伝子の相関と相互作用に提供することが出来、そして単に分類ができるというより更に詳細なサンプルの理解を手伝うことができる。C4.5は、同様な規則を発生できるが、時々悪く作用し(例えば、レベル6)、その規則は信頼性がない。 As first discussed, the obvious advantage of the PCL method over SVM, NB and k-NN is that it yields meaningful and reliable patterns and rules. These emerging patterns can provide new insights into gene correlations and interactions, and can help with a more detailed sample understanding than just being able to classify. C4.5 can generate similar rules, but sometimes it works badly (eg level 6) and the rules are not reliable.
トップの20の遺伝子の使用の査定
最も重要な遺伝子の確認のための努力や計算がなされた。実験結果は、選定されたトップ遺伝子あるいはトップ20の遺伝子がPCL予測法で非常に有用であることが示された。しかしながら、選定された遺伝子の品質を判定する他の方法が可能である。この場合、20個の遺伝子あるいは1個の遺伝子がランダム(無作為)に拾い上げられ、精度の差異が調査される。Assessment of use of top 20 genes Efforts and calculations were made to identify the most important genes. The experimental results showed that the selected top genes or top 20 genes are very useful in the PCL prediction method. However, other methods for determining the quality of the selected gene are possible. In this case, 20 genes or one gene is picked randomly (randomly), and the difference in accuracy is investigated.
手順は、(a):レベル1及びレベル2で1個の遺伝子をランダムに選び、そして残りの4レベルの各々でランダムに20個の遺伝子を選ぶ、(b):SVM及び k-NNを走らす、各々のレベルの試験サンプルに関するそれら精度を得る、及び(c):(a)と(b)を100回繰り返す、そして平均と他の統計を計算する。 The procedure is (a): randomly select one gene at
表-AAは、SVMとK-NNによる100回実験の最小、最大及び平均精度を示す。比較のために、ダミー分類器が、またリストされる。ダミー分類器によって、2個のアンバランスなクラスのデータが与えられたとすると、全ての試験サンプルは、大きいクラスとして平凡に予測される。次の2つの重要な事実が明らかになる。第1は、全ての平均精度はそれらダミー精度より低いか、わずかに大きい。第2は、全ての平均精度は著しく(少なくとも9%)選定遺伝子基準の精度より低い。差異は30%に達する。ゆえに、遺伝子選定方法は、予測方法で効率的に動作する。機能選定方法は、信頼の高い正確な予測モデルが確率される前の重要な基本ステップである。
表AA
Table AA
12,558個の遺伝子を持つオリジナルデータが予測法に適用されれば、また、精度の高い計算が可能である。実験結果は、遺伝子選定方法がまた大きな差異を生むことを示す。オリジナルデータに対して、SVM、k-NN、NB及び C4.5法は、それぞれ目隠し試験サンプルに関して23、23、63及び26個の分類ミスを作る。これらの結果は、減少データがそれぞれSVM、k-NN、NB及び C4.5法に適用されると、誤差率6、7、8及び13より更に悪い。従って、遺伝子選定方法は、信頼度のある予測モデルの確率のために重要である。 If original data with 12,558 genes is applied to the prediction method, it is possible to calculate with high accuracy. Experimental results show that gene selection methods also make a big difference. For the original data, the SVM, k-NN, NB, and C4.5 methods make 23, 23, 63, and 26 classification errors for the blind test samples, respectively. These results are even worse than the error rates 6, 7, 8 and 13 when the reduced data is applied to the SVM, k-NN, NB and C4.5 methods, respectively. Therefore, the gene selection method is important for the probability of a reliable prediction model.
最後に、エマージングパターン基礎の方法は、特に遺伝子表現ファイルの分類に適用した時、高い精度と簡単な翻訳の双方に利点を有する。ALLサンプルの大きな集合の試験の時、方法は、精度良くそのサブタイプの全てを分類し、そして誤差率は、C4. 5、NB、SVM及びK-NNに比べて著しく小さい。試験は、訓練用でおおよそデータの2/3が、目隠し試験用で残りの1/3を使うことで実行された。事実、誤差率の同様な改善が、表-BBに示すように、また、訓練データに関して10・フォールド・クロス・バリデーション(10-fold cross validation)試験において観察された。
表BB
Table BB
本発明の精神及び範囲を逸脱しないで、ここに開示した発明を実現するために構成要素の変更や修正を与えても良いことは明らかであろう。たとえば、種々の変数、データセット、コンピュータ読み込みメデイア、計算装置の利用は全て、本発明の範囲である。だから、そのような追加の具体例も本発明及びここに要求する特許請求の範囲内である。 It will be apparent that changes and modifications may be made to the components to implement the invention disclosed herein without departing from the spirit and scope of the invention. For example, the use of various variables, data sets, computer read media, and computing devices are all within the scope of the present invention. Thus, such additional embodiments are also within the scope of the invention and the claims required herein.
112:ファイルシステム
114:アプリケーションプログラム
118:統計分析ツール
120:ソーティングツール
122:エマージングパターン
124:発生頻度
126:データセットD
128:第一クラスD1
130:第二クラスD2
132:試験データT
202:EP’s及びD1、D2における発生頻度抽出
204:EP’s及びTにおける発生頻度抽出
206:D1あるいはD2であるTの尤度集合予測112: File system
114: Application program
118: Statistical analysis tools
120: Sorting tool
122: Emerging pattern
124: Frequency of occurrence
126: Data set D
128: First class D1
130: Second class D2
132: Test data T
202: Frequency of occurrence in EP's, D1, and D2
204: Frequency of occurrence in EP's and T
206: Prediction of likelihood set of T which is D1 or D2
Claims (75)
Translated fromJapanese少なくとも、各々の前記n個のクラスのデータの1個の実例を有する訓練データセットDから、複数のエマージングパターンを抽出すること、
n個のリストを作成すること、そこでは、
前記n個のリストのi番目のリストが、i番目のクラスのデータ内のゼロでない頻度を有する前記複数のエマージングパターンから各々のエマージングパターンEPi(m)の発生頻度fi(m)を含む、ことを特徴とし、
kは、複数のエマージングパターンでのエマージングパターンの総数よりも本質的に少ない数である、固定数kのエマージングパターンを用いて、n個のスコアの計算すること、そこでは、
前記n個のスコアのi番目のスコアを、また前記試験データで発生する前記i番目のスコアのk個のエマージングパターンの頻度から得ることを特徴とし、
そして
前記n個のスコアのもっとも高いものを選ぶことにより、試験データが、前記n個のクラスのデータのどこに分類されるかを推論すること、
から成る、nが2又はそれ以上であるn個のクラスのひとつに、試験データTを有する試験サンプルが分類されるかどうかを決定する方法。A method for determining whether a test sample having test data T is classified into one of n classes where n is 2 or more, comprising:
Extracting a plurality of emerging patterns from a training data set D having at least one instance of each of the n classes of data;
Create n lists, where
The i-th list of the n lists includes the occurrence frequency fi (m) of each emerging pattern EPi (m) from the plurality of emerging patterns having a non-zero frequency in the i-th class of data. , Characterized by
k is a number of emerging patterns with a fixed number k, which is essentially less than the total number of emerging patterns in multiple emerging patterns, where
The i-th score of the n scores is obtained from the frequency of k emerging patterns of the i-th score generated in the test data,
And inferring where the test data is classified in the n classes of data by selecting the highest of the n scores,
A method for determining whether a test sample having test data T is classified into one of n classes where n is 2 or more.
ことを特徴とする請求の範囲前記いずれかの請求項記載の方法。n = 2
A method according to any of the preceding claims.
ことを特徴とする請求の範囲第1から8項のいずれかに記載の方法。n = 3 or more,
9. A method according to any one of claims 1 to 8, characterized in that
少なくとも、第1クラスデータの1個の実例と第2クラスデータの1個の実例を有する訓練データセットDから、複数のエマージングパターンを抽出すること、
第1及び第2リストを作成すること、そこでは、
前記第1リストは、前記第1クラスのデータのゼロでない頻度を有する前記複数のエマージングパターンから各々のエマージングパターンEP1(m)の発生頻度f1(m)を含み、
前記第2リストは、前記第2クラスのデータのゼロでない頻度を有する前記複数のエマージングパターンから各々のエマージングパターンEP2(m)の発生頻度f2(m)を含む、ことを特徴とし、
kが、複数のエマージングパターンでのエマージングパターンの総数よりも本質的に少ない数である、固定数kのエマージングパターンを用いて、
また前記試験データで発生する前記第1リストのk個のエマージングパターンの頻度から得られる第1スコアと、
また前記試験データで発生する前記第2リストのk個のエマージングパターンの頻度から得られる第2スコアと、を計算すること、
前記第1および第2スコアの高いものを選ぶことにより、試験データが、前記第1クラスあるいは第2クラスのデータに分類されるかどうかを推論すること、
から成る、第1クラスあるいは第2クラスに、試験データTを有する試験サンプルが分類されるかどうかを決定する方法。A method for determining whether a test sample having test data T is classified into a first class or a second class, comprising:
Extracting a plurality of emerging patterns from a training data set D having at least one instance of first class data and one instance of second class data;
Creating the first and second lists, where:
The first list includes an occurrence frequency f1 (m) of each of the emerging patterns EP1 (m) from the plurality of emerging patterns having a non-zero frequency of the first class of data;
The second list includes an occurrence frequency f2 (m) of each emerging pattern EP2 (m) from the plurality of emerging patterns having a non-zero frequency of the data of the second class,
With a fixed number k of emerging patterns, where k is essentially less than the total number of emerging patterns in multiple emerging patterns,
A first score obtained from the frequency of k emerging patterns of the first list generated in the test data;
Calculating a second score obtained from the frequency of the k emerging patterns in the second list generated in the test data;
Inferring whether the test data is classified as data of the first class or the second class by selecting the one with the first and second high scores;
A method for determining whether a test sample having test data T is classified into a first class or a second class.
前記第三リストは、また前記試験データに発生し、そして前記第1クラスのデータにゼロでない発生を有する前記複数のエマージングパターンから各々のエマージングパターンimの前記第1クラスのデータにおける発生頻度f1 (im)を含み、
前記第四リストは、また前記試験データに発生し、そして前記第2クラスのデータにゼロでない発生を有する前記複数のエマージングパターンから各々のエマージングパターンjmの前記第2クラスのデータにおける発生頻度f2(jm)を含む、ことを特徴とし、そして
前記第三リストのエマージングパターンは、第1クラスのデータの前記発生頻度の降順に並べられ、そして
前記第四リストのエマージングパターンは、第2クラスのデータの前記発生頻度の降順に並べられる、
ことを特徴とする請求の範囲第11から14項のいずれかに記載の方法。In addition, it consists of creating a third list and a fourth list, where:
Said third list and said generated test data, and the first frequency in said first class of data classes each emerging pattern im from the plurality of emerging patterns with generating non-zero data of f1 (im )
The fourth list also occurs in the test data, and from the plurality of emerging patterns having non-zero occurrences in the second class data, the occurrence frequency f in the second class data of each emerging pattern jm2 (jm ), and the emerging patterns of the third list are arranged in descending order of the occurrence frequency of the data of the first class, and the emerging patterns of the fourth list are the second Arranged in descending order of the occurrence frequency of class data,
15. A method according to any one of claims 11 to 14, characterized in that
コンピュータプログラム製品は、コンピュータシステムに関連して用いられるものであり、
コンピュータプログラム製品は、コンピュータの読み出し可能な蓄積媒体とそこにはめ込まれたコンピュータプログラム機構から成り、
コンピュータプログラム機構は、
少なくとも1個の統計分析ツールと、
少なくとも1個のソーティングツールと、
少なくとも第1クラスのデータの1個の実例と、少なくとも第2クラスのデータの1個の実例とを有するデータセットにアクセスするための制御命令と、
前記データセットから複数のエマージングパターンを抽出することと、
第1リストと第2リストの作成、そこでは、
各々の前記複数のエマージングパターンに対して、
第1リストは、前記第1クラスのデータ内でゼロでない発生を有する前記複数のエマージングパターンから各々のエマージングパターンiの発生頻度fi(1)を含み、
第2リストは、前記第2クラスのデータ内でゼロでない発生を有する前記複数のエマージングパターンから各々のエマージングパターンiの発生頻度fi(2)を含む、ことを特徴とし、
kが、複数のエマージングパターンでのエマージングパターンの総数よりも本質的に少ない数である、固定数kのエマージングパターンを用いて、
また前記試験データで発生する前記第1リストのk個のエマージングパターンの頻度から得られる第1スコアと、
また前記試験データで発生する前記第2リストのk個のエマージングパターンの頻度から得られる第2スコアと、を計算し、
前記第1および第2スコアの高いものを選ぶことにより、試験データが、前記第1クラスあるいは第2クラスのデータに分類されるかどうかを推論することから成る、
試験データが存在する試験サンプルが、第1のクラスあるいは第2のクラスに分類されるかどうかを決定するためのコンピュータプログラム製品。A computer program product for determining whether a test sample for which test data exists is classified into a first class or a second class,
Computer program products are used in connection with computer systems,
A computer program product consists of a computer readable storage medium and a computer program mechanism embedded therein,
The computer program mechanism
At least one statistical analysis tool;
At least one sorting tool;
A control instruction for accessing a data set having at least one instance of first class data and at least one instance of second class data;
Extracting a plurality of emerging patterns from the data set;
Create the first and second lists, where
For each of the plurality of emerging patterns,
The first list includes an occurrence frequency fi(1) of each emerging pattern i from the plurality of emerging patterns having a non-zero occurrence in the first class of data;
The second list includes occurrence frequencies fi(2) of each emerging pattern i from the plurality of emerging patterns having non-zero occurrences in the second class of data,
With a fixed number k of emerging patterns, where k is essentially less than the total number of emerging patterns in multiple emerging patterns,
A first score obtained from the frequency of k emerging patterns of the first list generated in the test data;
A second score obtained from the frequency of the k emerging patterns of the second list generated in the test data;
By inferring whether the test data is classified into the first class or second class data by choosing the one with the higher first and second scores,
A computer program product for determining whether a test sample for which test data exists is classified into a first class or a second class.
システムは、
少なくとも1個のメモリと、
少なくとも1個のプロセッサーと、
少なくとも1個のユーザーインターフェースとから成り、
全ては、少なくとも1個のバスで互いに接続され、
そこでは、前記少なくとも1個のプロセッサーは、
少なくとも第1クラスのデータの1個の実例と少なくとも第2クラスのデータの1個の実例を有するデータセットをアクセスと、
前記データセットから複数のエマージングパターンを抽出と、
第1リストと第2リストの作成とを行うことを特徴とし、
そこで、
各々の前記複数のエマージングパターンに対して、
第1リストは、前記第1クラスのデータ内でゼロでない発生を有する前記複数のエマージングパターンから各々のエマージングパターンiの発生頻度fi(1)を含み、
第2リストは、前記第2クラスのデータ内でゼロでない発生を有する前記複数のエマージングパターンから各々のエマージングパターンiの発生頻度fi(2)を含み、
kが、複数のエマージングパターンでのエマージングパターンの総数よりも本質的に少ない数である、固定数kのエマージングパターンを用い、
また前記試験データで発生する前記第1リストのk個のエマージングパターンの頻度から得られる第1スコアと、
また前記試験データで発生する前記第2リストのk個のエマージングパターンの頻度から得られる第2スコアと、を計算し、
前記第1および第2スコアの高いものを選ぶことにより、試験データが、前記第1クラスあるいは第2クラスのデータに分類されるかどうかを推論すること
を特徴とする
試験データが存在する試験サンプルが、第1のクラスあるいは第2のクラスに分類されるかどうかを決定するためのシステム。A system for determining whether a test sample for which test data exists is classified into a first class or a second class,
the system,
At least one memory;
At least one processor;
Consisting of at least one user interface,
All connected to each other by at least one bus,
Wherein the at least one processor is
Accessing a data set having at least one instance of first class data and at least one instance of second class data;
Extracting a plurality of emerging patterns from the data set;
The first list and the second list are created,
there,
For each of the plurality of emerging patterns,
The first list includes an occurrence frequency fi(1) of each emerging pattern i from the plurality of emerging patterns having a non-zero occurrence in the first class of data;
The second list includes occurrence frequencies fi (2) of each emerging pattern i from the plurality of emerging patterns having non-zero occurrences in the second class of data;
Using a fixed number k of emerging patterns, where k is essentially less than the total number of emerging patterns in multiple emerging patterns,
A first score obtained from the frequency of k emerging patterns of the first list generated in the test data;
A second score obtained from the frequency of the k emerging patterns of the second list generated in the test data;
A test sample in which test data exists is characterized by inferring whether the test data is classified into the data of the first class or the second class by selecting one having a high first and second score. For determining whether is classified into the first class or the second class.
そこでは、
前記第三リストは、また前記試験データに発生し、そして前記第1クラスのデータにゼロでない発生を有する前記複数のエマージングパターンから各々のエマージングパターンimの前記第1クラスのデータにおける発生頻度f1(im)を含み、
前記第四リストは、また前記試験データに発生し、そして前記第2クラスのデータにゼロでない発生を有する前記複数のエマージングパターンから各々のエマージングパターンjmの前記第2クラスのデータにおける発生頻度f2(jm)を含む、ことを特徴とし、そして
前記第三リストのエマージングパターンは、第1クラスのデータの前記発生頻度の降順に並べられ、そして
前記第四リストのエマージングパターンは、第2クラスのデータの前記発生頻度の降順に並べられる、ことを特徴とすることを特徴とする請求の範囲第57から60項のいずれかに記載のシステム。In addition, the processor performs the creation of the third list and the fourth list,
Where,
Said third list and said generated test data, and the first frequency in said first class of data classes each emerging pattern im from the plurality of emerging patterns with generating non-zero data of f wherein1(i m),
The fourth list also occurs in the test data, and from the plurality of emerging patterns having non-zero occurrences in the second class data, the occurrence frequency f in the second class data of each emerging pattern jm2 (jm ), and the emerging patterns of the third list are arranged in descending order of the occurrence frequency of data of the first class, and the emerging patterns of the fourth list are the second 61. The system according to claim 57, wherein the system is arranged in descending order of the occurrence frequency of class data.
前記第1スコアを、次の式:
The first score is expressed by the following formula:
複数の癌セルに対する遺伝子表現データと複数の正常セルに対する遺伝子表現データから成るデータセットから複数のエマージングパターンを抽出することと、
第1リスト及び第2リストを作成すること、
そこでは、
前記第1リストは、前記癌セル内のゼロでない頻度を有する前記複数のエマージングパターンから各々のエマージングパターンiの発生頻度fi(1)を含み、
前記第2リストは、前記正常セル内のゼロでない頻度を有する前記複数のエマージングパターンから各々のエマージングパターンiの発生頻度f2(2)を含む、ことを特徴とする、と、
kが、複数のエマージングパターンでのエマージングパターンの総数よりも本質的に少ない数である、固定数kのエマージングパターンを用いて、
また前記試験データで発生する前記第1リストのk個のエマージングパターンの頻度から得られる第1スコアと、
また前記試験データで発生する前記第2リストのk個のエマージングパターンの頻度から得られる第2スコアと、を計算することと、
前記第1スコアが、前記第2スコアよりも高い場合、サンプルデータが、癌かどうかを推論する、
ことから成るサンプルセルが癌かどうかを決める方法。A method for determining whether a sample cell is cancer,
Extracting multiple emerging patterns from a data set comprising gene expression data for multiple cancer cells and gene expression data for multiple normal cells;
Creating a first list and a second list;
Where,
The first list includes an occurrence frequency fi(1) of each emerging pattern i from the plurality of emerging patterns having a non-zero frequency in the cancer cell;
The second list includes an occurrence frequency f2(2) of each emerging pattern i from the plurality of emerging patterns having a non-zero frequency in the normal cell; and
With a fixed number k of emerging patterns, where k is essentially less than the total number of emerging patterns in multiple emerging patterns,
A first score obtained from the frequency of k emerging patterns of the first list generated in the test data;
Calculating a second score obtained from the frequency of the k emerging patterns of the second list generated in the test data;
If the first score is higher than the second score, the sample data infers whether it is cancer;
A method for determining whether a sample cell comprising cancer is cancer.
Applications Claiming Priority (1)
| Application Number | Priority Date | Filing Date | Title |
|---|---|---|---|
| PCT/SG2002/000190WO2004019264A1 (en) | 2002-08-22 | 2002-08-22 | Prediction by collective likelihood from emerging patterns |
Publications (1)
| Publication Number | Publication Date |
|---|---|
| JP2005538437Atrue JP2005538437A (en) | 2005-12-15 |
Family
ID=31944989
Family Applications (1)
| Application Number | Title | Priority Date | Filing Date |
|---|---|---|---|
| JP2004530722APendingJP2005538437A (en) | 2002-08-22 | 2002-08-22 | Prediction with likelihood set from emerging patterns |
Country Status (6)
| Country | Link |
|---|---|
| US (1) | US20060074824A1 (en) |
| EP (1) | EP1550074A4 (en) |
| JP (1) | JP2005538437A (en) |
| CN (1) | CN1316419C (en) |
| AU (1) | AU2002330830A1 (en) |
| WO (1) | WO2004019264A1 (en) |
Cited By (1)
| Publication number | Priority date | Publication date | Assignee | Title |
|---|---|---|---|---|
| JP2015527635A (en)* | 2012-06-21 | 2015-09-17 | フィリップ モリス プロダクツ エス アー | System and method for generating biomarker signatures using an integrated dual ensemble and generalized simulated annealing technique |
Families Citing this family (96)
| Publication number | Priority date | Publication date | Assignee | Title |
|---|---|---|---|---|
| US8041541B2 (en)* | 2001-05-24 | 2011-10-18 | Test Advantage, Inc. | Methods and apparatus for data analysis |
| US20040163044A1 (en)* | 2003-02-14 | 2004-08-19 | Nahava Inc. | Method and apparatus for information factoring |
| JP4202798B2 (en)* | 2003-03-20 | 2008-12-24 | 株式会社東芝 | Time series pattern extraction apparatus and time series pattern extraction program |
| US8655911B2 (en)* | 2003-08-18 | 2014-02-18 | Oracle International Corporation | Expressing frequent itemset counting operations |
| US20060089828A1 (en)* | 2004-10-25 | 2006-04-27 | International Business Machines Corporation | Pattern solutions |
| WO2006062485A1 (en)* | 2004-12-08 | 2006-06-15 | Agency For Science, Technology And Research | A method for classifying data |
| US8244689B2 (en)* | 2006-02-17 | 2012-08-14 | Google Inc. | Attribute entropy as a signal in object normalization |
| US7769579B2 (en) | 2005-05-31 | 2010-08-03 | Google Inc. | Learning facts from semi-structured text |
| FR2882171A1 (en)* | 2005-02-14 | 2006-08-18 | France Telecom | METHOD AND DEVICE FOR GENERATING A CLASSIFYING TREE TO UNIFY SUPERVISED AND NON-SUPERVISED APPROACHES, COMPUTER PROGRAM PRODUCT AND CORRESPONDING STORAGE MEDIUM |
| US9208229B2 (en) | 2005-03-31 | 2015-12-08 | Google Inc. | Anchor text summarization for corroboration |
| US7587387B2 (en) | 2005-03-31 | 2009-09-08 | Google Inc. | User interface for facts query engine with snippets from information sources that include query terms and answer terms |
| US8682913B1 (en) | 2005-03-31 | 2014-03-25 | Google Inc. | Corroborating facts extracted from multiple sources |
| US8996470B1 (en) | 2005-05-31 | 2015-03-31 | Google Inc. | System for ensuring the internal consistency of a fact repository |
| US7831545B1 (en) | 2005-05-31 | 2010-11-09 | Google Inc. | Identifying the unifying subject of a set of facts |
| US7567976B1 (en)* | 2005-05-31 | 2009-07-28 | Google Inc. | Merging objects in a facts database |
| JP4429236B2 (en) | 2005-08-19 | 2010-03-10 | 富士通株式会社 | Classification rule creation support method |
| WO2007067956A2 (en)* | 2005-12-07 | 2007-06-14 | The Trustees Of Columbia University In The City Of New York | System and method for multiple-factor selection |
| US7991797B2 (en) | 2006-02-17 | 2011-08-02 | Google Inc. | ID persistence through normalization |
| US8260785B2 (en)* | 2006-02-17 | 2012-09-04 | Google Inc. | Automatic object reference identification and linking in a browseable fact repository |
| US8700568B2 (en) | 2006-02-17 | 2014-04-15 | Google Inc. | Entity normalization via name normalization |
| US8234077B2 (en) | 2006-05-10 | 2012-07-31 | The Trustees Of Columbia University In The City Of New York | Method of selecting genes from gene expression data based on synergistic interactions among the genes |
| US8762165B2 (en) | 2006-06-14 | 2014-06-24 | Bosch Automotive Service Solutions Llc | Optimizing test procedures for a subject under test |
| US8428813B2 (en) | 2006-06-14 | 2013-04-23 | Service Solutions Us Llc | Dynamic decision sequencing method and apparatus for optimizing a diagnostic test plan |
| US7643916B2 (en) | 2006-06-14 | 2010-01-05 | Spx Corporation | Vehicle state tracking method and apparatus for diagnostic testing |
| US20070293998A1 (en)* | 2006-06-14 | 2007-12-20 | Underdal Olav M | Information object creation based on an optimized test procedure method and apparatus |
| US9081883B2 (en) | 2006-06-14 | 2015-07-14 | Bosch Automotive Service Solutions Inc. | Dynamic decision sequencing method and apparatus for optimizing a diagnostic test plan |
| US8423226B2 (en)* | 2006-06-14 | 2013-04-16 | Service Solutions U.S. Llc | Dynamic decision sequencing method and apparatus for optimizing a diagnostic test plan |
| US7958407B2 (en)* | 2006-06-30 | 2011-06-07 | Spx Corporation | Conversion of static diagnostic procedure to dynamic test plan method and apparatus |
| US20100324376A1 (en)* | 2006-06-30 | 2010-12-23 | Spx Corporation | Diagnostics Data Collection and Analysis Method and Apparatus |
| US8122026B1 (en) | 2006-10-20 | 2012-02-21 | Google Inc. | Finding and disambiguating references to entities on web pages |
| US8291371B2 (en)* | 2006-10-23 | 2012-10-16 | International Business Machines Corporation | Self-service creation and deployment of a pattern solution |
| US8086409B2 (en) | 2007-01-30 | 2011-12-27 | The Trustees Of Columbia University In The City Of New York | Method of selecting genes from continuous gene expression data based on synergistic interactions among genes |
| US7873634B2 (en) | 2007-03-12 | 2011-01-18 | Hitlab Ulc. | Method and a system for automatic evaluation of digital files |
| US8347202B1 (en) | 2007-03-14 | 2013-01-01 | Google Inc. | Determining geographic locations for place names in a fact repository |
| US8239350B1 (en) | 2007-05-08 | 2012-08-07 | Google Inc. | Date ambiguity resolution |
| US7966291B1 (en) | 2007-06-26 | 2011-06-21 | Google Inc. | Fact-based object merging |
| US7970766B1 (en) | 2007-07-23 | 2011-06-28 | Google Inc. | Entity type assignment |
| US8744891B1 (en)* | 2007-07-26 | 2014-06-03 | United Services Automobile Association (Usaa) | Systems and methods for dynamic business decision making |
| US8738643B1 (en) | 2007-08-02 | 2014-05-27 | Google Inc. | Learning synonymous object names from anchor texts |
| US8046322B2 (en)* | 2007-08-07 | 2011-10-25 | The Boeing Company | Methods and framework for constraint-based activity mining (CMAP) |
| US8812435B1 (en) | 2007-11-16 | 2014-08-19 | Google Inc. | Learning objects and facts from documents |
| US20090216401A1 (en)* | 2008-02-27 | 2009-08-27 | Underdal Olav M | Feedback loop on diagnostic procedure |
| US20090216584A1 (en)* | 2008-02-27 | 2009-08-27 | Fountain Gregory J | Repair diagnostics based on replacement parts inventory |
| US8239094B2 (en)* | 2008-04-23 | 2012-08-07 | Spx Corporation | Test requirement list for diagnostic tests |
| WO2010025290A2 (en) | 2008-08-29 | 2010-03-04 | Weight Watchers International, Inc. | Processes and systems based on metabolic conversion efficiency |
| DE102008046703A1 (en)* | 2008-09-11 | 2009-07-23 | Siemens Ag Österreich | Automatic patent recognition system training and testing method for e.g. communication system, involves repeating searching and storing of key words to be identified until predetermined final criterion is fulfilled |
| US20100235344A1 (en)* | 2009-03-12 | 2010-09-16 | Oracle International Corporation | Mechanism for utilizing partitioning pruning techniques for xml indexes |
| US8648700B2 (en)* | 2009-06-23 | 2014-02-11 | Bosch Automotive Service Solutions Llc | Alerts issued upon component detection failure |
| US8370386B1 (en) | 2009-11-03 | 2013-02-05 | The Boeing Company | Methods and systems for template driven data mining task editing |
| US11398310B1 (en) | 2010-10-01 | 2022-07-26 | Cerner Innovation, Inc. | Clinical decision support for sepsis |
| US10431336B1 (en) | 2010-10-01 | 2019-10-01 | Cerner Innovation, Inc. | Computerized systems and methods for facilitating clinical decision making |
| US20120089421A1 (en) | 2010-10-08 | 2012-04-12 | Cerner Innovation, Inc. | Multi-site clinical decision support for sepsis |
| US10628553B1 (en) | 2010-12-30 | 2020-04-21 | Cerner Innovation, Inc. | Health information transformation system |
| US8856156B1 (en) | 2011-10-07 | 2014-10-07 | Cerner Innovation, Inc. | Ontology mapper |
| US8856130B2 (en)* | 2012-02-09 | 2014-10-07 | Kenshoo Ltd. | System, a method and a computer program product for performance assessment |
| US10163063B2 (en)* | 2012-03-07 | 2018-12-25 | International Business Machines Corporation | Automatically mining patterns for rule based data standardization systems |
| US10249385B1 (en) | 2012-05-01 | 2019-04-02 | Cerner Innovation, Inc. | System and method for record linkage |
| US8543523B1 (en) | 2012-06-01 | 2013-09-24 | Rentrak Corporation | Systems and methods for calibrating user and consumer data |
| US9110969B2 (en)* | 2012-07-25 | 2015-08-18 | Sap Se | Association acceleration for transaction databases |
| CN102956023B (en)* | 2012-08-30 | 2016-02-03 | 南京信息工程大学 | A kind of method that traditional meteorological data based on Bayes's classification and perception data merge |
| US9282894B2 (en)* | 2012-10-08 | 2016-03-15 | Tosense, Inc. | Internet-based system for evaluating ECG waveforms to determine the presence of p-mitrale and p-pulmonale |
| US11894117B1 (en) | 2013-02-07 | 2024-02-06 | Cerner Innovation, Inc. | Discovering context-specific complexity and utilization sequences |
| US10769241B1 (en) | 2013-02-07 | 2020-09-08 | Cerner Innovation, Inc. | Discovering context-specific complexity and utilization sequences |
| US10946311B1 (en) | 2013-02-07 | 2021-03-16 | Cerner Innovation, Inc. | Discovering context-specific serial health trajectories |
| CA2920608C (en)* | 2013-05-28 | 2018-07-24 | Five3 Genomics, Llc | Paradigm drug response networks |
| US10854334B1 (en) | 2013-08-12 | 2020-12-01 | Cerner Innovation, Inc. | Enhanced natural language processing |
| US12020814B1 (en) | 2013-08-12 | 2024-06-25 | Cerner Innovation, Inc. | User interface for clinical decision support |
| US10483003B1 (en) | 2013-08-12 | 2019-11-19 | Cerner Innovation, Inc. | Dynamically determining risk of clinical condition |
| US10521439B2 (en)* | 2014-04-04 | 2019-12-31 | Fraunhofer-Gesellschaft zur Förderung der angewandten Forschung e.V. | Method, apparatus, and computer program for data mining |
| US20150332182A1 (en)* | 2014-05-15 | 2015-11-19 | Lightbeam Health Solutions, LLC | Method for measuring risks and opportunities during patient care |
| WO2016028252A1 (en)* | 2014-08-18 | 2016-02-25 | Hewlett Packard Enterprise Development Lp | Interactive sequential pattern mining |
| US20170011312A1 (en)* | 2015-07-07 | 2017-01-12 | Tyco Fire & Security Gmbh | Predicting Work Orders For Scheduling Service Tasks On Intrusion And Fire Monitoring |
| CN105139093B (en)* | 2015-09-07 | 2019-05-31 | 河海大学 | Flood Forecasting Method based on Boosting algorithm and support vector machines |
| US10733183B2 (en)* | 2015-12-06 | 2020-08-04 | Innominds Inc. | Method for searching for reliable, significant and relevant patterns |
| WO2017191648A1 (en)* | 2016-05-05 | 2017-11-09 | Eswaran Kumar | An universal classifier for learning and classification of data with uses in machine learning |
| US10515082B2 (en)* | 2016-09-14 | 2019-12-24 | Salesforce.Com, Inc. | Identifying frequent item sets |
| US10956503B2 (en) | 2016-09-20 | 2021-03-23 | Salesforce.Com, Inc. | Suggesting query items based on frequent item sets |
| US11270023B2 (en) | 2017-05-22 | 2022-03-08 | International Business Machines Corporation | Anonymity assessment system |
| US10636512B2 (en) | 2017-07-14 | 2020-04-28 | Cofactor Genomics, Inc. | Immuno-oncology applications using next generation sequencing |
| US11132612B2 (en)* | 2017-09-30 | 2021-09-28 | Oracle International Corporation | Event recommendation system |
| US10685175B2 (en)* | 2017-10-21 | 2020-06-16 | ScienceSheet Inc. | Data analysis and prediction of a dataset through algorithm extrapolation from a spreadsheet formula |
| JP2021523745A (en) | 2018-05-16 | 2021-09-09 | シンテゴ コーポレイション | Methods and systems for guide RNA design and use |
| WO2019232494A2 (en)* | 2018-06-01 | 2019-12-05 | Synthego Corporation | Methods and systems for determining editing outcomes from repair of targeted endonuclease mediated cuts |
| US11227102B2 (en)* | 2019-03-12 | 2022-01-18 | Wipro Limited | System and method for annotation of tokens for natural language processing |
| US10515715B1 (en) | 2019-06-25 | 2019-12-24 | Colgate-Palmolive Company | Systems and methods for evaluating compositions |
| US12143407B2 (en) | 2019-08-07 | 2024-11-12 | Rubrik, Inc. | Anomaly and ransomware detection |
| US11449607B2 (en)* | 2019-08-07 | 2022-09-20 | Rubrik, Inc. | Anomaly and ransomware detection |
| US11522889B2 (en) | 2019-08-07 | 2022-12-06 | Rubrik, Inc. | Anomaly and ransomware detection |
| WO2021090484A1 (en)* | 2019-11-08 | 2021-05-14 | 日本電気株式会社 | Learning device, information integration system, learning method, and recording medium |
| US11730420B2 (en) | 2019-12-17 | 2023-08-22 | Cerner Innovation, Inc. | Maternal-fetal sepsis indicator |
| CA3072901A1 (en)* | 2020-02-19 | 2021-08-19 | Minerva Intelligence Inc. | Methods, systems, and apparatus for probabilistic reasoning |
| US12353509B1 (en)* | 2020-12-16 | 2025-07-08 | Amdocs Development Limited | System, method, and computer program for identifying a hidden class |
| US12250235B2 (en) | 2021-01-29 | 2025-03-11 | Rubrik, Inc. | Scalable automated training framework |
| CN112801237B (en)* | 2021-04-15 | 2021-07-23 | 北京远鉴信息技术有限公司 | Training method and device for violence and terrorism content recognition model and readable storage medium |
| WO2023128059A1 (en)* | 2021-12-28 | 2023-07-06 | Lunit Inc. | Method and apparatus for tumor purity based on pathological slide image |
| US12328234B2 (en) | 2022-03-18 | 2025-06-10 | The Mitre Corporation | Systems and methods for behavioral link prediction for network access microsegmentation policy |
Family Cites Families (1)
| Publication number | Priority date | Publication date | Assignee | Title |
|---|---|---|---|---|
| US6026397A (en)* | 1996-05-22 | 2000-02-15 | Electronic Data Systems Corporation | Data analysis system and method |
- 2002
- 2002-08-22JPJP2004530722Apatent/JP2005538437A/enactivePending
- 2002-08-22WOPCT/SG2002/000190patent/WO2004019264A1/enactiveApplication Filing
- 2002-08-22CNCNB028297059Apatent/CN1316419C/ennot_activeExpired - Fee Related
- 2002-08-22AUAU2002330830Apatent/AU2002330830A1/ennot_activeAbandoned
- 2002-08-22USUS10/524,606patent/US20060074824A1/ennot_activeAbandoned
- 2002-08-22EPEP02768262Apatent/EP1550074A4/ennot_activeWithdrawn
Cited By (2)
| Publication number | Priority date | Publication date | Assignee | Title |
|---|---|---|---|---|
| JP2015527635A (en)* | 2012-06-21 | 2015-09-17 | フィリップ モリス プロダクツ エス アー | System and method for generating biomarker signatures using an integrated dual ensemble and generalized simulated annealing technique |
| US10373708B2 (en) | 2012-06-21 | 2019-08-06 | Philip Morris Products S.A. | Systems and methods for generating biomarker signatures with integrated dual ensemble and generalized simulated annealing techniques |
Also Published As
| Publication number | Publication date |
|---|---|
| WO2004019264A1 (en) | 2004-03-04 |
| CN1689027A (en) | 2005-10-26 |
| EP1550074A1 (en) | 2005-07-06 |
| EP1550074A4 (en) | 2009-10-21 |
| US20060074824A1 (en) | 2006-04-06 |
| AU2002330830A1 (en) | 2004-03-11 |
| CN1316419C (en) | 2007-05-16 |
Similar Documents
| Publication | Publication Date | Title |
|---|---|---|
| JP2005538437A (en) | Prediction with likelihood set from emerging patterns | |
| Oyelade et al. | Clustering algorithms: their application to gene expression data | |
| Inza et al. | Machine learning: an indispensable tool in bioinformatics | |
| US7428554B1 (en) | System and method for determining matching patterns within gene expression data | |
| ElKarami et al. | Multi-omics data integration model based on UMAP embedding and convolutional neural network | |
| Ciaramella et al. | Data integration by fuzzy similarity-based hierarchical clustering | |
| Zhou et al. | ImputEHR: a visualization tool of imputation for the prediction of biomedical data | |
| Lin et al. | Cluster analysis of genome-wide expression data for feature extraction | |
| JP2004535612A (en) | Gene expression data management system and method | |
| Benso et al. | A cDNA microarray gene expression data classifier for clinical diagnostics based on graph theory | |
| Zhang | Recursive partitioning and tree-based methods | |
| Fratello et al. | Unsupervised algorithms for microarray sample stratification | |
| Wahde et al. | A survey of methods for classification of gene expression data using evolutionary algorithms | |
| Yang et al. | Non-monotone transformation of biomarkers to improve diagnostic and screening accuracy in a DNA methylation study with trichotomous phenotypes | |
| Yan | Robust fuzzy cluster ensemble on cancer gene expression data | |
| Bolshakova et al. | Comparison of the data-based and gene ontology-based approaches to cluster validation methods for gene microarrays | |
| De Bruyne et al. | Methods for microarray data analysis | |
| Dey et al. | Predictive Models for Integrating Clinical and Genomic Data. | |
| Bhattacharyya | Analyzing deviation pattern in strongly-correlated genes through core cluster mining | |
| Do et al. | Application of gene shaving and mixture models to cluster microarray gene expression data | |
| Dziuda | Current trends in multivariate biomarker discovery | |
| Kabir | Extracting Useful Information and Building Predictive Models from Medical and Health-care Data Using Machine Learning Techniques | |
| Rathod et al. | 11 Understanding and Why Should Data We Analysis Do It? | |
| Nasser | Classification of Iraqi Breast Cancer Dataset Based on Data Mining | |
| Rathod et al. | Understanding Data Analysis and Why Should We Do It? |
Legal Events
| Date | Code | Title | Description |
|---|---|---|---|
| A131 | Notification of reasons for refusal | Free format text:JAPANESE INTERMEDIATE CODE: A131 Effective date:20081028 | |
| A601 | Written request for extension of time | Free format text:JAPANESE INTERMEDIATE CODE: A601 Effective date:20090127 | |
| A602 | Written permission of extension of time | Free format text:JAPANESE INTERMEDIATE CODE: A602 Effective date:20090203 | |
| A02 | Decision of refusal | Free format text:JAPANESE INTERMEDIATE CODE: A02 Effective date:20090428 |