JP2005516307A - Method for processing, displaying and buying and selling financial products and electronic trading system therefor - Google Patents
Method for processing, displaying and buying and selling financial products and electronic trading system thereforDownload PDFInfo
- Publication number
- JP2005516307A JP2005516307AJP2003564780AJP2003564780AJP2005516307AJP 2005516307 AJP2005516307 AJP 2005516307AJP 2003564780 AJP2003564780 AJP 2003564780AJP 2003564780 AJP2003564780 AJP 2003564780AJP 2005516307 AJP2005516307 AJP 2005516307A
- Authority
- JP
- Japan
- Prior art keywords
- graph
- financial
- display
- market
- electronic
- Prior art date
- Legal status (The legal status is an assumption and is not a legal conclusion. Google has not performed a legal analysis and makes no representation as to the accuracy of the status listed.)
- Pending
Links
Images


Classifications
- G—PHYSICS
- G06—COMPUTING OR CALCULATING; COUNTING
- G06Q—INFORMATION AND COMMUNICATION TECHNOLOGY [ICT] SPECIALLY ADAPTED FOR ADMINISTRATIVE, COMMERCIAL, FINANCIAL, MANAGERIAL OR SUPERVISORY PURPOSES; SYSTEMS OR METHODS SPECIALLY ADAPTED FOR ADMINISTRATIVE, COMMERCIAL, FINANCIAL, MANAGERIAL OR SUPERVISORY PURPOSES, NOT OTHERWISE PROVIDED FOR
- G06Q40/00—Finance; Insurance; Tax strategies; Processing of corporate or income taxes
- G06Q40/06—Asset management; Financial planning or analysis
- G—PHYSICS
- G06—COMPUTING OR CALCULATING; COUNTING
- G06Q—INFORMATION AND COMMUNICATION TECHNOLOGY [ICT] SPECIALLY ADAPTED FOR ADMINISTRATIVE, COMMERCIAL, FINANCIAL, MANAGERIAL OR SUPERVISORY PURPOSES; SYSTEMS OR METHODS SPECIALLY ADAPTED FOR ADMINISTRATIVE, COMMERCIAL, FINANCIAL, MANAGERIAL OR SUPERVISORY PURPOSES, NOT OTHERWISE PROVIDED FOR
- G06Q40/00—Finance; Insurance; Tax strategies; Processing of corporate or income taxes
- G06Q40/04—Trading; Exchange, e.g. stocks, commodities, derivatives or currency exchange
Landscapes
- Business, Economics & Management (AREA)
- Engineering & Computer Science (AREA)
- Finance (AREA)
- Accounting & Taxation (AREA)
- Development Economics (AREA)
- Technology Law (AREA)
- Marketing (AREA)
- Strategic Management (AREA)
- Economics (AREA)
- Physics & Mathematics (AREA)
- General Business, Economics & Management (AREA)
- General Physics & Mathematics (AREA)
- Theoretical Computer Science (AREA)
- Entrepreneurship & Innovation (AREA)
- Game Theory and Decision Science (AREA)
- Human Resources & Organizations (AREA)
- Operations Research (AREA)
- Financial Or Insurance-Related Operations Such As Payment And Settlement (AREA)
Abstract
Translated fromJapaneseDescription
Translated fromJapanese本発明は、通貨、株式、デリバティブ、債権などの金融商品の売買を履行するトレーダーまたは投資家を支援するため、金融情報の処理およびグラフ表示を行う電子売買システムに関する。 The present invention relates to an electronic trading system for processing financial information and displaying a graph in order to support a trader or an investor who performs trading of financial products such as currencies, stocks, derivatives, and bonds.
ヒストリカル情報に基づく金融商品の分析は、「テクニカル分析」と呼ばれる専門活動分野である。テクニカル分析を実行する目的は、金融商品、例えば、通貨、株式、デリバティブ、債権、または金融データ交換に基づいて取引される他の価値を買うのか、売るのか、そしてそれはいつなのかを決定するトレーダーまたは投資家を支援することである。 Analysis of financial products based on historical information is a specialized activity field called “technical analysis”. The purpose of performing a technical analysis is a trader who decides whether and when to buy and sell financial products, such as currency, stocks, derivatives, receivables, or other values traded based on financial data exchange Or to support investors.
通常、アナリストが実行する従来のテクニカル分析では、コンピュータの画面に表示されるヒストリカル・パラメータの変化を示すグラフを調べる。金融パラメータが、毎時間、毎日、毎週、または毎月などの特定の時間枠で選択されると、テクニカル・アナリストは、情報の分析を支援するいくつかのツールを使用し、例えば、それぞれ下値および上値を通る「支持線」と「抵抗線」を描画することができる。描画された線が市況を表しているとアナリストが考えた場合、金融商品の価値が支持線よりも下に来るということは、例えば、強い下降の兆し(「売り」推奨に至る)を示すか、または逆に、金融商品の価値が抵抗線を超えた場合には、これは、上昇の兆し(「買い」推奨に至る)である。テクニカル・アナリストは、おそらく、同時に異なる時間枠を見て、比較的長期のトレンドと比較的短期のトレンドとを区別することであろう。「市場心理」および、金融パラメータが関係する企業または分野の知識もまた、アナリストが分析している情報に対するアナリストの受け取り方に影響を及ぼす。したがって、従来のアナリストは、その予測の基盤を主に直観と経験に置いており、アナリストの手にある情報分析ツールは、グラフを使用した非常に単純な性質の補助ツールである。 Conventional technical analysis, typically performed by analysts, examines a graph showing changes in historical parameters displayed on a computer screen. When financial parameters are selected for a specific time frame, such as hourly, daily, weekly, or monthly, technical analysts use several tools to help analyze the information, for example, lowering and It is possible to draw “support line” and “resistance line” passing the upper price. If the analyst thinks that the drawn line represents market conditions, the value of the financial product falling below the support line, for example, indicates a strong downtrend (leading to a “sell” recommendation) Or, conversely, if the value of a financial product exceeds the resistance line, this is a sign of an increase (leading to a “buy” recommendation). A technical analyst will probably look at different time frames at the same time to distinguish between relatively long-term trends and relatively short-term trends. “Market sentiment” and the knowledge of the company or field in which the financial parameters are relevant will also affect how analysts receive the information they are analyzing. Therefore, conventional analysts mainly place their predictions on the basis of intuition and experience, and the information analysis tools in the hands of analysts are auxiliary tools with a very simple nature using graphs.
国際特許出願WO01/95176では、金融商品のトレンドを予測するトレーダーまたは投資家を支援するため金融データを処理してグラフ表示およびその金融データの分析を行う方法について説明されている。前記の出願では、金融パラメータのリアルタイム・グラフ表示を一連の離散増分値に変換して「増分変化空間」内に曲線を出力し、その空間において支持線、抵抗線、トレンド展開均衡曲線、クオンタム・ライン、およびその他のグラフ要素などの情報分析ツールを重ねて表示できる。これらの情報を分析するためのグラフ線の変換および生成は、参照により本明細書に組み込まれている前述の特許出願を読むとよく理解できる。これらの情報分析ツールは、特に、展開を予測し、最終的に売買推奨を発行するか、またはそのような予測に基づき売買決定を履行することに関して、金融商品のトレンドを分析するテクニカル・アナリスト、投資家、または他の市場参加者(これ以降「市場参加者」と呼ぶ)を支援するのに特に役立つ。
したがって、多くの市場参加者が素早く金融情報を分析し、金融情報の変化に応じて行動することを望んでいる、あるいはその必要があるということを考慮すると、本発明の目的は、市場参加者が迅速に、かつ容易に、そのような情報を分析し、単純かつ迅速な作業に関して行動を起こせる、金融商品に関する情報を処理し、表示するための方法を提示することである。特に、金融商品に関する情報を分析し、表示する方法であって、市場参加者がごく少数の単純な操作でそのような金融商品の売買を行える方法を提示すると都合がよい。 Thus, in view of the fact that many market participants want or need to quickly analyze financial information and act in response to changes in financial information, the purpose of the present invention is to It is a quick and easy way to analyze such information and present a way to process and display information about financial instruments that can take action on simple and quick tasks. In particular, it would be advantageous to present a method for analyzing and displaying information about financial products that allows market participants to buy and sell such financial products with very few simple operations.
本発明の他の目的は、支持線、抵抗線などの情報分析ツールの助けを借りて市場参加者が金融商品に関するヒストリカル情報を分析し、単純で迅速な方法により売買履行などの活動を行うことができる電子売買システムを提示することである。 Another object of the present invention is to enable market participants to analyze historical information about financial products with the help of information analysis tools such as support lines and resistance lines, and to perform activities such as buying and selling in a simple and quick manner. Is to present an electronic trading system.
金融情報および情報分析ツールのグラフ表示結果の解釈に基づく支持線、抵抗線、展開曲線、クオンタム・ライン、およびビーム平均曲線などの複数の異なる情報分析ツールに基づき市場参加者が売買決定を下すことができる、金融情報を処理し、表示する方法およびそのための売買システムを提示すると都合がよい。 Market participants make trading decisions based on several different information analysis tools such as support lines, resistance lines, expansion curves, quantum lines, and beam average curves based on interpretation of financial information and information analysis tool graph display results It would be convenient to present a method for processing and displaying financial information and a trading system therefor.
市場参加者が複数の金融商品を取り扱うことを可能にする、金融情報を処理し、表示する方法およびそのための電子売買システムを提示すると都合がよい。 It would be advantageous to present a method and electronic trading system for processing and displaying financial information that allows market participants to handle multiple financial products.
自動売買注文の有効性を確認する前に作成し、編集することができるいくつかの条件に基づき市場参加者が自動売買注文を出すことができる電子売買システムを実現すると都合がよい。 It would be advantageous to implement an electronic trading system that allows market participants to place automated trading orders based on a number of conditions that can be created and edited prior to validating automated trading orders.
本発明の目的は、請求項1に従って金融情報を処理し、表示する方法を提示することにより達成されている。 The object of the invention is achieved by presenting a method for processing and displaying financial information according to
本明細書で開示されているのは、金融情報を処理し、コンピュータの画面などの電子的表示装置上に表示する方法であって、この方法は、金融商品を選択する工程と、金融商品のグラフ表示を表示装置に表示する工程と、情報分析ツールのグラフ表示を生成し、表示装置上に表示する工程と、表示装置上に図形として表され、市場参加者によって操作されるマウスなどのコントローラ・デバイスにより動かすことが可能なカーソルを使用して金融商品のグラフ表示および前記情報分析ツールのグラフ表示を選択する工程と、後の移動に応じて前記金融商品に対しアクションを実行することを可能にする比較条件を前記グラフ表示上で適用する工程を含む。 Disclosed herein is a method of processing financial information and displaying it on an electronic display device such as a computer screen, the method comprising: selecting a financial product; and A process of displaying a graph display on a display device, a step of generating a graph display of an information analysis tool and displaying it on the display device, and a controller such as a mouse that is displayed as a graphic on the display device and operated by a market participant・ Select the financial product graph display and the graph display of the information analysis tool using a cursor that can be moved by the device, and perform actions on the financial product in response to subsequent movements Applying a comparison condition on the graph display.
本発明の目的は、請求項12に従って電子売買システムを実現することによっても達成されている。 The object of the present invention is also achieved by realizing an electronic trading system according to
本明細書で開示されているのは、金融商品の売買を行う市場参加者を支援する電子売買システムであって、このシステムは、金融商品に関するデータを処理するサーバ・システムおよび電子表示装置にグラフ要素を含むイメージを生成し表示するソフトウェアを含み、第1のグラフ要素は金融商品のグラフ表示であり、第2のグラフ要素は金融情報分析ツールのグラフ表示であり、前記ソフトウェアは表示ポインティング・デバイスを使用して前記第1および第2のグラフ要素を選択すること、および前記第2のグラフ要素に関して前記第1のグラフ要素上で複数の条件のうちの少なくとも1つを適用することを可能にし前記条件が満たされたときに前記サーバ・システムにより自動的に前記金融商品にアクションが実行されるように適合されている。 Disclosed herein is an electronic trading system that assists market participants in buying and selling financial products, which is graphed on a server system and electronic display that processes data relating to financial products. Including software for generating and displaying an image including the elements, wherein the first graph element is a graph display of a financial product, the second graph element is a graph display of a financial information analysis tool, and the software is a display pointing device To select the first and second graph elements using and to apply at least one of a plurality of conditions on the first graph element with respect to the second graph element Adapted to automatically perform actions on the financial instrument by the server system when the condition is met To have.
電子表示装置にグラフ表示できる情報分析ツールは、国際出願WO01/195176に記述されている支持線、抵抗線、展開曲線、クオンタム・ライン、ビーム平均曲線、およびその他の情報分析ツールであってよい。金融商品は、本当の曲線、つまり、従来の電子売買システムの画面に一般的に表示されるように金融商品の価値を時刻または日付の関数として表した2次元チャートとして、またはWO01/95176に記述されているように増分変化空間内に金融パラメータを表す破線として、グラフ表示することができる。 Information analysis tools that can be graphically displayed on an electronic display device can be support lines, resistance lines, unfolded curves, quantum lines, beam average curves, and other information analysis tools described in International Application WO 01/195176. Financial products are described as real curves, ie two-dimensional charts representing the value of financial products as a function of time or date, as commonly displayed on the screen of conventional electronic trading systems, or in WO 01/95176 As indicated, the graph can be displayed as a dashed line representing a financial parameter in the incremental change space.
都合のよいことに、本発明を使用すると、市場参加者は、画面を制御するマウスなどの表示ポインティング・デバイスで、金融商品および選択された情報分析ツールのグラフ表示を選択することにより、金融商品に関する自動売買または売買推奨の条件を素早く設定することができる。 Conveniently, using the present invention, a market participant can select a financial instrument and a graphical display of the selected information analysis tool with a display pointing device, such as a mouse, that controls the screen. It is possible to quickly set conditions for automatic trading or recommendation for buying and selling.
1つまたは複数の情報分析ツールを生成し、電子表示装置に表示することができる。金融商品に作用する複数の条件を適用することができる。金融商品および情報分析ツールのグラフ表示に適用したときに、例えば、条件が満たされるとその金融商品のポジションを開いたり閉じたりすることができる条件「より大きい」および条件「より小さい」などの異なる条件を市場参加者に用意することができる。後者の例では、金融商品を表す曲線が情報分析ツールを表す曲線と交差すると条件が満たされる。適用される比較条件が「より小さい」であり、情報分析ツールが支持線の場合に意味することを説明する例では、金融商品のグラフが支持線と下方へ交差していると、売買システムは、売買を履行するか、または条件が満たされていることを市場参加者に通知するかのいずれかを行う。この場合、市場参加者に推奨されるアクションは、市場参加者が、金融商品のグラフと支持線との交差が有意な支持水準が破られていることを示していると考えた場合に、金融商品を売ることとしてよい。 One or more information analysis tools can be generated and displayed on the electronic display. Multiple conditions that affect financial instruments can be applied. When applied to a financial product and information analysis tool graph display, for example, the condition "greater than" and the condition "smaller" that can open and close the position of the financial product when the condition is met Conditions can be prepared for market participants. In the latter example, the condition is satisfied when the curve representing the financial product intersects the curve representing the information analysis tool. In the example explaining that the comparison condition applied is “less than” and the information analysis tool means in the case of a support line, if the financial instrument graph crosses down the support line, the trading system will Either perform the sale or inform the market participant that the condition is met. In this case, the recommended action for the market participant is that the market participant believes that the intersection of the financial instrument graph and the support line indicates that a significant level of support has been broken. Goods can be sold.
情報分析ツールは、さらに、売買が履行される単純な価値、例えば、金融商品が買われる、または売られる固定価格、およびストップ・ロス価値などトレーダーによって一般に使用されるその他の価値も含むことができる。 Information analysis tools can also include other values commonly used by traders, such as simple values at which buying and selling are performed, for example, fixed prices at which financial instruments are bought or sold, and stop-loss values .
都合のよいことに、金融商品のグラフ表示を生成するために使用される金融データは、内部(自)データ・ソースからリアルタイムで、またはインターネットなどの世界的通信ネットワークを通じて、外部金融情報サービス・プロバイダによって提供されるデータベース、または電子金融交換から取得することができる。 Conveniently, the financial data used to generate the graphical representation of the financial product can be obtained from an internal (self) data source in real time or through a global communications network such as the Internet. Can be obtained from databases provided by or electronic financial exchanges.
電子売買システムは、都合よく、表示装置上にイメージを生成することができ、そこには、リモートの電子金融交換で自動的にまたは電子システムを通じて履行される売買に対するクオートまたは注文を生成して送信するためカーソルまたはキーボードなどの電子コントローラ・デバイスを使って選択できるフィールドが配置されている売買ウィンドウが含まれる。 An electronic trading system can conveniently generate an image on a display device, which generates and sends quotes or orders for trades that are executed automatically or through an electronic system in a remote electronic financial exchange. In order to do so, a trading window is included in which fields are selected that can be selected using an electronic controller device such as a cursor or keyboard.
本発明の他の目的および有益な態様は、図面を参照して行う、請求項および以下の説明から明らかになるであろう。 Other objects and advantageous aspects of the invention will become apparent from the claims and the following description, made with reference to the drawings.
図1を参照すると、通信ネットワーク、例えば、ワールド・ワイド・ウェブを使用するインターネット上でオンライン・テクニカル分析および売買を行える売買システムが示されている。図に示されている実施形態では、売買システムは、例えば、通信ネットワーク、サーバ・サイト4、外部データ・サイト6、内部データ・ソース7、およびブローカ8に接続されているパーソナル・コンピュータ3を備える1つまたは複数の市場参加者を表す、クライアント・サイト2を含む。ブローカは、端末またはPCを所有する人、または電子金融交換で見られるような電子ブローカ(これ以降一般に「ブローカ」と呼ぶ)とすることができる。サーバ・サイト4は、通信ネットワークに接続され、許可された市場参加者3によるアクセスが可能である。ブローカ8は、さらに、インターネット、またはその他のネットワークなどの通信ネットワークを使用してサーバ・サイトに接続することもできるが、市場参加者3から直接売買注文を受け取れるようにクライアント・サイト2に接続することもできる。サーバ・サイト4へのリアルタイムまたは遅延された金融データは、通信ネットワークを介してサーバ・サイトに接続されている金融情報サービス・プロバイダまたは金融交換である外部データ・ソース6が、または内部(自)データ・ソース7が供給することができる。 Referring to FIG. 1, a trading system capable of online technical analysis and trading over a communications network, eg, the Internet using the World Wide Web, is shown. In the embodiment shown in the figure, the trading system comprises a
サーバ・サイト4は、データベース・サーバ10、ワールド・ワイド・ウェブ・サーバなどの通信サーバ12およびビジネス・ロジック・サーバなどのビジネス・サーバ14を含むサーバ・システムを備える。データベース10、通信サーバ12、およびビジネス・サーバ14は、単一のデータ処理システムに一体化するか、または通信ネットワークを介して通信しているさまざまな場所にあるサーバを備える分散処理システムを形成することができる。データベース・サーバ・システム10は、1つまたは複数の異なる情報サービス・プロバイダからの金融商品に関する定期的に更新される、またはリアルタイムのデータを供給するデータ・ソース6および7に接続されている。 The
データベース・サーバは、さらに、市場参加者から受け取った売買注文を格納する機能を実行し、売買操作の履歴を保持し、市場参加者の口座に対する操作を管理することができる。データベース・サーバ・システム10は、ビジネス・サーバ14および通信サーバ12に接続され、これにより、例えば、市場参加者は、例えば、HTMLプロトコルを使用してクライアント・サイトのブラウザ16を介して、サーバ・サイトと通信することができる。市場参加者は、クライアント・サイト2と通信サーバ12との間に確立されたネットワーク接続を使用して、ビジネス・サーバ14からアプレットまたはアプリケーションをダウンロードし、このアプレットまたはアプリケーションを使用して、情報の要求および注文のサーバ・サイトへの送信および要求されたデータまたは情報の受信を行ったり、または必要な操作を実行することができる。例えば、市場参加者がPCの画面上で実際の市場データのグラフ表示を得るためには、市場参加者は、自分の端末PCおよびブラウザを介して、要求をビジネス・サーバ14に送信し、ビジネス・サーバ14はその要求を処理して、データベース・サーバ10から関連するデータを取り出す。サーバ・サイトでは、クライアント・サイトに応答を送信し、市場参加者のPCはその応答をPCコンピュータの画面上にプロットされたグラフ要素の形式で再現し、例えば図2に示されているようなイメージを形成する。電子表示装置、この例では、市場参加者のPCまたは端末コンピュータの画面上に作成されるさまざまなウィンドウは、ビジネス・サーバからダウンロードされた、または市場参加者のコンピュータにプリインストールされているソフトウェアにより生成することができる。つまり、サーバ・サイト4により実行される主要操作には、データ収集および処理、データの生成および処理(例えば、実空間の金融データの増分変化空間変換および大きなコンピューティング資源を必要とする情報分析ツールの生成を実行するため)、データ格納、市場参加者の売買注文および依頼の受信、処理、および送信、操作のログブックの保持、統計データの生成および格納、および市場参加者の口座の管理がある。 The database server can further execute a function of storing a trade order received from a market participant, maintain a history of trade operations, and manage operations on the market participant's account. The
また、データの処理も、中央サーバから処理用ソフトウェアをダウンロードするか、またはユーザ・コンピュータにすでにインストールされているソフトウェアにより、ユーザ・コンピュータ上で実行することができることに留意できる。市場データの格納および処理を計画する際のデータベース格納および情報処理システムの集中化または分散化の程度はさまざまであり、本発明の範囲を逸脱することはない。 It can also be noted that the processing of the data can also be performed on the user computer by downloading processing software from a central server or by software already installed on the user computer. The degree of centralization or decentralization of database storage and information processing systems when planning the storage and processing of market data varies and does not depart from the scope of the present invention.
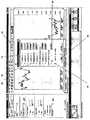
図2を参照すると、本発明による電子売買システムにより生成されたイメージは、チャート・ウィンドウ20、売買ポジション入力ウィンドウ22、ナビゲーション・ウィンドウ24、およびクオート・ウィンドウ26を含むように示されている。 Referring to FIG. 2, an image generated by the electronic trading system according to the present invention is shown to include a
クオート・ウィンドウ26には、さまざまな金融商品、例えば、市場参加者により選択された通貨の選択に対する通貨建値が表示され、金融商品の現在の価値、例えば他の通貨に関する通貨の「ビッド」および「アスク」価格をリアルタイムで示す。他の情報を、金融商品の種類に応じてクオート・ウィンドウ26内に表示することができ、例えば、株式の場合には、クオート・ウィンドウに、株式の素性、現在価格、日または市場参加者が選択した他の期間の高値と安値、前日からの引け値、および出来高を表示することができる。金融交換で提供される情報に典型的な金融商品に関係する特定の価値で他の情報を表示することもできる。 The
ナビゲータ・ウィンドウ24では、市場参加者により作成され、開かれた一連のチャートが、例えば、表示ポインティング手段を持つ画面上のアイコンのような選択することができる小さなチャート28の形で表示されている。表示ポインティング手段は、PCマウス、トラック・ボール、タッチ・パッド、ジョイスティック、または他のポインティング・デバイス・コントローラなどのコントローラ・デバイスにより制御される画面カーソルを備えることもできる。ポインティング・デバイスは、さらに、指またはポインティング・ペンで表示されているチャート・アイコン28の位置に触れたことに反応するタッチ・スクリーンでもよい。簡単のため、前述のポインティング手段および対応するコントローラ・デバイスは、一般に、これ以降「カーソル」と呼ぶことにするが、カーソルまたはキーボードを使用して電子表示装置上に表示されているアイコンおよびグラフ要素を選択できることは理解されるであろう。 In the
ナビゲータ・ウィンドウに表示されるチャートは、クオート・ウィンドウ26内で選択された同じ金融商品に関係しているが、生成された異なる情報分析ツール、異なる増分変化空間変換または実空間表示、異なる期間、または前記の組合せが設定されていることに注意されたい。これらのチャートは、さらに、異なる金融商品を表すこともでき、市場参加者が、特定の金融商品に関する情報が他の金融商品の変化、例えば、原油価格と石油会社の株価との相関関係に相関する、またはその相関関係の影響を受けると確信している場合に有用である。 The charts displayed in the navigator window are related to the same financial instrument selected in the
市場参加者は、入力ウィンドウ22において、売買注文を作成する、特に新規売買を開くか、または既存の売買を閉じるかどうか、売買の出来高(つまり、価値)、および売買履行の条件を定義することができる。入力ウィンドウ内にはこの目的のためにさまざまなパラメータ入力フィールドが用意されている。これらには、「Up−Down」フィールド30があり、これは、市場参加者がトレード・アップしたいか、トレード・ダウンしたいかを定義する。例えば、金融商品が先物契約であれば、トレード・アップする市場参加者は金融商品の価値が上昇する、したがって長期買いであると予測するであろうが、トレード・ダウンは、市場参加者が金融商品の価値が下落する、したがって短期売りであると予測することを意味する。 In the input window 22, the market participant creates trade orders, in particular whether to open new trades or close existing trades, define trading volume (ie value), and terms of fulfillment Can do. Various parameter input fields are provided for this purpose in the input window. These have an “Up-Down”
「lots」フィールド32では、市場参加者は、選択される金融商品の特定の価値のロットまたはユニットの数を定義することができる、つまり、売買の価値(出来高)を定義することができる。例えば、市場参加者は10ロット分の金融商品EUR/USDを選択することができ、それにより、1ロットは、例えば、USD10’000のEuroで売買を表す。 In the “lots”
「open」チェックボックス34では、市場参加者は新規ポジションを開くべきかどうかを定義することができる。 An “open”
「Open condition」フィールド36では、市場参加者は、売買を、例えば、市場で、つまり、要求が送信された時点における一般市場価格で、または単純条件で、つまり、将来一般的になると思われる他の任意の価格で、または複合条件で、つまりチャート・ウィンドウ20でカーソルまたはキーボードを使用して市場参加者により選択されるグラフ要素のペアに適用される条件で、注文または履行する方法を決定することができる。 In the “Open condition”
「close」チェックボックス38では、市場参加者は、特定の条件が満たされると自動的に既存の売買が閉じられるように要求することができる。 In a “close”
「close condition」フィールド40では、市場参加者は、市場ポジションの決済を履行するため金融商品に適用する条件の種類を選択することができ、それにより、条件は、チャート・ウィンドウ20でカーソルまたはキーボードを使用して市場参加者により選択されるグラフ要素のペアに適用される。 In the “close condition”
「take profit」チェックボックス44では、市場参加者は、「take profit」入力フィールド45、47で潜在的収益価値を定義することができ、そこで、金融商品が市場参加者にとって有利な方向に動く場合に売買を決済しなければならない。 The “take profit”
「stop loss」チェックボックス46では、市場参加者は、金融商品が市場参加者にとって不利な方向に動く場合に売買を決済して潜在的損失を制限するため「stop loss」入力フィールド47、49でストップ・ロス価値を定義することができる。 In the “stop loss” check box 46, the market participant can enter a “stop loss”
「notifier」チェックボックス48および関連する「notify condition」フィールド50では、市場参加者は、例えば、すでに指定されている条件が満たされたときに、例えば、イベントの発生を知らせるため表示装置に現れるアラームまたは通知シグナルを使って、通知を受けたいかどうかを定義することができる。 In the “notifier”
チャート・ウィンドウ20は、グラフ要素を作成し、処理し、編集し、チャート領域58に表示するためカーソルで選択できるアイコンの形で一連のコマンドが並べられているバー56を備え、これらのグラフ要素は、実空間または増分変化空間内の表現ですることができる、金融商品のグラフ表示T、およびチャート上に生成され重ね合わせられる情報分析ツール、例えば支持線Sおよび抵抗線Rを含む。このような線を生成する方法は、国際特許出願WO01/95176で説明されている。生成されチャート領域58内に表示されるこれらの線または曲線はそれぞれ、簡単のため、これ以降、一般的に、「グラフ要素」と呼ばれる。 The
次に図2および図6aから6eとともに図3を参照して、電子売買システム内に新規ポジションを開く注文を作成するルーチンの流れ図を説明する。 Next, referring to FIG. 3 together with FIG. 2 and FIGS. 6a to 6e, a flowchart of a routine for creating an order for opening a new position in the electronic trading system will be described.
工程3aで、市場参加者は、「Up−Down」フィールド30で、開く市場ポジションの種類、つまり、「Up」または「Down」を選択し、「quote」フィールド26で、通貨、株式、先物などの取引する商品の種類を選択し、「lots」フィールド32で、取引のボリュームを選択する。次の工程3bで、市場参加者は、「choose condition」フィールド40において、開くプロシージャに対する3つの選択肢「now」、「simple condition」、および「complex condition」のうちから1つ選択することができる。 In step 3a, the market participant selects the type of market position to open, i.e., "Up" or "Down", in the "Up-Down"
「now」要求(工程3b1)は、注文が発行された時点で、つまり、ダウン取引については次に利用可能なビッド・クオートおよびアップ取引についてはアスク・クオートで、一般的な市場価格で取引を実行することを意味する。市場参加者は、注文を開く条件の設定を終了した場合、工程3hに進み、(工程3iで)「OK」ボタン59をクリックして終了する。その後、このアルゴリズムは終了し、注文要求は、自動的にビジネス・サーバ14に送信される。市場参加者は、満たされるとポジションが自動的に閉じられるいくつかの追加条件を作成するつもりがあれば、図4に示されているルーチンに進む。 The “now” request (step 3b1) is the transaction at the general market price at the time the order is issued, ie the next available bid quote for down trades and the ask quote for up trades. It means to execute. When the market participant finishes setting the conditions for opening the order, the market participant proceeds to step 3h, and clicks the “OK” button 59 (in step 3i) to end. The algorithm then ends and the order request is automatically sent to the
「simple condition」要求(工程3b2)は、具体的な市場建値でポジションを開く条件を作成することを意味している。具体的にいうと、市場参加者は、建値が「simple condition」フィールドに市場参加者によって指定された値に達した場合にポジションを開くことを選択できる。市場参加者は、条件の設定を終了した場合、工程3hに進み、(工程3iで)「OK」ボタン59をクリックして終了する。その後、このアルゴリズムは終了し、注文要求は、自動的にサーバに送信される。市場参加者は、満たされるとポジションが自動的に閉じられるいくつかの追加条件を作成するつもりがあれば、図4に示されている工程に進む。 The “simple condition” request (step 3b2) means creating a condition for opening a position at a specific market price. Specifically, the market participant can choose to open a position when the quote reaches the value specified by the market participant in the “simple condition” field. When the market participant finishes setting the conditions, the market participant proceeds to step 3h and clicks the “OK” button 59 (in step 3i) to end. The algorithm is then terminated and the order request is automatically sent to the server. If the market participant intends to create some additional conditions that will automatically close the position when satisfied, then the market participant proceeds to the process shown in FIG.
フィールド40で「complex condition」を選択すると、複合条件サブウィンドウ101が開く(図6cを参照)。「complex condition」要求は、チャート領域48に表示されているグラフ要素を使用してポジションを開く条件を作成することを意味している。フィールド36または40で「complex condition」を選択すると、複合条件サブウィンドウ101が開き(6cの例について示されているように)、そこで複合条件を設定し、適用する。工程3c2で、市場参加者は、カーソルを使用して、チャート領域58に表示されている2つのグラフ要素を選択する。工程3dで、市場参加者は、注文が履行される条件の種類を選択する。使用可能な条件としては、特に比較条件、「>」、「≧」、「<」、「≦」などがあり、これにより、一方のグラフ要素の縦軸の値は、それぞれ、第2のグラフ要素の縦軸の値と「より大きい」、「以上」、「より小さい」、「以下」の関係を持つ。「グラフ要素」という用語は、増分変化空間曲線軌跡、トレンド支持線、トレンド抵抗線、増分変化空間内に描画された線、クオンタム・ライン、最終最小−最大線、展開均衡曲線、ビーム軌跡、または市場参加者が利用でき、チャート・ウィンドウ内に表示される他の任意のグラフ要素を含む。市場参加者は、さらに、基準点で測定された建値シフト遅延を「quote shift」フィールド162(図6cを参照)の中に指定することもでき、注文は、すでに説明した条件±建値シフトの値を満たしているかどうかに応じて実行される。市場参加者は、「time shift」フィールド164に、増分変化空間内の横軸の標準測定単位で測定された時間シフトを指定し、上述の条件に加えて時間シフトの値が満たされると、注文が実行されるようにできる。工程3eで、市場参加者は、「Accept」ボタン108(図6c参照)をクリックすることにより複合条件の有効性を確認することができる。 Selecting “complex condition” in the
市場参加者は、終了した後(工程3f)、「OK」ボタン59をクリックすることにより(工程3g)複合条件の有効性を確認する。そうでなければ、市場参加者は工程3kに進み、工程3c2から3fのプロシージャに従って作成された2つまたはそれ以上のグラフ条件の相互作用について演算子を選択するが、それには、入力ウィンドウ内のボタン「then」128、「or」130、または「and」132のうちの1つを選択する。「and」演算子は、両方の条件が満たされる必要のあることを意味する。「then」演算子は、条件が特定の順序、つまり相次いで満たされる必要のあることを意味する。「or」演算子は、2つの条件のうちの一方が満たされなければならないことを意味する。市場参加者は、その後、工程3c2に戻り、グラフ要素の同じペアまたは別のペアについて工程3c2から3fを繰り返す。選択が終了した後、市場参加者は工程3gに進み、複合条件サブウィンドウ内の「OK」ボタン134をクリックすることにより複合条件の有効性を確認する。市場参加者は、開いている注文に対する条件の設定を終了した後、工程3hに進み、入力ウィンドウ内の「OK」ボタン59をクリックすることにより要求を終了する。その後、このアルゴリズムは終了し、注文要求は、自動的にサーバ・システムに送信される。市場参加者は、満たされるとポジションが自動的に閉じられるいくつかの追加条件を作成するつもりがあれば、図4に示されている工程に進む。 After finishing (
図4は、ポジションを自動的に閉じる追加条件をセットアップするルーチンの流れ図である。これは、以下の「close」4b1、「stop loss」4b2、および「take profit」4b3のどれかまたはすべてを選択することにより実行できる。 FIG. 4 is a flowchart of a routine for setting up an additional condition for automatically closing a position. This can be done by selecting any or all of the following “close” 4b1, “stop loss” 4b2, and “take profit” 4b3.
「close」要求を作成するために、市場参加者はルーチン4c、4d、4e、4fに従って、図3の工程3c2から3eで説明されている1つを複製する。市場参加者は、注文を開くことに対する条件の設定を終了した後、工程4iに進み、「OK」ボタンをクリックすることにより要求を終了する。その後、このアルゴリズムは終了し、注文要求は、自動的にサーバに送信される。市場参加者は、ポジションを閉じる他の条件をいくつか作成するつもりであれば、このアルゴリズムの先頭に戻る。 To create a “close” request, the market participant duplicates one described in steps 3c2-3e of FIG. 3 according to routines 4c, 4d, 4e, 4f. After the market participant finishes setting the conditions for opening the order, the market participant proceeds to step 4i and ends the request by clicking the “OK” button. The algorithm is then terminated and the order request is automatically sent to the server. Market participants return to the top of this algorithm if they intend to create some other conditions to close their positions.
「stop loss」要求4k1は、不利な動きの場合、特定の建値に達したときにポジションを閉じるような条件を作成することを意味し、その値は、特に、市場参加者によって指示されるか、または(アップ・ポジションの場合)始値から市場参加者によって指定された多数のベーシス・ポイントを引いた値で、または(ダウン・ポジションの場合)始値に市場参加者によって指定された多数のベーシス・ポイントを足した値で示される。市場参加者は、ストップ・ロス条件を設定することにより、エクスポージャ、および自分がこのポジションを引き受ける意志のある最高損失額を定義する。市場参加者は、追加条件の作成を終了した場合、工程4hに進み、「OK」ボタンをクリックして終了する。その後、このアルゴリズムは終了し、注文要求は、自動的にサーバ・システムに送信される。 The “stop loss” requirement 4k1 means creating a condition that closes the position when a certain quote is reached, in the case of an unfavorable movement, and is that value specifically indicated by market participants? Or (in the case of an up position) the opening price minus a number of basis points specified by the market participant, or (in the case of a down position) a large number specified by the market participant in the opening price It is indicated by the value obtained by adding the basis points. Market participants define the exposure and maximum loss they are willing to take on this position by setting a stop-loss condition. When the market participant finishes creating the additional condition, the market participant proceeds to step 4h and clicks the “OK” button to finish. The algorithm is then terminated and the order request is automatically sent to the server system.
「take profit」要求4k2は、市場の動きが有利な場合、特定の建値に達したときにポジションを閉じるような条件を作成することを意味し、その値は、特に、市場参加者によって指示されるか、または(アップ・ポジションの場合)始値に市場参加者によって指定された多数のベーシス・ポイントを足した値で、または(ダウン・ポジションの場合)始値から市場参加者によって指定された多数のベーシス・ポイントを引いた値で示される。市場参加者は、追加条件の作成を終了した後、工程4hに進み、「OK」ボタンをクリックして終了する。その後、このアルゴリズムは終了し、注文要求は、自動的にサーバ・システムに送信される。 The “take profit” request 4k2 means creating a condition that closes the position when a certain quote is reached, if the market movement is advantageous, which value is specifically instructed by market participants. Or (in the case of an up position) the opening price plus a number of basis points specified by the market participant, or (in the case of a down position) specified by the market participant from the opening price It is expressed as a value minus a number of basis points. After completing the creation of the additional condition, the market participant proceeds to Step 4h and clicks the “OK” button to finish. The algorithm is then terminated and the order request is automatically sent to the server system.
市場参加者がポジションを閉じるいくつかの条件をセットアップした場合、システムは、新しい市場データを受け取った後満たされるべき第1の条件について実行する。 If a market participant sets up several conditions to close a position, the system will perform on the first condition to be met after receiving new market data.
図5は、市場参加者により設定されている条件に従って市場ポジションを開く工程を説明する流れ図である。工程5aで、市場参加者は、図3および4で説明されているルーチンに従ってポジションを開く条件付き成り行き注文を作成する。工程5bで、絶えず変化する金融商品パラメータに関する新しいデータがサーバ・システムに届く。工程5cで、変数および配列が初期化される。工程5dで、システムは、受け取った新しいデータ点を考察する。条件が満たされていない場合、工程5bに戻る。条件が満たされている場合、注文は電子ブローカに送られ(5f)、新しいポジションが開かれる(5g)。 FIG. 5 is a flowchart illustrating the process of opening a market position according to the conditions set by market participants. In step 5a, the market participant creates a conditional market order that opens a position according to the routine described in FIGS. In
上で説明した方法は、以下の操作を実行または有効にする。
・ したがって、定期的変更される変数またはパラメータに関する情報のグラフ要素形式による表示
・ カーソルのクリック・アクションまたは他の類似のデバイスに対する応答として実行される2つまたはそれ以上のグラフ要素の選択
・ 条件および条件が満たされた後システムにより自動的に実行されるアクションの種類の選択
・ グラフ要素に関係するような追加情報およびその識別の受信
・ 新しい情報に基づく、条件の検証およびその自動実行The method described above performs or enables the following operations.
Therefore, display of information about variables or parameters that change periodically in the form of a graph element. Click on a cursor. Select two or more graph elements to be executed in response to an action or other similar device. Select the type of action that is automatically performed by the system after the condition is met; Receive additional information related to the graph element and its identification; Verify the condition based on the new information and automatically execute it
当業者であれば、本発明による方法を本明細書で説明されている実施形態とは異なるさまざまな環境において使用可能であることを理解するであろう。例えば、これは、先物および商品市場の標準テクニカル分析で従来使用されているグラフ表示手段など、応用金融学で使用される多数のグラフ表示手段に応用することが可能である。この方法は、また、自然過程の予測など絶えず変化するパラメータの観測を含む専門業務でも応用することが可能である。 One skilled in the art will appreciate that the method according to the present invention can be used in a variety of environments different from the embodiments described herein. For example, it can be applied to a number of graph display means used in applied finance, such as the graph display means conventionally used in standard technical analysis of futures and commodity markets. This method can also be applied in professional work including observation of constantly changing parameters such as prediction of natural processes.
以下の節では、例を参照しながら、市場データの処理および分析を行い、本発明による電子売買システムを使って実行することが可能な売買決定を下す方法を説明する。究極的目的は、買い、売り、ホールド、および他の多くの種類の決定および推奨を下し実行するアナリスト、投資家、またはトレーダーを支援することである。 In the following section, referring to an example, a method for processing and analyzing market data and making a trading decision that can be performed using an electronic trading system according to the present invention is described. The ultimate goal is to assist analysts, investors, or traders who make and execute buy, sell, hold, and many other types of decisions and recommendations.
図6aから6eを参照しながら、本発明による売買システムを使用して仮説的な市場参加者によって実行される分析、意思決定、および決定実行プロシージャの例を説明し、売買システムの特徴をわかりやすく説明する。この例では、米国ドル/スイス・フラン市場の為替トレーダーを考察することにする。 With reference to FIGS. 6a to 6e, an example of analysis, decision making and decision execution procedures performed by a hypothetical market participant using the trading system according to the present invention will be described, and the characteristics of the trading system will be easily understood. explain. In this example, consider an exchange trader in the US dollar / Swiss franc market.
市場参加者の目標は、予想される市場の方向だけでなく予想される市場参入の正しい時期をできる限りあいまいな点を残さずに識別することである。この目的のために、市場参加者は、サーバ・システムに、例えば、ロイターによって提供される04/06/01から04/09/01までの3カ月間にわたる10分間隔の市場建値を要求する。建値を要求するために、ユーザは、チャート・ウィンドウ20内で「File」メニューの「get quotes」コマンドを選択し、期間と時間ステップ(頻度)を選ぶ。この要求は、ビジネス・サーバ14を介してデータベース10に送られる。サーバ・サイトでは、クライアント・サイトに応答を送信し、市場参加者のPCはその応答をPCコンピュータの画面上のチャート領域58でプロットされたグラフ要素の形式で再現する。 The goal of market participants is to identify not only the expected market direction but also the correct time of expected market entry, leaving as much ambiguity as possible. For this purpose, market participants require a quote from the server system, for example, a 10-minute market quote over the three months from 04/06/01 to 04/09/01 provided by Reuters. To request a quote, the user selects the “get quotes” command in the “File” menu in the
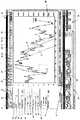
図6aを参照すると、リアルタイムのチャートは、正規化ステップr=0.00286とする増分変化空間内の軌跡T6aに変換されることがわかる。標準のリアルタイム・チャートを増分変化空間内の曲線軌跡に変換するため、市場参加者は、コマンド・バー56のDuka変換コマンド・ボタン60をクリックする。システムは、図6aに示されている「Set r parameter」ボックス76を自動的に開くので、市場参加者はそこで正規化振幅r(フィールド78)を指定する。これは、入ってきた建値の最大値と最小値との平均差(振幅r=1)としてシステムにより自動的に計算された既定値を選択するか、システムによって提供され、0.5、2、3などの係数を掛けたrの既定値として計算されたrの値をリストから選択するか、またはコンピュータのキーボードまたは類似のデバイスを使用してr手動入力フィールド80にrの値を直接入力するかのいずれか1つで実行することができる。チェックボックス82を選択することにより、増分変化チャート用に新しいウィンドウを自動的に作成することができる。パラメータが選択された後、市場参加者は、「apply」ボタン84で要求の有効性を確認する。 Referring to FIG. 6a, it can be seen that the real-time chart is transformed into a trajectory T6a in the incremental change space with a normalization step r = 0.00286. To convert a standard real-time chart into a curved trajectory in incremental change space, the market participant clicks on the Duka
図6bを参照すると、市場参加者は、支持線および抵抗線をプロットすることを選択した場合、自分の表示では支持線および抵抗線に属している増分変化空間内の曲線軌跡T6の点P6b1およびP6b2などの2点を選択し、コマンド・バー56の「trend line up」ボタン64をクリックする。システムは、図6bに示されている「Properties for Trend」ダイアログ・ボックス86をアクティブにし、q値入力フィールド88内で係数qの値を指定できるようにする。データ処理システムでは、国際特許出願WO01/195176で説明されているように、q_maxの値−データ配列全体から取得された係数qのうちの最高値−を自動的に表示する。それとは別に、市場参加者は、q係数の別の値を指定することもできる。さらに、市場参加者は、「more」ボタン90をクリックすることにより、線の太さフィールド92、線種フィールド94、および線色フィールド96を使用することにより、支持線および抵抗線のグラフ表示特性を指定することができる。「apply」ボタン100をクリックした後、要求は、ビジネス・サーバ14を介してデータベース10に送られる。データベースでは、計算を実行してその結果を格納し、応答をクライアント・サイトに送り、市場参加者のPCでは、その応答を、PCコンピュータ画面でチャート領域58にプロットされる、グラフ要素の形式、この例では、図6cに示されているような支持線および抵抗線S6cおよびR6cの形式で再現する。 Referring to FIG. 6b, if the market participant chooses to plot the support and resistance lines, the point P6b1 of the curve locus T6 in the incremental change space belonging to the support and resistance lines in his display and Select two points, such as P6b2, and click the “trend line up”
図6cを参照すると、市場参加者が市場が点P6c1とP6c2の間の水平ドリフト期間を抜けて、支持線と抵抗線S6cおよびR6cにより発展が定められている成長段階に入ったと確信した場合、市場参加者にとってはこの上昇トレンドがどれくらい続く可能性があるのかということが問題になるであろう。市場参加者は、トレンドが崩れたときに市場に参入する決定を下すことができ、それゆえ建値の下落の動きに賭けるわけだが、この場合、ドルに対してスイス・フランを買うことを意味する。 Referring to FIG. 6c, if the market participant believes that the market has gone through the horizontal drift period between points P6c1 and P6c2, and has entered a growth stage defined by the support lines and resistance lines S6c and R6c, It will be a question for market participants how long this uptrend can last. Market participants can make a decision to enter the market when the trend breaks down, and therefore bet on the falling price, which in this case means buying Swiss francs against the dollar .
この目的のために、市場参加者は、取引する額(例えば、USD10’000を10ロット分)、取引の種類(例えば、「down」)を選択し、「complex condition」を作成することを選択する。注文が履行される条件を正確に指定するため、市場参加者はカーソルを使って、図6cのフィールド102に「curve 2」と表示されている金融商品曲線軌跡T6を選択し、その後、フィールド104内に「curve 1」と表示されている支持線S6cを選択して、フィールド106で演算子「>」(より大きい)を選択することにより、建値軌跡T6が支持線と交差し、支持線よりも下へ移動すると(S6c>T6)すぐにサーバ・システムが自動的に下降ポジションを開くような条件を設定する。この条件の有効性を確認するには、「accept」ボタン108をクリックする。システムのこのような自動セットアップを使用すると、市場参加者が市場に参入する負担がかなり軽減される。決定を下すときに、トレーダー側に支持線S6cが途切れる点を予測できる情報がないため、これがその場合であり、そのような情報がなかったなら市場参加者は市場の展開を常に監視している必要があるであろう。このような監視は明らかに時間がかかるという事実は別として、トレーダーの他の、場合によってはより収益の高い市場部門からの注目を発散させる可能性もある。 For this purpose, the market participant chooses the amount to trade (
米国ドル/スイス・フランのトレーダーの例を続けるため、次に、前に考察したダウン・ポジションを閉じる意思決定および実施過程を考察しよう。 To continue the US dollar / Swiss franc trader example, let's now consider the decision making and implementation process to close the down position discussed earlier.
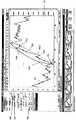
図6dおよび6eは、24/08/01から23/10/01までの2カ月間の増分変化空間チャートを示しており、増分変化空間の軌跡T6eは滑らかな軌跡C6e、図6aの支持線および抵抗線S6b1およびR6b1、新しい支持線および抵抗線S6e2およびR6e2および点P6e1から引かれているクオンタム・ラインQ6eとともにプロットされている。クオンタム・ラインをプロットするために、ユーザは、クオンタム・ラインが引かれる増分変化空間軌跡上に1点を選択し、コマンド・バー56のクオンタム・ライン・コマンド・ボタン68をクリックする。システムによって、図6dに示されている「Quantum line properties」ダイアログ・ボックス110がアクティブにされると、市場参加者は、「direction」フィールド112でクオンタム・ラインを引く際の基準となる方向、つまり上方または下方を選択し、さらにチェックボックス114でクオンタム・ラインの本数を選択することができる。「apply」ボタンをクリックすると、この要求は、ビジネス・サーバ14を介してデータベース10に送られる。データベースは計算を実行して計算結果を格納し、クライアント・サイトに応答を送信し、市場参加者のPCはその応答をPCコンピュータの画面上にプロットされる、グラフ要素、この例ではクオンタム・ラインQ6eの形で再現する。 6d and 6e show an incremental change space chart for 2 months from 24/08/01 to 23/10/01, where the incremental change space trajectory T6e is a smooth trajectory C6e, the support line of FIG. Plotted with resistance lines S6b1 and R6b1, new support lines and resistance lines S6e2 and R6e2, and quantum line Q6e drawn from point P6e1. To plot the Quantum Line, the user selects a point on the incremental change space trajectory where the Quantum Line is drawn and clicks the Quantum
また、この例で、図6dおよび6eについては、ナビゲーションおよび売買ポジション・ウィンドウのみが示されていることに注意されたい。これは、スクリーン・デバイスに同時に表示されるウィンドウの種類と個数の選択は、市場参加者の好みに全く依存しているという事実を例示している。 Also note that in this example, only the navigation and buy / sell position windows are shown for FIGS. 6d and 6e. This illustrates the fact that the choice of the type and number of windows that are simultaneously displayed on the screen device is entirely dependent on market participant preferences.
図6eから、開いているダウン注文はシステムにより点P6e2で履行されることがわかる。当然のことであるが、トレーダーは、現在のポジションが閉じられるか、またはおそらく反転されるかという問題に取り組む。最も単純な決定は、抵抗線R6e2と上述のプロシージャに似た軌跡T6eとの交差で市場ポジションを閉じる条件を作成することである。この場合、ここでの仮説的なトレーダーは800ベーシス・ポイントにほぼ等しい収益を挙げているであろう。しかし、チャートをよく見ると、点P6e3での最大の未回収利益が約1130ベーシス・ポイントであることがわかるが、これは約40%高い。差は、点P6e3とP6e5の間のチャート上の上がり勾配セクションに対応している。したがって、収益はあるが、市場参加者の戦略は最適でなかったということである。 From FIG. 6e it can be seen that the open down order is fulfilled by the system at point P6e2. Of course, traders address the issue of whether the current position is closed or possibly reversed. The simplest decision is to create a condition that closes the market position at the intersection of the resistance line R6e2 and a trajectory T6e similar to the procedure described above. In this case, the hypothetical trader here would have earned approximately equal to 800 basis points. However, a closer look at the chart shows that the largest uncollected profit at point P6e3 is about 1130 basis points, which is about 40% higher. The difference corresponds to the rising slope section on the chart between points P6e3 and P6e5. Thus, while there is revenue, the market participants' strategies were not optimal.
最適な決定を下すためにはさまざま手段を使用するのがよい。例えば、図6eの下落トレンド反転に対する追加のシグナルは、点P6e1から引かれたクオンタム・ラインQ6eで与えることができる。リスクを避ける傾向の強いトレーダーであれば、第4のクオンタム・ラインの交差で、つまり点P6e4で、ポジションが閉じられるように成り行き注文をセットアップすることがありえる。この例では、これは、示されているように、収益性がかなり上昇するため市場参加者の選択としてはよい。しかし、これは、市場が下落を続けていた場合には引き下がるのは早すぎるため、すべての状況で当てはまる場合である必要はない。したがって、複数のグラフ要素を同時に使用して金融商品の動きの分析を最適化する場合がある。実際、入口および出口戦略に対し複数の条件の組合せを使用するのが好ましいことが多い。このような戦略の例について後述する。 Various means should be used to make an optimal decision. For example, an additional signal for the downtrend reversal of FIG. 6e can be provided by the quantum line Q6e drawn from point P6e1. A trader who tends to avoid risk can set up a market order so that the position is closed at the intersection of the fourth quantum line, ie at point P6e4. In this example, this is a good choice for the market participant as shown, as profitability increases significantly. But this doesn't have to be the case in all situations, as it will drop too early if the market continues to decline. Therefore, there are cases where a plurality of graph elements are used simultaneously to optimize the analysis of the movement of the financial product. In fact, it is often preferred to use a combination of conditions for the entry and exit strategies. An example of such a strategy will be described later.
市場参加者の意思決定を最適化するために、ソフトウェアを使い、「and」、「or」、「then」演算子を使用して市場ポジションを開くだけでなく閉じる注文を作成するため複数の複合条件を組み合わせることができる。例として、ユーロ/米国ドルのトレーダーが図7aから図7cに示されているチャートと連携することを考察しよう。説明を分かりやすくするため、この例の目的に関して、分析では、トレーダーは3つのグラフ要素、つまり、ステップr=0.00069で正規化され、EUR/USDの動きを表す増分変化空間軌跡T7、上がり勾配のトレンド支持および抵抗線S7およびR7、および移動平均曲線C7を採用すると仮定しよう。移動平均曲線をプロットするために、市場参加者は、マウス・カーソルまたは類似のデバイスで、増分変化空間建値軌跡T7を選択し、コマンド・バー56の移動平均コマンド・ボタン70をクリックする。「properties for moving average bundle」ダイアログ・ボックス102がアクティブにされ(図7a)、市場参加者は、フィールド118またはフィールド120を使用して、移動平均曲線だけでなくその種類と数量をプロットするのに使用される係数qの値を指定することができる。「Apply」ボタン124をクリックした後、要求は、ビジネス・サーバ14を介してデータベース10に送られる。データベースは計算を実行して計算結果を格納し、クライアント・サイトに応答を送信し、市場参加者のPCはその応答を、図7bに示されているように、PCコンピュータの画面上にプロットされる、グラフ要素、この例では移動平均曲線C7の形で再現する。 Use multiple software to optimize market participant decision making, using multiple “and”, “or” and “then” operators to create orders that close as well as open market positions You can combine conditions. As an example, consider that a Euro / US dollar trader works with the charts shown in FIGS. 7a-7c. For clarity of explanation, for the purposes of this example, in the analysis, the trader is normalized by three graph elements: step r = 0.00069, an incremental change space trajectory T7 representing the EUR / USD movement, up Suppose that the gradient trend support and resistance lines S7 and R7 and the moving average curve C7 are employed. To plot the moving average curve, the market participant selects the incremental change space quote trajectory T7 with a mouse cursor or similar device and clicks the moving
図7bでは、移動平均曲線は、量子数n=2、43個の点からなるライフ・スパンでプロットされている。1分間のリアルタイム入力データに基づいて軌跡T7を分析することで、トレーダーは、点P71から始まった上昇トレンドの終わりを識別しようとする。このトレンドの終わりは、軌跡T7および移動平均曲線C7による支持線S7の交差で発生するものとして識別することが可能であり、これら2つのシグナルは互いに強め合う。本発明による電子売買システムの枠組み内では、このような注文の作成は比較的単純であり、「and」演算子132を使用して実現することができる。そこで、市場参加者はシステムに、支持線S7に金融投資曲線軌跡T7および移動平均曲線C7が交差したときに下降ポジションを開く注文を入力する。実際には、これは、次のようにして実装することができる。図2に示されているポジション入力ウィンドウ22で、市場参加者は、「up−down」フィールド30に売買の方向、この場合「down」を、「lots」フィールド32内で出来高、この場合「10」ロットを選択する。「open condition」フィールドで、市場参加者は「complex condition」を選択する。 In FIG. 7b, the moving average curve is plotted with a life span consisting of 43 points with quantum number n = 2. By analyzing the trajectory T7 based on the one-minute real-time input data, the trader tries to identify the end of the upward trend that started from the point P71. The end of this trend can be identified as occurring at the intersection of the support line S7 with the trajectory T7 and the moving average curve C7, and these two signals strengthen each other. Within the framework of an electronic trading system according to the present invention, the creation of such an order is relatively simple and can be accomplished using the “and”
図7bを参照すると、市場参加者は、チャート領域58内でカーソルを使って、2つのグラフ要素(軌跡T7および支持線S7)および条件、この場合、演算子「<」、つまりT7はS7「より小さい」を選択し、「accept」ボタン108を押して有効性を確認する。コマンド・ボタン「then」128、「or」130、または「and」132を使用して、グラフ要素の2つまたはそれ以上のペアを組み合わせることができる。この例では、市場参加者は「and」コマンド132を使用し、さらに2つのグラフ要素(移動平均曲線C7および支持線S7)および条件「<」、つまりC7はS7「より小さい」を選択し、「OK」ボタン134を押して注文の有効性を確認する。 Referring to FIG. 7b, the market participant uses the cursor within the
複合条件を使用して成り行き注文を作成するという状況では、市場参加者に、以前に作成された複合条件の追跡、検証、および編集を行うためのツールを提供すると都合がよい。市場参加者が複合条件の有効性を確認した後、クライアントPCまたはサーバ・システムはその条件を格納し、要求があったときに、それをグラフィックまたはテキスト記号の形式で表示する。図7cを参照すると、複合条件表示フィールド138には、2つの複合条件140および142および上述のルーチンに従って作成された「and」演算子144が表示されている。条件140または142の一方を選択し、「curve 1」ボタン146または「curve 2」ボタン148をクリックすることにより、チャート・ウィンドウ内で関連するグラフ要素がハイライト表示される。複合条件を作成するために使用されたチャート・ウィンドウが閉じられた場合、市場参加者は「view」コマンド・ボタン150を使用してそのチャート・ウィンドウの自動再作成を要求することができる。 In situations where composite conditions are used to create market orders, it is convenient to provide market participants with tools for tracking, validating, and editing previously created composite conditions. After the market participant confirms the validity of the compound condition, the client PC or server system stores the condition and displays it in the form of a graphic or text symbol when requested. Referring to FIG. 7c, the composite
複合条件の作成は、今開いている、または将来開かれるであろうポジションを閉じる注文を作成するときと同じようにして実行することが可能であることに注意されたい。以下の例で、「then」演算子を使用して複数の複合条件を組み合わせる方法を説明する。図8aおよび8bを参照すると、軌跡T8が増分ステップr=0.00047で正規化された1分間のリアルタイム入力されたユーロ/米ドル・データに基づく増分変化空間内のチャートが示されている。そこで、トレーダーは上昇ポジションを開いており、ポジションが閉じられる最適な点を識別しようとしていると仮定する。この例では、傾向線R8b、S8b、および展開均衡曲線D8bの組合せを使用する。展開均衡曲線をプロットするために、市場参加者は、展開均衡曲線が描画される増分変化空間軌跡T8上に1点P8a1を選択し、コマンド・バー56の展開均衡曲線コマンド・ボタン72をクリックする。「properties for development trajectories」ダイアログ・ボックス152がアクティブにされ、市場参加者は、フィールド154で展開均衡曲線が描画される基準となる方向−上昇または下降−を選択し、フィールド156または158で、q=q_maxの値などのシステムによって自動的に計算された値または市場参加者によって指定されたqの他の値のうちから選択された係数qの値を選択することができる。「apply」ボタン160をクリックした後、要求は、サーバ・システムのデータベース10に送られる。データベースは計算を実行して計算結果を格納し、クライアント・サイトに応答を送信し、市場参加者のPCはその応答をPCコンピュータの画面上にプロットされるグラフ要素(曲線D8b)の形で再現する。 Note that creating a compound condition can be performed in the same way as creating an order that closes a position that is now open or will be opened in the future. The following example describes how to combine multiple compound conditions using the “then” operator. Referring to FIGS. 8a and 8b, there is shown a chart in an incremental change space based on 1 minute real-time input Euro / US dollar data with trajectory T8 normalized with incremental step r = 0.00047. Thus, assume that the trader is opening an up position and trying to identify the optimal point at which the position is closed. In this example, a combination of trend lines R8b and S8b and a development equilibrium curve D8b is used. To plot the unfolding balance curve, the market participant selects one point P8a1 on the incremental change space trajectory T8 on which the unfolding balance curve is drawn and clicks the unfolding
展開均衡曲線D8bは、従来、建値軌跡T8bの外殻として使用され、後者が展開曲線に「接触」すると、例えば、トレンドはその最高速に達しており、まもなく反転するであろうと仮定することが可能である。この仮定を考慮することで、トレーダーは、建値軌跡が展開均衡曲線以上でありその後に支持線の交差が続くときにポジションを閉じる条件をセットアップすることができ、これは、「then」演算子を使用することにより実行することができる。点P8b1とP8b2との間の領域内の支持線S8bの一時的交差は、単に支持線に基づく条件が成立する結果どのようにして収益の得られるポジションの早期決済が行われるのかを示しているとして条件を指定することは有利であることは図から明らかである。他方で、上で提案された指定では、トレーダーは、ピークに近いポジションを閉じるトレンド全体を有効に活用している。 The development equilibrium curve D8b is conventionally used as the outer shell of the quoted trajectory T8b, and if the latter “contacts” the development curve, for example, it can be assumed that the trend has reached its maximum speed and will soon reverse. Is possible. By taking this assumption into account, traders can set up a condition that closes the position when the quote trajectory is greater than or equal to the unfolding equilibrium curve, followed by the crossing of the support line, which It can be executed by using. The temporary crossing of the support line S8b in the region between the points P8b1 and P8b2 shows how early settlement of profitable positions is performed as a result of the condition based solely on the support line. It is clear from the figure that it is advantageous to specify the conditions as On the other hand, in the designation proposed above, traders are effectively utilizing the entire trend closing positions close to the peak.
ここで考察する最終事項は、電子売買システムの枠組み内に、点P8b3などでのさまざまなグラフ要素間に非常に一時的な交差をもたらす「ノイズの多い」変動に連関する問題を回避する他の有用な方法が存在するということである。複合条件を設定した後、それぞれ「quote shift」フィールド162および「time shift」フィールド164に値を入力することにより複合条件の下でポジションを開くまたは閉じるための「建値シフト」または「時間シフト」遅延のある距離を修正することが可能である。ベーシス・ポイントで測定された正または負の建値シフト遅延を指定することにより、縦軸の建値で測ったベーシス・ポイントでの特定の間隔をプラスまたはマイナスした複合条件(例えば、2つの曲線の交差)が成立したときにポジションは開かれるか、または閉じられる。同様に、時間遅延は、横軸の標準測定単位で測った距離をプラスしたグラフ条件を履行することを意味する。 The final thing to consider here is that within the framework of the electronic trading system, other issues that avoid the problems associated with “noisy” fluctuations that result in very temporary intersections between various graph elements, such as at point P8b3. There is a useful method. After setting a compound condition, a “quote shift” or “time shift” delay to open or close a position under the compound condition by entering values in the “quote shift”
次に、米ドル/日本円市場で活動しているトレーダーに関する別の例を取りあげることにする。例えば、仮説的トレーダーとしては、通常ポジションを保持するのが2取引日以内であり、毎日複数の取引を成立させ、平均売買利益または損失が比較的小さく、その額は通常100ベーシス・ポイント以下である市場参加者として定義される「デイ・トレーダー」とすることが可能である。このようなトレーダーは短期市場変動に主に関心があるため、意思決定は特に速くなければならない。このようなトレーダーにとっては、売買決定を最もよい時期に最も効率的な方法で実行する売買システムが利用できる状態にあることが重要である。 Let's take another example of a trader operating in the US dollar / Japanese yen market. For example, as a hypothetical trader, a normal position is held within 2 trading days, multiple transactions are closed every day, and the average trading profit or loss is relatively small, the amount is usually less than 100 basis points It can be a “day trader” defined as a market participant. Since such traders are primarily interested in short-term market fluctuations, decision making must be particularly fast. For such traders, it is important that a trading system is available that performs trading decisions in the most efficient manner at the best time.
図9aは、USD/JPYに対するロイター1分間建値に基づいて正規化ステップr=0.11296で増分変化空間内に軌跡T9を表示している。では、トレーダーが点P91で作戦的売買決定を行うと仮定する。このときに、トレーダーが利用できる情報から、建値軌跡T9は「last minimum」線L91によって定義されているように前の底値に達していることがわかる。しかし、意思決定点で、トレーダーは、これが下落トレンドの反転を示す指標として従来から使用されている、従来のテクニカル分析で使用されることが多い周知の「2番底」構造であるのか、あるいは下落トレンドは引き続き「last minimum」線よりも下がるのかを示す明快な情報を持たない。「last minimum」または「last maximum」線をプロットするために、市場参加者は、クライアントPCのカーソルを使用して増分変化軌跡T9を選択し、コマンド・バーの「last minimum−last maximum」コマンド・ボタン74をクリックする。 FIG. 9a displays a trajectory T9 in the incremental change space with a normalization step r = 0.11296 based on the Reuters 1-minute quote for USD / JPY. Now assume that the trader makes a strategic buy / sell decision at point P91. At this time, it can be seen from the information available to the trader that the quoted track T9 has reached the previous bottom as defined by the “last minimum” line L91. However, at the decision point, the trader has a well-known “bottom” structure that is often used in traditional technical analysis, which is traditionally used as an indicator of the reversal of downtrends, or The downtrend continues to have no clear information indicating whether it will fall below the “last minimum” line. To plot the “last minimum” or “last maximum” line, the market participant uses the client PC cursor to select an incremental change trajectory T9 and the “last minimum-last maximum” command in the command bar. Click the
解決策の1つとして、市場がより具体的な方向シグナルを発し、その後になってポジションを開くのを待つという方法が考えられる。しかし、これだと、すでに指摘したようにすでにデイ・トレーダーにきわめて限定されている可能な収益分け前の大部分が減っていくおそれがある。 One solution is to wait for the market to give a more specific direction signal and then open a position. However, this may reduce most of the possible revenue share that is already very limited to day traders, as already pointed out.
他の解決策としては、2件の注文をシステムに出し、建値軌跡T9に対し2つの可能なシナリオ(下方または上方の動き)をシミュレートするという方法が考えられる。この目的のために、トレーダーはシステムに対して、建値の前の最小値の水準(変曲点)を計算し、対応する水平線(L91)をプロットするように要求することができる。市場参加者は、売買ウィンドウ内で、例えば、軌跡T9と「last minimum」線L91とが交差したときに下降ポジションを開く注文を作成する。交差した後、市場参加者は、例えば、市場が下向き方向をとっていると考えることができる。 Another solution is to place two orders in the system and simulate two possible scenarios (downward or upward movement) for the quote trajectory T9. For this purpose, the trader can ask the system to calculate the minimum level (inflection point) before the quote and plot the corresponding horizontal line (L91). The market participant creates an order that opens a descending position when, for example, the trajectory T9 and the “last minimum” line L91 intersect within the trading window. After crossing, a market participant can think, for example, that the market is taking a downward direction.
それと同時に、トレーダーは、反対方向で成り行き注文を入力することができる(図9b)。この目的のために、2つのグラフ要素、つまり、可能な下落トレンドに対する下がり勾配の抵抗線R9および支持線S9および滑らかな軌跡線C9を同時に採用することができる。カーソルを使用してグラフ要素および「or」演算子ボタン130を選択することにより、トレーダーは、建値軌跡T9が抵抗線R9または滑らかな軌跡線C9と交差した場合にUSD/JPYで上昇ポジションを開く注文を作成する。2件の注文および条件が、図9bに示されているように条件表示フィールド136に表示される。 At the same time, the trader can enter a market order in the opposite direction (Figure 9b). For this purpose, two graph elements can be employed at the same time, namely a down-slope resistance line R9 and a support line S9 and a smooth trajectory line C9 for possible downtrends. By using the cursor to select the graph element and the “or”
この単純な例は、不確定要素がある場合に、市場参加者が実際に市場行動に対する発散シナリオを活かすためどのように成り行き注文を作成できるかを示している。もちろん、市場参加者の戦略を複数のグラフ要素、複数の「and」、「or」、「then」演算子、時間および建値遅延などを使用することにより定義する方法は多数ある。同様に、市場参加者は、例えば、滑らかな曲線の建値軌跡と抵抗線による再交差がある場合、または場合によっては、新しいグラフ要素に基づいて条件が満たされたときにポジションが閉じられるように同じグラフ要素に基づき閉じる条件を設定することができる。 This simple example, when there is uncertainty, shows how you can create a market order in order to take advantage of the divergent scenarios for market participants actually market behavior. Of course, there are many ways to define a market participant's strategy by using multiple graph elements, multiple “and”, “or”, “then” operators, time and quote delays, and the like. Similarly, market participants can close their positions when, for example, there is a recursive crossover due to a smooth curve quote and a resistance line, or in some cases when a condition is met based on a new graph element. A closing condition can be set based on the same graph element.
簡単にいうと、本明細書で説明している電子売買システムは、金融情報および外国為替、株式、デリバティブなどの金融商品の売買をグラフ表示するためのオンライン・システムである。このシステムがあれば、金融市場参加者(アナリスト、トレーダー、投資家)は金融データの視覚的表示および分析だけでなく、金融市場商品の購入および販売のため電子売買注文を作成するのに使用される売買システムのための多数のツールを使用できる。 Briefly, the electronic trading system described herein is an online system for graphically displaying financial information and buying and selling of financial products such as foreign exchange, stocks and derivatives. With this system, financial market participants (analysts, traders, investors) can use it to create electronic trade orders for the purchase and sale of financial market products, as well as visual display and analysis of financial data You can use numerous tools for trading systems that are played.
実際、市場参加者が成功するかどうかは、3つの主要な条件、つまり、現在および将来の市場の方向(つまり、トレンド)、参加者が特定の金融商品の売買を通じて市場に参加することを決定する際の時期および価格、そして最後に、参加者の決定をタイミングよく、効率よく実行(履行)することにかかっている。上記の条件が満たされることが必要であることは、金融業務が最終的に成功するかまたは失敗するかに関して非常に重要であると思われる。例えば、いつも変化している市場に関しては、市場の方向に関する正しい決定から得られる利益は、最適とはいえない価格で市場に入ることにより徐々に損なわれてゆく可能性がある。 In fact, whether a market participant is successful determines three main conditions: current and future market direction (ie, trend), and the participant decides to join the market through buying and selling a specific financial instrument. It depends on the timing and price of the decision, and finally the decision of the participants in a timely and efficient manner. The requirement that the above conditions be met seems to be very important with regard to whether the financial business will ultimately succeed or fail. For example, for an ever-changing market, the profits gained from the right decisions about market direction can be gradually impaired by entering the market at suboptimal prices.
本発明による電子売買システムを利用すると、市場参加者は売買決定を下し、履行するための分析手段のポートフォリオを使用することができる。より具体的には、このシステムを使用する市場参加者は、入って来る金融データ(建値)を受信し、処理し、言葉で表し、チャート形式で表示することができる。また、システムは、金融商品の動きを分析し、売買決定または推奨を行うためのツールも備える。これらのツールに含まれるのは、
− 市場データ(建値)のデータベース
− 実際の市場データを増分変化空間内の軌跡に変換するプログラム・モジュールにより実行可能なデータ・フィルタ処理方法
− 支持線、抵抗線、クオンタム・ライン、展開均衡線、ビーム、ビーム平均曲線、最高速の軌跡、前の最小値および最大値に対する線、およびその変動などの増分変化空間分析線を計算し、描画するためのプログラム・モジュールにより実行可能な方法
− 上述の分析線の画面上の選択に基づき市場ポジションを開き、閉じる操作を行うためプログラム・モジュールにより実行可能な方法を含む売買およびポートフォリオ管理ツールUtilizing the electronic trading system according to the present invention, market participants can use a portfolio of analytical tools to make and execute trading decisions. More specifically, market participants using this system can receive, process, verbalize and display incoming financial data (quoted prices) in chart form. The system also includes tools for analyzing the movement of financial products and making trading decisions or recommendations. These tools include:
-A database of market data (quote price)-A data filtering method that can be executed by a program module that converts actual market data into a trajectory in incremental change space-Support lines, resistance lines, quantum lines, unfolding equilibrium lines, A method executable by the program module to calculate and draw incremental change spatial analysis lines such as beams, beam average curves, fastest trajectories, lines for previous minimum and maximum values, and their variations-as described above Trading and portfolio management tools including methods that can be executed by the program module to open and close market positions based on on-screen selection of analysis lines
この売買システムを使用することにより、市場参加者は、多数の売買ポートフォリオを作成することができる。これらのポートフォリオを使用して、新しい証券を購入したり、購入済みの証券を売ったり、条件付き購入を作成、編集したり、注文を売ったりといった活動を行うことができる。上述の分析ツールの助けを借りて、入ってきたデータの表示を解釈することにより導かれる1つまたは複数の条件付き基準に基づいて決定を下すことができる。 By using this trading system, market participants can create multiple trading portfolios. These portfolios can be used to purchase new securities, sell purchased securities, create and edit conditional purchases, and sell orders. With the help of the analysis tools described above, decisions can be made based on one or more conditional criteria derived by interpreting the incoming data representation.
Claims (26)
Translated fromJapanese− 前記市場参加者により通信ネットワークを介してアクセス可能なサーバ・システムを備える電子売買システムを実現する工程と、
− 金融商品に関するデータをサーバ・システムから選択してダウンロードする工程と、
− グラフ要素を前記表示装置上に生成し、表示する工程であって、前記グラフ要素は金融商品のグラフ表示と情報分析ツールのグラフ表示である第1のグラフ要素を含む工程と、
− 表示ポインティング・デバイスを使用して少なくとも前記第1および第2のグラフ要素を選択する工程と、
− 前記第2のグラフ要素に関して前記第1のグラフ要素に複数の条件のうちの少なくとも1つを適用し、前記条件が満たされたときに前記金融商品に対し前記サーバ・システムにより自動的にアクションを実行できるようにする工程を含む方法。A method of processing financial information and displaying it on an electronic display device of a market participant,
-Realizing an electronic trading system comprising a server system accessible via a communication network by said market participants;
-Selecting and downloading data on financial products from the server system;
-Generating and displaying a graph element on the display device, the graph element including a first graph element that is a graph display of a financial product and a graph display of an information analysis tool;
-Selecting at least the first and second graph elements using a display pointing device;
-Applying at least one of a plurality of conditions to the first graph element with respect to the second graph element and automatically acting on the financial instrument by the server system when the condition is met A method comprising the step of enabling execution.
− 市場データのソースを含む電子売買システムを実現する工程と、
− 金融商品に関するデータを前記ソースから選択してダウンロードする工程と、
− 前記電子表示装置上でグラフ要素を生成し表示する工程と、
− 表示ポインティング・デバイスを使って前記グラフ要素のペアを選択し、比較条件「より小さい」、「より大きい」、「以下」、または「以上」のいずれかの比較を適用して前記比較条件が満たされたときに前記市場参加者によって事前定義されているアクションが前記システムにより実行されることを可能にする工程を含む方法。A method of processing financial information, displaying it on a market participant's electronic display device, and automating buying and selling decisions,
-Implementing an electronic trading system that includes a source of market data;
-Selecting and downloading data relating to financial instruments from said source;
-Generating and displaying graph elements on said electronic display device;
-Use a display pointing device to select the pair of graph elements and apply a comparison of any of the comparison conditions "less than", "greater than", "less than" or "more than" to A method comprising allowing an action predefined by the market participant to be performed by the system when satisfied.
Using a trading system, market participants can verify the procedure by selecting the text or graphic symbol of a graph element using a display pointing device, and the system will plot the graph element. 25. The method of claim 24, wherein the location of the highlighted chart is displayed.
Applications Claiming Priority (1)
| Application Number | Priority Date | Filing Date | Title |
|---|---|---|---|
| PCT/IB2002/000326WO2003065258A2 (en) | 2002-01-29 | 2002-01-29 | Method of processing, displaying and trading financial instruments and an electronic trading system therefor |
Publications (1)
| Publication Number | Publication Date |
|---|---|
| JP2005516307Atrue JP2005516307A (en) | 2005-06-02 |
Family
ID=27637605
Family Applications (1)
| Application Number | Title | Priority Date | Filing Date |
|---|---|---|---|
| JP2003564780APendingJP2005516307A (en) | 2002-01-29 | 2002-01-29 | Method for processing, displaying and buying and selling financial products and electronic trading system therefor |
Country Status (3)
| Country | Link |
|---|---|
| US (1) | US20050075966A1 (en) |
| JP (1) | JP2005516307A (en) |
| WO (1) | WO2003065258A2 (en) |
Families Citing this family (99)
| Publication number | Priority date | Publication date | Assignee | Title |
|---|---|---|---|---|
| US6850907B2 (en)* | 1996-12-13 | 2005-02-01 | Cantor Fitzgerald, L.P. | Automated price improvement protocol processor |
| US5905974A (en)* | 1996-12-13 | 1999-05-18 | Cantor Fitzgerald Securities | Automated auction protocol processor |
| US7392214B1 (en) | 1999-04-30 | 2008-06-24 | Bgc Partners, Inc. | Systems and methods for trading |
| KR20030001462A (en) | 2000-05-01 | 2003-01-06 | 씨에프피에이치, 엘. 엘. 씨. | Real-time interactive wagering on event outcomes |
| US7392217B2 (en)* | 2001-05-09 | 2008-06-24 | Bgc Partners, Inc. | Systems and methods for controlling traders from manipulating electronic trading markets |
| CA2704252C (en) | 2001-07-26 | 2011-09-27 | Irise | System and process for interacting with a user to define a behavior of a portion of an interactive presentation |
| US7594181B2 (en)* | 2002-06-27 | 2009-09-22 | Siebel Systems, Inc. | Prototyping graphical user interfaces |
| US8254548B2 (en)* | 2002-07-10 | 2012-08-28 | Blake Bookstaff | Method and system for providing directory assistance to erroneous telephone calls |
| US8472607B2 (en) | 2002-07-10 | 2013-06-25 | Blake Bookstaff | Method and system for providing directory assistance to erroneous telephone calls |
| US8254547B2 (en)* | 2002-07-10 | 2012-08-28 | Blake Bookstaff | Method and system for providing directory assistance to erroneous telephone calls |
| US8693664B2 (en) | 2002-07-10 | 2014-04-08 | Blake Bookstaff | Method and system for providing directory assistance to erroneous telephone calls |
| US8913732B2 (en) | 2002-07-10 | 2014-12-16 | Blake Bookstaff | Method and system for providing directory assistance to erroneous telephone calls via wearable devices |
| US7227936B2 (en)* | 2002-07-10 | 2007-06-05 | Blake Bookstaff | Method and system for providing directory assistance to erroneous telephone calls |
| US8472608B2 (en) | 2002-07-10 | 2013-06-25 | Blake Bookstaff | Method and system for providing directory assistance to erroneous telephone calls |
| GB2395036A (en) | 2002-10-31 | 2004-05-12 | Espeed Inc | Trading interface using keyboard |
| EP1416363A3 (en) | 2002-10-31 | 2006-07-26 | eSpeed, Inc. | Keyboard for trading system |
| US8913728B2 (en) | 2002-11-07 | 2014-12-16 | Blake Bookstaff | Method and system for automated intellegent advertising on wearable devices |
| US8542809B2 (en) | 2002-11-07 | 2013-09-24 | Blake Bookstaff | Method and system for alphanumeric indexing for advertising with cloud computing |
| US8611517B2 (en) | 2002-11-07 | 2013-12-17 | Blake Bookstaff | Method and system for alphanumeric indexing for advertising with cloud computing |
| US7113190B2 (en)* | 2002-11-27 | 2006-09-26 | Espeed, Inc. | Systems and methods for providing an interactive graphical representation of a market for an electronic trading system |
| US8380611B2 (en) | 2002-11-27 | 2013-02-19 | Bgc Partners, Inc. | Graphical order entry user interface for trading system |
| US7921054B2 (en)* | 2002-12-09 | 2011-04-05 | Deep Liquidity, Inc. | System and method for block trading |
| US7769668B2 (en)* | 2002-12-09 | 2010-08-03 | Sam Balabon | System and method for facilitating trading of financial instruments |
| JP2004280739A (en)* | 2003-03-19 | 2004-10-07 | Hitachi Ltd | Information distribution system |
| US8595121B2 (en)* | 2003-03-24 | 2013-11-26 | Bgc Partners, Inc. | Midprice trading within a spread market |
| US7341517B2 (en) | 2003-04-10 | 2008-03-11 | Cantor Index, Llc | Real-time interactive wagering on event outcomes |
| US8924278B2 (en)* | 2003-07-25 | 2014-12-30 | Chicago Mercantile Exchange Inc. | System and method for controlling markets during a stop loss trigger |
| US8103576B2 (en)* | 2003-07-25 | 2012-01-24 | Chicago Mercantile Exchange Inc. | Controlling markets during a stop loss trigger |
| US8112347B2 (en) | 2003-07-25 | 2012-02-07 | Chicago Mercantile Exchange Inc. | Controlling implied markets during a stop loss trigger |
| US20050102216A1 (en)* | 2003-08-14 | 2005-05-12 | Glenn Ballman | An Electronic Order Book with Security Rights |
| US8131625B2 (en)* | 2003-11-17 | 2012-03-06 | Bgc Partners, Inc. | Customizable trading display of market data |
| US8131626B2 (en)* | 2003-11-17 | 2012-03-06 | Bgc Partners, Inc. | Customizable trading display of market data |
| US10225373B2 (en) | 2003-11-21 | 2019-03-05 | Thomson Reuters (Grc) Llc | Financial-information systems, methods, interfaces, and software |
| US20050256797A1 (en)* | 2004-05-13 | 2005-11-17 | Scottrade, Inc. | Method and apparatus for user-interactive financial instrument trading |
| WO2005122047A2 (en) | 2004-06-07 | 2005-12-22 | Cfph, Llc | System and method for managing financial market information |
| US7890396B2 (en) | 2005-06-07 | 2011-02-15 | Cfph, Llc | Enhanced system and method for managing financial market information |
| WO2005124632A2 (en)* | 2004-06-08 | 2005-12-29 | Rosenthal Collins, Group, Llc | Method and system for providing electronic information for multi-market electronic trading |
| US8429059B2 (en) | 2004-06-08 | 2013-04-23 | Rosenthal Collins Group, Llc | Method and system for providing electronic option trading bandwidth reduction and electronic option risk management and assessment for multi-market electronic trading |
| US7912781B2 (en)* | 2004-06-08 | 2011-03-22 | Rosenthal Collins Group, Llc | Method and system for providing electronic information for risk assessment and management for multi-market electronic trading |
| US20060010066A1 (en)* | 2004-07-12 | 2006-01-12 | Rosenthal Collins Group, L.L.C. | Method and system for providing a graphical user interface for electronic trading |
| US20080162378A1 (en)* | 2004-07-12 | 2008-07-03 | Rosenthal Collins Group, L.L.C. | Method and system for displaying a current market depth position of an electronic trade on a graphical user interface |
| US7620586B2 (en)* | 2004-09-08 | 2009-11-17 | Rosenthal Collins Group, Llc | Method and system for providing automatic execution of trading strategies for electronic trading |
| US20100094777A1 (en)* | 2004-09-08 | 2010-04-15 | Rosenthal Collins Group, Llc. | Method and system for providing automatic execution of risk-controlled synthetic trading entities |
| WO2006031952A2 (en)* | 2004-09-14 | 2006-03-23 | Ameritrade Ip Company, Inc. | Pattern matcher |
| US10586281B1 (en) | 2004-09-29 | 2020-03-10 | Refinitiv Us Organization Llc | Financial-information systems, methods, interfaces and software |
| US7624064B2 (en)* | 2004-11-01 | 2009-11-24 | Rosenthal Collins Group, Llc | Method and system for providing multiple graphic user interfaces for electronic trading |
| US7627517B2 (en) | 2004-12-09 | 2009-12-01 | Rosenthal Collins Group, Llc | Method and system for providing configurable features for graphical user interfaces for electronic trading |
| JP3981387B2 (en)* | 2005-02-04 | 2007-09-26 | 有限会社増田経済研究所 | Stock index display |
| CA2518012A1 (en) | 2005-03-24 | 2006-09-24 | Espeed, Inc. | Systems and methods for protecting against erroneous price entries in the electronic trading of financial and other instruments |
| US8589280B2 (en) | 2005-05-04 | 2013-11-19 | Rosenthal Collins Group, Llc | Method and system for providing automatic execution of gray box strategies for electronic trading |
| US7801801B2 (en) | 2005-05-04 | 2010-09-21 | Rosenthal Collins Group, Llc | Method and system for providing automatic execution of black box strategies for electonic trading |
| US8364575B2 (en) | 2005-05-04 | 2013-01-29 | Rosenthal Collins Group, Llc | Method and system for providing automatic execution of black box strategies for electronic trading |
| WO2006130650A2 (en) | 2005-05-31 | 2006-12-07 | Rosenthal Collins Group, Llc | Method and system for electronically inputting, monitoring and trading spreads |
| US20080288391A1 (en)* | 2005-05-31 | 2008-11-20 | Rosenthal Collins Group, Llc. | Method and system for automatically inputting, monitoring and trading spreads |
| JP2009509247A (en)* | 2005-09-16 | 2009-03-05 | ダラル,パンカジ,ビー. | Financial decision-making system |
| US20070088658A1 (en)* | 2005-09-30 | 2007-04-19 | Rosenthal Collins Group, L.L.C. | Method and system for providing accounting for electronic trading |
| US20110022509A1 (en)* | 2005-11-13 | 2011-01-27 | Rosenthal Collins Group, L.L.C. | Method and system for electronic trading via a yield curve on plural network devices |
| US7849000B2 (en)* | 2005-11-13 | 2010-12-07 | Rosenthal Collins Group, Llc | Method and system for electronic trading via a yield curve |
| WO2007056553A2 (en)* | 2005-11-13 | 2007-05-18 | Rosenthal Collins Group, Llc | Method and system for electronic trading via a yield curve |
| EP1949323A1 (en)* | 2005-11-18 | 2008-07-30 | Rts Realtime Systems Ag | Algorithmic trading system, a method for computer-based algorithmic trading and a computer program product |
| US8229832B2 (en) | 2006-01-09 | 2012-07-24 | Bgc Partners, Inc. | Systems and methods for establishing first on the follow trading priority in electronic trading systems |
| US20070168275A1 (en)* | 2006-01-13 | 2007-07-19 | Andrew Busby | Method for trading using volume submissions |
| US20080059846A1 (en)* | 2006-08-31 | 2008-03-06 | Rosenthal Collins Group, L.L.C. | Fault tolerant electronic trading system and method |
| US8562422B2 (en) | 2006-09-28 | 2013-10-22 | Cfph, Llc | Products and processes for processing information related to weather and other events |
| US20080172322A1 (en)* | 2007-01-17 | 2008-07-17 | Steidlmayer Pete | Method for scheduling future orders on an electronic commodity trading system |
| GB0705046D0 (en)* | 2007-03-15 | 2007-04-25 | Tyler Capital Ltd | Trading analysis tools |
| US8036971B2 (en) | 2007-03-30 | 2011-10-11 | Palantir Technologies, Inc. | Generating dynamic date sets that represent market conditions |
| US8600859B2 (en)* | 2007-06-24 | 2013-12-03 | Soren Lanng | Automatic trading system with computer aided decision-methods of when to buy and sell on stock exchanges |
| US8484115B2 (en) | 2007-10-03 | 2013-07-09 | Palantir Technologies, Inc. | Object-oriented time series generator |
| WO2009074987A2 (en)* | 2007-12-10 | 2009-06-18 | Easy Forex Ltd. | Device, system, and method of online trading |
| US20090171832A1 (en)* | 2007-12-28 | 2009-07-02 | Cunningham Trading Systems, Llc | Method for displaying multiple markets |
| US20100010937A1 (en)* | 2008-04-30 | 2010-01-14 | Rosenthal Collins Group, L.L.C. | Method and system for providing risk assessment management and reporting for multi-market electronic trading |
| US8984390B2 (en) | 2008-09-15 | 2015-03-17 | Palantir Technologies, Inc. | One-click sharing for screenshots and related documents |
| US20100070426A1 (en) | 2008-09-15 | 2010-03-18 | Palantir Technologies, Inc. | Object modeling for exploring large data sets |
| US20100241588A1 (en)* | 2009-03-17 | 2010-09-23 | Andrew Busby | System and method for determining confidence levels for a market depth in a commodities market |
| US8214277B2 (en)* | 2009-03-20 | 2012-07-03 | Dalal Pankaj B | Multidimensional risk analysis systems |
| US8694405B2 (en)* | 2010-01-21 | 2014-04-08 | Visual Trader Systems, S.L. | System and method of visual representation of stock exchange transactions |
| EP2625606A4 (en)* | 2010-10-08 | 2014-11-26 | Irise | System and method for extending a visualization platform |
| US8732574B2 (en) | 2011-08-25 | 2014-05-20 | Palantir Technologies, Inc. | System and method for parameterizing documents for automatic workflow generation |
| US8280802B1 (en) | 2011-09-02 | 2012-10-02 | Cervo Frank J | System and method for decisions in trading financial instruments |
| US8645262B1 (en)* | 2011-12-30 | 2014-02-04 | Charles Schwab & Co., Inc. | System and method for displaying security information |
| US8660936B1 (en) | 2012-09-21 | 2014-02-25 | Chicago Mercantile Exchange Inc. | Detection and mitigation of effects of high velocity price changes |
| US9348677B2 (en) | 2012-10-22 | 2016-05-24 | Palantir Technologies Inc. | System and method for batch evaluation programs |
| US8930897B2 (en) | 2013-03-15 | 2015-01-06 | Palantir Technologies Inc. | Data integration tool |
| US8868486B2 (en) | 2013-03-15 | 2014-10-21 | Palantir Technologies Inc. | Time-sensitive cube |
| US8855999B1 (en) | 2013-03-15 | 2014-10-07 | Palantir Technologies Inc. | Method and system for generating a parser and parsing complex data |
| US8909656B2 (en) | 2013-03-15 | 2014-12-09 | Palantir Technologies Inc. | Filter chains with associated multipath views for exploring large data sets |
| US8903717B2 (en) | 2013-03-15 | 2014-12-02 | Palantir Technologies Inc. | Method and system for generating a parser and parsing complex data |
| US8938686B1 (en) | 2013-10-03 | 2015-01-20 | Palantir Technologies Inc. | Systems and methods for analyzing performance of an entity |
| US9105000B1 (en) | 2013-12-10 | 2015-08-11 | Palantir Technologies Inc. | Aggregating data from a plurality of data sources |
| US8924429B1 (en) | 2014-03-18 | 2014-12-30 | Palantir Technologies Inc. | Determining and extracting changed data from a data source |
| US20160042455A1 (en)* | 2014-08-11 | 2016-02-11 | Sunil Arvindam | Performance evaluation of trading strategies |
| US20160225082A1 (en)* | 2015-02-04 | 2016-08-04 | Right Line Trading, LLC | Automated financial interest trading process based on formation close |
| US10692144B2 (en) | 2016-04-06 | 2020-06-23 | Chicagil Mercantile Exchange Inc. | Multi-path routing system including an integrity mechanism |
| US10783532B2 (en) | 2016-04-06 | 2020-09-22 | Chicago Mercantile Exchange Inc. | Detection and mitigation of effects of high velocity value changes based upon match event outcomes |
| US11238534B2 (en)* | 2017-03-09 | 2022-02-01 | Jpmorgan Chase Bank, N.A. | Method and system for commingling aggregate prices and franchise prices |
| US11216874B2 (en)* | 2017-03-09 | 2022-01-04 | Jpmorgan Chase Bank, N.A. | Method and system for aggregating foreign exchange measures |
| US20180260895A1 (en)* | 2017-03-09 | 2018-09-13 | Jpmorgan Chase Bank, N.A. | Method and system for performing benchmark comparisons |
| CA3121011A1 (en)* | 2018-11-29 | 2020-06-04 | Clifin Pty Ltd | An information management system |
Citations (6)
| Publication number | Priority date | Publication date | Assignee | Title |
|---|---|---|---|---|
| JPH06504152A (en)* | 1990-12-28 | 1994-05-12 | ロイターズ・リミテッド | Apparatus and method for creating user-definable video display documents showing changes in real-time data |
| WO2000051043A1 (en)* | 1999-02-24 | 2000-08-31 | Min Ho Cha | Automatic ordering method and system for trading of stock, bond, item, future index, option, index, current and so on |
| JP2000352528A (en)* | 1999-06-10 | 2000-12-19 | Mitsubishi Electric Corp | How to display the trend graph |
| JP2001155086A (en)* | 1999-09-14 | 2001-06-08 | Nippon Online Shoken Kk | Device, system and method for automatically giving selling or buying order |
| JP2002007707A (en)* | 2000-06-22 | 2002-01-11 | Keio Gijuku | Trading system |
| JP2002024547A (en)* | 2000-07-10 | 2002-01-25 | Kentex Kk | Stock buying and selling timing decision supporting system |
Family Cites Families (3)
| Publication number | Priority date | Publication date | Assignee | Title |
|---|---|---|---|---|
| US5297032A (en)* | 1991-02-01 | 1994-03-22 | Merrill Lynch, Pierce, Fenner & Smith Incorporated | Securities trading workstation |
| US7082398B1 (en)* | 1996-01-16 | 2006-07-25 | The Nasdaq Stock Market, Inc. | Media wall for displaying financial information |
| US6963855B1 (en)* | 2000-04-10 | 2005-11-08 | Alexander Borzenko | Apparatus and method for automated display of market activity |
- 2002
- 2002-01-29JPJP2003564780Apatent/JP2005516307A/enactivePending
- 2002-01-29WOPCT/IB2002/000326patent/WO2003065258A2/enactiveApplication Filing
- 2002-01-29USUS10/503,147patent/US20050075966A1/ennot_activeAbandoned
Patent Citations (6)
| Publication number | Priority date | Publication date | Assignee | Title |
|---|---|---|---|---|
| JPH06504152A (en)* | 1990-12-28 | 1994-05-12 | ロイターズ・リミテッド | Apparatus and method for creating user-definable video display documents showing changes in real-time data |
| WO2000051043A1 (en)* | 1999-02-24 | 2000-08-31 | Min Ho Cha | Automatic ordering method and system for trading of stock, bond, item, future index, option, index, current and so on |
| JP2000352528A (en)* | 1999-06-10 | 2000-12-19 | Mitsubishi Electric Corp | How to display the trend graph |
| JP2001155086A (en)* | 1999-09-14 | 2001-06-08 | Nippon Online Shoken Kk | Device, system and method for automatically giving selling or buying order |
| JP2002007707A (en)* | 2000-06-22 | 2002-01-11 | Keio Gijuku | Trading system |
| JP2002024547A (en)* | 2000-07-10 | 2002-01-25 | Kentex Kk | Stock buying and selling timing decision supporting system |
Also Published As
| Publication number | Publication date |
|---|---|
| WO2003065258A2 (en) | 2003-08-07 |
| US20050075966A1 (en) | 2005-04-07 |
Similar Documents
| Publication | Publication Date | Title |
|---|---|---|
| JP2005516307A (en) | Method for processing, displaying and buying and selling financial products and electronic trading system therefor | |
| US20210279744A1 (en) | Methods and systems for managing and trading using a shared order book as internal exchange | |
| US7827090B2 (en) | Apparatus and method for displaying trading trends | |
| US20090076945A1 (en) | Quick-filling customer asset trading system for booking orders with multiple providers | |
| US7877312B2 (en) | Apparatus and method for displaying trading trends | |
| US7430532B2 (en) | System and method for trade entry | |
| AU2009200963B2 (en) | Method for displaying information for use in electronic trading of financial instruments | |
| US8290837B2 (en) | Systems and methods for financial instrument inspection | |
| KR20250126763A (en) | Electronic platform for managing investment products | |
| KR20200106438A (en) | Electronic platform for managing investment products | |
| US20100218136A1 (en) | Method and Apparatus for User-Interactive Financial Instrument Trading | |
| US20020152151A1 (en) | Integrated investment portfolio management system and method | |
| US20060047590A1 (en) | Real-time risk management trading system for professional equity traders with adaptive contingency notification | |
| US20080162334A1 (en) | Complementary trading of interests | |
| US20050187858A1 (en) | Fixed income security offerings management techniques and related applications | |
| JP2010118084A (en) | System and method for estimating and optimizing transaction cost | |
| CA2477561A1 (en) | System and method for performing automatic spread trading | |
| US7827082B1 (en) | Method and system for mapping user data | |
| US20030065598A1 (en) | Methods and systems for managing a portfolio of securities | |
| JP2010536104A (en) | Financial decision-making system | |
| US20150095258A1 (en) | Composite portfolio trading method, creation and analysis system | |
| US7127421B1 (en) | Method and system for identifying bottlenecks in a securities processing system | |
| US20080228559A1 (en) | System and method for creating financial investment indices | |
| US20210158375A1 (en) | System and method for creating a trading strategy | |
| Chircu et al. | Beyond the ‘eBay of blank': Next stage digital intermediation in electronic commerce |
Legal Events
| Date | Code | Title | Description |
|---|---|---|---|
| A977 | Report on retrieval | Free format text:JAPANESE INTERMEDIATE CODE: A971007 Effective date:20071005 | |
| A131 | Notification of reasons for refusal | Free format text:JAPANESE INTERMEDIATE CODE: A131 Effective date:20071010 | |
| A601 | Written request for extension of time | Free format text:JAPANESE INTERMEDIATE CODE: A601 Effective date:20080110 | |
| A602 | Written permission of extension of time | Free format text:JAPANESE INTERMEDIATE CODE: A602 Effective date:20080118 | |
| A521 | Request for written amendment filed | Free format text:JAPANESE INTERMEDIATE CODE: A523 Effective date:20080410 | |
| A02 | Decision of refusal | Free format text:JAPANESE INTERMEDIATE CODE: A02 Effective date:20080512 |