EP3857381B1 - Collecting samples hierarchically in a datacenter - Google Patents
Collecting samples hierarchically in a datacenterDownload PDFInfo
- Publication number
- EP3857381B1 EP3857381B1EP19805453.8AEP19805453AEP3857381B1EP 3857381 B1EP3857381 B1EP 3857381B1EP 19805453 AEP19805453 AEP 19805453AEP 3857381 B1EP3857381 B1EP 3857381B1
- Authority
- EP
- European Patent Office
- Prior art keywords
- histogram
- svr
- metric
- bin
- service
- Prior art date
- Legal status (The legal status is an assumption and is not a legal conclusion. Google has not performed a legal analysis and makes no representation as to the accuracy of the status listed.)
- Active
Links
Images


Classifications
- G—PHYSICS
- G06—COMPUTING OR CALCULATING; COUNTING
- G06F—ELECTRIC DIGITAL DATA PROCESSING
- G06F11/00—Error detection; Error correction; Monitoring
- G06F11/30—Monitoring
- G06F11/34—Recording or statistical evaluation of computer activity, e.g. of down time, of input/output operation ; Recording or statistical evaluation of user activity, e.g. usability assessment
- G06F11/3452—Performance evaluation by statistical analysis
- H—ELECTRICITY
- H04—ELECTRIC COMMUNICATION TECHNIQUE
- H04L—TRANSMISSION OF DIGITAL INFORMATION, e.g. TELEGRAPHIC COMMUNICATION
- H04L43/00—Arrangements for monitoring or testing data switching networks
- H04L43/04—Processing captured monitoring data, e.g. for logfile generation
- H04L43/045—Processing captured monitoring data, e.g. for logfile generation for graphical visualisation of monitoring data
- G—PHYSICS
- G06—COMPUTING OR CALCULATING; COUNTING
- G06F—ELECTRIC DIGITAL DATA PROCESSING
- G06F11/00—Error detection; Error correction; Monitoring
- G06F11/30—Monitoring
- G06F11/3003—Monitoring arrangements specially adapted to the computing system or computing system component being monitored
- G06F11/3006—Monitoring arrangements specially adapted to the computing system or computing system component being monitored where the computing system is distributed, e.g. networked systems, clusters, multiprocessor systems
- G—PHYSICS
- G06—COMPUTING OR CALCULATING; COUNTING
- G06F—ELECTRIC DIGITAL DATA PROCESSING
- G06F11/00—Error detection; Error correction; Monitoring
- G06F11/30—Monitoring
- G06F11/3065—Monitoring arrangements determined by the means or processing involved in reporting the monitored data
- G06F11/3072—Monitoring arrangements determined by the means or processing involved in reporting the monitored data where the reporting involves data filtering, e.g. pattern matching, time or event triggered, adaptive or policy-based reporting
- G06F11/3082—Monitoring arrangements determined by the means or processing involved in reporting the monitored data where the reporting involves data filtering, e.g. pattern matching, time or event triggered, adaptive or policy-based reporting the data filtering being achieved by aggregating or compressing the monitored data
- H—ELECTRICITY
- H04—ELECTRIC COMMUNICATION TECHNIQUE
- H04L—TRANSMISSION OF DIGITAL INFORMATION, e.g. TELEGRAPHIC COMMUNICATION
- H04L41/00—Arrangements for maintenance, administration or management of data switching networks, e.g. of packet switching networks
- H04L41/22—Arrangements for maintenance, administration or management of data switching networks, e.g. of packet switching networks comprising specially adapted graphical user interfaces [GUI]
- H—ELECTRICITY
- H04—ELECTRIC COMMUNICATION TECHNIQUE
- H04L—TRANSMISSION OF DIGITAL INFORMATION, e.g. TELEGRAPHIC COMMUNICATION
- H04L43/00—Arrangements for monitoring or testing data switching networks
- H04L43/06—Generation of reports
- H04L43/065—Generation of reports related to network devices
- H—ELECTRICITY
- H04—ELECTRIC COMMUNICATION TECHNIQUE
- H04L—TRANSMISSION OF DIGITAL INFORMATION, e.g. TELEGRAPHIC COMMUNICATION
- H04L43/00—Arrangements for monitoring or testing data switching networks
- H04L43/08—Monitoring or testing based on specific metrics, e.g. QoS, energy consumption or environmental parameters
- H04L43/0852—Delays
- H—ELECTRICITY
- H04—ELECTRIC COMMUNICATION TECHNIQUE
- H04L—TRANSMISSION OF DIGITAL INFORMATION, e.g. TELEGRAPHIC COMMUNICATION
- H04L43/00—Arrangements for monitoring or testing data switching networks
- H04L43/08—Monitoring or testing based on specific metrics, e.g. QoS, energy consumption or environmental parameters
- H04L43/0876—Network utilisation, e.g. volume of load or congestion level
- H04L43/0894—Packet rate
- H—ELECTRICITY
- H04—ELECTRIC COMMUNICATION TECHNIQUE
- H04L—TRANSMISSION OF DIGITAL INFORMATION, e.g. TELEGRAPHIC COMMUNICATION
- H04L43/00—Arrangements for monitoring or testing data switching networks
- H04L43/10—Active monitoring, e.g. heartbeat, ping or trace-route
- H—ELECTRICITY
- H04—ELECTRIC COMMUNICATION TECHNIQUE
- H04L—TRANSMISSION OF DIGITAL INFORMATION, e.g. TELEGRAPHIC COMMUNICATION
- H04L47/00—Traffic control in data switching networks
- H04L47/70—Admission control; Resource allocation
- H04L47/82—Miscellaneous aspects
- H04L47/822—Collecting or measuring resource availability data
- H—ELECTRICITY
- H04—ELECTRIC COMMUNICATION TECHNIQUE
- H04L—TRANSMISSION OF DIGITAL INFORMATION, e.g. TELEGRAPHIC COMMUNICATION
- H04L63/00—Network architectures or network communication protocols for network security
- H04L63/14—Network architectures or network communication protocols for network security for detecting or protecting against malicious traffic
- H04L63/1408—Network architectures or network communication protocols for network security for detecting or protecting against malicious traffic by monitoring network traffic
- H04L63/1416—Event detection, e.g. attack signature detection
- H—ELECTRICITY
- H04—ELECTRIC COMMUNICATION TECHNIQUE
- H04L—TRANSMISSION OF DIGITAL INFORMATION, e.g. TELEGRAPHIC COMMUNICATION
- H04L63/00—Network architectures or network communication protocols for network security
- H04L63/14—Network architectures or network communication protocols for network security for detecting or protecting against malicious traffic
- H04L63/1408—Network architectures or network communication protocols for network security for detecting or protecting against malicious traffic by monitoring network traffic
- H04L63/1425—Traffic logging, e.g. anomaly detection
- H—ELECTRICITY
- H04—ELECTRIC COMMUNICATION TECHNIQUE
- H04L—TRANSMISSION OF DIGITAL INFORMATION, e.g. TELEGRAPHIC COMMUNICATION
- H04L63/00—Network architectures or network communication protocols for network security
- H04L63/20—Network architectures or network communication protocols for network security for managing network security; network security policies in general
- H—ELECTRICITY
- H04—ELECTRIC COMMUNICATION TECHNIQUE
- H04L—TRANSMISSION OF DIGITAL INFORMATION, e.g. TELEGRAPHIC COMMUNICATION
- H04L67/00—Network arrangements or protocols for supporting network services or applications
- H04L67/01—Protocols
- H04L67/10—Protocols in which an application is distributed across nodes in the network
- H04L67/1001—Protocols in which an application is distributed across nodes in the network for accessing one among a plurality of replicated servers
- G—PHYSICS
- G06—COMPUTING OR CALCULATING; COUNTING
- G06F—ELECTRIC DIGITAL DATA PROCESSING
- G06F11/00—Error detection; Error correction; Monitoring
- G06F11/30—Monitoring
- G06F11/34—Recording or statistical evaluation of computer activity, e.g. of down time, of input/output operation ; Recording or statistical evaluation of user activity, e.g. usability assessment
- G06F11/3409—Recording or statistical evaluation of computer activity, e.g. of down time, of input/output operation ; Recording or statistical evaluation of user activity, e.g. usability assessment for performance assessment
- G06F11/3419—Recording or statistical evaluation of computer activity, e.g. of down time, of input/output operation ; Recording or statistical evaluation of user activity, e.g. usability assessment for performance assessment by assessing time
- G—PHYSICS
- G06—COMPUTING OR CALCULATING; COUNTING
- G06F—ELECTRIC DIGITAL DATA PROCESSING
- G06F11/00—Error detection; Error correction; Monitoring
- G06F11/30—Monitoring
- G06F11/34—Recording or statistical evaluation of computer activity, e.g. of down time, of input/output operation ; Recording or statistical evaluation of user activity, e.g. usability assessment
- G06F11/3466—Performance evaluation by tracing or monitoring
- G06F11/3495—Performance evaluation by tracing or monitoring for systems
- G—PHYSICS
- G06—COMPUTING OR CALCULATING; COUNTING
- G06F—ELECTRIC DIGITAL DATA PROCESSING
- G06F2201/00—Indexing scheme relating to error detection, to error correction, and to monitoring
- G06F2201/87—Monitoring of transactions
Definitions
- Metricsare used by computer systems to quantify the measurement of system performance. Metrics are critical for analyzing systems' operations and providing feedback for improvements. In modem computer systems, the quantity of metrics can be large. For example, suppose that a single cloud application collects 1000 metrics for analysis every 5 seconds, which means that 720,000 metrics are collected every hour. In a typical high scale environment such as an enterprise data center that supports thousands of applications each executing on multiple servers, the rate can be on the order of billions of metrics per hour.
- US9697316B1concerns efficient data aggregation with a sparse exponential histogram, wherein, in response to receiving performance data, a performance data aggregator may parse the performance data for one of one or more performance metrics and one or more dimensions, and a sparse exponential histogram generator may create a sparse exponential histogram with the parsed performance data and may transmit or store the sparse exponential histogram representation for subsequent analysis.
- a performance data aggregatormay parse the performance data for one of one or more performance metrics and one or more dimensions
- a sparse exponential histogram generatormay create a sparse exponential histogram with the parsed performance data and may transmit or store the sparse exponential histogram representation for subsequent analysis.
- US2014006862A1concerns middlebox reliability
- US2010279622A1concerns real-time performance and load statistics of a communications system.
- the following descriptionconcerns a method for collecting metric values relating to operations of a set of one or more resources executing on host computers in a datacenter.
- the set of resourcesincludes a set of one or more applications (e.g., a cluster of webservers, application servers or database servers) for which a middlebox service is performed on the host computers, and the metric is the latency experienced by packets processed by the application set.
- applicationse.g., a cluster of webservers, application servers or database servers
- the methodhierarchically collects and analyzes samples, with a first set of samples collected and analyzed in the data plane, and a second set of samples collected and analyzed in the control plane by aggregating the samples collected in the data plane.
- the data planeincludes host computers on which sample collecting engines (e.g., service engines) execute, while the control plane includes a set of one or more servers that obtains sample data collected by the host computers, and aggregates and analyzes this data.
- the methodrepeatedly identifies different sample values for a particular operational metric.
- the methodis performed by a service engine that executes on the particular host computer and identifies different latencies experienced by different packets forwarded by the service engine to an application cluster.
- the service enginee.g., service virtual machine or container
- the service engineis a load balancer, while in other embodiments it is another type of middlebox service engine, such as a firewall engine, an intrusion detecting engine, an intrusion prevention engine, and a network address translating engine, etc.
- the methodidentifies a first set of sample metric values, and generates an individual-value (IV) first histogram that specifies the number of samples that the method has processed for each of several metric values. Based on the IV first histogram, the method specifies several metric value ranges (i.e., several bins) for a sample-value range (SVR) second histogram.
- the methodidentifies a second set of sample values, and generates the SVR second histogram to specify a number of samples that the method has processed for each range in a group of the specified ranges in the second histogram.
- the methodthen provides the SVR second histogram to a server to analyze in order to assess the operations of the set of resources in the datacenter.
- the methodprovides the SVR second histogram to a set of one or more servers to aggregate with SVR second histograms generated by several other host computers for the particular operational metric.
- the server setthen stores the aggregated histogram in a data storage (e.g., in a database), which can be accessed by network administrator to obtain information regarding the collected operational metric.
- the server setprovides this data in form of a graphical display of the aggregated histogram, or provides this information in a tabular or text form, e.g., provide latency values for 50%, 90% and 99% of the processed packets.
- the methodgenerates another SVR histogram before generating the SVR second histogram.
- the SVR second histogramin some embodiments has variable-sized bins (i.e., variable-sized ranges, also called variable-sized buckets).
- the methodin some embodiments generates an SVR third histogram with fixed-sized bins (i.e., with fixed-sized ranges/buckets) from the IV first histogram, and uses this fixed-sized bin SVR histogram to identify (1) the metric values around which the bin sizes of the variable SVR histogram should be defined, and (2) the sizes of these variable bins.
- the methodsuitably generates fixed-sized bins about the metric values identified along the first histogram.
- the IV first histogramdoes not have sample values for the full range of possible values that the method might process.
- the methodin some embodiments selects the fixed-sizes of the third-histogram bins to evenly cover the expected range of sample values.
- the methoddefines an SVR second histogram from the IV first histogram, instead of generating a fixed-sized bin histogram from the IV first histogram.
- the methoddefines for the SVR second histogram (1) one bin based on the bottom W% (e.g., 25%) of samples of the IV first histogram, (2) a few bins (e.g., 4 or 5 bins) for the next X% (e.g., next 25%) of samples of the IV first histogram, (3) a larger number of bins (e.g., 5 to 10 bins) for the next Y% (e.g., next 40%) of samples of the IV first histogram, and (4) another number of bins (e.g., 5 bins) for the last Z% (e.g., last 10%) of samples of the IV first histogram.
- the methodBased on the next set of samples that it processes, the method then generates the SVR second histogram, and then uses this histogram to define the bins for the SVR third histogram.
- This approachhas the advantage of preventing the method from creating too many bins for its second histogram based on outlier sample values identified in the first histogram.
- the methodAfter specifying the locations and sizes of the bins for the SVR third histogram, the method then (1) identifies a third set of sample values in a third time period that is between the first and second time periods during which the method identifies the first and second histograms, and (2) generates the SVR third histogram to specify a number of samples that the method has processed for each of the fixed-sized bins of the third histogram. After generating the SVR third histogram, the method then specifies the locations of the bins and the sizes of the bins for the SVR second histogram from the SVR third histogram.
- the methodin some embodiments (1) defines nine buckets for the SVR second histogram, (2) assigns the first bucket to center at 20 ms with a width of 20 ms, (3) assigns the next three buckets of the SVR second histogram to center respectively at 45, 55, and 65 ms, each with a width of 10 ms, and (4) assigns the last five buckets of the SVR second histogram to center respectively at 71, 73, 75, 77 and 79 ms, each with a width of 2 ms.
- This approachis optimized to identify the maximum latency values experienced by 50%, 90% and 99% of the samples, as it creates the first bucket to encompass the bottom 50% of sample value range that it identified in the SVR third histogram, creates three buckets for the next 40% of the expected sample value range, and then creates five buckets for the last 10% of the expected sample value range.
- the position and sizes of these bins in the SVR second histogramwere driven by the content of the SVR third histogram, which has its bins determined by the content of the IV first histogram, as mentioned above.
- the method of some embodimentsiteratively performs a range-modification process to modify the locations and/or sizes of the bins of the SVR second histogram. For instance, after providing the SVR second histogram to the server set, the method of some embodiments modifies at least two ranges (bins) specified for the SVR second histogram based on the number of sample values that the generated SVR second histogram specifies for its bins, and generates a new SVR second histogram for the next batch of samples that it processes based on these modified bins.
- a range-modification processto modify the locations and/or sizes of the bins of the SVR second histogram. For instance, after providing the SVR second histogram to the server set, the method of some embodiments modifies at least two ranges (bins) specified for the SVR second histogram based on the number of sample values that the generated SVR second histogram specifies for its bins, and generates a new SVR second histogram for the next batch of samples that it processes
- the inventioncan be implemented in numerous ways, including as a process; an apparatus; a system; a composition of matter; a computer program product embodied on a computer readable storage medium; and/or a processor, such as a processor configured to execute instructions stored on and/or provided by a memory coupled to the processor.
- these implementations, or any other form that the invention may take,may be referred to as techniques.
- a componentsuch as a processor or a memory described as being configured to perform a task may be implemented as a general component that is temporarily configured to perform the task at a given time or a specific component that is manufactured to perform the task.
- the term 'processor'refers to one or more devices, circuits, and/or processing cores configured to process data, such as computer program instructions.
- Metricsare used by computer systems to quantify the measurement of system performance. Metrics are critical for analyzing systems' operations and providing feedback for improvements. In modern computer systems, the quantity of metrics can be large. For example, suppose that a single cloud application collects 1000 metrics for analysis every 5 seconds, which means that 720,000 metrics are collected every hour. In a typical high scale environment such as an enterprise data center that supports thousands of applications each executing on multiple servers, the rate can be on the order of billions of metrics per hour. Analysis of metrics is further complicated by the distributed nature of some systems. In the distributed networks, each subsystem may only handle a small portion of the tasks in the network. Thus, each subsystem may only provide metrics data for a limited portion of the activities for the network.
- a method and system for characterizing performance for a distributed systemare described.
- the methodincludes obtaining a plurality of sets of performance metrics from a plurality of sources in the distributed network.
- Statistical summariesare generated for the sets of performance metrics.
- a system-level statistical description of distributed network's performanceis provided using the statistical summaries.
- FIG. 1is a functional diagram illustrating a programmed computer system for managing metrics in accordance with some embodiments.
- Computer system 100which includes various subsystems as described below, includes at least one microprocessor subsystem (also referred to as a processor or a central processing unit (CPU)) 102.
- processor 102can be implemented by a single-chip processor or by multiple processors.
- processor 102is a general purpose digital processor that controls the operation of the computer system 100. Using instructions retrieved from memory 110, the processor 102 controls the reception and manipulation of input data, and the output and display of data on output devices (e.g., display 118).
- processor 102includes and/or is used to provide server functions described below with respect to server 202, etc. of Figure 2 .
- Processor 102is coupled bi-directionally with memory 110, which can include a first primary storage, typically a random access memory (RAM), and a second primary storage area, typically a read-only memory (ROM).
- primary storagecan be used as a general storage area and as scratch-pad memory, and can also be used to store input data and processed data.
- Primary storagecan also store programming instructions and data, in the form of data objects and text objects, in addition to other data and instructions for processes operating on processor 102.
- primary storagetypically includes basic operating instructions, program code, data, and objects used by the processor 102 to perform its functions (e.g., programmed instructions).
- memory 110can include any suitable computer-readable storage media, described below, depending on whether, for example, data access needs to be bi-directional or uni-directional.
- processor 102can also directly and very rapidly retrieve and store frequently needed data in a cache memory (not shown).
- a removable mass storage device 112provides additional data storage capacity for the computer system 100, and is coupled either bi-directionally (read/write) or uni-directionally (read only) to processor 102.
- storage 112can also include computer-readable media such as magnetic tape, flash memory, PC-CARDS, portable mass storage devices, holographic storage devices, and other storage devices.
- a fixed mass storage 120can also, for example, provide additional data storage capacity. The most common example of mass storage 120 is a hard disk drive.
- Mass storages 112, 120generally store additional programming instructions, data, and the like that typically are not in active use by the processor 102. It will be appreciated that the information retained within mass storages 112 and 120 can be incorporated, if needed, in standard fashion as part of memory 110 (e.g., RAM) as virtual memory.
- bus 114can also be used to provide access to other subsystems and devices. As shown, these can include a display monitor 118, a network interface 116, a keyboard 104, and a pointing device 106, as well as an auxiliary input/output device interface, a sound card, speakers, and other subsystems as needed.
- the pointing device 106can be a mouse, stylus, track ball, or tablet, and is useful for interacting with a graphical user interface.
- the network interface 116allows processor 102 to be coupled to another computer, computer network, or telecommunications network using a network connection as shown.
- the processor 102can receive information (e.g., data objects or program instructions) from another network or output information to another network in the course of performing method/process steps.
- Informationoften represented as a sequence of instructions to be executed on a processor, can be received from and outputted to another network.
- An interface card or similar device and appropriate software implemented by (e.g., executed/performed on) processor 102can be used to connect the computer system 100 to an external network and transfer data according to standard protocols.
- various process embodiments disclosed hereincan be executed on processor 102, or can be performed across a network such as the Internet, intranet networks, or local area networks, in conjunction with a remote processor that shares a portion of the processing.
- Additional mass storage devicescan also be connected to processor 102 through network interface 116.
- auxiliary I/O device interfacecan be used in conjunction with computer system 100.
- the auxiliary I/O device interfacecan include general and customized interfaces that allow the processor 102 to send and, more typically, receive data from other devices such as microphones, touch-sensitive displays, transducer card readers, tape readers, voice or handwriting recognizers, biometrics readers, cameras, portable mass storage devices, and other computers.
- various embodiments disclosed hereinfurther relate to computer storage products with a computer readable medium that includes program code for performing various computer-implemented operations.
- the computer-readable mediumis any data storage device that can store data which can thereafter be read by a computer system.
- Examples of computer-readable mediainclude, but are not limited to, all the media mentioned above: magnetic media such as hard disks, floppy disks, and magnetic tape; optical media such as CD-ROM disks; magneto-optical media such as optical disks; and specially configured hardware devices such as application-specific integrated circuits (ASICs), programmable logic devices (PLDs), and ROM and RAM devices.
- Examples of program codeinclude both machine code, as produced, for example, by a compiler, or files containing higher level code (e.g., script) that can be executed using an interpreter.
- the computer system shown in Figure 1is but an example of a computer system suitable for use with the various embodiments disclosed herein.
- Other computer systems suitable for such usecan include additional or fewer subsystems.
- bus 114is illustrative of any interconnection scheme serving to link the subsystems.
- Other computer architectures having different configurations of subsystemscan also be utilized.
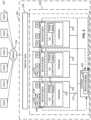
- FIG. 2is a block diagram illustrating an embodiment of a data center that includes a scalable distributed metrics manager and that may provide distributed network services.
- client devicessuch as 252 connect to a data center 250 via a network 254.
- a client devicecan be a laptop computer, a desktop computer, a tablet, a mobile device, a smart phone, a wearable networking device, or any other appropriate computing device.
- a web browser and/or a standalone client applicationis installed at each client, enabling a user to use the client device to access certain applications hosted by data center 250.
- Network 254can be the Internet, a private network, a hybrid network, or any other communications network.
- a networking layer 255comprising networking devices such as routers, switches, etc. forwards requests from client devices 252 to a distributed network service platform 203.
- distributed network service platform 203includes a number of servers configured to provide a distributed network service.
- a physical servere.g., 202, 204, 206, etc.
- hardwaree.g., 208 of the server supports operating system software in which a number of virtual machines (VMs) (e.g., 218, 219, 220, etc.) are configured to execute.
- VMsvirtual machines
- a VMis a software implementation of a machine (e.g., a computer) that simulates the way a physical machine executes programs.
- the part of the server's operating system that manages the VMsis referred to as the hypervisor.
- the hypervisorinterfaces between the physical hardware and the VMs, providing a layer of abstraction to the VMs. Through its management of the VMs' sharing of the physical hardware resources, the hypervisor makes it appear as though each VM were running on its own dedicated hardware. Examples of hypervisors include the VMware Workstation ® and Oracle VM VirtualBox ® .
- VM architectureAlthough physical servers supporting VM architecture are shown and discussed extensively for purposes of example, physical servers supporting other architectures such as container-based architecture (e.g., Kubernetes ® , Docker ® , Mesos ® ), standard operating systems, etc., can also be used and techniques described herein are also applicable.
- container-based architecturee.g., Kubernetes ® , Docker ® , Mesos ®
- standard operating systemsetc.
- the applicationsare executed in special containers rather than virtual machines.
- instances of applicationsare configured to execute within the VMs.
- Examples of such applicationsinclude web applications such as shopping cart, user authentication, credit card authentication, email, file sharing, virtual desktops, voice/video streaming, online collaboration, and many others.
- One or more service enginesare instantiated on a physical device.
- a service engineis implemented as software executing in a virtual machine.
- the service engineis executed to provide distributed network services for applications executing on the same physical server as the service engine, and/or for applications executing on different physical servers.
- the service engineis configured to enable appropriate service components that implement service logic. For example, a load balancer component is executed to provide load balancing logic to distribute traffic load amongst instances of applications executing on the local physical device as well as other physical devices; a firewall component is executed to provide firewall logic to instances of the applications on various devices; a metrics agent component is executed to gather metrics associated with traffic, performance, etc. associated with the instances of the applications, etc. Many other service components may be implemented and enabled as appropriate. When a specific service is desired, a corresponding service component is configured and invoked by the service engine to execute in a VM.
- traffic received on a physical port of a serveris sent to a virtual switch (e.g., 212).
- the virtual switchis configured to use an API provided by the hypervisor to intercept incoming traffic designated for the application(s) in an inline mode, and send the traffic to an appropriate service engine.
- inline modepackets are forwarded on without being replicated.
- the virtual switchpasses the traffic to a service engine in the distributed network service layer (e.g., the service engine on the same physical device), which transforms the packets if needed and redirects the packets to the appropriate application.
- the service enginebased on factors such as configured rules and operating conditions, redirects the traffic to an appropriate application executing in a VM on a server. Details of the virtual switch and its operations are outside the scope of the present application.
- Controller 290is configured to control, monitor, program, and/or provision the distributed network services and virtual machines.
- the controllerincludes a metrics manager 292 configured to collect performance metrics and perform analytical operations.
- the controllercan be implemented as software, hardware, firmware, or any combination thereof.
- the controlleris implemented on a system such as 100.
- the controlleris implemented as a single entity logically, but multiple instances of the controller are installed and executed on multiple physical devices to provide high availability and increased capacity.
- known techniquessuch as those used in distributed databases are applied to synchronize and maintain coherency of data among the controller instances.
- one or more controllers 290gather metrics data from various nodes operating in the data center.
- a noderefers to a computing element that is a source of metrics information. Examples of nodes include virtual machines, networking devices, service engines, or any other appropriate elements within the data center.
- metrics relating to the performance of the application and/or the VM executing the applicationcan be directly collected by the corresponding service engine.
- a service enginesends a script to a client browser or client application. The script measures client responses and returns one or more collected metrics back to the service engine. In both cases, the service engine sends the collected metrics to controller 290.
- infrastructure metrics relating to the performance of other components of the service platformcan be collected by the controller.
- metrics relating to the networking devices, metrics relating to the performance of the service engines themselves, metrics relating to the host devices such as data storage as well as operating system performance, etc.can be collected by the controller.
- Specific examples of the metricsinclude round trip time, latency, bandwidth, number of connections, etc.
- Figure 3is a flow chart illustrating an embodiment of a process for statistically characterizing the performance of a distributed network, such as a network employing the system 200.
- the process 300may be implemented using the service engines 214, 224 and/or the controller 290. Consequently, the method 300 is described in the context of the system 200. In other embodiments, other and/or additional components may be used to analyze performance of the distributed network.
- Performance metricsare obtained for the sources in the distributed network 200, in step 302.
- Step 302may include collecting performance data for clients, service engines, or other components in the system 200.
- the datamay be collected by the service engine itself, by a metrics agent, by a script sent by the service engine to another component or in another manner.
- each service engine(214, 224, etc.) may determine the latency for each transaction completed by through service engine over a particular time interval.
- Other metricssuch as client responses, connections, available storage or bandwidth might also be monitored via scripts sent to the client or other component.
- Components, such as one or more of the VMs (218, 219, 220...),may be configured to report selected performance metrics at regular intervals or in response to specific events.
- the metrics data obtained in step 302may be from components such as applications, VMs and/or clients that are spread out over multiple physical machines. Data related to such performance metrics are provided to the corresponding service engines.
- step 304Using the information obtained in step 302, statistical summaries are generated, via step 304.
- Generation of the statistical summaryincludes calculating a number of statistical values describing the performance metrics.
- a single statistical summarymay be provided for all performance metrics related to the source. In other embodiments, a separate statistical summary may be provided for each performance metric of each source. For example, a statistical summary may be provided for only transaction latencies for each service engine in step 304. Alternatively, a single statistical summary provided in step 304 may incorporate not only transaction latencies, but also other performance characteristics of the service engine or other component.
- the service engine(s) formay generate the statistical summaries in step 304.
- the statistical summaries provided in step 304statistically describes the performance of the service engine or other component(s).
- raw data for the performance metricsneed not be stored in a central storage device.
- the statistical summaryprovides an adequate description of the performance metric using the quantities calculated and stored in step 304.
- the statistical summarymay include one or more of the number of data points for the performance metric, a mean value, a standard of deviation, a variance, a confidence interval, a minimum value, a maximum value and/or other statistical quantities of interest.
- the statistical summary for the latencies of transactions managed by a service enginemay include one or more of the number of transactions completed in the time interval, the mean latency, the standard of deviation in the latency, the variance in the latency, the confidence interval for the latency, the minimum latency for the interval and the maximum latency for the interval.
- the confidence indicatoris a measure of the values for a certain percentage of the sample space.
- the confidence indicatormay be the range of latencies for ninety percent of the transactions occurring during the interval.
- the confidence intervalmay thus be represented by a range of values up to the ninetieth percentile of the sample space and the number of values within that percentile.
- the confidence intervalmay be one second (the range of latencies for the ninetieth percentile) and the one hundred and eighty (the ninety percent of the transactions). In alternate embodiments, other and/or additional quantities might be included in the statistical summary.
- Step 306may be carried out by the controller 290.
- the service enginesmay provide their statistical summaries to the controller 290, which combines the summaries in a manner that preserves the statistical information in the summaries and generalizes the information to the entire network (or predefined portion thereof).
- the metrics manager 292carries out this function.
- step 306may be performed by other/additional component(s).
- the system-level statistical descriptionstatistically characterizes the performance of the entire distributed network (or subset of the distributed network including multiple service engines) in a probabilistic fashion.
- the system-level statistical descriptionmay include a total number of data points for the performance metric, a system-level mean value, a system-level standard of deviation, a system-level variance, a system-level confidence interval, a system-level minimum value and a system-level maximum value.
- the system-level statistical descriptionmay include the total number of transactions in the distributed network completed over the interval, the system-level mean latency, the system-level standard of deviation in latency, the system-level variance in latency, a system-level confidence interval for latency, a system-level minimum latency and a system-level maximum latency.
- the aggregation in step 306may be carried out in a number of manners that are consistent with statistical/probability rubrics.
- a weighted sum of each of the statistical quantities in the statistical summaries for each metricis calculated.
- the mean value, standard of deviation, variance, confidence interval, minimum value and maximum valuemay be weighted by a measure of the number of transactions for the service engine over the corresponding time interval.
- the quantities abovemay be weighted by the number of transactions for the service engine or by the fraction of the total number of transactions that are completed for the service engine.
- Other mechanisms for weighting and/or integrating the values in each summary that are statistically validmay be used. Consequently, the system-level values are based on the values in each statistical summary but account for the fraction of the sample space represented by the summary.
- the system-level performance of a distributed networkis determined using statistical summaries of the individual service engines. Consequently, the system-level statistical description may be rapidly obtained, without requiring raw data for the performance metrics to be transferred to a mass storage device or other component, stored and/or analyzed in bulk. Instead, the system-level statistical description may be used. Further, other quantities of interest may be calculated using the system-level statistical description. Real time or quasi-real time performance may be determined and adjustments to system operation may be made.
- Figure 4is a flow chart illustrating an embodiment of a method 400 for statistically characterizing the transaction latency of a distributed network, such as one utilizing the system 200.
- the process 400may be implemented using service engines and controller such as the service engines 214, 224 and the controller 290. Consequently, the method 400 is described in the context of the system 200. In other embodiments, other and/or additional components may be used to analyze performance of the distributed network.
- the method 400is also described in the context of transaction latency as the performance metric being analyzed. However, the method 400 may be applied to other performance metrics.
- Step 402may include each service engine determining the latencies for transactions completed for the service engine over a specific time period. As discussed above, metrics agents, scripts or other data collection mechanisms might also be used.
- the latenciesare organized into buckets based on latency value, at step 404.
- Each bucketcorresponds to a certain percentile for latency. For example, if ten buckets are used, each bucket may correspond to ten percentiles.
- bucket 1may be for transactions having the lowest latencies from zero through the tenth percentile
- bucket 2may be for transactions having the next lowest latencies greater than the tenth percentile and not more than the twentieth percentile, and so on.
- another number of bucketsmay be used.
- each service enginemight organize latencies into twenty buckets, with each bucket corresponding to five percentiles. All service engines may use the same number of buckets. In alternate embodiments, different service engines may use a different number of buckets. Because the latencies are stored in buckets based on each latency's value, buckets generally include data for a different number of transactions.
- the desired statisticsare calculated for each bucket in each service engine, at step 406.
- the statistics calculated for each bucketmay include the number of transactions in the bucket, a mean value of the latencies in the bucket, a standard of deviation in the latencies for the bucket, a variance in latency for the bucket during the interval, a confidence interval for the bucket's latencies, a minimum latency for the bucket over the interval, and a maximum latency for the bucket during the interval.
- the statistics calculated for all of the buckets for the service enginemay be considered to be the statistical summary for the service engine.
- steps 404 and 406may correspond to step 304 of the method 300 (determining the statistical summary for the service engine).
- the statistical summaries for each service engineare provided to the controller, via step 408. Thus, the statistics for the buckets of the service engine are transmitted to the controller. Because statistical analysis has already been carried out for the data collected in step 402 for each service engine, raw data need not be transmitted from the service engines to the controller.
- the buckets for the service enginesare combined by the controller 290 in a manner consistent with statistical guidelines, thereby providing system-level buckets, via step 410.
- the controller 290thus generates the system-level statistical description for the distributed network.
- the controllermay hierarchically combine the buckets by merging buckets two buckets at each level until the number of buckets for all the service engines have been combined into the desired number of system-level buckets. Merging the buckets may include providing a weighted sum of the values in each bucket. Other statistically acceptable methods may also be used.
- the number of system-level bucketsis the same as the number of buckets for each service engine.
- the combining in step 410is performed so that each system-level bucket includes statistics for system-wide transactions that are in the appropriate percentile.
- system-level bucket 1may be for all transactions in the network having the lowest latencies from zero through the tenth percentile
- system-level bucket 2may be for all transactions in the network having the next lowest latencies greater than the tenth percentile and not exceeding the twentieth percentile
- each system-level bucketmay include a total number of transactions for that bucket's percentile range, a system-level mean latency for that percentile range, a system-level latency standard of deviation for that percentile range, a system-level variance in latency for that percentile range, a system-level confidence interval for that percentile range, a system-level minimum latency for that percentile range and a system-level maximum latency for that percentile range.
- the combination of the statistics in the system-level bucketsmay be considered to form the system-level statistical description for the latency.
- the merging of buckets in step 410may be carried out in a number of manners.
- a weighted sum of each of the statistical quantities for each bucket being combinedis calculated.
- the merged meanmay be determined by multiplying the mean of the first bucket by the number of transactions for the first bucket, adding the mean of the second bucket by the number of transactions for the second bucket and dividing the quantity by the sum of the transactions in the first and second buckets.
- the transactions serviced by each service engine and the total number of transactions for the systemmay be used in step 410.
- the merging of buckets in step 410may take into account the range of values in each bucket. In some cases, the ranges of values in different service engines do not overlap.
- the merging in step 410may be simplified.
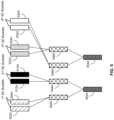
- Figure 5depicts the merging of buckets for four service engines having ranges that do not overlap and which have a similar number of transactions.
- Service engine 1(1 st SE) has buckets 502A and 504A.
- Service engine 2(2 nd SE) has two buckets 512A and 514A.
- the 3 rd SEhas buckets 522A and 524A.
- the 4 th SEhas buckets 532A and 534A.
- each bucket (502A, 504A, 512A, 7)describes fifty percent of the transactions serviced by the corresponding service engine.
- the 1 st SEhas the lowest latencies
- the 2 nd SEhas the next lowest latencies
- the 4 th SEhas the next to highest latencies
- the 3 rd SEhas the highest latencies.
- the buckets for each service engineare merely combined, for example via a weighted sum.
- Buckets 512A and 514Aare combined to bucket 544A.
- Buckets 522A and 524A and buckets 532 and 534Aare combined to buckets 548A and 546A, respectively.
- the service enginesprocess approximately the same number of transactions.
- buckets 502A through 534Amight be combined in another manner.
- the buckets 542A, 544A, 546A and 548Aare merged to system-level buckets 552A and 554A.
- Figure 6depicts an exemplary embodiment of a situation in which the service engines have latencies in ranges that overlap and which have a similar number of transactions.
- the 1 st SEhas buckets 502B and 504B;
- the 2 nd SEhas buckets 512B and 514B;
- the 3 rd SEhas buckets 522B and 524B;
- the 4 th SEhas buckets 532B and 534B.
- buckets 402B and 522Bare combined into bucket 542B, for example using a weighted sum.
- Buckets 504B and 512Bare combined into bucket 544B.
- Buckets 514B and 532Bare merged into bucket 546B. Buckets 524B and 534B are merged to buckets 548B. Similarly, buckets 542B and 546B are merged into system-level bucket 552B. Similarly, buckets 544B and 548B are merged into system-level bucket 554B. Although representing data for a larger fraction of the system, buckets 542B, 544B, 546B, 548B, 552B and 554B need not contain a larger amount of data. This is because the data contained in each bucket is a statistical summary of the transaction s to which they describe. In addition, in this combination, the service engines process approximately the same number of transactions. If, however, the number of transactions varied sufficiently between service engines, the buckets 502B through 534B might be combined in another manner.
- the system-level performance of a distributed networkis determined using statistical summaries of the individual service engines. Consequently, the system-level statistical description may be rapidly obtained, without requiring raw data for the performance metrics to be stored and analyzed in bulk. Using the statistical description, other quantities of interest may be calculated. Further, real time or quasi-real time performance may be determined and adjustments to system operation may be made.
- Some embodiments of the inventionprovide a method for collecting metric values relating to operations of a set of one or more resources executing on host computers in a datacenter.
- the set of resourcesincludes a set of one or more applications (e.g., a cluster of webservers, application servers or database servers) for which a middlebox service is performed on the host computers, and the metric is the latency experienced by packets processed by the application set.
- the methodhierarchically collects and analyzes samples, with a first set of samples collected and analyzed in the data plane, and a second set of samples collected and analyzed in the control plane by aggregating the samples collected in the data plane.
- the data planeincludes host computers on which sample collecting engines (e.g., service engines) execute, while the control plane includes a set of one or more servers that obtains sample data collected by the host computers, and aggregates and analyzes this data.
- the methodin some embodiments repeatedly identifies different sample values for a particular operational metric.
- the methodidentifies a first set of sample metric values and generates an individual-value (IV) first histogram that specifies the number of samples that the method has processed for each of several metric values. Based on the IV first histogram, the method specifies several bins (i.e., metric value ranges) for a sample-value range (SVR) second histogram.
- IVindividual-value
- the methodidentifies a second set of sample values, and generates the SVR second histogram to specify a number of samples that the method has processed for each range in a group of the specified ranges in the second histogram.
- the methodthen provides the SVR second histogram to a server to analyze in order to assess the operations of the set of resources in the datacenter. For instance, in some embodiments, the method provides the SVR second histogram to a set of one or more servers to aggregate with SVR second histograms generated by several other host computers for the particular operational metric.
- Figure 7illustrates a process 700 that implements the metric-value collection method of some embodiments.
- this process 700generates two SVR histograms, a first SVR histogram with fixed-sized bins that the process identifies based on an initial IV histogram, and a second SVR histogram with variable-sized bins that the process identifies based on the first SVR histogram.
- the process 700iteratively reports the variable-sized bin histogram to a set of servers, then generates and reports new variable-sized bin histograms, and with each generation of this histogram, it might modify the locations and/or sizes of bins to match the metric samples collected for the previous generation of its histogram.
- the process 700is performed by a service engine that executes on the particular host computer and identifies different metric values for different packets on which the service engine performs a middlebox service.
- This process 700will be described by reference to the example illustrated in Figure 8 , which presents several load balancing engines 805 executing as service virtual machines (SVMs) on several host computers 810 that distribute the packet-processing load across several server applications 815 in a server application cluster 820 that execute on the host computers in a datacenter.
- SVMsservice virtual machines
- the packets that the load balancers distribute among the server applications 815 of the application cluster 820are from other client applications that run in the same datacenter.
- the client and server applications 815operate as guest virtual machines (GVMs) that execute on the host computers 810.
- GVMsguest virtual machines
- the load balancers 805 and the applicationsare implemented differently, e.g., are implemented as containers, hypervisor service engines, etc.
- the host computers 810communicate with each other and with a set of controllers 875 through a network 860 of the datacenter.
- the load balancer 805athat executes on host computer 810a acts as the master load balancer for the application cluster 820.
- the load balancer 805aperforms the process 700 for the application cluster 820, by not only generating variable-sized bin histograms to summarize the latencies experienced by packets forwarded by this load balancer 805a from different clients 850 to the different applications 815 of the application cluster 820, but also by defining and updating the bin structure for these variable-sized bin histograms.
- the other load balancersalso perform part of the process 700 to define the variable-sized bin histograms for the packets that they forward to the application cluster, but these load balancers use the bin attributes (e.g., the bin locations and sizes) provided by the load balancer 805a for the histograms that they generate.
- these other load balancers executing on the other host computers 810perform the process 700 in its entirety for other application clusters 820.
- the approach of having one service engine (e.g., on load balancer) acting as a master service engine for defining the bin structure for all the service engines for a particular operational metric,is beneficial as it allows the variable-sized bin histograms that the service engines provide to a server set to aggregate to have the same bin structure (i.e., the same bins, at the same locations and with the same sizes) to simplify the aggregation of the provided histograms.
- Other embodimentsuse other techniques for defining the bin structure, including having the server set define the bin structure for the variable-sized bin histograms based on samples/histograms provided the service engines or based on sample values collected by the server set in previous settings or previous sample collection cycles.
- This process 700will also be described by reference to an example of a load-balancing process 900 of Figure 9 . While the load balancer 805a performs the process 700, all of the load balancers 805 (including the load balancer 805a) continuously perform the process 900 to distribute different packet flows among different server applications 815 in the server application cluster 820, and to identify and record latencies experienced by the packets in these flows.
- the process 900starts when the load balancer receives (at 905) a packet to forward to the application cluster.
- the process 900identifies (at 910) an application 815 in the cluster 820 that should process the packets of the received packet's flow.
- the process 900performs a load-balancing operation (e.g., by using weight values that direct a round robin selection operation) to select the application in the cluster 820 that should process the received packet's flow and stores the identity of the selected application for the packet's flow in a connection tracking storage.
- a load-balancing operatione.g., by using weight values that direct a round robin selection operation
- the process 900uses the record in the connection tracking storage to identify the application selected for the packet's flow (e.g., by matching the received packet's flow identifier with the flow identifier of a record in the connection tracker that specifies an application in the cluster for the flow specified by the flow identifier).
- the processforwards the packet to the identified application.
- the process 900identifies and stores a latency value for the packet if it needs to track such a value for the received packet.
- the load balancersstore latency values (i.e., store latency sample values) for all packets that they process, while in other embodiments the load balancers only store latency values for a subset of packet that they process as collecting such samples for all of the processed packets is too computationally and resource-consumption intensive.
- the load balancercomputes the latency value for the processed packet by interacting with the client 850 (i.e., the client application) that is the source of the processed packet to identify the round-trip time for the packet from when it leaves the client to when the client receives a responsive packet back from the application 815 that received the processed packet.
- the load balancercomputes the latency value differently, e.g., computes the time interval from when it received the packet to when it receives a responsive packet from the application 815.
- the process 700 of Figure 7is performed by a service engine in some embodiments.
- the process 700initially generates (at 705) an individual-value (IV) histogram for a first set of sample metric values (e.g., latency values) that the service engine processes during a first time period.
- the generated IV histogramspecifies the number of samples that the service engine has processed for each of several metric values.
- the process 700maintains a list of metric values that are stored by the values, and for each metric value on the list, maintains a number that represents the number of times that that service engine has identified that metric value during the first time interval for a processed packet.
- the process 700implements this list differently in different embodiments. For instance, in some embodiments, the process implements this list as a sorted linked list with each entry in the list storing a metric value and a sample count value, while in other embodiments it implements this list as a sorted array.
- the process 700has a different implementation of this list in other embodiments.
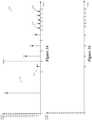
- Figure 10illustrates an example of a generated IV histogram 1000 for a sample of 100 latency values that a load balancer processes in some embodiments.
- the histogramis defined along an x-axis that represents individual latency values, and a y-axis that represents the number of samples.
- the histogramspecified the number of times that the latency value has been recorded for a packet by the load balancer.
- 50 sampleshave latencies below 0 to 50 milliseconds (ms), while another 50 samples have latencies between 51 to 100 ms.
- the process 700allocates a first amount of a memory of its host computer for the generated IV histogram.
- the processdetects that the generated IV histogram has consumed a second amount of the memory that is within a threshold size of the first amount, the process 700 transitions to 710 to define the bins for a fixed-sized bin histogram for a next batch of sample values that it should analyze.
- a sub-process of the process 700continues to generate the IV histogram while the bin are being defined for the fixed-sized bin histogram, while in other embodiments, the process 700 stops generating the IV histogram when it starts to define the bins for the fixed-sized bin histogram.
- the fixed-sized bin histogramincludes fixed-sized bins about the metric values identified along the IV histogram.
- the IV histogramdoes not have sample values for the full range of possible values that the method might process.
- the process 700in some embodiments selects the fixed-sizes of the bin histogram at 710 to evenly cover the expected range of sample values.
- Figure 11illustrates an example of the fixed-sized bins generated for the fixed-bin histogram at 710 in some embodiments.
- 54 binseach with a bin size of 2
- the last four binsare defined for latencies past 100 ms, even though the histogram 1000 did not identify any such latencies in order to have a cushion for identifying potentially larger latencies.
- Other embodimentsdo not generate such extra bins, or do not use as larger a sample-value cushion.
- the process 700After specifying the bin locations and sizes for the fixed-sized bin histogram, the process 700 generates (at 715) the fixed-sized bin histogram by processing another set of sample values in a second time period. This histogram specifies the number of samples that the process has analyzed for each of its fixed-sized bins. In some embodiments, the process 700 generates the fixed-sized bin histogram by stepping through the sample values, and for each sample value, identifying the histogram bin that corresponds to the sample value (i.e., the bin that specifies the value range that contains the processed sample value) and incrementing the sample count of the identified bin by one.
- Figure 12illustrates an example of the fixed-sized bin histogram 1200 that the process 700 generates at 715 in some embodiments.
- This histogramcorresponds to 1000 samples analyzed by the process 700.
- the median for the histogram 1200is 40 ms.
- the process 700generates (at 715) the fixed-sized bin histogram until it determines that it should transition to a variable-sized bin histogram.
- the processmakes this determination based on different criteria in different embodiments. For instance, in some embodiments, the process generates the fixed-sized bin histogram for only a certain number of samples, while in other embodiments, it generates this histogram for only a certain duration of time.
- the processuses (at 720) the fixed-sized bin histogram to identify the locations and sizes of the bins for variable-sized bin histogram.
- the process 700performs this operation 720 differently in different embodiments.
- the process 700in some embodiments allocates one bin of x-width for the bottom 50% sample values identified by the fixed-sized bin histogram, allocates N bins of y-width for the next 40% sample values identified by the fixed-sized bin histogram, and allocates M bins of z-width for the last 10% of sample values identified by the fixed-sized bin histogram, where N and M are integers and x is greater than y, which is greater than z.
- the process 700in some embodiments generates the variable-sized bins illustrated in Figure 13 . These bins are for a variable-sized bin histogram that the process 700 should next generate. Based on the fixed-bin histogram 1200, the process 700 (1) defines ten buckets for the variable-sized bin histogram, (2) assigns the first bucket to center at 20 ms with a width of 20 ms, (3) assigns the next four buckets of the variable-sized bin histogram to center respectively at 45, 55, 65, and 75 ms, each with a width of 10 ms, and (4) assigns the last five buckets of the variable-sized bin histogram to center respectively at 82, 86, 90, 94 and 98 ms, each with a width of 4 ms. In Figure 13 , these buckets are identified by their leftmost and rightmost values in order to simplify their illustration.
- This approachis optimized to identify the maximum latency values experienced by 50%, 90% and 99% of the samples, as it (1) creates the first bucket to capture the bottom 50% of expected sample value range based on what it previously processed for the fixed-value histogram, (2) creates four buckets for the next 40% of the expected sample value range, based on what it previously processed for the fixed-value histogram, and then (3) creates five buckets for the last 10% of the expected sample value range, based on what it previously processed for the fixed-value histogram.
- the process 700provides (at 725) the bin locations and sizes for this histogram to the other service engines on other host computers 810 so that they can start to generate their variable-sized bin histograms based on these bins.
- Figure 8depicts the load balancer 805a providing data regarding the variable-sized bins to the other load balancers 805 executing on other host computers 810. The operation of these other load balancers to generate their variable-sized bin histograms will be described below by reference to Figure 19 .
- the processgenerates (at 730) the variable-sized histogram by processing another set of sample values in a third time period.
- This histogramspecifies the number of samples that the process has analyzed for each of its bins.
- the process 700generates the variable-sized bin histogram by stepping through the sample values, and for each sample value, identifying the histogram bin that corresponds to the sample value (i.e., the bin that specifies the value range that contains the processed sample value) and incrementing the sample count of the identified bin by one.
- Figure 14illustrates an example of the variable-sized bin histogram 1400. That the process 700 generates at 730 in some embodiments.
- This histogramcorresponds to 1000 samples analyzed by the process 700.
- 450 of the samplesfall within the first bin 1405 of this histogram
- 50 samplesfall within the second bin 1410 of this histogram
- the remaining 500 samplesfall in the other seven buckets of the histogram.
- the latency medianhas shifted from 40 ms expressed by the fixed-bin sized histogram 1200 to 50 ms, as the 500 th sample is in the second bucket 1410.
- this histogramshows that the 90% and 99% latency values are 80 and 98 ms, as the 900 th and 990 th samples fall in the buckets 1415 and 1420 corresponding to these values.
- the process 700generates (at 730) the variable-sized bin histogram until it determines that it should report this histogram to the server set.
- the processmakes this determination based on different criteria in different embodiments. For instance, in some embodiments, the process generates the variable-sized bin histogram for only a certain number of samples, while in other embodiments, it generates this histogram for only a certain duration of time.
- the processtransmits (at 735) this histogram through a network to a server to analyze in order to assess the operations of the set of resources in the datacenter.
- the load balancer 805aprovides the variable-sized histogram to a set of one or more controllers 875.
- the controller set 875aggregates this histogram with variable-sized bin histograms generated by other load balancers 805 executing on other host computers 810 for the latencies identified for packets forwarded to the application cluster 820.
- Figure 15illustrates an example of how the load balancers report their variable-sized bin histograms in some embodiments.
- a load balancerin some embodiments reports its histogram as a table with multiple records representing multiple bins.
- Each bin's recordhas a latency value that expresses the maximum latency associated with the bin, with the minimum being the maximum latency value of the previous bin, or 0 in case of the first bin.
- Each bin's recordalso has a sample count that identifies the number of processed samples that fell into the bin.
- the load balancersreport their histograms differently.
- Other embodimentsuse other schemes for specifying the bin structure. For instance, some embodiments define each bin in terms of its midpoint and its width. In some of these embodiments, the bin's width is specified in terms of a percentage of error.
- process 700After sending (at 735) the variable-sized bin histogram to the server set, the process 700 performs (at 740) a bin-modification operation to determine whether it needs to modify the locations and/or sizes of the bins of the next variable-sized bin histogram, or whether it can use the same exact bins as the previous variable-sized bin histogram that it provided to the server set.
- process 700in some embodiments analyzes the sample counts expressed by the prior variable-sized bin histogram to determine whether the locations and sizes of the first bin, the last bins and the intermediate bins mirror the expressed sample counts, and if not, it modifies the locations and/or sizes of these bins.
- the processcreates the bins illustrated in Figure 16 for the next variable-sized bin histogram.
- the next variable-bin sized histogramhas (1) ten buckets, (2) the first bucket centering at 22.5 ms with a width of 22.5 ms, (3) the next four buckets centering respectively at 50, 60, 70, and 80 ms, each with a width of 10 ms, and (4) the last five buckets centering respectively at 86.5, 89.5, 92.5, 95.5 and 98.5 ms, each with a width of 3 ms.
- these bucketsare identified by their leftmost and rightmost values in order to simplify the illustration.
- the process 700provides the new bin structure for the next variable-sized histogram to other service engines if it changed the bin structure, or informs the service engines that it has not changed the bin structure.
- the processreturns to 730 to generate the next variable-sized bin histogram. The process loops through 730-740 until an external event (e.g., an instruction from a server, or the termination of its service engine's operation) causes the process 700 to shut down.
- an external evente.g., an instruction from a server, or the termination of its service engine's operation
- the process 700 of the master service enginedynamically creates its variable-sized bin histogram differently. For instance, after generating (at 705) its IV first histogram, this process defines (at 710) an SVR second histogram from the IV first histogram, instead of generating a fixed-sized bin histogram from the IV first histogram.
- Figure 17illustrates an example of how the process 700 defines for the SVR second histogram based on the generated IV first histogram.
- the SVR second histogram in Figure 17has (1) one bin based on the bottom 25% of samples of the IV first histogram, (2) four bins for the next 25% of samples of the IV first histogram, (3) seven bins for the next 40% of samples of the IV first histogram, and (4) another nine bins for the last 10% of samples of the IV first histogram.
- the methodthen processes the next 1000 samples to generate (at 715) the SVR second histogram, and uses this histogram to define (at 720) the bins for the SVR third histogram.
- Figure 18illustrates an example of the generated SVR second histogram 1800. As shown, this histogram shows the median to have moved from 50 ms to 42 ms. The approach illustrated in Figures 17 and 18 has the advantage of preventing the method from creating too many bins for its second histogram based on outlier sample values identified in the first histogram.
- Figure 19illustrates a process 1900 performed by another service engine that generates a variable-sized bin histogram based on bin size/location attributes that it receives from the process 700 of Figure 7 .
- This other service enginegenerates its variable-sized bin histogram to summarize metric values that this service engine collects for the particular operational metric as it performs services on packets that it receives.
- the process 1900does not generate the bin attributes for its variable-sized bin histogram by first generating the IV histogram followed by generating a fix-sized bin histogram for the samples that it collects.
- the service engine that performs the process 1900continues its collection of sample metric values, so that it can generate its variable-sized bin histogram with these values and other sample values that it collects after it starts to generate this histogram.
- the process 1900initially receives (at 1905) the bin size/location attributes from the process 700 of Figure 7 . Based on these received bin attributes, the process 1900 then generates (at 1910) a variable-sized histogram by processing a set of sample values that it identifies for the particular operational metric during a time period. This histogram specifies the number of samples that the process has analyzed for each of its bins. In some embodiments, the process 1900 generates the variable-sized bin histogram by stepping through the sample values, and for each sample value, identifying the histogram bin that corresponds to the sample value (i.e., the bin that specifies the value range that contains the processed sample value) and incrementing the sample count of the identified bin by one.
- the process 1900generates (at 1910) the variable-sized bin histogram until it determines that it should report this histogram to the server set.
- the processmakes this determination based on different criteria in different embodiments. For instance, in some embodiments, the process generates the variable-sized bin histogram for only a certain number of samples, while in other embodiments, it generates this histogram for only a certain duration of time.
- the processtransmits (at 1915) this histogram through a network to a server to analyze in order to assess the operations of the set of resources in the datacenter. For instance, when the process 1900 is performed by a load balancer 805 of Figure 8 , the load balancer forwards its histogram of the latencies that it identifies to the controller set 875, which then aggregates this histogram with variable-sized bin histograms generated by other load balancers 805 executing on other host computers 810 for the latencies identified for packets forwarded to the application cluster 820.
- the process 1900transitions to 1920, where it waits until it receives from the process 700 the bin attributes for the next variable-sized bin histogram that it should generate, or direction to use the previous bin attributes. Upon receiving (at 1920) this input from the process 700, the process 1900 transitions back to 1910 to generate its next variable-sized histogram for the next time period.
- the process 1900loops through its operations until an external event (e.g., an instruction from a server, or the termination of its service engine's operation) causes the process 1900 to shut down.
- an external evente.g., an instruction from a server, or the termination of its service engine's operation
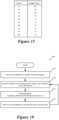
- Figure 20illustrates a process 2000 performed by a controller in some embodiments for a set of variable-sized bin histograms reported by a set of service engines for a particular operational metric.
- an operational metricis the latency experienced by packets forwarded to a cluster of applications by a set of load balancers.
- the controllerperforms the process 2000 iteratively (e.g., periodically). As shown, the process 2000 initially collects (at 2005) variable-sized bin histograms from several service engines. In some embodiments, the process 2000 directs the service engines to provide their histograms, while in other embodiments, the service engines provide their histograms to the controller at set intervals.
- some embodimentsuse one service engine as the master service engine that computes the bin attributes for the variable-sized histogram for all the service engines to use. In these embodiments, this ensures that the collected variable-sized histograms all have the same bin attributes, which simplifies the controller's aggregation of these histograms.
- the master service engineprovides its initial variable-sized histogram to the controller before the other service engines have had a chance to generate their variable-sized histograms.
- the controlleruses this provided histogram as an initial set of data for generating an initial report, while in other embodiments, the controller stores this set of data for later use with other reported histogram data from the master service engine and the other service engines.
- the master service enginegenerates its initial variable-sized bin histogram for a longer duration of time than the other service engines, so that master service engines and the other service engines can report their initial histograms at the same time to the controller.
- the process 2000aggregates the data (at 2010) to obtain a larger histogram for the operation of all the reporting service engines in the last time period.
- Figure 21illustrates a controller 875 summing the data of three reported histograms 2105, 2110 and 2115 to obtain an aggregate histogram 2120.
- the controllerin some embodiments simply adds the sample counts from all the corresponding bins in each histogram to produce the aggregate sample count for each bin in the aggregate histogram. This can be achieved because all of the reporting histograms have the same bin structure.
- the process 2000also combines the aggregate histogram that it generates with prior aggregate histograms in its previous iterations. To do this, the process 2000 in some embodiments uses a weighted sum approach that accounts for prior aggregate histograms but at a reduced weight than the current aggregate histogram. This weighted approach also accounts for the shifting of the bins over time.
- the controllerstores the aggregated histogram in a data storage (e.g., in a database), which can be accessed by network administrator to obtain information regarding the collected operational metric.
- a data storagee.g., in a database
- one or more serverscan access this data to provide graphical display of the aggregated histogram, or provide this information in a tabular or text form, e.g., provide latency values for 50%, 90% and 99% of the processed packets.
- These serversprovide access to this data through their user interface, e.g., a management portal, or through their application programming interface (API) calls.
- APIapplication programming interface
- the controller process 2000also analyzes (at 2020) its aggregate histogram as well as the different histograms reported by the different service engines, in order to perform certain actions.
- the aggregate histogram analyzed at 2020in some embodiments is the aggregate histogram that the process generates just for its current iteration based on the collected histograms in this iteration, while in other embodiments, the analyzed aggregate histogram is the histogram generated overall several iterations of the process 2000.
- the process' analysis of the different reported histogramsin some embodiments is limited to the current iteration of this process, while in other embodiments it accounts analysis of several reported histograms that each service engine reported overall several cycles of the operation of the process 2000.
- the process 2000in some embodiments provides (at 2025) the master service engine with some of this histogram data so that the master service engine can analyze this data to adjust its bin attributes (e.g., bin sizes and/or locations) if necessary.
- the process 2000in some embodiments directs (at 2030) all the service engines (including the master service engine) to use a new bin structure.
- the process 2000provides the new bin structure to all of the service engines when it detects that the bin structure defined by the master service engine is not suitable for the other service engines (e.g., is more than a threshold percentage off for the data collected by the other service engines). In other embodiments, the process 2000 does not perform either or both of the operations 2025 and 2030.
- Some embodimentsdo not have one service engine serve as the master service engine for defining the bin structure for the variable-sized bin histograms generated by all of the service engines, but instead use the controllers to define this bin structure.
- the controller clustercollects IV histograms or fixed-sized bin histograms from the service engines, and aggregates these histograms into an aggregate histogram. Based on this aggregate, the controller cluster generates the bin attributes for the variable-sized bin histograms, and distributes this bin structure to the service engines to use to generate their variable-sized bin histograms.
- the process 2000in some embodiments can also provide (at 2035) new configuration data to the host computers, in order to modify the operations of the service engines and/or application cluster to improve on one or more of the operational metrics, including the particular metric for which the histograms are generated by the service engines.
- the controller process 2000can deploy additional application instances (e.g., additional application VMs or containers) in the application cluster, and/or additional service engine (e.g., service VMs, etc.).
- additional application instancese.g., additional application VMs or containers
- additional service enginee.g., service VMs, etc.
- the new configuration datamight direct one or more host computers to allocate more resources (e.g., memory, processor cores, network bandwidth, etc.) to the application cluster and/or service engines.
- the new configuration datamight configure other elements in the datacenter, e.g., configure front end load balancers to distribute the flows differently to the different service engines.
- the controller process 2000does not perform one or more of the operations 2020-2035.
Landscapes
- Engineering & Computer Science (AREA)
- Computer Networks & Wireless Communication (AREA)
- Signal Processing (AREA)
- Computer Security & Cryptography (AREA)
- General Engineering & Computer Science (AREA)
- Computing Systems (AREA)
- Theoretical Computer Science (AREA)
- Computer Hardware Design (AREA)
- Physics & Mathematics (AREA)
- Quality & Reliability (AREA)
- General Physics & Mathematics (AREA)
- Data Mining & Analysis (AREA)
- Environmental & Geological Engineering (AREA)
- Human Computer Interaction (AREA)
- Health & Medical Sciences (AREA)
- Cardiology (AREA)
- General Health & Medical Sciences (AREA)
- Computer Vision & Pattern Recognition (AREA)
- Mathematical Physics (AREA)
- Life Sciences & Earth Sciences (AREA)
- Bioinformatics & Cheminformatics (AREA)
- Bioinformatics & Computational Biology (AREA)
- Evolutionary Biology (AREA)
- Probability & Statistics with Applications (AREA)
- Debugging And Monitoring (AREA)
Description
- Metrics (also referred to as performance metrics) are used by computer systems to quantify the measurement of system performance. Metrics are critical for analyzing systems' operations and providing feedback for improvements. In modem computer systems, the quantity of metrics can be large. For example, suppose that a single cloud application collects 1000 metrics for analysis every 5 seconds, which means that 720,000 metrics are collected every hour. In a typical high scale environment such as an enterprise data center that supports thousands of applications each executing on multiple servers, the rate can be on the order of billions of metrics per hour.
- Currently, most performance monitoring tools save collected metrics to a database, then perform analysis offline. These tools tend to scale poorly because of the high number of input/output (I/O) operations (such as database reads and writes) required for storing and processing a large number of metrics. Further, these tools typically do not support real time analytics due to the latency and processing overhead in storing and processing metrics data in the database.
- In the cited background art,
US9697316B1 US2014006862A1 concerns middlebox reliability, andUS2010279622A1 concerns real-time performance and load statistics of a communications system. - The present invention is defined according to the independent claims. Additional features will be appreciated from the dependent claims and the description herein.
- By way of introduction, the following description concerns a method for collecting metric values relating to operations of a set of one or more resources executing on host computers in a datacenter. Suitably, the set of resources includes a set of one or more applications (e.g., a cluster of webservers, application servers or database servers) for which a middlebox service is performed on the host computers, and the metric is the latency experienced by packets processed by the application set.
- Suitably, the method hierarchically collects and analyzes samples, with a first set of samples collected and analyzed in the data plane, and a second set of samples collected and analyzed in the control plane by aggregating the samples collected in the data plane. Suitably, the data plane includes host computers on which sample collecting engines (e.g., service engines) execute, while the control plane includes a set of one or more servers that obtains sample data collected by the host computers, and aggregates and analyzes this data.
- At a particular host computer, the method repeatedly identifies different sample values for a particular operational metric. For instance, the method is performed by a service engine that executes on the particular host computer and identifies different latencies experienced by different packets forwarded by the service engine to an application cluster. Suitably, the service engine (e.g., service virtual machine or container) is a load balancer, while in other embodiments it is another type of middlebox service engine, such as a firewall engine, an intrusion detecting engine, an intrusion prevention engine, and a network address translating engine, etc.
- During a first time period, the method identifies a first set of sample metric values, and generates an individual-value (IV) first histogram that specifies the number of samples that the method has processed for each of several metric values. Based on the IV first histogram, the method specifies several metric value ranges (i.e., several bins) for a sample-value range (SVR) second histogram. During a second time period, the method identifies a second set of sample values, and generates the SVR second histogram to specify a number of samples that the method has processed for each range in a group of the specified ranges in the second histogram.
- The method then provides the SVR second histogram to a server to analyze in order to assess the operations of the set of resources in the datacenter. Suitably, the method provides the SVR second histogram to a set of one or more servers to aggregate with SVR second histograms generated by several other host computers for the particular operational metric. The server set then stores the aggregated histogram in a data storage (e.g., in a database), which can be accessed by network administrator to obtain information regarding the collected operational metric. Suitably, the server set provides this data in form of a graphical display of the aggregated histogram, or provides this information in a tabular or text form, e.g., provide latency values for 50%, 90% and 99% of the processed packets.
- Suitably, the method generates another SVR histogram before generating the SVR second histogram. Suitably, the SVR second histogram in some embodiments has variable-sized bins (i.e., variable-sized ranges, also called variable-sized buckets). Before generating the SVR second histogram with variable-sized bins and providing this to the server, the method in some embodiments generates an SVR third histogram with fixed-sized bins (i.e., with fixed-sized ranges/buckets) from the IV first histogram, and uses this fixed-sized bin SVR histogram to identify (1) the metric values around which the bin sizes of the variable SVR histogram should be defined, and (2) the sizes of these variable bins.
- Specifically, for the fixed-sized bin SVR histogram, the method suitably generates fixed-sized bins about the metric values identified along the first histogram. In many cases, the IV first histogram does not have sample values for the full range of possible values that the method might process. To account for this while generating the SVR third histogram bins, the method in some embodiments selects the fixed-sizes of the third-histogram bins to evenly cover the expected range of sample values.
- In other embodiments, the method defines an SVR second histogram from the IV first histogram, instead of generating a fixed-sized bin histogram from the IV first histogram. In some of these embodiments, the method defines for the SVR second histogram (1) one bin based on the bottom W% (e.g., 25%) of samples of the IV first histogram, (2) a few bins (e.g., 4 or 5 bins) for the next X% (e.g., next 25%) of samples of the IV first histogram, (3) a larger number of bins (e.g., 5 to 10 bins) for the next Y% (e.g., next 40%) of samples of the IV first histogram, and (4) another number of bins (e.g., 5 bins) for the last Z% (e.g., last 10%) of samples of the IV first histogram. Based on the next set of samples that it processes, the method then generates the SVR second histogram, and then uses this histogram to define the bins for the SVR third histogram. This approach has the advantage of preventing the method from creating too many bins for its second histogram based on outlier sample values identified in the first histogram.
- After specifying the locations and sizes of the bins for the SVR third histogram, the method then (1) identifies a third set of sample values in a third time period that is between the first and second time periods during which the method identifies the first and second histograms, and (2) generates the SVR third histogram to specify a number of samples that the method has processed for each of the fixed-sized bins of the third histogram. After generating the SVR third histogram, the method then specifies the locations of the bins and the sizes of the bins for the SVR second histogram from the SVR third histogram.
- For instance, when the SVR third histogram has ten buckets with 500 samples corresponding to latencies below 0 to 40 milliseconds (ms), and another ten buckets for 500 samples corresponding to latencies from 40 to 80 ms, the method in some embodiments (1) defines nine buckets for the SVR second histogram, (2) assigns the first bucket to center at 20 ms with a width of 20 ms, (3) assigns the next three buckets of the SVR second histogram to center respectively at 45, 55, and 65 ms, each with a width of 10 ms, and (4) assigns the last five buckets of the SVR second histogram to center respectively at 71, 73, 75, 77 and 79 ms, each with a width of 2 ms.
- This approach is optimized to identify the maximum latency values experienced by 50%, 90% and 99% of the samples, as it creates the first bucket to encompass the
bottom 50% of sample value range that it identified in the SVR third histogram, creates three buckets for the next 40% of the expected sample value range, and then creates five buckets for the last 10% of the expected sample value range. The position and sizes of these bins in the SVR second histogram were driven by the content of the SVR third histogram, which has its bins determined by the content of the IV first histogram, as mentioned above. - In addition to generating the SVR second histogram, the method of some embodiments iteratively performs a range-modification process to modify the locations and/or sizes of the bins of the SVR second histogram. For instance, after providing the SVR second histogram to the server set, the method of some embodiments modifies at least two ranges (bins) specified for the SVR second histogram based on the number of sample values that the generated SVR second histogram specifies for its bins, and generates a new SVR second histogram for the next batch of samples that it processes based on these modified bins.
- The preceding Summary is intended to serve as a brief introduction to some embodiments of the invention. It is not meant to be an introduction or overview of all inventive subject matter disclosed in this document. The Detailed Description that follows and the Drawings that are referred to in the Detailed Description will further describe the embodiments described in the Summary as well as other embodiments. Accordingly, to understand all the embodiments described by this document, a full review of the Summary, the Detailed Description, the Drawings, and the Claims is needed. Moreover, the claimed subject matters are not to be limited by the illustrative details in the Summary, the Detailed Description, and the Drawings.
- The novel features of the invention are set forth in the appended claims. However, for purposes of explanation, several embodiments of the invention are set forth in the following figures.
Figure 1 is a functional diagram illustrating a programmed computer system for managing metrics in accordance with some embodiments.Figure 2 is a block diagram illustrating an embodiment of a data center that includes a scalable distributed metrics manager.Figure 3 is a flow chart illustrating an embodiment of a process for statistically characterizing the performance of a distributed network.Figure 4 is a flow chart illustrating an embodiment of a process for statistically characterizing transaction latency in a distributed network.Figure 5 is a block diagram depicting the merging of buckets in an exemplary embodiment of a distributed network.Figure 6 is a block diagram depicting the merging of buckets in an exemplary embodiment of a distributed network.Figure 7 illustrates a process that implements the metric-value collection method of some embodiments.Figure 8 presents several load balancing engines executing as service virtual machines (SVMs) on several host computers that distribute the packet-processing load across several server applications in a server application cluster that execute on the host computers in a datacenter.Figure 9 illustrates a load-balancing process of some embodiments.Figure 10 illustrates an example of a generated individual value histogram for a sample of latency values that a load balancer processes in some embodiments.Figure 11 illustrates an example of a fixed-sized bins generated for a fixed-bin histogram.Figure 12 illustrates an example of a fixed-sized bin histogram.Figure 13 illustrates an example of a variable-sized bins generated for a variable-bin histogram.Figure 14 illustrates an example of a variable-sized bin histogram.Figure 15 illustrates an example of how the load balancers report their variable-sized bin histograms in some embodiments.Figure 16 illustrates an example of modifying variable-sized bins for a variable-bin histogram.Figure 17 illustrates another example of a variable-sized bins generated for a variable-bin histogram.Figure 18 illustrates another example of a variable-sized bin histogramFigure 19 illustrates a process performed by another service engine that generates a variable-sized bin histogram based on bin size/location attributes that it receives from a master service engine.Figure 20 illustrates a process performed by a controller in some embodiments for a set of variable-sized bin histograms reported by a set of service engines for a particular operational metric.Figure 21 illustrates a controller summing the data of three reported histograms to obtain an aggregate histogram.- The invention can be implemented in numerous ways, including as a process; an apparatus; a system; a composition of matter; a computer program product embodied on a computer readable storage medium; and/or a processor, such as a processor configured to execute instructions stored on and/or provided by a memory coupled to the processor. In this specification, these implementations, or any other form that the invention may take, may be referred to as techniques. Unless stated otherwise, a component such as a processor or a memory described as being configured to perform a task may be implemented as a general component that is temporarily configured to perform the task at a given time or a specific component that is manufactured to perform the task. As used herein, the term 'processor' refers to one or more devices, circuits, and/or processing cores configured to process data, such as computer program instructions.
- Numerous specific details are set forth in the following description in order to provide a thorough understanding for the purpose of example. For the purpose of clarity, technical material that is known in the technical fields related to the invention has not been described in detail so that the invention is not unnecessarily obscured.
- Metrics (also referred to as performance metrics) are used by computer systems to quantify the measurement of system performance. Metrics are critical for analyzing systems' operations and providing feedback for improvements. In modern computer systems, the quantity of metrics can be large. For example, suppose that a single cloud application collects 1000 metrics for analysis every 5 seconds, which means that 720,000 metrics are collected every hour. In a typical high scale environment such as an enterprise data center that supports thousands of applications each executing on multiple servers, the rate can be on the order of billions of metrics per hour. Analysis of metrics is further complicated by the distributed nature of some systems. In the distributed networks, each subsystem may only handle a small portion of the tasks in the network. Thus, each subsystem may only provide metrics data for a limited portion of the activities for the network.
- Currently, most performance monitoring tools save collected metrics to a database, then perform analysis offline. These tools tend to scale poorly because of the high number of input/output (I/O) operations (such as database reads and writes) required for storing and processing a large number of metrics. Further, these tools typically do not support real time analytics due to the latency and processing overhead in storing and processing metrics data in the database.
- A method and system for characterizing performance for a distributed system are described. The method includes obtaining a plurality of sets of performance metrics from a plurality of sources in the distributed network. Statistical summaries are generated for the sets of performance metrics. A system-level statistical description of distributed network's performance is provided using the statistical summaries.
Figure 1 is a functional diagram illustrating a programmed computer system for managing metrics in accordance with some embodiments. As will be apparent, other computer system architectures and configurations can be used to manage and process metrics.Computer system 100, which includes various subsystems as described below, includes at least one microprocessor subsystem (also referred to as a processor or a central processing unit (CPU)) 102. For example,processor 102 can be implemented by a single-chip processor or by multiple processors. In some embodiments,processor 102 is a general purpose digital processor that controls the operation of thecomputer system 100. Using instructions retrieved frommemory 110, theprocessor 102 controls the reception and manipulation of input data, and the output and display of data on output devices (e.g., display 118). In some embodiments,processor 102 includes and/or is used to provide server functions described below with respect toserver 202, etc. ofFigure 2 .Processor 102 is coupled bi-directionally withmemory 110, which can include a first primary storage, typically a random access memory (RAM), and a second primary storage area, typically a read-only memory (ROM). As is well known in the art, primary storage can be used as a general storage area and as scratch-pad memory, and can also be used to store input data and processed data. Primary storage can also store programming instructions and data, in the form of data objects and text objects, in addition to other data and instructions for processes operating onprocessor 102. Also as is well known in the art, primary storage typically includes basic operating instructions, program code, data, and objects used by theprocessor 102 to perform its functions (e.g., programmed instructions). For example,memory 110 can include any suitable computer-readable storage media, described below, depending on whether, for example, data access needs to be bi-directional or uni-directional. For example,processor 102 can also directly and very rapidly retrieve and store frequently needed data in a cache memory (not shown).- A removable
mass storage device 112 provides additional data storage capacity for thecomputer system 100, and is coupled either bi-directionally (read/write) or uni-directionally (read only) toprocessor 102. For example,storage 112 can also include computer-readable media such as magnetic tape, flash memory, PC-CARDS, portable mass storage devices, holographic storage devices, and other storage devices. A fixedmass storage 120 can also, for example, provide additional data storage capacity. The most common example ofmass storage 120 is a hard disk drive. Mass storages 112, 120 generally store additional programming instructions, data, and the like that typically are not in active use by theprocessor 102. It will be appreciated that the information retained withinmass storages - In addition to providing
processor 102 access to storage subsystems,bus 114 can also be used to provide access to other subsystems and devices. As shown, these can include adisplay monitor 118, anetwork interface 116, akeyboard 104, and apointing device 106, as well as an auxiliary input/output device interface, a sound card, speakers, and other subsystems as needed. For example, thepointing device 106 can be a mouse, stylus, track ball, or tablet, and is useful for interacting with a graphical user interface. - The
network interface 116 allowsprocessor 102 to be coupled to another computer, computer network, or telecommunications network using a network connection as shown. For example, through thenetwork interface 116, theprocessor 102 can receive information (e.g., data objects or program instructions) from another network or output information to another network in the course of performing method/process steps. Information, often represented as a sequence of instructions to be executed on a processor, can be received from and outputted to another network. An interface card or similar device and appropriate software implemented by (e.g., executed/performed on)processor 102 can be used to connect thecomputer system 100 to an external network and transfer data according to standard protocols. For example, various process embodiments disclosed herein can be executed onprocessor 102, or can be performed across a network such as the Internet, intranet networks, or local area networks, in conjunction with a remote processor that shares a portion of the processing. Additional mass storage devices (not shown) can also be connected toprocessor 102 throughnetwork interface 116. - An auxiliary I/O device interface (not shown) can be used in conjunction with
computer system 100. The auxiliary I/O device interface can include general and customized interfaces that allow theprocessor 102 to send and, more typically, receive data from other devices such as microphones, touch-sensitive displays, transducer card readers, tape readers, voice or handwriting recognizers, biometrics readers, cameras, portable mass storage devices, and other computers. - In addition, various embodiments disclosed herein further relate to computer storage products with a computer readable medium that includes program code for performing various computer-implemented operations. The computer-readable medium is any data storage device that can store data which can thereafter be read by a computer system. Examples of computer-readable media include, but are not limited to, all the media mentioned above: magnetic media such as hard disks, floppy disks, and magnetic tape; optical media such as CD-ROM disks; magneto-optical media such as optical disks; and specially configured hardware devices such as application-specific integrated circuits (ASICs), programmable logic devices (PLDs), and ROM and RAM devices. Examples of program code include both machine code, as produced, for example, by a compiler, or files containing higher level code (e.g., script) that can be executed using an interpreter.
- The computer system shown in
Figure 1 is but an example of a computer system suitable for use with the various embodiments disclosed herein. Other computer systems suitable for such use can include additional or fewer subsystems. In addition,bus 114 is illustrative of any interconnection scheme serving to link the subsystems. Other computer architectures having different configurations of subsystems can also be utilized. Figure 2 is a block diagram illustrating an embodiment of a data center that includes a scalable distributed metrics manager and that may provide distributed network services. In this example, client devices such as 252 connect to adata center 250 via anetwork 254. A client device can be a laptop computer, a desktop computer, a tablet, a mobile device, a smart phone, a wearable networking device, or any other appropriate computing device. In some embodiments, a web browser and/or a standalone client application is installed at each client, enabling a user to use the client device to access certain applications hosted bydata center 250.Network 254 can be the Internet, a private network, a hybrid network, or any other communications network.- In the example shown, a
networking layer 255 comprising networking devices such as routers, switches, etc. forwards requests fromclient devices 252 to a distributed network service platform 203. In this example, distributed network service platform 203 includes a number of servers configured to provide a distributed network service. A physical server (e.g., 202, 204, 206, etc.) has hardware components and software components, and may be implemented using a device such as 100. In this example, hardware (e.g., 208) of the server supports operating system software in which a number of virtual machines (VMs) (e.g., 218, 219, 220, etc.) are configured to execute. A VM is a software implementation of a machine (e.g., a computer) that simulates the way a physical machine executes programs. The part of the server's operating system that manages the VMs is referred to as the hypervisor. The hypervisor interfaces between the physical hardware and the VMs, providing a layer of abstraction to the VMs. Through its management of the VMs' sharing of the physical hardware resources, the hypervisor makes it appear as though each VM were running on its own dedicated hardware. Examples of hypervisors include the VMware Workstation® and Oracle VM VirtualBox®. Although physical servers supporting VM architecture are shown and discussed extensively for purposes of example, physical servers supporting other architectures such as container-based architecture (e.g., Kubernetes®, Docker®, Mesos®), standard operating systems, etc., can also be used and techniques described herein are also applicable. In a container-based architecture, for example, the applications are executed in special containers rather than virtual machines. - In some embodiments, instances of applications are configured to execute within the VMs. Examples of such applications include web applications such as shopping cart, user authentication, credit card authentication, email, file sharing, virtual desktops, voice/video streaming, online collaboration, and many others.
- One or more service engines (e.g., 214, 224, etc.) are instantiated on a physical device. In some embodiments, a service engine is implemented as software executing in a virtual machine. The service engine is executed to provide distributed network services for applications executing on the same physical server as the service engine, and/or for applications executing on different physical servers. In some embodiments, the service engine is configured to enable appropriate service components that implement service logic. For example, a load balancer component is executed to provide load balancing logic to distribute traffic load amongst instances of applications executing on the local physical device as well as other physical devices; a firewall component is executed to provide firewall logic to instances of the applications on various devices; a metrics agent component is executed to gather metrics associated with traffic, performance, etc. associated with the instances of the applications, etc. Many other service components may be implemented and enabled as appropriate. When a specific service is desired, a corresponding service component is configured and invoked by the service engine to execute in a VM.
- In the example shown, traffic received on a physical port of a server (e.g., a communications interface such as Ethernet port 215) is sent to a virtual switch (e.g., 212). In some embodiments, the virtual switch is configured to use an API provided by the hypervisor to intercept incoming traffic designated for the application(s) in an inline mode, and send the traffic to an appropriate service engine. In inline mode, packets are forwarded on without being replicated. As shown, the virtual switch passes the traffic to a service engine in the distributed network service layer (e.g., the service engine on the same physical device), which transforms the packets if needed and redirects the packets to the appropriate application. The service engine, based on factors such as configured rules and operating conditions, redirects the traffic to an appropriate application executing in a VM on a server. Details of the virtual switch and its operations are outside the scope of the present application.
Controller 290 is configured to control, monitor, program, and/or provision the distributed network services and virtual machines. In particular, the controller includes ametrics manager 292 configured to collect performance metrics and perform analytical operations. The controller can be implemented as software, hardware, firmware, or any combination thereof. In some embodiments, the controller is implemented on a system such as 100. In some cases, the controller is implemented as a single entity logically, but multiple instances of the controller are installed and executed on multiple physical devices to provide high availability and increased capacity. In embodiments implementing multiple controllers, known techniques such as those used in distributed databases are applied to synchronize and maintain coherency of data among the controller instances.- Within
data center 250, one ormore controllers 290 gather metrics data from various nodes operating in the data center. As used herein, a node refers to a computing element that is a source of metrics information. Examples of nodes include virtual machines, networking devices, service engines, or any other appropriate elements within the data center. - Many different types of metrics can be collected by the controller. For example, since traffic (e.g., connection requests and responses, etc.) to and from an application will pass through a corresponding service engine, metrics relating to the performance of the application and/or the VM executing the application can be directly collected by the corresponding service engine. As another example, to collect metrics relating to client responses, a service engine sends a script to a client browser or client application. The script measures client responses and returns one or more collected metrics back to the service engine. In both cases, the service engine sends the collected metrics to
controller 290. Additionally, infrastructure metrics relating to the performance of other components of the service platform (e.g., metrics relating to the networking devices, metrics relating to the performance of the service engines themselves, metrics relating to the host devices such as data storage as well as operating system performance, etc.) can be collected by the controller. Specific examples of the metrics include round trip time, latency, bandwidth, number of connections, etc. - The components and arrangement of distributed network service platform 203 described above are for purposes of illustration only. The technique described herein is applicable to network service platforms having different components and/or arrangements.
Figure 3 is a flow chart illustrating an embodiment of a process for statistically characterizing the performance of a distributed network, such as a network employing thesystem 200. In some embodiments, theprocess 300 may be implemented using the service engines 214, 224 and/or thecontroller 290. Consequently, themethod 300 is described in the context of thesystem 200. In other embodiments, other and/or additional components may be used to analyze performance of the distributed network.- Performance metrics are obtained for the sources in the distributed
network 200, instep 302. Step 302 may include collecting performance data for clients, service engines, or other components in thesystem 200. The data may be collected by the service engine itself, by a metrics agent, by a script sent by the service engine to another component or in another manner. For example, each service engine (214, 224, etc.) may determine the latency for each transaction completed by through service engine over a particular time interval. Other metrics, such as client responses, connections, available storage or bandwidth might also be monitored via scripts sent to the client or other component. Components, such as one or more of the VMs (218, 219, 220...), may be configured to report selected performance metrics at regular intervals or in response to specific events. Thus, the metrics data obtained instep 302 may be from components such as applications, VMs and/or clients that are spread out over multiple physical machines. Data related to such performance metrics are provided to the corresponding service engines. - Using the information obtained in
step 302, statistical summaries are generated, viastep 304. Generation of the statistical summary includes calculating a number of statistical values describing the performance metrics. A single statistical summary may be provided for all performance metrics related to the source. In other embodiments, a separate statistical summary may be provided for each performance metric of each source. For example, a statistical summary may be provided for only transaction latencies for each service engine instep 304. Alternatively, a single statistical summary provided instep 304 may incorporate not only transaction latencies, but also other performance characteristics of the service engine or other component. The service engine(s) for may generate the statistical summaries instep 304. - The statistical summaries provided in
step 304 statistically describes the performance of the service engine or other component(s). Thus, raw data for the performance metrics need not be stored in a central storage device. Instead, the statistical summary provides an adequate description of the performance metric using the quantities calculated and stored instep 304. The statistical summary may include one or more of the number of data points for the performance metric, a mean value, a standard of deviation, a variance, a confidence interval, a minimum value, a maximum value and/or other statistical quantities of interest. For example, the statistical summary for the latencies of transactions managed by a service engine may include one or more of the number of transactions completed in the time interval, the mean latency, the standard of deviation in the latency, the variance in the latency, the confidence interval for the latency, the minimum latency for the interval and the maximum latency for the interval. The confidence indicator is a measure of the values for a certain percentage of the sample space. For example, the confidence indicator may be the range of latencies for ninety percent of the transactions occurring during the interval. The confidence interval may thus be represented by a range of values up to the ninetieth percentile of the sample space and the number of values within that percentile. For a service engine completing two hundred transactions over the interval, ninety percent of which were completed by one second, the confidence interval may be one second (the range of latencies for the ninetieth percentile) and the one hundred and eighty (the ninety percent of the transactions). In alternate embodiments, other and/or additional quantities might be included in the statistical summary. - The statistical summaries are aggregated to provide a system-level statistical description for the distributed network at
step 306. Step 306 may be carried out by thecontroller 290. Thus, the service engines may provide their statistical summaries to thecontroller 290, which combines the summaries in a manner that preserves the statistical information in the summaries and generalizes the information to the entire network (or predefined portion thereof). In some embodiments, themetrics manager 292 carries out this function. In other embodiments,step 306 may be performed by other/additional component(s). The system-level statistical description statistically characterizes the performance of the entire distributed network (or subset of the distributed network including multiple service engines) in a probabilistic fashion. The system-level statistical description may include a total number of data points for the performance metric, a system-level mean value, a system-level standard of deviation, a system-level variance, a system-level confidence interval, a system-level minimum value and a system-level maximum value. In the example of transaction latency above, the system-level statistical description may include the total number of transactions in the distributed network completed over the interval, the system-level mean latency, the system-level standard of deviation in latency, the system-level variance in latency, a system-level confidence interval for latency, a system-level minimum latency and a system-level maximum latency. - The aggregation in
step 306 may be carried out in a number of manners that are consistent with statistical/probability rubrics. In some embodiments, a weighted sum of each of the statistical quantities in the statistical summaries for each metric is calculated. For latencies, the mean value, standard of deviation, variance, confidence interval, minimum value and maximum value may be weighted by a measure of the number of transactions for the service engine over the corresponding time interval. For example, the quantities above may be weighted by the number of transactions for the service engine or by the fraction of the total number of transactions that are completed for the service engine. Other mechanisms for weighting and/or integrating the values in each summary that are statistically valid may be used. Consequently, the system-level values are based on the values in each statistical summary but account for the fraction of the sample space represented by the summary. - Using the
method 300, the system-level performance of a distributed network is determined using statistical summaries of the individual service engines. Consequently, the system-level statistical description may be rapidly obtained, without requiring raw data for the performance metrics to be transferred to a mass storage device or other component, stored and/or analyzed in bulk. Instead, the system-level statistical description may be used. Further, other quantities of interest may be calculated using the system-level statistical description. Real time or quasi-real time performance may be determined and adjustments to system operation may be made. Figure 4 is a flow chart illustrating an embodiment of amethod 400 for statistically characterizing the transaction latency of a distributed network, such as one utilizing thesystem 200. In some embodiments, theprocess 400 may be implemented using service engines and controller such as the service engines 214, 224 and thecontroller 290. Consequently, themethod 400 is described in the context of thesystem 200. In other embodiments, other and/or additional components may be used to analyze performance of the distributed network. Themethod 400 is also described in the context of transaction latency as the performance metric being analyzed. However, themethod 400 may be applied to other performance metrics.- The transaction latencies are obtained for the service engines in the distributed network, in
step 402. Step 402 may include each service engine determining the latencies for transactions completed for the service engine over a specific time period. As discussed above, metrics agents, scripts or other data collection mechanisms might also be used. - The latencies are organized into buckets based on latency value, at
step 404. Each bucket corresponds to a certain percentile for latency. For example, if ten buckets are used, each bucket may correspond to ten percentiles. For example,bucket 1 may be for transactions having the lowest latencies from zero through the tenth percentile,bucket 2 may be for transactions having the next lowest latencies greater than the tenth percentile and not more than the twentieth percentile, and so on. In another embodiment, another number of buckets may be used. For example, each service engine might organize latencies into twenty buckets, with each bucket corresponding to five percentiles. All service engines may use the same number of buckets. In alternate embodiments, different service engines may use a different number of buckets. Because the latencies are stored in buckets based on each latency's value, buckets generally include data for a different number of transactions. - The desired statistics are calculated for each bucket in each service engine, at
step 406. For example, the statistics calculated for each bucket may include the number of transactions in the bucket, a mean value of the latencies in the bucket, a standard of deviation in the latencies for the bucket, a variance in latency for the bucket during the interval, a confidence interval for the bucket's latencies, a minimum latency for the bucket over the interval, and a maximum latency for the bucket during the interval. The statistics calculated for all of the buckets for the service engine may be considered to be the statistical summary for the service engine. Thus, steps 404 and 406 may correspond to step 304 of the method 300 (determining the statistical summary for the service engine). - The statistical summaries for each service engine are provided to the controller, via
step 408. Thus, the statistics for the buckets of the service engine are transmitted to the controller. Because statistical analysis has already been carried out for the data collected instep 402 for each service engine, raw data need not be transmitted from the service engines to the controller. - The buckets for the service engines are combined by the
controller 290 in a manner consistent with statistical guidelines, thereby providing system-level buckets, viastep 410. Thecontroller 290 thus generates the system-level statistical description for the distributed network. The controller may hierarchically combine the buckets by merging buckets two buckets at each level until the number of buckets for all the service engines have been combined into the desired number of system-level buckets. Merging the buckets may include providing a weighted sum of the values in each bucket. Other statistically acceptable methods may also be used. In some embodiments, the number of system-level buckets is the same as the number of buckets for each service engine. The combining instep 410 is performed so that each system-level bucket includes statistics for system-wide transactions that are in the appropriate percentile. For example, system-level bucket 1 may be for all transactions in the network having the lowest latencies from zero through the tenth percentile, system-level bucket 2 may be for all transactions in the network having the next lowest latencies greater than the tenth percentile and not exceeding the twentieth percentile, and so on. Because the buckets are combined instep 410, each system-level bucket may include a total number of transactions for that bucket's percentile range, a system-level mean latency for that percentile range, a system-level latency standard of deviation for that percentile range, a system-level variance in latency for that percentile range, a system-level confidence interval for that percentile range, a system-level minimum latency for that percentile range and a system-level maximum latency for that percentile range. The combination of the statistics in the system-level buckets may be considered to form the system-level statistical description for the latency. - The merging of buckets in
step 410 may be carried out in a number of manners. In some embodiments, a weighted sum of each of the statistical quantities for each bucket being combined is calculated. For example, the merged mean may be determined by multiplying the mean of the first bucket by the number of transactions for the first bucket, adding the mean of the second bucket by the number of transactions for the second bucket and dividing the quantity by the sum of the transactions in the first and second buckets. Thus, the transactions serviced by each service engine and the total number of transactions for the system may be used instep 410. Further, the merging of buckets instep 410 may take into account the range of values in each bucket. In some cases, the ranges of values in different service engines do not overlap. In such an embodiment, the merging instep 410 may be simplified. For example,Figure 5 depicts the merging of buckets for four service engines having ranges that do not overlap and which have a similar number of transactions. Service engine 1 (1st SE) hasbuckets buckets buckets buckets Buckets Buckets bucket 544A.Buckets buckets 532 and 534A are combined tobuckets buckets 502A through 534A might be combined in another manner. Thebuckets level buckets Figure 6 depicts an exemplary embodiment of a situation in which the service engines have latencies in ranges that overlap and which have a similar number of transactions. In this case, the 1st SE hasbuckets buckets buckets buckets buckets 402B and 522B are combined intobucket 542B, for example using a weighted sum.Buckets bucket 544B.Buckets bucket 546B.Buckets buckets 548B. Similarly,buckets level bucket 552B. Similarly,buckets level bucket 554B. Although representing data for a larger fraction of the system,buckets buckets 502B through 534B might be combined in another manner.- Using the
method 400, the system-level performance of a distributed network is determined using statistical summaries of the individual service engines. Consequently, the system-level statistical description may be rapidly obtained, without requiring raw data for the performance metrics to be stored and analyzed in bulk. Using the statistical description, other quantities of interest may be calculated. Further, real time or quasi-real time performance may be determined and adjustments to system operation may be made. - Some embodiments of the invention provide a method for collecting metric values relating to operations of a set of one or more resources executing on host computers in a datacenter. In some embodiments, the set of resources includes a set of one or more applications (e.g., a cluster of webservers, application servers or database servers) for which a middlebox service is performed on the host computers, and the metric is the latency experienced by packets processed by the application set.
- In some embodiments, the method hierarchically collects and analyzes samples, with a first set of samples collected and analyzed in the data plane, and a second set of samples collected and analyzed in the control plane by aggregating the samples collected in the data plane. In some embodiments, the data plane includes host computers on which sample collecting engines (e.g., service engines) execute, while the control plane includes a set of one or more servers that obtains sample data collected by the host computers, and aggregates and analyzes this data.
- At a particular host computer, the method in some embodiments repeatedly identifies different sample values for a particular operational metric. During a first time period, the method identifies a first set of sample metric values and generates an individual-value (IV) first histogram that specifies the number of samples that the method has processed for each of several metric values. Based on the IV first histogram, the method specifies several bins (i.e., metric value ranges) for a sample-value range (SVR) second histogram.
- During a second time period, the method identifies a second set of sample values, and generates the SVR second histogram to specify a number of samples that the method has processed for each range in a group of the specified ranges in the second histogram. The method then provides the SVR second histogram to a server to analyze in order to assess the operations of the set of resources in the datacenter. For instance, in some embodiments, the method provides the SVR second histogram to a set of one or more servers to aggregate with SVR second histograms generated by several other host computers for the particular operational metric.
Figure 7 illustrates aprocess 700 that implements the metric-value collection method of some embodiments. As further described below, thisprocess 700 generates two SVR histograms, a first SVR histogram with fixed-sized bins that the process identifies based on an initial IV histogram, and a second SVR histogram with variable-sized bins that the process identifies based on the first SVR histogram. Theprocess 700 iteratively reports the variable-sized bin histogram to a set of servers, then generates and reports new variable-sized bin histograms, and with each generation of this histogram, it might modify the locations and/or sizes of bins to match the metric samples collected for the previous generation of its histogram.- In some embodiments, the
process 700 is performed by a service engine that executes on the particular host computer and identifies different metric values for different packets on which the service engine performs a middlebox service. Thisprocess 700 will be described by reference to the example illustrated inFigure 8 , which presents several load balancing engines 805 executing as service virtual machines (SVMs) on several host computers 810 that distribute the packet-processing load acrossseveral server applications 815 in aserver application cluster 820 that execute on the host computers in a datacenter. - In this example, the packets that the load balancers distribute among the
server applications 815 of theapplication cluster 820 are from other client applications that run in the same datacenter. Also, in this example, the client andserver applications 815 operate as guest virtual machines (GVMs) that execute on the host computers 810. In other embodiments, the load balancers 805 and the applications are implemented differently, e.g., are implemented as containers, hypervisor service engines, etc. The host computers 810 communicate with each other and with a set ofcontrollers 875 through anetwork 860 of the datacenter. - In the example illustrated in
Figure 8 , theload balancer 805a that executes onhost computer 810a acts as the master load balancer for theapplication cluster 820. In this role, theload balancer 805a performs theprocess 700 for theapplication cluster 820, by not only generating variable-sized bin histograms to summarize the latencies experienced by packets forwarded by thisload balancer 805a fromdifferent clients 850 to thedifferent applications 815 of theapplication cluster 820, but also by defining and updating the bin structure for these variable-sized bin histograms. - In this example, the other load balancers also perform part of the
process 700 to define the variable-sized bin histograms for the packets that they forward to the application cluster, but these load balancers use the bin attributes (e.g., the bin locations and sizes) provided by theload balancer 805a for the histograms that they generate. In some embodiments, these other load balancers executing on the other host computers 810 perform theprocess 700 in its entirety forother application clusters 820. - The approach of having one service engine (e.g., on load balancer) acting as a master service engine for defining the bin structure for all the service engines for a particular operational metric, is beneficial as it allows the variable-sized bin histograms that the service engines provide to a server set to aggregate to have the same bin structure (i.e., the same bins, at the same locations and with the same sizes) to simplify the aggregation of the provided histograms. Other embodiments, however, use other techniques for defining the bin structure, including having the server set define the bin structure for the variable-sized bin histograms based on samples/histograms provided the service engines or based on sample values collected by the server set in previous settings or previous sample collection cycles.
- This
process 700 will also be described by reference to an example of a load-balancing process 900 ofFigure 9 . While theload balancer 805a performs theprocess 700, all of the load balancers 805 (including theload balancer 805a) continuously perform theprocess 900 to distribute different packet flows amongdifferent server applications 815 in theserver application cluster 820, and to identify and record latencies experienced by the packets in these flows. - As shown, the
process 900 starts when the load balancer receives (at 905) a packet to forward to the application cluster. Theprocess 900 then identifies (at 910) anapplication 815 in thecluster 820 that should process the packets of the received packet's flow. When the received packet is a first packet that is received for a flow, theprocess 900 performs a load-balancing operation (e.g., by using weight values that direct a round robin selection operation) to select the application in thecluster 820 that should process the received packet's flow and stores the identity of the selected application for the packet's flow in a connection tracking storage. - On the other hand, when the received packet is not the first packet received for its flow, the
process 900 uses the record in the connection tracking storage to identify the application selected for the packet's flow (e.g., by matching the received packet's flow identifier with the flow identifier of a record in the connection tracker that specifies an application in the cluster for the flow specified by the flow identifier). - Next, at 915, the process forwards the packet to the identified application. At 920, the
process 900 identifies and stores a latency value for the packet if it needs to track such a value for the received packet. In some embodiments, the load balancers store latency values (i.e., store latency sample values) for all packets that they process, while in other embodiments the load balancers only store latency values for a subset of packet that they process as collecting such samples for all of the processed packets is too computationally and resource-consumption intensive. - Also, in some embodiments, the load balancer computes the latency value for the processed packet by interacting with the client 850 (i.e., the client application) that is the source of the processed packet to identify the round-trip time for the packet from when it leaves the client to when the client receives a responsive packet back from the
application 815 that received the processed packet. In other embodiments, the load balancer computes the latency value differently, e.g., computes the time interval from when it received the packet to when it receives a responsive packet from theapplication 815. After 920, the process ends. - As mentioned above, the
process 700 ofFigure 7 is performed by a service engine in some embodiments. Theprocess 700 initially generates (at 705) an individual-value (IV) histogram for a first set of sample metric values (e.g., latency values) that the service engine processes during a first time period. The generated IV histogram specifies the number of samples that the service engine has processed for each of several metric values. - To generate this histogram, the
process 700 maintains a list of metric values that are stored by the values, and for each metric value on the list, maintains a number that represents the number of times that that service engine has identified that metric value during the first time interval for a processed packet. Theprocess 700 implements this list differently in different embodiments. For instance, in some embodiments, the process implements this list as a sorted linked list with each entry in the list storing a metric value and a sample count value, while in other embodiments it implements this list as a sorted array. Theprocess 700 has a different implementation of this list in other embodiments. Figure 10 illustrates an example of a generatedIV histogram 1000 for a sample of 100 latency values that a load balancer processes in some embodiments. In this example, the histogram is defined along an x-axis that represents individual latency values, and a y-axis that represents the number of samples. Hence, for each latency value represented in the histogram, the histogram specified the number of times that the latency value has been recorded for a packet by the load balancer. In this histogram, 50 samples have latencies below 0 to 50 milliseconds (ms), while another 50 samples have latencies between 51 to 100 ms.- In some embodiments, the
process 700 allocates a first amount of a memory of its host computer for the generated IV histogram. When the process detects that the generated IV histogram has consumed a second amount of the memory that is within a threshold size of the first amount, theprocess 700 transitions to 710 to define the bins for a fixed-sized bin histogram for a next batch of sample values that it should analyze. In some embodiments, a sub-process of theprocess 700 continues to generate the IV histogram while the bin are being defined for the fixed-sized bin histogram, while in other embodiments, theprocess 700 stops generating the IV histogram when it starts to define the bins for the fixed-sized bin histogram. - In some embodiments, the fixed-sized bin histogram includes fixed-sized bins about the metric values identified along the IV histogram. In many cases, the IV histogram does not have sample values for the full range of possible values that the method might process. To account for this, the
process 700 in some embodiments selects the fixed-sizes of the bin histogram at 710 to evenly cover the expected range of sample values. - For the example illustrated in
Figure 10, Figure 11 illustrates an example of the fixed-sized bins generated for the fixed-bin histogram at 710 in some embodiments. In this example, 54 bins, each with a bin size of 2, are defined about the sample values identified by the IV histogram. In this example, the last four bins are defined for latencies past 100 ms, even though thehistogram 1000 did not identify any such latencies in order to have a cushion for identifying potentially larger latencies. Other embodiments, however, do not generate such extra bins, or do not use as larger a sample-value cushion. - After specifying the bin locations and sizes for the fixed-sized bin histogram, the
process 700 generates (at 715) the fixed-sized bin histogram by processing another set of sample values in a second time period. This histogram specifies the number of samples that the process has analyzed for each of its fixed-sized bins. In some embodiments, theprocess 700 generates the fixed-sized bin histogram by stepping through the sample values, and for each sample value, identifying the histogram bin that corresponds to the sample value (i.e., the bin that specifies the value range that contains the processed sample value) and incrementing the sample count of the identified bin by one. - For the example illustrated in
Figure 11 ,Figure 12 illustrates an example of the fixed-sized bin histogram 1200 that theprocess 700 generates at 715 in some embodiments. This histogram corresponds to 1000 samples analyzed by theprocess 700. In this histogram, sample count for the buckets corresponding to latencies of 40 ms or lower sum up to 500 while the sample count for the buckets corresponding to latencies larger than 40 ms sum up to 500. Accordingly, in this example, the median for thehistogram 1200 is 40 ms. - The
process 700 generates (at 715) the fixed-sized bin histogram until it determines that it should transition to a variable-sized bin histogram. The process makes this determination based on different criteria in different embodiments. For instance, in some embodiments, the process generates the fixed-sized bin histogram for only a certain number of samples, while in other embodiments, it generates this histogram for only a certain duration of time. - Once the process determines (at 715) that is should switch to a variable-sized bin histogram, the process uses (at 720) the fixed-sized bin histogram to identify the locations and sizes of the bins for variable-sized bin histogram. The
process 700 performs thisoperation 720 differently in different embodiments. For instance, for the variable-sized bin histogram, theprocess 700 in some embodiments allocates one bin of x-width for the bottom 50% sample values identified by the fixed-sized bin histogram, allocates N bins of y-width for the next 40% sample values identified by the fixed-sized bin histogram, and allocates M bins of z-width for the last 10% of sample values identified by the fixed-sized bin histogram, where N and M are integers and x is greater than y, which is greater than z. - For instance, from the fixed-bin histogram example of
Figure 12 , theprocess 700 in some embodiments generates the variable-sized bins illustrated inFigure 13 . These bins are for a variable-sized bin histogram that theprocess 700 should next generate. Based on the fixed-bin histogram 1200, the process 700 (1) defines ten buckets for the variable-sized bin histogram, (2) assigns the first bucket to center at 20 ms with a width of 20 ms, (3) assigns the next four buckets of the variable-sized bin histogram to center respectively at 45, 55, 65, and 75 ms, each with a width of 10 ms, and (4) assigns the last five buckets of the variable-sized bin histogram to center respectively at 82, 86, 90, 94 and 98 ms, each with a width of 4 ms. InFigure 13 , these buckets are identified by their leftmost and rightmost values in order to simplify their illustration. - This approach is optimized to identify the maximum latency values experienced by 50%, 90% and 99% of the samples, as it (1) creates the first bucket to capture the bottom 50% of expected sample value range based on what it previously processed for the fixed-value histogram, (2) creates four buckets for the next 40% of the expected sample value range, based on what it previously processed for the fixed-value histogram, and then (3) creates five buckets for the last 10% of the expected sample value range, based on what it previously processed for the fixed-value histogram.
- After specifying (at 720) the bin locations and sizes for the variable-sized bin histogram, the
process 700 provides (at 725) the bin locations and sizes for this histogram to the other service engines on other host computers 810 so that they can start to generate their variable-sized bin histograms based on these bins.Figure 8 depicts theload balancer 805a providing data regarding the variable-sized bins to the other load balancers 805 executing on other host computers 810. The operation of these other load balancers to generate their variable-sized bin histograms will be described below by reference toFigure 19 . - Next, the process generates (at 730) the variable-sized histogram by processing another set of sample values in a third time period. This histogram specifies the number of samples that the process has analyzed for each of its bins. In some embodiments, the
process 700 generates the variable-sized bin histogram by stepping through the sample values, and for each sample value, identifying the histogram bin that corresponds to the sample value (i.e., the bin that specifies the value range that contains the processed sample value) and incrementing the sample count of the identified bin by one. - For the example illustrated in
Figure 13 ,Figure 14 illustrates an example of the variable-sized bin histogram 1400. that theprocess 700 generates at 730 in some embodiments. This histogram corresponds to 1000 samples analyzed by theprocess 700. As shown, 450 of the samples fall within thefirst bin 1405 of this histogram, 50 samples fall within the second bin 1410 of this histogram, and the remaining 500 samples fall in the other seven buckets of the histogram. Thus, the latency median has shifted from 40 ms expressed by the fixed-binsized histogram 1200 to 50 ms, as the 500th sample is in the second bucket 1410. Also, this histogram shows that the 90% and 99% latency values are 80 and 98 ms, as the 900th and 990th samples fall in thebuckets - The
process 700 generates (at 730) the variable-sized bin histogram until it determines that it should report this histogram to the server set. The process makes this determination based on different criteria in different embodiments. For instance, in some embodiments, the process generates the variable-sized bin histogram for only a certain number of samples, while in other embodiments, it generates this histogram for only a certain duration of time. - Once the process determines (at 730) that is should provide the variable-sized bin histogram to the server set, the process transmits (at 735) this histogram through a network to a server to analyze in order to assess the operations of the set of resources in the datacenter. For instance, in the example illustrated in
Figure 8 , theload balancer 805a provides the variable-sized histogram to a set of one ormore controllers 875. As further described below, the controller set 875 aggregates this histogram with variable-sized bin histograms generated by other load balancers 805 executing on other host computers 810 for the latencies identified for packets forwarded to theapplication cluster 820. Figure 15 illustrates an example of how the load balancers report their variable-sized bin histograms in some embodiments. As shown, a load balancer in some embodiments reports its histogram as a table with multiple records representing multiple bins. Each bin's record has a latency value that expresses the maximum latency associated with the bin, with the minimum being the maximum latency value of the previous bin, or 0 in case of the first bin. Each bin's record also has a sample count that identifies the number of processed samples that fell into the bin. In other embodiments, the load balancers report their histograms differently. Other embodiments use other schemes for specifying the bin structure. For instance, some embodiments define each bin in terms of its midpoint and its width. In some of these embodiments, the bin's width is specified in terms of a percentage of error.- After sending (at 735) the variable-sized bin histogram to the server set, the
process 700 performs (at 740) a bin-modification operation to determine whether it needs to modify the locations and/or sizes of the bins of the next variable-sized bin histogram, or whether it can use the same exact bins as the previous variable-sized bin histogram that it provided to the server set. To do this,process 700 in some embodiments analyzes the sample counts expressed by the prior variable-sized bin histogram to determine whether the locations and sizes of the first bin, the last bins and the intermediate bins mirror the expressed sample counts, and if not, it modifies the locations and/or sizes of these bins. - For the example illustrated in
Figure 14 , the median has shifted to be 50 ms after it was initially determined to be about 40 ms with the fixed-sized bin histogram. Hence, in some embodiments, the process creates the bins illustrated inFigure 16 for the next variable-sized bin histogram. InFigure 16 , the next variable-bin sized histogram has (1) ten buckets, (2) the first bucket centering at 22.5 ms with a width of 22.5 ms, (3) the next four buckets centering respectively at 50, 60, 70, and 80 ms, each with a width of 10 ms, and (4) the last five buckets centering respectively at 86.5, 89.5, 92.5, 95.5 and 98.5 ms, each with a width of 3 ms. Again, inFigure 16 , these buckets are identified by their leftmost and rightmost values in order to simplify the illustration. - At 740, the
process 700 provides the new bin structure for the next variable-sized histogram to other service engines if it changed the bin structure, or informs the service engines that it has not changed the bin structure. After 740, the process returns to 730 to generate the next variable-sized bin histogram. The process loops through 730-740 until an external event (e.g., an instruction from a server, or the termination of its service engine's operation) causes theprocess 700 to shut down. - In other embodiments, the
process 700 of the master service engine dynamically creates its variable-sized bin histogram differently. For instance, after generating (at 705) its IV first histogram, this process defines (at 710) an SVR second histogram from the IV first histogram, instead of generating a fixed-sized bin histogram from the IV first histogram.Figure 17 illustrates an example of how theprocess 700 defines for the SVR second histogram based on the generated IV first histogram. As shown, the SVR second histogram inFigure 17 has (1) one bin based on the bottom 25% of samples of the IV first histogram, (2) four bins for the next 25% of samples of the IV first histogram, (3) seven bins for the next 40% of samples of the IV first histogram, and (4) another nine bins for the last 10% of samples of the IV first histogram. - Based on the next set of samples that it processes, the method then processes the next 1000 samples to generate (at 715) the SVR second histogram, and uses this histogram to define (at 720) the bins for the SVR third histogram.
Figure 18 illustrates an example of the generated SVR second histogram 1800. As shown, this histogram shows the median to have moved from 50 ms to 42 ms. The approach illustrated inFigures 17 and18 has the advantage of preventing the method from creating too many bins for its second histogram based on outlier sample values identified in the first histogram. Figure 19 illustrates aprocess 1900 performed by another service engine that generates a variable-sized bin histogram based on bin size/location attributes that it receives from theprocess 700 ofFigure 7 . This other service engine generates its variable-sized bin histogram to summarize metric values that this service engine collects for the particular operational metric as it performs services on packets that it receives. Unlike theprocess 700, theprocess 1900 does not generate the bin attributes for its variable-sized bin histogram by first generating the IV histogram followed by generating a fix-sized bin histogram for the samples that it collects.- Instead, it gets the bin attributes for its variable-sized bin histogram from the
process 700 as theprocess 700 is designated as the master process for the particular operation metric for which all of the service engines generate variable-sized bin histograms. In some embodiments, while it waits to get the bin attributes from theprocess 700, the service engine that performs theprocess 1900 continues its collection of sample metric values, so that it can generate its variable-sized bin histogram with these values and other sample values that it collects after it starts to generate this histogram. - As shown, the
process 1900 initially receives (at 1905) the bin size/location attributes from theprocess 700 ofFigure 7 . Based on these received bin attributes, theprocess 1900 then generates (at 1910) a variable-sized histogram by processing a set of sample values that it identifies for the particular operational metric during a time period. This histogram specifies the number of samples that the process has analyzed for each of its bins. In some embodiments, theprocess 1900 generates the variable-sized bin histogram by stepping through the sample values, and for each sample value, identifying the histogram bin that corresponds to the sample value (i.e., the bin that specifies the value range that contains the processed sample value) and incrementing the sample count of the identified bin by one. - The
process 1900 generates (at 1910) the variable-sized bin histogram until it determines that it should report this histogram to the server set. The process makes this determination based on different criteria in different embodiments. For instance, in some embodiments, the process generates the variable-sized bin histogram for only a certain number of samples, while in other embodiments, it generates this histogram for only a certain duration of time. - Once the process determines (at 1910) that it should provide the variable-sized bin histogram to the server set, the process transmits (at 1915) this histogram through a network to a server to analyze in order to assess the operations of the set of resources in the datacenter. For instance, when the
process 1900 is performed by a load balancer 805 ofFigure 8 , the load balancer forwards its histogram of the latencies that it identifies to the controller set 875, which then aggregates this histogram with variable-sized bin histograms generated by other load balancers 805 executing on other host computers 810 for the latencies identified for packets forwarded to theapplication cluster 820. - After 1915, the
process 1900 transitions to 1920, where it waits until it receives from theprocess 700 the bin attributes for the next variable-sized bin histogram that it should generate, or direction to use the previous bin attributes. Upon receiving (at 1920) this input from theprocess 700, theprocess 1900 transitions back to 1910 to generate its next variable-sized histogram for the next time period. Theprocess 1900 loops through its operations until an external event (e.g., an instruction from a server, or the termination of its service engine's operation) causes theprocess 1900 to shut down. Figure 20 illustrates aprocess 2000 performed by a controller in some embodiments for a set of variable-sized bin histograms reported by a set of service engines for a particular operational metric. One example of such an operational metric is the latency experienced by packets forwarded to a cluster of applications by a set of load balancers. In some embodiments, the controller performs theprocess 2000 iteratively (e.g., periodically). As shown, theprocess 2000 initially collects (at 2005) variable-sized bin histograms from several service engines. In some embodiments, theprocess 2000 directs the service engines to provide their histograms, while in other embodiments, the service engines provide their histograms to the controller at set intervals.- As mentioned above, some embodiments use one service engine as the master service engine that computes the bin attributes for the variable-sized histogram for all the service engines to use. In these embodiments, this ensures that the collected variable-sized histograms all have the same bin attributes, which simplifies the controller's aggregation of these histograms. In some embodiments, the master service engine provides its initial variable-sized histogram to the controller before the other service engines have had a chance to generate their variable-sized histograms.
- In some of these embodiments, the controller uses this provided histogram as an initial set of data for generating an initial report, while in other embodiments, the controller stores this set of data for later use with other reported histogram data from the master service engine and the other service engines. In still other embodiments, the master service engine generates its initial variable-sized bin histogram for a longer duration of time than the other service engines, so that master service engines and the other service engines can report their initial histograms at the same time to the controller.
- After collecting (at 2005) the histograms, the
process 2000 aggregates the data (at 2010) to obtain a larger histogram for the operation of all the reporting service engines in the last time period.Figure 21 illustrates acontroller 875 summing the data of three reportedhistograms aggregate histogram 2120. As shown, the controller in some embodiments simply adds the sample counts from all the corresponding bins in each histogram to produce the aggregate sample count for each bin in the aggregate histogram. This can be achieved because all of the reporting histograms have the same bin structure. - In some embodiments, the
process 2000 also combines the aggregate histogram that it generates with prior aggregate histograms in its previous iterations. To do this, theprocess 2000 in some embodiments uses a weighted sum approach that accounts for prior aggregate histograms but at a reduced weight than the current aggregate histogram. This weighted approach also accounts for the shifting of the bins over time. - Next, at 2015, the controller stores the aggregated histogram in a data storage (e.g., in a database), which can be accessed by network administrator to obtain information regarding the collected operational metric. For instance, in some embodiments, one or more servers can access this data to provide graphical display of the aggregated histogram, or provide this information in a tabular or text form, e.g., provide latency values for 50%, 90% and 99% of the processed packets. These servers provide access to this data through their user interface, e.g., a management portal, or through their application programming interface (API) calls.
- In some embodiments, the
controller process 2000 also analyzes (at 2020) its aggregate histogram as well as the different histograms reported by the different service engines, in order to perform certain actions. The aggregate histogram analyzed at 2020 in some embodiments is the aggregate histogram that the process generates just for its current iteration based on the collected histograms in this iteration, while in other embodiments, the analyzed aggregate histogram is the histogram generated overall several iterations of theprocess 2000. Similarly, the process' analysis of the different reported histograms in some embodiments is limited to the current iteration of this process, while in other embodiments it accounts analysis of several reported histograms that each service engine reported overall several cycles of the operation of theprocess 2000. - For instance, after analyzing histogram data from the non-master service engines, the
process 2000 in some embodiments provides (at 2025) the master service engine with some of this histogram data so that the master service engine can analyze this data to adjust its bin attributes (e.g., bin sizes and/or locations) if necessary. Alternatively, or conjunctively, after analyzing histogram data from the non-master service engines, theprocess 2000 in some embodiments directs (at 2030) all the service engines (including the master service engine) to use a new bin structure. In some embodiments, theprocess 2000 provides the new bin structure to all of the service engines when it detects that the bin structure defined by the master service engine is not suitable for the other service engines (e.g., is more than a threshold percentage off for the data collected by the other service engines). In other embodiments, theprocess 2000 does not perform either or both of theoperations - Some embodiments do not have one service engine serve as the master service engine for defining the bin structure for the variable-sized bin histograms generated by all of the service engines, but instead use the controllers to define this bin structure. In some of these embodiments, the controller cluster collects IV histograms or fixed-sized bin histograms from the service engines, and aggregates these histograms into an aggregate histogram. Based on this aggregate, the controller cluster generates the bin attributes for the variable-sized bin histograms, and distributes this bin structure to the service engines to use to generate their variable-sized bin histograms.
- Based on the analysis of the aggregate histogram, the
process 2000 in some embodiments can also provide (at 2035) new configuration data to the host computers, in order to modify the operations of the service engines and/or application cluster to improve on one or more of the operational metrics, including the particular metric for which the histograms are generated by the service engines. For instance, through the new configuration data, thecontroller process 2000 can deploy additional application instances (e.g., additional application VMs or containers) in the application cluster, and/or additional service engine (e.g., service VMs, etc.). - Conjunctively, or alternatively, the new configuration data might direct one or more host computers to allocate more resources (e.g., memory, processor cores, network bandwidth, etc.) to the application cluster and/or service engines. Also, in some embodiments, the new configuration data might configure other elements in the datacenter, e.g., configure front end load balancers to distribute the flows differently to the different service engines. In other embodiments, the
controller process 2000 does not perform one or more of the operations 2020-2035. - While the invention has been described with reference to numerous specific details, one of ordinary skill in the art will recognize that the invention can be embodied in other specific forms. For instance, while several examples were provided above for service engines tracking latencies, one of ordinary skill will realize that some embodiments are used to track other operational metrics in a datacenter by service engines or other forwarding or compute elements in a network. Thus, one of ordinary skill in the art would understand that the invention is not to be limited by the foregoing illustrative details, but rather is to be defined by the appended claims.
Claims (12)
- A method of collecting values for a particular operational metric relating to operations of a set of resources (805) executing on host computers (810) in a datacenter, the method comprising:
at a particular host computer (810a), while identifying different sample values for the particular operational metric:generating, in a first time period, an individual-value 'IV' first histogram (1000) specifying a number of samples identified in the first time period for each of a plurality of sample values of the particular operational metric;for a sample-value range 'SVR' second histogram (1400), specifying a plurality of metric value ranges for the particular operational metric, each metric value range containing at least one sample value with an associated sample value number specified by the IV first histogram (1000);generating, in a second time period, the SVR second histogram (1400) specifying a number of samples identified in the second time period after the first time period for each of a group of the specified metric value ranges specified for the particular operational metric;providing the SVR second histogram (1400) to a server (875) to analyze in order to assess the operations of the set of resources (805) in the datacenter; andafter providing the SVR second histogram (1400) to the server (875), modifying, in a third time period, at least two metric value ranges specified for the SVR second histogram (1400) based on the number of sample values that the generated SVR second histogram (1400) specifies for its plurality of metric value ranges and providing a modified SVR second histogram to the server (875) to analyze in order to assess the operations of the set of resources (805) in the datacenter. - The method of claim 1, wherein providing the SVR second histogram (1400) comprises providing the SVR second histogram (1400) to a set of one or more servers (875) to aggregate with SVR second histograms generated by a set of other host computers (810b, 810C) for the particular operational metric.
- The method of claim 1, wherein a service engine (805a) generates the first and second histograms (1000, 1400) on the particular host computer (810a), the service engine (805a) performing a middlebox service operation on the particular host computer (810a).
- The method of claim 3, wherein the middlebox service operation is one of a load balancing operation, a firewall operation, an intrusion detection operation, an intrusion prevention operation, and a network address translation operation.
- The method of claim 1, whereinthe plurality of metric value ranges is a first plurality of metric value ranges, andspecifying the first plurality of metric value ranges for the SVR second histogram (1400) comprises:for an SVR third histogram (1200), specifying a second plurality of metric value ranges for the particular operational metric;generating the SVR third histogram (1200) specifying a number of samples identified for each of a group of the specified ranges in the second plurality of metric value ranges specified for the particular operational metric; andspecifying the first plurality of metric value ranges based on the generated SVR third histogram (1200).
- The method of claim 5, wherein the metric value ranges specified for the SVR third histogram (1200) have a fixed size, while the metric value ranges specified for the SVR second histogram (1400) have a variable size.
- The method of claim 1, wherein the SVR second histogram (1400) specifies the values of the particular operational metric for 50%, 90% and 99% of the samples processed for the SVR second histogram (1400).
- The method of claim 1, wherein the particular operational metric is latency experienced by a set of packets processed at the particular host computer (810a).
- The method of claim 1 further comprising:allocating a first amount of a memory of the particular host computer (810a) for the generated IV first histogram (1000);detecting that the generated IV first histogram (1000) has consumed a second amount of the memory that is within a threshold size of the first amount; andbased on the detection, specifying the plurality of metric value ranges and generating the SVR second histogram (1400).
- The method of claim 9 further comprising terminating the generation of the IV first histogram (1000) based on the detection.
- A machine readable medium storing a program which when executed by at least one processing unit implements the method according to any one of claims 1-10.
- An electronic device comprising:a set of processing units; anda machine readable medium storing a program which when executed by at least one processing unit implements the method according to any one of claims 1-10.
Priority Applications (1)
| Application Number | Priority Date | Filing Date | Title |
|---|---|---|---|
| EP23183090.2AEP4239484A3 (en) | 2018-10-26 | 2019-10-25 | Collecting samples hierarchically in a datacenter |
Applications Claiming Priority (2)
| Application Number | Priority Date | Filing Date | Title |
|---|---|---|---|
| US201862751114P | 2018-10-26 | 2018-10-26 | |
| PCT/US2019/058054WO2020086956A1 (en) | 2018-10-26 | 2019-10-25 | Collecting samples hierarchically in a datacenter |
Related Child Applications (1)
| Application Number | Title | Priority Date | Filing Date |
|---|---|---|---|
| EP23183090.2ADivisionEP4239484A3 (en) | 2018-10-26 | 2019-10-25 | Collecting samples hierarchically in a datacenter |
Publications (2)
| Publication Number | Publication Date |
|---|---|
| EP3857381A1 EP3857381A1 (en) | 2021-08-04 |
| EP3857381B1true EP3857381B1 (en) | 2023-07-12 |
Family
ID=68583516
Family Applications (2)
| Application Number | Title | Priority Date | Filing Date |
|---|---|---|---|
| EP23183090.2APendingEP4239484A3 (en) | 2018-10-26 | 2019-10-25 | Collecting samples hierarchically in a datacenter |
| EP19805453.8AActiveEP3857381B1 (en) | 2018-10-26 | 2019-10-25 | Collecting samples hierarchically in a datacenter |
Family Applications Before (1)
| Application Number | Title | Priority Date | Filing Date |
|---|---|---|---|
| EP23183090.2APendingEP4239484A3 (en) | 2018-10-26 | 2019-10-25 | Collecting samples hierarchically in a datacenter |
Country Status (4)
| Country | Link |
|---|---|
| US (3) | US11044180B2 (en) |
| EP (2) | EP4239484A3 (en) |
| CN (1) | CN112703487B (en) |
| WO (1) | WO2020086956A1 (en) |
Families Citing this family (16)
| Publication number | Priority date | Publication date | Assignee | Title |
|---|---|---|---|---|
| US11283697B1 (en) | 2015-03-24 | 2022-03-22 | Vmware, Inc. | Scalable real time metrics management |
| US10594562B1 (en) | 2015-08-25 | 2020-03-17 | Vmware, Inc. | Intelligent autoscale of services |
| US10999168B1 (en) | 2018-05-30 | 2021-05-04 | Vmware, Inc. | User defined custom metrics |
| WO2020086956A1 (en) | 2018-10-26 | 2020-04-30 | Vmware, Inc. | Collecting samples hierarchically in a datacenter |
| US11290358B2 (en) | 2019-05-30 | 2022-03-29 | Vmware, Inc. | Partitioning health monitoring in a global server load balancing system |
| CN113542043B (en)* | 2020-04-14 | 2024-06-07 | 中兴通讯股份有限公司 | Data sampling method, device, equipment and medium for network equipment |
| US11533265B2 (en) | 2020-07-23 | 2022-12-20 | Vmware, Inc. | Alleviating flow congestion at forwarding elements |
| US11165676B1 (en)* | 2020-11-11 | 2021-11-02 | Vmware, Inc. | Generating network flow profiles for computing entities |
| US20220237203A1 (en)* | 2021-01-22 | 2022-07-28 | Vmware, Inc. | Method and system for efficiently propagating objects across a federated datacenter |
| US11811861B2 (en) | 2021-05-17 | 2023-11-07 | Vmware, Inc. | Dynamically updating load balancing criteria |
| US11799824B2 (en) | 2021-06-14 | 2023-10-24 | Vmware, Inc. | Method and apparatus for enhanced client persistence in multi-site GSLB deployments |
| US12200008B2 (en) | 2021-07-20 | 2025-01-14 | VMware LLC | Security aware load balancing for a global server load balancing system |
| US12130792B2 (en)* | 2021-12-02 | 2024-10-29 | International Business Machines Corporation | Data merging in distributed computing system |
| US12316601B2 (en) | 2022-07-14 | 2025-05-27 | VMware LLC | Two tier DNS |
| US12107821B2 (en) | 2022-07-14 | 2024-10-01 | VMware LLC | Two tier DNS |
| US12132631B2 (en)* | 2022-09-20 | 2024-10-29 | T-Mobile Usa, Inc. | On-device latency detection |
Family Cites Families (232)
| Publication number | Priority date | Publication date | Assignee | Title |
|---|---|---|---|---|
| US5109486A (en) | 1989-01-06 | 1992-04-28 | Motorola, Inc. | Distributed computer system with network and resource status monitoring |
| US6515968B1 (en) | 1995-03-17 | 2003-02-04 | Worldcom, Inc. | Integrated interface for real time web based viewing of telecommunications network call traffic |
| US5781703A (en) | 1996-09-06 | 1998-07-14 | Candle Distributed Solutions, Inc. | Intelligent remote agent for computer performance monitoring |
| US6714979B1 (en) | 1997-09-26 | 2004-03-30 | Worldcom, Inc. | Data warehousing infrastructure for web based reporting tool |
| US6763376B1 (en) | 1997-09-26 | 2004-07-13 | Mci Communications Corporation | Integrated customer interface system for communications network management |
| US6148335A (en) | 1997-11-25 | 2000-11-14 | International Business Machines Corporation | Performance/capacity management framework over many servers |
| US6804714B1 (en) | 1999-04-16 | 2004-10-12 | Oracle International Corporation | Multidimensional repositories for problem discovery and capacity planning of database applications |
| US6973490B1 (en) | 1999-06-23 | 2005-12-06 | Savvis Communications Corp. | Method and system for object-level web performance and analysis |
| US6449739B1 (en) | 1999-09-01 | 2002-09-10 | Mercury Interactive Corporation | Post-deployment monitoring of server performance |
| US6792458B1 (en) | 1999-10-04 | 2004-09-14 | Urchin Software Corporation | System and method for monitoring and analyzing internet traffic |
| US6901051B1 (en) | 1999-11-15 | 2005-05-31 | Fujitsu Limited | Server-based network performance metrics generation system and method |
| US6754706B1 (en) | 1999-12-16 | 2004-06-22 | Speedera Networks, Inc. | Scalable domain name system with persistence and load balancing |
| US6976090B2 (en) | 2000-04-20 | 2005-12-13 | Actona Technologies Ltd. | Differentiated content and application delivery via internet |
| US8443035B2 (en) | 2000-09-01 | 2013-05-14 | OP40 Holding, Inc. | System and method for collaboration using web browsers |
| US7454500B1 (en) | 2000-09-26 | 2008-11-18 | Foundry Networks, Inc. | Global server load balancing |
| US7111059B1 (en) | 2000-11-10 | 2006-09-19 | Microsoft Corporation | System for gathering and aggregating operational metrics |
| WO2002048866A2 (en) | 2000-12-11 | 2002-06-20 | Microsoft Corporation | Method and system for management of multiple network resources |
| US20020078150A1 (en) | 2000-12-18 | 2002-06-20 | Nortel Networks Limited And Bell Canada | Method of team member profile selection within a virtual team environment |
| US7197559B2 (en) | 2001-05-09 | 2007-03-27 | Mercury Interactive Corporation | Transaction breakdown feature to facilitate analysis of end user performance of a server system |
| US20020198985A1 (en) | 2001-05-09 | 2002-12-26 | Noam Fraenkel | Post-deployment monitoring and analysis of server performance |
| AU2002329611A1 (en) | 2001-07-20 | 2003-03-03 | Altaworks Corporation | System and method for adaptive threshold determination for performance metrics |
| US7231442B2 (en) | 2002-04-03 | 2007-06-12 | Tonic Software, Inc. | Global network monitoring system |
| AU2003276685A1 (en) | 2002-06-13 | 2003-12-31 | Netscout Systems, Inc. | Real-time network performance monitoring system |
| US7877435B2 (en) | 2002-06-20 | 2011-01-25 | International Business Machines Corporation | Method and system for transaction pipeline decomposition |
| WO2004001555A2 (en) | 2002-06-25 | 2003-12-31 | International Business Machines Corporation | Method and system for monitoring performance of application in a distributed environment |
| US6975963B2 (en)* | 2002-09-30 | 2005-12-13 | Mcdata Corporation | Method and system for storing and reporting network performance metrics using histograms |
| US6792460B2 (en) | 2002-10-02 | 2004-09-14 | Mercury Interactive Corporation | System and methods for monitoring application server performance |
| US7246159B2 (en) | 2002-11-01 | 2007-07-17 | Fidelia Technology, Inc | Distributed data gathering and storage for use in a fault and performance monitoring system |
| US20040103186A1 (en) | 2002-11-21 | 2004-05-27 | Fabio Casati | Platform and method for monitoring and analyzing data |
| US7505953B2 (en) | 2003-07-11 | 2009-03-17 | Computer Associates Think, Inc. | Performance monitoring of method calls and database statements in an application server |
| US8776050B2 (en) | 2003-08-20 | 2014-07-08 | Oracle International Corporation | Distributed virtual machine monitor for managing multiple virtual resources across multiple physical nodes |
| US8588069B2 (en) | 2003-08-29 | 2013-11-19 | Ineoquest Technologies, Inc. | System and method for analyzing the performance of multiple transportation streams of streaming media in packet-based networks |
| US20050060574A1 (en) | 2003-09-13 | 2005-03-17 | Finisar Corporation | Network analysis graphical user interface |
| US20050108444A1 (en) | 2003-11-19 | 2005-05-19 | Flauaus Gary R. | Method of detecting and monitoring fabric congestion |
| US7130812B1 (en) | 2003-11-26 | 2006-10-31 | Centergistic Solutions, Inc. | Method and system for managing real time data |
| US20050188221A1 (en) | 2004-02-24 | 2005-08-25 | Covelight Systems, Inc. | Methods, systems and computer program products for monitoring a server application |
| US7701852B1 (en)* | 2004-08-26 | 2010-04-20 | Sprint Communications Company L.P. | Method for analyzing performance of a network through measuring and reporting delay in routing devices |
| CN101044463B (en) | 2004-10-20 | 2010-08-18 | 意大利电信股份公司 | Method and system for monitoring performance of client-server architecture |
| US7743380B2 (en) | 2005-01-21 | 2010-06-22 | Hewlett-Packard Development Company, L.P. | Monitoring clustered software applications |
| US9160792B2 (en) | 2005-04-05 | 2015-10-13 | International Business Machines Corporation | On-demand global server load balancing system and method of use |
| US7990847B1 (en) | 2005-04-15 | 2011-08-02 | Cisco Technology, Inc. | Method and system for managing servers in a server cluster |
| US7743128B2 (en) | 2005-04-20 | 2010-06-22 | Netqos, Inc. | Method and system for visualizing network performance characteristics |
| US7895012B2 (en)* | 2005-05-03 | 2011-02-22 | Hewlett-Packard Development Company, L.P. | Systems and methods for organizing and storing data |
| US20060271677A1 (en) | 2005-05-24 | 2006-11-30 | Mercier Christina W | Policy based data path management, asset management, and monitoring |
| US8032896B1 (en)* | 2005-11-01 | 2011-10-04 | Netapp, Inc. | System and method for histogram based chatter suppression |
| US7653670B2 (en) | 2005-11-28 | 2010-01-26 | Nec Laboratories America, Inc. | Storage-efficient and collision-free hash-based packet processing architecture and method |
| US7558985B2 (en) | 2006-02-13 | 2009-07-07 | Sun Microsystems, Inc. | High-efficiency time-series archival system for telemetry signals |
| US9047648B1 (en) | 2006-03-30 | 2015-06-02 | At&T Mobility Ii Llc | Measurement, collection, reporting and processing of health condition data |
| US8555287B2 (en) | 2006-08-31 | 2013-10-08 | Bmc Software, Inc. | Automated capacity provisioning method using historical performance data |
| US8627402B2 (en) | 2006-09-19 | 2014-01-07 | The Invention Science Fund I, Llc | Evaluation systems and methods for coordinating software agents |
| US8874725B1 (en) | 2006-11-15 | 2014-10-28 | Conviva Inc. | Monitoring the performance of a content player |
| US8769120B2 (en) | 2006-11-28 | 2014-07-01 | Sap Ag | Method and system to monitor parameters of a data flow path in a communication system |
| US9026655B2 (en) | 2007-01-31 | 2015-05-05 | Oracle America, Inc. | Method and system for load balancing |
| US7979895B2 (en) | 2007-08-16 | 2011-07-12 | International Business Machines Corporation | System and method for partitioning a multi-level security namespace |
| US8131712B1 (en) | 2007-10-15 | 2012-03-06 | Google Inc. | Regional indexes |
| US8001365B2 (en) | 2007-12-13 | 2011-08-16 | Telefonaktiebolaget L M Ericsson (Publ) | Exchange of processing metric information between nodes |
| US8261278B2 (en) | 2008-02-01 | 2012-09-04 | Ca, Inc. | Automatic baselining of resource consumption for transactions |
| US8412493B2 (en) | 2008-12-22 | 2013-04-02 | International Business Machines Corporation | Multi-dimensional model generation for determining service performance |
| US8170491B2 (en)* | 2009-05-04 | 2012-05-01 | Qualcomm Incorporated | System and method for real-time performance and load statistics of a communications system |
| US8037076B2 (en) | 2009-05-11 | 2011-10-11 | Red Hat, Inc. | Federated indexing from hashed primary key slices |
| US9830192B1 (en) | 2014-11-10 | 2017-11-28 | Turbonomic, Inc. | Managing application performance in virtualization systems |
| WO2011063269A1 (en) | 2009-11-20 | 2011-05-26 | Alert Enterprise, Inc. | Method and apparatus for risk visualization and remediation |
| WO2011071850A2 (en) | 2009-12-07 | 2011-06-16 | Coach Wei | System and method for website performance optimization and internet traffic processing |
| US10289636B2 (en) | 2010-02-08 | 2019-05-14 | Here Global B.V. | Virtual table generator for analyzing geographic databases |
| US9535805B2 (en) | 2010-03-04 | 2017-01-03 | Microsoft Technology Licensing, Llc | Resilient routing for session initiation protocol based communication systems |
| US8533337B2 (en) | 2010-05-06 | 2013-09-10 | Citrix Systems, Inc. | Continuous upgrading of computers in a load balanced environment |
| WO2012027478A1 (en) | 2010-08-24 | 2012-03-01 | Jay Moorthi | Method and apparatus for clearing cloud compute demand |
| US9092561B2 (en) | 2010-10-20 | 2015-07-28 | Microsoft Technology Licensing, Llc | Model checking for distributed application validation |
| US8667138B2 (en) | 2010-10-29 | 2014-03-04 | Cisco Technology, Inc. | Distributed hierarchical rendering and provisioning of cloud services |
| US8499066B1 (en) | 2010-11-19 | 2013-07-30 | Amazon Technologies, Inc. | Predicting long-term computing resource usage |
| US10740353B2 (en) | 2010-12-23 | 2020-08-11 | Mongodb, Inc. | Systems and methods for managing distributed database deployments |
| JP5843459B2 (en) | 2011-03-30 | 2016-01-13 | インターナショナル・ビジネス・マシーンズ・コーポレーションInternational Business Machines Corporation | Information processing system, information processing apparatus, scaling method, program, and recording medium |
| US8806018B2 (en) | 2011-04-01 | 2014-08-12 | Carnegie Mellon University | Dynamic capacity management of multiple parallel-connected computing resources |
| US9292682B2 (en) | 2011-05-09 | 2016-03-22 | International Business Machines Corporation | Accessing a second web page from a dispersed storage network memory based on a first web page selection |
| US8713378B2 (en) | 2011-07-07 | 2014-04-29 | Microsoft Corporation | Health monitoring of applications in a guest partition |
| US9495222B1 (en) | 2011-08-26 | 2016-11-15 | Dell Software Inc. | Systems and methods for performance indexing |
| US9252979B2 (en) | 2011-10-01 | 2016-02-02 | Oracle International Corporation | Transparent configuration of virtual hosts supporting multiple time zones in an enterprise platform |
| US9329904B2 (en) | 2011-10-04 | 2016-05-03 | Tier 3, Inc. | Predictive two-dimensional autoscaling |
| US8856797B1 (en) | 2011-10-05 | 2014-10-07 | Amazon Technologies, Inc. | Reactive auto-scaling of capacity |
| US20130091266A1 (en) | 2011-10-05 | 2013-04-11 | Ajit Bhave | System for organizing and fast searching of massive amounts of data |
| US9697316B1 (en)* | 2011-12-13 | 2017-07-04 | Amazon Technologies, Inc. | System and method for efficient data aggregation with sparse exponential histogram |
| US9083710B1 (en) | 2012-01-03 | 2015-07-14 | Google Inc. | Server load balancing using minimally disruptive hash tables |
| US9170849B2 (en) | 2012-01-09 | 2015-10-27 | Microsoft Technology Licensing, Llc | Migration of task to different pool of resources based on task retry count during task lease |
| US20130179289A1 (en) | 2012-01-09 | 2013-07-11 | Microsoft Corportaion | Pricing of resources in virtual machine pools |
| US20130179894A1 (en) | 2012-01-09 | 2013-07-11 | Microsoft Corporation | Platform as a service job scheduling |
| US9372735B2 (en) | 2012-01-09 | 2016-06-21 | Microsoft Technology Licensing, Llc | Auto-scaling of pool of virtual machines based on auto-scaling rules of user associated with the pool |
| US9477936B2 (en) | 2012-02-09 | 2016-10-25 | Rockwell Automation Technologies, Inc. | Cloud-based operator interface for industrial automation |
| US9246777B2 (en) | 2012-02-14 | 2016-01-26 | Hitachi, Ltd. | Computer program and monitoring apparatus |
| US20210349749A1 (en) | 2012-02-14 | 2021-11-11 | Aloke Guha | Systems and methods for dynamic provisioning of resources for virtualized |
| US8918510B2 (en) | 2012-04-27 | 2014-12-23 | Hewlett-Packard Development Company, L. P. | Evaluation of cloud computing services |
| US9329915B1 (en) | 2012-05-08 | 2016-05-03 | Amazon Technologies, Inc. | System and method for testing in a production environment |
| US9729414B1 (en) | 2012-05-21 | 2017-08-08 | Thousandeyes, Inc. | Monitoring service availability using distributed BGP routing feeds |
| US9071537B2 (en) | 2012-06-15 | 2015-06-30 | Citrix Systems, Inc. | Systems and methods for propagating health of a cluster node |
| US10404556B2 (en) | 2012-06-22 | 2019-09-03 | Microsoft Technology Licensing, Llc | Methods and computer program products for correlation analysis of network traffic in a network device |
| US9378112B2 (en) | 2012-06-25 | 2016-06-28 | International Business Machines Corporation | Predictive alert threshold determination tool |
| US9262253B2 (en)* | 2012-06-28 | 2016-02-16 | Microsoft Technology Licensing, Llc | Middlebox reliability |
| US9052955B2 (en) | 2012-07-25 | 2015-06-09 | Cisco Technology, Inc. | System and method for seamless application hosting and migration in a network environment |
| US9161064B2 (en) | 2012-08-23 | 2015-10-13 | Adobe Systems Incorporated | Auto-scaling management of web content |
| US9071609B2 (en) | 2012-10-08 | 2015-06-30 | Google Technology Holdings LLC | Methods and apparatus for performing dynamic load balancing of processing resources |
| US9374276B2 (en) | 2012-11-01 | 2016-06-21 | Microsoft Technology Licensing, Llc | CDN traffic management in the cloud |
| US9537973B2 (en) | 2012-11-01 | 2017-01-03 | Microsoft Technology Licensing, Llc | CDN load balancing in the cloud |
| US9256452B1 (en) | 2012-11-14 | 2016-02-09 | Amazon Technologies, Inc. | Providing an instance availability estimate |
| US9280437B2 (en) | 2012-11-20 | 2016-03-08 | Bank Of America Corporation | Dynamically scalable real-time system monitoring |
| WO2014093932A1 (en) | 2012-12-14 | 2014-06-19 | Biscotti Inc. | Mobile presence detection |
| US9819729B2 (en) | 2012-12-21 | 2017-11-14 | Bmc Software, Inc. | Application monitoring for cloud-based architectures |
| US9032078B2 (en) | 2013-01-02 | 2015-05-12 | International Business Machines Corporation | Predictive scaling for clusters |
| US9331952B2 (en) | 2013-01-02 | 2016-05-03 | International Business Machines Corporation | Modifying an assignment of nodes to roles in a computing environment |
| US9332028B2 (en) | 2013-01-25 | 2016-05-03 | REMTCS Inc. | System, method, and apparatus for providing network security |
| US9191402B2 (en) | 2013-01-25 | 2015-11-17 | Opendns, Inc. | Domain classification based on client request behavior |
| US9762471B2 (en) | 2013-01-26 | 2017-09-12 | F5 Networks, Inc. | Methods and systems for estimating and analyzing flow activity and path performance data in cloud or distributed systems |
| US9256573B2 (en) | 2013-02-14 | 2016-02-09 | International Business Machines Corporation | Dynamic thread status retrieval using inter-thread communication |
| US9378306B2 (en)* | 2013-03-12 | 2016-06-28 | Business Objects Software Ltd. | Binning visual definition for visual intelligence |
| US9817699B2 (en) | 2013-03-13 | 2017-11-14 | Elasticbox Inc. | Adaptive autoscaling for virtualized applications |
| US9124490B2 (en) | 2013-03-15 | 2015-09-01 | Comcast Cable Communications, Llc | Consolidated performance metric analysis |
| US9477500B2 (en) | 2013-03-15 | 2016-10-25 | Avi Networks | Managing and controlling a distributed network service platform |
| US9596299B2 (en) | 2013-04-06 | 2017-03-14 | Citrix Systems, Inc. | Systems and methods for dynamically expanding load balancing pool |
| US9459980B1 (en) | 2013-04-17 | 2016-10-04 | Amazon Technologies, Inc. | Varying cluster sizes in a predictive test load while testing a productive system |
| US9491063B2 (en) | 2013-05-15 | 2016-11-08 | Telefonaktiebolaget Lm Ericsson (Publ) | Method and apparatus for providing network services orchestration |
| US9495420B2 (en) | 2013-05-22 | 2016-11-15 | International Business Machines Corporation | Distributed feature collection and correlation engine |
| US9288193B1 (en) | 2013-06-25 | 2016-03-15 | Intuit Inc. | Authenticating cloud services |
| CN103365695B (en) | 2013-07-31 | 2017-04-26 | 广州市动景计算机科技有限公司 | Method and device for increasing sub-resource loading speed |
| US9450700B1 (en) | 2013-08-05 | 2016-09-20 | Amazon Technologies, Inc. | Efficient network fleet monitoring |
| US9491164B1 (en) | 2013-08-21 | 2016-11-08 | NetSuite Inc. | System and method for importing heterogeneous hashed passwords |
| US9412075B2 (en) | 2013-08-23 | 2016-08-09 | Vmware, Inc. | Automated scaling of multi-tier applications using reinforced learning |
| US9386086B2 (en) | 2013-09-11 | 2016-07-05 | Cisco Technology Inc. | Dynamic scaling for multi-tiered distributed systems using payoff optimization of application classes |
| US20150081880A1 (en) | 2013-09-17 | 2015-03-19 | Stackdriver, Inc. | System and method of monitoring and measuring performance relative to expected performance characteristics for applications and software architecture hosted by an iaas provider |
| US9998530B2 (en) | 2013-10-15 | 2018-06-12 | Nicira, Inc. | Distributed global load-balancing system for software-defined data centers |
| US9876711B2 (en)* | 2013-11-05 | 2018-01-23 | Cisco Technology, Inc. | Source address translation in overlay networks |
| US9571516B1 (en) | 2013-11-08 | 2017-02-14 | Skyhigh Networks, Inc. | Cloud service usage monitoring system |
| US10185937B1 (en) | 2013-11-11 | 2019-01-22 | Amazon Technologies, Inc. | Workflow support for an annotations-based generic load generator |
| JP6248560B2 (en) | 2013-11-13 | 2017-12-20 | 富士通株式会社 | Management program, management method, and management apparatus |
| US9608932B2 (en) | 2013-12-10 | 2017-03-28 | International Business Machines Corporation | Software-defined networking single-source enterprise workload manager |
| US9300552B2 (en) | 2013-12-16 | 2016-03-29 | International Business Machines Corporation | Scaling a cloud infrastructure |
| KR20150083713A (en) | 2014-01-10 | 2015-07-20 | 삼성전자주식회사 | Electronic device and method for managing resource |
| US9678800B2 (en) | 2014-01-30 | 2017-06-13 | International Business Machines Corporation | Optimum design method for configuration of servers in a data center environment |
| US9577940B2 (en) | 2014-02-25 | 2017-02-21 | International Business Machines Corporation | Identity-aware load balancing |
| US10237135B1 (en) | 2014-03-04 | 2019-03-19 | Amazon Technologies, Inc. | Computing optimization |
| WO2015132945A1 (en) | 2014-03-07 | 2015-09-11 | 株式会社日立製作所 | Performance evaluation method and information processing device |
| US10003550B1 (en) | 2014-03-14 | 2018-06-19 | Amazon Technologies | Smart autoscaling of a cluster for processing a work queue in a distributed system |
| US9842039B2 (en) | 2014-03-31 | 2017-12-12 | Microsoft Technology Licensing, Llc | Predictive load scaling for services |
| US9619770B2 (en) | 2014-04-05 | 2017-04-11 | Parsable, Inc. | Systems and methods for digital workflow and communication |
| US10523521B2 (en) | 2014-04-15 | 2019-12-31 | Splunk Inc. | Managing ephemeral event streams generated from captured network data |
| US10360196B2 (en) | 2014-04-15 | 2019-07-23 | Splunk Inc. | Grouping and managing event streams generated from captured network data |
| US10700950B2 (en) | 2014-04-15 | 2020-06-30 | Splunk Inc. | Adjusting network data storage based on event stream statistics |
| US9979617B1 (en) | 2014-05-15 | 2018-05-22 | Amazon Technologies, Inc. | Techniques for controlling scaling behavior of resources |
| US8977728B1 (en) | 2014-05-16 | 2015-03-10 | Iboss, Inc. | Maintaining IP tables |
| US9619548B2 (en) | 2014-05-20 | 2017-04-11 | Google Inc. | Dimension widening aggregate data |
| US9692811B1 (en) | 2014-05-23 | 2017-06-27 | Amazon Technologies, Inc. | Optimization of application parameters |
| US9626275B1 (en) | 2014-06-05 | 2017-04-18 | Amazon Technologies, Inc. | Dynamic rate adjustment for interaction monitoring |
| US9674302B1 (en) | 2014-06-13 | 2017-06-06 | Amazon Technologies, Inc. | Computing resource transition notification and pending state |
| US9712410B1 (en) | 2014-06-25 | 2017-07-18 | Amazon Technologies, Inc. | Local metrics in a service provider environment |
| US10432699B2 (en)* | 2014-06-26 | 2019-10-01 | Vmware, Inc. | Crowd-sourced operational metric analysis of virtual appliances |
| KR102295966B1 (en) | 2014-08-27 | 2021-09-01 | 삼성전자주식회사 | Method of Fabricating Semiconductor Devices Using Nanowires |
| US9935829B1 (en) | 2014-09-24 | 2018-04-03 | Amazon Technologies, Inc. | Scalable packet processing service |
| JP6438719B2 (en) | 2014-09-24 | 2018-12-19 | 株式会社日立製作所 | Communication system and communication program |
| US9935864B2 (en) | 2014-09-30 | 2018-04-03 | Splunk Inc. | Service analyzer interface |
| US9825881B2 (en) | 2014-09-30 | 2017-11-21 | Sony Interactive Entertainment America Llc | Methods and systems for portably deploying applications on one or more cloud systems |
| US10467036B2 (en) | 2014-09-30 | 2019-11-05 | International Business Machines Corporation | Dynamic metering adjustment for service management of computing platform |
| US10171371B2 (en) | 2014-09-30 | 2019-01-01 | International Business Machines Corporation | Scalable metering for cloud service management based on cost-awareness |
| US9798883B1 (en)* | 2014-10-06 | 2017-10-24 | Exabeam, Inc. | System, method, and computer program product for detecting and assessing security risks in a network |
| US9210056B1 (en) | 2014-10-09 | 2015-12-08 | Splunk Inc. | Service monitoring interface |
| US9547534B2 (en) | 2014-10-10 | 2017-01-17 | International Business Machines Corporation | Autoscaling applications in shared cloud resources |
| CN107534886B (en) | 2014-10-30 | 2021-06-01 | 适应性频谱和信号校正股份有限公司 | Method and apparatus for providing performance and usage information for wireless local area networks |
| US9613120B1 (en) | 2014-11-11 | 2017-04-04 | Amazon Technologies, Inc. | Replicated database startup for common database storage |
| US10355934B2 (en) | 2014-12-03 | 2019-07-16 | Amazon Technologies, Inc. | Vertical scaling of computing instances |
| WO2016093887A1 (en) | 2014-12-12 | 2016-06-16 | Hewlett Packard Enterprise Development Lp | Cloud service tuning |
| US9614782B2 (en) | 2014-12-23 | 2017-04-04 | Facebook, Inc. | Continuous resource pool balancing |
| US20180004582A1 (en) | 2015-01-19 | 2018-01-04 | Telefonaktiebolaget Lm Ericsson (Publ) | Timers in stateless architecture |
| US10261851B2 (en)* | 2015-01-23 | 2019-04-16 | Lightbend, Inc. | Anomaly detection using circumstance-specific detectors |
| CA2975248A1 (en) | 2015-01-30 | 2016-08-04 | Nec Corporation | Node system, server apparatus, scaling control method, and program |
| US9608880B1 (en) | 2015-02-19 | 2017-03-28 | Dell Products L.P. | Systems and methods for real-time performance monitoring |
| US9467476B1 (en) | 2015-03-13 | 2016-10-11 | Varmour Networks, Inc. | Context aware microsegmentation |
| US11283697B1 (en) | 2015-03-24 | 2022-03-22 | Vmware, Inc. | Scalable real time metrics management |
| US9825875B2 (en) | 2015-03-31 | 2017-11-21 | Alcatel Lucent | Method and apparatus for provisioning resources using clustering |
| US10412020B2 (en) | 2015-04-30 | 2019-09-10 | Amazon Technologies, Inc. | Background processes in update load balancers of an auto scaling group |
| US9848041B2 (en) | 2015-05-01 | 2017-12-19 | Amazon Technologies, Inc. | Automatic scaling of resource instance groups within compute clusters |
| US10789542B2 (en) | 2015-06-05 | 2020-09-29 | Apple Inc. | System and method for predicting changes in network quality |
| WO2016200921A1 (en)* | 2015-06-09 | 2016-12-15 | Machine Zone, Inc. | Distributed scalable workload testing |
| US9910755B2 (en) | 2015-06-26 | 2018-03-06 | Amazon Technologies, Inc. | Retrieval of authoritative measurement data from in-memory datastores |
| US9882830B2 (en) | 2015-06-26 | 2018-01-30 | Amazon Technologies, Inc. | Architecture for metrics aggregation without service partitioning |
| US9959188B1 (en) | 2015-07-02 | 2018-05-01 | Amazon Technologies, Inc. | Managing processor usage of a physical host configured for hosting computing instances |
| US11115273B2 (en) | 2015-07-13 | 2021-09-07 | Telefonaktiebolaget Lm Ericsson (Publ) | Analytics-driven dynamic network design and configuration |
| US20170041386A1 (en) | 2015-08-05 | 2017-02-09 | International Business Machines Corporation | Provisioning a target hosting environment |
| US10594562B1 (en) | 2015-08-25 | 2020-03-17 | Vmware, Inc. | Intelligent autoscale of services |
| US10313211B1 (en) | 2015-08-25 | 2019-06-04 | Avi Networks | Distributed network service risk monitoring and scoring |
| US9912610B2 (en) | 2015-09-24 | 2018-03-06 | Barefoot Networks, Inc. | Data-plane stateful processing units in packet processing pipelines |
| US9531614B1 (en) | 2015-10-30 | 2016-12-27 | AppDynamics, Inc. | Network aware distributed business transaction anomaly detection |
| US10419530B2 (en) | 2015-11-02 | 2019-09-17 | Telefonaktiebolaget Lm Ericsson (Publ) | System and methods for intelligent service function placement and autoscale based on machine learning |
| US9967275B1 (en)* | 2015-12-17 | 2018-05-08 | EMC IP Holding Company LLC | Efficient detection of network anomalies |
| US9749888B1 (en)* | 2015-12-21 | 2017-08-29 | Headspin, Inc. | System for network characteristic assessment |
| EP3193227B1 (en)* | 2016-01-04 | 2021-02-03 | Siemens Aktiengesellschaft | Entropy-based validation of sensor measurements |
| US10212041B1 (en) | 2016-03-04 | 2019-02-19 | Avi Networks | Traffic pattern detection and presentation in container-based cloud computing architecture |
| US10931548B1 (en) | 2016-03-28 | 2021-02-23 | Vmware, Inc. | Collecting health monitoring data pertaining to an application from a selected set of service engines |
| US10469251B2 (en) | 2016-05-05 | 2019-11-05 | Auburn University | System and method for preemptive self-healing security |
| US9716617B1 (en) | 2016-06-14 | 2017-07-25 | ShieldX Networks, Inc. | Dynamic, load-based, auto-scaling network security microservices architecture |
| US10467293B2 (en)* | 2017-05-18 | 2019-11-05 | Aetna Inc. | Scalable distributed computing system for determining exact median and other quantiles in big data applications |
| US10972437B2 (en) | 2016-08-08 | 2021-04-06 | Talari Networks Incorporated | Applications and integrated firewall design in an adaptive private network (APN) |
| US10089135B2 (en) | 2016-08-09 | 2018-10-02 | International Business Machines Corporation | Expediting the provisioning of virtual machines based on cached repeated portions of a template |
| US10367757B2 (en) | 2016-08-27 | 2019-07-30 | Nicira, Inc. | Extension of network control system into public cloud |
| US10606857B2 (en) | 2016-09-26 | 2020-03-31 | Splunk Inc. | In-memory metrics catalog |
| US20180088935A1 (en) | 2016-09-27 | 2018-03-29 | Ca, Inc. | Microservices application configuration based on runtime environment |
| US20180136931A1 (en) | 2016-11-14 | 2018-05-17 | Ca, Inc. | Affinity of microservice containers |
| US10157085B2 (en) | 2017-02-17 | 2018-12-18 | Sas Institute Inc. | Techniques for decentralized load balancing |
| US10372600B2 (en) | 2017-03-01 | 2019-08-06 | Salesforce.Com, Inc. | Systems and methods for automated web performance testing for cloud apps in use-case scenarios |
| US10630543B1 (en) | 2017-03-17 | 2020-04-21 | Amazon Technologies, Inc. | Wireless mesh network implementation for IOT devices |
| US10868742B2 (en) | 2017-03-29 | 2020-12-15 | Juniper Networks, Inc. | Multi-cluster dashboard for distributed virtualization infrastructure element monitoring and policy control |
| US10673714B1 (en) | 2017-03-29 | 2020-06-02 | Juniper Networks, Inc. | Network dashboard with multifaceted utilization visualizations |
| US10757075B2 (en) | 2017-04-14 | 2020-08-25 | Calix, Inc. | Device specific website filtering using a bifurcated domain name system |
| US10873541B2 (en) | 2017-04-17 | 2020-12-22 | Microsoft Technology Licensing, Llc | Systems and methods for proactively and reactively allocating resources in cloud-based networks |
| WO2018200757A1 (en) | 2017-04-25 | 2018-11-01 | Nutanix, Inc. | Systems and methods for networked microservice modeling |
| WO2018201084A1 (en) | 2017-04-28 | 2018-11-01 | Opanga Networks, Inc. | System and method for tracking domain names for the purposes of network management |
| US10623470B2 (en) | 2017-06-14 | 2020-04-14 | International Business Machines Corporation | Optimizing internet data transfers using an intelligent router agent |
| US10523748B2 (en) | 2017-12-22 | 2019-12-31 | A10 Networks, Inc. | Managing health status of network devices in a distributed global server load balancing system |
| US11102118B2 (en) | 2018-03-22 | 2021-08-24 | Futurewei Technologies, Inc. | System and method for supporting ICN-within-IP networking |
| US10728121B1 (en) | 2018-05-23 | 2020-07-28 | Juniper Networks, Inc. | Dashboard for graphic display of computer network topology |
| US10999168B1 (en) | 2018-05-30 | 2021-05-04 | Vmware, Inc. | User defined custom metrics |
| WO2020086956A1 (en) | 2018-10-26 | 2020-04-30 | Vmware, Inc. | Collecting samples hierarchically in a datacenter |
| US10977140B2 (en) | 2018-11-06 | 2021-04-13 | International Business Machines Corporation | Fault tolerant distributed system to monitor, recover and scale load balancers |
| US10887196B2 (en)* | 2018-11-28 | 2021-01-05 | Microsoft Technology Licensing, Llc | Efficient metric calculation with recursive data processing |
| US10789102B2 (en) | 2019-01-09 | 2020-09-29 | Microsoft Technology Licensing, Llc | Resource provisioning in computing systems |
| US10853082B1 (en) | 2019-04-30 | 2020-12-01 | Splunk Inc. | Pipeline set selection based on duty cycle estimation of pipeline threads |
| US11290358B2 (en) | 2019-05-30 | 2022-03-29 | Vmware, Inc. | Partitioning health monitoring in a global server load balancing system |
| US11240294B2 (en) | 2019-08-23 | 2022-02-01 | Samsung Electronics Co., Ltd. | Systems and methods for spike detection and load balancing resource management |
| US11755385B2 (en) | 2020-05-29 | 2023-09-12 | Vmware, Inc. | Cross-cluster load balancer |
| US11609794B2 (en) | 2020-11-10 | 2023-03-21 | Oracle International Corporation | Techniques for modifying cluster computing environments |
| US20220237203A1 (en) | 2021-01-22 | 2022-07-28 | Vmware, Inc. | Method and system for efficiently propagating objects across a federated datacenter |
| WO2022235651A1 (en) | 2021-05-03 | 2022-11-10 | Avesha, Inc. | Distributed computing system with multi tenancy based on application slices |
| US11811861B2 (en) | 2021-05-17 | 2023-11-07 | Vmware, Inc. | Dynamically updating load balancing criteria |
| US11799824B2 (en) | 2021-06-14 | 2023-10-24 | Vmware, Inc. | Method and apparatus for enhanced client persistence in multi-site GSLB deployments |
| US20230018908A1 (en) | 2021-07-19 | 2023-01-19 | Vmware, Inc. | Feedback-based control system for software defined networks |
| US20230024475A1 (en) | 2021-07-20 | 2023-01-26 | Vmware, Inc. | Security aware load balancing for a global server load balancing system |
| US12200008B2 (en) | 2021-07-20 | 2025-01-14 | VMware LLC | Security aware load balancing for a global server load balancing system |
- 2019
- 2019-10-25WOPCT/US2019/058054patent/WO2020086956A1/ennot_activeCeased
- 2019-10-25EPEP23183090.2Apatent/EP4239484A3/enactivePending
- 2019-10-25EPEP19805453.8Apatent/EP3857381B1/enactiveActive
- 2019-10-25CNCN201980058045.5Apatent/CN112703487B/enactiveActive
- 2019-10-25USUS16/663,360patent/US11044180B2/ennot_activeExpired - Fee Related
- 2019-10-30USUS16/669,227patent/US11171849B2/enactiveActive
- 2021
- 2021-11-08USUS17/521,771patent/US11736372B2/enactiveActive
Also Published As
| Publication number | Publication date |
|---|---|
| EP4239484A2 (en) | 2023-09-06 |
| US20200136942A1 (en) | 2020-04-30 |
| US20220141102A1 (en) | 2022-05-05 |
| CN112703487A (en) | 2021-04-23 |
| EP3857381A1 (en) | 2021-08-04 |
| CN112703487B (en) | 2024-08-27 |
| US11736372B2 (en) | 2023-08-22 |
| US11044180B2 (en) | 2021-06-22 |
| US20200136939A1 (en) | 2020-04-30 |
| US11171849B2 (en) | 2021-11-09 |
| WO2020086956A1 (en) | 2020-04-30 |
| EP4239484A3 (en) | 2024-01-03 |
Similar Documents
| Publication | Publication Date | Title |
|---|---|---|
| EP3857381B1 (en) | Collecting samples hierarchically in a datacenter | |
| US11411825B2 (en) | In intelligent autoscale of services | |
| US11347518B2 (en) | System and method for adaptively sampling application programming interface execution traces based on clustering | |
| US20210342193A1 (en) | Multi-cluster container orchestration | |
| Zhu et al. | A performance interference model for managing consolidated workloads in QoS-aware clouds | |
| US11487588B2 (en) | Auto-sizing for stream processing applications | |
| US11275667B2 (en) | Handling of workload surges in a software application | |
| US8555276B2 (en) | Systems and methods for transparently optimizing workloads | |
| US11283697B1 (en) | Scalable real time metrics management | |
| US20140196054A1 (en) | Ensuring performance of a computing system | |
| US9442817B2 (en) | Diagnosis of application server performance problems via thread level pattern analysis | |
| US8954563B2 (en) | Event enrichment using data correlation | |
| US10419303B2 (en) | Real-time ranking of monitored entities | |
| US20230222004A1 (en) | Data locality for big data on kubernetes | |
| Stewart et al. | Entomomodel: Understanding and avoiding performance anomaly manifestations | |
| US11171846B1 (en) | Log throttling | |
| WO2023039711A1 (en) | Efficiency engine in a cloud computing architecture | |
| US10908969B2 (en) | Model driven dynamic management of enterprise workloads through adaptive tiering | |
| US20200151002A1 (en) | Identifying a delay associated with an input/output interrupt | |
| US10673937B2 (en) | Dynamic record-level sharing (RLS) provisioning inside a data-sharing subsystem | |
| US11962659B1 (en) | Adaptive discovery process scheduling | |
| US20250117239A1 (en) | System and method for analyzing resource elasticity profiles of computing environments | |
| Kanizo et al. | Efficient use of geographically spread cloud resources | |
| Lin et al. | The adaptive load balancing algorithm in cloud computing | |
| Elijorde et al. | Reliable and Energy Efficient Cloud Resource Provisioning Through Workload Clustering and SLA-Aware VM Assignment |
Legal Events
| Date | Code | Title | Description |
|---|---|---|---|
| STAA | Information on the status of an ep patent application or granted ep patent | Free format text:STATUS: UNKNOWN | |
| STAA | Information on the status of an ep patent application or granted ep patent | Free format text:STATUS: THE INTERNATIONAL PUBLICATION HAS BEEN MADE | |
| PUAI | Public reference made under article 153(3) epc to a published international application that has entered the european phase | Free format text:ORIGINAL CODE: 0009012 | |
| STAA | Information on the status of an ep patent application or granted ep patent | Free format text:STATUS: REQUEST FOR EXAMINATION WAS MADE | |
| 17P | Request for examination filed | Effective date:20210426 | |
| AK | Designated contracting states | Kind code of ref document:A1 Designated state(s):AL AT BE BG CH CY CZ DE DK EE ES FI FR GB GR HR HU IE IS IT LI LT LU LV MC MK MT NL NO PL PT RO RS SE SI SK SM TR | |
| DAV | Request for validation of the european patent (deleted) | ||
| DAX | Request for extension of the european patent (deleted) | ||
| STAA | Information on the status of an ep patent application or granted ep patent | Free format text:STATUS: EXAMINATION IS IN PROGRESS | |
| 17Q | First examination report despatched | Effective date:20220307 | |
| GRAP | Despatch of communication of intention to grant a patent | Free format text:ORIGINAL CODE: EPIDOSNIGR1 | |
| STAA | Information on the status of an ep patent application or granted ep patent | Free format text:STATUS: GRANT OF PATENT IS INTENDED | |
| INTG | Intention to grant announced | Effective date:20230208 | |
| GRAS | Grant fee paid | Free format text:ORIGINAL CODE: EPIDOSNIGR3 | |
| GRAA | (expected) grant | Free format text:ORIGINAL CODE: 0009210 | |
| STAA | Information on the status of an ep patent application or granted ep patent | Free format text:STATUS: THE PATENT HAS BEEN GRANTED | |
| AK | Designated contracting states | Kind code of ref document:B1 Designated state(s):AL AT BE BG CH CY CZ DE DK EE ES FI FR GB GR HR HU IE IS IT LI LT LU LV MC MK MT NL NO PL PT RO RS SE SI SK SM TR | |
| REG | Reference to a national code | Ref country code:CH Ref legal event code:EP | |
| REG | Reference to a national code | Ref country code:IE Ref legal event code:FG4D | |
| REG | Reference to a national code | Ref country code:DE Ref legal event code:R096 Ref document number:602019032710 Country of ref document:DE | |
| REG | Reference to a national code | Ref country code:LT Ref legal event code:MG9D | |
| REG | Reference to a national code | Ref country code:NL Ref legal event code:MP Effective date:20230712 | |
| REG | Reference to a national code | Ref country code:AT Ref legal event code:MK05 Ref document number:1587860 Country of ref document:AT Kind code of ref document:T Effective date:20230712 | |
| PG25 | Lapsed in a contracting state [announced via postgrant information from national office to epo] | Ref country code:NL Free format text:LAPSE BECAUSE OF FAILURE TO SUBMIT A TRANSLATION OF THE DESCRIPTION OR TO PAY THE FEE WITHIN THE PRESCRIBED TIME-LIMIT Effective date:20230712 | |
| PG25 | Lapsed in a contracting state [announced via postgrant information from national office to epo] | Ref country code:GR Free format text:LAPSE BECAUSE OF FAILURE TO SUBMIT A TRANSLATION OF THE DESCRIPTION OR TO PAY THE FEE WITHIN THE PRESCRIBED TIME-LIMIT Effective date:20231013 | |
| PG25 | Lapsed in a contracting state [announced via postgrant information from national office to epo] | Ref country code:ES Free format text:LAPSE BECAUSE OF FAILURE TO SUBMIT A TRANSLATION OF THE DESCRIPTION OR TO PAY THE FEE WITHIN THE PRESCRIBED TIME-LIMIT Effective date:20230712 | |
| PG25 | Lapsed in a contracting state [announced via postgrant information from national office to epo] | Ref country code:IS Free format text:LAPSE BECAUSE OF FAILURE TO SUBMIT A TRANSLATION OF THE DESCRIPTION OR TO PAY THE FEE WITHIN THE PRESCRIBED TIME-LIMIT Effective date:20231112 | |
| PG25 | Lapsed in a contracting state [announced via postgrant information from national office to epo] | Ref country code:SE Free format text:LAPSE BECAUSE OF FAILURE TO SUBMIT A TRANSLATION OF THE DESCRIPTION OR TO PAY THE FEE WITHIN THE PRESCRIBED TIME-LIMIT Effective date:20230712 Ref country code:RS Free format text:LAPSE BECAUSE OF FAILURE TO SUBMIT A TRANSLATION OF THE DESCRIPTION OR TO PAY THE FEE WITHIN THE PRESCRIBED TIME-LIMIT Effective date:20230712 Ref country code:PT Free format text:LAPSE BECAUSE OF FAILURE TO SUBMIT A TRANSLATION OF THE DESCRIPTION OR TO PAY THE FEE WITHIN THE PRESCRIBED TIME-LIMIT Effective date:20231113 Ref country code:NO Free format text:LAPSE BECAUSE OF FAILURE TO SUBMIT A TRANSLATION OF THE DESCRIPTION OR TO PAY THE FEE WITHIN THE PRESCRIBED TIME-LIMIT Effective date:20231012 Ref country code:LV Free format text:LAPSE BECAUSE OF FAILURE TO SUBMIT A TRANSLATION OF THE DESCRIPTION OR TO PAY THE FEE WITHIN THE PRESCRIBED TIME-LIMIT Effective date:20230712 Ref country code:LT Free format text:LAPSE BECAUSE OF FAILURE TO SUBMIT A TRANSLATION OF THE DESCRIPTION OR TO PAY THE FEE WITHIN THE PRESCRIBED TIME-LIMIT Effective date:20230712 Ref country code:IS Free format text:LAPSE BECAUSE OF FAILURE TO SUBMIT A TRANSLATION OF THE DESCRIPTION OR TO PAY THE FEE WITHIN THE PRESCRIBED TIME-LIMIT Effective date:20231112 Ref country code:HR Free format text:LAPSE BECAUSE OF FAILURE TO SUBMIT A TRANSLATION OF THE DESCRIPTION OR TO PAY THE FEE WITHIN THE PRESCRIBED TIME-LIMIT Effective date:20230712 Ref country code:GR Free format text:LAPSE BECAUSE OF FAILURE TO SUBMIT A TRANSLATION OF THE DESCRIPTION OR TO PAY THE FEE WITHIN THE PRESCRIBED TIME-LIMIT Effective date:20231013 Ref country code:FI Free format text:LAPSE BECAUSE OF FAILURE TO SUBMIT A TRANSLATION OF THE DESCRIPTION OR TO PAY THE FEE WITHIN THE PRESCRIBED TIME-LIMIT Effective date:20230712 Ref country code:ES Free format text:LAPSE BECAUSE OF FAILURE TO SUBMIT A TRANSLATION OF THE DESCRIPTION OR TO PAY THE FEE WITHIN THE PRESCRIBED TIME-LIMIT Effective date:20230712 Ref country code:AT Free format text:LAPSE BECAUSE OF FAILURE TO SUBMIT A TRANSLATION OF THE DESCRIPTION OR TO PAY THE FEE WITHIN THE PRESCRIBED TIME-LIMIT Effective date:20230712 | |
| RAP4 | Party data changed (patent owner data changed or rights of a patent transferred) | Owner name:VMWARE LLC | |
| REG | Reference to a national code | Ref country code:DE Ref legal event code:R081 Ref document number:602019032710 Country of ref document:DE Owner name:VMWARE LLC, PALO ALTO, US Free format text:FORMER OWNER: VMWARE, INC., PALO ALTO, CA, US | |
| PG25 | Lapsed in a contracting state [announced via postgrant information from national office to epo] | Ref country code:PL Free format text:LAPSE BECAUSE OF FAILURE TO SUBMIT A TRANSLATION OF THE DESCRIPTION OR TO PAY THE FEE WITHIN THE PRESCRIBED TIME-LIMIT Effective date:20230712 | |
| REG | Reference to a national code | Ref country code:DE Ref legal event code:R097 Ref document number:602019032710 Country of ref document:DE | |
| PG25 | Lapsed in a contracting state [announced via postgrant information from national office to epo] | Ref country code:SM Free format text:LAPSE BECAUSE OF FAILURE TO SUBMIT A TRANSLATION OF THE DESCRIPTION OR TO PAY THE FEE WITHIN THE PRESCRIBED TIME-LIMIT Effective date:20230712 Ref country code:RO Free format text:LAPSE BECAUSE OF FAILURE TO SUBMIT A TRANSLATION OF THE DESCRIPTION OR TO PAY THE FEE WITHIN THE PRESCRIBED TIME-LIMIT Effective date:20230712 Ref country code:EE Free format text:LAPSE BECAUSE OF FAILURE TO SUBMIT A TRANSLATION OF THE DESCRIPTION OR TO PAY THE FEE WITHIN THE PRESCRIBED TIME-LIMIT Effective date:20230712 Ref country code:DK Free format text:LAPSE BECAUSE OF FAILURE TO SUBMIT A TRANSLATION OF THE DESCRIPTION OR TO PAY THE FEE WITHIN THE PRESCRIBED TIME-LIMIT Effective date:20230712 Ref country code:CZ Free format text:LAPSE BECAUSE OF FAILURE TO SUBMIT A TRANSLATION OF THE DESCRIPTION OR TO PAY THE FEE WITHIN THE PRESCRIBED TIME-LIMIT Effective date:20230712 Ref country code:SK Free format text:LAPSE BECAUSE OF FAILURE TO SUBMIT A TRANSLATION OF THE DESCRIPTION OR TO PAY THE FEE WITHIN THE PRESCRIBED TIME-LIMIT Effective date:20230712 | |
| PLBE | No opposition filed within time limit | Free format text:ORIGINAL CODE: 0009261 | |
| STAA | Information on the status of an ep patent application or granted ep patent | Free format text:STATUS: NO OPPOSITION FILED WITHIN TIME LIMIT | |
| PG25 | Lapsed in a contracting state [announced via postgrant information from national office to epo] | Ref country code:IT Free format text:LAPSE BECAUSE OF FAILURE TO SUBMIT A TRANSLATION OF THE DESCRIPTION OR TO PAY THE FEE WITHIN THE PRESCRIBED TIME-LIMIT Effective date:20230712 Ref country code:MC Free format text:LAPSE BECAUSE OF FAILURE TO SUBMIT A TRANSLATION OF THE DESCRIPTION OR TO PAY THE FEE WITHIN THE PRESCRIBED TIME-LIMIT Effective date:20230712 | |
| REG | Reference to a national code | Ref country code:CH Ref legal event code:PL | |
| REG | Reference to a national code | Ref country code:BE Ref legal event code:MM Effective date:20231031 | |
| 26N | No opposition filed | Effective date:20240415 | |
| PG25 | Lapsed in a contracting state [announced via postgrant information from national office to epo] | Ref country code:LU Free format text:LAPSE BECAUSE OF NON-PAYMENT OF DUE FEES Effective date:20231025 | |
| PG25 | Lapsed in a contracting state [announced via postgrant information from national office to epo] | Ref country code:LU Free format text:LAPSE BECAUSE OF NON-PAYMENT OF DUE FEES Effective date:20231025 | |
| PG25 | Lapsed in a contracting state [announced via postgrant information from national office to epo] | Ref country code:CH Free format text:LAPSE BECAUSE OF NON-PAYMENT OF DUE FEES Effective date:20231031 | |
| PG25 | Lapsed in a contracting state [announced via postgrant information from national office to epo] | Ref country code:CH Free format text:LAPSE BECAUSE OF NON-PAYMENT OF DUE FEES Effective date:20231031 Ref country code:SI Free format text:LAPSE BECAUSE OF FAILURE TO SUBMIT A TRANSLATION OF THE DESCRIPTION OR TO PAY THE FEE WITHIN THE PRESCRIBED TIME-LIMIT Effective date:20230712 | |
| PG25 | Lapsed in a contracting state [announced via postgrant information from national office to epo] | Ref country code:BE Free format text:LAPSE BECAUSE OF NON-PAYMENT OF DUE FEES Effective date:20231031 | |
| PG25 | Lapsed in a contracting state [announced via postgrant information from national office to epo] | Ref country code:IE Free format text:LAPSE BECAUSE OF NON-PAYMENT OF DUE FEES Effective date:20231025 | |
| PGFP | Annual fee paid to national office [announced via postgrant information from national office to epo] | Ref country code:GB Payment date:20240919 Year of fee payment:6 | |
| PGFP | Annual fee paid to national office [announced via postgrant information from national office to epo] | Ref country code:FR Payment date:20240919 Year of fee payment:6 | |
| PG25 | Lapsed in a contracting state [announced via postgrant information from national office to epo] | Ref country code:IE Free format text:LAPSE BECAUSE OF NON-PAYMENT OF DUE FEES Effective date:20231025 | |
| PG25 | Lapsed in a contracting state [announced via postgrant information from national office to epo] | Ref country code:BG Free format text:LAPSE BECAUSE OF FAILURE TO SUBMIT A TRANSLATION OF THE DESCRIPTION OR TO PAY THE FEE WITHIN THE PRESCRIBED TIME-LIMIT Effective date:20230712 | |
| PG25 | Lapsed in a contracting state [announced via postgrant information from national office to epo] | Ref country code:BG Free format text:LAPSE BECAUSE OF FAILURE TO SUBMIT A TRANSLATION OF THE DESCRIPTION OR TO PAY THE FEE WITHIN THE PRESCRIBED TIME-LIMIT Effective date:20230712 | |
| PGFP | Annual fee paid to national office [announced via postgrant information from national office to epo] | Ref country code:DE Payment date:20241010 Year of fee payment:6 | |
| PG25 | Lapsed in a contracting state [announced via postgrant information from national office to epo] | Ref country code:CY Free format text:LAPSE BECAUSE OF FAILURE TO SUBMIT A TRANSLATION OF THE DESCRIPTION OR TO PAY THE FEE WITHIN THE PRESCRIBED TIME-LIMIT; INVALID AB INITIO Effective date:20191025 | |
| PG25 | Lapsed in a contracting state [announced via postgrant information from national office to epo] | Ref country code:HU Free format text:LAPSE BECAUSE OF FAILURE TO SUBMIT A TRANSLATION OF THE DESCRIPTION OR TO PAY THE FEE WITHIN THE PRESCRIBED TIME-LIMIT; INVALID AB INITIO Effective date:20191025 |