EP3364187B1 - Method of quantifying substrate - Google Patents
Method of quantifying substrateDownload PDFInfo
- Publication number
- EP3364187B1 EP3364187B1EP18161641.8AEP18161641AEP3364187B1EP 3364187 B1EP3364187 B1EP 3364187B1EP 18161641 AEP18161641 AEP 18161641AEP 3364187 B1EP3364187 B1EP 3364187B1
- Authority
- EP
- European Patent Office
- Prior art keywords
- biosensor
- measuring
- electrode
- sample liquid
- voltage
- Prior art date
- Legal status (The legal status is an assumption and is not a legal conclusion. Google has not performed a legal analysis and makes no representation as to the accuracy of the status listed.)
- Expired - Lifetime
Links
Images


Classifications
- G—PHYSICS
- G01—MEASURING; TESTING
- G01N—INVESTIGATING OR ANALYSING MATERIALS BY DETERMINING THEIR CHEMICAL OR PHYSICAL PROPERTIES
- G01N27/00—Investigating or analysing materials by the use of electric, electrochemical, or magnetic means
- G01N27/26—Investigating or analysing materials by the use of electric, electrochemical, or magnetic means by investigating electrochemical variables; by using electrolysis or electrophoresis
- G01N27/28—Electrolytic cell components
- G01N27/30—Electrodes, e.g. test electrodes; Half-cells
- G01N27/327—Biochemical electrodes, e.g. electrical or mechanical details for in vitro measurements
- C—CHEMISTRY; METALLURGY
- C12—BIOCHEMISTRY; BEER; SPIRITS; WINE; VINEGAR; MICROBIOLOGY; ENZYMOLOGY; MUTATION OR GENETIC ENGINEERING
- C12Q—MEASURING OR TESTING PROCESSES INVOLVING ENZYMES, NUCLEIC ACIDS OR MICROORGANISMS; COMPOSITIONS OR TEST PAPERS THEREFOR; PROCESSES OF PREPARING SUCH COMPOSITIONS; CONDITION-RESPONSIVE CONTROL IN MICROBIOLOGICAL OR ENZYMOLOGICAL PROCESSES
- C12Q1/00—Measuring or testing processes involving enzymes, nucleic acids or microorganisms; Compositions therefor; Processes of preparing such compositions
- C12Q1/001—Enzyme electrodes
- C12Q1/005—Enzyme electrodes involving specific analytes or enzymes
- C12Q1/006—Enzyme electrodes involving specific analytes or enzymes for glucose
- G—PHYSICS
- G01—MEASURING; TESTING
- G01N—INVESTIGATING OR ANALYSING MATERIALS BY DETERMINING THEIR CHEMICAL OR PHYSICAL PROPERTIES
- G01N27/00—Investigating or analysing materials by the use of electric, electrochemical, or magnetic means
- G01N27/26—Investigating or analysing materials by the use of electric, electrochemical, or magnetic means by investigating electrochemical variables; by using electrolysis or electrophoresis
- G01N27/28—Electrolytic cell components
- G01N27/30—Electrodes, e.g. test electrodes; Half-cells
- G01N27/327—Biochemical electrodes, e.g. electrical or mechanical details for in vitro measurements
- G01N27/3271—Amperometric enzyme electrodes for analytes in body fluids, e.g. glucose in blood
- G01N27/3272—Test elements therefor, i.e. disposable laminated substrates with electrodes, reagent and channels
- G—PHYSICS
- G01—MEASURING; TESTING
- G01N—INVESTIGATING OR ANALYSING MATERIALS BY DETERMINING THEIR CHEMICAL OR PHYSICAL PROPERTIES
- G01N27/00—Investigating or analysing materials by the use of electric, electrochemical, or magnetic means
- G01N27/26—Investigating or analysing materials by the use of electric, electrochemical, or magnetic means by investigating electrochemical variables; by using electrolysis or electrophoresis
- G01N27/28—Electrolytic cell components
- G01N27/30—Electrodes, e.g. test electrodes; Half-cells
- G01N27/327—Biochemical electrodes, e.g. electrical or mechanical details for in vitro measurements
- G01N27/3271—Amperometric enzyme electrodes for analytes in body fluids, e.g. glucose in blood
- G01N27/3274—Corrective measures, e.g. error detection, compensation for temperature or hematocrit, calibration
- G—PHYSICS
- G01—MEASURING; TESTING
- G01N—INVESTIGATING OR ANALYSING MATERIALS BY DETERMINING THEIR CHEMICAL OR PHYSICAL PROPERTIES
- G01N33/00—Investigating or analysing materials by specific methods not covered by groups G01N1/00 - G01N31/00
- G01N33/48—Biological material, e.g. blood, urine; Haemocytometers
- G01N33/483—Physical analysis of biological material
- G01N33/487—Physical analysis of biological material of liquid biological material
- G01N33/4875—Details of handling test elements, e.g. dispensing or storage, not specific to a particular test method
- G01N33/48771—Coding of information, e.g. calibration data, lot number
- G—PHYSICS
- G01—MEASURING; TESTING
- G01N—INVESTIGATING OR ANALYSING MATERIALS BY DETERMINING THEIR CHEMICAL OR PHYSICAL PROPERTIES
- G01N33/00—Investigating or analysing materials by specific methods not covered by groups G01N1/00 - G01N31/00
- G01N33/48—Biological material, e.g. blood, urine; Haemocytometers
- G01N33/50—Chemical analysis of biological material, e.g. blood, urine; Testing involving biospecific ligand binding methods; Immunological testing
- G01N33/53—Immunoassay; Biospecific binding assay; Materials therefor
- G01N33/543—Immunoassay; Biospecific binding assay; Materials therefor with an insoluble carrier for immobilising immunochemicals
- G01N33/54366—Apparatus specially adapted for solid-phase testing
- G01N33/54373—Apparatus specially adapted for solid-phase testing involving physiochemical end-point determination, e.g. wave-guides, FETS, gratings
- G01N33/5438—Electrodes
- A—HUMAN NECESSITIES
- A61—MEDICAL OR VETERINARY SCIENCE; HYGIENE
- A61B—DIAGNOSIS; SURGERY; IDENTIFICATION
- A61B2562/00—Details of sensors; Constructional details of sensor housings or probes; Accessories for sensors
- A61B2562/02—Details of sensors specially adapted for in-vivo measurements
- A61B2562/0295—Strip shaped analyte sensors for apparatus classified in A61B5/145 or A61B5/157
- A—HUMAN NECESSITIES
- A61—MEDICAL OR VETERINARY SCIENCE; HYGIENE
- A61B—DIAGNOSIS; SURGERY; IDENTIFICATION
- A61B5/00—Measuring for diagnostic purposes; Identification of persons
- A61B5/145—Measuring characteristics of blood in vivo, e.g. gas concentration or pH-value ; Measuring characteristics of body fluids or tissues, e.g. interstitial fluid or cerebral tissue
- A61B5/1468—Measuring characteristics of blood in vivo, e.g. gas concentration or pH-value ; Measuring characteristics of body fluids or tissues, e.g. interstitial fluid or cerebral tissue using chemical or electrochemical methods, e.g. by polarographic means
- A61B5/1486—Measuring characteristics of blood in vivo, e.g. gas concentration or pH-value ; Measuring characteristics of body fluids or tissues, e.g. interstitial fluid or cerebral tissue using chemical or electrochemical methods, e.g. by polarographic means using enzyme electrodes, e.g. with immobilised oxidase
- G—PHYSICS
- G01—MEASURING; TESTING
- G01N—INVESTIGATING OR ANALYSING MATERIALS BY DETERMINING THEIR CHEMICAL OR PHYSICAL PROPERTIES
- G01N27/00—Investigating or analysing materials by the use of electric, electrochemical, or magnetic means
- G01N27/26—Investigating or analysing materials by the use of electric, electrochemical, or magnetic means by investigating electrochemical variables; by using electrolysis or electrophoresis
Definitions
- the present inventionprovides a novel measuring method which reduces measurement errors caused by a biosensor.
- Biosensorsmeasure the quantity of a substrate included in sample liquid.
- the sensorsutilize molecular recognition capability of bio material such as germ, enzyme, antibody, DNA, RNA and the like, and uses the bio material as a molecular recognizing element.
- bio materialsuch as germ, enzyme, antibody, DNA, RNA and the like
- the biosensorsutilize those reactions and measure the quantity of the substrate included in the sample liquid.
- enzyme sensorshave been promoted to practical use. For instance, an enzyme sensor for glucose, lactic acid, cholesterol, and amino acid is used in medical measurement and food industry.
- the enzyme sensorreduces an electron carrier with an electron produced by the reaction between the substrate and the enzyme included in the sample liquid, i.e., specimen.
- a measuring devicemeasures the reduced amount of the electron carrier electrochemically, so that quantative analysis of the specimen is carried out.
- FIG. 16(a)shows a perspective exploded view of biosensor Z.
- Fig. 16(b)shows a structure of an electrode formed at a tip of biosensor Z.
- a method of measuring a quantity of a substrate in a sample liquidwill be described with reference to Fig. 16(b) .
- biosensor Zis inserted into a measuring device.
- the measuring deviceapplies a given voltage across counter electrode 1103a and measuring electrode 1103b.
- the sample liquidis supplied to inlet 1106b of a sample supplying path.
- the sample liquidis sacked into the supplying path due to capillary phenomenon, and passes on counter electrode 1103a, which is nearer to inlet 1106b, and arrives at measuring electrode 1103b.
- reagent layer 1105starts dissolving.
- the measuring devicedetects an electrical change occurring between counter electrode 1103a and measuring electrode 1103b, and starts measuring the quantity. The quantity of the substrate included in the sample liquid is thus measured.
- oxidoreductase and an electron acceptor retained in the reagent layerdissolve into the sample liquid, and enzyme reaction progresses between the substrate in the liquid. Then the electron acceptor is reduced. After the reaction finishes, the reduced electron acceptor is oxidized electrochemically. A concentration of the substrate can be measured using an oxidation current measured when the acceptor is oxidized.
- the conventional biosensor Zhas some problems to be solved.
- various factorsinfluence measurement accuracy and sensitivity of the measuring device.
- an incorrect operation by a userinfluences them. For instance: (1) After the user supplies the sample liquid to the sample supplying path, the user adds the sample liquid before the measuring device completes the measurement; (2) The user tries to measure the quantity with a biosensor which have been already used; (3) The user supplies the sample liquid to a incorrect place; (4) The user inserts the biosensor into the measuring device in a wrong direction; and (5) When supplying the sample liquid, the user fails to pinpoint an inlet of the sample supplying path, has the sample liquid attach to a surrounding area, and thus has the sample liquid not run into the path. Thus some ways have been desired to avoid those incorrect operations which influence the measurement accuracy. In particular, preventing aged users from the incorrect operations is required.
- characteristics of an object to be measuredinfluence them. For instance, when a glucose concentration of human blood is measured with a biosensor, a viscosity of the blood may influence measurement accuracy. Hematocrit, which is generally known as an index of blood viscosity, indicates a volume percentage of erythrocyte included in the blood. Blood in a person who does not suffer from anemia includes 50-60 volume% of water and 40-50 volume% of erythrocyte. If suffering from renal anemia due to chronic renal failure, a person has blood have the volume percentage of hematocrit decrease to less than 15%. Appropriate treatment requires to restrain the influence to hematocrit in the blood for accurate measurement of glucose concentration in the blood of, e.g., a diabetic.
- a temperature around the measuring deviceinfluences them.
- Measuring devices available in the market for biosensorshave been downsized so that users can carry it with them. Soon after moving into indoors from the outside, a user may try to measure the quantity. In this case, the measurement may start before a temperature in the measuring device becomes stable. A sharp change in temperature influences the oxidation current corresponding to a substrate concentration, and thus may lower the measurement accuracy.
- a body temperature of the userupon being transmitted to the measuring device via, e.g., the user's hand, might influence the measurement accuracy.
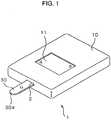
- FIG. 1shows a biosensor system.
- Biosensor system 1includes biosensor 30 and measuring device 10 having biosensor 30 mounted detachably thereto. Sample liquid is dripped on sample-drip point 30a located at a tip of biosensor 30. A quantity of a substrate included in the dripped sample liquid is measured by measuring device 10.
- Measuring device 10includes, for instance, supporting section 2 to which biosensor 30 is detachably mounted and display 11 which shows a measured quantity of the substrate included in the sample liquid dripped on sample-drip point 30a.
- a userinserts biosensor 30 into measuring device 10. Then the user drips the sample liquid on sample-drip point 30a while measuring device 10 applies a certain voltage to electrodes of biosensor 30. The sample liquid dripped, upon being sacked into biosensor 30, make a reagent layer start dissolving. Measuring device 10 detects an electrical change generated between the electrodes of biosensor 30, then starts measuring the quantity of the substrate.
- Biosensor system 1is suitable to processing human blood as a sample liquid among others, and measuring a quantity of glucose, lactic acid, cholesterol included in the human blood as a substrate. Measuring the quantity of the substrate included in human body fluid is very important for diagnosis and medical treatment for a specific physiological abnormality. In particular, a diabetic is required to monitor his glucose concentration in the blood frequently.
- biosensor system 1can measure a quantity of lactic acid, cholesterol and other substrates by selecting an appropriate enzyme as well.
- Insulating board 31(hereinafter called simply "board") is made of, e.g., polyethylene terephthalate.
- a conductive layerwhich is made of a noble metal such as gold and palladium, or an electrically conductive substance such as carbon, is formed by screen printing or sputtering evaporation.
- the conductive layermay be formed on the entire or at least a part of the surface.
- Reference numeral 32denotes an insulating board having air hole 33 formed at its center. Spacer 34 having a notch is disposed between boards 31 and 32, so that board 32 is integrated to board 31.
- the conductive layeris divided by a plurality of slits into counter electrode 37, measuring electrode 38, and detecting electrode 39.
- the conductive layeris divided by the following slits: substantially arc-shaped slit 40 formed on counter electrode 37; slits 41a and 41c formed vertically to a side of board 31; slits, 41b, 41d, and 41f and V-shaped slit 41e.
- the slitsform counter electrode 37, measuring electrode 38 and detecting electrode 39.
- Each electrodemay can be formed on at least a part of board 31.
- Measuring device 10may connected to the electrodes with lead wires.
- Spacer 34is placed for covering counter electrode 37, measuring electrode 38, and detecting electrode 39 on board 31.
- the notch shaped in a rectangular provided at a center in a front section of spacer 34forms sample supplying path 35.
- the sample liquidis dripped to inlet 30a of sample supplying path 35.
- the sample liquid dripped to inlet 30ais sacked by capillary phenomenon in an approximately horizontal direction (along arrow AR in Fig. 2 ) toward air hole 33.
- Reference numeral 36denotes a reagent layer formed by applying reagent, which contains enzymes, electron acceptors, amino acid, sugar alcohol and the like, to portions of counter electrode 37, measuring electrode 38 and detecting electrode 39, the portions which are exposed from the notch of spacer 34.
- the enzymesmay employ the following materials: glucose oxidase, lactate oxidase, cholesterol oxidase, cholesterol estrase, uricase, ascorbate acid oxidase, bilirubin oxidase, glucose dehydrogenase, lactate dehydrogenase.
- the electron acceptorpreferably employs ferricyanide kalium, however, may employ p-benzoquinone and its derivatives, phenacine methor sulphate, methylene blue, and pherocane and its derivatives.
- glucose oxidaseis used as oxidoreductase retained in reagent layer 36, and ferricyanide kalium is used as the electron acceptor in order to measure the glucose concentration in human blood.
- the oxidoreductase and the electron acceptordissolve in the sample liquid (human blood in this embodiment) which is sacked into the sample supplying path, and then the glucose, a substrate in the sample liquid, reacts with the oxidoreductase and the electron acceptor, and the enzyme reaction progresses. Then the electron acceptor is reduced, thus producing ferrocyanide (ferricyanide kalium in this embodiment). After the reaction, the reduced electron acceptor, upon being oxidized electrochemically, generates a current from which the glucose concentration is measured. This series of reactions progress mainly in an area covering slits 40, 41e and detecting electrode 39. The current produced by the electrochemical change is read out through measuring electrode 38 and detecting electrode 39.
- Reference numeral 42denotes a recognizing section for recognizing, with measuring device 10, a type of biosensor 30 and a difference in output characteristics among production lots.
- Slits 41g and 41hare combined to portions of counter electrode 37 and detecting electrode 39 corresponding to recognizing section 42. The slits enables measuring device 10 to recognize the differences in output characteristics electrically.
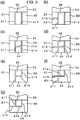
- Fig. 3shows combinations of slits depending on the presence of slits 41g, 41h in recognizing section 42 of biosensor 30.
- Fig. 3illustrates seven types of combinations.
- Fig. 3(a)shows recognizing section 42 of biosensor 30 for measuring cholesterol.
- slits 41g and 41hare not formed.
- Figs. 3(b), 3(c), and 3(d)illustrate recognizing section 42 of biosensor 30 for measuring lactic acid.
- slit 41his provided only in counter electrode 37, thereby forming compensating section 43.
- slit 41gis provided only to detecting electrode 39, thereby forming compensating section 44.
- slits 41h and 41gare provided to counter electrode 37 and detecting electrode 39, respectively, thereby forming compensating section 43 and 44, respectively.
- Figs. 3(e), 3(f), and 3(g)illustrate recognizing section 42 of biosensor 30 for measuring glucose.
- slit 41gis provided only to detecting electrode 39, and slit 41d is formed up to slit 41g. And thus compensating section 44 is integrally formed with measuring electrode 38.
- slit 41his added to the section in Fig. 3(e) , thereby forming compensating section 43.
- slit 41fis formed up to slit 41h shown in Fig. 3(f) .
- correcting sections 43 and 44are integrally formed with measuring electrode 38.
- a conductive area between the electrodescan be varied depending on patterns of the slits in recognizing section 42.
- Thisenables measuring device 10 to recognize the differences in output characteristics (concentrations of glucose, cholesterol, lactic acid) of biosensor 30 and errors depending on production lots.
- Data and a control programsince being changed appropriately to the substrate according to the recognition, enables the device to be expected in exact measurement. This allows a user not to input compensating data using a compensating chip, and prevents the user from incorrectly handling the device.
- This embodimentdiscloses the biosensor having three electrodes. However, a number of electrodes may change, and a biosensor may have at least a pair of electrodes. The patterns of the slits other than those shown in Fig. 3 may be formed.
- FIG. 4shows structures of biosensor 30 (top view) and measuring device 10.
- biosensor 30top view
- measuring electrode 38 and detecting electrode 39are arranged along a flowing direction of a sample from sample-drip point 30a where detecting electrode 39 is placed most downstream.
- Counter electrode 37may be exchanged between measuring electrode 38 in the arrangement order.
- Measuring electrode 38 and detecting electrode 39are spaced at a given distance by slits 41c and 41e.
- the devicecan determine, from an electric current changing according to an electrical change of the substrate, whether enough quantity of the sample liquid is sacked securely or not.
- reference numerals 12, 13, 14, 15, 16 and 17denote connectors connected to areas A, B, C, D, E and F, respectively, which are produced by dividing recognizing section 42 of biosensor 30 into six areas.
- the six areasare grouped such that the groups correspond to slits 41d, 41f and slits 41g, 41h.
- Area Acorresponds to measuring electrode 38
- area Ccorresponds to detecting electrode 39
- area Ecorresponds to measuring electrode 38.
- Area Ais integrally formed with area B, and areas D and F correspond to compensating sections 43 and 44 shown in Fig. 3 , respectively.
- Switches 18, 19, 20, 21 and 22are provided between respective connectors 13, 14, 15, 16, 17 and a grounding (meaning a constant voltage, not necessarily “0"V This definition is applicable to this description hereinafter.) Voltage to be applied to respective electrodes can be controlled at the grounding. Connectors 13, 14, 15, 16 and 17 are connected in parallel to the grounding. Switches 18 to 22, upon being turned on and off under control, select a necessary connector out of connectors 13 to 17 which is used for the measurement.
- Reference numeral 23denotes a current/voltage converter connected to connector 12, for converting a current flowing between measuring electrode 38 and other electrodes into a voltage.
- Reference numeral 24denotes an AID converter connected to current/voltage converter 23, for converting a voltage supplied from circuit 23 into a pulse.
- Reference numeral 25denotes a CPU for controlling to turn on and off the switches and calculating a content of the substrate included in the sample liquid based on the pulse supplied from A/D converter 24.
- Reference numeral 11denotes an LCD for displaying measured data calculated by CPU 25.
- Reference numerals 26 and 28denote temperature measuring sections for measuring temperatures inside measuring device 10. Temperature measuring sections 26 and 28 are connected in parallel to each other between connector 12 and current/voltage converter 23.
- biosensor 30 and measuring device 10An operations of biosensor 30 and measuring device 10 will be demonstrated with reference to Fig. 5 through Fig. 7 , for measuring a content of a substrate in sample liquid by a method with biosensor 30.
- Step S1it is determined whether or not biosensor 30 is properly inserted into supporting section 2 of measuring device 10 (Step S1). Specifically, this is determined with a switch (not shown) in a connector shown in Fig. 4 . If biosensor 30 is properly inserted (step S1: Yes), conductivity between areas A and B is tested (step S2). As shown in Fig. 3 , measuring electrode 38 has no slit formed therein for insulating one electrode itself such as slits 41h and 41g. In measuring electrode 38, areas A and B are connected to connectors 12 and 13, respectively. Areas A and B thus become conductive to each other without failure when biosensor 30 is inserted into measuring device 10 in a direction (a predetermined direction) such that a conductive layer of biosensor 30 is oriented normally.
- step S3the measuring process terminates due to an error of detecting the front and back sides.
- the errorwhen being detected, is preferably displayed on display 11, or noticed as an alarm sound from a speaker.
- step S4When the conductivity between areas A and B is detected (step S2: Yes), it is determined whether or not voltages detected between area A and area C and between area A and area E are greater than 5 mV (step S4). Switches 19 and 21 are simultaneously turned on, thereby allowing areas C and E to be considered to be electrically unified. Then a voltage is detected between area A and area C or E for determining whether biosensor 30 inserted in step 1 is an used one or not. This is determined since a reaction between reagent layer 36 and glucose in the blood has progressed to probably enlarge the detected voltage if biosensor 30 is the used one.
- step S4If it is determined that the voltage detected between area A and areas C is greater than 5mV (step S4, Yes), it is recognized that biosensor 30 which is used is inserted, and the measuring process terminates due to an error of an used sensor (step S5). If being detected, the error of used sensor is preferably displayed on display 11, or noticed to a user as an alarm sound from a speaker. This prevents the user easily from dripping blood to biosensor 30 by mistake while used biosensor 30 is inserted.
- step S4when the voltage detected between area A and areas C, E is not greater than 5mV (step S4: No), the patterns of the slits is recognized by recognizing section 42 of biosensor 30 which is detected to be inserted at step S1. According to the recognizing result, CPU 25 changes data and a program into appropriate ones for output characteristics of the sensor (steps S6 to S10).
- three patterns of the slitsare available, as shown in Figs. 3(e), 3(f), and 3(g) , for a blood-sugar-level sensor which measures a glucose concentration. Specifically, first, conductivity between areas A and D is tested (step S6). Switch 20 is turned on, and then the conductivity between areas A and D is tested, so that it may be determined whether or not biosensor 30 is proper to measure a blood sugar level and not proper to measure a quantity of lactic acid or cholesterol.
- step S6If the conductivity between areas A and D is not detected (step S6: No), it is determined that biosensor 30 is incompatible with the blood-sugar-level sensor. Then the measuring process terminates (step S7), and display 11 shows an error message, or a speaker sounds an alarm for the user. These prevent the user from recognizing a measurement as a glucose concentration by mistake.
- step S6If the conductivity between areas A and D is detected (step S6: Yes), the conductivity between areas A and F is tested (step 8). Switch 22 is turned on. Then the conductivity between areas A and F is tested, so that the device can recognize differences in output characteristics due to production lots of biosensors 30 proper to blood-sugar-level sensors.
- CPU 25automatically changes data and programs to which output characteristics corresponding to production lots have been reflected. Thus the user does not need a compensating chip. As a result, the biosensor and the measuring device can be handled more easily, and a higher accuracy of measurement can be expected.
- biosensor 30is defined as a type shown in Fig. 3(g) , and result I is stored in a memory (not shown) (step S9). If the conductivity between areas A and F is not detected (step S8: No), biosensor 30 is defined as a type shown in Fig. 3(e) or Fig. 3(f) , and result II is stored in the memory (not shown) (step S10).
- step S11After the type of biosensor 30 is recognized, it is determined again whether the voltage detected between area A and areas C, E is greater than 5mV or not (step S11). Switches 19, 21 are simultaneously turned on for detecting a current between area A and areas C, E. Then it is determined whether or not a user drips the sample liquid on biosensor 30 before measuring device 10 is ready for measurement. This process not only prevents positively the user from using used biosensor 30, but also detects that the sample liquid has been dripped by the user before the measurement is available.
- step S11If the voltage detected between area A and areas C, E is greater than 5mV (step S11: Yes), it is determined, as a drip error, that the sample liquid is dripped before the measurement is prepared.
- the drip erroris preferably displayed on display 11, notified to a user with an alarm sound from a speaker, or displayed with LEDs (not shown) to give the user an alarm. The user can positively avoid a failure in operation by these operations, and a high accuracy of measurement can be expected.
- step S11If the voltage detected between area A and areas C, E is not greater than 5mV (step S11: No), it is determined that the sample liquid is not dripped before the measurement is prepared. Then a completion of the preparation is notified to the user with LEDs (step S13).
- the erroris preferably displayed on display 11, notified to the user with an alarm sound from a speaker, or displayed with LEDs. Receiving this notice, the user takes blood as sample liquid from his body by himself and drips it to sample-drip point 30a of biosensor 30 inserted to measuring device 10.
- step S14 to S20it is determined whether or not enough quantity of the sample liquid is sacked through the sample supplying path from point 30a (steps S14 to S20).
- counter electrode 37, measuring electrode 38, and detecting electrode 39are arranged along sample supplying path 35 from sample-drip point 30a toward a downstream of the sample liquid flow. Detecting electrode 39 is placed most downstream. Either one of a group consisting of counter electrode 37 and measuring electrode 38, or another group consisting of measuring electrode 38 and detecting electrode 39 is selected at a given interval. A voltage is applied to a selected group, so that it is determined whether or not the sample liquid is supplied in a quantity enough for measurement. In a conventional manner, a current change only between measuring electrode 38 and detecting electrode 39 is recognized. In the conventional manner, it is very difficult to identify a cause why the measurement does not start even though enough quantity of the sample liquid is supplied to the sample supplying path, or since the quantity is less than enough quantity for starting the measurement.
- switch 19is turned off, and switch 21 is turned on for generating a voltage between areas A and E.
- switch 19is turned on, and switch 21 is turned off for generating a voltage between areas A and C.
- switches 19 and 21are on-off controlled, thereby selecting and switching either one of the groups easily.
- generating the voltage between counter electrode 37 and measuring electrode 38is referred to as generating a voltage between areas A and E.
- Also generating a voltage between measuring electrode 38 and detecting electrode 39is referred to as generating a voltage between areas A and C.
- a pair of areas A and E and a pair of areas A and Care switched every 0.2 seconds, and 0.2V is applied to each pair. It is determined whether or not respective voltages measured between areas A and E and between areas A and C reaches 10mV (a given threshold). These numbers may be changed responsive to a type of biosensors.
- a voltage of 0.2Vis produced between areas A and E which are located at the upstream portion of the sample supplying path, and it is determined whether or not the voltage measured between areas A and E exceeds 10mV (step S14). If the voltage measured does not exceed 10mV (step S14: No), a voltage of 0.2V is applied between areas A and C located downstream of the path. Then it is determined whether the voltage measured between areas A and C exceeds 10mV or not (step S15).
- step S15If the voltage measured between areas A and C does not exceed 10mV (step S15: No), it is determined whether or not 3 minutes have passed since the voltage was produced between areas A and E in step S14 (step S16). If the 3 minutes has not passed (step S16: No), the processes from step S14 and onward are repeated. If respective voltages between areas A and E and between areas A and C do not reach 10 mV for 3 minutes (step S16: Yes), the measuring process terminates.
- step S14If the voltage between areas A and E is determined to reach 10mV (step S14: Yes), it is determined whether or not the voltage between areas A and C reaches 10mV (step S17). If the voltage between areas A and C does not reach 10mV (step S17: No), it is determined whether or not 10 seconds (a given period) have passed since the voltage between areas A and E was determined to reach 10mV (step S18). If the 10 seconds has not passed, the processes in steps S17 and S18 are repeated. While the 10 seconds passes, the measuring process temporarily halts until the voltage measured between areas A and C reaches 10mV (step S18; No).
- the sample liquid drippedis probably insufficient, it is preferable to display the error message on display 11, or sound an alarm to a user from a speaker so that the user may understand that the sample liquid should be added. If the voltage measured between areas A and C does not reach 10mV even after 10 seconds has passed (step S18: Yes), the measuring process terminates due to an error of specimen insufficient (step S19).
- a quantity of the substrateis compensated responsive to a measured voltage in measuring device 10.
- the compensationdepends on the lapse of time (delay time) since the voltage between areas A and E was determined to reach 10mV in step S14 until the voltage between areas A and C is determined to reach 10mV in step S17.
- Fig. 8is a sensitivity compensation table illustrating a relation between the delay time and a compensation coefficient for the measured quantity of the substrate.
- the vertical axisrepresents the compensation coefficient
- the horizontal axisrepresents the delay time. For instance, if the delay time is 5 seconds, the measured quantity is compensated by 10% lower. As a result, 90% of the measured quantity becomes a compensated quantity.
- This kind of the sensitivity compensation tableis stored in a memory (not shown) of measuring device 10, and this table is referred when a final quantity of the substrate is calculated.
- step S15if the voltage measured between areas A and C is determined to excess 10mV not the voltage between areas A and E (step S15: Yes), it is determined, in 0.2 seconds after the determination, whether or not the voltage between areas A and E reaches 10mV (step S20). If the voltage between areas A and E does not excess 10mV, it is determined that the sample liquid has been dripped to an incorrect position, and the measuring process terminates (step S50).
- sample liquidis normally dripped on sample-drip point 30a, the liquid is sacked along sample supplying path 35 to air hole 33 and then moistens counter electrode 37, measuring electrode 38 and detecting electrode 39 in this order.
- the voltage measured only between areas A and Cchanges largely, a user has probably dripped the sample liquid to air hole 33 incorrectly. In this case, it is determined that an exact measurement is not expected, and the measuring process compulsorily terminates due to an error of dripping at a incorrect position. This can avoid a measurement error due to an incorrect operation by the user.
- step S17If the voltage measured between areas A and C is determined to reach 10mV (step S17: Yes), or if the voltage measured between areas A and E is determined to reach 10mV (step S20: Yes), enough quantity of the sample liquid is determined to be dripped. Then a pre-process for measuring the quantity of the substrate starts, and a timer (not shown) of measuring device 10 counts time (step S21).
- step S22conductivity between areas A and F is tested (step S22).
- Switch 22is turned on, and the conductivity is tested between areas A and F. If the conductivity is detected (step S22: Yes), it is determined whether result I identifying a type of biosensor 30 is stored in the memory in step S9 or not (step S23). If result I is stored (step S23: Yes), it is determined that the type of biosensor 30 is that shown in Fig. 3(g) .
- Calibration curve datais prepared using voltages measured when the reduced electron acceptor is oxidized electrochemically. Then calibration curve F7 is prepared as the calibration curve data for specifying a concentration of the glucose in the sample liquid (step S24).
- step S23when result II is stored (step S23: No), it is determined that the type of biosensor 30 is that shown in Fig. 3(e) , and calibration curve F5 is prepared as the calibration curve data (step S25). If the conductivity is not detected between areas A and F (step S22: No), it is determined that the type of biosensor 30 is that shown in Fig. 3(f) , and calibration curve F6 is prepared as the calibration curve data (step S26).
- the measuring pre-processstarts (step S27 - S29).
- the pre-processwill be demonstrated with reference to Fig. 9 , which illustrates a profile of the pre-process.
- the pre-processstarts at time t0.
- time t0is the time when the timer (not shown) of measuring device 10 starts counting time.
- the profile of the pre-processincludes three consecutive periods, for instance, a first voltage period t0-t1, a standby period t1-t2, and a second voltage period t2-t3.
- voltage V1is applied to areas A, C and E, to have the enzyme reaction progress. This increases a voltage measured by oxidizing ferrocyanide electrochemically similar to an exponential function.
- voltage V1 applied during the first voltage periodis set at zero, and thus the ferrocyanide is not oxidized electrochemically, but the enzyme reaction keeps progressing. The ferrocyanide is thus accumulated.
- voltage V2is applied to areas A, C and E to oxidize the ferrocyanide accumulated during the standby period all at once. Then a quantity of discharged electron increases, and a high response current is thus observed at time t2.
- a current reaching the high response currentdecreases, as time passes, into a stable value i3 at time t3.
- switches 19 and 21are simultaneously turned on in measuring device 10, so that a voltage is applied to counter electrode 37 and detecting electrode 39 as one unit.
- Fig. 10shows a relation between a blood viscosity, a reaction time of reactive reagent layer on the blood, and a measurement sensitivity.
- Data shown in Fig. 10is measured by a conventional method, which applies a voltage within a period corresponding to the second voltage period shown in Fig. 9 and measures the voltage.
- influence due to differences in viscosity (Hct in the case of blood) to measurement sensitivityincreases at a shorter reaction time. Great difference is observed between the high Hct and the low Hct particularly at a reaction time around 5 sec.
- the conventional methodtends to reveal a measurement error obviously due to blood viscosity.
- reaction products produced at an initial stage of dissolving reagent layer 36is thus compulsorily consumed by applying voltage V1.
- voltage V1since the low Hct has a higher speed in enzyme reaction than the high Hct, greater reaction products are produced in the low Hct and thus greater reaction products are consumed.
- an effective first voltage period t1-t0may be 3 to 13 seconds.
- the voltage to be appliedmay be further increased, so that a voltage application time is preferably 2 to 10 seconds.
- Voltage VImay range preferably from 0.1 to 0.8V.
- the standby period t2-t1is 1 to 10 seconds and preferably 2 to 10 seconds.
- voltage V2starts being applied at time t2. And just after time t2, the voltage is not stable and requires a time to be stable. A voltage similar to that during the first voltage period is not necessarily applied, and a lower voltage than voltage V1 is preferably applied. The lower voltage may be low enough to oxidize ferrocyanide kalium.
- the second voltage period t3-t2is thus preferably 2 to 10 seconds.
- Voltage V2is preferably 0.05 to 0.6V.
- value i3 measured between areas A, C and area E at time t3is read out, and the quantity of the substrate (glucose) in the sample liquid is calculated.
- the set time discussed aboveis particularly suitable for a quantity measuring with the biosensor including electrodes made of noble metal such as palladium.
- a reagentis not limited to glucose oxidase and/or glucose dehydrogenase and ferricyanide kalium, but includes amino acid, sugar alcohol.
- the set timeis also suitable to a biosensor including organic acid.
- the reaction of reagent layer 36 in the sample liquidis incubated in a certain period before the quantity of the substrate is measured.
- the incubate periodmay change depending on the laps of time since the voltage measured between areas A and E exceeds a threshold (10mV) in step S14 until the voltage between areas A and C exceeds the threshold (10mV) in step S17.
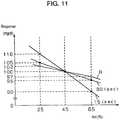
- Fig. 11shows glucose concentrations (mg/dl) measured by the conventional method and the measuring pre-process discussed above for three types of blood having contents of hematocrit (Hct) of 25%, 45% and 65%.
- Reference mark R in Fig. 11denotes the measurement result by the pre-process.
- the other two resultswere measured by the conventional method with 15 seconds and 30 seconds of the reaction time.
- the pre-processwas performed under the following condition: the first voltage period was 6 seconds; voltage V1 was 0.5V; the standby period was 6 seconds; the second voltage period was 3 seconds; and voltage V2 was 0.2V.
- the dispersionbecomes greater at a shorter reaction time.
- the dispersionis produced by 10% higher (low Hct of 25%) and by 10% lower (high Hct of 65%).
- the dispersionis produced by 5% higher (low Hct of 25%) and by 5% lower (high Hct of 65%).
- the dispersionis produced by 3% higher (low Hct of 25%) and by 3% lower (high Hct of 65%).
- Fig. 11teaches that the pre-process can reduce the dispersion due to the types of Hct while the reaction time is the same as that in the conventional method.
- the measuring pre-processstarts, and 0.5V is applied between areas A and C, and between areas A and E for 6 seconds in the first voltage period (step S27).
- the standby periodis taken for 6 sec., and the voltage applied is cancelled in the standby period (step S28).
- the second voltage periodstarts, and 0.2V is applied between areas A and C, and between areas A and E for 3 sec. (step S29). Then value i3 is read out (step 30).
- step S30temperature measuring sections 26 and 28 and switches 27, 29 disposed in measuring device 10 are controlled to measure a temperature in measuring device 10 (step S31). Specifically, switch 27 is turned on, and measuring section 26 measures the temperature (step S31). Then switch 27 is turned off, switch 29 is turned on, and measuring section 28 measures the temperature (step S32).
- step S33The two temperatures measured by temperature measuring section 26 and 28 are compared with each other, and it is determined whether or not the difference between the two temperatures ranges within a given threshold (step S33). If the difference is out of the threshold, the measuring process terminates due to a failure of either one of measuring section 26 or 28 (step S33: No).
- plural temperature-measuring sections (26, 28)are disposed in measuring device 10, and their measuring results are compared, so that a failure can be detected exactly and easily. This can avoid a measurement error caused by a measurement at an irregular temperature.
- the temperaturesare measured just after the value has been read out in step S30; however, the temperatures may be measured, for instance, when the pre-process starts in step S21.
- step S33If the difference between the two temperatures measured ranges within the given threshold (step S33: Yes), the temperatures are temporarily stored in a memory (not shown). At this time, the temperature measured by either one of sections 26 or 28 may be selected and stored, and the average of the two temperatures may be stored. Then a calibration curve, which should refer to value i3 measured in step S30, is specified (step S34).
- the calibration curves prepared in steps S24, S25 and S26are referred. If biosensor 30 corresponds to step S24, calibration curve F7 is referred (step S35). In the same manner, if biosensor 30 corresponds to step S25, calibration curve F5 is referred (step S36). If biosensor 30 corresponds to step S26, calibration curve F6 is referred (step S37).
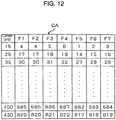
- Fig. 12shows calibration curve data CA measured in steps S34, S35 and S36.
- data CAa voltage measured in step S30 and a concentration (mg/dl) of a substrate included in sample liquid are determined depending on each output characteristic F1 to F7 of biosensor 30. For instance, if a measured voltage is 25mV, and the biosensor corresponds to calibration curve F5, a substrate concentration of 14 (mg/dl) is stored in the memory.
- a concentration of the substrate selected in step S35, S36 or S37is compensated by a compensation coefficient corresponding to the delay time which has been found in steps S14 and S17 and stored in the memory (step S38).
- step S38the concentration compensated in step S38 is compensated according to the temperatures measured in steps S31 to S33 (step S39).
- the temperature stored in the memory in step S33is read out, and a temperature compensation table shown in Fig. 13 is referred, thereby determining a temperature compensation coefficient to be applied to concentration D1.
- Fig. 13shows temperature compensation tables.
- Compensation table T10is used for the temperature of 10°C.
- table T15is for the temperature of 15°C
- table T20is for the temperature of 20°C.
- the compensation tablesspecifies a relation between substrate concentration D1 in the sample liquid and a temperature compensation coefficient is specified.
- the temperature compensation coefficientis determined based on a concentration at 25°C as a reference, and shows a coefficient for compensation with respect to the concentration.
- Fig. 14shows relations between the measured temperature and measurement dispersion (bias) at each concentration of glucose.
- the measurement dispersion in Fig. 14is defined by a coefficient of a change of a concentration of glucose measured at 25°C according to a change of the measured temperature.
- Fig. 14(a)shows a relation between the dispersion and the measured temperature in the case of glucose concentration of 50mg/dl at 25°C.
- Fig. 14(b)shows the relation for the glucose concentration of 100mg/dl and the temperature of 25°C.
- Fig. 14(c)shows the relation for the glucose concentration of 200mg/dl and the temperature of 25°C.
- Fig. 14(d)shows the relation for the glucose concentration of 300mg/dl and the temperature of 25°C.
- Fig. 14(e)shows the relation for the glucose concentration of 420mg/dl and the temperature of 25°C.
- Fig. 14(f)shows the relation for the glucose concentration 550mg/dl and the temperature of 25°C.
- the measuring dispersionincreases as a difference between a measured temperature and reference temperature 25°C becomes greater.
- the dispersionincreases in a negative direction as a measured temperature decreases from the reference temperature, and the dispersion increases in a positive direction as a measured temperature rises from the reference temperature.
- the dispersionconverges at the glucose concentration of 300mg/dl, which seems a boundary, even though the glucose concentration increases.
- Fig. 14(a)indicates the dispersion of approximately 28% at 40°C
- Fig. 14(c)indicates approximately 50%
- Fig. 14(d)indicates approximately 60%
- Fig. 14(f)indicates approximately 50%.
- a similar tendencyis found in a low temperature range such as a measured temperature of 10°C.
- the measuring dispersionincreases as a difference between a measured temperature and reference temperature of 25 °C becomes greater for the same glucose concentration.
- the dispersionstarts converging at the glucose concentration of 300mg/dl as a boundary even though the glucose concentration increases.
- a temperature compensation table for every 1°Cmay be prepared, or the table for every given temperature range (e.g. 5°C). If a temperature at a middle of the given temperature range is detected, a temperature compensation coefficient may be calculated by a linear interpolation with a temperature compensation table including the detected temperature.
- concentration D2which has undergone the temperature compensation discussed above, is output on display 11 of measuring device 10 as a final concentration of the substrate (step S40).
- concentration D2which has undergone the temperature compensation discussed above, is output on display 11 of measuring device 10 as a final concentration of the substrate (step S40).
- the time when the sample liquid is added, the measured temperature, and the combination of the measured temperature and the concentrationare considered as influence factors to the measurement.
- a viscosity (Hct) of sample liquidis also considered as an influence factor. Those factors are taken into consideration when the quantity of a substrate is measured. As a result, the measurement accuracy is remarkably improved from the measurement by a conventional method.
- the following methodcan be introduced in order to further decrease a measurement error due to temperature.
- the temperatureis measured successively and stored. After biosensor 30 is inserted, temperatures measured in steps S31 and S32 are compared with the stored ones. If large differences between the stored temperatures and the measured ones are found, the measuring process may compulsorily terminates due to a significant temperature change which influences a measurement error.
- a portable biosensor system being carried easily,is exposed in various temperature changes depending on the outside environment.
- the biosensor systemmay be influenced by a temperature of a user's hand, or a sharp change in temperature when a user moves from outside to indoors.
- the sharp temperature-changecan be expected, it takes reasonable time for measuring device 10 to be stabilized in its temperature change.
- Fig. 15shows temperature changes in measuring device 10.
- a temperature change in device 10 moving from a place at a temperature of 10°C to another place at a temperature of that of 25°Cis shown in Fig. 15 .
- a temperature change in device 10 moving from a place at a temperature of 40°C to a place of a temperature of 25°Cis also shown in Fig. 15.
- Fig. 15shows that it takes approximately 30 minutes to stabilize the temperature changes in an ambient temperature ranging from 10 to 40°C. If the temperature compensation is carried while the temperature changes, an exact temperature compensation may not be expected.
- the measuring processmay compulsorily terminate due to the temperature change which may influence a measuring error. This further improves the accuracy of temperature compensation in measuring device 10.
- a temperaturemay be measured before biosensor 30 is inserted into measuring device 10 at given intervals, e.g., 5-minute interval, or successively. Based on the magnitude of temperature change, the measuring process may be cancelled although a user tries to carry it out.
- the biosensor in accordance with the second exemplary embodiment not according to the present inventionwill be demonstrated hereinafter.
- an enzyme sensoris described.
- the sensoremploys an enzyme as a molecule recognizing element which specifically reacts on a specific material contained in sample liquid.
- the second embodimentdiscusses this problem.
- a userfails to drip sample liquid to an inlet of a sample supplying path, and the sample liquid attaches to a surrounding areas of the inlet.
- the sample supplying pathcannot carry the sample liquid.
- Such kind of incorrect operations by a usermay affect a measurement accuracy, and the ways how to avoid those mis-operations are demonstrated in this embodiment.
- an insulating board and a cover forming the pathhave respective ends of the same shape at the same location in a plan view. Therefore, a sample supplying angle becomes small. Or when the sample liquid attaches to a rear side (a side having no electrode formed thereon) of the insulating board by mistake, this sample liquid attached to the rear side may prevents the user from again supplying the sample liquid. As a result, the sample liquid is not supplied well, which causes a failure in measurement or a measurement error.
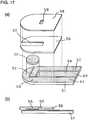
- FIG. 17(a)is an exploded perspective view of the biosensor in accordance with the second embodiment.
- Fig. 17(b)is a cross section at a center of the sample supplying path in the longitudinal direction of the biosensor.
- measuring electrode 52, counter electrode 53 and detecting electrode 54are formed on first insulating board 51. Those electrodes are made of electrically conductive material.
- Detecting electrode 54 in this embodimentfunctions not only as an electrode for detecting a insufficiency of a specimen but also as a part of a reference electrode or as a part of the counter electrode.
- Fig. 17shows that the electrodes discussed above are disposed on the first insulating board; however, those electrodes may be divided and disposed also on second insulating board 58 to be a cover board located opposite to first board 51.
- Boards 51 and 58are preferably made of polyethylene terephthalate, polycarbonate, polyimide or the like.
- Each electrodeis preferably made of electrically conductive material such as noble metal including gold, platinum, and palladium, or simple material such as carbon. They may be also made of composite material such as carbon paste or noble metal paste.
- electrically conductive materialsuch as noble metal including gold, platinum, and palladium
- simple materialsuch as carbon.
- Theymay be also made of composite material such as carbon paste or noble metal paste.
- a conductive layercan be formed on board 51 or 58 easily by a sputtering evaporation method.
- a conductive layercan be formed on board 51 or 58 easily by a screen printing method.
- the conductive layeris formed on an entire or a part of first insulating board 51 or second insulating board 58 by the sputtering evaporation method or the screen printing method. Then slits are provided by laser for forming and dividing the electrodes.
- the electrodesmay be formed by the screen printing method or a sputtering evaporation method on a printed board or a masked board having electrode patterns formed in advance.
- Reagent layer 35includes enzymes, electron carriers and hydrophilic high-polymer.
- the enzymesinclude glucose oxidase, lactate oxidase, cholesterol oxidase, cholesterol estrase, uricase, ascorbate acid oxidase, bilirubin oxidase, glucose dehydrogenase, lactate dehydrogenase.
- the electron carrierpreferably employ ferricyanide kalium and may employ p-benzoquinone and its derivatives, phenacine methor sulphate, methylene blue, or pherocane and its derivatives.
- the hydrophilic high-polymeremploy, e.g. carboxymethyl cellulose, hdroxy-ethyl cellulose, hydroxy propyl cellulose, methyl cellulose, ethyl cellulose, ethyl hydroxyethyl cellulose, carboxy methyl ethyl cellulose, polyvinyl alcohol, polyvinyl pyrrolidone, polyamino acids such as poly-lysine, sulfonated polystyrene acid, gelatin and its derivatives, acrylic acid and its salts, methacrylic acid and its salts, starch and its derivatives, anhydrous maleci acid and its salts, or agarose gel and its derivatives.
- First insulating board 51 and second insulating board 58are bonded via spacer 56 in between for forming sample supplying path 57, from which sample liquid is supplied.
- Spacer 56has slit-shaped notch 57 formed therein.
- first board 51 and second board 58 forming path 57are placed with their ends at an inlet of sample supplying path 57 deviated each other and bonded. That is, respective ends are placed at different places from each other.
- This preparationis viewed from a plan view.
- first board 51 and second board 58are in the same shape near the inlet of path 57; however, second board 58 and spacer 56 protrude toward the inlet with respect to first board 51.
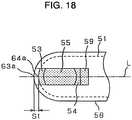
- the deviation of second board 58 from first board 51 at the ends thereof, that is, distance S1 between points 63a and 64ais preferably not less than 0.1mm and more preferably ranges from 0.25 to 1.0mm, where center line L of path 57 shown in Fig. 18 crosses with first board 51 and second board 58 at points 64a and 63a, respectively.
- first board 51has different shape from second board 58 near the inlet of path 57 as shown in Fig. 19 , a similar advantage to that discussed above is measurable.
- the deviation at the ends thereof, i.e., center line L of path 57 shown in Fig. 20crosses with first board 51 at point 64b and crosses with second board 58 at point 63b.
- Distance S2 between point 63b and point 64bis preferably not less than 0.1mm and more preferably ranging from 0.25 to 1.0mm.
- a depth of the sample supplying pathi.e., a thickness of spacer 56, ranges preferably from 0.05 to 0.3 mm in order to supply the sample liquid quickly to slit-shaped path 57.
- Spacer 56is preferably made of polyethylene terephthalate, polycarbonate, polyimide, polybutylene terephthalate, polyamide, polyvinyl chloride, polyvinylidene chloride, or nylon.
- first board 51may be bonded to second board 58 integrated with spacer 56 into one unit.
- Reagent layer 55is disposed on entire or a part of a surface of the electrode, and however, may be disposed anywhere in sample supplying path 57 as long as it does not lower the performance of the biosensor.
- the sample liquidis supplied to the biosensor through path 57 having a structure discussed above by the capillary phenomenon.
- air hole 59through which air flows outside the biosensor is necessary in path 57 in order to supply the sample liquid smoothly.
- Air hole 59may shape in a rectangle, circle or polygon.
- Air hole 59may be located anywhere in path 57 as long as it does not block the supply of sample liquid.
- Hydrophilic treatmentwhich may be performed inside path 57 enables the sample liquid to be supplied into path 57 more quickly and accurately.
- the hydrophilic treatmentis realized by developing surface active agent into or on second board 58, or by roughing the surface of the board by sandblasting, electric-discharge machining, non-glare process, mat process, or chemical plating.
- a currentis generated by the reaction between a specific component in the sample liquid and reagent layer 55 containing enzymes.
- the currentis conducted to an external measuring instrument (not shown) via lead-wires 60, 61, and 62 of measuring electrode 52, counter electrode 53, detecting electrode 54 for being measured.
- a triple-electrode methodemploying measuring electrode 52, counter electrode 53 and detecting electrode 54 is available as discussed in this embodiment not according to the present invention.
- a double-electrode methodemploying only measuring electrode 52 and counter electrode 53 is available. Either method can produce the similar advantage to that of this embodiment; however, the triple-electrode method achieves more precise measurement.
- a thin palladium film of 8nm thicknesswas formed on the entire surface of the first insulating board made of polyethylene terephthalate by sputtering evaporation method. Then slits were provided on a part of the thin film by YAG laser, and thus the electrode was divided into a measuring electrode, a counter electrode and a detecting electrode. On top of that, water solution containing enzymes, electron carriers, and hydrophilic high-polymer was dripped such that the water solution covered the measuring electrode as a center and parts of the counter electrode as well as the detecting electrode. Then the water solution was dried to form a reagent layer.
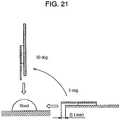
- Fig. 21illustrates a test method for confirming a blood-sacking performance of the sensor depending on a blood-supplying angle in the blood-sugar value sensor discussed above. Table 1 shows the test result.
- a small blood-supplying anglewhen a user supplies the blood to the sample supplying path, the blood attaches to the rear side of the insulating board firstly. Thus even if the user tries to supply the blood again, the blood is pulled by the blood attached to the rear side. This may be a reason why the conventional sensor does not work well.
- Fig. 22illustrates a test method for testing the sensor in the blood-sacking performance depending on the blood-supplying angle.
- bloodis attached to the rear side of the insulating board in advance at an area of 5mm from the end of the board in order to prevent the blood from being sacked.
- Table 2shows the test result.
- the sensorcan sack the blood easily at any blood-supplying angle when distance S is not less than 0.25mm.
- first insulating board 51 and second insulating board 58are deviated each other so that both the ends are placed at different places viewed from a plan view. This allows the sample liquid to be sacked exactly and easily.
- an enzyme sensor as the biosensoris described.
- the present disclosureis similarly applicable to biosensors including a molecular recognition element reacting not only with the enzyme but also with germ, antibody, DNA, or RNA.
- two boards bonded togetherform the sample supplying path, from which the sample liquid is taken out, between the boards.
- An openingis provided as an inlet at respective ends of both boards for accepting the sample liquid.
- the ends forming the inletare located at different places or shaped in different forms viewed from a plan view of the biosensor.
Landscapes
- Health & Medical Sciences (AREA)
- Life Sciences & Earth Sciences (AREA)
- Chemical & Material Sciences (AREA)
- Engineering & Computer Science (AREA)
- Immunology (AREA)
- Physics & Mathematics (AREA)
- Organic Chemistry (AREA)
- Molecular Biology (AREA)
- General Health & Medical Sciences (AREA)
- Biochemistry (AREA)
- Analytical Chemistry (AREA)
- Zoology (AREA)
- Proteomics, Peptides & Aminoacids (AREA)
- Wood Science & Technology (AREA)
- Biomedical Technology (AREA)
- Hematology (AREA)
- Biophysics (AREA)
- General Physics & Mathematics (AREA)
- Pathology (AREA)
- Biotechnology (AREA)
- Microbiology (AREA)
- Genetics & Genomics (AREA)
- Bioinformatics & Cheminformatics (AREA)
- General Engineering & Computer Science (AREA)
- Urology & Nephrology (AREA)
- Chemical Kinetics & Catalysis (AREA)
- Electrochemistry (AREA)
- Food Science & Technology (AREA)
- Medicinal Chemistry (AREA)
- Optics & Photonics (AREA)
- Emergency Medicine (AREA)
- Cell Biology (AREA)
- Investigating Or Analysing Biological Materials (AREA)
- Investigating Or Analyzing Materials By The Use Of Electric Means (AREA)
- Apparatus Associated With Microorganisms And Enzymes (AREA)
Description
- The present invention provides a novel measuring method which reduces measurement errors caused by a biosensor.
- Biosensors measure the quantity of a substrate included in sample liquid. The sensors utilize molecular recognition capability of bio material such as germ, enzyme, antibody, DNA, RNA and the like, and uses the bio material as a molecular recognizing element. In other words, when the bio material recognizes an objective substrate, it reacts such that the germ breathes, emits light, consumes oxygen, or causes enzyme reaction. The biosensors utilize those reactions and measure the quantity of the substrate included in the sample liquid. Among the biosensors, enzyme sensors have been promoted to practical use. For instance, an enzyme sensor for glucose, lactic acid, cholesterol, and amino acid is used in medical measurement and food industry. The enzyme sensor reduces an electron carrier with an electron produced by the reaction between the substrate and the enzyme included in the sample liquid, i.e., specimen. A measuring device measures the reduced amount of the electron carrier electrochemically, so that quantative analysis of the specimen is carried out.
- Various kinds of biosensors, such as the one discussed above, and as shown in
US 5,352,351 A , have been proposed. A conventional biosensor, biosensor Z, will be described hereinafter.Fig. 16(a) shows a perspective exploded view of biosensor Z.Fig. 16(b) shows a structure of an electrode formed at a tip of biosensor Z. A method of measuring a quantity of a substrate in a sample liquid will be described with reference toFig. 16(b) . - First, biosensor Z is inserted into a measuring device. The measuring device applies a given voltage across
counter electrode 1103a and measuringelectrode 1103b. Then the sample liquid is supplied to inlet 1106b of a sample supplying path. The sample liquid is sacked into the supplying path due to capillary phenomenon, and passes oncounter electrode 1103a, which is nearer to inlet 1106b, and arrives at measuringelectrode 1103b. Thenreagent layer 1105 starts dissolving. At this time, the measuring device detects an electrical change occurring betweencounter electrode 1103a and measuringelectrode 1103b, and starts measuring the quantity. The quantity of the substrate included in the sample liquid is thus measured. - Specifically, oxidoreductase and an electron acceptor retained in the reagent layer dissolve into the sample liquid, and enzyme reaction progresses between the substrate in the liquid. Then the electron acceptor is reduced. After the reaction finishes, the reduced electron acceptor is oxidized electrochemically. A concentration of the substrate can be measured using an oxidation current measured when the acceptor is oxidized.
- However, the conventional biosensor Z has some problems to be solved. In particular, when the measuring device detects the electrical change in
reagent layer 1105, various factors influence measurement accuracy and sensitivity of the measuring device. - First, an incorrect operation by a user influences them. For instance: (1) After the user supplies the sample liquid to the sample supplying path, the user adds the sample liquid before the measuring device completes the measurement; (2) The user tries to measure the quantity with a biosensor which have been already used; (3) The user supplies the sample liquid to a incorrect place; (4) The user inserts the biosensor into the measuring device in a wrong direction; and (5) When supplying the sample liquid, the user fails to pinpoint an inlet of the sample supplying path, has the sample liquid attach to a surrounding area, and thus has the sample liquid not run into the path. Thus some ways have been desired to avoid those incorrect operations which influence the measurement accuracy. In particular, preventing aged users from the incorrect operations is required.
- Second, characteristics of an object to be measured influence them. For instance, when a glucose concentration of human blood is measured with a biosensor, a viscosity of the blood may influence measurement accuracy. Hematocrit, which is generally known as an index of blood viscosity, indicates a volume percentage of erythrocyte included in the blood. Blood in a person who does not suffer from anemia includes 50-60 volume% of water and 40-50 volume% of erythrocyte. If suffering from renal anemia due to chronic renal failure, a person has blood have the volume percentage of hematocrit decrease to less than 15%. Appropriate treatment requires to restrain the influence to hematocrit in the blood for accurate measurement of glucose concentration in the blood of, e.g., a diabetic.
- Third, a temperature around the measuring device influences them. Measuring devices available in the market for biosensors have been downsized so that users can carry it with them. Soon after moving into indoors from the outside, a user may try to measure the quantity. In this case, the measurement may start before a temperature in the measuring device becomes stable. A sharp change in temperature influences the oxidation current corresponding to a substrate concentration, and thus may lower the measurement accuracy. A body temperature of the user, upon being transmitted to the measuring device via, e.g., the user's hand, might influence the measurement accuracy.
- For solving the above problems, a method according to
claim 1 is provided. Fig. 1 shows a biosensor system.Fig. 2 is an exploded perspective view of a biosensor.Fig. 3 shows combinations of recognizing sections of the biosensor depending on the presence of slits in accordance with the first embodiment.Fig. 4 shows structures of the biosensor and a measuring device.Fig. 5 is a flowchart illustrating processes of measuring a quantity of a substrate included in sample liquid by the biosensor and the measuring device.Fig. 6 is a flowchart illustrating processes of measuring a quantity of a substrate included in sample liquid by the biosensor and the measuring device.Fig. 7 is a flowchart illustrating steps of measuring a quantity of a substrate included in sample liquid by the biosensor and the measuring device.Fig. 8 illustrates a relation between a delay time and a compensation coefficient for compensating a measured quantity of a substrate.Fig. 9 shows a profile at a measurement pre-process.Fig. 10 shows a relation between a blood viscosity, a reaction time of reactive reagent layer and blood, and a measurement sensitivity.Fig. 11 shows a glucose concentration (mg/dl) measured by a conventional method and a measurement pre-process.Fig. 12 shows data CA of a calibration curve.Fig. 13 shows temperature compensation tables.Fig. 14 shows relations between a temperature measured and measurement dispersion at each concentration of a substrate.Fig. 15 shows a temperature change in a measuring device.Fig. 16 is an exploded perspective view of a conventional biosensor.Fig. 17 shows an exploded perspective view and a sectional view of a biosensor.Fig. 18 is an enlarged plan view illustrating a sample supplying path of the biosensor shown inFig. 17 .Fig. 19 shows an exploded view and a sectional view of another example of the biosensor.Fig. 20 is an enlarged plan view illustrating a sample supplying path of the biosensor.Fig. 21 illustrates a test method of sacking blood by the biosensor.Fig. 22 illustrates another test method of sacking blood by the biosensor.- The first embodiment will be demonstrated hereinafter with reference to the accompanying drawings.
Fig. 1 shows a biosensor system.Biosensor system 1 includesbiosensor 30 and measuringdevice 10 havingbiosensor 30 mounted detachably thereto. Sample liquid is dripped on sample-drip point 30a located at a tip ofbiosensor 30. A quantity of a substrate included in the dripped sample liquid is measured by measuringdevice 10. - Measuring
device 10 includes, for instance, supportingsection 2 to whichbiosensor 30 is detachably mounted anddisplay 11 which shows a measured quantity of the substrate included in the sample liquid dripped on sample-drip point 30a. - To measure a quantity of a substrate included in sample liquid with
biosensor system 1, first, a user insertsbiosensor 30 into measuringdevice 10. Then the user drips the sample liquid on sample-drip point 30a while measuringdevice 10 applies a certain voltage to electrodes ofbiosensor 30. The sample liquid dripped, upon being sacked intobiosensor 30, make a reagent layer start dissolving. Measuringdevice 10 detects an electrical change generated between the electrodes ofbiosensor 30, then starts measuring the quantity of the substrate. Biosensor system 1 is suitable to processing human blood as a sample liquid among others, and measuring a quantity of glucose, lactic acid, cholesterol included in the human blood as a substrate. Measuring the quantity of the substrate included in human body fluid is very important for diagnosis and medical treatment for a specific physiological abnormality. In particular, a diabetic is required to monitor his glucose concentration in the blood frequently.- The following demonstration refers to measuring a quantity of glucose included in human blood. However,
biosensor system 1 can measure a quantity of lactic acid, cholesterol and other substrates by selecting an appropriate enzyme as well. - Next,
components forming biosensor 30 will be described with reference toFig. 2 , an exploded perspective view ofbiosensor 30. Insulating board 31 (hereinafter called simply "board") is made of, e.g., polyethylene terephthalate. On a surface ofboard 31, a conductive layer, which is made of a noble metal such as gold and palladium, or an electrically conductive substance such as carbon, is formed by screen printing or sputtering evaporation. The conductive layer may be formed on the entire or at least a part of the surface.Reference numeral 32 denotes an insulating board havingair hole 33 formed at its center.Spacer 34 having a notch is disposed betweenboards board 32 is integrated toboard 31. - On
board 31, the conductive layer is divided by a plurality of slits intocounter electrode 37, measuringelectrode 38, and detectingelectrode 39. In detail, the conductive layer is divided by the following slits: substantially arc-shapedslit 40 formed oncounter electrode 37;slits board 31; slits, 41b, 41d, and 41f and V-shapedslit 41e. The slits formcounter electrode 37, measuringelectrode 38 and detectingelectrode 39. Each electrode may can be formed on at least a part ofboard 31. Measuringdevice 10 may connected to the electrodes with lead wires. Spacer 34 is placed for coveringcounter electrode 37, measuringelectrode 38, and detectingelectrode 39 onboard 31. The notch shaped in a rectangular provided at a center in a front section ofspacer 34 formssample supplying path 35. The sample liquid is dripped toinlet 30a ofsample supplying path 35. The sample liquid dripped toinlet 30a is sacked by capillary phenomenon in an approximately horizontal direction (along arrow AR inFig. 2 ) towardair hole 33.Reference numeral 36 denotes a reagent layer formed by applying reagent, which contains enzymes, electron acceptors, amino acid, sugar alcohol and the like, to portions ofcounter electrode 37, measuringelectrode 38 and detectingelectrode 39, the portions which are exposed from the notch ofspacer 34.- The enzymes may employ the following materials: glucose oxidase, lactate oxidase, cholesterol oxidase, cholesterol estrase, uricase, ascorbate acid oxidase, bilirubin oxidase, glucose dehydrogenase, lactate dehydrogenase.
- The electron acceptor preferably employs ferricyanide kalium, however, may employ p-benzoquinone and its derivatives, phenacine methor sulphate, methylene blue, and pherocane and its derivatives.
- In the biosensor system glucose oxidase is used as oxidoreductase retained in
reagent layer 36, and ferricyanide kalium is used as the electron acceptor in order to measure the glucose concentration in human blood. - The oxidoreductase and the electron acceptor dissolve in the sample liquid (human blood in this embodiment) which is sacked into the sample supplying path, and then the glucose, a substrate in the sample liquid, reacts with the oxidoreductase and the electron acceptor, and the enzyme reaction progresses. Then the electron acceptor is reduced, thus producing ferrocyanide (ferricyanide kalium in this embodiment). After the reaction, the reduced electron acceptor, upon being oxidized electrochemically, generates a current from which the glucose concentration is measured. This series of reactions progress mainly in an area covering slits 40, 41e and detecting
electrode 39. The current produced by the electrochemical change is read out through measuringelectrode 38 and detectingelectrode 39. Reference numeral 42 denotes a recognizing section for recognizing, with measuringdevice 10, a type ofbiosensor 30 and a difference in output characteristics among production lots.Slits counter electrode 37 and detectingelectrode 39 corresponding to recognizingsection 42. The slits enables measuringdevice 10 to recognize the differences in output characteristics electrically.Fig. 3 shows combinations of slits depending on the presence ofslits section 42 ofbiosensor 30.Fig. 3 illustrates seven types of combinations. For instance,Fig. 3(a) shows recognizingsection 42 ofbiosensor 30 for measuring cholesterol. In this case, slits 41g and 41h are not formed.Figs. 3(b), 3(c), and 3(d) illustrate recognizingsection 42 ofbiosensor 30 for measuring lactic acid. InFig. 3(b) , slit 41h is provided only incounter electrode 37, thereby forming compensatingsection 43. InFig. 3(c) ,slit 41g is provided only to detectingelectrode 39, thereby forming compensatingsection 44. InFig. 3(d) , slits 41h and 41g are provided to counterelectrode 37 and detectingelectrode 39, respectively, thereby forming compensatingsection Figs. 3(e), 3(f), and 3(g) illustrate recognizingsection 42 ofbiosensor 30 for measuring glucose. InFig. 3(e) ,slit 41g is provided only to detectingelectrode 39, and slit 41d is formed up toslit 41g. And thus compensatingsection 44 is integrally formed with measuringelectrode 38. InFig. 3(f) , slit 41h is added to the section inFig. 3(e) , thereby forming compensatingsection 43. InFig. 3(g) , slit 41f is formed up toslit 41h shown inFig. 3(f) . Thus, correctingsections electrode 38.- As such, a conductive area between the electrodes can be varied depending on patterns of the slits in recognizing
section 42. This enables measuringdevice 10 to recognize the differences in output characteristics (concentrations of glucose, cholesterol, lactic acid) ofbiosensor 30 and errors depending on production lots. Data and a control program, since being changed appropriately to the substrate according to the recognition, enables the device to be expected in exact measurement. This allows a user not to input compensating data using a compensating chip, and prevents the user from incorrectly handling the device. This embodiment discloses the biosensor having three electrodes. However, a number of electrodes may change, and a biosensor may have at least a pair of electrodes. The patterns of the slits other than those shown inFig. 3 may be formed. - Next, a structure of measuring
device 10 will be explained in detail.Fig. 4 shows structures of biosensor 30 (top view) and measuringdevice 10. Inbiosensor 30,counter electrode 37, measuringelectrode 38 and detectingelectrode 39 are arranged along a flowing direction of a sample from sample-drip point 30a where detectingelectrode 39 is placed most downstream.Counter electrode 37 may be exchanged between measuringelectrode 38 in the arrangement order. Measuringelectrode 38 and detectingelectrode 39 are spaced at a given distance byslits - In measuring
device 10,reference numerals section 42 ofbiosensor 30 into six areas. The six areas are grouped such that the groups correspond toslits slits electrode 38, area C corresponds to detectingelectrode 39, and area E corresponds to measuringelectrode 38. Area A is integrally formed with area B, and areas D and F correspond to compensatingsections Fig. 3 , respectively.Switches respective connectors Connectors Switches 18 to 22, upon being turned on and off under control, select a necessary connector out ofconnectors 13 to 17 which is used for the measurement. Reference numeral 23 denotes a current/voltage converter connected toconnector 12, for converting a current flowing between measuringelectrode 38 and other electrodes into a voltage.Reference numeral 24 denotes an AID converter connected to current/voltage converter 23, for converting a voltage supplied fromcircuit 23 into a pulse.Reference numeral 25 denotes a CPU for controlling to turn on and off the switches and calculating a content of the substrate included in the sample liquid based on the pulse supplied from A/D converter 24.Reference numeral 11 denotes an LCD for displaying measured data calculated byCPU 25.Reference numerals device 10.Temperature measuring sections connector 12 and current/voltage converter 23.- In measuring
device 10 voltages (mV) converted from the currents flowing between the electrodes ofbiosensor 30 are used for detecting changes of the currents. In other words, the voltages indicate the currents flowing between the electrodes. - An operations of
biosensor 30 and measuringdevice 10 will be demonstrated with reference toFig. 5 through Fig. 7 , for measuring a content of a substrate in sample liquid by a method withbiosensor 30. - First, it is determined whether or not
biosensor 30 is properly inserted into supportingsection 2 of measuring device 10 (Step S1). Specifically, this is determined with a switch (not shown) in a connector shown inFig. 4 . Ifbiosensor 30 is properly inserted (step S1: Yes), conductivity between areas A and B is tested (step S2). As shown inFig. 3 , measuringelectrode 38 has no slit formed therein for insulating one electrode itself such asslits electrode 38, areas A and B are connected toconnectors biosensor 30 is inserted into measuringdevice 10 in a direction (a predetermined direction) such that a conductive layer ofbiosensor 30 is oriented normally. - Therefore, conductivity between areas A and B is tested by turning on
switch 18, so that the front and back sides ofbiosensor 30 can be determined. If the conductivity between areas A and B is not detected (step S2: No), it is determined thatbiosensor 30 is inserted front-side back (reversely). Then the measuring process terminates due to an error of detecting the front and back sides (step S3). The error, when being detected, is preferably displayed ondisplay 11, or noticed as an alarm sound from a speaker. These preparations prevent the user easily from dripping blood tobiosensor 30 by mistake whilebiosensor 30 is inserted front-side back. - When the conductivity between areas A and B is detected (step S2: Yes), it is determined whether or not voltages detected between area A and area C and between area A and area E are greater than 5 mV (step S4).
Switches biosensor 30 inserted instep 1 is an used one or not. This is determined since a reaction betweenreagent layer 36 and glucose in the blood has progressed to probably enlarge the detected voltage ifbiosensor 30 is the used one. - If it is determined that the voltage detected between area A and areas C is greater than 5mV (step S4, Yes), it is recognized that
biosensor 30 which is used is inserted, and the measuring process terminates due to an error of an used sensor (step S5). If being detected, the error of used sensor is preferably displayed ondisplay 11, or noticed to a user as an alarm sound from a speaker. This prevents the user easily from dripping blood tobiosensor 30 by mistake while usedbiosensor 30 is inserted. - Next, when the voltage detected between area A and areas C, E is not greater than 5mV (step S4: No), the patterns of the slits is recognized by recognizing
section 42 ofbiosensor 30 which is detected to be inserted at step S1. According to the recognizing result,CPU 25 changes data and a program into appropriate ones for output characteristics of the sensor (steps S6 to S10). In the first embodiment, three patterns of the slits are available, as shown inFigs. 3(e), 3(f), and 3(g) , for a blood-sugar-level sensor which measures a glucose concentration. Specifically, first, conductivity between areas A and D is tested (step S6).Switch 20 is turned on, and then the conductivity between areas A and D is tested, so that it may be determined whether or notbiosensor 30 is proper to measure a blood sugar level and not proper to measure a quantity of lactic acid or cholesterol. - If the conductivity between areas A and D is not detected (step S6: No), it is determined that
biosensor 30 is incompatible with the blood-sugar-level sensor. Then the measuring process terminates (step S7), anddisplay 11 shows an error message, or a speaker sounds an alarm for the user. These prevent the user from recognizing a measurement as a glucose concentration by mistake. - If the conductivity between areas A and D is detected (step S6: Yes), the conductivity between areas A and F is tested (step 8).
Switch 22 is turned on. Then the conductivity between areas A and F is tested, so that the device can recognize differences in output characteristics due to production lots ofbiosensors 30 proper to blood-sugar-level sensors.CPU 25 automatically changes data and programs to which output characteristics corresponding to production lots have been reflected. Thus the user does not need a compensating chip. As a result, the biosensor and the measuring device can be handled more easily, and a higher accuracy of measurement can be expected. - If conductivity between areas A and F is detected (step S8: Yes),
biosensor 30 is defined as a type shown inFig. 3(g) , and result I is stored in a memory (not shown) (step S9). If the conductivity between areas A and F is not detected (step S8: No),biosensor 30 is defined as a type shown inFig. 3(e) or Fig. 3(f) , and result II is stored in the memory (not shown) (step S10). - After the type of
biosensor 30 is recognized, it is determined again whether the voltage detected between area A and areas C, E is greater than 5mV or not (step S11).Switches biosensor 30 before measuringdevice 10 is ready for measurement. This process not only prevents positively the user from using usedbiosensor 30, but also detects that the sample liquid has been dripped by the user before the measurement is available. - If the voltage detected between area A and areas C, E is greater than 5mV (step S11: Yes), it is determined, as a drip error, that the sample liquid is dripped before the measurement is prepared. When being detected, the drip error is preferably displayed on
display 11, notified to a user with an alarm sound from a speaker, or displayed with LEDs (not shown) to give the user an alarm. The user can positively avoid a failure in operation by these operations, and a high accuracy of measurement can be expected. - If the voltage detected between area A and areas C, E is not greater than 5mV (step S11: No), it is determined that the sample liquid is not dripped before the measurement is prepared. Then a completion of the preparation is notified to the user with LEDs (step S13). When being detected, the error is preferably displayed on
display 11, notified to the user with an alarm sound from a speaker, or displayed with LEDs. Receiving this notice, the user takes blood as sample liquid from his body by himself and drips it to sample-drip point 30a ofbiosensor 30 inserted to measuringdevice 10. - Next, it is determined whether or not enough quantity of the sample liquid is sacked through the sample supplying path from
point 30a (steps S14 to S20). Inbiosensor 30,counter electrode 37, measuringelectrode 38, and detectingelectrode 39 are arranged alongsample supplying path 35 from sample-drip point 30a toward a downstream of the sample liquid flow. Detectingelectrode 39 is placed most downstream. Either one of a group consisting ofcounter electrode 37 and measuringelectrode 38, or another group consisting of measuringelectrode 38 and detectingelectrode 39 is selected at a given interval. A voltage is applied to a selected group, so that it is determined whether or not the sample liquid is supplied in a quantity enough for measurement. In a conventional manner, a current change only between measuringelectrode 38 and detectingelectrode 39 is recognized. In the conventional manner, it is very difficult to identify a cause why the measurement does not start even though enough quantity of the sample liquid is supplied to the sample supplying path, or since the quantity is less than enough quantity for starting the measurement. - Specifically, for the group of
counter electrode 37 and measuringelectrode 38,switch 19 is turned off, and switch 21 is turned on for generating a voltage between areas A and E. For the group of measuringelectrode 38 and detectingelectrode 39,switch 19 is turned on, and switch 21 is turned off for generating a voltage between areas A and C. As such, switches 19 and 21 are on-off controlled, thereby selecting and switching either one of the groups easily. For easy description, hereinafter, generating the voltage betweencounter electrode 37 and measuringelectrode 38 is referred to as generating a voltage between areas A and E. Also generating a voltage between measuringelectrode 38 and detectingelectrode 39 is referred to as generating a voltage between areas A and C. - Further in this embodiment, as an example, a pair of areas A and E and a pair of areas A and C are switched every 0.2 seconds, and 0.2V is applied to each pair. It is determined whether or not respective voltages measured between areas A and E and between areas A and C reaches 10mV (a given threshold). These numbers may be changed responsive to a type of biosensors.
- Back to the flowchart shown in
Fig. 6 , the operations of the biosensor and the measuring device will be further described hereinafter. First, a voltage of 0.2V is produced between areas A and E which are located at the upstream portion of the sample supplying path, and it is determined whether or not the voltage measured between areas A and E exceeds 10mV (step S14). If the voltage measured does not exceed 10mV (step S14: No), a voltage of 0.2V is applied between areas A and C located downstream of the path. Then it is determined whether the voltage measured between areas A and C exceeds 10mV or not (step S15). - If the voltage measured between areas A and C does not exceed 10mV (step S15: No), it is determined whether or not 3 minutes have passed since the voltage was produced between areas A and E in step S14 (step S16). If the 3 minutes has not passed (step S16: No), the processes from step S14 and onward are repeated. If respective voltages between areas A and E and between areas A and C do not reach 10 mV for 3 minutes (step S16: Yes), the measuring process terminates.
- If the voltage between areas A and E is determined to reach 10mV (step S14: Yes), it is determined whether or not the voltage between areas A and C reaches 10mV (step S17). If the voltage between areas A and C does not reach 10mV (step S17: No), it is determined whether or not 10 seconds (a given period) have passed since the voltage between areas A and E was determined to reach 10mV (step S18). If the 10 seconds has not passed, the processes in steps S17 and S18 are repeated. While the 10 seconds passes, the measuring process temporarily halts until the voltage measured between areas A and C reaches 10mV (step S18; No). In this case, the sample liquid dripped is probably insufficient, it is preferable to display the error message on
display 11, or sound an alarm to a user from a speaker so that the user may understand that the sample liquid should be added. If the voltage measured between areas A and C does not reach 10mV even after 10 seconds has passed (step S18: Yes), the measuring process terminates due to an error of specimen insufficient (step S19). - While the 10second passes since the voltage between areas A and E was determined to reach 10mV in step S14, if a user adds the sample liquid, a final measurement accuracy is lowered. This was found by inventors. Specifically, while the user adds the sample liquid, the substrate in the sample liquid originally dripped has reacted on the enzyme included in
reagent layer 36 and enzyme reaction has progressed. Thus a reduced substance has been produced before the measurement starts. After the added sample liquid reaches between areas A and C, the quantity of the substrate is possibly measured. In this case, the reduced substance already produced influences this measurement, i.e., makes the voltage apparently greater. In other words, as a time since the voltage between areas A and E is determined to reach 10mV in step S14 becomes longer, the measurement is influenced more by the reduced form. - In order to eliminate a measurement error caused by adding the sample liquid, a quantity of the substrate is compensated responsive to a measured voltage in measuring
device 10. The compensation depends on the lapse of time (delay time) since the voltage between areas A and E was determined to reach 10mV in step S14 until the voltage between areas A and C is determined to reach 10mV in step S17. Fig. 8 is a sensitivity compensation table illustrating a relation between the delay time and a compensation coefficient for the measured quantity of the substrate. The vertical axis represents the compensation coefficient, and the horizontal axis represents the delay time. For instance, if the delay time is 5 seconds, the measured quantity is compensated by 10% lower. As a result, 90% of the measured quantity becomes a compensated quantity. This kind of the sensitivity compensation table is stored in a memory (not shown) of measuringdevice 10, and this table is referred when a final quantity of the substrate is calculated.- In
biosensor 30 shown inFig. 2 ,counter electrode 37 is formed such thatslit 41f extends towardslit 41c and connects withslit 41b. Then a drip position error caused through dripping the sample liquid toair hole 33 by mistake, can be detected. In the flowchart shown inFig. 6 , if the voltage measured between areas A and C is determined to excess 10mV not the voltage between areas A and E (step S15: Yes), it is determined, in 0.2 seconds after the determination, whether or not the voltage between areas A and E reaches 10mV (step S20). If the voltage between areas A and E does not excess 10mV, it is determined that the sample liquid has been dripped to an incorrect position, and the measuring process terminates (step S50). - If the sample liquid is normally dripped on sample-
drip point 30a, the liquid is sacked alongsample supplying path 35 toair hole 33 and then moistenscounter electrode 37, measuringelectrode 38 and detectingelectrode 39 in this order. However, if the voltage measured only between areas A and C changes largely, a user has probably dripped the sample liquid toair hole 33 incorrectly. In this case, it is determined that an exact measurement is not expected, and the measuring process compulsorily terminates due to an error of dripping at a incorrect position. This can avoid a measurement error due to an incorrect operation by the user. - If the voltage measured between areas A and C is determined to reach 10mV (step S17: Yes), or if the voltage measured between areas A and E is determined to reach 10mV (step S20: Yes), enough quantity of the sample liquid is determined to be dripped. Then a pre-process for measuring the quantity of the substrate starts, and a timer (not shown) of measuring
device 10 counts time (step S21). - Next, conductivity between areas A and F is tested (step S22).
Switch 22 is turned on, and the conductivity is tested between areas A and F. If the conductivity is detected (step S22: Yes), it is determined whether result I identifying a type ofbiosensor 30 is stored in the memory in step S9 or not (step S23). If result I is stored (step S23: Yes), it is determined that the type ofbiosensor 30 is that shown inFig. 3(g) . Calibration curve data is prepared using voltages measured when the reduced electron acceptor is oxidized electrochemically. Then calibration curve F7 is prepared as the calibration curve data for specifying a concentration of the glucose in the sample liquid (step S24). - On the other hand, when result II is stored (step S23: No), it is determined that the type of
biosensor 30 is that shown inFig. 3(e) , and calibration curve F5 is prepared as the calibration curve data (step S25). If the conductivity is not detected between areas A and F (step S22: No), it is determined that the type ofbiosensor 30 is that shown inFig. 3(f) , and calibration curve F6 is prepared as the calibration curve data (step S26). - As discussed above, a difference in output characteristics of
biosensor 30 is automatically recognized responsive to the slits in recognizingsection 42 ofbiosensor 30. The calibration curve data appropriate to the output characteristics is then automatically selected and set. Therefore, a user does not need a compensating chip, andCPU 25 switches automatically the calibration curve data to which the output characteristics depending on production lots are reflected. As a result, an incorrect measurement using user's incorrect data can be avoided, and a highly accurate measurement can be expected. - After the calibration curve is prepared in steps S24 to S26, the measuring pre-process starts (step S27 - S29). The pre-process will be demonstrated with reference to
Fig. 9 , which illustrates a profile of the pre-process. - In the profile shown in
Fig. 9 , the pre-process starts at time t0. Specifically, time t0 is the time when the timer (not shown) of measuringdevice 10 starts counting time. The profile of the pre-process includes three consecutive periods, for instance, a first voltage period t0-t1, a standby period t1-t2, and a second voltage period t2-t3. - During the first voltage period, voltage V1 is applied to areas A, C and E, to have the enzyme reaction progress. This increases a voltage measured by oxidizing ferrocyanide electrochemically similar to an exponential function. Next, during the standby period, voltage V1 applied during the first voltage period is set at zero, and thus the ferrocyanide is not oxidized electrochemically, but the enzyme reaction keeps progressing. The ferrocyanide is thus accumulated. During the second voltage period, voltage V2 is applied to areas A, C and E to oxidize the ferrocyanide accumulated during the standby period all at once. Then a quantity of discharged electron increases, and a high response current is thus observed at time t2. A current reaching the high response current decreases, as time passes, into a stable value i3 at time t3. In the pre-process, switches 19 and 21 are simultaneously turned on in measuring
device 10, so that a voltage is applied to counterelectrode 37 and detectingelectrode 39 as one unit. - Recently, shortening a measurement time has been desired to upgrade a performance of the biosensor. When a quantity of a substrate is measured with a biosensor, a viscosity of the sample liquid critically influences measurement accuracy. This was found by the inventor. In particular, when human blood is measured as the sample liquid, blood with high viscosity (high Hct) lowers measurement sensitivity, and blood with low viscosity (low Hct) increases the measurement sensitivity. This phenomenon derives from a dissolving speed of a reagent layer in the blood, i.e., slow dissolution in high Hct and quick dissolution in low Hct. Thus the viscosity influences the measurement sensitivity of the biosensor.
Fig. 10 shows a relation between a blood viscosity, a reaction time of reactive reagent layer on the blood, and a measurement sensitivity. Data shown inFig. 10 is measured by a conventional method, which applies a voltage within a period corresponding to the second voltage period shown inFig. 9 and measures the voltage. As shown inFig. 10 , influence due to differences in viscosity (Hct in the case of blood) to measurement sensitivity increases at a shorter reaction time. Great difference is observed between the high Hct and the low Hct particularly at a reaction time around 5 sec.- Therefore, the conventional method tends to reveal a measurement error obviously due to blood viscosity.
- During the first voltage period of the pre-process, reaction products produced at an initial stage of dissolving
reagent layer 36 is thus compulsorily consumed by applying voltage V1. During the first voltage period, since the low Hct has a higher speed in enzyme reaction than the high Hct, greater reaction products are produced in the low Hct and thus greater reaction products are consumed. However, if a voltage is applied for too long period, reaction products are consumed too much, and responsivity of a voltage detected in the second voltage period may probably decline. Therefore, an effective first voltage period t1-t0 may be 3 to 13 seconds. The voltage to be applied may be further increased, so that a voltage application time is preferably 2 to 10 seconds. Voltage VI may range preferably from 0.1 to 0.8V. - Next, during the standby period, the enzyme reaction progresses again, and the reaction products in the low Hct blood, the reaction products which have been consumed in the first voltage period, are quickly recovered and accumulated in approximately the same quantity as those in the high Hct blood. Too long a standby period or too short a standby period influences the final measurement sensitivity in a different way.
- If the standby period is too short, a response value i3 measured at time t3 becomes too low, and a measurement error becomes great. If the standby period is too long, a difference in enzyme reaction speed between the low Hct blood and the high Hct blood probably becomes greater. The standby period is determined so that the difference in enzyme reaction speeds may not become greater. As a result, the standby period t2-t1 is 1 to 10 seconds and preferably 2 to 10 seconds.
- During the second voltage period, voltage V2 starts being applied at time t2. And just after time t2, the voltage is not stable and requires a time to be stable. A voltage similar to that during the first voltage period is not necessarily applied, and a lower voltage than voltage V1 is preferably applied. The lower voltage may be low enough to oxidize ferrocyanide kalium. The second voltage period t3-t2 is thus preferably 2 to 10 seconds. Voltage V2 is preferably 0.05 to 0.6V. Finally, value i3 measured between areas A, C and area E at time t3 is read out, and the quantity of the substrate (glucose) in the sample liquid is calculated.
- The set time discussed above is particularly suitable for a quantity measuring with the biosensor including electrodes made of noble metal such as palladium. A reagent is not limited to glucose oxidase and/or glucose dehydrogenase and ferricyanide kalium, but includes amino acid, sugar alcohol. The set time is also suitable to a biosensor including organic acid.
- After the sample liquid is supplied to sample supplying
path 35, the reaction ofreagent layer 36 in the sample liquid is incubated in a certain period before the quantity of the substrate is measured. The incubate period may change depending on the laps of time since the voltage measured between areas A and E exceeds a threshold (10mV) in step S14 until the voltage between areas A and C exceeds the threshold (10mV) in step S17. Fig. 11 shows glucose concentrations (mg/dl) measured by the conventional method and the measuring pre-process discussed above for three types of blood having contents of hematocrit (Hct) of 25%, 45% and 65%. Reference mark R inFig. 11 denotes the measurement result by the pre-process. The other two results were measured by the conventional method with 15 seconds and 30 seconds of the reaction time. The pre-process was performed under the following condition: the first voltage period was 6 seconds; voltage V1 was 0.5V; the standby period was 6 seconds; the second voltage period was 3 seconds; and voltage V2 was 0.2V. As compared with a measurement for: the Hct was 45%; and the glucose concentration was 100 mg/dl, an actual measurement proved that low Hct (25%) blood and high Hct (65%) blood produce greater dispersion in the measurement, and the response values of low Hct disperse in a higher range and those of high Hct disperse in a lower range.- Further, the dispersion becomes greater at a shorter reaction time. At a reaction time of 15 seconds, the dispersion is produced by 10% higher (low Hct of 25%) and by 10% lower (high Hct of 65%). At a reaction time of 30 seconds, the dispersion is produced by 5% higher (low Hct of 25%) and by 5% lower (high Hct of 65%). In this pre-process, the dispersion is produced by 3% higher (low Hct of 25%) and by 3% lower (high Hct of 65%). At a reaction time of 15 seconds,
Fig. 11 teaches that the pre-process can reduce the dispersion due to the types of Hct while the reaction time is the same as that in the conventional method. - Back to
Fig. 7 again, the description of the measuring process continues hereinafter. The measuring pre-process starts, and 0.5V is applied between areas A and C, and between areas A and E for 6 seconds in the first voltage period (step S27). After the first voltage period, the standby period is taken for 6 sec., and the voltage applied is cancelled in the standby period (step S28). After the standby period, the second voltage period starts, and 0.2V is applied between areas A and C, and between areas A and E for 3 sec. (step S29). Then value i3 is read out (step 30). - After value i3 is read out in step S30,
temperature measuring sections device 10 are controlled to measure a temperature in measuring device 10 (step S31). Specifically, switch 27 is turned on, and measuringsection 26 measures the temperature (step S31). Then switch 27 is turned off, switch 29 is turned on, and measuringsection 28 measures the temperature (step S32). - The two temperatures measured by
temperature measuring section section 26 or 28 (step S33: No). As such, plural temperature-measuring sections (26, 28) are disposed in measuringdevice 10, and their measuring results are compared, so that a failure can be detected exactly and easily. This can avoid a measurement error caused by a measurement at an irregular temperature. The temperatures are measured just after the value has been read out in step S30; however, the temperatures may be measured, for instance, when the pre-process starts in step S21. - If the difference between the two temperatures measured ranges within the given threshold (step S33: Yes), the temperatures are temporarily stored in a memory (not shown). At this time, the temperature measured by either one of
sections biosensor 30 corresponds to step S24, calibration curve F7 is referred (step S35). In the same manner, ifbiosensor 30 corresponds to step S25, calibration curve F5 is referred (step S36). Ifbiosensor 30 corresponds to step S26, calibration curve F6 is referred (step S37). Fig. 12 shows calibration curve data CA measured in steps S34, S35 and S36. In data CA, a voltage measured in step S30 and a concentration (mg/dl) of a substrate included in sample liquid are determined depending on each output characteristic F1 to F7 ofbiosensor 30. For instance, if a measured voltage is 25mV, and the biosensor corresponds to calibration curve F5, a substrate concentration of 14 (mg/dl) is stored in the memory.- Next, a concentration of the substrate selected in step S35, S36 or S37 is compensated by a compensation coefficient corresponding to the delay time which has been found in steps S14 and S17 and stored in the memory (step S38). Specifically, the concentration is compensated by the following equation (1):

- Next, the concentration compensated in step S38 is compensated according to the temperatures measured in steps S31 to S33 (step S39). The temperature stored in the memory in step S33 is read out, and a temperature compensation table shown in
Fig. 13 is referred, thereby determining a temperature compensation coefficient to be applied to concentration D1. Fig. 13 shows temperature compensation tables. Compensation table T10 is used for the temperature of 10°C. In the same manner, table T15 is for the temperature of 15°C, and table T20 is for the temperature of 20°C. The compensation tables specifies a relation between substrate concentration D1 in the sample liquid and a temperature compensation coefficient is specified. The temperature compensation coefficient is determined based on a concentration at 25°C as a reference, and shows a coefficient for compensation with respect to the concentration. Specifically, the compensation for temperature is performed according to the following equation (2):
- The inventors found experimentally that measurement accuracy was influenced by a combination of a measured temperature and a concentration of a substrate. The influence will be described hereinafter.
Fig. 14 shows relations between the measured temperature and measurement dispersion (bias) at each concentration of glucose. The measurement dispersion inFig. 14 is defined by a coefficient of a change of a concentration of glucose measured at 25°C according to a change of the measured temperature.Fig. 14(a) shows a relation between the dispersion and the measured temperature in the case of glucose concentration of 50mg/dl at 25°C. Similarly,Fig. 14(b) shows the relation for the glucose concentration of 100mg/dl and the temperature of 25°C.Fig. 14(c) shows the relation for the glucose concentration of 200mg/dl and the temperature of 25°C.Fig. 14(d) shows the relation for the glucose concentration of 300mg/dl and the temperature of 25°C.Fig. 14(e) shows the relation for the glucose concentration of 420mg/dl and the temperature of 25°C.Fig. 14(f) shows the relation for the glucose concentration 550mg/dl and the temperature of 25°C. - These experimental data point out the following two tendencies. First, for the same glucose concentration, the measuring dispersion increases as a difference between a measured temperature and
reference temperature 25°C becomes greater. In detail, the dispersion increases in a negative direction as a measured temperature decreases from the reference temperature, and the dispersion increases in a positive direction as a measured temperature rises from the reference temperature. Second, the dispersion converges at the glucose concentration of 300mg/dl, which seems a boundary, even though the glucose concentration increases. Specifically,Fig. 14(a) indicates the dispersion of approximately 28% at 40°C,Fig. 14(c) indicates approximately 50%,Fig. 14(d) indicates approximately 60%, andFig. 14(f) indicates approximately 50%. A similar tendency is found in a low temperature range such as a measured temperature of 10°C. - This tendency is reflected to the tables shown in
Fig. 13 . First, the measuring dispersion increases as a difference between a measured temperature and reference temperature of 25 °C becomes greater for the same glucose concentration. Second, the dispersion starts converging at the glucose concentration of 300mg/dl as a boundary even though the glucose concentration increases. These two aspects are taken into consideration for preparing the tables. The measurement accuracy is remarkably improved by compensating a concentration referring to the temperature compensation table, in which combinations of measured temperatures and concentrations of the substrate are well considered, rather than compensating a concentration only based on a measured temperature. - In an operable temperature range of biosensor 30 (10°C to 40°C in this embodiment), a temperature compensation table for every 1°C may be prepared, or the table for every given temperature range (e.g. 5°C). If a temperature at a middle of the given temperature range is detected, a temperature compensation coefficient may be calculated by a linear interpolation with a temperature compensation table including the detected temperature.
- Back to the flowchart in
Fig. 7 , concentration D2, which has undergone the temperature compensation discussed above, is output ondisplay 11 of measuringdevice 10 as a final concentration of the substrate (step S40). As discussed above, the time when the sample liquid is added, the measured temperature, and the combination of the measured temperature and the concentration are considered as influence factors to the measurement. A viscosity (Hct) of sample liquid is also considered as an influence factor. Those factors are taken into consideration when the quantity of a substrate is measured. As a result, the measurement accuracy is remarkably improved from the measurement by a conventional method. - The following method can be introduced in order to further decrease a measurement error due to temperature.
- Before
biosensor 30 is inserted into measuringdevice 10, the temperature is measured successively and stored. Afterbiosensor 30 is inserted, temperatures measured in steps S31 and S32 are compared with the stored ones. If large differences between the stored temperatures and the measured ones are found, the measuring process may compulsorily terminates due to a significant temperature change which influences a measurement error. - A portable biosensor system being carried easily, is exposed in various temperature changes depending on the outside environment. For instance, the biosensor system may be influenced by a temperature of a user's hand, or a sharp change in temperature when a user moves from outside to indoors. The sharp temperature-change can be expected, it takes reasonable time for measuring
device 10 to be stabilized in its temperature change. Fig. 15 shows temperature changes in measuringdevice 10. A temperature change indevice 10 moving from a place at a temperature of 10°C to another place at a temperature of that of 25°C is shown inFig. 15 . A temperature change indevice 10 moving from a place at a temperature of 40°C to a place of a temperature of 25°C is also shown inFig. 15. Fig. 15 shows that it takes approximately 30 minutes to stabilize the temperature changes in an ambient temperature ranging from 10 to 40°C. If the temperature compensation is carried while the temperature changes, an exact temperature compensation may not be expected.- Therefore, if a great difference between the temperature stored in advance and the temperatures measured in steps S31 and S32, the measuring process may compulsorily terminate due to the temperature change which may influence a measuring error. This further improves the accuracy of temperature compensation in measuring
device 10. A temperature may be measured beforebiosensor 30 is inserted into measuringdevice 10 at given intervals, e.g., 5-minute interval, or successively. Based on the magnitude of temperature change, the measuring process may be cancelled although a user tries to carry it out. - The biosensor in accordance with the second exemplary embodiment not according to the present invention will be demonstrated hereinafter. In this embodiment, an enzyme sensor is described. The sensor employs an enzyme as a molecule recognizing element which specifically reacts on a specific material contained in sample liquid.
- An incorrect operation by a user influences a measuring accuracy. Thus the second embodiment discusses this problem. In particular, a user fails to drip sample liquid to an inlet of a sample supplying path, and the sample liquid attaches to a surrounding areas of the inlet. As a result, the sample supplying path cannot carry the sample liquid. Such kind of incorrect operations by a user may affect a measurement accuracy, and the ways how to avoid those mis-operations are demonstrated in this embodiment.
- According to a structure shown in
Fig. 16 orFig. 2 , at the inlet, to which sample liquid is supplied, of the sample supplying path, an insulating board and a cover forming the path have respective ends of the same shape at the same location in a plan view. Therefore, a sample supplying angle becomes small. Or when the sample liquid attaches to a rear side (a side having no electrode formed thereon) of the insulating board by mistake, this sample liquid attached to the rear side may prevents the user from again supplying the sample liquid. As a result, the sample liquid is not supplied well, which causes a failure in measurement or a measurement error. - A biosensor which can accept the sample liquid exactly and easily will be specifically described hereinafter.
Fig. 17(a) is an exploded perspective view of the biosensor in accordance with the second embodiment.Fig. 17(b) is a cross section at a center of the sample supplying path in the longitudinal direction of the biosensor. InFig. 17 , measuringelectrode 52,counter electrode 53 and detectingelectrode 54 are formed on first insulatingboard 51. Those electrodes are made of electrically conductive material. Detectingelectrode 54 in this embodiment functions not only as an electrode for detecting a insufficiency of a specimen but also as a part of a reference electrode or as a part of the counter electrode. Fig. 17 shows that the electrodes discussed above are disposed on the first insulating board; however, those electrodes may be divided and disposed also on second insulatingboard 58 to be a cover board located opposite tofirst board 51.Boards - Each electrode is preferably made of electrically conductive material such as noble metal including gold, platinum, and palladium, or simple material such as carbon. They may be also made of composite material such as carbon paste or noble metal paste. In the former case, a conductive layer can be formed on
board board - The conductive layer is formed on an entire or a part of first insulating
board 51 or second insulatingboard 58 by the sputtering evaporation method or the screen printing method. Then slits are provided by laser for forming and dividing the electrodes. The electrodes may be formed by the screen printing method or a sputtering evaporation method on a printed board or a masked board having electrode patterns formed in advance. - On the electrodes thus formed,
reagent layer 55 is formed.Reagent layer 35 includes enzymes, electron carriers and hydrophilic high-polymer. The enzymes include glucose oxidase, lactate oxidase, cholesterol oxidase, cholesterol estrase, uricase, ascorbate acid oxidase, bilirubin oxidase, glucose dehydrogenase, lactate dehydrogenase. The electron carrier preferably employ ferricyanide kalium and may employ p-benzoquinone and its derivatives, phenacine methor sulphate, methylene blue, or pherocane and its derivatives. - The hydrophilic high-polymer employ, e.g. carboxymethyl cellulose, hdroxy-ethyl cellulose, hydroxy propyl cellulose, methyl cellulose, ethyl cellulose, ethyl hydroxyethyl cellulose, carboxy methyl ethyl cellulose, polyvinyl alcohol, polyvinyl pyrrolidone, polyamino acids such as poly-lysine, sulfonated polystyrene acid, gelatin and its derivatives, acrylic acid and its salts, methacrylic acid and its salts, starch and its derivatives, anhydrous maleci acid and its salts, or agarose gel and its derivatives.
- First insulating
board 51 and second insulatingboard 58 are bonded viaspacer 56 in between for formingsample supplying path 57, from which sample liquid is supplied.Spacer 56 has slit-shapednotch 57 formed therein. - A significant difference from the conventional biosensor is that
first board 51 andsecond board 58 formingpath 57 are placed with their ends at an inlet ofsample supplying path 57 deviated each other and bonded. That is, respective ends are placed at different places from each other. This preparation is viewed from a plan view. In other words,first board 51 andsecond board 58 are in the same shape near the inlet ofpath 57; however,second board 58 andspacer 56 protrude toward the inlet with respect tofirst board 51. - This allows the sample liquid to be sacked exactly and easily even though the sample supplying angle is small. This prevents the sample liquid from attaching to the rear side of
first board 51. Even if the sample liquid attaches to the rear side, the sample liquid can be supplied again smoothly. - The deviation of
second board 58 fromfirst board 51 at the ends thereof, that is, distance S1 betweenpoints path 57 shown inFig. 18 crosses withfirst board 51 andsecond board 58 atpoints - If being less than 0.1mm, distance S1 is too short. The sample liquid thus cannot be supplied well if the sample supplying angle is small as in the conventional biosensor.
- If
first board 51 has different shape fromsecond board 58 near the inlet ofpath 57 as shown inFig. 19 , a similar advantage to that discussed above is measurable. In this case, the deviation at the ends thereof, i.e., center line L ofpath 57 shown inFig. 20 crosses withfirst board 51 atpoint 64b and crosses withsecond board 58 atpoint 63b. Distance S2 betweenpoint 63b andpoint 64b is preferably not less than 0.1mm and more preferably ranging from 0.25 to 1.0mm. - In the structures illustrated in
Fig. 17 to Fig. 20 , a depth of the sample supplying path, i.e., a thickness ofspacer 56, ranges preferably from 0.05 to 0.3 mm in order to supply the sample liquid quickly to slit-shapedpath 57. Spacer 56 is preferably made of polyethylene terephthalate, polycarbonate, polyimide, polybutylene terephthalate, polyamide, polyvinyl chloride, polyvinylidene chloride, or nylon.- For form
sample supplying path 57,first board 51 may be bonded tosecond board 58 integrated withspacer 56 into one unit. Reagent layer 55 is disposed on entire or a part of a surface of the electrode, and however, may be disposed anywhere insample supplying path 57 as long as it does not lower the performance of the biosensor. The sample liquid is supplied to the biosensor throughpath 57 having a structure discussed above by the capillary phenomenon. However,air hole 59 through which air flows outside the biosensor is necessary inpath 57 in order to supply the sample liquid smoothly.Air hole 59 may shape in a rectangle, circle or polygon.Air hole 59 may be located anywhere inpath 57 as long as it does not block the supply of sample liquid.- Hydrophilic treatment which may be performed inside
path 57 enables the sample liquid to be supplied intopath 57 more quickly and accurately. The hydrophilic treatment is realized by developing surface active agent into or onsecond board 58, or by roughing the surface of the board by sandblasting, electric-discharge machining, non-glare process, mat process, or chemical plating. - In the biosensor discussed above, a current is generated by the reaction between a specific component in the sample liquid and
reagent layer 55 containing enzymes. The current is conducted to an external measuring instrument (not shown) via lead-wires electrode 52,counter electrode 53, detectingelectrode 54 for being measured. - For the current measurement, a triple-electrode method employing measuring
electrode 52,counter electrode 53 and detectingelectrode 54 is available as discussed in this embodiment not according to the present invention. Besides the triple-electrode method, a double-electrode method employing only measuringelectrode 52 andcounter electrode 53 is available. Either method can produce the similar advantage to that of this embodiment; however, the triple-electrode method achieves more precise measurement. - A thin palladium film of 8nm thickness was formed on the entire surface of the first insulating board made of polyethylene terephthalate by sputtering evaporation method. Then slits were provided on a part of the thin film by YAG laser, and thus the electrode was divided into a measuring electrode, a counter electrode and a detecting electrode. On top of that, water solution containing enzymes, electron carriers, and hydrophilic high-polymer was dripped such that the water solution covered the measuring electrode as a center and parts of the counter electrode as well as the detecting electrode. Then the water solution was dried to form a reagent layer. Further on top of that, a spacer made of polyethylene terephthalate and having a notch together with the second insulating board (cover) made of polyethylene terephthalate and having the air hole was bonded. As a result, the sample supplying path, i.e., a capillary which leads blood, was formed.
- In order to confirm the advantage of the present disclosure, the following six types of blood-sugar value sensors having end-deviations (distance S) from the board to the spacer and cover were determined as: S=0 (a conventional sensor), 0.1, 0.25, 0.5, 1.0, and 2.0mm.
- Surface active agent is applied to the surface of the cover (inside of the sample supplying path) in order to supply the blood to the path more quickly.
Fig. 21 illustrates a test method for confirming a blood-sacking performance of the sensor depending on a blood-supplying angle in the blood-sugar value sensor discussed above. Table 1 shows the test result.
- Table 1 tells that the conventional sensor having distance S=0mm does not sack blood and requires several trials of supply for proper sacking when it has a small blood-supplying angle (0 - 30 degree). For a small blood-supplying angle, when a user supplies the blood to the sample supplying path, the blood attaches to the rear side of the insulating board firstly. Thus even if the user tries to supply the blood again, the blood is pulled by the blood attached to the rear side. This may be a reason why the conventional sensor does not work well.
- The sensor of the present disclosure not according to the present invention on the other hand, sometimes requires several sacking operations when the blood-supplying angle is small even at the shortest distance S=0.1mm; however the sensor does sack the blood at all. When the distance S is not less than 0.25mm, the sensor sacks the blood easily at any sacking angle.
Fig. 22 illustrates a test method for testing the sensor in the blood-sacking performance depending on the blood-supplying angle. In this test, blood is attached to the rear side of the insulating board in advance at an area of 5mm from the end of the board in order to prevent the blood from being sacked. Table 2 shows the test result.
- Table 2 shows that the conventional sensor having the distance S=0mm can not sack the blood except the blood-supplying angle of 90 degree. On the other hand, the sensor of the present disclosure sometimes cannot sack the blood when distance S=0.1 mm at a small blood-supplying angle. However, the sensor can sack the blood easily at any blood-supplying angle when distance S is not less than 0.25mm.
- According to the second embodiment discussed above, the respective ends of first insulating
board 51 and second insulatingboard 58 are deviated each other so that both the ends are placed at different places viewed from a plan view. This allows the sample liquid to be sacked exactly and easily. - In the second embodiment, an enzyme sensor as the biosensor is described. The present disclosure is similarly applicable to biosensors including a molecular recognition element reacting not only with the enzyme but also with germ, antibody, DNA, or RNA.
- According to the sensor in accordance with the second embodiment, two boards bonded together form the sample supplying path, from which the sample liquid is taken out, between the boards. An opening is provided as an inlet at respective ends of both boards for accepting the sample liquid. The ends forming the inlet are located at different places or shaped in different forms viewed from a plan view of the biosensor. Thus the supply sample liquid can be sacked exactly and easily even if the sample-supplying angle is not enough (small). Further this prevents the sample liquid from attaching to the rear side of first insulating
board 51. If the sample liquid attaches to the rear side, a user can supply the sample liquid again to allowing the sample liquid to be supplied smoothly.


Claims (3)
- A method of measuring a quantity of a substrate in a sample liquid by inserting a biosensor into a measuring device, the method comprising:providing the biosensor which includes:an insulating board;an electrode part which includes a counter electrode, a measuring electrode and a detecting electrode disposed on at least a part of the insulating board;a sample supplying path which supplies the sample liquid to the electrode part; anda reagent layer at least partially disposed in the sample supplying path;wherein the detecting electrode is the electrode disposed most downstream along the sample supplying path from an inlet of the path along a flow of the sample liquid;providing the measuring device which includes:a supporting section which detachably supports the biosensor;a connecting terminal which applies a voltage to the electrode part; anda driving power supply;applying the voltage to a first group including the counter electrode and the measuring electrode and a second group including the detecting electrode and one of the measuring electrode and the counter electrode by the driving power supply when the biosensor is inserted into the supporting section;determining whether a sufficient quantity of the sample liquid is supplied to the sample supplying path based on whether first electrical current from the first group and a second electrical current from the second group exceed respective predetermined thresholds;measuring an elapsed time between the first electrical current exceeding the threshold and the second electrical current exceeding the threshold;calculating the quantity of the substrate of the sample liquid based on an electrical current measured due to a voltage applied to the electrode part;if the elapsed time is within a predetermined time, compensating the calculated quantity of the substrate of the sample liquid based on the elapsed time.
- The method of claim 1 wherein the predetermined time is 10 seconds.
- The method of any one of claims 1 to 2, wherein measuring the quantity of the substrate is terminated if a sufficient quantity of the sample liquid has not been supplied when the elapsed time exceeds the predetermined time.
Applications Claiming Priority (5)
| Application Number | Priority Date | Filing Date | Title |
|---|---|---|---|
| JP2000364225AJP4639465B2 (en) | 2000-11-30 | 2000-11-30 | Biosensor |
| JP2001357144AJP2003156469A (en) | 2001-11-22 | 2001-11-22 | Biosensor, measuring device for biosensor, and method of quantifying substrate |
| PCT/JP2001/010525WO2002044705A1 (en) | 2000-11-30 | 2001-11-30 | Biosensor, measuring instrument for biosensor, and method of quantifying substrate |
| EP11176149.0AEP2388585B1 (en) | 2000-11-30 | 2001-11-30 | Method of quantifying substrate |
| EP01998816AEP1256798A4 (en) | 2000-11-30 | 2001-11-30 | BIOSENSOR, MEASURING INSTRUMENT FOR BIOSENSOR, AND METHOD FOR MEASURING SUBSTRATE |
Related Parent Applications (3)
| Application Number | Title | Priority Date | Filing Date |
|---|---|---|---|
| EP01998816ADivisionEP1256798A4 (en) | 2000-11-30 | 2001-11-30 | BIOSENSOR, MEASURING INSTRUMENT FOR BIOSENSOR, AND METHOD FOR MEASURING SUBSTRATE |
| EP11176149.0ADivisionEP2388585B1 (en) | 2000-11-30 | 2001-11-30 | Method of quantifying substrate |
| EP11176149.0ADivision-IntoEP2388585B1 (en) | 2000-11-30 | 2001-11-30 | Method of quantifying substrate |
Publications (2)
| Publication Number | Publication Date |
|---|---|
| EP3364187A1 EP3364187A1 (en) | 2018-08-22 |
| EP3364187B1true EP3364187B1 (en) | 2019-09-18 |
Family
ID=26604890
Family Applications (8)
| Application Number | Title | Priority Date | Filing Date |
|---|---|---|---|
| EP11176154.0AExpired - LifetimeEP2388587B1 (en) | 2000-11-30 | 2001-11-30 | Method of quantifying substrate |
| EP09007943.5AExpired - LifetimeEP2096436B1 (en) | 2000-11-30 | 2001-11-30 | Method of quantifying a substrate |
| EP09007944.3AExpired - LifetimeEP2096437B1 (en) | 2000-11-30 | 2001-11-30 | Biosensor for quantifying substrate |
| EP09007942.7AExpired - LifetimeEP2096435B1 (en) | 2000-11-30 | 2001-11-30 | Method of quantifying substrate |
| EP11176149.0AExpired - LifetimeEP2388585B1 (en) | 2000-11-30 | 2001-11-30 | Method of quantifying substrate |
| EP01998816ACeasedEP1256798A4 (en) | 2000-11-30 | 2001-11-30 | BIOSENSOR, MEASURING INSTRUMENT FOR BIOSENSOR, AND METHOD FOR MEASURING SUBSTRATE |
| EP18161641.8AExpired - LifetimeEP3364187B1 (en) | 2000-11-30 | 2001-11-30 | Method of quantifying substrate |
| EP11176153.2AExpired - LifetimeEP2388586B1 (en) | 2000-11-30 | 2001-11-30 | Method of quantifying substrate |
Family Applications Before (6)
| Application Number | Title | Priority Date | Filing Date |
|---|---|---|---|
| EP11176154.0AExpired - LifetimeEP2388587B1 (en) | 2000-11-30 | 2001-11-30 | Method of quantifying substrate |
| EP09007943.5AExpired - LifetimeEP2096436B1 (en) | 2000-11-30 | 2001-11-30 | Method of quantifying a substrate |
| EP09007944.3AExpired - LifetimeEP2096437B1 (en) | 2000-11-30 | 2001-11-30 | Biosensor for quantifying substrate |
| EP09007942.7AExpired - LifetimeEP2096435B1 (en) | 2000-11-30 | 2001-11-30 | Method of quantifying substrate |
| EP11176149.0AExpired - LifetimeEP2388585B1 (en) | 2000-11-30 | 2001-11-30 | Method of quantifying substrate |
| EP01998816ACeasedEP1256798A4 (en) | 2000-11-30 | 2001-11-30 | BIOSENSOR, MEASURING INSTRUMENT FOR BIOSENSOR, AND METHOD FOR MEASURING SUBSTRATE |
Family Applications After (1)
| Application Number | Title | Priority Date | Filing Date |
|---|---|---|---|
| EP11176153.2AExpired - LifetimeEP2388586B1 (en) | 2000-11-30 | 2001-11-30 | Method of quantifying substrate |
Country Status (4)
| Country | Link |
|---|---|
| US (13) | US7232510B2 (en) |
| EP (8) | EP2388587B1 (en) |
| CN (2) | CN100510732C (en) |
| WO (1) | WO2002044705A1 (en) |
Families Citing this family (186)
| Publication number | Priority date | Publication date | Assignee | Title |
|---|---|---|---|---|
| AU6157898A (en) | 1997-02-06 | 1998-08-26 | E. Heller & Company | Small volume (in vitro) analyte sensor |
| US8071384B2 (en) | 1997-12-22 | 2011-12-06 | Roche Diagnostics Operations, Inc. | Control and calibration solutions and methods for their use |
| US6391005B1 (en) | 1998-03-30 | 2002-05-21 | Agilent Technologies, Inc. | Apparatus and method for penetration with shaft having a sensor for sensing penetration depth |
| US6338790B1 (en) | 1998-10-08 | 2002-01-15 | Therasense, Inc. | Small volume in vitro analyte sensor with diffusible or non-leachable redox mediator |
| US20050103624A1 (en) | 1999-10-04 | 2005-05-19 | Bhullar Raghbir S. | Biosensor and method of making |
| US6616819B1 (en) | 1999-11-04 | 2003-09-09 | Therasense, Inc. | Small volume in vitro analyte sensor and methods |
| US8641644B2 (en) | 2000-11-21 | 2014-02-04 | Sanofi-Aventis Deutschland Gmbh | Blood testing apparatus having a rotatable cartridge with multiple lancing elements and testing means |
| EP2388587B1 (en) | 2000-11-30 | 2018-01-10 | Panasonic Healthcare Holdings Co., Ltd. | Method of quantifying substrate |
| US7344507B2 (en) | 2002-04-19 | 2008-03-18 | Pelikan Technologies, Inc. | Method and apparatus for lancet actuation |
| US7749174B2 (en) | 2001-06-12 | 2010-07-06 | Pelikan Technologies, Inc. | Method and apparatus for lancet launching device intergrated onto a blood-sampling cartridge |
| US9226699B2 (en) | 2002-04-19 | 2016-01-05 | Sanofi-Aventis Deutschland Gmbh | Body fluid sampling module with a continuous compression tissue interface surface |
| US9427532B2 (en) | 2001-06-12 | 2016-08-30 | Sanofi-Aventis Deutschland Gmbh | Tissue penetration device |
| JP4209767B2 (en) | 2001-06-12 | 2009-01-14 | ペリカン テクノロジーズ インコーポレイテッド | Self-optimized cutting instrument with adaptive means for temporary changes in skin properties |
| US7981056B2 (en) | 2002-04-19 | 2011-07-19 | Pelikan Technologies, Inc. | Methods and apparatus for lancet actuation |
| US8337419B2 (en) | 2002-04-19 | 2012-12-25 | Sanofi-Aventis Deutschland Gmbh | Tissue penetration device |
| EP1395185B1 (en) | 2001-06-12 | 2010-10-27 | Pelikan Technologies Inc. | Electric lancet actuator |
| US7041068B2 (en) | 2001-06-12 | 2006-05-09 | Pelikan Technologies, Inc. | Sampling module device and method |
| US9795747B2 (en) | 2010-06-02 | 2017-10-24 | Sanofi-Aventis Deutschland Gmbh | Methods and apparatus for lancet actuation |
| US8227240B2 (en)* | 2001-08-14 | 2012-07-24 | The Washington University | Systems for screening pharmaceutical chemicals |
| US6814844B2 (en) | 2001-08-29 | 2004-11-09 | Roche Diagnostics Corporation | Biosensor with code pattern |
| US8360992B2 (en) | 2002-04-19 | 2013-01-29 | Sanofi-Aventis Deutschland Gmbh | Method and apparatus for penetrating tissue |
| US8579831B2 (en) | 2002-04-19 | 2013-11-12 | Sanofi-Aventis Deutschland Gmbh | Method and apparatus for penetrating tissue |
| US7547287B2 (en) | 2002-04-19 | 2009-06-16 | Pelikan Technologies, Inc. | Method and apparatus for penetrating tissue |
| US9248267B2 (en) | 2002-04-19 | 2016-02-02 | Sanofi-Aventis Deustchland Gmbh | Tissue penetration device |
| US8221334B2 (en) | 2002-04-19 | 2012-07-17 | Sanofi-Aventis Deutschland Gmbh | Method and apparatus for penetrating tissue |
| US9795334B2 (en) | 2002-04-19 | 2017-10-24 | Sanofi-Aventis Deutschland Gmbh | Method and apparatus for penetrating tissue |
| US7297122B2 (en) | 2002-04-19 | 2007-11-20 | Pelikan Technologies, Inc. | Method and apparatus for penetrating tissue |
| US7331931B2 (en) | 2002-04-19 | 2008-02-19 | Pelikan Technologies, Inc. | Method and apparatus for penetrating tissue |
| US7976476B2 (en) | 2002-04-19 | 2011-07-12 | Pelikan Technologies, Inc. | Device and method for variable speed lancet |
| US8784335B2 (en) | 2002-04-19 | 2014-07-22 | Sanofi-Aventis Deutschland Gmbh | Body fluid sampling device with a capacitive sensor |
| US7674232B2 (en) | 2002-04-19 | 2010-03-09 | Pelikan Technologies, Inc. | Method and apparatus for penetrating tissue |
| US7491178B2 (en) | 2002-04-19 | 2009-02-17 | Pelikan Technologies, Inc. | Method and apparatus for penetrating tissue |
| US7892183B2 (en) | 2002-04-19 | 2011-02-22 | Pelikan Technologies, Inc. | Method and apparatus for body fluid sampling and analyte sensing |
| US7232451B2 (en) | 2002-04-19 | 2007-06-19 | Pelikan Technologies, Inc. | Method and apparatus for penetrating tissue |
| US9314194B2 (en) | 2002-04-19 | 2016-04-19 | Sanofi-Aventis Deutschland Gmbh | Tissue penetration device |
| US7708701B2 (en) | 2002-04-19 | 2010-05-04 | Pelikan Technologies, Inc. | Method and apparatus for a multi-use body fluid sampling device |
| US8372016B2 (en) | 2002-04-19 | 2013-02-12 | Sanofi-Aventis Deutschland Gmbh | Method and apparatus for body fluid sampling and analyte sensing |
| US8267870B2 (en) | 2002-04-19 | 2012-09-18 | Sanofi-Aventis Deutschland Gmbh | Method and apparatus for body fluid sampling with hybrid actuation |
| US8702624B2 (en) | 2006-09-29 | 2014-04-22 | Sanofi-Aventis Deutschland Gmbh | Analyte measurement device with a single shot actuator |
| US7909778B2 (en) | 2002-04-19 | 2011-03-22 | Pelikan Technologies, Inc. | Method and apparatus for penetrating tissue |
| US7229458B2 (en) | 2002-04-19 | 2007-06-12 | Pelikan Technologies, Inc. | Method and apparatus for penetrating tissue |
| US7901362B2 (en) | 2002-04-19 | 2011-03-08 | Pelikan Technologies, Inc. | Method and apparatus for penetrating tissue |
| DE10397003B4 (en) | 2002-07-02 | 2015-04-30 | Panasonic Healthcare Holdings Co., Ltd. | Biosensor, biosensor chip and biosensor device |
| CN100504371C (en)* | 2002-07-25 | 2009-06-24 | 爱科来株式会社 | Sample analyzing method and sample analyzer |
| JP4009683B2 (en)* | 2002-09-26 | 2007-11-21 | アークレイ株式会社 | Method for manufacturing analytical tool |
| EP1557662B1 (en)* | 2002-10-31 | 2016-07-13 | Panasonic Healthcare Holdings Co., Ltd. | Determination method for automatically identifying analyte liquid and standard solution for biosensor |
| WO2004061444A1 (en)* | 2002-12-20 | 2004-07-22 | Arkray, Inc. | Thin analyzing device |
| US8574895B2 (en) | 2002-12-30 | 2013-11-05 | Sanofi-Aventis Deutschland Gmbh | Method and apparatus using optical techniques to measure analyte levels |
| JP3910148B2 (en)* | 2003-03-14 | 2007-04-25 | アークレイ株式会社 | Analysis tool with exhaust port |
| USD512512S1 (en) | 2003-05-21 | 2005-12-06 | Wachovia Bank, National Association | Blood glucose test strip |
| DE602004028463D1 (en) | 2003-05-30 | 2010-09-16 | Pelikan Technologies Inc | METHOD AND DEVICE FOR INJECTING LIQUID |
| US7850621B2 (en) | 2003-06-06 | 2010-12-14 | Pelikan Technologies, Inc. | Method and apparatus for body fluid sampling and analyte sensing |
| WO2006001797A1 (en) | 2004-06-14 | 2006-01-05 | Pelikan Technologies, Inc. | Low pain penetrating |
| US7867369B2 (en)* | 2003-06-20 | 2011-01-11 | Roche Diagnostics Operations, Inc. | Biosensor with multiple electrical functionalities |
| WO2004113911A1 (en)* | 2003-06-20 | 2004-12-29 | Roche Diagnostics Gmbh | System and method for coding information on a biosensor test strip |
| JP4447009B2 (en) | 2003-06-20 | 2010-04-07 | エフ ホフマン−ラ ロッシュ アクチェン ゲゼルシャフト | Test strip with slot vent opening |
| US8206565B2 (en) | 2003-06-20 | 2012-06-26 | Roche Diagnostics Operation, Inc. | System and method for coding information on a biosensor test strip |
| US7597793B2 (en) | 2003-06-20 | 2009-10-06 | Roche Operations Ltd. | System and method for analyte measurement employing maximum dosing time delay |
| US7645373B2 (en) | 2003-06-20 | 2010-01-12 | Roche Diagnostic Operations, Inc. | System and method for coding information on a biosensor test strip |
| US8148164B2 (en) | 2003-06-20 | 2012-04-03 | Roche Diagnostics Operations, Inc. | System and method for determining the concentration of an analyte in a sample fluid |
| US7718439B2 (en) | 2003-06-20 | 2010-05-18 | Roche Diagnostics Operations, Inc. | System and method for coding information on a biosensor test strip |
| US8058077B2 (en) | 2003-06-20 | 2011-11-15 | Roche Diagnostics Operations, Inc. | Method for coding information on a biosensor test strip |
| US7645421B2 (en) | 2003-06-20 | 2010-01-12 | Roche Diagnostics Operations, Inc. | System and method for coding information on a biosensor test strip |
| US7604721B2 (en) | 2003-06-20 | 2009-10-20 | Roche Diagnostics Operations, Inc. | System and method for coding information on a biosensor test strip |
| US8071030B2 (en) | 2003-06-20 | 2011-12-06 | Roche Diagnostics Operations, Inc. | Test strip with flared sample receiving chamber |
| US7452457B2 (en) | 2003-06-20 | 2008-11-18 | Roche Diagnostics Operations, Inc. | System and method for analyte measurement using dose sufficiency electrodes |
| US8679853B2 (en) | 2003-06-20 | 2014-03-25 | Roche Diagnostics Operations, Inc. | Biosensor with laser-sealed capillary space and method of making |
| TW594006B (en)* | 2003-07-04 | 2004-06-21 | Veutron Corp | Biosensor with multi-channel A/D conversion and a method thereof |
| USD500257S1 (en) | 2003-07-18 | 2004-12-28 | Chemimage Corporation | Handheld biothreat detector |
| US8282576B2 (en) | 2003-09-29 | 2012-10-09 | Sanofi-Aventis Deutschland Gmbh | Method and apparatus for an improved sample capture device |
| JP4458802B2 (en)* | 2003-10-02 | 2010-04-28 | パナソニック株式会社 | Method for measuring glucose in blood and sensor used therefor |
| EP1680014A4 (en) | 2003-10-14 | 2009-01-21 | Pelikan Technologies Inc | METHOD AND DEVICE FOR A VARIABLE USER INTERFACE |
| EP1707953B1 (en) | 2003-12-04 | 2015-07-01 | Panasonic Healthcare Holdings Co., Ltd. | Method of measuring hematocrit (Hct) |
| CN100472210C (en) | 2003-12-04 | 2009-03-25 | 松下电器产业株式会社 | Method for measuring blood components and sensor and measuring device used in the method |
| US7822454B1 (en) | 2005-01-03 | 2010-10-26 | Pelikan Technologies, Inc. | Fluid sampling device with improved analyte detecting member configuration |
| US8668656B2 (en) | 2003-12-31 | 2014-03-11 | Sanofi-Aventis Deutschland Gmbh | Method and apparatus for improving fluidic flow and sample capture |
| EP1713926B1 (en)* | 2004-02-06 | 2012-08-01 | Bayer HealthCare, LLC | Oxidizable species as an internal reference for biosensors and method of use |
| US20060240540A1 (en)* | 2004-03-01 | 2006-10-26 | Junji Nakatsuka | Biosensor, biosensor chip, and biosensor device |
| EP3115777B1 (en) | 2004-04-19 | 2020-01-08 | PHC Holdings Corporation | Method for measuring blood components |
| WO2006011062A2 (en) | 2004-05-20 | 2006-02-02 | Albatros Technologies Gmbh & Co. Kg | Printable hydrogel for biosensors |
| WO2005120365A1 (en) | 2004-06-03 | 2005-12-22 | Pelikan Technologies, Inc. | Method and apparatus for a fluid sampling device |
| US9775553B2 (en) | 2004-06-03 | 2017-10-03 | Sanofi-Aventis Deutschland Gmbh | Method and apparatus for a fluid sampling device |
| US7601299B2 (en) | 2004-06-18 | 2009-10-13 | Roche Diagnostics Operations, Inc. | System and method for coding information on a biosensor test strip |
| US7569126B2 (en) | 2004-06-18 | 2009-08-04 | Roche Diagnostics Operations, Inc. | System and method for quality assurance of a biosensor test strip |
| US7556723B2 (en) | 2004-06-18 | 2009-07-07 | Roche Diagnostics Operations, Inc. | Electrode design for biosensor |
| DE102004036474A1 (en)* | 2004-07-28 | 2006-03-23 | Roche Diagnostics Gmbh | Analysis system for analyzing a sample on a test element |
| CA2590956A1 (en)* | 2004-12-29 | 2006-07-06 | Lifescan Scotland Limited | Analyte measurement meter or system incorporating an improved measurement circuit |
| US8652831B2 (en) | 2004-12-30 | 2014-02-18 | Sanofi-Aventis Deutschland Gmbh | Method and apparatus for analyte measurement test time |
| US7713392B2 (en) | 2005-04-15 | 2010-05-11 | Agamatrix, Inc. | Test strip coding and quality measurement |
| WO2006134942A1 (en)* | 2005-06-14 | 2006-12-21 | Mitsumi Electric Co., Ltd. | Field effect transistor, biosensor provided with it, and detecting method |
| JP4501793B2 (en)* | 2005-06-24 | 2010-07-14 | パナソニック株式会社 | Biosensor |
| CA2616402A1 (en)* | 2005-07-26 | 2007-02-01 | Bayer Healthcare Llc | Method and system for checking an electromechanical biosensor |
| WO2007026683A1 (en)* | 2005-09-02 | 2007-03-08 | Arkray, Inc. | Method for detecting sample supply condition, and analyzer |
| EP1927850B1 (en)* | 2005-09-14 | 2015-04-15 | Sumitomo Electric Industries, Ltd. | Bio-sensor measuring device, bio-sensor measuring system, and bio-sensor measuring method |
| EP1793229B1 (en) | 2005-12-05 | 2010-09-08 | Roche Diagnostics GmbH | Method to give acoustically an information in an analytical system |
| EP1793228A1 (en) | 2005-12-05 | 2007-06-06 | F. Hoffmann-La Roche AG | Method to give acoustically an information in an analytical system |
| US20070173712A1 (en) | 2005-12-30 | 2007-07-26 | Medtronic Minimed, Inc. | Method of and system for stabilization of sensors |
| US8114269B2 (en)* | 2005-12-30 | 2012-02-14 | Medtronic Minimed, Inc. | System and method for determining the point of hydration and proper time to apply potential to a glucose sensor |
| US20070169533A1 (en)* | 2005-12-30 | 2007-07-26 | Medtronic Minimed, Inc. | Methods and systems for detecting the hydration of sensors |
| KR100981222B1 (en)* | 2006-01-31 | 2010-09-10 | 파나소닉 주식회사 | Blood sensor and blood test device having it |
| EP3553510B1 (en)* | 2006-05-03 | 2024-12-18 | Ascensia Diabetes Care Holdings AG | Underfill detection system for a biosensor |
| US7699973B2 (en)* | 2006-06-30 | 2010-04-20 | Abbott Diabetes Care Inc. | Rapid analyte measurement assay |
| EP2040065B1 (en)* | 2006-07-05 | 2015-12-30 | Panasonic Healthcare Holdings Co., Ltd. | Method and apparatus for measuring liquid sample |
| JP5027819B2 (en) | 2006-11-30 | 2012-09-19 | パナソニック株式会社 | Blood test equipment |
| WO2008076212A1 (en)* | 2006-12-13 | 2008-06-26 | Bayer Healthcare Llc | Biosensor with coded information and method for manufacturing the same |
| US20080228056A1 (en) | 2007-03-13 | 2008-09-18 | Michael Blomquist | Basal rate testing using frequent blood glucose input |
| US7751907B2 (en) | 2007-05-24 | 2010-07-06 | Smiths Medical Asd, Inc. | Expert system for insulin pump therapy |
| US8221345B2 (en) | 2007-05-30 | 2012-07-17 | Smiths Medical Asd, Inc. | Insulin pump based expert system |
| US8206564B2 (en)* | 2007-07-23 | 2012-06-26 | Bayer Healthcare Llc | Biosensor calibration system |
| US7875461B2 (en)* | 2007-07-24 | 2011-01-25 | Lifescan Scotland Limited | Test strip and connector |
| AU2008279067A1 (en) | 2007-07-26 | 2009-01-29 | Nipro Diagnostics, Inc. | System and methods for determination of analyte concentration using time resolved amperometry |
| US8101062B2 (en) | 2007-07-26 | 2012-01-24 | Nipro Diagnostics, Inc. | System and methods for determination of analyte concentration using time resolved amperometry |
| RU2010108229A (en) | 2007-08-06 | 2011-09-20 | БАЙЕР ХЕЛТКЭА ЭлЭлСи (US) | SYSTEM AND METHOD FOR AUTOMATIC CALIBRATION |
| US8778168B2 (en)* | 2007-09-28 | 2014-07-15 | Lifescan, Inc. | Systems and methods of discriminating control solution from a physiological sample |
| US8241488B2 (en) | 2007-11-06 | 2012-08-14 | Bayer Healthcare Llc | Auto-calibrating test sensors |
| JP5080211B2 (en)* | 2007-11-09 | 2012-11-21 | ベックマン コールター, インコーポレイテッド | Analysis equipment |
| US8906209B2 (en) | 2007-12-10 | 2014-12-09 | Bayer Healthcare Llc | Auto-calibrating test sensor and method of making the same |
| JP4944083B2 (en)* | 2007-12-12 | 2012-05-30 | パナソニック株式会社 | Biological sample measuring specimen and biological sample measuring device |
| US20090177147A1 (en) | 2008-01-07 | 2009-07-09 | Michael Blomquist | Insulin pump with insulin therapy coaching |
| TWM341206U (en)* | 2008-01-24 | 2008-09-21 | Apex Biotechnology Corp | Biochemical test strip |
| JP5032654B2 (en)* | 2008-03-27 | 2012-09-26 | パナソニック株式会社 | Measuring device, measuring system, and concentration measuring method |
| US8344733B2 (en)* | 2008-03-27 | 2013-01-01 | Panasonic Corporation | Sample measurement device, sample measurement system and sample measurement method |
| JP2009250806A (en) | 2008-04-07 | 2009-10-29 | Panasonic Corp | Biosensor system, sensor chip and measuring method of concentration of analyte in blood sample |
| EP2265324B1 (en) | 2008-04-11 | 2015-01-28 | Sanofi-Aventis Deutschland GmbH | Integrated analyte measurement system |
| US8187658B2 (en)* | 2008-06-24 | 2012-05-29 | Lifescan, Inc. | Method of manufacturing analyte test strip for accepting diverse sample volumes |
| US8178313B2 (en)* | 2008-06-24 | 2012-05-15 | Lifescan, Inc. | Method for determining an analyte in a bodily fluid |
| US7922985B2 (en)* | 2008-06-24 | 2011-04-12 | Lifescan, Inc. | Analyte test strip for accepting diverse sample volumes |
| US20100012490A1 (en)* | 2008-07-15 | 2010-01-21 | Tien-Tsai Hsu | Test strip with optical identification patterns and test instrument using the same |
| US20100015006A1 (en)* | 2008-07-16 | 2010-01-21 | Tien-Tsai Hsu | Test strip with identification openings and test instrument using the same |
| US8424763B2 (en) | 2008-10-07 | 2013-04-23 | Bayer Healthcare Llc | Method of forming an auto-calibration circuit or label |
| TW201018903A (en)* | 2008-11-07 | 2010-05-16 | Yuan-Soon Ho | Inspection device and inspection method used for measuring substance concentration inside stomach |
| CN102209893B (en) | 2008-11-28 | 2013-06-26 | 松下电器产业株式会社 | Sensor chip, biosensor system, method for measuring temperature of biological sample, method for measuring temperature of blood sample, method for measuring concentration of analyte in blood sample |
| US20100186334A1 (en)* | 2009-01-27 | 2010-07-29 | Seem Charles T | Metal roofing shingle, metal roofing shingle system, and method of installing |
| US9375169B2 (en) | 2009-01-30 | 2016-06-28 | Sanofi-Aventis Deutschland Gmbh | Cam drive for managing disposable penetrating member actions with a single motor and motor and control system |
| EP2392921B1 (en)* | 2009-01-30 | 2018-11-14 | PHC Holdings Corporation | Method for measuring temperature of biological sample, method for measuring concentration of biological sample and biosensor system |
| US20100294660A1 (en)* | 2009-03-13 | 2010-11-25 | Tyson Bioresearch, Inc. | Glucose Testing Device And Strips For Same |
| JP5422647B2 (en)* | 2009-05-29 | 2014-02-19 | パナソニック株式会社 | Biosensor system and method for measuring concentration of analyte |
| US8801273B2 (en)* | 2009-06-08 | 2014-08-12 | Bayer Healthcare Llc | Method and assembly for determining the temperature of a test sensor |
| US20120116706A1 (en)* | 2009-06-30 | 2012-05-10 | Arkray, Inc. | Analysis Device and Analysis Method |
| US20110057671A1 (en)* | 2009-09-04 | 2011-03-10 | Lifescan Scotland, Ltd. | Methods, system and device to identify a type of test strip |
| US8882701B2 (en) | 2009-12-04 | 2014-11-11 | Smiths Medical Asd, Inc. | Advanced step therapy delivery for an ambulatory infusion pump and system |
| EP2540224B1 (en)* | 2010-02-26 | 2020-04-01 | ARKRAY, Inc. | Analysis device, analysis method, and analysis system |
| US8965476B2 (en) | 2010-04-16 | 2015-02-24 | Sanofi-Aventis Deutschland Gmbh | Tissue penetration device |
| CA2807117A1 (en)* | 2010-08-02 | 2012-02-09 | Cilag Gmbh International | Systems and methods for improved accuracy for temperature correction of glucose results for control solution |
| US8603323B2 (en)* | 2010-09-20 | 2013-12-10 | Lifescan, Inc. | Apparatus and process for improved measurements of a monitoring device |
| US9103772B2 (en) | 2010-09-30 | 2015-08-11 | Panasonic Healthcare Holdings Co., Ltd. | Body for storing biosensors and measurement device using the biosensors |
| US11213226B2 (en)* | 2010-10-07 | 2022-01-04 | Abbott Diabetes Care Inc. | Analyte monitoring devices and methods |
| US9482636B2 (en) | 2010-10-28 | 2016-11-01 | Panasonic Healthcare Holdings Co., Ltd. | Vital information measurement device and vital information measurement method employing same |
| CN102183570A (en)* | 2011-02-14 | 2011-09-14 | 北京软测科技有限公司 | Implementation method and detector for improving blood detection accuracy |
| TWI458979B (en)* | 2011-03-18 | 2014-11-01 | Eps Bio Technology Corp | Biosensor having a function of environment temperature compensating and method thereof |
| WO2012132432A1 (en)* | 2011-03-28 | 2012-10-04 | パナソニック株式会社 | Device for measuring biological sample |
| WO2012140888A1 (en) | 2011-04-12 | 2012-10-18 | パナソニック株式会社 | Biosensor and measuring device using same |
| US9974472B2 (en) | 2011-06-16 | 2018-05-22 | Abbott Diabetes Care Inc. | Temperature-compensated analyte monitoring devices, systems, and methods thereof |
| JP2013054925A (en)* | 2011-09-05 | 2013-03-21 | Toyota Motor Corp | Inspection method and inspection device of fuel cell |
| JP5749806B2 (en) | 2011-11-01 | 2015-07-15 | パナソニックヘルスケアホールディングス株式会社 | Biological sample measuring device |
| US9572922B2 (en) | 2012-12-21 | 2017-02-21 | Larry Leonard | Inventive diabetic systems, tools, kits, and supplies for better diabetic living and mobility |
| US9903830B2 (en) | 2011-12-29 | 2018-02-27 | Lifescan Scotland Limited | Accurate analyte measurements for electrochemical test strip based on sensed physical characteristic(s) of the sample containing the analyte |
| JP5708878B2 (en)* | 2012-03-15 | 2015-04-30 | 株式会社村田製作所 | Biosensor and manufacturing method thereof |
| CN102967637B (en) | 2012-03-31 | 2016-07-06 | 艾康生物技术(杭州)有限公司 | Automatic encoding device and biosensor and the manufacture method with this device |
| US20130266481A1 (en)* | 2012-04-05 | 2013-10-10 | Prodigy Diabetes Care, Llc | Blood glucose test strip |
| US9238100B2 (en) | 2012-06-07 | 2016-01-19 | Tandem Diabetes Care, Inc. | Device and method for training users of ambulatory medical devices |
| JP6220170B2 (en) | 2012-07-12 | 2017-10-25 | パナソニックヘルスケアホールディングス株式会社 | Liquid sample measuring device |
| JP6218749B2 (en)* | 2012-11-28 | 2017-10-25 | パナソニックヘルスケアホールディングス株式会社 | Biological information measuring device, biosensor system, and error detecting method of biological information measuring device |
| US20140174953A1 (en)* | 2012-12-21 | 2014-06-26 | Cilag Gmbh International | Hand-held test meter configured for distinguishing orientation of analytical test strip insertion |
| GB201223166D0 (en)* | 2012-12-21 | 2013-02-06 | Alere Switzerland Gmbh | Test strip |
| HK1217364A1 (en)* | 2013-01-11 | 2017-01-06 | Northeastern University | Saliva glucose monitoring system |
| US10357606B2 (en) | 2013-03-13 | 2019-07-23 | Tandem Diabetes Care, Inc. | System and method for integration of insulin pumps and continuous glucose monitoring |
| US10016561B2 (en) | 2013-03-15 | 2018-07-10 | Tandem Diabetes Care, Inc. | Clinical variable determination |
| US9354194B2 (en)* | 2013-06-19 | 2016-05-31 | Cilag Gmbh International | Orientation independent meter |
| TWI576583B (en)* | 2013-08-02 | 2017-04-01 | 達爾生技股份有限公司 | Determination methods for biochemical detection strips |
| US9243276B2 (en) | 2013-08-29 | 2016-01-26 | Lifescan Scotland Limited | Method and system to determine hematocrit-insensitive glucose values in a fluid sample |
| US9459231B2 (en) | 2013-08-29 | 2016-10-04 | Lifescan Scotland Limited | Method and system to determine erroneous measurement signals during a test measurement sequence |
| CN106062554A (en)* | 2013-09-26 | 2016-10-26 | 迅捷有限责任公司 | Sample collection device for optical analysis |
| US11259724B2 (en) | 2014-03-12 | 2022-03-01 | Glucovation, Inc. | Electrochemical sensing system |
| US20160109400A1 (en)* | 2014-10-21 | 2016-04-21 | Eumed Biotechnology Co., Ltd. | Sensor for detecting glucose of rhizome plants |
| CN105987938A (en)* | 2015-02-02 | 2016-10-05 | 惠碁生物科技股份有限公司 | Sensor for detecting lactate dehydrogenase |
| US20160265024A1 (en)* | 2015-03-09 | 2016-09-15 | Eumed Biotechnology Co., Ltd. | Lactate dehydrogenase detector |
| EP3271711A1 (en)* | 2015-03-16 | 2018-01-24 | Pro-ino Development APS | Handheld apparatus for testing a sample of prepared food for allergens and/or food intolerance ingredients and disposable electrochemical test strips therefore |
| US10746687B2 (en)* | 2015-12-07 | 2020-08-18 | Arkray, Inc. | Method for measuring target component and apparatus for measuring target component |
| US10569016B2 (en) | 2015-12-29 | 2020-02-25 | Tandem Diabetes Care, Inc. | System and method for switching between closed loop and open loop control of an ambulatory infusion pump |
| US10302587B2 (en)* | 2016-03-29 | 2019-05-28 | Broadmaster Biotech Corp. | Test strip and method of operation thereof |
| CN106404867B (en)* | 2016-08-30 | 2018-12-14 | 生工生物工程(上海)股份有限公司 | A kind of biosensor measuring device |
| CN107389739A (en)* | 2017-07-31 | 2017-11-24 | 重庆微奥云生物技术有限公司 | A kind of RNA detecting systems and detection method of quality control |
| CN107389757A (en)* | 2017-07-31 | 2017-11-24 | 重庆微奥云生物技术有限公司 | A kind of DNA detecting systems and detection method of quality control |
| US11874249B2 (en) | 2017-08-23 | 2024-01-16 | Mayo Foundation For Medical Education And Research | Graphite biosensor and circuit structure and method of manufacture |
| JP7208696B2 (en)* | 2020-06-12 | 2023-01-19 | トライポッド・デザイン株式会社 | sensor |
Family Cites Families (82)
| Publication number | Priority date | Publication date | Assignee | Title |
|---|---|---|---|---|
| US4426451A (en) | 1981-01-28 | 1984-01-17 | Eastman Kodak Company | Multi-zoned reaction vessel having pressure-actuatable control means between zones |
| US5141868A (en)* | 1984-06-13 | 1992-08-25 | Internationale Octrooi Maatschappij "Octropa" Bv | Device for use in chemical test procedures |
| DE68924026T3 (en)* | 1988-03-31 | 2008-01-10 | Matsushita Electric Industrial Co., Ltd., Kadoma | BIOSENSOR AND ITS MANUFACTURE. |
| JPH0658338B2 (en) | 1988-05-18 | 1994-08-03 | 松下電器産業株式会社 | Biosensor |
| JPH0816664B2 (en) | 1989-04-18 | 1996-02-21 | 松下電器産業株式会社 | Biosensor and manufacturing method thereof |
| CH677149A5 (en)* | 1989-07-07 | 1991-04-15 | Disetronic Ag | |
| US5508171A (en)* | 1989-12-15 | 1996-04-16 | Boehringer Mannheim Corporation | Assay method with enzyme electrode system |
| US5288387A (en)* | 1990-06-12 | 1994-02-22 | Daikin Industries, Ltd. | Apparatus for maintaining the activity of an enzyme electrode |
| DE4019632C2 (en) | 1990-06-20 | 1996-12-19 | Tetra Pak Gmbh | Device for heating plate-shaped parts made of thermoformed plastic |
| JPH0820412B2 (en)* | 1990-07-20 | 1996-03-04 | 松下電器産業株式会社 | Quantitative analysis method and device using disposable sensor |
| US5230866A (en) | 1991-03-01 | 1993-07-27 | Biotrack, Inc. | Capillary stop-flow junction having improved stability against accidental fluid flow |
| US5264103A (en)* | 1991-10-18 | 1993-11-23 | Matsushita Electric Industrial Co., Ltd. | Biosensor and a method for measuring a concentration of a substrate in a sample |
| DE59207763D1 (en)* | 1991-10-29 | 1997-02-06 | Siemens Ag | Electrocatalytic glucose sensor |
| US6156270A (en) | 1992-05-21 | 2000-12-05 | Biosite Diagnostics, Inc. | Diagnostic devices and apparatus for the controlled movement of reagents without membranes |
| JP3189416B2 (en)* | 1992-09-25 | 2001-07-16 | 松下電器産業株式会社 | Liquid component measuring device |
| ZA938555B (en) | 1992-11-23 | 1994-08-02 | Lilly Co Eli | Technique to improve the performance of electrochemical sensors |
| US5405511A (en)* | 1993-06-08 | 1995-04-11 | Boehringer Mannheim Corporation | Biosensing meter with ambient temperature estimation method and system |
| US5352351A (en) | 1993-06-08 | 1994-10-04 | Boehringer Mannheim Corporation | Biosensing meter with fail/safe procedures to prevent erroneous indications |
| ES2153335T3 (en)* | 1993-06-08 | 2006-09-01 | Roche Diagnostics Operations, Inc. | BIOSENSOR METER THAT DETECTS THE PROPER ADJUSTMENT OF THE ELECTRODES AND DISTINGUISHES SAMPLING STRIPS AND CHECKING STRIPS. |
| US5658443A (en) | 1993-07-23 | 1997-08-19 | Matsushita Electric Industrial Co., Ltd. | Biosensor and method for producing the same |
| US5497772A (en)* | 1993-11-19 | 1996-03-12 | Alfred E. Mann Foundation For Scientific Research | Glucose monitoring system |
| US5762770A (en)* | 1994-02-21 | 1998-06-09 | Boehringer Mannheim Corporation | Electrochemical biosensor test strip |
| US5437999A (en)* | 1994-02-22 | 1995-08-01 | Boehringer Mannheim Corporation | Electrochemical sensor |
| US5627041A (en) | 1994-09-02 | 1997-05-06 | Biometric Imaging, Inc. | Disposable cartridge for an assay of a biological sample |
| US5651869A (en) | 1995-02-28 | 1997-07-29 | Matsushita Electric Industrial Co., Ltd. | Biosensor |
| US5650062A (en)* | 1995-03-17 | 1997-07-22 | Matsushita Electric Industrial Co., Ltd. | Biosensor, and a method and a device for quantifying a substrate in a sample liquid using the same |
| US5582697A (en) | 1995-03-17 | 1996-12-10 | Matsushita Electric Industrial Co., Ltd. | Biosensor, and a method and a device for quantifying a substrate in a sample liquid using the same |
| US5620579A (en) | 1995-05-05 | 1997-04-15 | Bayer Corporation | Apparatus for reduction of bias in amperometric sensors |
| US5554273A (en) | 1995-07-26 | 1996-09-10 | Praxair Technology, Inc. | Neural network compensation for sensors |
| AUPN661995A0 (en) | 1995-11-16 | 1995-12-07 | Memtec America Corporation | Electrochemical cell 2 |
| JP3365184B2 (en)* | 1996-01-10 | 2003-01-08 | 松下電器産業株式会社 | Biosensor |
| US5651889A (en)* | 1996-03-25 | 1997-07-29 | Mitsui Petrochemical Industries, Ltd. | Sludge treatment membrane apparatus |
| WO1998032013A1 (en) | 1997-01-17 | 1998-07-23 | Via Medical Corporation | Method for calibrating sensors used in diagnostic testing |
| AU6157898A (en) | 1997-02-06 | 1998-08-26 | E. Heller & Company | Small volume (in vitro) analyte sensor |
| US5798031A (en) | 1997-05-12 | 1998-08-25 | Bayer Corporation | Electrochemical biosensor |
| US6391645B1 (en)* | 1997-05-12 | 2002-05-21 | Bayer Corporation | Method and apparatus for correcting ambient temperature effect in biosensors |
| JP2002505008A (en)* | 1997-06-16 | 2002-02-12 | エラン コーポレーション ピーエルシー | Methods for calibrating and testing sensors for in vivo measurement of analytes and devices for use in such methods |
| US6309526B1 (en) | 1997-07-10 | 2001-10-30 | Matsushita Electric Industrial Co., Ltd. | Biosensor |
| ES2323393T3 (en) | 1997-07-22 | 2009-07-14 | Arkray, Inc | DENSITOMETER |
| US6071391A (en) | 1997-09-12 | 2000-06-06 | Nok Corporation | Enzyme electrode structure |
| US7494816B2 (en) | 1997-12-22 | 2009-02-24 | Roche Diagnostic Operations, Inc. | System and method for determining a temperature during analyte measurement |
| JP3978489B2 (en)* | 1998-02-26 | 2007-09-19 | アークレイ株式会社 | Blood measuring device |
| JPH11304748A (en)* | 1998-04-23 | 1999-11-05 | Omron Corp | Biosensor |
| US6576117B1 (en) | 1998-05-20 | 2003-06-10 | Arkray | Method and apparatus for electrochemical measurement using statistical technique |
| JP3487410B2 (en)* | 1998-05-29 | 2004-01-19 | 松下電器産業株式会社 | Biosensor |
| JP3398598B2 (en)* | 1998-06-10 | 2003-04-21 | 松下電器産業株式会社 | Substrate quantification method and analytical element and measuring device used for the method |
| JP3874321B2 (en) | 1998-06-11 | 2007-01-31 | 松下電器産業株式会社 | Biosensor |
| JP2000019147A (en) | 1998-07-01 | 2000-01-21 | Nok Corp | Reaction product measuring device |
| JP3267936B2 (en) | 1998-08-26 | 2002-03-25 | 松下電器産業株式会社 | Biosensor |
| JP2000162176A (en) | 1998-09-22 | 2000-06-16 | Omron Corp | Measuring method and measuring device using biosensor |
| US6338790B1 (en) | 1998-10-08 | 2002-01-15 | Therasense, Inc. | Small volume in vitro analyte sensor with diffusible or non-leachable redox mediator |
| JP4352109B2 (en) | 1999-01-29 | 2009-10-28 | アークレイ株式会社 | Biosensor |
| US6475372B1 (en) | 2000-02-02 | 2002-11-05 | Lifescan, Inc. | Electrochemical methods and devices for use in the determination of hematocrit corrected analyte concentrations |
| US6258229B1 (en) | 1999-06-02 | 2001-07-10 | Handani Winarta | Disposable sub-microliter volume sensor and method of making |
| US6287451B1 (en) | 1999-06-02 | 2001-09-11 | Handani Winarta | Disposable sensor and method of making |
| CA2305922C (en) | 1999-08-02 | 2005-09-20 | Bayer Corporation | Improved electrochemical sensor design |
| US6841052B2 (en) | 1999-08-02 | 2005-01-11 | Bayer Corporation | Electrochemical-sensor design |
| US6645359B1 (en) | 2000-10-06 | 2003-11-11 | Roche Diagnostics Corporation | Biosensor |
| US7276146B2 (en) | 2001-11-16 | 2007-10-02 | Roche Diagnostics Operations, Inc. | Electrodes, methods, apparatuses comprising micro-electrode arrays |
| US6616819B1 (en)* | 1999-11-04 | 2003-09-09 | Therasense, Inc. | Small volume in vitro analyte sensor and methods |
| EP2151683A3 (en) | 1999-11-15 | 2010-07-28 | Panasonic Corporation | Biosensor, thin film electrode forming method, quantification apparatus, and quantification method |
| US6780296B1 (en) | 1999-12-23 | 2004-08-24 | Roche Diagnostics Corporation | Thermally conductive sensor |
| JP2001201479A (en)* | 2000-01-21 | 2001-07-27 | Matsushita Electric Ind Co Ltd | Biosensor |
| GB0005564D0 (en) | 2000-03-08 | 2000-05-03 | Inverness Medical Ltd | Measurjement of substances in liquid |
| DE60122517T2 (en) | 2000-03-31 | 2007-03-08 | Lifescan, Inc., Milpitas | ELECTRICALLY CONDUCTIVE PATTERN FOR MONITORING THE FILLING OF MEDICAL DEVICES |
| JP4061816B2 (en) | 2000-04-27 | 2008-03-19 | 松下電器産業株式会社 | Biosensor |
| JP2001330581A (en) | 2000-05-19 | 2001-11-30 | Matsushita Electric Ind Co Ltd | Substrate concentration determination method |
| US6814843B1 (en) | 2000-11-01 | 2004-11-09 | Roche Diagnostics Corporation | Biosensor |
| JP2003156469A (en) | 2001-11-22 | 2003-05-30 | Matsushita Electric Ind Co Ltd | Biosensor, measuring device for biosensor, and method of quantifying substrate |
| EP2388587B1 (en) | 2000-11-30 | 2018-01-10 | Panasonic Healthcare Holdings Co., Ltd. | Method of quantifying substrate |
| US6821410B2 (en) | 2001-03-07 | 2004-11-23 | Matsushita Electric Industrial Co., Ltd. | Biosensor and method of substrate quantification |
| US7491310B2 (en)* | 2001-10-12 | 2009-02-17 | Arkray, Inc. | Concentration measuring method and concentration measuring apparatus |
| US7018843B2 (en) | 2001-11-07 | 2006-03-28 | Roche Diagnostics Operations, Inc. | Instrument |
| US20030116447A1 (en) | 2001-11-16 | 2003-06-26 | Surridge Nigel A. | Electrodes, methods, apparatuses comprising micro-electrode arrays |
| KR100475634B1 (en) | 2001-12-24 | 2005-03-15 | 주식회사 아이센스 | Biosensor equipped with sample introducing part which enables quick introduction of a small amount of sample |
| US6964871B2 (en)* | 2002-04-25 | 2005-11-15 | Home Diagnostics, Inc. | Systems and methods for blood glucose sensing |
| US6743635B2 (en)* | 2002-04-25 | 2004-06-01 | Home Diagnostics, Inc. | System and methods for blood glucose sensing |
| US7050743B2 (en)* | 2004-05-25 | 2006-05-23 | Xerox Corporation | Self-regenerative xerographic coatings |
| JP3754441B1 (en) | 2004-09-10 | 2006-03-15 | 三洋電機株式会社 | Reception method and apparatus, and communication system using the same |
| US7846311B2 (en)* | 2005-09-27 | 2010-12-07 | Abbott Diabetes Care Inc. | In vitro analyte sensor and methods of use |
| EP2577303B1 (en)* | 2010-06-07 | 2022-08-03 | Ascensia Diabetes Care Holdings AG | Underfill management system for a biosensor |
| US20130020209A1 (en) | 2011-07-22 | 2013-01-24 | Verna Rose Benjamin-Lambert | Inflatable device for transporting and prepping a wig |
- 2001
- 2001-11-30EPEP11176154.0Apatent/EP2388587B1/ennot_activeExpired - Lifetime
- 2001-11-30USUS10/182,236patent/US7232510B2/ennot_activeExpired - Lifetime
- 2001-11-30CNCNB018043496Apatent/CN100510732C/ennot_activeExpired - Lifetime
- 2001-11-30EPEP09007943.5Apatent/EP2096436B1/ennot_activeExpired - Lifetime
- 2001-11-30WOPCT/JP2001/010525patent/WO2002044705A1/ennot_activeCeased
- 2001-11-30EPEP09007944.3Apatent/EP2096437B1/ennot_activeExpired - Lifetime
- 2001-11-30EPEP09007942.7Apatent/EP2096435B1/ennot_activeExpired - Lifetime
- 2001-11-30EPEP11176149.0Apatent/EP2388585B1/ennot_activeExpired - Lifetime
- 2001-11-30CNCNB2005100036790Apatent/CN100346158C/ennot_activeExpired - Lifetime
- 2001-11-30EPEP01998816Apatent/EP1256798A4/ennot_activeCeased
- 2001-11-30EPEP18161641.8Apatent/EP3364187B1/ennot_activeExpired - Lifetime
- 2001-11-30EPEP11176153.2Apatent/EP2388586B1/ennot_activeExpired - Lifetime
- 2006
- 2006-03-16USUS11/378,944patent/US7850839B2/ennot_activeExpired - Lifetime
- 2006-03-17USUS11/378,682patent/US8771487B2/ennot_activeExpired - Lifetime
- 2007
- 2007-05-03USUS11/800,273patent/US20080110754A1/ennot_activeAbandoned
- 2010
- 2010-06-10USUS12/802,608patent/US8668820B2/ennot_activeExpired - Fee Related
- 2010-06-22USUS12/803,253patent/US8298400B2/ennot_activeExpired - Fee Related
- 2011
- 2011-01-28USUS12/931,296patent/US8101063B2/ennot_activeExpired - Fee Related
- 2011-01-31USUS12/931,420patent/US8097147B2/ennot_activeExpired - Fee Related
- 2011-10-25USUS13/317,662patent/US20120043227A1/ennot_activeAbandoned
- 2012
- 2012-09-11USUS13/609,305patent/US20130020208A1/ennot_activeAbandoned
- 2014
- 2014-01-29USUS14/166,956patent/US9797858B2/ennot_activeExpired - Lifetime
- 2017
- 2017-09-15USUS15/705,540patent/US20180074007A1/ennot_activeAbandoned
- 2017-12-05USUS15/831,642patent/US10605757B2/ennot_activeExpired - Fee Related
Non-Patent Citations (1)
| Title |
|---|
| None* |
Also Published As
Similar Documents
| Publication | Publication Date | Title |
|---|---|---|
| EP3364187B1 (en) | Method of quantifying substrate | |
| CA2065890C (en) | Quantitative analysis method and its system using a disposable sensor | |
| JP2003156469A (en) | Biosensor, measuring device for biosensor, and method of quantifying substrate | |
| JP2007033459A (en) | Biosensor, biosensor measuring apparatus, and substrate quantification method | |
| JP4475264B2 (en) | Biosensor, biosensor measuring apparatus, and substrate quantification method | |
| CN101059503B (en) | biological sensor | |
| JP4725665B2 (en) | Biosensor, biosensor measuring apparatus, and substrate quantification method | |
| JP4840520B2 (en) | Biosensor, biosensor measuring apparatus, and substrate quantification method |
Legal Events
| Date | Code | Title | Description |
|---|---|---|---|
| PUAI | Public reference made under article 153(3) epc to a published international application that has entered the european phase | Free format text:ORIGINAL CODE: 0009012 | |
| STAA | Information on the status of an ep patent application or granted ep patent | Free format text:STATUS: THE APPLICATION HAS BEEN PUBLISHED | |
| AC | Divisional application: reference to earlier application | Ref document number:1256798 Country of ref document:EP Kind code of ref document:P Ref document number:2388585 Country of ref document:EP Kind code of ref document:P | |
| AK | Designated contracting states | Kind code of ref document:A1 Designated state(s):DE FR GB IT | |
| STAA | Information on the status of an ep patent application or granted ep patent | Free format text:STATUS: REQUEST FOR EXAMINATION WAS MADE | |
| REG | Reference to a national code | Ref country code:DE Ref legal event code:R079 Ref document number:60151191 Country of ref document:DE Free format text:PREVIOUS MAIN CLASS: G01N0033487000 Ipc:A61B0005148600 | |
| 17P | Request for examination filed | Effective date:20190215 | |
| RBV | Designated contracting states (corrected) | Designated state(s):DE FR GB IT | |
| RIC1 | Information provided on ipc code assigned before grant | Ipc:G01N 33/543 20060101ALI20190322BHEP Ipc:G01N 33/487 20060101ALI20190322BHEP Ipc:A61B 5/1486 20060101AFI20190322BHEP Ipc:G01N 27/327 20060101ALI20190322BHEP Ipc:C12Q 1/00 20060101ALI20190322BHEP | |
| GRAP | Despatch of communication of intention to grant a patent | Free format text:ORIGINAL CODE: EPIDOSNIGR1 | |
| STAA | Information on the status of an ep patent application or granted ep patent | Free format text:STATUS: GRANT OF PATENT IS INTENDED | |
| INTG | Intention to grant announced | Effective date:20190516 | |
| GRAS | Grant fee paid | Free format text:ORIGINAL CODE: EPIDOSNIGR3 | |
| GRAA | (expected) grant | Free format text:ORIGINAL CODE: 0009210 | |
| STAA | Information on the status of an ep patent application or granted ep patent | Free format text:STATUS: THE PATENT HAS BEEN GRANTED | |
| RIN1 | Information on inventor provided before grant (corrected) | Inventor name:MATSUMOTO, KAZUHIRO Inventor name:TOKUNAGA, HIROYUKI Inventor name:TOKUNO, YOSHINOBU Inventor name:SAWADA, YASUHIKO Inventor name:MIYAZAKI, SHOJI | |
| AC | Divisional application: reference to earlier application | Ref document number:2388585 Country of ref document:EP Kind code of ref document:P Ref document number:1256798 Country of ref document:EP Kind code of ref document:P | |
| AK | Designated contracting states | Kind code of ref document:B1 Designated state(s):DE FR GB IT | |
| REG | Reference to a national code | Ref country code:GB Ref legal event code:FG4D | |
| RIN2 | Information on inventor provided after grant (corrected) | Inventor name:TOKUNO, YOSHINOBU Inventor name:TOKUNAGA, HIROYUKI Inventor name:SAWADA, YASUHIKO Inventor name:MATSUMOTO, KAZUHIRO Inventor name:MIYAZAKI, SHOJI | |
| REG | Reference to a national code | Ref country code:DE Ref legal event code:R096 Ref document number:60151191 Country of ref document:DE | |
| PG25 | Lapsed in a contracting state [announced via postgrant information from national office to epo] | Ref country code:IT Free format text:LAPSE BECAUSE OF FAILURE TO SUBMIT A TRANSLATION OF THE DESCRIPTION OR TO PAY THE FEE WITHIN THE PRESCRIBED TIME-LIMIT Effective date:20190918 | |
| REG | Reference to a national code | Ref country code:DE Ref legal event code:R097 Ref document number:60151191 Country of ref document:DE | |
| PLBE | No opposition filed within time limit | Free format text:ORIGINAL CODE: 0009261 | |
| STAA | Information on the status of an ep patent application or granted ep patent | Free format text:STATUS: NO OPPOSITION FILED WITHIN TIME LIMIT | |
| 26N | No opposition filed | Effective date:20200619 | |
| GBPC | Gb: european patent ceased through non-payment of renewal fee | Effective date:20191218 | |
| PG25 | Lapsed in a contracting state [announced via postgrant information from national office to epo] | Ref country code:FR Free format text:LAPSE BECAUSE OF NON-PAYMENT OF DUE FEES Effective date:20191130 Ref country code:GB Free format text:LAPSE BECAUSE OF NON-PAYMENT OF DUE FEES Effective date:20191218 | |
| PGFP | Annual fee paid to national office [announced via postgrant information from national office to epo] | Ref country code:DE Payment date:20201126 Year of fee payment:20 | |
| REG | Reference to a national code | Ref country code:DE Ref legal event code:R071 Ref document number:60151191 Country of ref document:DE |