EP2631876B1 - Method and system for monitoring the evolution of a physical quantity - Google Patents
Method and system for monitoring the evolution of a physical quantityDownload PDFInfo
- Publication number
- EP2631876B1 EP2631876B1EP20120290061EP12290061AEP2631876B1EP 2631876 B1EP2631876 B1EP 2631876B1EP 20120290061EP20120290061EP 20120290061EP 12290061 AEP12290061 AEP 12290061AEP 2631876 B1EP2631876 B1EP 2631876B1
- Authority
- EP
- European Patent Office
- Prior art keywords
- value
- graphical
- displaying
- indicator
- zone
- Prior art date
- Legal status (The legal status is an assumption and is not a legal conclusion. Google has not performed a legal analysis and makes no representation as to the accuracy of the status listed.)
- Not-in-force
Links
Images


Classifications
- G—PHYSICS
- G06—COMPUTING OR CALCULATING; COUNTING
- G06T—IMAGE DATA PROCESSING OR GENERATION, IN GENERAL
- G06T11/00—2D [Two Dimensional] image generation
- G—PHYSICS
- G06—COMPUTING OR CALCULATING; COUNTING
- G06T—IMAGE DATA PROCESSING OR GENERATION, IN GENERAL
- G06T11/00—2D [Two Dimensional] image generation
- G06T11/20—Drawing from basic elements, e.g. lines or circles
- G06T11/206—Drawing of charts or graphs
Definitions
- the inventionrelates to a method and a system for monitoring the evolution of a physical quantity.
- the inventionconcerns a method and system for monitoring such a physical quantity relating to a material composing a pharmaceutical product.
- an operatormay have to weigh 100g plus or minus 0,0001g, the tolerance window the operator has to enter is therefore really restricted in comparison with the total quantity of raw material. Furthermore, an error made by the operator in the above mentioned tolerance means that the whole pharmaceutical product has to be thrown away because it can not be used at all and of course cannot be sold.
- An objective of the inventionis to provide a method and a system to solve the above mentioned problems.
- An important objective of the present inventionis to allow that the operator realizes the dosage operation right at the first time to avoid the product to be non usable and therefore to increase the production rate by saving time and money.
- the inventionproposes according to a first aspect a method for monitoring the evolution of a physical quantity, such a physical quantity of a component of a pharmaceutical product, the method comprises:
- the method according to the inventioncan also comprise several other features, taken alone or in combination, such as:
- a second aspect of the inventionis a system for monitoring the evolution of a physical quantity, such as a physical quantity of a component of a pharmaceutical product, for carrying out the method according as above defined, the system comprising:
- a third aspect of the inventionis a computer readable media including program instructions which when executed by a processor cause the processor to perform the method according to claims 1 to 13.
- the inventionallows the good dosage from the beginning and avoids loosing time and money during the production process.
- FIG. 1is a schematic view of a system according to the invention.
- This systemcomprises a sensor 5 which outputs a value depending on the quantity of raw material 6 introduced by an operator 1 from a first container 3 into a second container 7.
- the sensor 5is communicatively connected to a computer in turn connected to a display 13.
- the sensor 5is a digital balance measuring the mass of the raw material 6 introduced in the second container 7. This information is transmitted via a communication line 9 to a computer 11.
- the computer 11includes a memory (not shown) comprising instructions for displaying the raw material mass evolution on a screen 13. For this purpose, computer 11 is connected to the display 13. The operator can follow the evolution of the product mass by consulting the screen 13 while discharging the raw material from the first to the second container.
- the senor 15continuously sends information to the computer 11 which in turn sends displaying instructions to the display 13.
- FIGS 2a, 2b and 2Care detailed views of display or screen 13 respectively before ( figure 1a ) and during ( figures 2b and 2c ) weighing operations according to an embodiment of the present invention.
- a control display 18 according to the inventionshows on screen 13 a plurality of information helping the operator to add precisely the requested quantity of raw material in the second container 7.
- the control display 18has a general rectangular shape and is divided in four different zones A, B, C and D.
- the first zone Alocated on the top left of the control display 18 comprises a progression or completion indicator 27.
- the progression or completion indicator 27dynamically indicates the percentage of the set point value already reached since the beginning of weighing of current raw material.
- the progression or completion degreeis displayed in a graphical form and in a numerical form.
- the graphical formcomprises a ring which is angularly filled depending on the percentage of completion of the weighing process. Within this ring, a numerical value representing the same percentage is also displayed and regularly updated in real time.
- the second zone B located on the top right of the control display 18comprises a plurality of numerical information:
- the third zone C located on the bottom right of the control display 18comprises a stability indicator 29 showing if the actual weight is stable or not. Two symbols are used to display this information:
- the fourth graphical zone D located at the bottom right of the control display 18comprises a bar graph 23 showing the evolution of the current mass of the added material.
- the bar graphis regularly updated by the computer 11 and moves forward depending on information coming from the sensor 5.
- the current mass value of the added raw materialis also displayed on a numerical form.
- a set point indicator 15is drawn in the graphical zone D as vertical line marked by arrows to represent the target to reach.
- Minimum and maximum tolerance value indicators 17a and 19aare also displayed with two vertical lines.
- At least two colored horizontal bars 31indicate the state of the current weighing (under targeted value, near targeted values, inside tolerances values, over maximum targeted value).
- a first colored baris located above the bar graph 23 and a second colored bar is located below the bar graph 23.
- Computer 11comprises a processor (not shown) in communication with the sensor 5 and with a memory.
- the processoris configured to execute computer readable instructions stored in its memory or in any other computer readable media which modify the control display 18 and which allow the control display 18 to have a particular behaviour depending on the information coming from the sensor 5. This particular intelligent behaviour helps the operator during weighing operations.
- the memoryalso contains all different views and graphical information needed to update the control display 18 during a monitoring process.
- the computer 11via its processor continuously monitor the value coming from the sensor 5, and updates in real time the different values and graphs displayed by the screen 13 depending on the values provided by the sensor 5, i.e., and in particular in the embodiment of figure 2a, 2b and 2c : the progression 27, the remaining quantity 25, the stability 29, the position of bar graph 23 and the state 31.
- a plurality of different graphical zones D and Dzcan be displayed on the screen 13 depending on the values returned by the sensor and depending on the ratio between the current mass and the set point.
- a magnification of the important part of the zoomed graphical zone Dzis also realized within the zoomed graphical zone Dz itself.
- the bar graph 23is updated in real time and keeps on moving forward also in the zoomed graphical zone Dz and also in the magnified area of the zoomed graph graphical zone Dz.
- Figure 2cis a slightly enlarged view of figure 2b wherein details concerning the bar graph displaying when the first threshold is reach by the monitored value have been added for explanations purposes. Note that these added information do normally not appear when the invention is used.
- the computer 13when the computer 13 detects that the monitored value enters 90% of set point value, the computer 13 displays a zoom from 90% to 110% of the set point value on the screen 13 and only this portion is shown in the zoomed graphical zone Dz. In this way as soon as the operator sees this scale change he knows he needs to be more careful and precise and that he needs to introduce the raw material more slowly.
- the monitored valuesin the present embodiment the mass of the raw material, is not linearly displayed and, a part of the zoomed graphical zone Dz is magnified. This means that at least two different scales are used and shown in the same zoomed graphical zone Dz.
- the graphical zone Dzis divided in four different scale areas or portions D1 to D4. Each area D1 to D4 has a different scale but the four zones or areas D1 to D4 may have the graphical same length.
- areas or zones D1 and D4are the zoomed areas and areas D2 and D3 are the magnified areas.
- the magnified areahave the same length but do not represent the same real interval of values, i.e. in the embodiment of figure 2c , 9.995g for area D1, 0.005 g for area D2 0.0002g for area D3 and 9.998g for area D4.
- the entering tolerance value 17 and the exiting tolerance value 19can be set and may not be symmetrical relative to the set point value. This may be the case depending of the raw material to introduce in the recipe.
- the minimum tolerance value indicator 17a and the maximum tolerance value indicator 19aare shown symmetrically relative to the set point indicator 15 in zoomed graphical zone Dz. This allows an operator to easily identify the tolerance values and also to stay between the tolerance values 17 and 19. Furthermore, the operator does not need to focus on the numerical monitored value itself but only on the visual information provided in the zoomed graphical zone Dz. The operator only needs to follow the evolution of the bar graph 23 and its position relative to the set point indicator 15 and relative to the tolerance indicators 17a and 19a. The weighing process can therefore be realized only by looking the screen 13 and the operator does not really need to care about the real values of the physical quantity.
- magnificationor “magnified” means that a further zoom is applied within an already zoomed zone as if a magnifying glass was introduced within the already zoomed zone.
- four different scalesare used, one for each area D1 to D4 as above defined.
- the zoom of magnification areas D2 and D3may be between 10 times and up to 2000 times greater than the zoom used in the zoomed areas D1 and D4.
- the set point indicator 15is located in the middle of the zoomed graphical zone Dz.
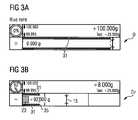
- FIGS 3a-3dare views of one embodiment of the invention and show further details of the invention. Please note that in figures 3a to 3d all reference numbers have not been added for sake of clarity but of course these figures show a control display similar to those of figures 2 and the reference numbers of figures 2 also apply for figures 3a-3d .
- the two colored horizontal bars 31are used to indicate visually the status of the raw material 6 introduced in the second container 7 relative to the set point and relative to the tolerance values 17 an 19. As can be seen on figures 3a to 3e the horizontal bars 31 appear in different locations depending on the raw material measured mass. Furthermore, the color of the control display 18 also changes depending on this status.
- each horizontal bar 31extends from the left hand side starting point of the zone D or Dz to second threshold indicator 35.
- Figure 3ashows the situation where the monitored value is under the first zooming threshold 33 and when no zoom has occurred.
- Figure 3bshows the situation where a zoom has occurred and when the monitored value represented by the bar graph 23 is still under a second threshold represented by a second threshold indicator 35.
- the second threshold represented by the second threshold indicator 35can be set for example at 98% of the value to reach represented by the graphical set point 15. In this state the control display 18 appears in blue.
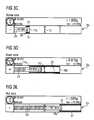
- each horizontal bar 31extends between the second threshold indicator 35 and the minimum tolerance value indicator 17a. This can be seen on fig.3c . In this state the control display 18 appears in yellow.
- each horizontal bar 31extends between the graphical minimum and maximum tolerance values 17a and 19a and is centered relative to the graphical set point 15. In this state the control display 18 appears in green.
- each horizontal bar 31extends from and beyond the graphical maximum tolerance values 19 as can be seen in figure 3d .
- the control display 18appears in red.
Landscapes
- Physics & Mathematics (AREA)
- General Physics & Mathematics (AREA)
- Engineering & Computer Science (AREA)
- Theoretical Computer Science (AREA)
- User Interface Of Digital Computer (AREA)
Description
- The invention relates to a method and a system for monitoring the evolution of a physical quantity. In particular, the invention concerns a method and system for monitoring such a physical quantity relating to a material composing a pharmaceutical product.
- In pharmaceutical production environment, the raw materials used to manufacture a product are quantified in a recipe. On numerous occasions an operator has to introduce manually each component of the pharmaceutical product in the recipe. For evident public health reasons, it is very important that the operator introduces each ingredient in the required quantity and with limited compulsory predefined minimal and maximal tolerances. As already mentioned, this process is done manually and should be done as quickly as possible and also independently from the environment in which the operator works.
- For example, in a particular recipe, an operator may have to weigh 100g plus or
minus 0,0001g, the tolerance window the operator has to enter is therefore really restricted in comparison with the total quantity of raw material. Furthermore, an error made by the operator in the above mentioned tolerance means that the whole pharmaceutical product has to be thrown away because it can not be used at all and of course cannot be sold. - In this regard, the concrete example of preparation of a liquid composition used in dialysis treatment can be cited. In this pharmaceutical product, water is mixed with a small quantity of active ingredient. This process is very simple and the key point is the active ingredient quantity added to the water. If, from the beginning the dosage is wrong, the whole mixture cannot be used and this is a time and money lost.
- Therefore, there is a clear need in pharmaceutical production processes, wherein very small tolerances are allowed in comparison with the whole quantity of raw material and wherein human being operators are involved, to monitor accurately the quantity of product introduced in the recipe.
DocumentUS2007/176933A1 discloses a self-centring zoom bar graph. - An objective of the invention is to provide a method and a system to solve the above mentioned problems. An important objective of the present invention is to allow that the operator realizes the dosage operation right at the first time to avoid the product to be non usable and therefore to increase the production rate by saving time and money.
- Given the above mentioned objectives, the invention proposes according to a first aspect a method for monitoring the evolution of a physical quantity, such a physical quantity of a component of a pharmaceutical product, the method comprises:
- measuring the evolution of the value of the physical quantity,
- displaying in a first graphical zone a bar graph representing the evolution of the value received from a sensor until this value reaches a first threshold, the graphical zone having a first displaying scale,
- wherein, when the monitored value reaches the first threshold:
- ∘ displaying the bar graph representing the evolution of the value received from the sensor in a second graphical zone, the second graphical zone being a zoom of a part of the first graphical zone and having at least a second displaying scale and
- ∘ further displaying at least one magnified portion of the second graphical zone, the magnified portion having at least a third displaying scale.
- The method according to the invention can also comprise several other features, taken alone or in combination, such as:
- the second graphical zone replaces the first graphical zone when the second graphical zone is displayed;
- the magnified portion is displayed within the second graphical zone;
- a target value indicator is displayed within the magnified portion
- a minimum tolerance value indicator and a maximum tolerance value indicator delimiting the magnified portion are displayed within the second graphical zone;
- the second graphical zone comprises at least four different displaying areas or portions consecutively extending along the second graphical zone length, each displaying area having a displaying scale different from the others:
- ➢ a first zoom area extending from a first threshold indicator to the minimum tolerance values indicator and having a first scale,
- ➢ a first magnification area extending from the minimum tolerance value indicator to the target value indicator and having a second scale;
- ➢ a second magnification area extending from the target value indicator to the maximum tolerance values indicators and having a third scale;
- ➢ a second zoom area extending from and beyond the maximum tolerance values indicators and having a fourth scale;
- a graphical status indicator is further displayed within each graphical zone, the graphical status indicator comprising at least two horizontal bars appearing at different locations of the bar graph zones depending on the current value of the monitored value;
- when the monitored value is under a second predefined threshold, each horizontal bar extends from the left hand side starting point of the first or second bar graph zone to a second threshold indicator;
- when the monitored value is between a second predefined threshold and the minimum tolerance value, each horizontal bar extends between the graphical indicators of those two values;
- when the monitored value is between a predefined minimum tolerance value and a predefined maximum tolerance value, each horizontal bar extends between the minimum and maximum tolerance value indicators and is centered relative to the set point indicator;
- when the monitored value is greater than a maximum tolerance value, each horizontal bar extends from and beyond the graphical maximum tolerance values indicator;
- a completion indicator is further dynamically displayed and indicates the percentage of the set point value already reached since the beginning of monitoring process;
- the completion indicator is displayed in a graphical form and in a numerical form, the graphical form comprises a ring which is angularly filled depending on the percentage of completion of the monitoring process and within this ring, a numerical value representing the same percentage is also displayed and regularly updated in real time.
- A second aspect of the invention is a system for monitoring the evolution of a physical quantity, such as a physical quantity of a component of a pharmaceutical product, for carrying out the method according as above defined, the system comprising:
- a sensor for measuring the evolution of the value of the physical quantity, the sensor being communicatively connected with a computer provided with a processor,
- means for displaying the evolution of the value, said means being communicatively connected with the computer and receiving displaying instruction from the processor,
- a memory including instructions for:
- i. displaying in a first graphical zone a bar graph representing the evolution of the value received from the sensor until this value reaches a first threshold, the bar graph zone having a first displaying scale,
- ii. when the monitored value reaches the first threshold:
- displaying the bar graph representing the evolution of the value received from the sensor in a second graphical zone, the second graphical zone being a zoom of a part of the first graphical zone and having at least a second displaying scale and
- further displaying at least one magnified portion of the second graphical zone, the magnified portion having at least one third displaying scale.
- A third aspect of the invention is a computer readable media including program instructions which when executed by a processor cause the processor to perform the method according to claims 1 to 13.
- Thanks to the invention no more weighing error happens. The invention allows the good dosage from the beginning and avoids loosing time and money during the production process.
- Other features and advantages of the present invention will be more readily apparent upon reading the following description of exemplified and non limiting embodiments of the invention with reference to the accompanying drawing, in which:
fig. 1 is a schematic view of the system according to the invention.fig. 2a is a view of a monitoring display according to the invention before a weighing process.fig 2b is a view of a monitoring display according to the invention during a weighing process.fig.2c is an enlarged view offigure 2b wherein further details have been added.fig. 3a-3c are views of a monitoring display according to the invention showing the different status of the monitoring of the value of a physical quantity according to the invention.Figure 1 is a schematic view of a system according to the invention. This system comprises a sensor 5 which outputs a value depending on the quantity of raw material 6 introduced by an operator 1 from afirst container 3 into a second container 7. The sensor 5 is communicatively connected to a computer in turn connected to adisplay 13.- In the embodiment of
figure 1 , the sensor 5 is a digital balance measuring the mass of the raw material 6 introduced in the second container 7. This information is transmitted via acommunication line 9 to acomputer 11. Thecomputer 11 includes a memory (not shown) comprising instructions for displaying the raw material mass evolution on ascreen 13. For this purpose,computer 11 is connected to thedisplay 13. The operator can follow the evolution of the product mass by consulting thescreen 13 while discharging the raw material from the first to the second container. - During a weighing procedure, the
sensor 15 continuously sends information to thecomputer 11 which in turn sends displaying instructions to thedisplay 13. Figures 2a, 2b and 2C are detailed views of display orscreen 13 respectively before (figure 1a ) and during (figures 2b and 2c ) weighing operations according to an embodiment of the present invention. Acontrol display 18 according to the invention shows on screen 13 a plurality of information helping the operator to add precisely the requested quantity of raw material in the second container 7. Thecontrol display 18 has a general rectangular shape and is divided in four different zones A, B, C and D.- The first zone A, located on the top left of the
control display 18 comprises a progression orcompletion indicator 27. The progression orcompletion indicator 27 dynamically indicates the percentage of the set point value already reached since the beginning of weighing of current raw material. In the embodiment offigures 2a, 2b and 2c the progression or completion degree is displayed in a graphical form and in a numerical form. The graphical form comprises a ring which is angularly filled depending on the percentage of completion of the weighing process. Within this ring, a numerical value representing the same percentage is also displayed and regularly updated in real time. - The second zone B located on the top right of the
control display 18 comprises a plurality of numerical information: Minimum 17 and maximum 19 tolerance values, these values are also highlighted by down and up arrows;Tare value 21 indicating the mass of the second container 7 and of the material already present in the second container 7 before the beginning of the current raw material weighing procedure. Thetare value 21 is displayed in a numerical form because this information must not be ambiguous;- Remaining
quantity 25 indicating the current raw material mass missing to reach the set point; the remainingquantity 25 is displayed in a numerical form. The remainingquantity 25 shows the user what is missing to reach the set point. It's the information that drives the user to perfectly reach the set point. - The third zone C located on the bottom right of the
control display 18 comprises astability indicator 29 showing if the actual weight is stable or not. Two symbols are used to display this information: - Symbol "=" means stable
- Symbol "∼" means not stable
- The fourth graphical zone D located at the bottom right of the
control display 18 comprises abar graph 23 showing the evolution of the current mass of the added material. The bar graph is regularly updated by thecomputer 11 and moves forward depending on information coming from the sensor 5. Furthermore, the current mass value of the added raw material is also displayed on a numerical form. Aset point indicator 15 is drawn in the graphical zone D as vertical line marked by arrows to represent the target to reach. Minimum and maximumtolerance value indicators horizontal bars 31 indicate the state of the current weighing (under targeted value, near targeted values, inside tolerances values, over maximum targeted value). In the embodiment offigures 2a and 2b , a first colored bar is located above thebar graph 23 and a second colored bar is located below thebar graph 23. - As above mentioned and as can be seen on
figures 2a, 2b and 2c all important information are displayed graphically and a numerically. This increases the legibility of the information for the operator. Computer 11 comprises a processor (not shown) in communication with the sensor 5 and with a memory. The processor is configured to execute computer readable instructions stored in its memory or in any other computer readable media which modify thecontrol display 18 and which allow thecontrol display 18 to have a particular behaviour depending on the information coming from the sensor 5. This particular intelligent behaviour helps the operator during weighing operations. The memory also contains all different views and graphical information needed to update thecontrol display 18 during a monitoring process.- The
computer 11 via its processor continuously monitor the value coming from the sensor 5, and updates in real time the different values and graphs displayed by thescreen 13 depending on the values provided by the sensor 5, i.e., and in particular in the embodiment offigure 2a, 2b and 2c : theprogression 27, the remainingquantity 25, thestability 29, the position ofbar graph 23 and thestate 31. - According to the invention, a plurality of different graphical zones D and Dz can be displayed on the
screen 13 depending on the values returned by the sensor and depending on the ratio between the current mass and the set point. - More precisely, as shown in
figure 2a , when the current value returned by the sensor is under a first threshold graphically represented by afirst threshold indicator 33, for example under 90% of the set point also call target value, the evolution of the bar graph is shown in the fourth zone D with a first linear scale going for example from 0 to 110% of the target value. In this first state (non zoomed state) of thecontrol display 18, the graphical marks of, theset point 15, the minimal 17 and the maximal 19 tolerance values are close one from each other within the graphical zone D. This enables the operator to know he can introduce a great amount of raw material at that time. - As soon as a first threshold is reached by the monitored value returned by the sensor 5 and as can be seen on
figure 2b and 2c , the scale is changed and a zoom is realized only on the important portion of the previous larger scale including theset point indicator 15, the minimal 17 and the maximal 19 tolerance value indicators. This is the second state of the control display 18 (the zoomed and magnified state). For sake of clarity the zoomed graphical zone will be referenced as Dz in the rest of the patent application. For example, only the part between 90% and 110 % of the previous scale is now shown on all the space previously dedicated to the graphical zone D of thescreen 13, and this zoomed zone Dz replaces the previous graphical zone D. Further to this zoom, a magnification of the important part of the zoomed graphical zone Dz is also realized within the zoomed graphical zone Dz itself. Thebar graph 23 is updated in real time and keeps on moving forward also in the zoomed graphical zone Dz and also in the magnified area of the zoomed graph graphical zone Dz. Figure 2c is a slightly enlarged view offigure 2b wherein details concerning the bar graph displaying when the first threshold is reach by the monitored value have been added for explanations purposes. Note that these added information do normally not appear when the invention is used.- As above mentioned, when the
computer 13 detects that the monitored value enters 90% of set point value, thecomputer 13 displays a zoom from 90% to 110% of the set point value on thescreen 13 and only this portion is shown in the zoomed graphical zone Dz. In this way as soon as the operator sees this scale change he knows he needs to be more careful and precise and that he needs to introduce the raw material more slowly. - In this zoomed mode or state, to help the users to correctly reach the set point and because the tolerance is very fine, the monitored values, in the present embodiment the mass of the raw material, is not linearly displayed and, a part of the zoomed graphical zone Dz is magnified. This means that at least two different scales are used and shown in the same zoomed graphical zone Dz.
- In the embodiment of
figure 2C , the graphical zone Dz is divided in four different scale areas or portions D1 to D4. Each area D1 to D4 has a different scale but the four zones or areas D1 to D4 may have the graphical same length. - In the example of
figure 2C , the different areas are defined as follows: - D1: first area displaying a value from 90 to 99.995 g with a delta of 9.995 g
- D2: second area displaying values from 99.995 to 100 g with a delta of 0.005 g
- D3: third area displaying values from 100 to 100.002 g with a delta of 0.002 g
- D4: last zone displaying values from 100.002 to 110 g with a delta of 9.998 g
- As can be easily understood, areas or zones D1 and D4 are the zoomed areas and areas D2 and D3 are the magnified areas. In the example of
figure 2C the magnified area have the same length but do not represent the same real interval of values, i.e. in the embodiment offigure 2c , 9.995g for area D1, 0.005 g for area D2 0.0002g for area D3 and 9.998g for area D4. In other words, the enteringtolerance value 17 and the exitingtolerance value 19 can be set and may not be symmetrical relative to the set point value. This may be the case depending of the raw material to introduce in the recipe. However, according to the invention the minimumtolerance value indicator 17a and the maximumtolerance value indicator 19a are shown symmetrically relative to theset point indicator 15 in zoomed graphical zone Dz. This allows an operator to easily identify the tolerance values and also to stay between the tolerance values 17 and 19. Furthermore, the operator does not need to focus on the numerical monitored value itself but only on the visual information provided in the zoomed graphical zone Dz. The operator only needs to follow the evolution of thebar graph 23 and its position relative to theset point indicator 15 and relative to thetolerance indicators screen 13 and the operator does not really need to care about the real values of the physical quantity. - In the present patent application the words "magnification" or "magnified" means that a further zoom is applied within an already zoomed zone as if a magnifying glass was introduced within the already zoomed zone. This means that on the graphical zone Dz at least two different scales can be shown. In the embodiment of
figure 2c four different scales are used, one for each area D1 to D4 as above defined. For example, the zoom of magnification areas D2 and D3 may be between 10 times and up to 2000 times greater than the zoom used in the zoomed areas D1 and D4. Of course other values may be used by the skilled man, as far as the magnification areas D2 and D3 are portions much more zoomed than the zoomed areas D1 and D4. Further, in the embodiment offigure 2c theset point indicator 15 is located in the middle of the zoomed graphical zone Dz. Figures 3a-3d are views of one embodiment of the invention and show further details of the invention. Please note that infigures 3a to 3d all reference numbers have not been added for sake of clarity but of course these figures show a control display similar to those offigures 2 and the reference numbers offigures 2 also apply forfigures 3a-3d .- According to one embodiment, the two colored
horizontal bars 31 are used to indicate visually the status of the raw material 6 introduced in the second container 7 relative to the set point and relative to the tolerance values 17 an 19. As can be seen onfigures 3a to 3e thehorizontal bars 31 appear in different locations depending on the raw material measured mass. Furthermore, the color of thecontrol display 18 also changes depending on this status. - More precisely, when the monitored value is under the minimum of a second threshold represented by the
second threshold indicator 35, eachhorizontal bar 31 extends from the left hand side starting point of the zone D or Dz tosecond threshold indicator 35.Figure 3a shows the situation where the monitored value is under thefirst zooming threshold 33 and when no zoom has occurred.Figure 3b shows the situation where a zoom has occurred and when the monitored value represented by thebar graph 23 is still under a second threshold represented by asecond threshold indicator 35. The second threshold represented by thesecond threshold indicator 35 can be set for example at 98% of the value to reach represented by thegraphical set point 15. In this state thecontrol display 18 appears in blue. - When the monitored value is between the second threshold and the
minimum tolerance value 17, eachhorizontal bar 31 extends between thesecond threshold indicator 35 and the minimumtolerance value indicator 17a. This can be seen onfig.3c . In this state thecontrol display 18 appears in yellow. - When the monitored value is between the minimum and maximum tolerance values, each
horizontal bar 31 extends between the graphical minimum and maximum tolerance values 17a and 19a and is centered relative to thegraphical set point 15. In this state thecontrol display 18 appears in green. - When the monitored value is greater than the
maximum tolerance value 19, eachhorizontal bar 31 extends from and beyond the graphical maximum tolerance values 19 as can be seen infigure 3d . In this state thecontrol display 18 appears in red. - Thanks to the combination of the location and form changing of the horizontals bars 31 and the colored context, depending on the monitored value, an operator can directly and at first view recognize in which status the weighing process is and can avoid any mistake. Further the location and form changing of the horizontals bars 31 alone allow blind color operators to also realize the weighing and to benefit from the advantages of the invention.
- Of course, even if the present invention has been presented in relation with the production of pharmaceutical product, it can be used in all technical fields requiring accurate monitoring of a physical value, in particular in processes where human being are involved.
- The following advantages are provided with the use of the invention:
- The operator has a better control of the process,
- The precision is enhanced,
- A better efficiency is obtained due to a decrease of handling errors,
- The operator reaches more easily the target in one shot, the first time and in one step.
- This avoids what is not appropriate in pharmaceutical production namely the fact that the operator needs to take out some material.
Claims (15)
- Method for monitoring the evolution of a physical quantity comprising:- measuring the evolution of the value of the physical quantity,- displaying in a first graphical zone (D) a bar graph (23) representing the evolution of the value received from a sensor until this value reaches a first threshold, the graphical zone (D) having a first displaying scale,- wherein, when the monitored value reaches the first threshold:∘ displaying the bar graph (23) representing the evolution of the value received from the sensor in a second graphical zone (Dz), the second graphical zone (Dz) being a zoom of a part of the first graphical zone (D) and having at least a second displaying scale,
the method beingcharacterised by that it further comprises:∘ further displaying at least one magnified portion (D2, D3) of the second graphical zone (Dz), the magnified portion having at least a third displaying scale. - Method according to claim 1 wherein the second graphical zone (Dz) replaces the first graphical zone (D) when the second graphical zone is displayed.
- Method according to claim 1 or 2 wherein the magnified portion (D2, D3) is displayed within the second graphical zone (Dz).
- Method according to anyone of the previous claims wherein a target value indicator (15) is displayed within the magnified portion.
- Method according to claim 4 wherein a minimum tolerance value indicator (17) and a maximum (19) tolerance value indicator delimiting the magnified portion are displayed within the second graphical zone (Dz).
- Method according to anyone of the previous claims wherein the second graphical zone comprises at least four different displaying areas or portions (D1-D4) consecutively extending along the second graphical zone length, each displaying area having a displaying scale different from the others:➢ a first zoom area (D1) extending from a first threshold indicator (33) to the minimum tolerance values indicator (17) and having a first scale,➢ a first magnification area (D2) extending from the minimum (17) tolerance value indicator to the target value indicator (15) and having a second scale;➢ a second magnification area (D3) extending from the target value indicator (15) to the maximum (19) tolerance values indicators and having a third scale;➢ a second zoom area (D4) extending from and beyond the maximum tolerance values indicators (19) and having a fourth scale.
- Method according to anyone of the previous claims wherein a graphical status indicator is further displayed within each graphical zone (D, Dz), the graphical status indicator comprising at least two horizontal bars (31) appearing at different locations of the bar graph zones (D, Dz) depending on the current value of the monitored value.
- Method according to claim 7 wherein when the monitored value is under a second predefined threshold, each horizontal bar (31) extends from the left hand side starting point of the first or second bar graph zone (D, Dz) to a second threshold indicator (35).
- Method according to claims 7 or 8 when they depend on claim 5 wherein when the monitored value is between a second predefined threshold and the minimum tolerance value (17), each horizontal bar (31) extends between the graphical indicators (35, 17a) of those two values.
- Method according to claims 7 to 9 when they depend on claim 5 wherein when the monitored value is between a predefined minimum tolerance value (17a) and a predefined maximum tolerance value (19a), each horizontal bar (31) extends between the minimum and maximum tolerance value indicators (17a, 19a) and is centered relative to the set point indicator (15).
- Method according to claims 7 to 10 when they depend on claim 5 wherein when the monitored value is greater than a maximum tolerance value (19), each horizontal bar (31) extends from and beyond the graphical maximum tolerance values indicator (19a).
- Method according to anyone of the previous claims wherein a completion indicator (27) is further dynamically displayed and indicates the percentage of the set point value already reached since the beginning of monitoring process.
- Method according to the previous claim wherein the completion indicator is displayed in a graphical form and in a numerical form, the graphical form comprises a ring which is angularly filled depending on the percentage of completion of the monitoring process and within this ring, a numerical value representing the same percentage is also displayed and regularly updated in real time.
- System for monitoring the evolution of a physical quantity for carrying out the method according to anyone of the previous claims, the system comprising:∘ a sensor (5) for measuring the evolution of the value of the physical quantity, the sensor being communicatively connected with a computer (11) provided with a processor,∘ means (13) for displaying the evolution of the value, said means being communicatively connected with the computer (11) and receiving displaying instruction from the processor,∘ a memory including instructions for:■ displaying in a first graphical zone (D) a bar graph (23) representing the evolution of the value received from the sensor until this value reaches a first threshold, the bar graph zone (D) having a first displaying scale,■ when the monitored value reaches the first threshold:➢ displaying the bar graph (23) representing the evolution of the value received from the sensor in a second graphical zone (Dz), the second graphical zone (Dz) being a zoom of a part of the first graphical zone (D) and having at least a second displaying scale,characterized by➢ further displaying at least one magnified portion (17,19) of the second graphical zone (Dz), the magnified portion having at least one third displaying scale.
- A computer readable media including program instructions which when executed by a processor cause the processor to perform the method according to claims 1 to 13.
Priority Applications (3)
| Application Number | Priority Date | Filing Date | Title |
|---|---|---|---|
| EP20120290061EP2631876B1 (en) | 2012-02-21 | 2012-02-21 | Method and system for monitoring the evolution of a physical quantity |
| CN201310066801.3ACN103256970B (en) | 2012-02-21 | 2013-02-21 | For the method and system for the differentiation for monitoring physical quantity |
| US13/772,578US9129419B2 (en) | 2012-02-21 | 2013-02-21 | Method and system for monitoring the evolution of a physical quantity |
Applications Claiming Priority (1)
| Application Number | Priority Date | Filing Date | Title |
|---|---|---|---|
| EP20120290061EP2631876B1 (en) | 2012-02-21 | 2012-02-21 | Method and system for monitoring the evolution of a physical quantity |
Publications (2)
| Publication Number | Publication Date |
|---|---|
| EP2631876A1 EP2631876A1 (en) | 2013-08-28 |
| EP2631876B1true EP2631876B1 (en) | 2014-10-01 |
Family
ID=45841404
Family Applications (1)
| Application Number | Title | Priority Date | Filing Date |
|---|---|---|---|
| EP20120290061Not-in-forceEP2631876B1 (en) | 2012-02-21 | 2012-02-21 | Method and system for monitoring the evolution of a physical quantity |
Country Status (3)
| Country | Link |
|---|---|
| US (1) | US9129419B2 (en) |
| EP (1) | EP2631876B1 (en) |
| CN (1) | CN103256970B (en) |
Families Citing this family (22)
| Publication number | Priority date | Publication date | Assignee | Title |
|---|---|---|---|---|
| US20160019360A1 (en) | 2013-12-04 | 2016-01-21 | Apple Inc. | Wellness aggregator |
| US12080421B2 (en) | 2013-12-04 | 2024-09-03 | Apple Inc. | Wellness aggregator |
| CN103744598B (en)* | 2013-12-17 | 2017-03-01 | 联想(北京)有限公司 | A kind of method and apparatus of information processing |
| CN117038008A (en)* | 2014-09-02 | 2023-11-10 | 苹果公司 | Physical activity and fitness monitor |
| CN107921317B (en) | 2015-08-20 | 2021-07-06 | 苹果公司 | Movement-based watch faces and complications |
| CA3022948A1 (en)* | 2016-05-03 | 2017-11-09 | Bombardier Inc. | Crew alerting systems and methods for mobile platforms |
| AU2017100667A4 (en) | 2016-06-11 | 2017-07-06 | Apple Inc. | Activity and workout updates |
| US11216119B2 (en) | 2016-06-12 | 2022-01-04 | Apple Inc. | Displaying a predetermined view of an application |
| US10736543B2 (en) | 2016-09-22 | 2020-08-11 | Apple Inc. | Workout monitor interface |
| US10845955B2 (en) | 2017-05-15 | 2020-11-24 | Apple Inc. | Displaying a scrollable list of affordances associated with physical activities |
| US10258304B1 (en) | 2017-11-29 | 2019-04-16 | Siemens Healthcare Gmbh | Method and system for accurate boundary delineation of tubular structures in medical images using infinitely recurrent neural networks |
| DK179980B1 (en) | 2018-03-12 | 2019-11-27 | Apple Inc. | User interfaces for health monitoring |
| DK201870380A1 (en) | 2018-05-07 | 2020-01-29 | Apple Inc. | Displaying user interfaces associated with physical activities |
| US11317833B2 (en) | 2018-05-07 | 2022-05-03 | Apple Inc. | Displaying user interfaces associated with physical activities |
| DK201970532A1 (en) | 2019-05-06 | 2021-05-03 | Apple Inc | Activity trends and workouts |
| CN113892077A (en) | 2019-06-01 | 2022-01-04 | 苹果公司 | Multi-modal activity tracking user interface |
| DK202070616A1 (en) | 2020-02-14 | 2022-01-14 | Apple Inc | User interfaces for workout content |
| US12232878B1 (en) | 2020-08-01 | 2025-02-25 | Apple Inc. | Atrial fibrillation user interfaces |
| EP3967983A1 (en) | 2020-09-14 | 2022-03-16 | Mettler-Toledo (Albstadt) GmbH | Method, apparatus and computer program for displaying an evolution of a filling quantity |
| EP4323992B1 (en) | 2021-05-15 | 2025-05-14 | Apple Inc. | User interfaces for group workouts |
| US11896871B2 (en) | 2022-06-05 | 2024-02-13 | Apple Inc. | User interfaces for physical activity information |
| US11977729B2 (en) | 2022-06-05 | 2024-05-07 | Apple Inc. | Physical activity information user interfaces |
Family Cites Families (7)
| Publication number | Priority date | Publication date | Assignee | Title |
|---|---|---|---|---|
| CN1196480A (en)* | 1997-04-15 | 1998-10-21 | 鼓颂凯 | Machanical automatic logarithmic valuation balance |
| JP2006280916A (en)* | 2005-03-11 | 2006-10-19 | Yuyama Manufacturing Co Ltd | Medicine-weighing apparatus |
| US8004527B2 (en)* | 2006-01-20 | 2011-08-23 | Newport Corporation | Self-centering zoom bar graph |
| JP4802739B2 (en)* | 2006-01-31 | 2011-10-26 | Jfeスチール株式会社 | Blast furnace raw material mixing degree measuring method and blast furnace raw material mixing degree measuring device |
| JP2007244728A (en)* | 2006-03-17 | 2007-09-27 | Omron Healthcare Co Ltd | Body composition measurement apparatus |
| CN101750141A (en)* | 2008-11-28 | 2010-06-23 | 上海精密科学仪器有限公司 | Balance weighing display method |
| US20120262472A1 (en)* | 2011-04-13 | 2012-10-18 | Honeywell International Inc. | Heatmap timeline for visualization of time series data |
- 2012
- 2012-02-21EPEP20120290061patent/EP2631876B1/ennot_activeNot-in-force
- 2013
- 2013-02-21CNCN201310066801.3Apatent/CN103256970B/ennot_activeExpired - Fee Related
- 2013-02-21USUS13/772,578patent/US9129419B2/ennot_activeExpired - Fee Related
Also Published As
| Publication number | Publication date |
|---|---|
| US20130215119A1 (en) | 2013-08-22 |
| US9129419B2 (en) | 2015-09-08 |
| CN103256970B (en) | 2017-07-28 |
| CN103256970A (en) | 2013-08-21 |
| EP2631876A1 (en) | 2013-08-28 |
Similar Documents
| Publication | Publication Date | Title |
|---|---|---|
| EP2631876B1 (en) | Method and system for monitoring the evolution of a physical quantity | |
| JP2022058551A (en) | Methods, equipment, and computer-readable media for displaying recipe information for process control systems | |
| US20150324106A1 (en) | User interface, method, and computer program for displaying data | |
| JP2023153916A (en) | Operator interface apparatus, method, and tangible product | |
| US20130135093A1 (en) | In-vehicle display apparatus | |
| JP2017083454A (en) | Smart scale-proportioning system for cooking | |
| DE102009046645A1 (en) | Visual readings | |
| CN103419344A (en) | Remote operating system of injection moulding machine | |
| JP2012203605A (en) | Graph creation device and graph creation method | |
| WO2016128484A1 (en) | Hierarchical icons for graphical user interface | |
| CN105091879A (en) | Method and device for displaying deviations of the position of a stationary aircraft | |
| JP2013101544A (en) | Operation monitoring screen display apparatus and operation monitoring screen display method | |
| JP6113353B2 (en) | Plan 卜 monitoring and control system | |
| US20170160705A1 (en) | Controller including means for confirmation in preparation of synchronous operation teaching data | |
| JP2006278891A (en) | Method for comparing semiconductor characteristic curves | |
| JP5155232B2 (en) | Quality analysis system, quality analysis method and program | |
| JP7409001B2 (en) | audio equipment | |
| GB2531649A (en) | Device for managing and configuring field devices in an automation installation | |
| WO2014058537A1 (en) | Systems and methods for improved graphical display of real-time data in a user interface | |
| JP2015130131A (en) | Data creation apparatus and method | |
| JP2000035448A (en) | Waveform display device | |
| JP2015230182A (en) | Automatic analyzer | |
| JP6418996B2 (en) | Program design apparatus, batch plant control system, and program design support method | |
| JP6605285B2 (en) | Display device, measuring device, display method and program | |
| JP2014035609A (en) | Image creation method of instrument operator console and plant monitoring control system |
Legal Events
| Date | Code | Title | Description |
|---|---|---|---|
| PUAI | Public reference made under article 153(3) epc to a published international application that has entered the european phase | Free format text:ORIGINAL CODE: 0009012 | |
| AK | Designated contracting states | Kind code of ref document:A1 Designated state(s):AL AT BE BG CH CY CZ DE DK EE ES FI FR GB GR HR HU IE IS IT LI LT LU LV MC MK MT NL NO PL PT RO RS SE SI SK SM TR | |
| AX | Request for extension of the european patent | Extension state:BA ME | |
| REG | Reference to a national code | Ref country code:DE Ref legal event code:R079 Ref document number:602012003261 Country of ref document:DE Free format text:PREVIOUS MAIN CLASS: G06T0011200000 Ipc:G06T0011000000 | |
| 17P | Request for examination filed | Effective date:20140225 | |
| RBV | Designated contracting states (corrected) | Designated state(s):AL AT BE BG CH CY CZ DE DK EE ES FI FR GB GR HR HU IE IS IT LI LT LU LV MC MK MT NL NO PL PT RO RS SE SI SK SM TR | |
| RIC1 | Information provided on ipc code assigned before grant | Ipc:G06T 11/20 20060101ALI20140314BHEP Ipc:G06T 11/00 20060101AFI20140314BHEP | |
| GRAP | Despatch of communication of intention to grant a patent | Free format text:ORIGINAL CODE: EPIDOSNIGR1 | |
| INTG | Intention to grant announced | Effective date:20140502 | |
| GRAS | Grant fee paid | Free format text:ORIGINAL CODE: EPIDOSNIGR3 | |
| GRAA | (expected) grant | Free format text:ORIGINAL CODE: 0009210 | |
| AK | Designated contracting states | Kind code of ref document:B1 Designated state(s):AL AT BE BG CH CY CZ DE DK EE ES FI FR GB GR HR HU IE IS IT LI LT LU LV MC MK MT NL NO PL PT RO RS SE SI SK SM TR | |
| REG | Reference to a national code | Ref country code:GB Ref legal event code:FG4D | |
| REG | Reference to a national code | Ref country code:AT Ref legal event code:REF Ref document number:689853 Country of ref document:AT Kind code of ref document:T Effective date:20141015 Ref country code:CH Ref legal event code:EP | |
| REG | Reference to a national code | Ref country code:IE Ref legal event code:FG4D | |
| REG | Reference to a national code | Ref country code:DE Ref legal event code:R096 Ref document number:602012003261 Country of ref document:DE Effective date:20141113 | |
| REG | Reference to a national code | Ref country code:NL Ref legal event code:VDEP Effective date:20141001 | |
| REG | Reference to a national code | Ref country code:AT Ref legal event code:MK05 Ref document number:689853 Country of ref document:AT Kind code of ref document:T Effective date:20141001 | |
| REG | Reference to a national code | Ref country code:LT Ref legal event code:MG4D | |
| PG25 | Lapsed in a contracting state [announced via postgrant information from national office to epo] | Ref country code:NL Free format text:LAPSE BECAUSE OF FAILURE TO SUBMIT A TRANSLATION OF THE DESCRIPTION OR TO PAY THE FEE WITHIN THE PRESCRIBED TIME-LIMIT Effective date:20141001 | |
| PG25 | Lapsed in a contracting state [announced via postgrant information from national office to epo] | Ref country code:ES Free format text:LAPSE BECAUSE OF FAILURE TO SUBMIT A TRANSLATION OF THE DESCRIPTION OR TO PAY THE FEE WITHIN THE PRESCRIBED TIME-LIMIT Effective date:20141001 Ref country code:PT Free format text:LAPSE BECAUSE OF FAILURE TO SUBMIT A TRANSLATION OF THE DESCRIPTION OR TO PAY THE FEE WITHIN THE PRESCRIBED TIME-LIMIT Effective date:20150202 Ref country code:LT Free format text:LAPSE BECAUSE OF FAILURE TO SUBMIT A TRANSLATION OF THE DESCRIPTION OR TO PAY THE FEE WITHIN THE PRESCRIBED TIME-LIMIT Effective date:20141001 Ref country code:IS Free format text:LAPSE BECAUSE OF FAILURE TO SUBMIT A TRANSLATION OF THE DESCRIPTION OR TO PAY THE FEE WITHIN THE PRESCRIBED TIME-LIMIT Effective date:20150201 Ref country code:FI Free format text:LAPSE BECAUSE OF FAILURE TO SUBMIT A TRANSLATION OF THE DESCRIPTION OR TO PAY THE FEE WITHIN THE PRESCRIBED TIME-LIMIT Effective date:20141001 Ref country code:NO Free format text:LAPSE BECAUSE OF FAILURE TO SUBMIT A TRANSLATION OF THE DESCRIPTION OR TO PAY THE FEE WITHIN THE PRESCRIBED TIME-LIMIT Effective date:20150101 Ref country code:CZ Free format text:LAPSE BECAUSE OF FAILURE TO SUBMIT A TRANSLATION OF THE DESCRIPTION OR TO PAY THE FEE WITHIN THE PRESCRIBED TIME-LIMIT Effective date:20141001 | |
| PG25 | Lapsed in a contracting state [announced via postgrant information from national office to epo] | Ref country code:CY Free format text:LAPSE BECAUSE OF FAILURE TO SUBMIT A TRANSLATION OF THE DESCRIPTION OR TO PAY THE FEE WITHIN THE PRESCRIBED TIME-LIMIT Effective date:20141001 Ref country code:PL Free format text:LAPSE BECAUSE OF FAILURE TO SUBMIT A TRANSLATION OF THE DESCRIPTION OR TO PAY THE FEE WITHIN THE PRESCRIBED TIME-LIMIT Effective date:20141001 Ref country code:AT Free format text:LAPSE BECAUSE OF FAILURE TO SUBMIT A TRANSLATION OF THE DESCRIPTION OR TO PAY THE FEE WITHIN THE PRESCRIBED TIME-LIMIT Effective date:20141001 Ref country code:HR Free format text:LAPSE BECAUSE OF FAILURE TO SUBMIT A TRANSLATION OF THE DESCRIPTION OR TO PAY THE FEE WITHIN THE PRESCRIBED TIME-LIMIT Effective date:20141001 Ref country code:RS Free format text:LAPSE BECAUSE OF FAILURE TO SUBMIT A TRANSLATION OF THE DESCRIPTION OR TO PAY THE FEE WITHIN THE PRESCRIBED TIME-LIMIT Effective date:20141001 Ref country code:GR Free format text:LAPSE BECAUSE OF FAILURE TO SUBMIT A TRANSLATION OF THE DESCRIPTION OR TO PAY THE FEE WITHIN THE PRESCRIBED TIME-LIMIT Effective date:20150102 Ref country code:LV Free format text:LAPSE BECAUSE OF FAILURE TO SUBMIT A TRANSLATION OF THE DESCRIPTION OR TO PAY THE FEE WITHIN THE PRESCRIBED TIME-LIMIT Effective date:20141001 Ref country code:SE Free format text:LAPSE BECAUSE OF FAILURE TO SUBMIT A TRANSLATION OF THE DESCRIPTION OR TO PAY THE FEE WITHIN THE PRESCRIBED TIME-LIMIT Effective date:20141001 | |
| PG25 | Lapsed in a contracting state [announced via postgrant information from national office to epo] | Ref country code:BE Free format text:LAPSE BECAUSE OF NON-PAYMENT OF DUE FEES Effective date:20150228 | |
| REG | Reference to a national code | Ref country code:DE Ref legal event code:R097 Ref document number:602012003261 Country of ref document:DE | |
| PG25 | Lapsed in a contracting state [announced via postgrant information from national office to epo] | Ref country code:SK Free format text:LAPSE BECAUSE OF FAILURE TO SUBMIT A TRANSLATION OF THE DESCRIPTION OR TO PAY THE FEE WITHIN THE PRESCRIBED TIME-LIMIT Effective date:20141001 Ref country code:RO Free format text:LAPSE BECAUSE OF FAILURE TO SUBMIT A TRANSLATION OF THE DESCRIPTION OR TO PAY THE FEE WITHIN THE PRESCRIBED TIME-LIMIT Effective date:20141001 Ref country code:DK Free format text:LAPSE BECAUSE OF FAILURE TO SUBMIT A TRANSLATION OF THE DESCRIPTION OR TO PAY THE FEE WITHIN THE PRESCRIBED TIME-LIMIT Effective date:20141001 Ref country code:EE Free format text:LAPSE BECAUSE OF FAILURE TO SUBMIT A TRANSLATION OF THE DESCRIPTION OR TO PAY THE FEE WITHIN THE PRESCRIBED TIME-LIMIT Effective date:20141001 | |
| PLBE | No opposition filed within time limit | Free format text:ORIGINAL CODE: 0009261 | |
| STAA | Information on the status of an ep patent application or granted ep patent | Free format text:STATUS: NO OPPOSITION FILED WITHIN TIME LIMIT | |
| 26N | No opposition filed | Effective date:20150702 | |
| PG25 | Lapsed in a contracting state [announced via postgrant information from national office to epo] | Ref country code:LU Free format text:LAPSE BECAUSE OF FAILURE TO SUBMIT A TRANSLATION OF THE DESCRIPTION OR TO PAY THE FEE WITHIN THE PRESCRIBED TIME-LIMIT Effective date:20150221 | |
| REG | Reference to a national code | Ref country code:CH Ref legal event code:PL | |
| PG25 | Lapsed in a contracting state [announced via postgrant information from national office to epo] | Ref country code:CH Free format text:LAPSE BECAUSE OF NON-PAYMENT OF DUE FEES Effective date:20150228 Ref country code:LI Free format text:LAPSE BECAUSE OF NON-PAYMENT OF DUE FEES Effective date:20150228 Ref country code:MC Free format text:LAPSE BECAUSE OF FAILURE TO SUBMIT A TRANSLATION OF THE DESCRIPTION OR TO PAY THE FEE WITHIN THE PRESCRIBED TIME-LIMIT Effective date:20141001 | |
| REG | Reference to a national code | Ref country code:IE Ref legal event code:MM4A | |
| PG25 | Lapsed in a contracting state [announced via postgrant information from national office to epo] | Ref country code:IE Free format text:LAPSE BECAUSE OF NON-PAYMENT OF DUE FEES Effective date:20150221 | |
| REG | Reference to a national code | Ref country code:FR Ref legal event code:PLFP Year of fee payment:5 | |
| PG25 | Lapsed in a contracting state [announced via postgrant information from national office to epo] | Ref country code:SI Free format text:LAPSE BECAUSE OF FAILURE TO SUBMIT A TRANSLATION OF THE DESCRIPTION OR TO PAY THE FEE WITHIN THE PRESCRIBED TIME-LIMIT Effective date:20141001 | |
| PG25 | Lapsed in a contracting state [announced via postgrant information from national office to epo] | Ref country code:MT Free format text:LAPSE BECAUSE OF FAILURE TO SUBMIT A TRANSLATION OF THE DESCRIPTION OR TO PAY THE FEE WITHIN THE PRESCRIBED TIME-LIMIT Effective date:20141001 | |
| REG | Reference to a national code | Ref country code:FR Ref legal event code:PLFP Year of fee payment:6 | |
| PG25 | Lapsed in a contracting state [announced via postgrant information from national office to epo] | Ref country code:BG Free format text:LAPSE BECAUSE OF FAILURE TO SUBMIT A TRANSLATION OF THE DESCRIPTION OR TO PAY THE FEE WITHIN THE PRESCRIBED TIME-LIMIT Effective date:20141001 Ref country code:HU Free format text:LAPSE BECAUSE OF FAILURE TO SUBMIT A TRANSLATION OF THE DESCRIPTION OR TO PAY THE FEE WITHIN THE PRESCRIBED TIME-LIMIT; INVALID AB INITIO Effective date:20120221 Ref country code:SM Free format text:LAPSE BECAUSE OF FAILURE TO SUBMIT A TRANSLATION OF THE DESCRIPTION OR TO PAY THE FEE WITHIN THE PRESCRIBED TIME-LIMIT Effective date:20141001 | |
| PG25 | Lapsed in a contracting state [announced via postgrant information from national office to epo] | Ref country code:TR Free format text:LAPSE BECAUSE OF FAILURE TO SUBMIT A TRANSLATION OF THE DESCRIPTION OR TO PAY THE FEE WITHIN THE PRESCRIBED TIME-LIMIT Effective date:20141001 | |
| REG | Reference to a national code | Ref country code:FR Ref legal event code:PLFP Year of fee payment:7 | |
| PGFP | Annual fee paid to national office [announced via postgrant information from national office to epo] | Ref country code:GB Payment date:20180212 Year of fee payment:7 | |
| PGFP | Annual fee paid to national office [announced via postgrant information from national office to epo] | Ref country code:FR Payment date:20180221 Year of fee payment:7 Ref country code:IT Payment date:20180226 Year of fee payment:7 | |
| PG25 | Lapsed in a contracting state [announced via postgrant information from national office to epo] | Ref country code:MK Free format text:LAPSE BECAUSE OF FAILURE TO SUBMIT A TRANSLATION OF THE DESCRIPTION OR TO PAY THE FEE WITHIN THE PRESCRIBED TIME-LIMIT Effective date:20141001 | |
| PGFP | Annual fee paid to national office [announced via postgrant information from national office to epo] | Ref country code:DE Payment date:20180419 Year of fee payment:7 | |
| PG25 | Lapsed in a contracting state [announced via postgrant information from national office to epo] | Ref country code:AL Free format text:LAPSE BECAUSE OF FAILURE TO SUBMIT A TRANSLATION OF THE DESCRIPTION OR TO PAY THE FEE WITHIN THE PRESCRIBED TIME-LIMIT Effective date:20141001 | |
| REG | Reference to a national code | Ref country code:DE Ref legal event code:R119 Ref document number:602012003261 Country of ref document:DE | |
| GBPC | Gb: european patent ceased through non-payment of renewal fee | Effective date:20190221 | |
| PG25 | Lapsed in a contracting state [announced via postgrant information from national office to epo] | Ref country code:DE Free format text:LAPSE BECAUSE OF NON-PAYMENT OF DUE FEES Effective date:20190903 Ref country code:GB Free format text:LAPSE BECAUSE OF NON-PAYMENT OF DUE FEES Effective date:20190221 | |
| PG25 | Lapsed in a contracting state [announced via postgrant information from national office to epo] | Ref country code:FR Free format text:LAPSE BECAUSE OF NON-PAYMENT OF DUE FEES Effective date:20190228 Ref country code:IT Free format text:LAPSE BECAUSE OF NON-PAYMENT OF DUE FEES Effective date:20190221 |