EP2482069B1 - Method for checking whether a test strip is sufficiently filled - Google Patents
Method for checking whether a test strip is sufficiently filledDownload PDFInfo
- Publication number
- EP2482069B1 EP2482069B1EP12164561.8AEP12164561AEP2482069B1EP 2482069 B1EP2482069 B1EP 2482069B1EP 12164561 AEP12164561 AEP 12164561AEP 2482069 B1EP2482069 B1EP 2482069B1
- Authority
- EP
- European Patent Office
- Prior art keywords
- test
- electrode
- current
- voltage
- glucose
- Prior art date
- Legal status (The legal status is an assumption and is not a legal conclusion. Google has not performed a legal analysis and makes no representation as to the accuracy of the status listed.)
- Active
Links
- 238000012360testing methodMethods0.000titleclaimsdescription523
- 238000000034methodMethods0.000titleclaimsdescription73
- WQZGKKKJIJFFOK-GASJEMHNSA-NGlucoseNatural productsOC[C@H]1OC(O)[C@H](O)[C@@H](O)[C@@H]1OWQZGKKKJIJFFOK-GASJEMHNSA-N0.000claimsdescription169
- 239000008103glucoseSubstances0.000claimsdescription169
- 239000003153chemical reaction reagentSubstances0.000claimsdescription51
- 230000000670limiting effectEffects0.000claimsdescription30
- 230000002829reductive effectEffects0.000claimsdescription29
- 239000012491analyteSubstances0.000claimsdescription15
- 230000003647oxidationEffects0.000claimsdescription12
- 238000007254oxidation reactionMethods0.000claimsdescription12
- 230000001052transient effectEffects0.000claimsdescription12
- 108090000790EnzymesProteins0.000claimsdescription9
- 102000004190EnzymesHuman genes0.000claimsdescription9
- 239000011248coating agentSubstances0.000claimsdescription8
- 238000000576coating methodMethods0.000claimsdescription8
- 238000012545processingMethods0.000claimsdescription3
- 230000002277temperature effectEffects0.000claims1
- WQZGKKKJIJFFOK-VFUOTHLCSA-Nbeta-D-glucoseChemical compoundOC[C@H]1O[C@@H](O)[C@H](O)[C@@H](O)[C@@H]1OWQZGKKKJIJFFOK-VFUOTHLCSA-N0.000description165
- 210000004369bloodAnatomy0.000description70
- 239000008280bloodSubstances0.000description69
- 238000012937correctionMethods0.000description50
- 238000005534hematocritMethods0.000description44
- 238000005259measurementMethods0.000description42
- 230000006870functionEffects0.000description34
- 125000006850spacer groupChemical group0.000description34
- 239000007788liquidSubstances0.000description23
- KDLHZDBZIXYQEI-UHFFFAOYSA-NPalladiumChemical compound[Pd]KDLHZDBZIXYQEI-UHFFFAOYSA-N0.000description18
- 238000004422calculation algorithmMethods0.000description13
- 239000000243solutionSubstances0.000description13
- 238000010586diagramMethods0.000description10
- 229910052763palladiumInorganic materials0.000description9
- 238000001514detection methodMethods0.000description8
- 210000004027cellAnatomy0.000description7
- 229940088598enzymeDrugs0.000description7
- YAGKRVSRTSUGEY-UHFFFAOYSA-NferricyanideChemical compound[Fe+3].N#[C-].N#[C-].N#[C-].N#[C-].N#[C-].N#[C-]YAGKRVSRTSUGEY-UHFFFAOYSA-N0.000description7
- 239000012530fluidSubstances0.000description7
- 230000008859changeEffects0.000description6
- 230000007423decreaseEffects0.000description6
- 230000000694effectsEffects0.000description6
- 230000036961partial effectEffects0.000description6
- 2299400061932-mercaptoethanesulfonic acidDrugs0.000description5
- 108010050375Glucose 1-DehydrogenaseProteins0.000description5
- 239000000853adhesiveSubstances0.000description5
- 230000001070adhesive effectEffects0.000description5
- ZNEWHQLOPFWXOF-UHFFFAOYSA-Ncoenzyme MChemical compoundOS(=O)(=O)CCSZNEWHQLOPFWXOF-UHFFFAOYSA-N0.000description5
- 230000008569processEffects0.000description5
- MMXZSJMASHPLLR-UHFFFAOYSA-Npyrroloquinoline quinoneChemical compoundC12=C(C(O)=O)C=C(C(O)=O)N=C2C(=O)C(=O)C2=C1NC(C(=O)O)=C2MMXZSJMASHPLLR-UHFFFAOYSA-N0.000description5
- 238000009472formulationMethods0.000description4
- PCHJSUWPFVWCPO-UHFFFAOYSA-NgoldChemical compound[Au]PCHJSUWPFVWCPO-UHFFFAOYSA-N0.000description4
- 229910052737goldInorganic materials0.000description4
- 239000010931goldSubstances0.000description4
- 238000004519manufacturing processMethods0.000description4
- 239000000203mixtureSubstances0.000description4
- 230000004044responseEffects0.000description4
- 238000004364calculation methodMethods0.000description3
- 238000006243chemical reactionMethods0.000description3
- 230000005284excitationEffects0.000description3
- 239000000463materialSubstances0.000description3
- 230000007246mechanismEffects0.000description3
- 229910052751metalInorganic materials0.000description3
- 239000002184metalSubstances0.000description3
- 210000002381plasmaAnatomy0.000description3
- 230000002028prematureEffects0.000description3
- 229910052770UraniumInorganic materials0.000description2
- 238000004458analytical methodMethods0.000description2
- 238000003556assayMethods0.000description2
- 230000015572biosynthetic processEffects0.000description2
- 239000008364bulk solutionSubstances0.000description2
- HVYWMOMLDIMFJA-DPAQBDIFSA-NcholesterolChemical compoundC1C=C2C[C@@H](O)CC[C@]2(C)[C@@H]2[C@@H]1[C@@H]1CC[C@H]([C@H](C)CCCC(C)C)[C@@]1(C)CC2HVYWMOMLDIMFJA-DPAQBDIFSA-N0.000description2
- 239000004020conductorSubstances0.000description2
- 230000000875corresponding effectEffects0.000description2
- 230000002950deficientEffects0.000description2
- 238000013461designMethods0.000description2
- 206010012601diabetes mellitusDiseases0.000description2
- 238000009792diffusion processMethods0.000description2
- 238000002848electrochemical methodMethods0.000description2
- KTWOOEGAPBSYNW-UHFFFAOYSA-NferroceneChemical compound[Fe+2].C=1C=C[CH-]C=1.C=1C=C[CH-]C=1KTWOOEGAPBSYNW-UHFFFAOYSA-N0.000description2
- VWWQXMAJTJZDQX-UYBVJOGSSA-Nflavin adenine dinucleotideChemical compoundC1=NC2=C(N)N=CN=C2N1[C@@H]([C@H](O)[C@@H]1O)O[C@@H]1CO[P@](O)(=O)O[P@@](O)(=O)OC[C@@H](O)[C@@H](O)[C@@H](O)CN1C2=NC(=O)NC(=O)C2=NC2=C1C=C(C)C(C)=C2VWWQXMAJTJZDQX-UYBVJOGSSA-N0.000description2
- 235000019162flavin adenine dinucleotideNutrition0.000description2
- 239000011714flavin adenine dinucleotideSubstances0.000description2
- 229940093632flavin-adenine dinucleotideDrugs0.000description2
- 229930195733hydrocarbonNatural products0.000description2
- 150000002430hydrocarbonsChemical class0.000description2
- 229910052738indiumInorganic materials0.000description2
- APFVFJFRJDLVQX-UHFFFAOYSA-Nindium atomChemical compound[In]APFVFJFRJDLVQX-UHFFFAOYSA-N0.000description2
- 230000000977initiatory effectEffects0.000description2
- BASFCYQUMIYNBI-UHFFFAOYSA-NplatinumChemical compound[Pt]BASFCYQUMIYNBI-UHFFFAOYSA-N0.000description2
- 229920000139polyethylene terephthalatePolymers0.000description2
- 238000007430reference methodMethods0.000description2
- 238000007650screen-printingMethods0.000description2
- 239000000126substanceSubstances0.000description2
- XOLBLPGZBRYERU-UHFFFAOYSA-Ntin dioxideChemical compoundO=[Sn]=OXOLBLPGZBRYERU-UHFFFAOYSA-N0.000description2
- 229910001887tin oxideInorganic materials0.000description2
- 238000012935AveragingMethods0.000description1
- UXVMQQNJUSDDNG-UHFFFAOYSA-LCalcium chlorideChemical compound[Cl-].[Cl-].[Ca+2]UXVMQQNJUSDDNG-UHFFFAOYSA-L0.000description1
- OKTJSMMVPCPJKN-UHFFFAOYSA-NCarbonChemical compound[C]OKTJSMMVPCPJKN-UHFFFAOYSA-N0.000description1
- 229920001634CopolyesterPolymers0.000description1
- PHOQVHQSTUBQQK-SQOUGZDYSA-ND-glucono-1,5-lactoneChemical compoundOC[C@H]1OC(=O)[C@H](O)[C@@H](O)[C@@H]1OPHOQVHQSTUBQQK-SQOUGZDYSA-N0.000description1
- IAYPIBMASNFSPL-UHFFFAOYSA-NEthylene oxideChemical compoundC1CO1IAYPIBMASNFSPL-UHFFFAOYSA-N0.000description1
- 108010015776Glucose oxidaseProteins0.000description1
- 239000004366Glucose oxidaseSubstances0.000description1
- BAWFJGJZGIEFAR-NNYOXOHSSA-NNAD zwitterionChemical compoundNC(=O)C1=CC=C[N+]([C@H]2[C@@H]([C@H](O)[C@@H](COP([O-])(=O)OP(O)(=O)OC[C@@H]3[C@H]([C@@H](O)[C@@H](O3)N3C4=NC=NC(N)=C4N=C3)O)O2)O)=C1BAWFJGJZGIEFAR-NNYOXOHSSA-N0.000description1
- 229920002023Pluronic® F 87Polymers0.000description1
- 229920002057Pluronic® P 103Polymers0.000description1
- RVGRUAULSDPKGF-UHFFFAOYSA-NPoloxamerChemical compoundC1CO1.CC1CO1RVGRUAULSDPKGF-UHFFFAOYSA-N0.000description1
- 239000004642PolyimideSubstances0.000description1
- 239000004793PolystyreneSubstances0.000description1
- ZLMJMSJWJFRBEC-UHFFFAOYSA-NPotassiumChemical compound[K]ZLMJMSJWJFRBEC-UHFFFAOYSA-N0.000description1
- GOOHAUXETOMSMM-UHFFFAOYSA-NPropylene oxideChemical compoundCC1CO1GOOHAUXETOMSMM-UHFFFAOYSA-N0.000description1
- BQCADISMDOOEFD-UHFFFAOYSA-NSilverChemical compound[Ag]BQCADISMDOOEFD-UHFFFAOYSA-N0.000description1
- 229930006000SucroseNatural products0.000description1
- CZMRCDWAGMRECN-UGDNZRGBSA-NSucroseChemical compoundO[C@H]1[C@H](O)[C@@H](CO)O[C@@]1(CO)O[C@@H]1[C@H](O)[C@@H](O)[C@H](O)[C@@H](CO)O1CZMRCDWAGMRECN-UGDNZRGBSA-N0.000description1
- 229920000535Tan IIPolymers0.000description1
- 230000009471actionEffects0.000description1
- 239000002518antifoaming agentSubstances0.000description1
- 238000013459approachMethods0.000description1
- 230000002238attenuated effectEffects0.000description1
- 230000006399behaviorEffects0.000description1
- 229920001400block copolymerPolymers0.000description1
- 239000001110calcium chlorideSubstances0.000description1
- 229910001628calcium chlorideInorganic materials0.000description1
- 239000003990capacitorSubstances0.000description1
- 229910052799carbonInorganic materials0.000description1
- 239000000919ceramicSubstances0.000description1
- 235000012000cholesterolNutrition0.000description1
- 229940018560citraconateDrugs0.000description1
- HNEGQIOMVPPMNR-IHWYPQMZSA-Ncitraconic acidChemical compoundOC(=O)C(/C)=C\C(O)=OHNEGQIOMVPPMNR-IHWYPQMZSA-N0.000description1
- 150000001875compoundsChemical class0.000description1
- 238000009833condensationMethods0.000description1
- 230000005494condensationEffects0.000description1
- 230000003750conditioning effectEffects0.000description1
- 230000002596correlated effectEffects0.000description1
- 230000001351cycling effectEffects0.000description1
- 230000003247decreasing effectEffects0.000description1
- 230000007547defectEffects0.000description1
- 230000000994depressogenic effectEffects0.000description1
- 238000009795derivationMethods0.000description1
- 238000003745diagnosisMethods0.000description1
- 201000010099diseaseDiseases0.000description1
- 208000037265diseases, disorders, signs and symptomsDiseases0.000description1
- 238000009826distributionMethods0.000description1
- 238000000840electrochemical analysisMethods0.000description1
- 238000000835electrochemical detectionMethods0.000description1
- 238000003487electrochemical reactionMethods0.000description1
- 238000007772electroless platingMethods0.000description1
- 230000007613environmental effectEffects0.000description1
- 238000006911enzymatic reactionMethods0.000description1
- 230000008020evaporationEffects0.000description1
- 238000001704evaporationMethods0.000description1
- 210000003722extracellular fluidAnatomy0.000description1
- 238000013213extrapolationMethods0.000description1
- 230000004907fluxEffects0.000description1
- -1for exampleSubstances0.000description1
- 239000011521glassSubstances0.000description1
- 235000012209glucono delta-lactoneNutrition0.000description1
- 229960003681gluconolactoneDrugs0.000description1
- 229940116332glucose oxidaseDrugs0.000description1
- 235000019420glucose oxidaseNutrition0.000description1
- 238000007641inkjet printingMethods0.000description1
- 239000011810insulating materialSubstances0.000description1
- 229910052741iridiumInorganic materials0.000description1
- GKOZUEZYRPOHIO-UHFFFAOYSA-Niridium atomChemical compound[Ir]GKOZUEZYRPOHIO-UHFFFAOYSA-N0.000description1
- 230000004315low visual acuityEffects0.000description1
- 238000013178mathematical modelMethods0.000description1
- 230000000116mitigating effectEffects0.000description1
- 238000012986modificationMethods0.000description1
- 230000004048modificationEffects0.000description1
- 229940101270nicotinamide adenine dinucleotide (nad)Drugs0.000description1
- 229910052762osmiumInorganic materials0.000description1
- 230000001590oxidative effectEffects0.000description1
- 230000035515penetrationEffects0.000description1
- 230000010363phase shiftEffects0.000description1
- 239000004033plasticSubstances0.000description1
- 229920003023plasticPolymers0.000description1
- 229910052697platinumInorganic materials0.000description1
- 229920001983poloxamerPolymers0.000description1
- 229920000515polycarbonatePolymers0.000description1
- 239000004417polycarbonateSubstances0.000description1
- 229920000728polyesterPolymers0.000description1
- 229920005644polyethylene terephthalate glycol copolymerPolymers0.000description1
- 229920001721polyimidePolymers0.000description1
- 229920002223polystyrenePolymers0.000description1
- 229910052700potassiumInorganic materials0.000description1
- 239000011591potassiumSubstances0.000description1
- 150000004059quinone derivativesChemical class0.000description1
- 230000009467reductionEffects0.000description1
- 239000011347resinSubstances0.000description1
- 229920005989resinPolymers0.000description1
- 229920006395saturated elastomerPolymers0.000description1
- 210000002966serumAnatomy0.000description1
- 229910052710siliconInorganic materials0.000description1
- 239000010703siliconSubstances0.000description1
- 229910052709silverInorganic materials0.000description1
- 239000004332silverSubstances0.000description1
- 238000004088simulationMethods0.000description1
- 239000007787solidSubstances0.000description1
- 239000012453solvateSubstances0.000description1
- 238000012421spikingMethods0.000description1
- 238000004544sputter depositionMethods0.000description1
- 238000003860storageMethods0.000description1
- 239000005720sucroseSubstances0.000description1
- 229920001169thermoplasticPolymers0.000description1
- 239000004416thermosoftening plasticSubstances0.000description1
- 150000003573thiolsChemical class0.000description1
- 230000000007visual effectEffects0.000description1
- 239000000080wetting agentSubstances0.000description1
Images


Classifications
- G—PHYSICS
- G01—MEASURING; TESTING
- G01N—INVESTIGATING OR ANALYSING MATERIALS BY DETERMINING THEIR CHEMICAL OR PHYSICAL PROPERTIES
- G01N27/00—Investigating or analysing materials by the use of electric, electrochemical, or magnetic means
- G01N27/26—Investigating or analysing materials by the use of electric, electrochemical, or magnetic means by investigating electrochemical variables; by using electrolysis or electrophoresis
- G01N27/28—Electrolytic cell components
- G01N27/30—Electrodes, e.g. test electrodes; Half-cells
- G01N27/327—Biochemical electrodes, e.g. electrical or mechanical details for in vitro measurements
- G01N27/3271—Amperometric enzyme electrodes for analytes in body fluids, e.g. glucose in blood
- G01N27/3274—Corrective measures, e.g. error detection, compensation for temperature or hematocrit, calibration
Definitions
- the present disclosurerelates to methods and systems for determining analyte concentration of a sample.
- Analyte detection in physiological fluidsis of ever increasing importance to today's society.
- Analyte detection assaysfind use in a variety of applications, including clinical laboratory testing, home testing, etc., where the results of such testing play a prominent role in diagnosis and management in a variety of disease conditions.
- Analytes of interestinclude glucose for diabetes management, cholesterol, and the like.
- analyte detection protocols and devices for both clinical and home usehave been developed.
- an electrochemical methodOne type of method that is employed for analyte detection is an electrochemical method.
- an aqueous liquid sampleis placed into a sample-receiving chamber in an electrochemical cell that includes two electrodes, e.g., a counter and working electrode.
- the analyteis allowed to react with a redox reagent to form an oxidizable (or reducible) substance in an amount corresponding to the analyte concentration.
- the quantity of the oxidizable (or reducible) substance presentis then estimated electrochemically and related to the amount of analyte present in the initial sample.
- Such systemsare susceptible to various modes of inefficiency and/or error. For example, variations in temperatures can affect the results of the method. This is especially relevant when the method is carried out in an uncontrolled environment, as is often the case in home applications or in third world countries. Errors can also occur when the sample size is insufficient to get an accurate result. Partially filled test strips can potentially give an inaccurate result because the measured test currents are proportional to the area of the working electrode that is wetted with sample. Thus, partially filled test strips can under certain conditions provide a glucose concentration that is negatively biased. A user can have difficulty determining whether an electrode area of a test strip is completely covered by a sample.
- test stripsincluding the ones described herein, have a relatively small volume ( ⁇ one microliter) making it difficult for a user to see and judge whether there is a small area of an electrode that is unwetted. This can especially be a problem for people with diabetes that often have poor visual acuity.
- a method for checking whether a test strip is sufficiently filled using capacitance measurementsis known from US 7 195 704 .
- the methodaccounts for temperature variation and includes applying a sample to a test strip and applying a first test voltage for a first time interval between a first electrode and a second electrode sufficient to oxidize a reduced mediator at the second electrode.
- a second test voltagecan be applied for a second time interval between the first electrode and the second electrode that is also sufficient to oxidize the reduced mediator at the first electrode.
- a first glucose concentrationcan be calculated based on the test current values during the first time interval and the second time interval.
- the test metercan measure a temperature value. Accordingly, a temperature corrected glucose concentration can be calculated based on the first glucose concentration and the temperature value.
- a method to determine whether a test strip is sufficiently filled with a sampleincludes applying a first test voltage between a first electrode and a second electrode of a test strip.
- the first test voltagehas both an AC voltage component and a DC voltage component.
- the AC voltage componentis applied at a predetermined amount of time after the application of the first test voltage.
- the DC voltage componenthas a magnitude sufficient to cause a limiting test current at the second electrode. Accordingly, a portion of the resulting test current from the AC voltage component is processed into a capacitance value.
- a glucose test systembased on a thin-layer cell design with opposing electrodes and tri-pulse electrochemical detection that is fast (e.g., about 5 second analysis time), requires a small sample (e.g., about 0.4 ⁇ L), and can provide improved reliability and accuracy of blood glucose measurements.
- glucose in the samplecan be oxidized to gluconolactone using glucose dehydrogenase and an electrochemically active mediator can be used to shuttle electrons from the enzyme to a palladium working electrode.
- a potentiostatcan be utilized to apply a tri-pulse potential waveform to the working and counter electrodes, resulting in test current transients used to calculate the glucose concentration. Further, additional information gained from the test current transients may be used to discriminate between sample matrices and correct for variability in blood samples due to hematocrit, temperature variation, electrochemically active components, and identify possible system errors.
- an electrochemical cellcan be in the form of a test strip.
- the test stripmay include two opposing electrodes separated by a thin spacer for defining a sample-receiving chamber or zone in which a reagent layer is located.
- test stripsincluding, for example, test strips with co-planar electrodes may also be used with the methods described herein.
- FIGS. 1A to 4Bshow various views of an exemplary test strip 62 suitable for use with the methods and systems described herein.
- a test strip 62is provided which includes an elongate body extending from a distal end 80 to a proximal end 82, and having lateral edges 56, 58, as illustrated in FIG. 1A .
- the test strip 62also includes a first electrode layer 66, a second electrode layer 64, and a spacer 60 sandwiched in between the two electrode layers 64 and 66.
- the first electrode layer 66can include a first electrode 166, a first connection track 76, and a first contact pad 67, where the first connection track 76 electrically connects the first electrode 166 to the first contact pad 67, as shown in FIGS. 1B and 4B .
- the first electrode 166is a portion of the first electrode layer 66 that is immediately underneath the reagent layer 72, as indicated by FIGS. 1B and 4B .
- the second electrode layer 64can include a second electrode 164, a second connection track 78, and a second contact pad 63, where the second connection track 78 electrically connects the second electrode 164 with the second contact pad 63, as shown in FIGS. 1B , 2, and 4B .
- the second electrode 164is a portion of the second electrode layer 64 that is above the reagent layer 72, as indicated by FIG. 4B .
- the sample-receiving chamber 61is defined by the first electrode 166, the second electrode 164, and the spacer 60 near the distal end 80 of the test strip 62, as shown in FIG. 1B and 4B .
- the first electrode 166 and the second electrode 164can define the bottom and the top of sample-receiving chamber 61, respectively, as illustrated in FIG. 4B .
- a cutout area 68 of the spacer 60can define the sidewalls of the sample-receiving chamber 61, as illustrated in FIG. 4B .
- the sample-receiving chamber 61can include ports 70 that provide a sample inlet and/or a vent, as shown in FIGS. 1A to 1C .
- one of the portscan allow a fluid sample to ingress and the other port can allow air to egress.
- the sample-receiving chamber 61can have a small volume.
- the chamber 61can have a volume in the range of from about 0.1 microliters to about 5 microliters, about 0.2 microliters to about 3 microliters, or, preferably, about 0.3 microliters to about 1 microliter.
- the cutout 68can have an area ranging from about 0.01 cm 2 to about 0.2 cm 2 , about 0.02 cm 2 to about 0.15 cm 2 , or, preferably, about 0.03 cm 2 to about 0.08 cm 2 .
- first electrode 166 and second electrode 164can be spaced apart in the range of about 1 micron to about 500 microns, preferably between about 10 microns and about 400 microns, and more preferably between about 40 microns and about 200 microns.
- the relatively close spacing of the electrodescan also allow redox cycling to occur, where oxidized mediator generated at first electrode 166, can diffuse to second electrode 164 to become reduced, and subsequently diffuse back to first electrode 166 to become oxidized again.
- the first electrode layer 66 and the second electrode layer 64can be a conductive material formed from materials such as gold, palladium, carbon, silver, platinum, tin oxide, iridium, indium, or combinations thereof (e.g., indium doped tin oxide).
- the electrodescan be formed by disposing a conductive material onto an insulating sheet (not shown) by a sputtering, electroless plating, or a screenprinting process.
- the first electrode layer 66 and the second electrode layer 64can be made from sputtered palladium and sputtered gold, respectively.
- Suitable materials that can be employed as spacer 60include a variety of insulating materials, such as, for example, plastics (e.g., PET, PETG, polyimide, polycarbonate, polystyrene), silicon, ceramic, glass, adhesives, and combinations thereof.
- the spacer 60may be in the form of a double sided adhesive coated on opposing sides of a polyester sheet where the adhesive may be pressure sensitive or heat activated.
- plasticse.g., PET, PETG, polyimide, polycarbonate, polystyrene
- the spacer 60may be in the form of a double sided adhesive coated on opposing sides of a polyester sheet where the adhesive may be pressure sensitive or heat activated.
- the first electrode layer 66, the second electrode layer 64, and/or the spacer 60are within the spirit and scope of the present disclosure.
- reagent layer 72can be disposed within the sample-receiving chamber 61 using a process such as slot coating, dispensing from the end of a tube, ink jetting, and screen printing.
- the reagent layer 72can include at least a mediator and an enzyme and is deposited onto first electrode 166.
- mediatorsinclude ferricyanide, ferrocene, ferrocene derivatives, osmium bipyridyl complexes, and quinone derivatives.
- suitable enzymesinclude glucose oxidase, glucose dehydrogenase (GDH) using a pyrroloquinoline quinone (PQQ) co-factor, GDH using a nicotinamide adenine dinucleotide (NAD) co-factor, and GDH using a flavin adenine dinucleotide (FAD) co-factor [E.C.1.1.99.10].
- PQQpyrroloquinoline quinone
- NADnicotinamide adenine dinucleotide
- FADflavin adenine dinucleotide
- the reagent layer 72can be prepared from a formulation that contains 33 mM potassium citraconate, pH 6.8, 0.033% Pluronic P103, 0.017% Pluronic F87, 0.85 mM CaCl 2 , 30 mM sucrose, 286 ⁇ M PQQ, 15 mg/mL apo-GDH, and 0.6 M ferricyanide.
- the PQQcan be left out of the formulation and the apo-GDH can be replaced with FAD-GDH.
- Pluronicsare a block copolymers based on ethylene oxide and propylene oxide, which can function as antifoaming agents and/or wetting agents.
- the formulationcan be applied at 570 ⁇ L/min using a 13 gauge needle poised about 150 ⁇ m above a palladium web moving at about 10 m/min.
- concentration of the solids in the reagentcan be increased by 50% and the flow rate can be reduced to 380 ⁇ L/min in order to maintain a constant reagent coating density.
- the enzyme formulationBefore coating the palladium web with the enzyme formulation, it can be coated with 2-mercaptoethane sulfonic acid (MESA).
- MESA2-mercaptoethane sulfonic acid
- a 95 ⁇ m thick spacer with a 1.2 mm wide channel cut in itcan be laminated to the reagent layer and the palladium web at 70°C.
- a MESA-coated gold webcan be laminated to the other side of the spacer.
- the spacercan be made from PET coated on both sides with a thermoplastic such as Vitel, which is a linear saturated copolyester resin having a relatively high molecular weight.
- Vitela linear saturated copolyester resin having a relatively high molecular weight.
- the resulting laminatecan be cut such that the fill path of the sample-receiving chamber is about 3.5 mm long, thus giving a total volume of about 0.4 ⁇ L.
- the reagent layer 72may have an area larger than the area of the first electrodes 166. As a result a portion of the spacer 60 may overlap and touch the reagent layer 72.
- the spacer 60may be configured to form a liquid impermeable seal to the first electrode 166 even though a portion of the reagent layer 72 is between the spacer 60 and the first electrode 166.
- the spacer 60may intermingle or partially dissolve a portion of the reagent layer 72 to form a liquid impermeable bond to the first electrode 166 sufficient to define the electrode area for at least the total test time.
- the spacer 60may not be able to form a liquid impermeable seal and, as a result, the liquid may seep between the spacer 60 and the first electrode 166. Such a leakage event may cause an inaccurate glucose measurement to occur.
- Either the first electrode 166 or the second electrode 164can perform the function of a working electrode depending on the magnitude and/or polarity of the applied test voltage.
- the working electrodemay measure a limiting test current that is proportional to the reduced mediator concentration. For example, if the current limiting species is a reduced mediator (e.g., ferrocyanide), then it can be oxidized at the first electrode 166 as long as the test voltage is sufficiently greater than the redox mediator potential with respect to the second electrode 164. In such a situation, the first electrode 166 performs the function of the working electrode and the second electrode 164 performs the function of a counter/reference electrode. Note that one skilled in the art may refer to a counter/reference electrode simply as a reference electrode or a counter electrode.
- a limiting oxidationoccurs when all reduced mediator has been depleted at the working electrode surface such that the measured oxidation current is proportional to the flux of reduced mediator diffusing from the bulk solution towards the working electrode surface.
- the term bulk solutionrefers to a portion of the solution sufficiently far away from the working electrode where the reduced mediator is not located within a depletion zone.
- the reduced mediatorcan be oxidized at the second electrode 164 as a limiting current.
- the second electrode 164performs the function of the working electrode and the first electrode 166 performs the function of the counter/reference electrode.
- performing an analysiscan include introducing a quantity of a fluid sample into a sample-receiving chamber 61 via a port 70.
- the port 70 and/or the sample-receiving chamber 61can be configured such that capillary action causes the fluid sample to fill the sample-receiving chamber 61.
- the first electrode 166 and/or second electrode 164may be coated with a hydrophilic reagent to promote the capillarity of the sample-receiving chamber 61.
- thiol derivatized reagents having a hydrophilic moietysuch as 2-mercaptoethane sulfonic acid may be coated onto the first electrode and/or the second electrode.
- FIG. 5provides a simplified schematic showing a test meter 100 interfacing with a first contact pad 67a, 67b and a second contact pad 63.
- the second contact pad 63can be used to establish an electrical connection to the test meter through a U-shaped notch 65, as illustrated in FIG. 2 .
- the test meter 100may include a second electrode connector 101, and a first electrode connectors (102a, 102b), a test voltage unit 106, a current measurement unit 107, a processor 212, a memory unit 210, and a visual display 202, as shown in FIG. 5 .
- the first contact pad 67can include two prongs denoted as 67a and 67b.
- the first electrode connectors 102a and 102bseparately connect to prongs 67a and 67b, respectively.
- the second electrode connector 101can connect to second contact pad 63.
- the test meter 100can measure the resistance or electrical continuity between the prongs 67a and 67b to determine whether the test strip 62 is electrically connected to the test meter 100.
- the test meter 100can use a variety of sensors and circuits to determine when the test strip 62 is properly positioned with respect to the test meter 100.
- the test meter 100can apply a test voltage and/or a current between the first contact pad 67 and the second contact pad 63. Once the test meter 100 recognizes that the strip 62 has been inserted, the test meter 100 turns on and initiates a fluid detection mode. In one embodiment, the fluid detection mode causes test meter 100 to apply a constant current of about 1 microampere between the first electrode 166 and the second electrode 164. Because the test strip 62 is initially dry, the test meter 100 measures a relatively large voltage, which can be limited by the analog-to-digital converter (A/D) within test meter 100. When the fluid sample bridges the gap between the first electrode 166 and the second electrode 164 during the dosing process, the test meter 100 will measure a decrease in measured voltage that is below a predetermined threshold causing test meter 100 to automatically initiate the glucose test.
- A/Danalog-to-digital converter
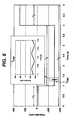
- the test meter 100can perform a glucose test by applying a plurality of test voltages for prescribed intervals, as shown in FIG. 6 .
- the plurality of test voltagesmay include a first test voltage V 1 for a first time interval t 1 , a second test voltage V 2 for a second time interval t 2 , and a third test voltage V 3 for a third time interval t 3 .
- a glucose test time interval t Grepresents an amount of time to perform the glucose test (but not necessarily all the calculations associated with the glucose test).
- Glucose test time interval t Gcan range from about 1 second to about 5 seconds. Further, as illustrated in FIG.
- the second test voltage V 2can include a constant (DC) test voltage component and a superimposed alternating (AC), or oscillating, test voltage component.
- the superimposed alternating test voltage componentcan be applied for a time interval indicated by t cap .
- the inset of FIG. 6magnifies the high frequency AC component.
- the plurality of test current values measured during any of the time intervalsmay be performed at a frequency ranging from about 1 measurement per nanosecond to about one measurement per 100 milliseconds. While an embodiment using three test voltages in a serial manner is described, one skilled in the art will appreciate that the glucose test can include different numbers of open-circuit and test voltages. For example, as an alternative embodiment, the glucose test could include an open-circuit for a first time interval, a second test voltage for a second time interval, and a third test voltage for a third time interval.
- names "first,” "second,” and “third”are chosen for convenience and do not necessarily reflect the order in which the test voltages are applied. For instance, an embodiment can have a potential waveform where the third test voltage can be applied before the application of the first and second test voltage.
- the test meter 100may apply a first test voltage V 1 (e.g., -20 mV in FIG. 6 ) for a first time interval t 1 (e.g., 1 second in FIG. 6 ).
- the first time interval t 1can range from about 0.1 seconds to about 3 seconds and preferably range from about 0.2 seconds to about 2 seconds, and most preferably range from about 0.3 seconds to about 1 seconds.
- the first time interval t 1may be sufficiently long so that the sample-receiving chamber 61 can fully fill with sample and also so that the reagent layer 72 can at least partially dissolve or solvate.
- the first test voltage V 1may be a value relatively close to the redox potential of the mediator so that a relatively small amount of a reduction or oxidation current is measured.
- FIG. 7shows that a relatively small amount of current is observed during the first time interval t 1 compared to the second and third time intervals t 2 and t 3 .
- the first test voltage V 1can range from about -100 mV to about -1 mV, preferably range from about -50 mV to about -5 mV, and most preferably range from about -30 mV to about -10 mV.
- the test meter 100After applying the first test voltage V 1 , the test meter 100 applies a second test voltage V 2 between first electrode 166 and second electrode 164 (e.g., -0.3 Volts in FIG. 6 ), for a second time interval t 2 (e.g., about 3 seconds in FIG. 6 ).
- the second test voltage V 2may be a value sufficiently negative of the mediator redox potential so that a limiting oxidation current is measured at the second electrode 164.
- the second test voltage V 2can range from about -600 mV to about zero mV, preferably range from about -600 mV to about -100 mV, and more preferably be about -300 mV.
- the second time interval t 2should be sufficiently long so that the rate of generation of reduced mediator (e.g., ferrocyanide) can be monitored based on the magnitude of a limiting oxidation current.
- Reduced mediatoris generated by enzymatic reactions with the reagent layer 72.
- a limiting amount of reduced mediatoris oxidized at second electrode 164 and a non-limiting amount of oxidized mediator is reduced at first electrode 166 to form a concentration gradient between first electrode 166 and second electrode 164.
- the second time interval t 2should also be sufficiently long so that a sufficient amount of ferricyanide can be generated at the second electrode 164.
- a sufficient amount of ferricyanideis required at the second electrode 164 so that a limiting current can be measured for oxidizing ferrocyanide at the first electrode 166 during the third test voltage V 3 .
- the second time interval t 2may be less than about 60 seconds, and preferably can range from about 1 second to about 10 seconds, and more preferably range from about 2 seconds to about 5 seconds.
- the time interval indicated as t cap in FIG. 6may also last over a range of times, but in one exemplary embodiment it has a duration of about 20 milliseconds.
- the superimposed alternating test voltage componentis applied after about 0.3 seconds to about 0.4 seconds after the application of the second test voltage V 2 , and induces a sine wave having a frequency of about 109 Hz with an amplitude of about +/-50 mV.
- FIG. 7shows a relatively small peak i pb at the beginning of the second time interval t 2 followed by a gradual increase of an absolute value of an oxidation current during the second time interval t 2 .
- the small peak i pboccurs due to an initial depletion of reduced mediator at about 1 second.
- the gradual absolute increase in oxidation current after the small peak i pbis caused by the generation of ferrocyanide by reagent layer 72, which then diffuses to second electrode 164.
- the test meter 100After applying the second test voltage V 2 , the test meter 100 applies a third test voltage V 3 between the first electrode 166 and the second electrode 164 (e.g., about +0.3 Volts in FIG. 6 ) for a third time interval t 3 (e.g., 1 second in FIG. 6 ).
- the third test voltage V 3may be a value sufficiently positive of the mediator redox potential so that a limiting oxidation current is measured at the first electrode 166.
- the third test voltage V 3can range from about zero mV to about 600 mV, preferably range from about 100 mV to about 600 mV, and more preferably be about 300 mV.
- the third time interval t 3may be sufficiently long to monitor the diffusion of reduced mediator (e.g., ferrocyanide) near the first electrode 166 based on the magnitude of the oxidation current.
- reduced mediatore.g., ferrocyanide
- the third time interval t 3can range from about 0.1 seconds to about 5 seconds and preferably range from about 0.3 seconds to about 3 seconds, and more preferably range from about 0.5 seconds to about 2 seconds.
- FIG. 7shows a relatively large peak i pc at the beginning of the third time interval t 3 followed by a decrease to a steady-state current i ss value.
- the second test voltage V 2can have a first polarity and the third test voltage V 3 may have a second polarity that is opposite to the first polarity.
- the second test voltage V 2can be sufficiently negative of the mediator redox potential and the third test voltage V 3 can be sufficiently positive of the mediator redox potential.
- the third test voltage V 3may be applied immediately after the second test voltage V 2 .
- the magnitude and polarity of the second and third test voltagescan be chosen depending on the manner in which analyte concentration is determined.
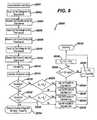
- FIG. 8illustrates one method of determining a glucose concentration by way of a flow diagram.
- a usercan insert a test strip into a test meter and then apply a sample to the test strip.
- the test meterdetects the presence of the sample and applies a test voltage, as shown in a step 1802.
- the test metermeasures a test current, as shown in a step 1804.
- a microprocessor of the test metercan then process the resulting test current values so that an accurate glucose measurement can be determined and to ensure that there are no system errors.
- step 1806Another step in the method, as shown in step 1806, can be performing a control solution (CS)/blood discrimination test.
- CScontrol solution
- step 1808if the CS/blood discrimination test determines that the sample is blood, then method 1800 moves to a series of steps that include: the application of a blood glucose algorithm 1810, hematocrit correction 1812, blood temperature correction 1814, and error checks 1000; and if the CS/blood discrimination test determines that the sample is CS (i.e., not blood), then method 1800 moves to a series of steps that include: the application of a CS glucose algorithm 1824, CS temperature correction 1826, and error checks 1000.
- step 1818can be performed to determine if there are any errors. If there are no errors, then the test meter outputs a glucose concentration, as shown in a step 1820, but if there are errors, then the test outputs an error message, as shown in a step 1822.
- the CS/blood discrimination test 1806can include a first reference value and a second reference value.
- the first reference valuecan be based on current values during the first time interval t 1 and the second reference value can be based on current values during both the second time interval t 2 and the third time interval t 3 .
- the first reference valuecan be obtained by performing a summation of the current values obtained during the first time current transient when using the test voltage waveform of FIG. 6 .
- a discrimination criterioncan be used to determine if the sample is either control solution or blood based on the first reference value of Eq. 1 and the second reference of Eq. 2. For example, the first reference value of Eq. 1 can be compared to a pre-determined threshold and the second reference value of Eq. 2 can be compared to a pre-determined threshold equation.
- the pre-determined thresholdmay be about 12 microamperes.
- the pre-determined threshold equationcan be based on a function using the first reference value of Eq. 1. More specifically, as illustrated by Eq. 3, the pre-determined threshold equation can be: Z 1 * i sum - 12 i sum where Z 1 can be a constant such as, for example, about 0.2.
- the CS/Blood discrimination test 1806can identify a sample as blood if i sum > 12 and if R 7 ⁇ Z 1 * i sum - 12 i sum else the sample is a control solution.
- the first test current value i 1 and the second test current value i 2can each be defined by an average or summation of one or more predetermined test current values that occur during the third time interval t 3 .
- the third test current value i 3can be defined by an average or summation of one or more predetermined test current values that occur during the second time interval t 2 .
- Equation 4can be modified to provide an even more accurate glucose concentration.
- i ssmay be estimated by multiplying the test current value at 5 seconds with a constant K 8 (e.g., 0.678).
- K 8e.g. 0.78
- K 80.678
- K 80.678
- K 80.678
- i pcmay be the test current value at 4.1 seconds
- i pbmay be the test current value at 1.1 seconds, based on the test voltage and test current waveforms in FIGS. 6 and 7 .
- Equation 5can be combined with Equation 4 to yield an equation for determining a more accurate glucose concentration that can compensate for the presence of endogenous and/or exogenous interferents in a blood sample, as shown in Equation 7:
- G 1i 2 i 3 p ⁇ a ⁇ i 2 ⁇ i pc - 2 ⁇ i pb + i ss i pc + i ss - z
- the first glucose concentration G 1is the output of the blood glucose algorithm and the terms a, p , and z are constants that can be derived empirically.
- the CS glucose algorithm of step 1824can be performed on the test current values.
- a first glucose concentration G 1 for CScan be calculated using Equation 7 above, although the values for a, p, and z for CS can be different than those for blood.
- hematocrit correction 1812can be applied by modifying G 1 to provide a second glucose concentration G 2 that is accurate even if the sample has an extreme hematocrit level (e.g., about 20% or about 60%).
- FIG. 9is a flow diagram depicting a method 2000 for calculating an accurate glucose concentration that accounts for blood samples having an extreme hematocrit level.
- a usercan initiate a test by applying a sample to the test strip, as shown in a step 2001.
- a first test voltage V 1can be applied for a first time interval t 1 , as shown in a step 2002.
- the resulting test currentis then measured for the first time interval t 1 , as shown in a step 2004.
- the second test voltage V 2is applied for a second time interval t 2 , as shown in a step 2006.
- the resulting test currentis then measured for the second time interval t 2 , as shown in a step 2008.
- the third test voltage V 3is applied for a third time interval t 3 , as shown in a step 2010.
- the resulting test currentis then measured for the third time interval t 3 , as shown in a step 2012.
- a first glucose concentration G 1can be calculated, as shown in a step 2014.
- the first glucose concentration G 1can be calculated using Equations 4 or 7.
- a hematocrit level Hcan be calculated, as shown in a step 2016.
- the hematocrit levelmay be estimated using test current values acquired during the glucose test time interval t G .
- the hematocrit level Hmay be estimated using test current values acquired during the second time interval t 2 and the third time interval t 3 .
- the hematocrit level Hcan be estimated using a hematocrit equation based upon the first glucose concentration G 1 and i 2 .
- K 5 , K 6 , and K 7may be about -76, 56, and 250, respectively.
- K 5 , K 6 , and K 7may be about -73.5, 58.8, and 213, respectively.
- FIG. 10shows that the estimated hematocrit levels using Equation 8 has an approximately linear correlation with actual hematocrit levels measured with a reference method.
- the hematocrit level His compared to a lower predetermined hematocrit level H L , as shown in a step 2018.
- the lower predetermined hematocrit level H Lmay be about 30%. If the hematocrit level H is less than lower predetermined hematocrit level H L , then the first glucose concentration G 1 is compared to an upper predetermined glucose concentration G U , as shown in a step 2020.
- the upper predetermined glucose concentration G Umay be about 300 mg/dL. If the hematocrit level H is not less than lower predetermined hematocrit level H L , then the hematocrit level H is compared to an upper predetermined hematocrit level H U , as shown in a step 2022.
- the upper predetermined hematocrit level H Umay be about 50%. If the hematocrit level H is greater than H U , then the first glucose concentration G 1 is compared to a lower predetermined glucose concentration G L , as shown in a step 2028.
- the lower predetermined glucose concentration G Lmay be about 100 mg/dL. Steps 2018 and 2022 indicate that method 2000 will output first glucose concentration G 1 , as shown in a step 2034, if the hematocrit level H is not less than H L and not greater than H U .
- a first functioncan be used to calculate a correction value Corr , as shown in a step 2024, if the first glucose concentration G 1 is less than the upper predetermined glucose concentration G U .
- the second functioncan be used to calculate the correction value Corr, as shown in a step 2026.
- K 2 and G maxmay be about -0.004 and about 600 mg/dL, respectively.
- the correction value Corr for Equations 9 and 10may be restricted to a range of about -5 to about zero. Thus, if Corr is less than -5, then Corr is set to -5 and if Corr is greater than zero, then Corr is set to zero.
- a third functioncan be used to calculate a correction value Corr, as shown in a step 2030, if the first glucose concentration G 1 is less than lower predetermined glucose concentration G L .
- the correction value Corr for Equation 12may be restricted to a range of about zero to about six. Thus, if Corr is less than zero, then Corr is set to zero and if Corr is greater than six, then Corr is set to six.
- the first glucose concentrationis compared to 100 mg/dL in a step 2036. If the first glucose concentration is less than 100 mg/dL, then the second glucose concentration G 2 is calculated using a first correction equation, as shown in a step 2038.
- the 100 mg/dLrepresents a glucose threshold and should not be construed as a limiting number. In one embodiment, the glucose threshold may range from about 70 mg/dL to about 100 mg/dL.
- the second glucose concentration G 2is calculated using a second correction equation, as shown in a step 2040.
- the second glucose concentration G 2is calculated in either steps 2038 or 2040, it is outputted as a glucose reading in a step 2042.
- the second glucose concentration G 2can be calculated using Equation 14, as shown in step 2040.
- the second glucose concentration G 2equals the first glucose concentration G 1 , which can then be outputted as a glucose reading in step 2042.
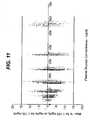
- FIG. 11shows a bias plot for a plurality of test strips that were tested with blood samples having a wide range of hematocrit levels and glucose concentrations. More specifically, FIG. 11 shows the effect of whole blood samples having a wide range of hematocrit on the accuracy and precision of the new test system.
- the bias of the sensor response with respect to the YSI 2700(Yellow Springs Instruments, Yellow Springs, Ohio) is plotted against the plasma glucose concentration. The data were obtained with 3 batches of sensors and 4 blood donors.
- the hematocritwas adjusted to 20% (squares), 37-45% (circles) or 60% (triangles) prior to spiking the samples with glucose.
- blood temperature correction 1814can be applied to the test current values to provide a glucose concentration with an improved accuracy because of a reduced effect from temperature.
- a method for calculating a temperature corrected glucose concentrationcan include measuring a temperature value and calculating a second correction value Corr 2 .
- the second correction value Corr 2can be based on a temperature value and either first glucose concentration G 1 or second glucose concentration G 2 glucose concentration, both of which as described previously do not include a correction for temperature. Accordingly, the second correction value Corr 2 can then be used to correct the glucose concentration G 1 or G 2 for temperature.
- FIG. 12is a flow diagram depicting an embodiment of the method 1814 of applying a blood temperature correction.
- a glucose concentration uncorrected for temperaturecan be obtained such as first glucose concentration G 1 from step 1810 or a second glucose concentration G 2 from step 1812. While a blood temperature correction can be applied to either G 1 or G 2 , for simplicity the blood temperature correction will be described using G 2 .
- a temperature valuecan be measured.
- the temperaturecan be measured using a thermistor or other temperature reading device that is incorporated into a test meter, or by way of any number of other mechanisms or means.
- a determinationcan be performed to determine whether the temperature value T is greater than a first temperature threshold T 1 .
- the temperature threshold T 1is about 15 °C. If the temperature value T is greater than 15 °C, then a first temperature function can be applied to determine the second correction value Corr 2 , as shown in a step 1914. If the temperature value T is not greater than 15 °C, then a second temperature function can be applied to determine the second correction value Corr 2 , as shown in a step 1916.
- K 9is a ninth constant (e.g., 0.57 for GDH-PQQ and 0.89 for FAD-GDH)
- Tis a temperature value
- T RTis a room temperature value (e.g., 22°C)
- K 10is a tenth constant (e.g., 0.00023 for GDH-PQQ and 0.00077 for FAD-GDH)
- G 2is the second glucose concentration.
- the first temperature functioncan be configured to have essentially no correction at room temperature such that variation can be reduced under routine ambient conditions.
- K 11is an eleventh constant (e.g., 0.57 for GDH-PQQ and 0.89 for FAD-GDH)
- Tis a temperature value
- T RTis a room temperature value
- K 12is a twelfth constant (e.g., 0.00023 for GDH-PQQ and 0.00077 for FAD-GDH)
- G 1is a first glucose concentration
- K 13is a thirteenth constant (e.g., 0.63 for GDH-PQQ and 1.65 for FAD-GDH)
- Corr 2can be limited to have a range of - 10 to +10 by using a step 1918 and/or a step 1922.
- a determinationcan be performed to determine whether Corr 2 is greater than 10. If Corr 2 is greater than 10, the Corr 2 is set to 10, as shown in a step 1920. If Corr 2 is not greater than 10, then a determination is performed to determine whether Corr 2 is less than -10, as shown in a step 1922.
- Corr 2can be set to -10 if Corr 2 is less than -10, as shown in a step 1924. If Corr 2 is a value already in between -10 and +10, then there generally is no need for truncation.
- a temperature corrected glucose concentrationcan be calculated using either a step 1928 or a step 1930.
- the third glucose concentrationcan be outputted, as shown in a step 1932.
- the method 1814 for blood temperature correctionwas verified using blood in a glove box over a temperature range of about 5 °C to 45 °C.
- the blood sampleshad a hematocrit range of about 20-50 % hematocrit and a glucose range of about 20-600 mg/dL equivalent plasma glucose concentration.
- the glove boxwas an enclosed chamber that could hold a pre-determined constant temperature.
- the glove portion of the glove boxallowed a tester outside of the glove box to perform a glucose test inside the glove box.
- the testerinserted test strips into a test meter and dose sampled in an environment having both a controlled temperature and relative humidity (RH).
- the RHwas maintained at about 60% in order to keep evaporation of the sample droplets at a relatively low level during the test.
- FIG. 13shows that temperature has a substantial bias on the blood results when there is no temperature compensation function in the test meters because only about 83.4% of biases were within 15% or 15 mg/dL of the reference glucose value.
- FIG. 14there is much less bias on the blood results when there is a temperature compensation in the test meters because far less biases percentage-wise were located outside of the 15% or 15 mg/dL range of the reference glucose value when compared to the results of FIG. 13 .
- FIG. 15is a flow diagram depicting an embodiment of the method 1826 of applying a CS temperature correction.
- the CS temperature correctionis similar to the blood temperature correction except that the temperature function for calculating Corr 2 is different.
- a glucose concentration uncorrected for temperaturecan be obtained such as first glucose concentration G 1 from step 1824.
- a temperature valuecan be measured, as shown in a step 1910.
- a third temperature functioncan be applied to determine the second correction value Corr 2 for CS, as shown in a step 1934.
- K 15is a fifteenth constant (e.g., 0.27 for GDH-PQQ and 0.275 for FAD-GDH)
- Tis a temperature value
- T RTis a room temperature value (e.g., 22 °C)
- K 16is a sixteenth constant (e.g., 0.0011 for GDH-PQQ and
- Corr 2can be limited to have a range of -10 to +10 by using a step 1918 and/or a step 1922, as shown in FIG. 20 .
- step 1918a determination can be performed to determine whether Corr 2 is greater than 10. If Corr 2 is greater than 10, the Corr 2 can be set to 10, as shown in a step 1920. If Corr 2 is not greater than 10, then a determination can be performed to determine whether Corr 2 is less than -10, as shown in a step 1922. Corr 2 can be set to -10 if Corr 2 is less than -10, as shown in a step 1924.
- a temperature corrected glucose concentration for CScan be calculated using either a step 1928 or a step 1930.
- a determinationcan be performed to determine whether the glucose concentration uncorrected for temperature (e.g., G 1 ) is less than 100 mg/dL. If G 1 is less than 100 mg/dL, then third glucose concentration G 3 can be calculated by adding G 1 + Corr 2 , as shown in step 1928. If G 1 is not less than 100 mg/dL, then third glucose concentration G 3 can be calculated by dividing Corr 2 by one hundred, adding one, and then multiplying by the second glucose concentration to give a temperature corrected concentration, as shown in step 1930. Once a third glucose concentration for CS is determined that is corrected for the effects of temperature, the third glucose concentration can be outputted, as shown in a step 1932, to either the next step in method 1800 or to error checks 1000.
- the method 1826 for CS temperature correctionwas verified in a glove box over a temperature range of about 5 °C to 45 °C.
- the relative humidity (RH)was maintained at about 60%.
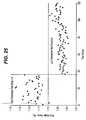
- FIG. 16shows that temperature has a substantial bias on the CS results when there is no temperature compensation function in the meters because a fair amount of the results fall outside of 15% or 15 mg/dL of the reference glucose value.
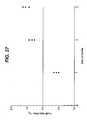
- FIG. 17there is much less bias on the blood results when there is a temperature compensation in the test meters because none of the results were located outside of the 15% or 15 mg/dL range of the glucose value.
- Various embodiments of a method for identifying various system errorswhich may include user errors when performing a test, test meter errors, and defective test strips, are also provided.
- the systemcan be configured to identify a test utilizing a partial fill or double-fill of a sample chamber. Also, the system can be configured to identify those situation where the sample may be leaking from the sample chamber thereby compromising the integrity of the testing and/or those situations where some portion of system (e.g., the test strip) is damaged.
- FIG. 18is a flow diagram depicting an exemplary embodiment of a method 1000 of identifying system errors in performing an analyte measurement.
- a usercan initiate a test by applying a sample to a test strip, as shown in a step 1002.
- the test meterapplies a first test voltage V 1 for a first time interval t 1 , as shown in a step 1004a.
- a resulting test currentis then measured for the first time interval t 1 , as shown in a step 1005a.
- the test metercan perform a double dose check 1006a and a maximum current check 1012a.
- test meterwill display an error message, as shown in a step 1028. If the double dose check 1006a and maximum current check 1012a both pass, then the test meter can apply a second test voltage V 2 for a second time interval t 2 , as shown in a step 1004b.
- a resulting test currentis measured for the second time interval t 2 , as shown in a step 1005b.
- the test metercan perform a sufficient volume check 1030, a double dose check 1006b, a maximum current check 1012b, and a minimum current check 1014b. If one of the checks 1030, 1006b, 1012b, or 1014b fails, then the test meter will display an error message, as shown in step 1028. If all of the checks 1030, 1006b, 1012b, and 1014b pass, then the test meter will apply a third test voltage V 3 , as shown in a step 1004c.
- a resulting test currentis measured for the third time interval t 3 , as shown in a step 1005c.
- the test metercan perform a double dose check 1006c, maximum current check 1012c, a minimum current check 1014c, a high resistance check 1022c, and a sample leakage check 1024c. If all of the checks 1006c, 1012c, 1014c, 1022c, and 1024c pass, then the test meter will display a glucose concentration, as shown in a step 1026. If one of the checks 1006c, 1012c, 1014c, 1022c, and 1024c fails, then the test meter will display an error message, as shown in step 1028. The following will describe the system checks and how errors can be identified using such system checks.
- a capacitance measurementis used.
- the capacitance measurementcan measure essentially an ionic double-layer capacitance resulting from the formation of ionic layers at the electrode-liquid interface.
- a magnitude of the capacitancecan be proportional to the area of an electrode coated with sample.
- test stripscan be found in U.S. Patents Nos. 7,195,704 and 7,199,594 .
- a test voltage having a constant component and an oscillating componentis applied to the test strip.
- the resulting test currentcan be mathematically processed, as described in further detail below, to determine a capacitance value.
- a limiting test currentoccurs at a working electrode having a well-defined area (i.e., an area not changing during the capacitance measurement)
- the most accurate and precise capacitance measurements in an electrochemical test stripcan be performed.
- a well-defined electrode area that does not change with timecan occur when there is a tight seal between the electrode and the spacer.
- the test currentis relatively constant when the current is not changing rapidly due either to glucose oxidation or electrochemical decay.
- any period of time when an increase in signal, which would be seen due to glucose oxidation, is effectively balanced by a decrease in signal, which accompanies electrochemical decaycan also be an appropriate time interval for measuring capacitance.
- first electrode 166can potentially change with time after dosing with the sample if the sample seeps in between the spacer 60 and the first electrode 166.
- reagent layer 72can have an area larger than the cutout area 68 that causes a portion of the reagent layer 72 to be in between the spacer 60 and the first electrode layer 66. Under certain circumstances, interposing a portion of the reagent layer 72 in between the spacer 60 and the first electrode layer 66 can allow the wetted electrode area to increase during a test. As a result, a leakage can occur during a test that causes the area of the first electrode to increase with time, which in turn can distort a capacitance measurement.
- an area of second electrode 164can be more stable with time compared to the first electrode 166 because there is no reagent layer in between the second electrode 164 and the spacer 60. Thus, the sample is less likely to seep in between the spacer 60 and the second electrode 164.
- a capacitance measurement that uses a limiting test current at the second electrode 164can thus be more precise because the area does not change during the test.
- a first test voltage V 1(e.g., -20 mV) can be applied between the electrodes for about 1 second to monitor the fill behavior of the liquid and to distinguish between control solution and blood.
- the test currentsare used from about 0.05 to 1 second.
- This first test voltage V 1can be relatively low (i.e., the test voltage is similar in magnitude to the redox potential of the mediator) such that the distribution of ferrocyanide in the cell is disturbed as little as possible by the electrochemical reactions occurring at the first and second electrodes.
- a second test voltage V 2(e.g., -300 mV) having a larger absolute magnitude can be applied after the first test voltage V 1 such that a limiting current can be measured at the second electrode 164.
- the second test voltage V 2can include an AC voltage component and a DC voltage component.
- the AC voltage componentcan be applied at a predetermined amount of time after the application of the second test voltage V 2 , and further, can be a sine wave having a frequency of about 109 Hertz and an amplitude of about +/-50 millivolts.
- the predetermined amount of timecan range from about 0.3 seconds to about 0.4 seconds after the application of the second test voltage V 2 .
- the predetermined amount of timecan be a time where a test current transient as a function of time has a slope of about zero.
- the predetermined amount of timecan be a time required for a peak current value (e.g., i pb ) to decay by about 50%.
- the DC voltageit can be applied at a beginning of the first test voltage.
- the DC voltage componentcan have a magnitude sufficient to cause a limiting test current at the second electrode such as, for example, about -0.3 volts with respect to the second electrode.
- the reagent layer 72is not coated onto the second electrode 164, which causes the magnitude of the absolute peak current i pb to be relatively low compared to the magnitude of the absolute peak current i pc .
- the reagent layer 72can be configured to generate a reduced mediator in a presence of an analyte, and the amount of the reduced mediator proximate to first electrode can contribute to the relatively high absolute peak current i pc .
- at least the enzyme portion of the reagent layer 72can be configured to not substantially diffuse from the first electrode to the second electrode when a sample is introduced into the test strip.
- test currents after i pbtends to settle to a flat region at approximately 1.3 seconds, and then the current increases again as the reduced mediator generated at the first electrode 166, which can be coated with the reagent layer 72, diffuses to the second electrode 164, which is not coated with the reagent layer 72.
- a capacitance measurementcan be performed at a relatively flat region of the test current values, which can be performed at about 1.3 seconds to about 1.4 seconds.
- the capacitancecan interfere with the relatively low first test voltage V 1 that can be used in the CS/blood discrimination test 1806.
- an oscillating voltage component on the order of +/- 50 mV superimposed onto a -20 mV constant voltage componentcan cause significant perturbation of the measured test current.
- the oscillating voltage componentinterfere with the first test voltage V 1 , but it can also significantly perturb the test currents measured after 1.4 seconds, which in turn can interfere with the blood glucose algorithm 1810.
- measuring the capacitance at about 1.3 seconds to about 1.4 secondsresulted in accurate and precise measurements that did not interfere with the CS/blood discrimination test or the glucose algorithm.
- the third test voltage V 3(e.g., +300 mV) can be applied causing the test current to be measured at the first electrode 166, which can be coated with the reagent layer 72.
- the presence of a reagent layer on the first electrodecan allow penetration of liquid between the spacer layer and the electrode layer, which can cause the electrode area to increase.
- a 109 Hz AC test voltage( ⁇ 50 mV peak-to-peak) can be applied for 2 cycles during the time interval t cap .
- the first cyclecan be used as a conditioning pulse and the second cycle can be used to determine the capacitance.
- the capacitance estimatecan be obtained by summing the test current over a portion of the alternating current (AC) wave, subtracting the direct current (DC) offset, and normalizing the result using the AC test voltage amplitude and the AC frequency. This calculation provides a measure of the capacitance of the strip, which is dominated by the strip sample chamber when it is filled with a sample.
- the capacitancecan be measured by summing the test current over one quarter of the AC wavelength on either side of the point in time where the input AC voltage crosses the DC offset, i.e. when the AC component of the input voltage is zero (the zero crossing point).
- the DC current componentis considered as changing linearly with time (due to the on-going glucose reaction generating ferrocyanide) and is thus represented by a constant i o , which is the DC current at time zero (the zero crossing point), and s , the slope of the DC current change with time.
- the AC current componentis represented by Isin( ⁇ t + ⁇ ), where I is the amplitude of the current wave, ⁇ is its frequency, and ⁇ is its phase shift relative to the input voltage wave.
- ⁇can also be expressed as 2 ⁇ f, where f is the frequency of the AC wave in Hertz.
- IV Z
- is the magnitude of the complex impedance.
- the capacitance measurementscan be obtained by summing the currents not around the voltage zero crossing point, but rather around the maximum AC component of the current.
- the test currentcan be summed a quarter wavelength around the current maximum. This is tantamount to assuming that the circuit element responding to the AC excitation is a pure capacitor, so ⁇ is ⁇ /2.
- Equation 28can then be used with Equation 25 to yield a simplified capacitance equation that does not require an integral approximation. The net result is that capacitance measurements when summing the currents not around the voltage crossing point, but rather around the maximum AC component of the current, were more precise.
- the microprocessor of the test metercan have a heavy load with calculating the glucose concentration.
- the capacitance data acquisitionneeds to be made part way through the test rather than at its beginning, it can be necessary to defer the processing of the capacitance measurement data until after the determination of the glucose concentration is completed.
- the capacitancecan be calculated, and if the capacitance is below a pre-determined threshold, a partial fill error can be flagged.
- Cap corrCap - 1.9 ⁇ T
- Cap corrthe temperature corrected capacitance value
- Capcapacitance
- Ttemperature
- the temperature-corrected capacitance values from Equations 29 and 30can be used for identifying partially filled test strips.
- the thresholdshould generally be set four (4) standard deviation units below the mean. Statistically this equates to a 99.994% certainty that no complete fill will be identified as a partial fill.
- the temperature-corrected capacitance threshold value for bloodwill be about 450 nF, and the corresponding value for control solution will be about 560 nF. These values can be programmed into a memory portion of the test meters. In an alternative embodiment, the threshold value can be adjusted by the operator depending on the intended use. Table 1 - Temperature-corrected capacitance values for complete fills Parameter All bloods results All CS results Mean capacitance (nF) 515 664 SD (nF) 16 27 Mean -4*SD (nF) 451 556
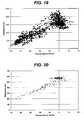
- the chart of FIG. 19shows a correlation of capacitance and bias to a reference glucose measurement (YSI, Yellow Springs Instrument).
- the measured glucose concentrationswere converted to a bias by comparing it to a glucose measurement performed with a reference instrument.
- Several test stripswere filled with various volumes of blood, and the capacitance and glucose concentrations were measured with the test voltage waveform of FIG. 6 . More particularly, the capacitance was measured during the third test voltage V 3 where the test current is relatively large and decreases rapidly with time. Additionally, the capacitance measurements were performed where the limiting test current occurs on the first electrode, which has a reagent layer coating.
- the capacitance valuesshould form a straight line with relatively little scatter when correlated to the YSI bias.
- a 50% negative bias to YSIshould correspond to a 50% decrease in capacitance compared to a fully-filled test strip.
- the strip-to-strip variation in biasis relatively small, then the relatively large scatter of data points in FIG 19 can be ascribed to a relatively large variation in the capacitance measurements. It was found that capacitance variation was caused by performing the capacitance measurement during the third test voltage where the test current values are generally not relatively constant.
- a relatively large scatter in the capacitance measurementscould cause a significant number of fully-filled test strips to be rejected. Further, a large capacitance variation can cause some capacitance measurements to be biased low, and thus, be below a sufficiently filled threshold resulting in a falsely identified partial fill.
- the chart of FIG. 20shows a correlation of capacitance (measured at about 1.3 seconds) and bias to a reference glucose measurement (YSI, Yellow Springs Instrument).
- a reference glucose measurementYSI, Yellow Springs Instrument.
- Several test stripswere filled with various volumes of blood, and the capacitance and glucose concentrations were measured with the test voltage waveform of FIG. 6 . More particularly, the capacitance was measured during the second test voltage V 2 where the test current is relatively constant. In addition, the capacitance measurement was performed where the limiting test current occurs on the second electrode, which did not have a reagent layer coating. In contrast to FIG. 19 , the data in FIG. 20 shows that the capacitance values are less scattered.
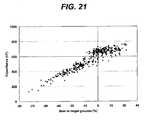
- the chart of FIG. 21shows a correlation of capacitance (measured at about 1.3 seconds) and bias to a reference glucose measurement (YSI, Yellow Springs Instrument).
- Several test stripswere filled with various volumes of CS, and the capacitance and glucose concentrations were measured with the test voltage waveform of FIG. 6 . Similar to FIG. 20 , the data in FIG. 21 shows that the capacitance values have a relatively low amount of variation when performed during this time interval.
- FIG. 22shows a test current transient where a user performed a double-dosing event during the second test time interval t 2 that caused a spike to be observed (see solid line). When there is no double-dosing event, the test current transient does not have a peak (see dotted line of FIG. 22 ).
- a double-dosing eventcan cause a glucose test to have an inaccurate reading.
- a double-dosing eventinitially causes the measured test current to be low in magnitude because the electrode area is effectively decreased when only a portion is wetted with sample. Once the user applies the second dose, a current spike will occur because of a sudden increase in the effective electrode area and also because turbulence causes more reduced mediator to be transported close to the working electrode. In addition, less ferrocyanide will be generated because a portion of the reagent layer is not wetted by sample for the entire test time. Thus, an inaccurate glucose reading can result if a test current value used in the glucose algorithm is depressed or elevated as a result of the double-dosing.
- a method of identifying a double-dosing event (1006a, 1006b, or 1006c)may include measuring a second test current and a third test current where the second test current occurs before the third test current.
- An equationmay be used to identify double-dosing events based on a difference between the absolute value of the third test current and the absolute value of the second test current. If the difference is greater than a predetermined threshold, the test meter may output an error message indicative of a double-dosing event.
- the method of identifying the double-dosing eventmay be performed multiple times in serial manner as the test current values are collected by the test meter.
- Equation 31for calculating a difference value Z 2 for determining whether a double-dosing event had occurred:
- Z 2abs ⁇ i ⁇ t + x - abs i t
- i(t)is a second test current
- i(t+x)is a third test current
- tis a time for the second test current
- xis an increment of time in between current measurements. If the value Z 2 is greater than a predetermined threshold of about three (3) microamperes, then the test meter may output an error message due to a double-dosing event.
- the predetermined thresholds disclosed hereinare illustrative for use with test strip 100 and with the test voltage waveform of FIG.
- working electrode and reference electrodeboth have an area of about 0.042 cm 2 and a distance between the two electrodes ranging from about 90 microns to about 100 microns. It should be obvious to one skilled in the art that such predetermined thresholds may change based on the test strip design, the test voltage waveform, and other factors.
- a methodmay include measuring a first test current, a second test current, and third test current where the first test current occurs before the second test current and the third test current occurs after the second test current.
- An equationmay be used to identify double-dosing events based on two times the absolute value of the second test current minus the absolute value of first test current and minus the absolute value of the third test current.
- the predetermined thresholdmay be set to a different value for the first time interval t 1 , second time interval t 2 , and third time interval t 3 .
- the predetermined thresholdmay be about two (2) microamperes for the first time interval t 1 , about two (2) microamperes for the second time interval t 2 , and about three (3) microamperes for the third time interval t 3 .
- the predetermined thresholdsmay be adjusted as a result of the following factors such as noise in the test meter, frequency of test current measurements, the area of the electrodes, the distance between the electrodes, the probability of a false positive identification of a double-dosing event, and the probability of a false negative identification of a double-dosing event.
- the method of identifying the double-dosing event using Equation 32can be performed for multiple portions of the test current transient.
- Equation 32can be more accurate than Equation 31 for identifying double-dosing events because the first test current and third test current provide a baseline correction.
- the double-dosing checkcan be performed at a time period just after the beginning of the first, second, and third time intervals because a peak typically occurs at the beginning of the time intervals. For example, the test currents measured at zero seconds to about 0.3, 1.05, and 4.05 seconds should be excluded from the double-dosing check.
- a maximum current checkcan be used to identify a test meter error or a test strip defect.
- An example of a test meter erroroccurs when the blood is detected late after it is dosed.
- An example of a defective test stripoccurs when the first and second electrode are shorted together.
- FIG. 23shows a test current transient where the test meter did not immediately detect the dosing of blood into the test strip (see solid line). In such a scenario, a late start will generate a significant amount of ferrocyanide before the second test voltage V 2 is applied causing a relatively large test current value to be observed. In contrast, when the test meter properly initiates the test voltage waveform once blood is applied, the test current values for the second time interval are much smaller, as illustrated by the dotted line in FIG. 23 .
- a late start eventcan cause an inaccurate glucose reading. Thus, it would be desirable to identify a late start event and then have the meter output an error message instead of outputting an inaccurate reading.
- a late start eventcauses the measured test current to be larger in magnitude because there is more time for the reagent layer to generate ferrocyanide. Thus, the increased test current values will likely distort the accuracy of the glucose concentration.
- a short between the first and second electrodecan cause the test current to increase.
- the magnitude of this increasedepends on the magnitude of the shunting resistance between the first and second electrode. If the shunting resistance is relatively low, a relatively large positive bias will be added to the test current causing a potentially inaccurate glucose response.
- Maximum current check (1012a, 1012b, and 1012c)can be performed by comparing the absolute value of all of the measured test current values to a predetermined threshold and outputting an error message if the absolute value of one of the measured test current values is greater than the predetermined threshold.
- the predetermined thresholdcan be set to a different value for the first, second, and third test time intervals ( t 1 , t 2 , and t 3 ). In one embodiment, the predetermined threshold may be about 50 microamperes for the first time interval t 1 , about 300 microamperes for the second time interval t 2 , and about 3000 microamperes for the third time interval t 3 .
- a minimum current checkcan be used to identify a false start of a glucose test, an improper time shift by a test meter, and a premature test strip removal.
- a false startcan occur when the test meter initiates a glucose test even though no sample has been applied to the test strip. Examples of situations that can cause a test meter to inadvertently initiate a test are an electrostatic discharge event (ESD) or a temporary short between first and second electrodes. Such events can cause a relatively large current to be observed for a least a short moment in time that initiates a test even though no liquid sample has been introduced into the test strip.
- ESDelectrostatic discharge event
- An inadvertent initiation of a glucose testcan cause a test meter to output a low glucose concentration even though no sample has yet been applied to the test strip.
- the test metershould provide an error message that instructs the user to re-insert the same test strip or to insert a new test strip for performing the test again.
- a time shifting error by the test metercan occur when the third test voltage V 3 is applied early or late.
- An early application of the third test voltage V 3should cause the test current value at the end of the second time interval t 2 to be a relatively large current value with a positive polarity instead of a relatively small current value with a negative polarity.
- a late application of the third test voltage V 3should cause the test current value at the beginning of the third time interval to be a relatively small current value with a negative polarity instead of a relatively large current value with a positive polarity.
- For both the early and late application of the third test voltage V 3there is a possibility of causing an inaccurate glucose result. Therefore, it would be desirable to identify a time shifting error by the test meter using the minimum current check so that an inaccurate glucose reading does not occur.
- a premature removal of a test strip from the test meter before the end of a glucose testcan also cause an inaccurate glucose reading to occur.
- a test strip removalwould cause the test current to change to a value close to zero potentially causing an inaccurate glucose output. Accordingly, it would also be desirable to identify a premature strip removal using a minimum current check so that an error message can be provided instead of displaying an inaccurate glucose reading.
- the minimum current checkmay be performed by comparing the absolute value of all of the measured test current values during the second and third time intervals ( t 2 and t 3 ) to a predetermined threshold and outputting an error message if the absolute value of one of the measured test current values is less than a predetermined threshold.
- the predetermined thresholdmay be set to a different value for the second and third test time intervals. However, in one embodiment, the predetermined threshold may be about 1 microampere for the first time interval t 1 and the second time interval t 2 . Note that the minimum current check was not performed for the first time interval because the test current values are relatively small because the first test voltage V 1 is close in magnitude to the redox potential of the mediator.
- a high resistance trackcan be detected on a test strip that can result in an inaccurate glucose reading.
- a high resistance trackcan occur on a test strip that has an insulating scratch or a fouled electrode surface.
- scratchescan easily occur during the handling and manufacture of the test strip.
- a scratch that runs from one lateral edge 56 to another lateral edge 58 on first electrode layer 66can cause an increased resistance between first contact pads 67 and first electrode 166.
- Sputtered metal filmstend to be very thin (e.g., 10 to 50 nm) making them prone to scratches during the handling and manufacture of the test strip.
- sputtered metal filmscan be fouled by exposure to volatile compounds such as hydrocarbons. This exposure causes an insulating film to form on the surface of the electrode, which increases the resistance.
- Another scenario that can cause a high resistance trackis when the sputtered metal film is too thin (e.g., ⁇ 10 nm).
- Yet another scenario that can cause a high resistance trackis when the test meter connectors do not form a sufficiently conductive contact to the test strip contact pads. For example, the presence of dried blood on the test meter connectors can prevent a sufficiently conductive contact to the test strip contact pads.
- FIG. 24shows two test current transients during a third time interval t 3 for a test strip having a high resistance track (squares) and a low resistance track (triangles).
- a sufficiently high track resistance R that is between the electrode and the electrode contact padcan substantially attenuate the magnitude of the effectively applied test voltage V eff , which in turn can attenuate the magnitude of the resulting test current.
- V effwill be the most attenuated at the beginning of the third time interval t 3 where the test current will generally have the highest magnitude.
- Such attenuation in the peak current immediately at about 4.05 secondscan cause the calculated glucose concentration to be inaccurate.
- Rshould be a relatively small value (i.e., low track resistance).
- a low resistance trackmay be represented by an electrode layer having a resistivity of less than about 12 ohms per square and a high resistance track may be represented by an electrode layer having a resistivity of greater than about 40 ohms per square.
- a determination of whether a test strip has a high track resistancecan use an equation based on a first test current i 1 and a second test current i 2 that both occur during the third time interval t 3 .
- the first test current i 1may be measured at about a beginning of the third time interval t 3 (e.g., 4.05 seconds) where the magnitude is at a maximum or close to the maximum.
- the second test current i 2may be measured at about an end of the third time interval t 3 (e.g., 5 seconds) where the magnitude is at the minimum or close to the minimum.
- first ratio R 1is greater than a predetermined threshold, then the test meter may output an error message due to the test strip having a high resistance track.
- the predetermined thresholdmay be about 1.2. It is significant that the first test current i 1 is about a maximum current value because it is the most sensitive to resistance variations according to Equation 33. If a first test current i 1 is measured at a time that was closer to the minimum current value, then Equation 34 would be less sensitive for determining whether a high resistance track was present. It is advantageous to have relatively low variation in the first ratio R 1 when testing low resistance test strips. The relatively low variation decreases the likelihood of mistakenly identifying a high resistance track test strip.
- first ratio R 1 values for test strips having a low resistance trackis about four times lower when a first test current value i 1 was defined as a current value immediately after the application of the third test voltage V 3 , as opposed to being a sum of current values during the third time interval t 3 .
- first ratio R 1 values for low resistance test stripsthe probability of mistakenly identifying a high resistance track increases.
- FIG. 25is a chart showing a plurality of R 1 values calculated with Equation 34 for two test strip lots where one lot has a high resistance track and the other lot has a low resistance track.
- One lot of test stripwas purposely manufactured with a high resistance track by using palladium electrodes that were purposely fouled by an exposure to gas containing hydrocarbons for several weeks.
- the second test strip lotwas manufactured without purposely fouling the electrode surface.
- a roll of sputtered coated palladiumwas coated with MESA before coating with the reagent layer. All of the low resistance test strips, which were not fouled, had R 1 values of less than 1.1 indicating that Equation 34 could identify low track resistance test strips. Similarly, essentially all of the high resistance test strips, which were purposely fouled, had R 1 values of greater than 1.1 indicating that Equation 34 could identify high track resistance test strips.
- a leakagecan be detected on a test strip when the spacer 60 does not form a sufficiently strong liquid impermeable seal with the first electrode layer 66.
- a leakageoccurs when liquid seeps in between the spacer 60 and the first electrode 166 and/or the second electrode 164.
- FIG. 4Bshows a reagent layer 72 that is immediately adjacent to the walls of the spacer 60.
- the reagent layer 72can be have an area larger than the cutout area 68 that causes a portion of the reagent layer 72 to be in between the spacer 60 and the first electrode layer 66.
- FIG. 16shows test current transients during a third time interval t 3 for three different types of test strip lots where test strip lot 1 (squares) has a leakage of liquid between the spacer and the first electrode.
- Test strip lot 1was constructed using a dryer setting that did not sufficiently dry the reagent layer and also was laminated with a pressure setting that was not sufficient to form a liquid impermeable seal to the electrodes.
- the reagent layeris sufficiently dried so that an adhesive portion of the spacer 60 can intermingle with the reagent layer and still form a liquid impermeable seal to the first electrode layer 166.
- sufficient pressuremust be applied so that the adhesive portion of the spacer 60 can form the liquid impermeable seal to the first electrode layer 166.
- test strip lot 2was prepared similarly to test strip lot 1 except that they were stored at about 37 degrees Celsius for about two weeks. The storage of the test strip lot 2 caused the spacer to reform creating a liquid impermeable seal to the electrodes.
- Test strip lot 3was constructed using a dryer setting that was sufficient to dry the reagent layer and also was laminated with a pressure setting sufficient to form a liquid impermeable seal. Both test strip lots 2 and 3 (triangles and circles respectively) show a more rapid decay in the test current magnitude with time compared to test strip 1 (squares), as illustrated in FIG. 26 .
- a determination of whether a test strip leakscan be performed using an equation based on a first test current, a second test current, a third test current, and a fourth test current that occur during the third test time interval.
- a first logarithm of a second ratiocan be calculated based on a first test current i 1 and a second test current i 2 .
- a second logarithm of a third ratiocan be calculated based on a third test current i 3 and a fourth test current i 4 .
- An equationmay be used to calculate a fourth ratio R 4 based on the first logarithm and the second logarithm. If the fourth ratio R 4 is less than a predetermined ratio, then the test meter will output an error message due to leakage.
- the predetermined thresholdmay range from about 0.95 to about 1.
- the first test current i 1 and the second test i 2 currentmay be about the two largest current values occurring the third time interval t 3
- the fourth test current i 4may be a smallest current value occurring the third time interval t 3
- the third test current i 3may be selected at a third test time so that a difference between the fourth test time and a third test time is greater than a difference between a second test time and a first test time.
- the first test current, the second test current, the third test current, and the fourth test currentmay be measured at about 4.1 seconds, 4.2 seconds, 4.5 seconds, and 5 seconds, respectively.
- FIG. 27is a chart showing a plurality of R 4 values calculated with Equation 35 for the three test strip lots described for FIG. 26 . Accordingly, test strip lot 1 has fourth ratio values less than one and both test strip lots 2 and 3 have fourth ratio R 4 values greater than one indicating that Equation 35can successfully identify strip leakages.
- a determination of whether a test strip has a leakagecan be performed using an equation based on only three test current values instead of using four test current values as shown in Equation 35.
- the three test current valuesmay include a first test current i 1 , a third test current i 3 , and a fourth test current i 4 that all occur during the third test time interval t 3 .
- a third logarithm of a fifth ratiomay be calculated based on the first test current i 1 and the third test current i 3 .
- a second logarithm of a third ratiomay be calculated based on the third test current i 3 and the fourth test current i 4 .
- Equation 36An equation may be used to calculate a sixth ratio R 6 based on the third logarithm and the second logarithm. If R 6 is less than a predetermined ratio, then the test meter will output an error message due to leakage.
Landscapes
- Health & Medical Sciences (AREA)
- Chemical & Material Sciences (AREA)
- Hematology (AREA)
- Life Sciences & Earth Sciences (AREA)
- Electrochemistry (AREA)
- Chemical Kinetics & Catalysis (AREA)
- Molecular Biology (AREA)
- Physics & Mathematics (AREA)
- Analytical Chemistry (AREA)
- Biochemistry (AREA)
- General Health & Medical Sciences (AREA)
- General Physics & Mathematics (AREA)
- Immunology (AREA)
- Pathology (AREA)
- Investigating Or Analysing Biological Materials (AREA)
Description
- The present disclosure relates to methods and systems for determining analyte concentration of a sample.
- Analyte detection in physiological fluids, e.g. blood or blood derived products, is of ever increasing importance to today's society. Analyte detection assays find use in a variety of applications, including clinical laboratory testing, home testing, etc., where the results of such testing play a prominent role in diagnosis and management in a variety of disease conditions. Analytes of interest include glucose for diabetes management, cholesterol, and the like. In response to this growing importance of analyte detection, a variety of analyte detection protocols and devices for both clinical and home use have been developed.
- One type of method that is employed for analyte detection is an electrochemical method. In such methods, an aqueous liquid sample is placed into a sample-receiving chamber in an electrochemical cell that includes two electrodes, e.g., a counter and working electrode. The analyte is allowed to react with a redox reagent to form an oxidizable (or reducible) substance in an amount corresponding to the analyte concentration. The quantity of the oxidizable (or reducible) substance present is then estimated electrochemically and related to the amount of analyte present in the initial sample.
- Such systems are susceptible to various modes of inefficiency and/or error. For example, variations in temperatures can affect the results of the method. This is especially relevant when the method is carried out in an uncontrolled environment, as is often the case in home applications or in third world countries. Errors can also occur when the sample size is insufficient to get an accurate result. Partially filled test strips can potentially give an inaccurate result because the measured test currents are proportional to the area of the working electrode that is wetted with sample. Thus, partially filled test strips can under certain conditions provide a glucose concentration that is negatively biased. A user can have difficulty determining whether an electrode area of a test strip is completely covered by a sample. Many test strips, including the ones described herein, have a relatively small volume (<one microliter) making it difficult for a user to see and judge whether there is a small area of an electrode that is unwetted. This can especially be a problem for people with diabetes that often have poor visual acuity.
- A method for checking whether a test strip is sufficiently filled using capacitance measurements is known from
US 7 195 704 . - Various aspects of a method of calculating an analyte concentration of a sample are provided. In one aspect the method accounts for temperature variation and includes applying a sample to a test strip and applying a first test voltage for a first time interval between a first electrode and a second electrode sufficient to oxidize a reduced mediator at the second electrode. A second test voltage can be applied for a second time interval between the first electrode and the second electrode that is also sufficient to oxidize the reduced mediator at the first electrode. A first glucose concentration can be calculated based on the test current values during the first time interval and the second time interval. Additionally, the test meter can measure a temperature value. Accordingly, a temperature corrected glucose concentration can be calculated based on the first glucose concentration and the temperature value.
- In accordance with the present invention, according to
claim 1 is provided a method to determine whether a test strip is sufficiently filled with a sample. The method includes applying a first test voltage between a first electrode and a second electrode of a test strip. The first test voltage has both an AC voltage component and a DC voltage component. The AC voltage component is applied at a predetermined amount of time after the application of the first test voltage. The DC voltage component has a magnitude sufficient to cause a limiting test current at the second electrode. Accordingly, a portion of the resulting test current from the AC voltage component is processed into a capacitance value. - The present disclosure will be more fully understood from the following detailed description taken in conjunction with the accompanying drawings, in which:
FIG. 1A is a perspective view of a test strip;FIG. 1B is an exploded perspective view of the test strip ofFIG. 1A ;FIG. 1C is a perspective view of a distal portion of the test strip ofFIG. 1A ;FIG. 2 is a bottom plan view of the test strip ofFIG. 1A ;FIG. 3 is a side plan view of the test strip ofFIG. 1A ;FIG. 4A is a top plan view of the test strip ofFIG. 1A ;FIG. 4B is a partial side view of the distal portion of the test strip consistent witharrows 4B-4B ofFIG. 4A ;FIG. 5 is a simplified schematic showing a test meter electrically interfacing with the test strip contact pads;FIG. 6 shows a test voltage waveform in which the test meter applies a plurality of test voltages for prescribed time intervals;FIG. 7 shows a test current transient generated with the test voltage waveform ofFIG. 6 ;FIG. 8 is a flow diagram showing an embodiment of a method of determining a glucose concentration;FIG. 9 is a flow diagram showing an exemplary embodiment of a blood glucose algorithm and a hematocrit correction;FIG. 10 is a chart showing a correlation between measured hematocrit levels using a reference method and measured hematocrit levels using the test strip ofFIG. 1 ;FIG. 11 is a bias plot showing a plurality of test strips that were tested with blood samples having a wide range of hematocrit levels;FIG. 12 is a flow diagram showing an embodiment of a method of applying a temperature correction when a sample is blood;FIG. 13 is a bias plot showing a plurality of test strips that were tested with blood samples having a wide range of hematocrit levels, a wide range of glucose levels, and a wide range of temperature levels without temperature correction;FIG. 14 is a bias plot showing a plurality of test strips that were tested with blood samples having a wide range of hematocrit levels, a wide range of glucose levels, and a wide range of temperature levels with temperature correction;FIG. 15 is a flow diagram showing an embodiment of a method of applying a temperature correction when a sample is control solution;FIG. 16 is a bias plot showing a plurality of test strips that were tested with control solution samples having a wide range of glucose levels and a wide range of temperature levels without temperature correction;FIG. 17 is a bias plot showing a plurality of test strips that were tested with control solution samples having a wide range of glucose levels and a wide range of temperature levels with temperature correction;FIG. 18 is a flow diagram depicting an embodiment of a method of identifying system errors;FIG. 19 is a chart showing a correlation of capacitance and bias to a reference glucose measurement (YSI, Yellow Springs Instrument) where capacitance values were measured for blood samples during the third test voltage ofFIG. 6 ;FIG. 20 is a chart showing a correlation of capacitance and bias to a reference glucose measurement (YSI, Yellow Springs Instrument) where capacitance values were measured for blood samples during the second test voltage ofFIG. 6 (e.g., after approximately 1.3 seconds);FIG. 21 is a chart showing a correlation of capacitance and bias to a reference glucose measurement (YSI, Yellow Springs Instrument) where capacitance values were measured for control solution samples during the second test voltage ofFIG. 6 (e.g., after approximately 1.3 seconds);FIG. 22 shows a test current transient of the second test time interval when a user performs a double dose (solid line) and does not perform a double dose (dotted line);FIG. 23 shows a test current transient of the second test time interval when a late start error occurs (solid line) and does not occur (dotted line) with the test meter;FIG. 24 shows a test current transient of the third test time interval for a test strip having a high resistance track (squares) and a low resistance track (triangles);FIG. 25 is a chart showing a plurality of ratio values indicating that a high resistance test strip lot can be distinguished from a low resistance test strip lot;FIG. 26 shows a plurality of test current transients for a test strip lot having leakage between a spacer and the first electrode (squares) and for test strip lots having a sufficiently low amount of leakage (circles and triangles); andFIG. 27 is a chart showing a plurality of ratio values for identifying leakage of liquid for test strip lots prepared with different manufacturing conditions.- Certain exemplary embodiments will now be described to provide an overall understanding of the principles of the structure, function, manufacture, and use of the devices, systems, and methods disclosed herein. One or more examples of these embodiments are illustrated in the accompanying drawings. Those skilled in the art will understand that the devices and methods specifically described herein and illustrated in the accompanying drawings are non-limiting exemplary embodiments and that the scope of the present disclosure is defined solely by the claims. The features illustrated or described in connection with one exemplary embodiment may be combined with the features of other embodiments. Such modifications and variations are intended to be included within the scope of the present disclosure.
- The subject systems and methods are suitable for use in the determination of a wide variety of analytes in a wide variety of samples, and are particularly suited for use in the determination of analytes in whole blood, plasma, serum, interstitial fluid, or derivatives thereof. In an exemplary embodiment, a glucose test system based on a thin-layer cell design with opposing electrodes and tri-pulse electrochemical detection that is fast (e.g., about 5 second analysis time), requires a small sample (e.g., about 0.4 µL), and can provide improved reliability and accuracy of blood glucose measurements. In the reaction cell, glucose in the sample can be oxidized to gluconolactone using glucose dehydrogenase and an electrochemically active mediator can be used to shuttle electrons from the enzyme to a palladium working electrode. A potentiostat can be utilized to apply a tri-pulse potential waveform to the working and counter electrodes, resulting in test current transients used to calculate the glucose concentration. Further, additional information gained from the test current transients may be used to discriminate between sample matrices and correct for variability in blood samples due to hematocrit, temperature variation, electrochemically active components, and identify possible system errors.
- The subject methods can be used, in principle, with any type of electrochemical cell having spaced apart first and second electrodes and a reagent layer. For example, an electrochemical cell can be in the form of a test strip. In one aspect, the test strip may include two opposing electrodes separated by a thin spacer for defining a sample-receiving chamber or zone in which a reagent layer is located. One skilled in the art will appreciate that other types of test strips, including, for example, test strips with co-planar electrodes may also be used with the methods described herein.
FIGS. 1A to 4B show various views of anexemplary test strip 62 suitable for use with the methods and systems described herein. In an exemplary embodiment, atest strip 62 is provided which includes an elongate body extending from adistal end 80 to aproximal end 82, and havinglateral edges FIG. 1A . As shown inFIG. 1B , thetest strip 62 also includes afirst electrode layer 66, asecond electrode layer 64, and aspacer 60 sandwiched in between the twoelectrode layers first electrode layer 66 can include a first electrode 166, afirst connection track 76, and afirst contact pad 67, where thefirst connection track 76 electrically connects the first electrode 166 to thefirst contact pad 67, as shown inFIGS. 1B and4B . Note that the first electrode 166 is a portion of thefirst electrode layer 66 that is immediately underneath thereagent layer 72, as indicated byFIGS. 1B and4B . Similarly, thesecond electrode layer 64 can include asecond electrode 164, asecond connection track 78, and asecond contact pad 63, where thesecond connection track 78 electrically connects thesecond electrode 164 with thesecond contact pad 63, as shown inFIGS. 1B ,2, and 4B . Note that thesecond electrode 164 is a portion of thesecond electrode layer 64 that is above thereagent layer 72, as indicated byFIG. 4B .- As shown, the sample-receiving
chamber 61 is defined by the first electrode 166, thesecond electrode 164, and thespacer 60 near thedistal end 80 of thetest strip 62, as shown inFIG. 1B and4B . The first electrode 166 and thesecond electrode 164 can define the bottom and the top of sample-receivingchamber 61, respectively, as illustrated inFIG. 4B . A cutout area 68 of thespacer 60 can define the sidewalls of the sample-receivingchamber 61, as illustrated inFIG. 4B . In one aspect, the sample-receivingchamber 61 can includeports 70 that provide a sample inlet and/or a vent, as shown inFIGS. 1A to 1C . For example, one of the ports can allow a fluid sample to ingress and the other port can allow air to egress. - In an exemplary embodiment, the sample-receiving
chamber 61 can have a small volume. For example, thechamber 61 can have a volume in the range of from about 0.1 microliters to about 5 microliters, about 0.2 microliters to about 3 microliters, or, preferably, about 0.3 microliters to about 1 microliter. To provide the small sample volume, the cutout 68 can have an area ranging from about 0.01 cm2 to about 0.2 cm2, about 0.02 cm2 to about 0.15 cm2, or, preferably, about 0.03 cm2 to about 0.08 cm2. In addition, first electrode 166 andsecond electrode 164 can be spaced apart in the range of about 1 micron to about 500 microns, preferably between about 10 microns and about 400 microns, and more preferably between about 40 microns and about 200 microns. The relatively close spacing of the electrodes can also allow redox cycling to occur, where oxidized mediator generated at first electrode 166, can diffuse tosecond electrode 164 to become reduced, and subsequently diffuse back to first electrode 166 to become oxidized again. - In one embodiment, the
first electrode layer 66 and thesecond electrode layer 64 can be a conductive material formed from materials such as gold, palladium, carbon, silver, platinum, tin oxide, iridium, indium, or combinations thereof (e.g., indium doped tin oxide). In addition, the electrodes can be formed by disposing a conductive material onto an insulating sheet (not shown) by a sputtering, electroless plating, or a screenprinting process. In one exemplary embodiment, thefirst electrode layer 66 and thesecond electrode layer 64 can be made from sputtered palladium and sputtered gold, respectively. Suitable materials that can be employed asspacer 60 include a variety of insulating materials, such as, for example, plastics (e.g., PET, PETG, polyimide, polycarbonate, polystyrene), silicon, ceramic, glass, adhesives, and combinations thereof. In one embodiment, thespacer 60 may be in the form of a double sided adhesive coated on opposing sides of a polyester sheet where the adhesive may be pressure sensitive or heat activated. Those skilled in the art will appreciate that various other materials for thefirst electrode layer 66, thesecond electrode layer 64, and/or thespacer 60 are within the spirit and scope of the present disclosure. - Various mechanisms and/or processes can be utilized to dispose a
reagent layer 72 within the sample-receivingchamber 61. For example, thereagent layer 72 can be disposed within the sample-receivingchamber 61 using a process such as slot coating, dispensing from the end of a tube, ink jetting, and screen printing. In one embodiment, thereagent layer 72 can include at least a mediator and an enzyme and is deposited onto first electrode 166. Examples of suitable mediators include ferricyanide, ferrocene, ferrocene derivatives, osmium bipyridyl complexes, and quinone derivatives. Examples of suitable enzymes include glucose oxidase, glucose dehydrogenase (GDH) using a pyrroloquinoline quinone (PQQ) co-factor, GDH using a nicotinamide adenine dinucleotide (NAD) co-factor, and GDH using a flavin adenine dinucleotide (FAD) co-factor [E.C.1.1.99.10]. Thereagent layer 72 can be prepared from a formulation that contains 33 mM potassium citraconate, pH 6.8, 0.033% Pluronic P103, 0.017% Pluronic F87, 0.85 mM CaCl2, 30 mM sucrose, 286 µM PQQ, 15 mg/mL apo-GDH, and 0.6 M ferricyanide. Alternatively, the PQQ can be left out of the formulation and the apo-GDH can be replaced with FAD-GDH. Pluronics are a block copolymers based on ethylene oxide and propylene oxide, which can function as antifoaming agents and/or wetting agents. - The formulation can be applied at 570 µL/min using a 13 gauge needle poised about 150 µm above a palladium web moving at about 10 m/min. Alternatively, the concentration of the solids in the reagent can be increased by 50% and the flow rate can be reduced to 380 µL/min in order to maintain a constant reagent coating density. Before coating the palladium web with the enzyme formulation, it can be coated with 2-mercaptoethane sulfonic acid (MESA). A 95 µm thick spacer with a 1.2 mm wide channel cut in it can be laminated to the reagent layer and the palladium web at 70°C. Next, a MESA-coated gold web can be laminated to the other side of the spacer. The spacer can be made from PET coated on both sides with a thermoplastic such as Vitel, which is a linear saturated copolyester resin having a relatively high molecular weight. The resulting laminate can be cut such that the fill path of the sample-receiving chamber is about 3.5 mm long, thus giving a total volume of about 0.4 µL.
- In one embodiment, the
reagent layer 72 may have an area larger than the area of the first electrodes 166. As a result a portion of thespacer 60 may overlap and touch thereagent layer 72. Thespacer 60 may be configured to form a liquid impermeable seal to the first electrode 166 even though a portion of thereagent layer 72 is between thespacer 60 and the first electrode 166. Thespacer 60 may intermingle or partially dissolve a portion of thereagent layer 72 to form a liquid impermeable bond to the first electrode 166 sufficient to define the electrode area for at least the total test time. Under certain circumstances where thereagent layer 72 is not sufficiently dry, thespacer 60 may not be able to form a liquid impermeable seal and, as a result, the liquid may seep between thespacer 60 and the first electrode 166. Such a leakage event may cause an inaccurate glucose measurement to occur. - Either the first electrode 166 or the
second electrode 164 can perform the function of a working electrode depending on the magnitude and/or polarity of the applied test voltage. The working electrode may measure a limiting test current that is proportional to the reduced mediator concentration. For example, if the current limiting species is a reduced mediator (e.g., ferrocyanide), then it can be oxidized at the first electrode 166 as long as the test voltage is sufficiently greater than the redox mediator potential with respect to thesecond electrode 164. In such a situation, the first electrode 166 performs the function of the working electrode and thesecond electrode 164 performs the function of a counter/reference electrode. Note that one skilled in the art may refer to a counter/reference electrode simply as a reference electrode or a counter electrode. A limiting oxidation occurs when all reduced mediator has been depleted at the working electrode surface such that the measured oxidation current is proportional to the flux of reduced mediator diffusing from the bulk solution towards the working electrode surface. The term bulk solution refers to a portion of the solution sufficiently far away from the working electrode where the reduced mediator is not located within a depletion zone. It should be noted that unless otherwise stated fortest strip 62, all potentials applied bytest meter 100 will hereinafter be stated with respect tosecond electrode 164. - Similarly, if the test voltage is sufficiently less than the redox mediator potential, then the reduced mediator can be oxidized at the
second electrode 164 as a limiting current. In such a situation, thesecond electrode 164 performs the function of the working electrode and the first electrode 166 performs the function of the counter/reference electrode. - Initially, performing an analysis can include introducing a quantity of a fluid sample into a sample-receiving
chamber 61 via aport 70. In one aspect, theport 70 and/or the sample-receivingchamber 61 can be configured such that capillary action causes the fluid sample to fill the sample-receivingchamber 61. The first electrode 166 and/orsecond electrode 164 may be coated with a hydrophilic reagent to promote the capillarity of the sample-receivingchamber 61. For example, thiol derivatized reagents having a hydrophilic moiety such as 2-mercaptoethane sulfonic acid may be coated onto the first electrode and/or the second electrode. FIG. 5 provides a simplified schematic showing atest meter 100 interfacing with afirst contact pad second contact pad 63. Thesecond contact pad 63 can be used to establish an electrical connection to the test meter through aU-shaped notch 65, as illustrated inFIG. 2 . In one embodiment, thetest meter 100 may include asecond electrode connector 101, and a first electrode connectors (102a, 102b), atest voltage unit 106, acurrent measurement unit 107, aprocessor 212, amemory unit 210, and avisual display 202, as shown inFIG. 5 . Thefirst contact pad 67 can include two prongs denoted as 67a and 67b. In one exemplary embodiment, thefirst electrode connectors prongs second electrode connector 101 can connect tosecond contact pad 63. Thetest meter 100 can measure the resistance or electrical continuity between theprongs test strip 62 is electrically connected to thetest meter 100. One skilled in the art will appreciate that thetest meter 100 can use a variety of sensors and circuits to determine when thetest strip 62 is properly positioned with respect to thetest meter 100.- In one embodiment, the
test meter 100 can apply a test voltage and/or a current between thefirst contact pad 67 and thesecond contact pad 63. Once thetest meter 100 recognizes that thestrip 62 has been inserted, thetest meter 100 turns on and initiates a fluid detection mode. In one embodiment, the fluid detection mode causestest meter 100 to apply a constant current of about 1 microampere between the first electrode 166 and thesecond electrode 164. Because thetest strip 62 is initially dry, thetest meter 100 measures a relatively large voltage, which can be limited by the analog-to-digital converter (A/D) withintest meter 100. When the fluid sample bridges the gap between the first electrode 166 and thesecond electrode 164 during the dosing process, thetest meter 100 will measure a decrease in measured voltage that is below a predetermined threshold causingtest meter 100 to automatically initiate the glucose test. - In one embodiment, the
test meter 100 can perform a glucose test by applying a plurality of test voltages for prescribed intervals, as shown inFIG. 6 . The plurality of test voltages may include a first test voltageV1 for a first time intervalt1, a second test voltageV2 for a second time intervalt2, and a third test voltageV3 for a third time intervalt3. A glucose test time intervaltG represents an amount of time to perform the glucose test (but not necessarily all the calculations associated with the glucose test). Glucose test time intervaltG can range from about 1 second to about 5 seconds. Further, as illustrated inFIG. 6 , the second test voltageV2 can include a constant (DC) test voltage component and a superimposed alternating (AC), or oscillating, test voltage component. The superimposed alternating test voltage component can be applied for a time interval indicated bytcap. The inset ofFIG. 6 magnifies the high frequency AC component. - The plurality of test current values measured during any of the time intervals may be performed at a frequency ranging from about 1 measurement per nanosecond to about one measurement per 100 milliseconds. While an embodiment using three test voltages in a serial manner is described, one skilled in the art will appreciate that the glucose test can include different numbers of open-circuit and test voltages. For example, as an alternative embodiment, the glucose test could include an open-circuit for a first time interval, a second test voltage for a second time interval, and a third test voltage for a third time interval. One skilled in the art will appreciate that names "first," "second," and "third" are chosen for convenience and do not necessarily reflect the order in which the test voltages are applied. For instance, an embodiment can have a potential waveform where the third test voltage can be applied before the application of the first and second test voltage.
- Once the glucose assay has been initiated, the
test meter 100 may apply a first test voltageV1 (e.g., -20 mV inFIG. 6 ) for a first time intervalt1 (e.g., 1 second inFIG. 6 ). The first time intervalt1 can range from about 0.1 seconds to about 3 seconds and preferably range from about 0.2 seconds to about 2 seconds, and most preferably range from about 0.3 seconds to about 1 seconds. - The first time intervalt1 may be sufficiently long so that the sample-receiving
chamber 61 can fully fill with sample and also so that thereagent layer 72 can at least partially dissolve or solvate. In one aspect, the first test voltageV1 may be a value relatively close to the redox potential of the mediator so that a relatively small amount of a reduction or oxidation current is measured.FIG. 7 shows that a relatively small amount of current is observed during the first time intervalt1 compared to the second and third time intervalst2 andt3. For example, when using ferricyanide and/or ferrocyanide as the mediator, the first test voltageV1 can range from about -100 mV to about -1 mV, preferably range from about -50 mV to about -5 mV, and most preferably range from about -30 mV to about -10 mV. - After applying the first test voltageV1, the
test meter 100 applies a second test voltageV2 between first electrode 166 and second electrode 164 (e.g., -0.3 Volts inFIG. 6 ), for a second time intervalt2 (e.g., about 3 seconds inFIG. 6 ). The second test voltageV2 may be a value sufficiently negative of the mediator redox potential so that a limiting oxidation current is measured at thesecond electrode 164. For example, when using ferricyanide and/or ferrocyanide as the mediator, the second test voltageV2 can range from about -600 mV to about zero mV, preferably range from about -600 mV to about -100 mV, and more preferably be about -300 mV. - The second time intervalt2 should be sufficiently long so that the rate of generation of reduced mediator (e.g., ferrocyanide) can be monitored based on the magnitude of a limiting oxidation current. Reduced mediator is generated by enzymatic reactions with the
reagent layer 72. During the second time intervalt2, a limiting amount of reduced mediator is oxidized atsecond electrode 164 and a non-limiting amount of oxidized mediator is reduced at first electrode 166 to form a concentration gradient between first electrode 166 andsecond electrode 164. - In an exemplary embodiment, the second time intervalt2 should also be sufficiently long so that a sufficient amount of ferricyanide can be generated at the
second electrode 164. A sufficient amount of ferricyanide is required at thesecond electrode 164 so that a limiting current can be measured for oxidizing ferrocyanide at the first electrode 166 during the third test voltageV3. The second time intervalt2 may be less than about 60 seconds, and preferably can range from about 1 second to about 10 seconds, and more preferably range from about 2 seconds to about 5 seconds. Likewise, the time interval indicated astcap inFIG. 6 may also last over a range of times, but in one exemplary embodiment it has a duration of about 20 milliseconds. In one exemplary embodiment, the superimposed alternating test voltage component is applied after about 0.3 seconds to about 0.4 seconds after the application of the second test voltageV2, and induces a sine wave having a frequency of about 109 Hz with an amplitude of about +/-50 mV. FIG. 7 shows a relatively small peakipb at the beginning of the second time intervalt2 followed by a gradual increase of an absolute value of an oxidation current during the second time intervalt2. The small peakipb occurs due to an initial depletion of reduced mediator at about 1 second. The gradual absolute increase in oxidation current after the small peakipb is caused by the generation of ferrocyanide byreagent layer 72, which then diffuses tosecond electrode 164.- After applying the second test voltageV2, the
test meter 100 applies a third test voltageV3 between the first electrode 166 and the second electrode 164 (e.g., about +0.3 Volts inFIG. 6 ) for a third time intervalt3 (e.g., 1 second inFIG. 6 ). The third test voltageV3 may be a value sufficiently positive of the mediator redox potential so that a limiting oxidation current is measured at the first electrode 166. For example, when using ferricyanide and/or ferrocyanide as the mediator, the third test voltageV3 can range from about zero mV to about 600 mV, preferably range from about 100 mV to about 600 mV, and more preferably be about 300 mV. - The third time intervalt3 may be sufficiently long to monitor the diffusion of reduced mediator (e.g., ferrocyanide) near the first electrode 166 based on the magnitude of the oxidation current. During the third time intervalt3, a limiting amount of reduced mediator is oxidized at first electrode 166 and a non-limiting amount of oxidized mediator is reduced at the
second electrode 164. The third time intervalt3 can range from about 0.1 seconds to about 5 seconds and preferably range from about 0.3 seconds to about 3 seconds, and more preferably range from about 0.5 seconds to about 2 seconds. FIG. 7 shows a relatively large peakipc at the beginning of the third time intervalt3 followed by a decrease to a steady-state currentiss value. In one embodiment, the second test voltageV2 can have a first polarity and the third test voltageV3 may have a second polarity that is opposite to the first polarity. In another embodiment, the second test voltageV2 can be sufficiently negative of the mediator redox potential and the third test voltageV3 can be sufficiently positive of the mediator redox potential. The third test voltageV3 may be applied immediately after the second test voltageV2. However, one skilled in the art will appreciate that the magnitude and polarity of the second and third test voltages can be chosen depending on the manner in which analyte concentration is determined.FIG. 8 illustrates one method of determining a glucose concentration by way of a flow diagram. A user can insert a test strip into a test meter and then apply a sample to the test strip. The test meter detects the presence of the sample and applies a test voltage, as shown in astep 1802. In response to the test voltage, the test meter measures a test current, as shown in astep 1804. A microprocessor of the test meter can then process the resulting test current values so that an accurate glucose measurement can be determined and to ensure that there are no system errors.- Another step in the method, as shown in
step 1806, can be performing a control solution (CS)/blood discrimination test. As indicated instep 1808, if the CS/blood discrimination test determines that the sample is blood, thenmethod 1800 moves to a series of steps that include: the application of ablood glucose algorithm 1810,hematocrit correction 1812,blood temperature correction 1814, anderror checks 1000; and if the CS/blood discrimination test determines that the sample is CS (i.e., not blood), thenmethod 1800 moves to a series of steps that include: the application of aCS glucose algorithm 1824,CS temperature correction 1826, and error checks 1000. After performing the error checks 1000,step 1818 can be performed to determine if there are any errors. If there are no errors, then the test meter outputs a glucose concentration, as shown in astep 1820, but if there are errors, then the test outputs an error message, as shown in astep 1822. - The CS/
blood discrimination test 1806 can include a first reference value and a second reference value. The first reference value can be based on current values during the first time intervalt1 and the second reference value can be based on current values during both the second time intervalt2 and the third time intervalt3. In one embodiment the first reference value can be obtained by performing a summation of the current values obtained during the first time current transient when using the test voltage waveform ofFIG. 6 . By way of non-limiting example, a first reference value isum can be represented by Equation 1:
where the termisum is the summation of current values and t is a time. The second reference value, sometimes referred to as the residual reaction index, can be obtained by a seventh ratio R7 of current values during the second time interval and the third time interval, as shown in Eq. 2:
whereabs represents an absolute function and 3.8 and 4.15 represent the time in seconds of the second and third time intervals, respectively, for this particular example. A discrimination criterion can be used to determine if the sample is either control solution or blood based on the first reference value of Eq. 1 and the second reference of Eq. 2. For example, the first reference value of Eq. 1 can be compared to a pre-determined threshold and the second reference value of Eq. 2 can be compared to a pre-determined threshold equation. The pre-determined threshold may be about 12 microamperes. The pre-determined threshold equation can be based on a function using the first reference value of Eq. 1. More specifically, as illustrated by Eq. 3, the pre-determined threshold equation can be:
Blood discrimination test 1806 can identify a sample as blood if
- If the sample is identified as a blood sample, the blood glucose algorithm of
step 1810 can be performed on the test current values. A first glucose concentrationG1 can be calculated using a glucose algorithm as shown in Equation 4:
wherei1 is a first test current value,i2 is a second test current value,i3 is a third test current value, and the termsa, p, andz can be empirically derived calibration constants. All test current values (e.g.,i1,i2, andi3) inEquation 4 use the absolute value of the current. The first test current valuei1 and the second test current valuei2 can each be defined by an average or summation of one or more predetermined test current values that occur during the third time intervalt3. The third test current valuei3 can be defined by an average or summation of one or more predetermined test current values that occur during the second time intervalt2. One skilled in the art will appreciate that names "first," "second," and "third" are chosen for convenience and do not necessarily reflect the order in which the current values are calculated. Equation 4 can be modified to provide an even more accurate glucose concentration. Instead or using a simple average or summation of test current values, the termi1 can be defined to include peak current valuesipb andipc and the steady-state currentiss, as shown in Equation 5:
where a calculation of the steady-state currentiss can be based on a mathematical model, an extrapolation, an average at a predetermined time interval, a combination thereof, or any number of other ways for calculating a steady-state current. Some examples of methods for calculatingiss can be found inU.S. Patent Nos. 5,942,402 and6,413,410 .- Alternatively,iss may be estimated by multiplying the test current value at 5 seconds with a constantK8 (e.g., 0.678). Thus,iss≃ i(5) xK8). The termK8 can be estimated using Equation 6:

where the number 0.975 is about the time in seconds after the third test voltageV3 is applied that corresponds to i(5), which, assuming a linear variation over the time between about 0.95 seconds and 1 second, is the average current between 0.95 and 1 second, the term D is assumed to be about 5 x 10⁻⁶ cm2/sec as a typical diffusion coefficient in blood, and the term L is assumed to be about 0.0095 cm, which represents the height of thespacer 60. - Turning again to Eq. 5,ipc may be the test current value at 4.1 seconds, andipb may be the test current value at 1.1 seconds, based on the test voltage and test current waveforms in
FIGS. 6 and7 . - Turning back to Eq. 4,i2 can be defined to be


Equation 5 can be combined withEquation 4 to yield an equation for determining a more accurate glucose concentration that can compensate for the presence of endogenous and/or exogenous interferents in a blood sample, as shown in Equation 7:
where the first glucose concentrationG1 is the output of the blood glucose algorithm and the terms a,p, andz are constants that can be derived empirically.- If the sample is identified as a CS, the CS glucose algorithm of
step 1824 can be performed on the test current values. A first glucose concentrationG1 for CS can be calculated using Equation 7 above, although the values fora, p, andz for CS can be different than those for blood. - In addition to endogenous interferents, extreme hematocrit levels under certain circumstances can affect the accuracy of a glucose measurement. Thus,
hematocrit correction 1812 can be applied by modifyingG1 to provide a second glucose concentrationG2 that is accurate even if the sample has an extreme hematocrit level (e.g., about 20% or about 60%). - Methods and systems of accurately measuring glucose concentrations in extreme hematocrit samples are provided herein. For example,
FIG. 9 is a flow diagram depicting amethod 2000 for calculating an accurate glucose concentration that accounts for blood samples having an extreme hematocrit level. A user can initiate a test by applying a sample to the test strip, as shown in astep 2001. A first test voltageV1 can be applied for a first time intervalt1, as shown in astep 2002. The resulting test current is then measured for the first time intervalt1, as shown in astep 2004. After the first time intervalt1, the second test voltageV2 is applied for a second time intervalt2, as shown in astep 2006. The resulting test current is then measured for the second time intervalt2, as shown in astep 2008. After the second time intervalt2, the third test voltageV3 is applied for a third time intervalt3, as shown in astep 2010. The resulting test current is then measured for the third time intervalt3, as shown in astep 2012. - Now that test current values have been collected by a test meter, a first glucose concentrationG1 can be calculated, as shown in a
step 2014. The first glucose concentrationG1 can be calculated usingEquations 4 or 7. Next, a hematocrit levelH can be calculated, as shown in astep 2016. - The hematocrit level may be estimated using test current values acquired during the glucose test time intervaltG. Alternatively, the hematocrit levelH may be estimated using test current values acquired during the second time intervalt2 and the third time intervalt3. In one embodiment, the hematocrit levelH can be estimated using a hematocrit equation based upon the first glucose concentrationG1 andi2. An exemplary hematocrit equation is shown in Equation 8:

FIG. 10 shows that the estimated hematocrit levels using Equation 8 has an approximately linear correlation with actual hematocrit levels measured with a reference method. - Once the hematocrit levelH has been calculated in
step 2016, it is compared to a lower predetermined hematocrit levelHL, as shown in astep 2018. The lower predetermined hematocrit levelHL may be about 30%. If the hematocrit levelH is less than lower predetermined hematocrit levelHL, then the first glucose concentrationG1 is compared to an upper predetermined glucose concentrationGU, as shown in astep 2020. The upper predetermined glucose concentrationGU may be about 300 mg/dL. If the hematocrit levelH is not less than lower predetermined hematocrit levelHL, then the hematocrit levelH is compared to an upper predetermined hematocrit levelHU, as shown in astep 2022. The upper predetermined hematocrit levelHU may be about 50%. If the hematocrit levelH is greater thanHU, then the first glucose concentrationG1 is compared to a lower predetermined glucose concentrationGL, as shown in astep 2028. The lower predetermined glucose concentrationGL may be about 100 mg/dL.Steps method 2000 will output first glucose concentrationG1, as shown in astep 2034, if the hematocrit levelH is not less thanHL and not greater thanHU. - A first function can be used to calculate a correction valueCorr, as shown in a
step 2024, if the first glucose concentrationG1 is less than the upper predetermined glucose concentrationGU. The first function may be in the form of Equation 9:
whereK1 is a first constant andHL is the lower predetermined hematocrit level. In one embodimentK1 andHL may be about -0.004 and about 30%, respectively. - However, if the first glucose concentrationG1 is not less than the upper predetermined glucose concentrationGU, then the second function can be used to calculate the correction valueCorr, as shown in a
step 2026. The second function may be in the form of Equation 10:
whereK2 is a second constant andGmax is a predetermined maximun glucose concentration. In one embodimentsK2 andGmax may be about -0.004 and about 600 mg/dL, respectively. The correction valueCorr forEquations 9 and 10 may be restricted to a range of about -5 to about zero. Thus, ifCorr is less than -5, thenCorr is set to -5 and ifCorr is greater than zero, thenCorr is set to zero. - A third function can be used to calculate a correction valueCorr, as shown in a
step 2030, if the first glucose concentrationG1 is less than lower predetermined glucose concentrationGL. The third function may be in the form of Equation 11:
step 2032. The fourth function may be in the form of Equation 12:
whereK4 is fourth constant, which may be about 0.011. The correction valueCorr for Equation 12 may be restricted to a range of about zero to about six. Thus, ifCorr is less than zero, thenCorr is set to zero and ifCorr is greater than six, thenCorr is set to six. - After calculatingCorr with the first function in
step 2024, the first glucose concentration is compared to 100 mg/dL in astep 2036. If the first glucose concentration is less than 100 mg/dL, then the second glucose concentrationG2 is calculated using a first correction equation, as shown in astep 2038. Note that the 100 mg/dL represents a glucose threshold and should not be construed as a limiting number. In one embodiment, the glucose threshold may range from about 70 mg/dL to about 100 mg/dL. The first correction equation may be in the form of Equation 13:
- If the first glucose concentrationG1 is not less than 100 mg/dL based on
step 2036, then the second glucose concentrationG2 is calculated using a second correction equation, as shown in astep 2040. The second correction equation may be in the form of Equation 14:
- After the second glucose concentrationG2 is calculated in either
steps step 2042. - After calculatingCorr in
step step 2040. WhenCorr equals zero (as for the third function), the second glucose concentrationG2 equals the first glucose concentrationG1, which can then be outputted as a glucose reading instep 2042. - The
method 2000 for calculating accurate glucose concentrations in blood samples having extreme hematocrit levels was verified using blood from several donors.FIG. 11 shows a bias plot for a plurality of test strips that were tested with blood samples having a wide range of hematocrit levels and glucose concentrations. More specifically,FIG. 11 shows the effect of whole blood samples having a wide range of hematocrit on the accuracy and precision of the new test system. As shown, the bias of the sensor response with respect to the YSI 2700 (Yellow Springs Instruments, Yellow Springs, Ohio) is plotted against the plasma glucose concentration. The data were obtained with 3 batches of sensors and 4 blood donors. The hematocrit was adjusted to 20% (squares), 37-45% (circles) or 60% (triangles) prior to spiking the samples with glucose. These data suggest that the thin layer cell and tri-pulse approach for electrochemical measurement offers the opportunity for improved analytical performance with blood glucose test systems. Thus, the use of the correction valueCorr, which depends on the hematocrit levelH and the first glucose concentrationG1, allows for the determination of a more accurate second glucose concentrationG2 even if the blood sample has an extreme hematocrit level. - Turning back to
FIG. 8 ,blood temperature correction 1814 can be applied to the test current values to provide a glucose concentration with an improved accuracy because of a reduced effect from temperature. A method for calculating a temperature corrected glucose concentration can include measuring a temperature value and calculating a second correction valueCorr2. The second correction valueCorr2 can be based on a temperature value and either first glucose concentrationG1 or second glucose concentrationG2 glucose concentration, both of which as described previously do not include a correction for temperature. Accordingly, the second correction valueCorr2 can then be used to correct the glucose concentrationG1 orG2 for temperature. FIG. 12 is a flow diagram depicting an embodiment of themethod 1814 of applying a blood temperature correction. Initially, a glucose concentration uncorrected for temperature can be obtained such as first glucose concentrationG1 fromstep 1810 or a second glucose concentrationG2 fromstep 1812. While a blood temperature correction can be applied to eitherG1 orG2, for simplicity the blood temperature correction will be described usingG2.- As shown in a
step 1910 of themethod 1814, a temperature value can be measured. The temperature can be measured using a thermistor or other temperature reading device that is incorporated into a test meter, or by way of any number of other mechanisms or means. Subsequently, a determination can be performed to determine whether the temperature valueT is greater than a first temperature thresholdT1. As illustrated inFIG. 12 , the temperature thresholdT1 is about 15 °C. If the temperature valueT is greater than 15 °C, then a first temperature function can be applied to determine the second correction valueCorr2, as shown in astep 1914. If the temperature valueT is not greater than 15 °C, then a second temperature function can be applied to determine the second correction valueCorr2, as shown in astep 1916. - The first temperature function for calculating the second correction valueCorr2 can be in the form of Equation 15:

whereCorr2 is the correction value,K9 is a ninth constant (e.g., 0.57 for GDH-PQQ and 0.89 for FAD-GDH),T is a temperature value,TRT is a room temperature value (e.g., 22°C),K10 is a tenth constant (e.g., 0.00023 for GDH-PQQ and 0.00077 for FAD-GDH), andG2 is the second glucose concentration. WhenT is about equal toTRT,Corr2 is about zero. In some instances, the first temperature function can be configured to have essentially no correction at room temperature such that variation can be reduced under routine ambient conditions. The second temperature function for calculating the second correction valueCorr2 can be in the form of Equation 16:
- After theCorr2 is calculated using either
step step 1918 and/or astep 1922. In thestep 1918, a determination can be performed to determine whetherCorr2 is greater than 10. IfCorr2 is greater than 10, theCorr2 is set to 10, as shown in astep 1920. IfCorr2 is not greater than 10, then a determination is performed to determine whetherCorr2 is less than -10, as shown in astep 1922.Corr2 can be set to -10 ifCorr2 is less than -10, as shown in astep 1924. IfCorr2 is a value already in between -10 and +10, then there generally is no need for truncation. - OnceCorr2 is determined, a temperature corrected glucose concentration can be calculated using either a
step 1928 or astep 1930. In astep 1926, a determination can be performed to determine whether the glucose concentration uncorrected for temperature (e.g.,G2) is less than 100 mg/dL. IfG2 is less than 100 mg/dL, then an Equation 17 can be used to calculate the temperature corrected glucose concentrationG3 by adding the correction valueCorr2 to the second glucose concentrationG2:
- IfG2 is not less than 100 mg/dL, then an Equation 18 can be used to calculate the temperature corrected glucose concentrationG3 by dividingCorr2 by one hundred, adding one; and then multiplying by the second glucose concentrationG2:

- Once a third glucose concentration is determined that has been corrected for the effects of temperature, the third glucose concentration can be outputted, as shown in a
step 1932. - The
method 1814 for blood temperature correction was verified using blood in a glove box over a temperature range of about 5 °C to 45 °C. The blood samples had a hematocrit range of about 20-50 % hematocrit and a glucose range of about 20-600 mg/dL equivalent plasma glucose concentration. The glove box was an enclosed chamber that could hold a pre-determined constant temperature. The glove portion of the glove box allowed a tester outside of the glove box to perform a glucose test inside the glove box. The tester inserted test strips into a test meter and dose sampled in an environment having both a controlled temperature and relative humidity (RH). The RH was maintained at about 60% in order to keep evaporation of the sample droplets at a relatively low level during the test. Generally the RH should not be too high to prevent condensation from occurring on the test meter. The blood was equilibrated to 37 °C outside the glove box, pipetted onto parafilm, rapidly moved into the glove box, and applied to the strips. This particular method allowed for the simulation of dosing capillary blood off a finger.FIG. 13 shows that temperature has a substantial bias on the blood results when there is no temperature compensation function in the test meters because only about 83.4% of biases were within 15% or 15 mg/dL of the reference glucose value. In contrast, as seen inFIG. 14 , there is much less bias on the blood results when there is a temperature compensation in the test meters because far less biases percentage-wise were located outside of the 15% or 15 mg/dL range of the reference glucose value when compared to the results ofFIG. 13 . FIG. 15 is a flow diagram depicting an embodiment of themethod 1826 of applying a CS temperature correction. The CS temperature correction is similar to the blood temperature correction except that the temperature function for calculatingCorr2 is different.- Initially, a glucose concentration uncorrected for temperature can be obtained such as first glucose concentrationG1 from
step 1824. Next, a temperature value can be measured, as shown in astep 1910. A third temperature function can be applied to determine the second correction valueCorr2 for CS, as shown in astep 1934. The third temperature function for calculating the second correction valueCorr2 can be in the form of Equation 19:
- After theCorr2 is calculated using
step 1934, a couple of truncation functions can be performed to ensure thatCorr2 is constrained to a pre-determined range. In one embodimentCorr2 can be limited to have a range of -10 to +10 by using astep 1918 and/or astep 1922, as shown inFIG. 20 . Instep 1918, a determination can be performed to determine whetherCorr2 is greater than 10. IfCorr2 is greater than 10, theCorr2 can be set to 10, as shown in astep 1920. IfCorr2 is not greater than 10, then a determination can be performed to determine whetherCorr2 is less than -10, as shown in astep 1922.Corr2 can be set to -10 ifCorr2 is less than -10, as shown in astep 1924. - OnceCorr2 is determined, a temperature corrected glucose concentration for CS can be calculated using either a
step 1928 or astep 1930. In astep 1926, a determination can be performed to determine whether the glucose concentration uncorrected for temperature (e.g.,G1) is less than 100 mg/dL. IfG1 is less than 100 mg/dL, then third glucose concentrationG3 can be calculated by addingG1 +Corr2, as shown instep 1928. IfG1 is not less than 100 mg/dL, then third glucose concentrationG3 can be calculated by dividingCorr2 by one hundred, adding one, and then multiplying by the second glucose concentration to give a temperature corrected concentration, as shown instep 1930. Once a third glucose concentration for CS is determined that is corrected for the effects of temperature, the third glucose concentration can be outputted, as shown in astep 1932, to either the next step inmethod 1800 or to errorchecks 1000. - The
method 1826 for CS temperature correction was verified in a glove box over a temperature range of about 5 °C to 45 °C. The relative humidity (RH) was maintained at about 60%.FIG. 16 shows that temperature has a substantial bias on the CS results when there is no temperature compensation function in the meters because a fair amount of the results fall outside of 15% or 15 mg/dL of the reference glucose value. In contrast, as seen inFIG. 17 , there is much less bias on the blood results when there is a temperature compensation in the test meters because none of the results were located outside of the 15% or 15 mg/dL range of the glucose value. - Various embodiments of a method for identifying various system errors, which may include user errors when performing a test, test meter errors, and defective test strips, are also provided. The system can be configured to identify a test utilizing a partial fill or double-fill of a sample chamber. Also, the system can be configured to identify those situation where the sample may be leaking from the sample chamber thereby compromising the integrity of the testing and/or those situations where some portion of system (e.g., the test strip) is damaged.
- For example,
FIG. 18 is a flow diagram depicting an exemplary embodiment of amethod 1000 of identifying system errors in performing an analyte measurement. As shown, a user can initiate a test by applying a sample to a test strip, as shown in astep 1002. After the sample has been dosed, the test meter applies a first test voltageV1 for a first time intervalt1, as shown in astep 1004a. A resulting test current is then measured for the first time intervalt1, as shown in astep 1005a. During the first time intervalt1, the test meter can perform adouble dose check 1006a and a maximumcurrent check 1012a. If either thedouble dose check 1006a or maximumcurrent check 1012a fails, then the test meter will display an error message, as shown in astep 1028. If thedouble dose check 1006a and maximumcurrent check 1012a both pass, then the test meter can apply a second test voltageV2 for a second time intervalt2, as shown in astep 1004b. - A resulting test current is measured for the second time intervalt2, as shown in a
step 1005b. During the application of the second test voltageV2, the test meter can perform asufficient volume check 1030, adouble dose check 1006b, a maximumcurrent check 1012b, and a minimumcurrent check 1014b. If one of thechecks step 1028. If all of thechecks step 1004c. - A resulting test current is measured for the third time intervalt3, as shown in a
step 1005c. During the application of the third test voltageV3, the test meter can perform adouble dose check 1006c, maximumcurrent check 1012c, a minimumcurrent check 1014c, ahigh resistance check 1022c, and asample leakage check 1024c. If all of thechecks step 1026. If one of thechecks step 1028. The following will describe the system checks and how errors can be identified using such system checks. - In the method of the present invention for performing a sufficient volume check, a capacitance measurement is used. The capacitance measurement can measure essentially an ionic double-layer capacitance resulting from the formation of ionic layers at the electrode-liquid interface. A magnitude of the capacitance can be proportional to the area of an electrode coated with sample. Once the magnitude of the capacitance is measured, if the value is greater than a threshold and thus the test strip has a sufficient volume of liquid for an accurate measurement, a glucose concentration can be outputted, but if the value is not greater than a threshold and thus the test strip has an insufficient volume of liquid for an accurate measurement, then an error message can be outputted.
- By way of non-limiting example, methods and mechanisms for performing capacitance measurements on test strips can be found in
U.S. Patents Nos. 7,195,704 and7,199,594 . In one method for measuring capacitance, a test voltage having a constant component and an oscillating component is applied to the test strip. In such an instance, the resulting test current can be mathematically processed, as described in further detail below, to determine a capacitance value. - Generally, when a limiting test current occurs at a working electrode having a well-defined area (i.e., an area not changing during the capacitance measurement), the most accurate and precise capacitance measurements in an electrochemical test strip can be performed. A well-defined electrode area that does not change with time can occur when there is a tight seal between the electrode and the spacer. The test current is relatively constant when the current is not changing rapidly due either to glucose oxidation or electrochemical decay. Alternatively, any period of time when an increase in signal, which would be seen due to glucose oxidation, is effectively balanced by a decrease in signal, which accompanies electrochemical decay, can also be an appropriate time interval for measuring capacitance.
- An area of first electrode 166 can potentially change with time after dosing with the sample if the sample seeps in between the
spacer 60 and the first electrode 166. In an embodiment of a test strip,reagent layer 72 can have an area larger than the cutout area 68 that causes a portion of thereagent layer 72 to be in between thespacer 60 and thefirst electrode layer 66. Under certain circumstances, interposing a portion of thereagent layer 72 in between thespacer 60 and thefirst electrode layer 66 can allow the wetted electrode area to increase during a test. As a result, a leakage can occur during a test that causes the area of the first electrode to increase with time, which in turn can distort a capacitance measurement. - In contrast, an area of
second electrode 164 can be more stable with time compared to the first electrode 166 because there is no reagent layer in between thesecond electrode 164 and thespacer 60. Thus, the sample is less likely to seep in between thespacer 60 and thesecond electrode 164. A capacitance measurement that uses a limiting test current at thesecond electrode 164 can thus be more precise because the area does not change during the test. - Referring back to
FIG. 6 , once liquid is detected in the test strip, a first test voltageV1 (e.g., -20 mV) can be applied between the electrodes for about 1 second to monitor the fill behavior of the liquid and to distinguish between control solution and blood. InEquation 1, the test currents are used from about 0.05 to 1 second. This first test voltageV1 can be relatively low (i.e., the test voltage is similar in magnitude to the redox potential of the mediator) such that the distribution of ferrocyanide in the cell is disturbed as little as possible by the electrochemical reactions occurring at the first and second electrodes. - A second test voltageV2 (e.g., -300 mV) having a larger absolute magnitude can be applied after the first test voltageV1 such that a limiting current can be measured at the
second electrode 164. The second test voltageV2 can include an AC voltage component and a DC voltage component. The AC voltage component can be applied at a predetermined amount of time after the application of the second test voltageV2, and further, can be a sine wave having a frequency of about 109 Hertz and an amplitude of about +/-50 millivolts. In a preferred embodiment, the predetermined amount of time can range from about 0.3 seconds to about 0.4 seconds after the application of the second test voltageV2. Alternatively, the predetermined amount of time can be a time where a test current transient as a function of time has a slope of about zero. In another embodiment, the predetermined amount of time can be a time required for a peak current value (e.g.,ipb) to decay by about 50%. As for the DC voltage, it can be applied at a beginning of the first test voltage. The DC voltage component can have a magnitude sufficient to cause a limiting test current at the second electrode such as, for example, about -0.3 volts with respect to the second electrode. - Consistent with
FIG. 4B , thereagent layer 72 is not coated onto thesecond electrode 164, which causes the magnitude of the absolute peak currentipb to be relatively low compared to the magnitude of the absolute peak currentipc. Thereagent layer 72 can be configured to generate a reduced mediator in a presence of an analyte, and the amount of the reduced mediator proximate to first electrode can contribute to the relatively high absolute peak currentipc. In one embodiment at least the enzyme portion of thereagent layer 72 can be configured to not substantially diffuse from the first electrode to the second electrode when a sample is introduced into the test strip. - The test currents afteripb tends to settle to a flat region at approximately 1.3 seconds, and then the current increases again as the reduced mediator generated at the first electrode 166, which can be coated with the
reagent layer 72, diffuses to thesecond electrode 164, which is not coated with thereagent layer 72. Generally, the glucose algorithm requires test current values both before and after the test interval of about 1.3 to about 1.4 seconds. For example,ipb is measured at 1.1 seconds in Equation 7and test currents are measured at 1.4 seconds onwards for
- In one embodiment, a capacitance measurement can be performed at a relatively flat region of the test current values, which can be performed at about 1.3 seconds to about 1.4 seconds. Generally, if the capacitance is measured before 1 second, then the capacitance measurement can interfere with the relatively low first test voltageV1 that can be used in the CS/
blood discrimination test 1806. For example, an oscillating voltage component on the order of +/- 50 mV superimposed onto a -20 mV constant voltage component can cause significant perturbation of the measured test current. Not only does the oscillating voltage component interfere with the first test voltageV1, but it can also significantly perturb the test currents measured after 1.4 seconds, which in turn can interfere with theblood glucose algorithm 1810. Following a great deal of testing and experimentation, it was finally determined that, surprisingly, measuring the capacitance at about 1.3 seconds to about 1.4 seconds resulted in accurate and precise measurements that did not interfere with the CS/blood discrimination test or the glucose algorithm. - After the second test voltageV2, the third test voltageV3 (e.g., +300 mV) can be applied causing the test current to be measured at the first electrode 166, which can be coated with the
reagent layer 72. The presence of a reagent layer on the first electrode can allow penetration of liquid between the spacer layer and the electrode layer, which can cause the electrode area to increase. - As illustrated in
FIG. 6 , in an exemplary embodiment a 109 Hz AC test voltage (±50 mV peak-to-peak) can be applied for 2 cycles during the time intervaltcap. The first cycle can be used as a conditioning pulse and the second cycle can be used to determine the capacitance. The capacitance estimate can be obtained by summing the test current over a portion of the alternating current (AC) wave, subtracting the direct current (DC) offset, and normalizing the result using the AC test voltage amplitude and the AC frequency. This calculation provides a measure of the capacitance of the strip, which is dominated by the strip sample chamber when it is filled with a sample. - In one embodiment the capacitance can be measured by summing the test current over one quarter of the AC wavelength on either side of the point in time where the input AC voltage crosses the DC offset, i.e. when the AC component of the input voltage is zero (the zero crossing point). A derivation of how this translates to a measure of the capacitance is described in further detail below.
Equation 20 can show the test current magnitude as a function of time during the time intervaltcap:


whereR is the real part of the impedance andC is the capacitance. Equation 20 can be integrated from one quarter wavelength before the zero crossing point to one quarter wavelength after the zero crossing point to yield Equation 23:
which can be simplified to Equation 24:
- By substituting Eq. 21 into Eq. 20, then into Eq. 23, and then rearranging, Equation 25 results:

- The integral term in Equation 25 can be approximated using a sum of currents shown in an Equation 26:


in which the DC offset currentio can be obtained by averaging the test currentbover one full sine cycle around the zero crossing point. - In another embodiment, the capacitance measurements can be obtained by summing the currents not around the voltage zero crossing point, but rather around the maximum AC component of the current. Thus, in Equation 26, rather than sum a quarter wavelength on either side of the voltage zero crossing point, the test current can be summed a quarter wavelength around the current maximum. This is tantamount to assuming that the circuit element responding to the AC excitation is a pure capacitor, soφ is π/2. Thus, Equation 24 can be reduced to Equation 28:

- In one exemplary embodiment the microprocessor of the test meter can have a heavy load with calculating the glucose concentration. In such an instance, because the capacitance data acquisition needs to be made part way through the test rather than at its beginning, it can be necessary to defer the processing of the capacitance measurement data until after the determination of the glucose concentration is completed. Thus, once the glucose measurement part of the test is completed, the capacitance can be calculated, and if the capacitance is below a pre-determined threshold, a partial fill error can be flagged.
- Under certain circumstances the capacitance measurement can depend on the environmental temperature. To measure capacitance in an accurate and precise manner for determining electrode fill volumes, the effect of temperature can be reduced using a temperature correction for blood as shown in Equation 29:

- The effect of temperature can be removed using a temperature correction for CS as shown in Equation 30:

Equations 29 and 30 can be used for identifying partially filled test strips. - As illustrated by Table 1 below, a different temperature-corrected capacitance threshold value will be required for blood and control solution. The threshold should generally be set four (4) standard deviation units below the mean. Statistically this equates to a 99.994% certainty that no complete fill will be identified as a partial fill. The temperature-corrected capacitance threshold value for blood will be about 450 nF, and the corresponding value for control solution will be about 560 nF. These values can be programmed into a memory portion of the test meters. In an alternative embodiment, the threshold value can be adjusted by the operator depending on the intended use.
Table 1 - Temperature-corrected capacitance values for complete fills Parameter All bloods results All CS results Mean capacitance (nF) 515 664 SD (nF) 16 27 Mean -4*SD (nF) 451 556 - The chart of
FIG. 19 shows a correlation of capacitance and bias to a reference glucose measurement (YSI, Yellow Springs Instrument). The measured glucose concentrations were converted to a bias by comparing it to a glucose measurement performed with a reference instrument. Several test strips were filled with various volumes of blood, and the capacitance and glucose concentrations were measured with the test voltage waveform ofFIG. 6 . More particularly, the capacitance was measured during the third test voltage V3 where the test current is relatively large and decreases rapidly with time. Additionally, the capacitance measurements were performed where the limiting test current occurs on the first electrode, which has a reagent layer coating. - If it is assumed that the main contributor to the bias to YSI is caused by the percentage partial coverage of the electrodes with liquid, then the capacitance values should form a straight line with relatively little scatter when correlated to the YSI bias. For example, a 50% negative bias to YSI should correspond to a 50% decrease in capacitance compared to a fully-filled test strip. Thus, if it is also assumed that the strip-to-strip variation in bias is relatively small, then the relatively large scatter of data points in
FIG 19 can be ascribed to a relatively large variation in the capacitance measurements. It was found that capacitance variation was caused by performing the capacitance measurement during the third test voltage where the test current values are generally not relatively constant. - A relatively large scatter in the capacitance measurements could cause a significant number of fully-filled test strips to be rejected. Further, a large capacitance variation can cause some capacitance measurements to be biased low, and thus, be below a sufficiently filled threshold resulting in a falsely identified partial fill.
- The chart of
FIG. 20 shows a correlation of capacitance (measured at about 1.3 seconds) and bias to a reference glucose measurement (YSI, Yellow Springs Instrument). Several test strips were filled with various volumes of blood, and the capacitance and glucose concentrations were measured with the test voltage waveform ofFIG. 6 . More particularly, the capacitance was measured during the second test voltage V2 where the test current is relatively constant. In addition, the capacitance measurement was performed where the limiting test current occurs on the second electrode, which did not have a reagent layer coating. In contrast toFIG. 19 , the data inFIG. 20 shows that the capacitance values are less scattered. - The chart of
FIG. 21 shows a correlation of capacitance (measured at about 1.3 seconds) and bias to a reference glucose measurement (YSI, Yellow Springs Instrument). Several test strips were filled with various volumes of CS, and the capacitance and glucose concentrations were measured with the test voltage waveform ofFIG. 6 . Similar toFIG. 20 , the data inFIG. 21 shows that the capacitance values have a relatively low amount of variation when performed during this time interval. - A double dose occurs when a user applies an insufficient volume of blood to a sample-receiving chamber and then applies a subsequent bolus of blood to further fill the sample-receiving chamber. An insufficient volume of blood expressed on a user's fingertip or a shaky finger can cause the occurrence of a double-dosing event. The currently disclosed system and method can be configured to identify such double-fill events. For example,
FIG. 22 shows a test current transient where a user performed a double-dosing event during the second test time intervalt2 that caused a spike to be observed (see solid line). When there is no double-dosing event, the test current transient does not have a peak (see dotted line ofFIG. 22 ). - A double-dosing event can cause a glucose test to have an inaccurate reading. Thus, it is usually desirable to identify a double-dosing event and then have the meter output an error message instead of outputting a potentially inaccurate reading. A double-dosing event initially causes the measured test current to be low in magnitude because the electrode area is effectively decreased when only a portion is wetted with sample. Once the user applies the second dose, a current spike will occur because of a sudden increase in the effective electrode area and also because turbulence causes more reduced mediator to be transported close to the working electrode. In addition, less ferrocyanide will be generated because a portion of the reagent layer is not wetted by sample for the entire test time. Thus, an inaccurate glucose reading can result if a test current value used in the glucose algorithm is depressed or elevated as a result of the double-dosing.
- A method of identifying a double-dosing event (1006a, 1006b, or 1006c) may include measuring a second test current and a third test current where the second test current occurs before the third test current. An equation may be used to identify double-dosing events based on a difference between the absolute value of the third test current and the absolute value of the second test current. If the difference is greater than a predetermined threshold, the test meter may output an error message indicative of a double-dosing event. The method of identifying the double-dosing event may be performed multiple times in serial manner as the test current values are collected by the test meter. The equation can be in the form of Equation 31 for calculating a difference valueZ2 for determining whether a double-dosing event had occurred:

test strip 100 and with the test voltage waveform ofFIG. 6 where working electrode and reference electrode both have an area of about 0.042 cm2 and a distance between the two electrodes ranging from about 90 microns to about 100 microns. It should be obvious to one skilled in the art that such predetermined thresholds may change based on the test strip design, the test voltage waveform, and other factors. - In another embodiment for identifying a double-dosing event (e.g., 1006a, 1006b, or 1006c), a method may include measuring a first test current, a second test current, and third test current where the first test current occurs before the second test current and the third test current occurs after the second test current. An equation may be used to identify double-dosing events based on two times the absolute value of the second test current minus the absolute value of first test current and minus the absolute value of the third test current. The equation may be in the form of Equation 32 for calculating a summation valueY for determining whether a double-dosing event had occurred:

wherei(t) is a second the current,i(t-x) is a first test current,i(t+x) is a third test current,t is a time for the second test current, andx is an increment of time in between measurements, andabs represents an absolute function. If the summation valueY is greater than a predetermined threshold, then the test meter may output an error message due to a double-dosing event. The predetermined threshold may be set to a different value for the first time intervalt1, second time intervalt2, and third time intervalt3. - In one embodiment the predetermined threshold may be about two (2) microamperes for the first time intervalt1, about two (2) microamperes for the second time intervalt2, and about three (3) microamperes for the third time intervalt3. The predetermined thresholds may be adjusted as a result of the following factors such as noise in the test meter, frequency of test current measurements, the area of the electrodes, the distance between the electrodes, the probability of a false positive identification of a double-dosing event, and the probability of a false negative identification of a double-dosing event. The method of identifying the double-dosing event using Equation 32 can be performed for multiple portions of the test current transient. It should be noted that Equation 32 can be more accurate than Equation 31 for identifying double-dosing events because the first test current and third test current provide a baseline correction. When using the test voltage waveform of
FIG. 6 , the double-dosing check can be performed at a time period just after the beginning of the first, second, and third time intervals because a peak typically occurs at the beginning of the time intervals. For example, the test currents measured at zero seconds to about 0.3, 1.05, and 4.05 seconds should be excluded from the double-dosing check. - As referred to in
steps FIG. 18 , a maximum current check can be used to identify a test meter error or a test strip defect. An example of a test meter error occurs when the blood is detected late after it is dosed. An example of a defective test strip occurs when the first and second electrode are shorted together.FIG. 23 shows a test current transient where the test meter did not immediately detect the dosing of blood into the test strip (see solid line). In such a scenario, a late start will generate a significant amount of ferrocyanide before the second test voltageV2 is applied causing a relatively large test current value to be observed. In contrast, when the test meter properly initiates the test voltage waveform once blood is applied, the test current values for the second time interval are much smaller, as illustrated by the dotted line inFIG. 23 . - A late start event can cause an inaccurate glucose reading. Thus, it would be desirable to identify a late start event and then have the meter output an error message instead of outputting an inaccurate reading. A late start event causes the measured test current to be larger in magnitude because there is more time for the reagent layer to generate ferrocyanide. Thus, the increased test current values will likely distort the accuracy of the glucose concentration.
- In addition to a test meter error, a short between the first and second electrode can cause the test current to increase. The magnitude of this increase depends on the magnitude of the shunting resistance between the first and second electrode. If the shunting resistance is relatively low, a relatively large positive bias will be added to the test current causing a potentially inaccurate glucose response.
- Maximum current check (1012a, 1012b, and 1012c) can be performed by comparing the absolute value of all of the measured test current values to a predetermined threshold and outputting an error message if the absolute value of one of the measured test current values is greater than the predetermined threshold. The predetermined threshold can be set to a different value for the first, second, and third test time intervals (t1,t2, andt3). In one embodiment, the predetermined threshold may be about 50 microamperes for the first time intervalt1, about 300 microamperes for the second time intervalt2, and about 3000 microamperes for the third time intervalt3.
- As referred to in
steps FIG. 18 , a minimum current check can be used to identify a false start of a glucose test, an improper time shift by a test meter, and a premature test strip removal. A false start can occur when the test meter initiates a glucose test even though no sample has been applied to the test strip. Examples of situations that can cause a test meter to inadvertently initiate a test are an electrostatic discharge event (ESD) or a temporary short between first and second electrodes. Such events can cause a relatively large current to be observed for a least a short moment in time that initiates a test even though no liquid sample has been introduced into the test strip. - An inadvertent initiation of a glucose test can cause a test meter to output a low glucose concentration even though no sample has yet been applied to the test strip. Thus, it would be desirable to identify an inadvertent initiation of a glucose test so that the test meter does not output a falsely low glucose reading. Instead, the test meter should provide an error message that instructs the user to re-insert the same test strip or to insert a new test strip for performing the test again.
- A time shifting error by the test meter can occur when the third test voltageV3 is applied early or late. An early application of the third test voltageV3 should cause the test current value at the end of the second time intervalt2 to be a relatively large current value with a positive polarity instead of a relatively small current value with a negative polarity. A late application of the third test voltageV3 should cause the test current value at the beginning of the third time interval to be a relatively small current value with a negative polarity instead of a relatively large current value with a positive polarity. For both the early and late application of the third test voltageV3, there is a possibility of causing an inaccurate glucose result. Therefore, it would be desirable to identify a time shifting error by the test meter using the minimum current check so that an inaccurate glucose reading does not occur.
- A premature removal of a test strip from the test meter before the end of a glucose test can also cause an inaccurate glucose reading to occur. A test strip removal would cause the test current to change to a value close to zero potentially causing an inaccurate glucose output. Accordingly, it would also be desirable to identify a premature strip removal using a minimum current check so that an error message can be provided instead of displaying an inaccurate glucose reading.
- The minimum current check may be performed by comparing the absolute value of all of the measured test current values during the second and third time intervals (t2 andt3) to a predetermined threshold and outputting an error message if the absolute value of one of the measured test current values is less than a predetermined threshold. The predetermined threshold may be set to a different value for the second and third test time intervals. However, in one embodiment, the predetermined threshold may be about 1 microampere for the first time intervalt1 and the second time intervalt2. Note that the minimum current check was not performed for the first time interval because the test current values are relatively small because the first test voltageV1 is close in magnitude to the redox potential of the mediator.
- As referred to in
step 1022c ofFIG. 18 , a high resistance track can be detected on a test strip that can result in an inaccurate glucose reading. A high resistance track can occur on a test strip that has an insulating scratch or a fouled electrode surface. For the situation in which the electrode layers are made from a sputtered gold film or sputtered palladium film, scratches can easily occur during the handling and manufacture of the test strip. For example, a scratch that runs from onelateral edge 56 to anotherlateral edge 58 onfirst electrode layer 66 can cause an increased resistance betweenfirst contact pads 67 and first electrode 166. Sputtered metal films tend to be very thin (e.g., 10 to 50 nm) making them prone to scratches during the handling and manufacture of the test strip. In addition, sputtered metal films can be fouled by exposure to volatile compounds such as hydrocarbons. This exposure causes an insulating film to form on the surface of the electrode, which increases the resistance. Another scenario that can cause a high resistance track is when the sputtered metal film is too thin (e.g., <<10 nm). Yet another scenario that can cause a high resistance track is when the test meter connectors do not form a sufficiently conductive contact to the test strip contact pads. For example, the presence of dried blood on the test meter connectors can prevent a sufficiently conductive contact to the test strip contact pads. FIG. 24 shows two test current transients during a third time intervalt3 for a test strip having a high resistance track (squares) and a low resistance track (triangles). A sufficiently high track resistanceR that is between the electrode and the electrode contact pad can substantially attenuate the magnitude of the effectively applied test voltageVeff, which in turn can attenuate the magnitude of the resulting test current. The effective test voltageVeff can be described by Equation 33:
- Generally,Veff will be the most attenuated at the beginning of the third time intervalt3 where the test current will generally have the highest magnitude. The combination of a relatively largeR and a relatively large test current at the beginning of the third time intervalt3 can cause a significant attenuation in the applied test voltage. In turn, this could cause an attenuation of the resulting test current at the beginning of the third time intervalt3, as illustrated in
FIG. 24 at t=4.05 seconds. Such attenuation in the peak current immediately at about 4.05 seconds can cause the calculated glucose concentration to be inaccurate. In order to avoid significant attenuation in the applied test voltage,R should be a relatively small value (i.e., low track resistance). In one embodiment, a low resistance track may be represented by an electrode layer having a resistivity of less than about 12 ohms per square and a high resistance track may be represented by an electrode layer having a resistivity of greater than about 40 ohms per square. - A determination of whether a test strip has a high track resistance can use an equation based on a first test currenti1 and a second test currenti2 that both occur during the third time intervalt3. The first test currenti1 may be measured at about a beginning of the third time intervalt3 (e.g., 4.05 seconds) where the magnitude is at a maximum or close to the maximum. The second test currenti2 may be measured at about an end of the third time intervalt3 (e.g., 5 seconds) where the magnitude is at the minimum or close to the minimum.
- The equation for identifying a high track resistance may be in the form of Equation 34:

- If first ratioR1 is greater than a predetermined threshold, then the test meter may output an error message due to the test strip having a high resistance track. The predetermined threshold may be about 1.2. It is significant that the first test currenti1 is about a maximum current value because it is the most sensitive to resistance variations according to Equation 33. If a first test currenti1 is measured at a time that was closer to the minimum current value, then Equation 34 would be less sensitive for determining whether a high resistance track was present. It is advantageous to have relatively low variation in the first ratioR1 when testing low resistance test strips. The relatively low variation decreases the likelihood of mistakenly identifying a high resistance track test strip. As determined and described herein, the variation of first ratioR1 values for test strips having a low resistance track is about four times lower when a first test current valuei1 was defined as a current value immediately after the application of the third test voltageV3, as opposed to being a sum of current values during the third time intervalt3. When there is a high variation in first ratioR1 values for low resistance test strips, the probability of mistakenly identifying a high resistance track increases.
FIG. 25 is a chart showing a plurality ofR1 values calculated with Equation 34 for two test strip lots where one lot has a high resistance track and the other lot has a low resistance track. One lot of test strip was purposely manufactured with a high resistance track by using palladium electrodes that were purposely fouled by an exposure to gas containing hydrocarbons for several weeks. The second test strip lot was manufactured without purposely fouling the electrode surface. To prevent fouling, a roll of sputtered coated palladium was coated with MESA before coating with the reagent layer. All of the low resistance test strips, which were not fouled, hadR1 values of less than 1.1 indicating that Equation 34 could identify low track resistance test strips. Similarly, essentially all of the high resistance test strips, which were purposely fouled, hadR1 values of greater than 1.1 indicating that Equation 34 could identify high track resistance test strips.- As previously referred to in
step 1024c inFIG. 18 , a leakage can be detected on a test strip when thespacer 60 does not form a sufficiently strong liquid impermeable seal with thefirst electrode layer 66. A leakage occurs when liquid seeps in between thespacer 60 and the first electrode 166 and/or thesecond electrode 164. Note thatFIG. 4B shows areagent layer 72 that is immediately adjacent to the walls of thespacer 60. However, in another embodiment (not shown) where leakage is more likely to occur, thereagent layer 72 can be have an area larger than the cutout area 68 that causes a portion of thereagent layer 72 to be in between thespacer 60 and thefirst electrode layer 66. Under certain circumstances, interposing a portion of thereagent layer 72 in between thespacer 60 and thefirst electrode layer 66 can prevent the formation of a liquid impermeable seal. As a result, a leakage can occur which creates an effectively larger area on either the first electrode 166, which in turn, can cause an inaccurate glucose reading. An asymmetry in area between the first electrode 166 and thesecond electrode 164 can distort the test current transient where an extra hump appears during the third time intervalt3, as illustrated inFIG. 26 . FIG. 16 shows test current transients during a third time intervalt3 for three different types of test strip lots where test strip lot 1 (squares) has a leakage of liquid between the spacer and the first electrode.Test strip lot 1 was constructed using a dryer setting that did not sufficiently dry the reagent layer and also was laminated with a pressure setting that was not sufficient to form a liquid impermeable seal to the electrodes. Normally, the reagent layer is sufficiently dried so that an adhesive portion of thespacer 60 can intermingle with the reagent layer and still form a liquid impermeable seal to the first electrode layer 166. In addition, sufficient pressure must be applied so that the adhesive portion of thespacer 60 can form the liquid impermeable seal to the first electrode layer 166. Thetest strip lot 2 was prepared similarly totest strip lot 1 except that they were stored at about 37 degrees Celsius for about two weeks. The storage of thetest strip lot 2 caused the spacer to reform creating a liquid impermeable seal to the electrodes.Test strip lot 3 was constructed using a dryer setting that was sufficient to dry the reagent layer and also was laminated with a pressure setting sufficient to form a liquid impermeable seal. Bothtest strip lots 2 and 3 (triangles and circles respectively) show a more rapid decay in the test current magnitude with time compared to test strip 1 (squares), as illustrated inFIG. 26 .- A determination of whether a test strip leaks can be performed using an equation based on a first test current, a second test current, a third test current, and a fourth test current that occur during the third test time interval. A first logarithm of a second ratio can be calculated based on a first test currenti1 and a second test currenti2. A second logarithm of a third ratio can be calculated based on a third test currenti3 and a fourth test currenti4. An equation may be used to calculate a fourth ratioR4 based on the first logarithm and the second logarithm. If the fourth ratioR4 is less than a predetermined ratio, then the test meter will output an error message due to leakage. The predetermined threshold may range from about 0.95 to about 1. The equation for identifying leakage can be in the form of Equation 35:

- In one embodiment, the first test currenti1 and the second testi2 current may be about the two largest current values occurring the third time intervalt3, the fourth test currenti4 may be a smallest current value occurring the third time intervalt3, and the third test currenti3 may be selected at a third test time so that a difference between the fourth test time and a third test time is greater than a difference between a second test time and a first test time. In one illustrative embodiment, the first test current, the second test current, the third test current, and the fourth test current may be measured at about 4.1 seconds, 4.2 seconds, 4.5 seconds, and 5 seconds, respectively.
FIG. 27 is a chart showing a plurality ofR4 values calculated with Equation 35 for the three test strip lots described forFIG. 26 . Accordingly,test strip lot 1 has fourth ratio values less than one and bothtest strip lots - In an alternative embodiment, a determination of whether a test strip has a leakage can be performed using an equation based on only three test current values instead of using four test current values as shown in Equation 35. The three test current values may include a first test currenti1, a third test currenti3, and a fourth test currenti4 that all occur during the third test time intervalt3. A third logarithm of a fifth ratio may be calculated based on the first test currenti1 and the third test currenti3. A second logarithm of a third ratio may be calculated based on the third test currenti3 and the fourth test currenti4. An equation may be used to calculate a sixth ratioR6 based on the third logarithm and the second logarithm. IfR6 is less than a predetermined ratio, then the test meter will output an error message due to leakage. The equation for identifying leakage may be in the form of Equation 36:


Claims (19)
- A method for determining whether a test chamber (61) of a strip is sufficiently filled with a sample, the method comprising:applying a first test voltage between a first electrode (166) and a second electrode (164) of a test strip, the first test voltage having an alternating current (AC) voltage component and a direct current (DC) voltage component, the AC voltage component being applied at a predetermined amount of time after the application of the first test voltage, the DC voltage component having a magnitude sufficient to cause a limiting test current at the second electrode (164), the second electrode (164) not having a reagent layer (72) coating;processing a portion of the limiting test currents resulting from the AC voltage component into a capacitance value representative of a magnitude of a volume of the sample in the test chamber (61); anddetermining if the test chamber (61) is sufficiently filled with the sample by comparing the capacitance value to a predetermined threshold.
- The method of claim 1, in which the predetermined amount of time ranges from 0.3 seconds to 0.4 seconds after the application of the first test voltage.
- The method of claim 1, in which the predetermined amount of time comprises a time where a current transient as a function of time has a slope of about zero.
- The method of claim 1, in which the predetermined amount of time comprises a time required for a peak-current value to decay by about 50%.
- The method of any one of claims 1 to 4, in which the limiting test current comprises a limiting oxidation current where substantially all of a reduced mediator has been depleted at a surface of the second working electrode (164).
- The method of any one of claims 1 to 5, in which a magnitude of the first test voltage is sufficient to oxidize a reduced mediator at the second electrode (164).
- The method of any one of claims 1 to 6, in which the DC voltage component is applied at a beginning of the first test voltage.
- The method of any one of claims 1 to 7, in which the DC voltage component is about -0.3 volts with respect to the second electrode (164).
- The method of any one of claims 1 to 8, in which the AC voltage component comprises a sine wave having a frequency of about 109 Hertz and an amplitude of about +/-50 millivolts.
- The method of any one of claims 1 to 9, in which the reagent layer (72) coating comprises a reagent disposed on the first electrode (166).
- The method of claim 10, in which the reagent layer (72) is configured to generate reduced mediator in a presence of an analyte.
- The method of claim 11, in which the reagent layer (72) includes a mediator and an enzyme where the enzyme does not substantially diffuse from the first electrode (166) to the second electrode (164) when sample including glucose is introduced into the strip.
- The method of any one of claims 1 to 12, in which the first electrode (166) and the second electrode (164) are in an opposing face format.
- The method of any one of claims 1 to 13, wherein determining if the test chamber (61) is sufficiently filled further comprises determining that the chamber (61) is sufficiently filled with the sample including glucose if the capacitance value is greater than the predetermined threshold.
- The method of any one of claims 1 to 14, wherein determining if the test chamber (61) is sufficiently filled further comprises determining that the chamber (61) is not sufficiently filled with the sample including glucose if the capacitance is less than the predetermined threshold.
- The method of any one of claims 1 to 15, in which a portion of the limiting test currents, resulting from the AC voltage component and the DC voltage component, are summed between a ¼ wavelength before and a ¼ wavelength after a zero voltage crossing point.
- The method of any one of claims 1 to 15, in which a portion of the limiting test currents, resulting from the AC voltage component and the DC voltage component, are summed between a ¼ wavelength before and a ¼ wavelength after about a maximum AC component.
- The method of any one of claims 1 to 17, wherein prior to processing the portion of the limiting test currents, a glucose concentration level of the sample including glucose is determined.
- The method of any one of claims 1 to 18, further including correcting the capacitance value for temperature effects.
Applications Claiming Priority (3)
| Application Number | Priority Date | Filing Date | Title |
|---|---|---|---|
| US13157208P | 2008-06-09 | 2008-06-09 | |
| US12/464,935US8551320B2 (en) | 2008-06-09 | 2009-05-13 | System and method for measuring an analyte in a sample |
| EP09251507.1AEP2138841B8 (en) | 2008-06-09 | 2009-06-08 | System and method for measuring an analyte in a sample |
Related Parent Applications (3)
| Application Number | Title | Priority Date | Filing Date |
|---|---|---|---|
| EP09251507.1ADivisionEP2138841B8 (en) | 2008-06-09 | 2009-06-08 | System and method for measuring an analyte in a sample |
| EP09251507.1ADivision-IntoEP2138841B8 (en) | 2008-06-09 | 2009-06-08 | System and method for measuring an analyte in a sample |
| EP09251507.1Division | 2009-06-08 |
Publications (2)
| Publication Number | Publication Date |
|---|---|
| EP2482069A1 EP2482069A1 (en) | 2012-08-01 |
| EP2482069B1true EP2482069B1 (en) | 2014-05-14 |
Family
ID=41327300
Family Applications (2)
| Application Number | Title | Priority Date | Filing Date |
|---|---|---|---|
| EP12164561.8AActiveEP2482069B1 (en) | 2008-06-09 | 2009-06-08 | Method for checking whether a test strip is sufficiently filled |
| EP09251507.1AActiveEP2138841B8 (en) | 2008-06-09 | 2009-06-08 | System and method for measuring an analyte in a sample |
Family Applications After (1)
| Application Number | Title | Priority Date | Filing Date |
|---|---|---|---|
| EP09251507.1AActiveEP2138841B8 (en) | 2008-06-09 | 2009-06-08 | System and method for measuring an analyte in a sample |
Country Status (6)
| Country | Link |
|---|---|
| US (2) | US8551320B2 (en) |
| EP (2) | EP2482069B1 (en) |
| JP (4) | JP5237201B2 (en) |
| AU (2) | AU2009202200B2 (en) |
| CA (1) | CA2668237C (en) |
| ES (2) | ES2647238T3 (en) |
Families Citing this family (135)
| Publication number | Priority date | Publication date | Assignee | Title |
|---|---|---|---|---|
| US6391005B1 (en) | 1998-03-30 | 2002-05-21 | Agilent Technologies, Inc. | Apparatus and method for penetration with shaft having a sensor for sensing penetration depth |
| US8641644B2 (en) | 2000-11-21 | 2014-02-04 | Sanofi-Aventis Deutschland Gmbh | Blood testing apparatus having a rotatable cartridge with multiple lancing elements and testing means |
| US7981056B2 (en) | 2002-04-19 | 2011-07-19 | Pelikan Technologies, Inc. | Methods and apparatus for lancet actuation |
| US8337419B2 (en) | 2002-04-19 | 2012-12-25 | Sanofi-Aventis Deutschland Gmbh | Tissue penetration device |
| US9795747B2 (en) | 2010-06-02 | 2017-10-24 | Sanofi-Aventis Deutschland Gmbh | Methods and apparatus for lancet actuation |
| US7041068B2 (en) | 2001-06-12 | 2006-05-09 | Pelikan Technologies, Inc. | Sampling module device and method |
| US9427532B2 (en) | 2001-06-12 | 2016-08-30 | Sanofi-Aventis Deutschland Gmbh | Tissue penetration device |
| EP1395185B1 (en) | 2001-06-12 | 2010-10-27 | Pelikan Technologies Inc. | Electric lancet actuator |
| JP4209767B2 (en) | 2001-06-12 | 2009-01-14 | ペリカン テクノロジーズ インコーポレイテッド | Self-optimized cutting instrument with adaptive means for temporary changes in skin properties |
| US7749174B2 (en) | 2001-06-12 | 2010-07-06 | Pelikan Technologies, Inc. | Method and apparatus for lancet launching device intergrated onto a blood-sampling cartridge |
| US7344507B2 (en) | 2002-04-19 | 2008-03-18 | Pelikan Technologies, Inc. | Method and apparatus for lancet actuation |
| US9226699B2 (en) | 2002-04-19 | 2016-01-05 | Sanofi-Aventis Deutschland Gmbh | Body fluid sampling module with a continuous compression tissue interface surface |
| US7004928B2 (en) | 2002-02-08 | 2006-02-28 | Rosedale Medical, Inc. | Autonomous, ambulatory analyte monitor or drug delivery device |
| US7976476B2 (en) | 2002-04-19 | 2011-07-12 | Pelikan Technologies, Inc. | Device and method for variable speed lancet |
| US9314194B2 (en) | 2002-04-19 | 2016-04-19 | Sanofi-Aventis Deutschland Gmbh | Tissue penetration device |
| US7297122B2 (en) | 2002-04-19 | 2007-11-20 | Pelikan Technologies, Inc. | Method and apparatus for penetrating tissue |
| US7331931B2 (en) | 2002-04-19 | 2008-02-19 | Pelikan Technologies, Inc. | Method and apparatus for penetrating tissue |
| US7674232B2 (en) | 2002-04-19 | 2010-03-09 | Pelikan Technologies, Inc. | Method and apparatus for penetrating tissue |
| US7547287B2 (en) | 2002-04-19 | 2009-06-16 | Pelikan Technologies, Inc. | Method and apparatus for penetrating tissue |
| US7491178B2 (en) | 2002-04-19 | 2009-02-17 | Pelikan Technologies, Inc. | Method and apparatus for penetrating tissue |
| US8372016B2 (en) | 2002-04-19 | 2013-02-12 | Sanofi-Aventis Deutschland Gmbh | Method and apparatus for body fluid sampling and analyte sensing |
| US8579831B2 (en) | 2002-04-19 | 2013-11-12 | Sanofi-Aventis Deutschland Gmbh | Method and apparatus for penetrating tissue |
| US8267870B2 (en) | 2002-04-19 | 2012-09-18 | Sanofi-Aventis Deutschland Gmbh | Method and apparatus for body fluid sampling with hybrid actuation |
| US8784335B2 (en) | 2002-04-19 | 2014-07-22 | Sanofi-Aventis Deutschland Gmbh | Body fluid sampling device with a capacitive sensor |
| US9248267B2 (en) | 2002-04-19 | 2016-02-02 | Sanofi-Aventis Deustchland Gmbh | Tissue penetration device |
| US7892183B2 (en) | 2002-04-19 | 2011-02-22 | Pelikan Technologies, Inc. | Method and apparatus for body fluid sampling and analyte sensing |
| US7232451B2 (en) | 2002-04-19 | 2007-06-19 | Pelikan Technologies, Inc. | Method and apparatus for penetrating tissue |
| US7901362B2 (en) | 2002-04-19 | 2011-03-08 | Pelikan Technologies, Inc. | Method and apparatus for penetrating tissue |
| US8221334B2 (en) | 2002-04-19 | 2012-07-17 | Sanofi-Aventis Deutschland Gmbh | Method and apparatus for penetrating tissue |
| US8360992B2 (en) | 2002-04-19 | 2013-01-29 | Sanofi-Aventis Deutschland Gmbh | Method and apparatus for penetrating tissue |
| US8702624B2 (en) | 2006-09-29 | 2014-04-22 | Sanofi-Aventis Deutschland Gmbh | Analyte measurement device with a single shot actuator |
| US7909778B2 (en) | 2002-04-19 | 2011-03-22 | Pelikan Technologies, Inc. | Method and apparatus for penetrating tissue |
| US9795334B2 (en) | 2002-04-19 | 2017-10-24 | Sanofi-Aventis Deutschland Gmbh | Method and apparatus for penetrating tissue |
| US7708701B2 (en) | 2002-04-19 | 2010-05-04 | Pelikan Technologies, Inc. | Method and apparatus for a multi-use body fluid sampling device |
| US7229458B2 (en) | 2002-04-19 | 2007-06-12 | Pelikan Technologies, Inc. | Method and apparatus for penetrating tissue |
| US8574895B2 (en) | 2002-12-30 | 2013-11-05 | Sanofi-Aventis Deutschland Gmbh | Method and apparatus using optical techniques to measure analyte levels |
| DE602004028463D1 (en) | 2003-05-30 | 2010-09-16 | Pelikan Technologies Inc | METHOD AND DEVICE FOR INJECTING LIQUID |
| US7850621B2 (en) | 2003-06-06 | 2010-12-14 | Pelikan Technologies, Inc. | Method and apparatus for body fluid sampling and analyte sensing |
| WO2006001797A1 (en) | 2004-06-14 | 2006-01-05 | Pelikan Technologies, Inc. | Low pain penetrating |
| US8282576B2 (en) | 2003-09-29 | 2012-10-09 | Sanofi-Aventis Deutschland Gmbh | Method and apparatus for an improved sample capture device |
| EP1680014A4 (en) | 2003-10-14 | 2009-01-21 | Pelikan Technologies Inc | METHOD AND DEVICE FOR A VARIABLE USER INTERFACE |
| US7822454B1 (en) | 2005-01-03 | 2010-10-26 | Pelikan Technologies, Inc. | Fluid sampling device with improved analyte detecting member configuration |
| US8668656B2 (en) | 2003-12-31 | 2014-03-11 | Sanofi-Aventis Deutschland Gmbh | Method and apparatus for improving fluidic flow and sample capture |
| WO2006011062A2 (en) | 2004-05-20 | 2006-02-02 | Albatros Technologies Gmbh & Co. Kg | Printable hydrogel for biosensors |
| US9775553B2 (en) | 2004-06-03 | 2017-10-03 | Sanofi-Aventis Deutschland Gmbh | Method and apparatus for a fluid sampling device |
| WO2005120365A1 (en) | 2004-06-03 | 2005-12-22 | Pelikan Technologies, Inc. | Method and apparatus for a fluid sampling device |
| US8652831B2 (en) | 2004-12-30 | 2014-02-18 | Sanofi-Aventis Deutschland Gmbh | Method and apparatus for analyte measurement test time |
| US20060281187A1 (en) | 2005-06-13 | 2006-12-14 | Rosedale Medical, Inc. | Analyte detection devices and methods with hematocrit/volume correction and feedback control |
| EP1928302B1 (en) | 2005-09-30 | 2012-08-01 | Intuity Medical, Inc. | Fully integrated wearable or handheld monitor |
| US8801631B2 (en) | 2005-09-30 | 2014-08-12 | Intuity Medical, Inc. | Devices and methods for facilitating fluid transport |
| US8529751B2 (en) | 2006-03-31 | 2013-09-10 | Lifescan, Inc. | Systems and methods for discriminating control solution from a physiological sample |
| US8778168B2 (en) | 2007-09-28 | 2014-07-15 | Lifescan, Inc. | Systems and methods of discriminating control solution from a physiological sample |
| JP5812603B2 (en)* | 2007-12-10 | 2015-11-17 | バイエル・ヘルスケア・エルエルシーBayer HealthCareLLC | Slope-based correction |
| US8603768B2 (en) | 2008-01-17 | 2013-12-10 | Lifescan, Inc. | System and method for measuring an analyte in a sample |
| EP2265324B1 (en) | 2008-04-11 | 2015-01-28 | Sanofi-Aventis Deutschland GmbH | Integrated analyte measurement system |
| US9833183B2 (en) | 2008-05-30 | 2017-12-05 | Intuity Medical, Inc. | Body fluid sampling device—sampling site interface |
| WO2009148624A1 (en) | 2008-06-06 | 2009-12-10 | Intuity Medical, Inc. | Detection meter and mode of operation |
| EP3984454A1 (en) | 2008-06-06 | 2022-04-20 | Intuity Medical, Inc. | Medical diagnostic devices and methods |
| US8551320B2 (en) | 2008-06-09 | 2013-10-08 | Lifescan, Inc. | System and method for measuring an analyte in a sample |
| US9375169B2 (en) | 2009-01-30 | 2016-06-28 | Sanofi-Aventis Deutschland Gmbh | Cam drive for managing disposable penetrating member actions with a single motor and motor and control system |
| JP5422647B2 (en) | 2009-05-29 | 2014-02-19 | パナソニック株式会社 | Biosensor system and method for measuring concentration of analyte |
| US8323467B2 (en)* | 2009-10-27 | 2012-12-04 | Lifescan Scotland Limited | Dual chamber, multi-analyte test strip with opposing electrodes |
| EP2506768B1 (en) | 2009-11-30 | 2016-07-06 | Intuity Medical, Inc. | Calibration material delivery devices and methods |
| KR100980316B1 (en)* | 2009-12-09 | 2010-09-06 | 동진메디칼 주식회사 | Strip having thermal compensating function and method for measuring blood sugar using it |
| IL209760A (en)* | 2009-12-11 | 2015-05-31 | Lifescan Scotland Ltd | Fill sufficiency method and system |
| US8101065B2 (en)* | 2009-12-30 | 2012-01-24 | Lifescan, Inc. | Systems, devices, and methods for improving accuracy of biosensors using fill time |
| US8877034B2 (en) | 2009-12-30 | 2014-11-04 | Lifescan, Inc. | Systems, devices, and methods for measuring whole blood hematocrit based on initial fill velocity |
| US8391940B2 (en)* | 2010-02-04 | 2013-03-05 | Lifescan, Inc. | Methods and systems to correct for hematocrit effects |
| US8773106B2 (en) | 2010-02-25 | 2014-07-08 | Lifescan Scotland Limited | Capacitance detection in electrochemical assay with improved sampling time offset |
| US8742773B2 (en) | 2010-02-25 | 2014-06-03 | Lifescan Scotland Limited | Capacitance detection in electrochemical assay with improved response |
| WO2011104517A2 (en) | 2010-02-25 | 2011-09-01 | Lifescan Scotland Limited | Capacitance detection in electrochemical assay |
| US20110208435A1 (en)* | 2010-02-25 | 2011-08-25 | Lifescan Scotland Ltd. | Capacitance detection in electrochemical assays |
| EP2540224B1 (en)* | 2010-02-26 | 2020-04-01 | ARKRAY, Inc. | Analysis device, analysis method, and analysis system |
| EP2565637A3 (en) | 2010-03-31 | 2013-04-03 | Lifescan Scotland Limited | Electrochemical analyte measurement method and system |
| US8965476B2 (en) | 2010-04-16 | 2015-02-24 | Sanofi-Aventis Deutschland Gmbh | Tissue penetration device |
| CA2803797A1 (en) | 2010-06-25 | 2011-12-29 | Intuity Medical, Inc. | Analyte monitoring methods and systems |
| KR101899307B1 (en) | 2010-07-19 | 2018-09-18 | 시락 게엠베하 인터내셔날 | System and method for measuring an analyte in a sample |
| CA2807117A1 (en)* | 2010-08-02 | 2012-02-09 | Cilag Gmbh International | Systems and methods for improved accuracy for temperature correction of glucose results for control solution |
| US8603323B2 (en) | 2010-09-20 | 2013-12-10 | Lifescan, Inc. | Apparatus and process for improved measurements of a monitoring device |
| US8932445B2 (en)* | 2010-09-30 | 2015-01-13 | Cilag Gmbh International | Systems and methods for improved stability of electrochemical sensors |
| US8617370B2 (en)* | 2010-09-30 | 2013-12-31 | Cilag Gmbh International | Systems and methods of discriminating between a control sample and a test fluid using capacitance |
| EP3901624B1 (en)* | 2010-12-22 | 2024-01-31 | Roche Diabetes Care GmbH | Methods to compensate for sources of error during electrochemical testing |
| US9632054B2 (en) | 2010-12-31 | 2017-04-25 | Cilag Gmbh International | Systems and methods for high accuracy analyte measurement |
| EP2679992B1 (en)* | 2011-02-23 | 2019-10-23 | PHC Holdings Corporation | Biological sample measuring system |
| RU2605292C2 (en)* | 2011-05-27 | 2016-12-20 | Лайфскэн Скотлэнд Лимитед | Peak offset correction for analyte test strip, used for measuring analyte content |
| US9782114B2 (en) | 2011-08-03 | 2017-10-10 | Intuity Medical, Inc. | Devices and methods for body fluid sampling and analysis |
| US8475733B2 (en) | 2011-08-04 | 2013-07-02 | Cilag Gmbh International | Hand-held test meter and analytical test strip cartridge assembly with desiccant vial |
| US8580576B2 (en) | 2011-08-04 | 2013-11-12 | Cilag Gmbh International | Method for bodily fluid sample transfer during analyte determination |
| US20130084590A1 (en)* | 2011-09-30 | 2013-04-04 | Lifescan Scotland Ltd. | Analytical test strip with bodily fluid phase-shift measurement electrodes |
| US8840776B2 (en)* | 2011-10-25 | 2014-09-23 | Bionime Corporation | Method and sensor strip for analysis of a sample |
| EP2781914A1 (en)* | 2011-11-18 | 2014-09-24 | Murata Manufacturing Co., Ltd. | Method for measuring hematocrit levels, quantitative analysis method using said measurement method, and sensor chip |
| US9903830B2 (en) | 2011-12-29 | 2018-02-27 | Lifescan Scotland Limited | Accurate analyte measurements for electrochemical test strip based on sensed physical characteristic(s) of the sample containing the analyte |
| US8709232B2 (en)* | 2012-04-30 | 2014-04-29 | Cilag Gmbh International | Analyte measurement technique and system |
| US9201038B2 (en) | 2012-07-24 | 2015-12-01 | Lifescan Scotland Limited | System and methods to account for interferents in a glucose biosensor |
| MX355854B (en)* | 2012-07-27 | 2018-05-03 | Ascensia Diabetes Care Holdings Ag | System and method for detecting used and dried sensors. |
| EP2919000B1 (en)* | 2012-12-12 | 2019-05-08 | PHC Holdings Corporation | Blood component measuring device and method for measuring blood component |
| CA2900885C (en) | 2013-03-15 | 2017-12-19 | F. Hoffmann-La Roche Ag | Methods of electrochemically measuring an analyte with a test sequence having a pulsed dc block as well as devices, apparatuses and systems incorporating the same |
| KR101732300B1 (en) | 2013-03-15 | 2017-05-02 | 에프. 호프만-라 로슈 아게 | Methods of failsafing electrochemical measurements of an analyte as well as devices, apparatuses and systems incorporating the same |
| CA2949906C (en)* | 2013-03-15 | 2019-04-02 | F. Hoffmann-La Roche Ag | Methods of scaling data used to construct biosensor algorithms as well as devices, apparatuses and systems incorporating the same |
| CN105190299B (en) | 2013-03-15 | 2018-04-20 | 豪夫迈·罗氏有限公司 | The method based on descriptor of electrochemical measurement analyte and the unit and system with reference to this method |
| CN105247356B (en) | 2013-03-15 | 2017-11-07 | 豪夫迈·罗氏有限公司 | Methods of using information from recovery pulses in electrochemical analyte measurements and devices, devices and systems incorporating said methods |
| KR101743382B1 (en) | 2013-03-15 | 2017-06-02 | 에프. 호프만-라 로슈 아게 | Methods of detecting high antioxidant levels during electrochemical measurements and failsafing an analyte concentration therefrom as well as devices, apparatuses and systems incorporting the same |
| US20140299483A1 (en) | 2013-04-05 | 2014-10-09 | Lifescan Scotland Limited | Analyte meter and method of operation |
| US9274098B2 (en) | 2013-04-30 | 2016-03-01 | Lifescan Scotland Limited | Analyte meter digital sample detection |
| US20140318987A1 (en) | 2013-04-30 | 2014-10-30 | Lifescan Scotland Limited | Analyte meter test strip detection |
| GB2515299B (en) | 2013-06-18 | 2015-12-30 | Suresensors Ltd | Methods and apparatus for determining analyte in a sample |
| US9354194B2 (en) | 2013-06-19 | 2016-05-31 | Cilag Gmbh International | Orientation independent meter |
| WO2014205412A1 (en) | 2013-06-21 | 2014-12-24 | Intuity Medical, Inc. | Analyte monitoring system with audible feedback |
| US9435762B2 (en)* | 2013-06-27 | 2016-09-06 | Lifescan Scotland Limited | Fill error trap for an analyte measurement determined from a specified sampling time derived from a sensed physical characteristic of the sample containing the analyte |
| US9835578B2 (en)* | 2013-06-27 | 2017-12-05 | Lifescan Scotland Limited | Temperature compensation for an analyte measurement determined from a specified sampling time derived from a sensed physical characteristic of the sample containing the analyte |
| US20150050678A1 (en) | 2013-08-13 | 2015-02-19 | Lifescan Scotland Limited | Modular analytical test meter |
| US9383332B2 (en) | 2013-09-24 | 2016-07-05 | Lifescan Scotland Limited | Analytical test strip with integrated battery |
| US20150144507A1 (en)* | 2013-11-22 | 2015-05-28 | Cilag Gmbh International | Folded biosensor |
| US20150177256A1 (en) | 2013-12-23 | 2015-06-25 | Cilag Gmbh International | Test strip sample application video system |
| US9500616B2 (en) | 2013-12-23 | 2016-11-22 | Cilag Gmbh International | Multi-orientation test strip |
| US20150176053A1 (en) | 2013-12-23 | 2015-06-25 | Cilag Gmbh International | Test strip insertion drive mechanism for analyte meter |
| US20150176049A1 (en) | 2013-12-23 | 2015-06-25 | Cilag Gmbh International | Determining usability of analytical test strip |
| US9575051B2 (en) | 2013-12-23 | 2017-02-21 | Cilag Gmbh International | Test strip connector contact protection |
| US9442089B2 (en) | 2013-12-23 | 2016-09-13 | Lifescan Scotland Limited | Analyte meter test strip detection |
| TWI512287B (en)* | 2014-03-31 | 2015-12-11 | Taidoc Technology Corp | Electrochemical biosensor device, system and detection method with sample detection function |
| US20160091451A1 (en)* | 2014-09-25 | 2016-03-31 | Lifescan Scotland Limited | Accurate analyte measurements for electrochemical test strip to determine analyte measurement time based on measured temperature, physical characteristic and estimated analyte value |
| JP6654383B2 (en)* | 2014-10-03 | 2020-02-26 | アークレイ株式会社 | Measuring device, detecting method, electrochemical sensor and measuring system |
| US20160178559A1 (en) | 2014-12-17 | 2016-06-23 | Lifescan Scotland Limited | Universal strip port connector |
| US20160178574A1 (en)* | 2014-12-17 | 2016-06-23 | Cilag Gmbh International | Test strip and method to determine test strip compatibility |
| JP6779210B2 (en)* | 2014-12-19 | 2020-11-04 | エフ.ホフマン−ラ ロシュ アーゲーF. Hoffmann−La Roche Aktiengesellschaft | Inspection element for electrochemical detection of at least one analyte |
| US10369567B2 (en)* | 2015-11-04 | 2019-08-06 | International Business Machines Corporation | Continuous, capacitance-based monitoring of liquid flows in a microfluidic device |
| JP6403653B2 (en)* | 2015-11-05 | 2018-10-10 | シラグ・ゲーエムベーハー・インターナショナルCilag GMBH International | High accuracy analyte measurement system and method |
| JP6680702B2 (en)* | 2017-01-27 | 2020-04-15 | シラグ・ゲーエムベーハー・インターナショナルCilag GMBH International | High accuracy analyte measurement system and method |
| US11408881B2 (en)* | 2017-05-04 | 2022-08-09 | Roche Diabetes Care, Inc. | Test meter and method for detecting undue pressure applied to an inserated test strip |
| CN207528678U (en)* | 2017-12-05 | 2018-06-22 | 禅谱科技股份有限公司 | Electrochemical analyzer |
| JP6609001B2 (en)* | 2018-06-04 | 2019-11-20 | シラグ・ゲーエムベーハー・インターナショナル | High accuracy analyte measurement system and method |
| US11035819B2 (en)* | 2018-06-28 | 2021-06-15 | Lifescan Ip Holdings, Llc | Method for determining analyte concentration in a sample technical field |
| CN109884150B (en)* | 2019-03-08 | 2021-05-14 | 武汉璟泓科技股份有限公司 | Erythrocyte backlog correction method and storage medium |
| US20200378917A1 (en)* | 2019-05-29 | 2020-12-03 | Hach Company | Electrochemistry sensor housing |
| CN115426608B (en)* | 2022-09-26 | 2025-04-04 | 深圳市豪恩声学股份有限公司 | Headphone operation test collection method, device, computer equipment and storage medium |
Family Cites Families (215)
| Publication number | Priority date | Publication date | Assignee | Title |
|---|---|---|---|---|
| US797861A (en)* | 1905-05-16 | 1905-08-22 | Augustine Melgarejo | Car-platform. |
| BE758318A (en) | 1969-12-01 | 1971-04-30 | Technicon Instr | METHOD AND APPARATUS FOR THE AUTOMATIC HIGH PRECISION DETERMINATION OF THE HEMATOCRITIS OF TOTAL BLOOD SAMPLES |
| SE399768B (en) | 1975-09-29 | 1978-02-27 | Lilja Jan E | CYVETT FOR SAMPLING, MIXING OF, THE SAMPLE WITH A REAGENTS AND DIRECT PERFORMANCE OF, SPECIAL OPTICAL, ANALYSIS OF THE SAMPLE MIXED WITH THE REAGENTS |
| JPS5912135B2 (en) | 1977-09-28 | 1984-03-21 | 松下電器産業株式会社 | enzyme electrode |
| NL7903113A (en) | 1978-05-05 | 1979-11-07 | Baker Chem Co J T | KINETIC MEASUREMENT OF GLUCOSE CONCENTRATIONS IN BODY LIQUIDS AND PREPARATIONS TO BE USED FOR THIS. |
| US4250257A (en) | 1978-08-24 | 1981-02-10 | Technicon Instruments Corporation | Whole blood analyses in porous media |
| US4254083A (en) | 1979-07-23 | 1981-03-03 | Eastman Kodak Company | Structural configuration for transport of a liquid drop through an ingress aperture |
| US4233029A (en) | 1978-10-25 | 1980-11-11 | Eastman Kodak Company | Liquid transport device and method |
| JPS5594560U (en) | 1978-12-20 | 1980-06-30 | ||
| DE2913553C2 (en) | 1979-04-04 | 1981-09-17 | Boehringer Mannheim Gmbh, 6800 Mannheim | Method and reagent for the enzymatic determination of enzyme substrates |
| US4307188A (en) | 1979-09-06 | 1981-12-22 | Miles Laboratories, Inc. | Precursor indicator compositions |
| US4301412A (en) | 1979-10-29 | 1981-11-17 | United States Surgical Corporation | Liquid conductivity measuring system and sample cards therefor |
| US4301414A (en) | 1979-10-29 | 1981-11-17 | United States Surgical Corporation | Disposable sample card and method of making same |
| US4303887A (en) | 1979-10-29 | 1981-12-01 | United States Surgical Corporation | Electrical liquid conductivity measuring system |
| SE419903B (en) | 1980-03-05 | 1981-08-31 | Enfors Sven Olof | enzyme electrode |
| US4629563B1 (en) | 1980-03-14 | 1997-06-03 | Memtec North America | Asymmetric membranes |
| US4774039A (en) | 1980-03-14 | 1988-09-27 | Brunswick Corporation | Dispersing casting of integral skinned highly asymmetric polymer membranes |
| US4404066A (en) | 1980-08-25 | 1983-09-13 | The Yellow Springs Instrument Company | Method for quantitatively determining a particular substrate catalyzed by a multisubstrate enzyme |
| US4436812A (en) | 1980-10-29 | 1984-03-13 | Fuji Electric Co., Ltd. | Process of calibrating a blood sugar analyzing apparatus |
| DE3103464C2 (en) | 1981-02-02 | 1984-10-11 | Gkss - Forschungszentrum Geesthacht Gmbh, 2054 Geesthacht | Sealing frame for electrodialysis membrane stacks |
| EP0078636B2 (en) | 1981-10-23 | 1997-04-02 | MediSense, Inc. | Sensor for components of a liquid mixture |
| US4431004A (en) | 1981-10-27 | 1984-02-14 | Bessman Samuel P | Implantable glucose sensor |
| DE3202067C2 (en) | 1982-01-23 | 1984-06-20 | Holger Dr. 5100 Aachen Kiesewetter | Device for determining the hematocrit value |
| DE3228542A1 (en) | 1982-07-30 | 1984-02-02 | Siemens AG, 1000 Berlin und 8000 München | METHOD FOR DETERMINING THE CONCENTRATION OF ELECTROCHEMICALLY IMPLEMENTABLE SUBSTANCES |
| US4552840A (en) | 1982-12-02 | 1985-11-12 | California And Hawaiian Sugar Company | Enzyme electrode and method for dextran analysis |
| US5509410A (en) | 1983-06-06 | 1996-04-23 | Medisense, Inc. | Strip electrode including screen printing of a single layer |
| CA1219040A (en) | 1983-05-05 | 1987-03-10 | Elliot V. Plotkin | Measurement of enzyme-catalysed reactions |
| CA1226036A (en) | 1983-05-05 | 1987-08-25 | Irving J. Higgins | Analytical equipment and sensor electrodes therefor |
| US4533440A (en) | 1983-08-04 | 1985-08-06 | General Electric Company | Method for continuous measurement of the sulfite/sulfate ratio |
| US4517291A (en) | 1983-08-15 | 1985-05-14 | E. I. Du Pont De Nemours And Company | Biological detection process using polymer-coated electrodes |
| SE8305704D0 (en) | 1983-10-18 | 1983-10-18 | Leo Ab | Cuvette |
| GB8330268D0 (en) | 1983-11-12 | 1983-12-21 | Lion Lab Ltd | Discriminant analysis of gas constituents |
| US4508613A (en) | 1983-12-19 | 1985-04-02 | Gould Inc. | Miniaturized potassium ion sensor |
| GB2154735B (en) | 1984-01-27 | 1987-07-15 | Menarini Sas | Reagent for determining blood glucose content |
| US5141868A (en) | 1984-06-13 | 1992-08-25 | Internationale Octrooi Maatschappij "Octropa" Bv | Device for use in chemical test procedures |
| SE8403628D0 (en) | 1984-07-09 | 1984-07-09 | Cerac Inst Sa | LIQUID DISTRIBUTION DEVICE BY SCRATCHING MACHINES |
| US5171689A (en) | 1984-11-08 | 1992-12-15 | Matsushita Electric Industrial Co., Ltd. | Solid state bio-sensor |
| US4686479A (en) | 1985-07-22 | 1987-08-11 | Young Chung C | Apparatus and control kit for analyzing blood sample values including hematocrit |
| US4664119A (en) | 1985-12-04 | 1987-05-12 | University Of Southern California | Transcutaneous galvanic electrode oxygen sensor |
| SU1351627A2 (en) | 1986-03-27 | 1987-11-15 | Томский инженерно-строительный институт | Filtering element |
| JPS636451A (en) | 1986-06-27 | 1988-01-12 | Terumo Corp | Enzyme sensor |
| GB8618022D0 (en) | 1986-07-23 | 1986-08-28 | Unilever Plc | Electrochemical measurements |
| US4828705A (en) | 1986-10-31 | 1989-05-09 | Kingston Technologies, Inc. | Pressure-dependent anisotropic-transport membrane system |
| DE3786655T2 (en) | 1986-11-28 | 1993-12-02 | Unilever Nv | Electrochemical measuring device. |
| EP0278647A3 (en) | 1987-02-09 | 1989-09-20 | AT&T Corp. | Electronchemical processes involving enzymes |
| GB2201248B (en) | 1987-02-24 | 1991-04-17 | Ici Plc | Enzyme electrode sensors |
| US4955947A (en) | 1987-05-14 | 1990-09-11 | Ace Orthopedic Manufacturing | Pressure sensor |
| US4963815A (en) | 1987-07-10 | 1990-10-16 | Molecular Devices Corporation | Photoresponsive electrode for determination of redox potential |
| US4812221A (en) | 1987-07-15 | 1989-03-14 | Sri International | Fast response time microsensors for gaseous and vaporous species |
| US5064516A (en) | 1987-07-16 | 1991-11-12 | Gas Research Institute | Measuring gas levels |
| US4790925A (en) | 1987-09-18 | 1988-12-13 | Mine Safety Appliances Company | Electrochemical gas sensor |
| US5128015A (en) | 1988-03-15 | 1992-07-07 | Tall Oak Ventures | Method and apparatus for amperometric diagnostic analysis |
| US5108564A (en) | 1988-03-15 | 1992-04-28 | Tall Oak Ventures | Method and apparatus for amperometric diagnostic analysis |
| DE68924026T3 (en) | 1988-03-31 | 2008-01-10 | Matsushita Electric Industrial Co., Ltd., Kadoma | BIOSENSOR AND ITS MANUFACTURE. |
| FR2630546B1 (en) | 1988-04-20 | 1993-07-30 | Centre Nat Rech Scient | ENZYMATIC ELECTRODE AND ITS PREPARATION METHOD |
| CA1316572C (en) | 1988-07-18 | 1993-04-20 | Martin J. Patko | Precalibrated, disposable, electrochemical sensors |
| GB8817421D0 (en) | 1988-07-21 | 1988-08-24 | Medisense Inc | Bioelectrochemical electrodes |
| US5089320A (en) | 1989-01-09 | 1992-02-18 | James River Ii, Inc. | Resealable packaging material |
| US5312590A (en) | 1989-04-24 | 1994-05-17 | National University Of Singapore | Amperometric sensor for single and multicomponent analysis |
| EP0400918A1 (en) | 1989-05-31 | 1990-12-05 | Nakano Vinegar Co., Ltd. | Enzyme sensor |
| US5272060A (en) | 1989-07-13 | 1993-12-21 | Kyoto Daiichi Kagaku Co., Ltd. | Method for determination of glucose concentration in whole blood |
| GB2235050B (en) | 1989-08-14 | 1994-01-05 | Sieger Ltd | Electrochemical gas sensor |
| JP2665806B2 (en) | 1989-09-13 | 1997-10-22 | 株式会社豊田中央研究所 | Hematocrit measuring device |
| DE68925727T2 (en) | 1989-09-15 | 1996-07-04 | Hewlett Packard Gmbh | Method for determining the optimal working conditions in an electrochemical detector and electrochemical detector using this method |
| GB8922126D0 (en) | 1989-10-02 | 1989-11-15 | Normalair Garrett Ltd | Oxygen monitoring method and apparatus |
| DE69025134T2 (en) | 1989-11-24 | 1996-08-14 | Matsushita Electric Ind Co Ltd | Method of manufacturing a biosensor |
| JPH0758270B2 (en) | 1989-11-27 | 1995-06-21 | 山武ハネウエル株式会社 | Method for manufacturing moisture sensitive element |
| US5508171A (en)* | 1989-12-15 | 1996-04-16 | Boehringer Mannheim Corporation | Assay method with enzyme electrode system |
| US5243516A (en) | 1989-12-15 | 1993-09-07 | Boehringer Mannheim Corporation | Biosensing instrument and method |
| DE4003194A1 (en) | 1990-02-03 | 1991-08-08 | Boehringer Mannheim Gmbh | METHOD AND SENSOR ELECTRODE SYSTEM FOR THE ELECTROCHEMICAL DETERMINATION OF AN ANALYT, OR AN OXIDOR REDUCTASE, AND USE OF SUITABLE COMPOUNDS THEREFOR |
| CA2036435A1 (en) | 1990-03-26 | 1991-09-27 | Paul J. Anderson | Reagent unit |
| US5059908A (en) | 1990-05-31 | 1991-10-22 | Capital Controls Company, Inc. | Amperimetric measurement with cell electrode deplating |
| JPH0466112A (en) | 1990-07-03 | 1992-03-02 | Ube Ind Ltd | How to determine transport conditions in membrane transport |
| US5320732A (en) | 1990-07-20 | 1994-06-14 | Matsushita Electric Industrial Co., Ltd. | Biosensor and measuring apparatus using the same |
| US5642734A (en) | 1990-10-04 | 1997-07-01 | Microcor, Inc. | Method and apparatus for noninvasively determining hematocrit |
| DE69229629T2 (en) | 1991-02-27 | 2002-05-16 | Roche Diagnostics Corp., Indianapolis | STABILIZING AN ENZYME-CONTAINING REAGENT TO DETERMINE ANALYT |
| US5192415A (en) | 1991-03-04 | 1993-03-09 | Matsushita Electric Industrial Co., Ltd. | Biosensor utilizing enzyme and a method for producing the same |
| JP3118015B2 (en) | 1991-05-17 | 2000-12-18 | アークレイ株式会社 | Biosensor and separation and quantification method using the same |
| JPH04343065A (en) | 1991-05-17 | 1992-11-30 | Ngk Spark Plug Co Ltd | Biosensor |
| JP2992603B2 (en) | 1991-06-24 | 1999-12-20 | 日本電信電話株式会社 | Wall jet type electrochemical detector and method of manufacturing the same |
| DE4123348A1 (en) | 1991-07-15 | 1993-01-21 | Boehringer Mannheim Gmbh | ELECTROCHEMICAL ANALYSIS SYSTEM |
| US5388163A (en) | 1991-12-23 | 1995-02-07 | At&T Corp. | Electret transducer array and fabrication technique |
| AU3104293A (en) | 1992-01-14 | 1993-07-15 | Commonwealth Scientific And Industrial Research Organisation | Viscometer |
| US6319471B1 (en) | 1992-07-10 | 2001-11-20 | Gambro, Inc. | Apparatus for producing blood component products |
| EP0560336B1 (en) | 1992-03-12 | 1998-05-06 | Matsushita Electric Industrial Co., Ltd. | A biosensor including a catalyst made from phosphate |
| GB9215972D0 (en) | 1992-07-28 | 1992-09-09 | Univ Manchester | Improved analytical method |
| JP2541081B2 (en) | 1992-08-28 | 1996-10-09 | 日本電気株式会社 | Biosensor and method of manufacturing and using biosensor |
| FR2695481B1 (en) | 1992-09-07 | 1994-12-02 | Cylergie Gie | Amperometric measurement device comprising an electrochemical sensor. |
| EP0600607A3 (en) | 1992-10-28 | 1996-07-03 | Nakano Vinegar Co Ltd | Coulometric analysis method and a device therefor. |
| US5469369A (en) | 1992-11-02 | 1995-11-21 | The United States Of America As Represented By The Secretary Of The Navy | Smart sensor system and method using a surface acoustic wave vapor sensor array and pattern recognition for selective trace organic vapor detection |
| JP3167464B2 (en) | 1992-11-26 | 2001-05-21 | 富士電機株式会社 | Inverter fault diagnosis device |
| JPH06222874A (en) | 1993-01-26 | 1994-08-12 | Sharp Corp | Position input device |
| FR2701117B1 (en) | 1993-02-04 | 1995-03-10 | Asulab Sa | Electrochemical measurement system with multizone sensor, and its application to glucose measurement. |
| US5385846A (en) | 1993-06-03 | 1995-01-31 | Boehringer Mannheim Corporation | Biosensor and method for hematocrit determination |
| US5352351A (en) | 1993-06-08 | 1994-10-04 | Boehringer Mannheim Corporation | Biosensing meter with fail/safe procedures to prevent erroneous indications |
| US5405511A (en)* | 1993-06-08 | 1995-04-11 | Boehringer Mannheim Corporation | Biosensing meter with ambient temperature estimation method and system |
| US5413690A (en) | 1993-07-23 | 1995-05-09 | Boehringer Mannheim Corporation | Potentiometric biosensor and the method of its use |
| US5508203A (en) | 1993-08-06 | 1996-04-16 | Fuller; Milton E. | Apparatus and method for radio frequency spectroscopy using spectral analysis |
| GB9325189D0 (en) | 1993-12-08 | 1994-02-09 | Unilever Plc | Methods and apparatus for electrochemical measurements |
| AU1911795A (en) | 1994-02-09 | 1995-08-29 | Abbott Laboratories | Diagnostic flow cell device |
| US5762770A (en) | 1994-02-21 | 1998-06-09 | Boehringer Mannheim Corporation | Electrochemical biosensor test strip |
| US5437999A (en) | 1994-02-22 | 1995-08-01 | Boehringer Mannheim Corporation | Electrochemical sensor |
| JP3099254B2 (en) | 1994-02-28 | 2000-10-16 | 安藤電気株式会社 | Suction hand with floating mechanism and transfer contact mechanism |
| GB9415499D0 (en) | 1994-08-01 | 1994-09-21 | Bartlett Philip N | Electrodes and their use in analysis |
| DE4445948C2 (en) | 1994-12-22 | 1998-04-02 | Draegerwerk Ag | Method for operating an amperometric measuring cell |
| US6153069A (en) | 1995-02-09 | 2000-11-28 | Tall Oak Ventures | Apparatus for amperometric Diagnostic analysis |
| US5527446A (en) | 1995-04-13 | 1996-06-18 | United States Of America As Represented By The Secretary Of The Air Force | Gas sensor |
| US5620579A (en) | 1995-05-05 | 1997-04-15 | Bayer Corporation | Apparatus for reduction of bias in amperometric sensors |
| US5567302A (en) | 1995-06-07 | 1996-10-22 | Molecular Devices Corporation | Electrochemical system for rapid detection of biochemical agents that catalyze a redox potential change |
| US6413410B1 (en) | 1996-06-19 | 2002-07-02 | Lifescan, Inc. | Electrochemical cell |
| AUPN363995A0 (en) | 1995-06-19 | 1995-07-13 | Memtec Limited | Electrochemical cell |
| US5628890A (en) | 1995-09-27 | 1997-05-13 | Medisense, Inc. | Electrochemical sensor |
| US6058934A (en) | 1995-11-02 | 2000-05-09 | Chiron Diagnostics Corporation | Planar hematocrit sensor incorporating a seven-electrode conductivity measurement cell |
| US6863801B2 (en) | 1995-11-16 | 2005-03-08 | Lifescan, Inc. | Electrochemical cell |
| AUPN661995A0 (en) | 1995-11-16 | 1995-12-07 | Memtec America Corporation | Electrochemical cell 2 |
| US5723284A (en) | 1996-04-01 | 1998-03-03 | Bayer Corporation | Control solution and method for testing the performance of an electrochemical device for determining the concentration of an analyte in blood |
| US5962215A (en) | 1996-04-05 | 1999-10-05 | Mercury Diagnostics, Inc. | Methods for testing the concentration of an analyte in a body fluid |
| US5869971A (en) | 1996-05-17 | 1999-02-09 | Sendx Medical, Inc. | Method and apparatus for ratiometric measurement of hematocrit |
| US5660791A (en) | 1996-06-06 | 1997-08-26 | Bayer Corporation | Fluid testing sensor for use in dispensing instrument |
| AUPO581397A0 (en) | 1997-03-21 | 1997-04-17 | Memtec America Corporation | Sensor connection means |
| US6391645B1 (en)* | 1997-05-12 | 2002-05-21 | Bayer Corporation | Method and apparatus for correcting ambient temperature effect in biosensors |
| US6071391A (en) | 1997-09-12 | 2000-06-06 | Nok Corporation | Enzyme electrode structure |
| US5997817A (en) | 1997-12-05 | 1999-12-07 | Roche Diagnostics Corporation | Electrochemical biosensor test strip |
| US7390667B2 (en) | 1997-12-22 | 2008-06-24 | Roche Diagnostics Operations, Inc. | System and method for analyte measurement using AC phase angle measurements |
| US7494816B2 (en) | 1997-12-22 | 2009-02-24 | Roche Diagnostic Operations, Inc. | System and method for determining a temperature during analyte measurement |
| US7407811B2 (en) | 1997-12-22 | 2008-08-05 | Roche Diagnostics Operations, Inc. | System and method for analyte measurement using AC excitation |
| US6645368B1 (en) | 1997-12-22 | 2003-11-11 | Roche Diagnostics Corporation | Meter and method of using the meter for determining the concentration of a component of a fluid |
| JP3991173B2 (en) | 1998-02-17 | 2007-10-17 | アークレイ株式会社 | Distinguishing liquid sample from control liquid |
| WO1999058050A1 (en) | 1998-05-13 | 1999-11-18 | Cygnus, Inc. | Signal processing for measurement of physiological analytes |
| US6576117B1 (en) | 1998-05-20 | 2003-06-10 | Arkray | Method and apparatus for electrochemical measurement using statistical technique |
| US6830934B1 (en) | 1999-06-15 | 2004-12-14 | Lifescan, Inc. | Microdroplet dispensing for a medical diagnostic device |
| US6251260B1 (en) | 1998-08-24 | 2001-06-26 | Therasense, Inc. | Potentiometric sensors for analytic determination |
| US6338790B1 (en) | 1998-10-08 | 2002-01-15 | Therasense, Inc. | Small volume in vitro analyte sensor with diffusible or non-leachable redox mediator |
| JP4066112B2 (en) | 1999-01-28 | 2008-03-26 | 株式会社スーパーシリコン研究所 | Wire saw control method and wire saw |
| US6475372B1 (en) | 2000-02-02 | 2002-11-05 | Lifescan, Inc. | Electrochemical methods and devices for use in the determination of hematocrit corrected analyte concentrations |
| US6287451B1 (en) | 1999-06-02 | 2001-09-11 | Handani Winarta | Disposable sensor and method of making |
| US6193873B1 (en) | 1999-06-15 | 2001-02-27 | Lifescan, Inc. | Sample detection to initiate timing of an electrochemical assay |
| GB2351153B (en) | 1999-06-18 | 2003-03-26 | Abbott Lab | Electrochemical sensor for analysis of liquid samples |
| JP2001066274A (en) | 1999-08-27 | 2001-03-16 | Omron Corp | Method for evaluating biosensor |
| JP4050434B2 (en) | 1999-11-29 | 2008-02-20 | 松下電器産業株式会社 | Sample discrimination method |
| JP3982133B2 (en) | 2000-01-25 | 2007-09-26 | 松下電器産業株式会社 | Measuring device using biosensor and biosensor and dedicated standard solution used therefor |
| KR100340173B1 (en) | 2000-03-22 | 2002-06-12 | 이동준 | Electrochemical Biosensor Readout Meter |
| US20030036202A1 (en) | 2001-08-01 | 2003-02-20 | Maria Teodorcyzk | Methods and devices for use in analyte concentration determination assays |
| JP2005505075A (en) | 2001-10-09 | 2005-02-17 | コーニンクレッカ フィリップス エレクトロニクス エヌ ヴィ | Device having touch sensitivity function |
| US6797150B2 (en) | 2001-10-10 | 2004-09-28 | Lifescan, Inc. | Determination of sample volume adequacy in biosensor devices |
| US7018843B2 (en) | 2001-11-07 | 2006-03-28 | Roche Diagnostics Operations, Inc. | Instrument |
| US7083712B2 (en) | 2001-11-20 | 2006-08-01 | Arkray, Inc. | Fail judging method for analysis and analyzer |
| AU2002349656A1 (en) | 2001-11-20 | 2003-06-10 | Arkray, Inc. | Fail judging method and analyzer |
| US6749887B1 (en) | 2001-11-28 | 2004-06-15 | Lifescan, Inc. | Solution drying system |
| US6689411B2 (en) | 2001-11-28 | 2004-02-10 | Lifescan, Inc. | Solution striping system |
| US6872299B2 (en) | 2001-12-10 | 2005-03-29 | Lifescan, Inc. | Passive sample detection to initiate timing of an assay |
| US6856125B2 (en) | 2001-12-12 | 2005-02-15 | Lifescan, Inc. | Biosensor apparatus and method with sample type and volume detection |
| US6682933B2 (en) | 2002-03-14 | 2004-01-27 | Lifescan, Inc. | Test strip qualification system |
| US6942770B2 (en) | 2002-04-19 | 2005-09-13 | Nova Biomedical Corporation | Disposable sub-microliter volume biosensor with enhanced sample inlet |
| US6743635B2 (en) | 2002-04-25 | 2004-06-01 | Home Diagnostics, Inc. | System and methods for blood glucose sensing |
| US6946299B2 (en) | 2002-04-25 | 2005-09-20 | Home Diagnostics, Inc. | Systems and methods for blood glucose sensing |
| US6964871B2 (en) | 2002-04-25 | 2005-11-15 | Home Diagnostics, Inc. | Systems and methods for blood glucose sensing |
| AU2003234944A1 (en) | 2002-08-27 | 2004-03-18 | Bayer Healthcare, Llc | Methods of Determining Glucose Concentration in Whole Blood Samples |
| EP1557662B1 (en) | 2002-10-31 | 2016-07-13 | Panasonic Healthcare Holdings Co., Ltd. | Determination method for automatically identifying analyte liquid and standard solution for biosensor |
| EP1557663B1 (en) | 2002-11-01 | 2007-08-01 | ARKRAY, Inc. | Measuring instrument provided with sold component concentrating means |
| ES2286209T3 (en)* | 2002-11-21 | 2007-12-01 | Lifescan, Inc. | DETERMINATION OF THE ADEQUACY OF THE SAMPLE VOLUME IN BIODETECTORS. |
| US20040120848A1 (en) | 2002-12-20 | 2004-06-24 | Maria Teodorczyk | Method for manufacturing a sterilized and calibrated biosensor-based medical device |
| US7132041B2 (en) | 2003-02-11 | 2006-11-07 | Bayer Healthcare Llc | Methods of determining the concentration of an analyte in a fluid test sample |
| EP1467206A1 (en) | 2003-04-08 | 2004-10-13 | Roche Diagnostics GmbH | Biosensor system |
| JP4447009B2 (en) | 2003-06-20 | 2010-04-07 | エフ ホフマン−ラ ロッシュ アクチェン ゲゼルシャフト | Test strip with slot vent opening |
| US7645373B2 (en) | 2003-06-20 | 2010-01-12 | Roche Diagnostic Operations, Inc. | System and method for coding information on a biosensor test strip |
| US7488601B2 (en) | 2003-06-20 | 2009-02-10 | Roche Diagnostic Operations, Inc. | System and method for determining an abused sensor during analyte measurement |
| US7604721B2 (en) | 2003-06-20 | 2009-10-20 | Roche Diagnostics Operations, Inc. | System and method for coding information on a biosensor test strip |
| US7718439B2 (en) | 2003-06-20 | 2010-05-18 | Roche Diagnostics Operations, Inc. | System and method for coding information on a biosensor test strip |
| US7597793B2 (en) | 2003-06-20 | 2009-10-06 | Roche Operations Ltd. | System and method for analyte measurement employing maximum dosing time delay |
| US8148164B2 (en) | 2003-06-20 | 2012-04-03 | Roche Diagnostics Operations, Inc. | System and method for determining the concentration of an analyte in a sample fluid |
| US7452457B2 (en) | 2003-06-20 | 2008-11-18 | Roche Diagnostics Operations, Inc. | System and method for analyte measurement using dose sufficiency electrodes |
| US7645421B2 (en) | 2003-06-20 | 2010-01-12 | Roche Diagnostics Operations, Inc. | System and method for coding information on a biosensor test strip |
| US20050036906A1 (en) | 2003-08-11 | 2005-02-17 | Toray Industries, Inc. | Biosensor |
| JP4449431B2 (en) | 2003-11-19 | 2010-04-14 | パナソニック株式会社 | Substrate concentration measurement method |
| GB0400394D0 (en) | 2004-01-09 | 2004-02-11 | Hypoguard Ltd | Biosensor and method of manufacture |
| JP5011100B2 (en)* | 2004-03-31 | 2012-08-29 | バイエル・ヘルスケア・エルエルシー | Method and apparatus for implementing threshold-based correction functions for biosensors |
| EP3115777B1 (en) | 2004-04-19 | 2020-01-08 | PHC Holdings Corporation | Method for measuring blood components |
| MXPA06013233A (en) | 2004-05-14 | 2007-02-28 | Bayer Healthcare Llc | Methods for performing hematocrit adjustment in glucose assays and devices for same. |
| US7862341B2 (en)* | 2004-06-17 | 2011-01-04 | Krueger International, Inc. | Marker board |
| US7556723B2 (en) | 2004-06-18 | 2009-07-07 | Roche Diagnostics Operations, Inc. | Electrode design for biosensor |
| ES2552083T3 (en) | 2005-04-08 | 2015-11-25 | Bayer Healthcare Llc | Oxidizable species as internal reference in control solutions for biosensors |
| US7547382B2 (en) | 2005-04-15 | 2009-06-16 | Agamatrix, Inc. | Determination of partial fill in electrochemical strips |
| US7964089B2 (en) | 2005-04-15 | 2011-06-21 | Agamatrix, Inc. | Analyte determination method and analyte meter |
| US7645374B2 (en) | 2005-04-15 | 2010-01-12 | Agamatrix, Inc. | Method for determination of analyte concentrations and related apparatus |
| US7344626B2 (en) | 2005-04-15 | 2008-03-18 | Agamatrix, Inc. | Method and apparatus for detection of abnormal traces during electrochemical analyte detection |
| US7695600B2 (en) | 2005-06-03 | 2010-04-13 | Hypoguard Limited | Test system |
| US20070017824A1 (en) | 2005-07-19 | 2007-01-25 | Rippeth John J | Biosensor and method of manufacture |
| JP4481909B2 (en) | 2005-09-21 | 2010-06-16 | 日立オートモティブシステムズ株式会社 | Manufacturing method of connection terminal used for connector |
| US7749371B2 (en) | 2005-09-30 | 2010-07-06 | Lifescan, Inc. | Method and apparatus for rapid electrochemical analysis |
| KR101577176B1 (en) | 2005-09-30 | 2015-12-14 | 바이엘 헬스케어 엘엘씨 | Gated voltammetry analyte determination |
| US7429865B2 (en) | 2005-10-05 | 2008-09-30 | Roche Diagnostics Operations, Inc. | Method and system for error checking an electrochemical sensor |
| US7468125B2 (en) | 2005-10-17 | 2008-12-23 | Lifescan, Inc. | System and method of processing a current sample for calculating a glucose concentration |
| JP2007133985A (en) | 2005-11-11 | 2007-05-31 | Hitachi Ltd | Magnetic recording / optical recording disk inspection system |
| RU2455925C2 (en) | 2006-02-27 | 2012-07-20 | БАЙЕР ХЕЛТКЭА ЭлЭлСи | Determination of investigated substance with correction to temperature for systems of biosensors |
| US20070205114A1 (en)* | 2006-03-01 | 2007-09-06 | Mathur Vijaywanth P | Method of detecting biosensor filling |
| JP2007248281A (en) | 2006-03-16 | 2007-09-27 | Matsushita Electric Ind Co Ltd | Electrode tip and manufacturing method thereof |
| US8529751B2 (en) | 2006-03-31 | 2013-09-10 | Lifescan, Inc. | Systems and methods for discriminating control solution from a physiological sample |
| US8163162B2 (en) | 2006-03-31 | 2012-04-24 | Lifescan, Inc. | Methods and apparatus for analyzing a sample in the presence of interferents |
| US20070235346A1 (en) | 2006-04-11 | 2007-10-11 | Popovich Natasha D | System and methods for providing corrected analyte concentration measurements |
| EP3553510B1 (en) | 2006-05-03 | 2024-12-18 | Ascensia Diabetes Care Holdings AG | Underfill detection system for a biosensor |
| US7909983B2 (en) | 2006-05-04 | 2011-03-22 | Nipro Diagnostics, Inc. | System and methods for automatically recognizing a control solution |
| BRPI0711433A2 (en) | 2006-05-08 | 2011-11-16 | Bayer Healthcare Llc | Abnormal output detection system for a biosensor |
| EP1860432B1 (en)* | 2006-05-24 | 2017-12-13 | Bionime GmbH | A method for operating a measuring meter and a measuring meter |
| EP2040065B1 (en) | 2006-07-05 | 2015-12-30 | Panasonic Healthcare Holdings Co., Ltd. | Method and apparatus for measuring liquid sample |
| US20080083618A1 (en) | 2006-09-05 | 2008-04-10 | Neel Gary T | System and Methods for Determining an Analyte Concentration Incorporating a Hematocrit Correction |
| US20100276303A1 (en) | 2006-10-19 | 2010-11-04 | Panasonic Corporation | Method for measuring hematocrit value of blood sample, method for measuring concentration of analyte in blood sample, sensor chip and sensor unit |
| US8409424B2 (en) | 2006-12-19 | 2013-04-02 | Apex Biotechnology Corp. | Electrochemical test strip, electrochemical test system, and measurement method using the same |
| US8343331B2 (en) | 2007-09-27 | 2013-01-01 | Philosys Co., Ltd. | Method for correcting erroneous results of measurement in biosensors and apparatus using the same |
| US8778168B2 (en) | 2007-09-28 | 2014-07-15 | Lifescan, Inc. | Systems and methods of discriminating control solution from a physiological sample |
| US8603768B2 (en) | 2008-01-17 | 2013-12-10 | Lifescan, Inc. | System and method for measuring an analyte in a sample |
| US8551320B2 (en) | 2008-06-09 | 2013-10-08 | Lifescan, Inc. | System and method for measuring an analyte in a sample |
| JP5738770B2 (en) | 2008-12-08 | 2015-06-24 | バイエル・ヘルスケア・エルエルシーBayer HealthCareLLC | Biosensor system with signal conditioning |
| CN103210310B (en) | 2010-06-07 | 2015-03-18 | 拜尔健康护理有限责任公司 | Slope-based compensation including secondary output signals |
| JP3167464U (en) | 2010-10-20 | 2011-04-28 | 由英 高藤 | Sanitary napkins package and case |
- 2009
- 2009-05-13USUS12/464,935patent/US8551320B2/enactiveActive
- 2009-06-03AUAU2009202200Apatent/AU2009202200B2/ennot_activeCeased
- 2009-06-03CACA2668237Apatent/CA2668237C/enactiveActive
- 2009-06-08EPEP12164561.8Apatent/EP2482069B1/enactiveActive
- 2009-06-08ESES09251507.1Tpatent/ES2647238T3/enactiveActive
- 2009-06-08EPEP09251507.1Apatent/EP2138841B8/enactiveActive
- 2009-06-08ESES12164561.8Tpatent/ES2481015T3/enactiveActive
- 2009-06-09JPJP2009137856Apatent/JP5237201B2/enactiveActive
- 2011
- 2011-03-18AUAU2011201224Apatent/AU2011201224B2/ennot_activeCeased
- 2012
- 2012-09-14USUS13/620,448patent/US9784707B2/enactiveActive
- 2012-11-29JPJP2012261693Apatent/JP5806195B2/ennot_activeExpired - Fee Related
- 2014
- 2014-05-12JPJP2014098994Apatent/JP5934284B2/enactiveActive
- 2015
- 2015-12-01JPJP2015234775Apatent/JP6306557B2/enactiveActive
Also Published As
| Publication number | Publication date |
|---|---|
| CA2668237A1 (en) | 2009-12-09 |
| EP2482069A1 (en) | 2012-08-01 |
| ES2647238T3 (en) | 2017-12-20 |
| AU2009202200B2 (en) | 2011-01-06 |
| HK1172692A1 (en) | 2013-04-26 |
| EP2138841A2 (en) | 2009-12-30 |
| AU2009202200A1 (en) | 2009-12-24 |
| ES2481015T3 (en) | 2014-07-29 |
| EP2138841A3 (en) | 2011-10-12 |
| EP2138841B1 (en) | 2017-10-18 |
| EP2138841B8 (en) | 2017-12-13 |
| JP5237201B2 (en) | 2013-07-17 |
| AU2011201224B2 (en) | 2012-04-12 |
| AU2011201224A1 (en) | 2011-04-07 |
| US9784707B2 (en) | 2017-10-10 |
| JP5934284B2 (en) | 2016-06-15 |
| JP5806195B2 (en) | 2015-11-10 |
| US8551320B2 (en) | 2013-10-08 |
| JP2013040972A (en) | 2013-02-28 |
| US20130008804A1 (en) | 2013-01-10 |
| JP2014142363A (en) | 2014-08-07 |
| JP2016048258A (en) | 2016-04-07 |
| JP6306557B2 (en) | 2018-04-04 |
| CA2668237C (en) | 2017-02-28 |
| JP2009294213A (en) | 2009-12-17 |
| US20090301899A1 (en) | 2009-12-10 |
Similar Documents
| Publication | Publication Date | Title |
|---|---|---|
| EP2482069B1 (en) | Method for checking whether a test strip is sufficiently filled | |
| EP2508876B1 (en) | Method of identifying a defect in a test strip | |
| AU2012201914B2 (en) | System and method for measuring an analyte in a sample | |
| HK1172692B (en) | Method for checking whether a test strip is sufficiently filled | |
| HK1138641A (en) | System and method for measuring an analyte in a sample | |
| HK1138641B (en) | System and method for measuring an analyte in a sample | |
| HK1175531B (en) | Method of identifying a defect in a test strip | |
| HK1175247B (en) | Method of identifying a defect in a test strip | |
| HK1175246A (en) | Method of identifying an error in performing a test with a test strip | |
| HK1175531A (en) | Method of identifying a defect in a test strip | |
| HK1137809A (en) | System and method for measuring an analyte in a sample | |
| HK1175247A (en) | Method of identifying a defect in a test strip | |
| HK1137809B (en) | System and method for measuring an analyte in a sample | |
| HK1175246B (en) | Method of identifying an error in performing a test with a test strip | |
| HK1237875A1 (en) | System and method for measuring an analyte in a sample |
Legal Events
| Date | Code | Title | Description |
|---|---|---|---|
| PUAI | Public reference made under article 153(3) epc to a published international application that has entered the european phase | Free format text:ORIGINAL CODE: 0009012 | |
| AC | Divisional application: reference to earlier application | Ref document number:2138841 Country of ref document:EP Kind code of ref document:P | |
| AK | Designated contracting states | Kind code of ref document:A1 Designated state(s):AT BE BG CH CY CZ DE DK EE ES FI FR GB GR HR HU IE IS IT LI LT LU LV MC MK MT NL NO PL PT RO SE SI SK TR | |
| AX | Request for extension of the european patent | Extension state:AL BA RS | |
| 17P | Request for examination filed | Effective date:20130201 | |
| 17Q | First examination report despatched | Effective date:20130502 | |
| GRAP | Despatch of communication of intention to grant a patent | Free format text:ORIGINAL CODE: EPIDOSNIGR1 | |
| INTG | Intention to grant announced | Effective date:20131010 | |
| GRAS | Grant fee paid | Free format text:ORIGINAL CODE: EPIDOSNIGR3 | |
| GRAA | (expected) grant | Free format text:ORIGINAL CODE: 0009210 | |
| AC | Divisional application: reference to earlier application | Ref document number:2138841 Country of ref document:EP Kind code of ref document:P | |
| AK | Designated contracting states | Kind code of ref document:B1 Designated state(s):AT BE BG CH CY CZ DE DK EE ES FI FR GB GR HR HU IE IS IT LI LT LU LV MC MK MT NL NO PL PT RO SE SI SK TR | |
| REG | Reference to a national code | Ref country code:GB Ref legal event code:FG4D | |
| REG | Reference to a national code | Ref country code:AT Ref legal event code:REF Ref document number:668658 Country of ref document:AT Kind code of ref document:T Effective date:20140615 | |
| REG | Reference to a national code | Ref country code:IE Ref legal event code:FG4D | |
| REG | Reference to a national code | Ref country code:DE Ref legal event code:R096 Ref document number:602009024186 Country of ref document:DE Effective date:20140626 | |
| REG | Reference to a national code | Ref country code:ES Ref legal event code:FG2A Ref document number:2481015 Country of ref document:ES Kind code of ref document:T3 Effective date:20140729 | |
| REG | Reference to a national code | Ref country code:NL Ref legal event code:T3 | |
| REG | Reference to a national code | Ref country code:AT Ref legal event code:MK05 Ref document number:668658 Country of ref document:AT Kind code of ref document:T Effective date:20140514 | |
| REG | Reference to a national code | Ref country code:LT Ref legal event code:MG4D | |
| PG25 | Lapsed in a contracting state [announced via postgrant information from national office to epo] | Ref country code:CY Free format text:LAPSE BECAUSE OF FAILURE TO SUBMIT A TRANSLATION OF THE DESCRIPTION OR TO PAY THE FEE WITHIN THE PRESCRIBED TIME-LIMIT Effective date:20140514 Ref country code:GR Free format text:LAPSE BECAUSE OF FAILURE TO SUBMIT A TRANSLATION OF THE DESCRIPTION OR TO PAY THE FEE WITHIN THE PRESCRIBED TIME-LIMIT Effective date:20140815 Ref country code:NO Free format text:LAPSE BECAUSE OF FAILURE TO SUBMIT A TRANSLATION OF THE DESCRIPTION OR TO PAY THE FEE WITHIN THE PRESCRIBED TIME-LIMIT Effective date:20140814 Ref country code:LT Free format text:LAPSE BECAUSE OF FAILURE TO SUBMIT A TRANSLATION OF THE DESCRIPTION OR TO PAY THE FEE WITHIN THE PRESCRIBED TIME-LIMIT Effective date:20140514 Ref country code:IS Free format text:LAPSE BECAUSE OF FAILURE TO SUBMIT A TRANSLATION OF THE DESCRIPTION OR TO PAY THE FEE WITHIN THE PRESCRIBED TIME-LIMIT Effective date:20140914 Ref country code:FI Free format text:LAPSE BECAUSE OF FAILURE TO SUBMIT A TRANSLATION OF THE DESCRIPTION OR TO PAY THE FEE WITHIN THE PRESCRIBED TIME-LIMIT Effective date:20140514 | |
| PG25 | Lapsed in a contracting state [announced via postgrant information from national office to epo] | Ref country code:SE Free format text:LAPSE BECAUSE OF FAILURE TO SUBMIT A TRANSLATION OF THE DESCRIPTION OR TO PAY THE FEE WITHIN THE PRESCRIBED TIME-LIMIT Effective date:20140514 Ref country code:PL Free format text:LAPSE BECAUSE OF FAILURE TO SUBMIT A TRANSLATION OF THE DESCRIPTION OR TO PAY THE FEE WITHIN THE PRESCRIBED TIME-LIMIT Effective date:20140514 Ref country code:LV Free format text:LAPSE BECAUSE OF FAILURE TO SUBMIT A TRANSLATION OF THE DESCRIPTION OR TO PAY THE FEE WITHIN THE PRESCRIBED TIME-LIMIT Effective date:20140514 Ref country code:AT Free format text:LAPSE BECAUSE OF FAILURE TO SUBMIT A TRANSLATION OF THE DESCRIPTION OR TO PAY THE FEE WITHIN THE PRESCRIBED TIME-LIMIT Effective date:20140514 Ref country code:HR Free format text:LAPSE BECAUSE OF FAILURE TO SUBMIT A TRANSLATION OF THE DESCRIPTION OR TO PAY THE FEE WITHIN THE PRESCRIBED TIME-LIMIT Effective date:20140514 | |
| PG25 | Lapsed in a contracting state [announced via postgrant information from national office to epo] | Ref country code:PT Free format text:LAPSE BECAUSE OF FAILURE TO SUBMIT A TRANSLATION OF THE DESCRIPTION OR TO PAY THE FEE WITHIN THE PRESCRIBED TIME-LIMIT Effective date:20140915 | |
| PG25 | Lapsed in a contracting state [announced via postgrant information from national office to epo] | Ref country code:DK Free format text:LAPSE BECAUSE OF FAILURE TO SUBMIT A TRANSLATION OF THE DESCRIPTION OR TO PAY THE FEE WITHIN THE PRESCRIBED TIME-LIMIT Effective date:20140514 Ref country code:EE Free format text:LAPSE BECAUSE OF FAILURE TO SUBMIT A TRANSLATION OF THE DESCRIPTION OR TO PAY THE FEE WITHIN THE PRESCRIBED TIME-LIMIT Effective date:20140514 Ref country code:CZ Free format text:LAPSE BECAUSE OF FAILURE TO SUBMIT A TRANSLATION OF THE DESCRIPTION OR TO PAY THE FEE WITHIN THE PRESCRIBED TIME-LIMIT Effective date:20140514 Ref country code:RO Free format text:LAPSE BECAUSE OF FAILURE TO SUBMIT A TRANSLATION OF THE DESCRIPTION OR TO PAY THE FEE WITHIN THE PRESCRIBED TIME-LIMIT Effective date:20140514 Ref country code:SK Free format text:LAPSE BECAUSE OF FAILURE TO SUBMIT A TRANSLATION OF THE DESCRIPTION OR TO PAY THE FEE WITHIN THE PRESCRIBED TIME-LIMIT Effective date:20140514 Ref country code:BE Free format text:LAPSE BECAUSE OF FAILURE TO SUBMIT A TRANSLATION OF THE DESCRIPTION OR TO PAY THE FEE WITHIN THE PRESCRIBED TIME-LIMIT Effective date:20140514 | |
| REG | Reference to a national code | Ref country code:CH Ref legal event code:PL | |
| REG | Reference to a national code | Ref country code:DE Ref legal event code:R097 Ref document number:602009024186 Country of ref document:DE | |
| REG | Reference to a national code | Ref country code:HK Ref legal event code:GR Ref document number:1172692 Country of ref document:HK | |
| PLBE | No opposition filed within time limit | Free format text:ORIGINAL CODE: 0009261 | |
| STAA | Information on the status of an ep patent application or granted ep patent | Free format text:STATUS: NO OPPOSITION FILED WITHIN TIME LIMIT | |
| 26N | No opposition filed | Effective date:20150217 | |
| PG25 | Lapsed in a contracting state [announced via postgrant information from national office to epo] | Ref country code:IT Free format text:LAPSE BECAUSE OF FAILURE TO SUBMIT A TRANSLATION OF THE DESCRIPTION OR TO PAY THE FEE WITHIN THE PRESCRIBED TIME-LIMIT Effective date:20140514 Ref country code:CH Free format text:LAPSE BECAUSE OF NON-PAYMENT OF DUE FEES Effective date:20140630 Ref country code:LI Free format text:LAPSE BECAUSE OF NON-PAYMENT OF DUE FEES Effective date:20140630 | |
| REG | Reference to a national code | Ref country code:DE Ref legal event code:R097 Ref document number:602009024186 Country of ref document:DE Effective date:20150217 | |
| PG25 | Lapsed in a contracting state [announced via postgrant information from national office to epo] | Ref country code:SI Free format text:LAPSE BECAUSE OF FAILURE TO SUBMIT A TRANSLATION OF THE DESCRIPTION OR TO PAY THE FEE WITHIN THE PRESCRIBED TIME-LIMIT Effective date:20140514 | |
| PG25 | Lapsed in a contracting state [announced via postgrant information from national office to epo] | Ref country code:MT Free format text:LAPSE BECAUSE OF FAILURE TO SUBMIT A TRANSLATION OF THE DESCRIPTION OR TO PAY THE FEE WITHIN THE PRESCRIBED TIME-LIMIT Effective date:20140514 | |
| PG25 | Lapsed in a contracting state [announced via postgrant information from national office to epo] | Ref country code:MC Free format text:LAPSE BECAUSE OF FAILURE TO SUBMIT A TRANSLATION OF THE DESCRIPTION OR TO PAY THE FEE WITHIN THE PRESCRIBED TIME-LIMIT Effective date:20140514 | |
| REG | Reference to a national code | Ref country code:FR Ref legal event code:PLFP Year of fee payment:8 | |
| PG25 | Lapsed in a contracting state [announced via postgrant information from national office to epo] | Ref country code:BG Free format text:LAPSE BECAUSE OF FAILURE TO SUBMIT A TRANSLATION OF THE DESCRIPTION OR TO PAY THE FEE WITHIN THE PRESCRIBED TIME-LIMIT Effective date:20140514 | |
| PG25 | Lapsed in a contracting state [announced via postgrant information from national office to epo] | Ref country code:HU Free format text:LAPSE BECAUSE OF FAILURE TO SUBMIT A TRANSLATION OF THE DESCRIPTION OR TO PAY THE FEE WITHIN THE PRESCRIBED TIME-LIMIT; INVALID AB INITIO Effective date:20090608 Ref country code:LU Free format text:LAPSE BECAUSE OF NON-PAYMENT OF DUE FEES Effective date:20140608 Ref country code:TR Free format text:LAPSE BECAUSE OF FAILURE TO SUBMIT A TRANSLATION OF THE DESCRIPTION OR TO PAY THE FEE WITHIN THE PRESCRIBED TIME-LIMIT Effective date:20140514 | |
| REG | Reference to a national code | Ref country code:FR Ref legal event code:PLFP Year of fee payment:9 | |
| REG | Reference to a national code | Ref country code:FR Ref legal event code:PLFP Year of fee payment:10 | |
| PG25 | Lapsed in a contracting state [announced via postgrant information from national office to epo] | Ref country code:MK Free format text:LAPSE BECAUSE OF FAILURE TO SUBMIT A TRANSLATION OF THE DESCRIPTION OR TO PAY THE FEE WITHIN THE PRESCRIBED TIME-LIMIT Effective date:20140514 | |
| PGFP | Annual fee paid to national office [announced via postgrant information from national office to epo] | Ref country code:IT Payment date:20190619 Year of fee payment:8 | |
| PGFP | Annual fee paid to national office [announced via postgrant information from national office to epo] | Ref country code:GB Payment date:20190605 Year of fee payment:11 Ref country code:ES Payment date:20190701 Year of fee payment:11 | |
| GBPC | Gb: european patent ceased through non-payment of renewal fee | Effective date:20200608 | |
| PG25 | Lapsed in a contracting state [announced via postgrant information from national office to epo] | Ref country code:IE Free format text:LAPSE BECAUSE OF NON-PAYMENT OF DUE FEES Effective date:20200608 Ref country code:GB Free format text:LAPSE BECAUSE OF NON-PAYMENT OF DUE FEES Effective date:20200608 | |
| REG | Reference to a national code | Ref country code:ES Ref legal event code:FD2A Effective date:20211103 | |
| PG25 | Lapsed in a contracting state [announced via postgrant information from national office to epo] | Ref country code:ES Free format text:LAPSE BECAUSE OF NON-PAYMENT OF DUE FEES Effective date:20200609 | |
| REG | Reference to a national code | Ref country code:FR Ref legal event code:PLFP Year of fee payment:15 | |
| PGFP | Annual fee paid to national office [announced via postgrant information from national office to epo] | Ref country code:NL Payment date:20240415 Year of fee payment:16 | |
| PGFP | Annual fee paid to national office [announced via postgrant information from national office to epo] | Ref country code:FR Payment date:20240328 Year of fee payment:16 | |
| PGFP | Annual fee paid to national office [announced via postgrant information from national office to epo] | Ref country code:DE Payment date:20240328 Year of fee payment:16 |