EP2264451A1 - Method and apparatus for correcting ambient temperature effect in biosensor - Google Patents
Method and apparatus for correcting ambient temperature effect in biosensorDownload PDFInfo
- Publication number
- EP2264451A1 EP2264451A1EP10173366AEP10173366AEP2264451A1EP 2264451 A1EP2264451 A1EP 2264451A1EP 10173366 AEP10173366 AEP 10173366AEP 10173366 AEP10173366 AEP 10173366AEP 2264451 A1EP2264451 A1EP 2264451A1
- Authority
- EP
- European Patent Office
- Prior art keywords
- analyte concentration
- concentration value
- degrees celsius
- percent
- ambient temperature
- Prior art date
- Legal status (The legal status is an assumption and is not a legal conclusion. Google has not performed a legal analysis and makes no representation as to the accuracy of the status listed.)
- Withdrawn
Links
Images

Classifications
- C—CHEMISTRY; METALLURGY
- C12—BIOCHEMISTRY; BEER; SPIRITS; WINE; VINEGAR; MICROBIOLOGY; ENZYMOLOGY; MUTATION OR GENETIC ENGINEERING
- C12Q—MEASURING OR TESTING PROCESSES INVOLVING ENZYMES, NUCLEIC ACIDS OR MICROORGANISMS; COMPOSITIONS OR TEST PAPERS THEREFOR; PROCESSES OF PREPARING SUCH COMPOSITIONS; CONDITION-RESPONSIVE CONTROL IN MICROBIOLOGICAL OR ENZYMOLOGICAL PROCESSES
- C12Q1/00—Measuring or testing processes involving enzymes, nucleic acids or microorganisms; Compositions therefor; Processes of preparing such compositions
- C12Q1/001—Enzyme electrodes
- C12Q1/005—Enzyme electrodes involving specific analytes or enzymes
- C12Q1/006—Enzyme electrodes involving specific analytes or enzymes for glucose
- G—PHYSICS
- G01—MEASURING; TESTING
- G01N—INVESTIGATING OR ANALYSING MATERIALS BY DETERMINING THEIR CHEMICAL OR PHYSICAL PROPERTIES
- G01N27/00—Investigating or analysing materials by the use of electric, electrochemical, or magnetic means
- G01N27/26—Investigating or analysing materials by the use of electric, electrochemical, or magnetic means by investigating electrochemical variables; by using electrolysis or electrophoresis
- G01N27/28—Electrolytic cell components
- G01N27/30—Electrodes, e.g. test electrodes; Half-cells
- G01N27/327—Biochemical electrodes, e.g. electrical or mechanical details for in vitro measurements
- G01N27/3271—Amperometric enzyme electrodes for analytes in body fluids, e.g. glucose in blood
- G01N27/3274—Corrective measures, e.g. error detection, compensation for temperature or hematocrit, calibration
- Y—GENERAL TAGGING OF NEW TECHNOLOGICAL DEVELOPMENTS; GENERAL TAGGING OF CROSS-SECTIONAL TECHNOLOGIES SPANNING OVER SEVERAL SECTIONS OF THE IPC; TECHNICAL SUBJECTS COVERED BY FORMER USPC CROSS-REFERENCE ART COLLECTIONS [XRACs] AND DIGESTS
- Y10—TECHNICAL SUBJECTS COVERED BY FORMER USPC
- Y10T—TECHNICAL SUBJECTS COVERED BY FORMER US CLASSIFICATION
- Y10T436/00—Chemistry: analytical and immunological testing
- Y10T436/14—Heterocyclic carbon compound [i.e., O, S, N, Se, Te, as only ring hetero atom]
- Y10T436/142222—Hetero-O [e.g., ascorbic acid, etc.]
- Y10T436/143333—Saccharide [e.g., DNA, etc.]
- Y10T436/144444—Glucose
Definitions
- the present inventionrelates to a biosensor, and, more particularly, to a new and improved method and apparatus for correcting ambient temperature effect in biosensors.
- the quantitative determination of analytes in body fluidsis of great importance in the diagnoses and maintenance of certain physiological abnormalities. For example lactate, cholesterol and bilirubin should be monitored in certain individuals.
- the determination of glucose in body fluidsis of great importance to diabetic individuals who must frequently check the level of glucose in their body fluids as a means of regulating the glucose intake in their diets. While the remainder of the disclosure herein will be directed towards the determination of glucose, it is to be understood that the procedure and apparatus of this invention can be used for the determination of other analytes upon selection of the appropriate enzyme.
- the ideal diagnostic device for the detection of glucose in fluidsmust be simple, so as not to require a high degree of technical skill on the part of the technician administering the test. In many cases, these tests are administered by the patient which lends further emphasis to the need for a test which is easy to carry out. Additionally, such a device should be based upon elements which are sufficiently stable to meet situations of prolonged storage.
- Methods for determining analyte concentration in fluidscan be based on the electrochemical reaction between an enzyme and the analyte specific to the enzyme and a mediator which maintains the enzyme in its initial oxidation state.
- Suitable redox enzymesinclude oxidases, dehydrogenases, catalase and peroxidase.
- glucoseis the analyte
- the reaction with glucose oxidase and oxygenis represented by equation (A).
- the released hydrogen peroxidein the presence of a peroxidase, causes a color change in a redox indicator which color change is proportional to the level of glucose in the test fluid.
- colorimetric testscan be made semi-quantitative by the use of color charts for comparison of the color change of the redox indicator with the color change obtained using test fluids of known glucose concentration, and can be rendered more highly quantitative by reading the result with a spectrophotometric instrument, the results are generally not as accurate nor are they obtained as quickly as those obtained using an electrochemical biosensor.
- biosensoris intended to refer to an analytical device that responds selectively to analytes in an appropriate sample and converts their concentration into an electrical signal via a combination of a biological recognition signal and a physico-chemical transducer.
- a biosensoris an instrument which generates an electrical signal directly thereby facilitating a simplified design.
- a biosensoroffers the advantage of low material cost since a thin layer of chemicals is deposited on the electrodes and little material is wasted.
- H 2 O 2 ⁇ O 2 + 2H + + 2e - (B)The electron flow is then converted to the electrical signal which directly correlates to the glucose concentration.
- glucose present in the test sampleconverts the oxidized flavin adenine dinucleotide (FAD) center of the enzyme into its reduced form, (FADH 2 ). Because these redox centers are essentially electrically insulated within the enzyme molecule, direct electron transfer to the surface of a conventional electrode does not occur to any measurable degree in the absence of an unacceptably high overvoltage.
- An improvement to this systeminvolves the use of a nonphysiological redox coupling between the electrode and the enzyme to shuttle electrons between the (FADH 2 ) and the electrode.
- GO(FAD)represents the oxidized form of glucose oxidase and GO(FADH 2 ) indicates its reduced form.
- the mediating species M redshuttles electrons from the reduced enzyme to the electrode thereby oxidizing the enzyme causing its regeneration in situ which, of course, is desirable for reasons of economy.
- the main purpose for using a mediatoris to reduce the working potential of the sensor. An ideal mediator would be re-oxidized at the electrode at a low potential under which impurity in the chemical layer and interfering substances in the sample would not be oxidized thereby minimizing interference.
- mediatorsare useful as mediators due to their ability to accept electrons from the reduced enzyme and transfer them to the electrode.
- mediators known to be useful as electron transfer agents in analytical determinationsare the substituted benzo- and naphthoquinones disclosed in U.S. Patent 4,746,607 ; the N-oxides, nitroso compounds, hydroxylamines and oxines specifically disclosed in EP 0 354 441 ; the flavins, phenazines, phenothiazines, indophenols, substituted 1,4-benzoquinones and indamins disclosed in EP 0 330 517 and the phenazinium/phenoxazinium salts described in U.S. Patent 3,791,988 .
- a comprehensive review of electrochemical mediators of biological redox systemscan be found in Analytica Clinica Acta. 140 (1982), Pp 1-18 .
- hexacyanoferratealso known as ferricyanide
- ferricyanidewhich is discussed by Schläpfer et al in Clinica Chimica Acta., 57 (1974), Pp. 283-289 .
- U.S. Patent 4,929,545there is disclosed the use of a soluble ferricyanide compound in combination with a soluble ferric compound in a composition for enzymatically determining an analyte in a sample.
- Substituting the iron salt of ferricyanide for oxygen in equation (A)provides: since the ferricyanide is reduced to ferrocyanide by its acceptance of electrons from the glucose oxidase enzyme.
- Important objects of the present inventionare to provide a new and improved method and apparatus for correcting ambient temperature effect in biosensors; to provide such method and apparatus that eliminates or minimizes the ambient temperature effect in analyte concentration value identified by a biosensor; and to provide such method and apparatus that overcome many of the disadvantages of prior art arrangements.
- a method and apparatusare provided for correcting ambient temperature effect in biosensors.
- An ambient temperature valueis measured.
- a sampleis applied to the biosensors, then a current generated in the test sample is measured.
- An observed analyte concentration valueis calculated from the current through a standard response curve. The observed analyte concentration is then modified utilizing the measured ambient temperature value to thereby increase the accuracy of the analyte determination.
- G 1is said observed analyte concentration value
- T 2is said measured ambient temperature value and 11
- I 2 , S1, and S2are predetermined parameters.
- Biosensor system 100includes a microprocessor 102 together with an associated memory 104 for storing program and user data.
- a meter function 106 coupled to biosensor 108is operatively controlled by the microprocessor 102 for recording test values, such as blood glucose test values.
- An ON/OFF input at a line 110 responsive to the user ON/OFF input operationis coupled to the microprocessor 102 for performing the blood test sequence mode of biosensor system 100.
- a system features input at a line 112 responsive to a user input operationis coupled to the microprocessor 102 for selectively performing the system features mode of biosensor 100.
- a signal input indicated at a line 120is coupled to the microprocessor 102 providing temperature information from a thermistor 122 in accordance with the invention.
- Microprocessor 102contains suitable programming to perform the methods of the invention as illustrated in FIG. 2 .
- a display 150is coupled to the microprocessor 102 for displaying information to the user including test results.
- a battery monitor function 160is coupled to the microprocessor 102 for detecting a low or dead battery condition.
- An alarm function 162is coupled to the microprocessor 102 for detecting predefined system conditions and for generating alarm indications for the user of biosensor system 100.
- a data port or communications interface 164couples data to and from a connected computer (not shown).
- biosensor system 100performs a temperature correction method of the preferred embodiment.
- logical steps performed in accordance with the method for correcting ambient temperature effect in biosensors 108 by the biosensor processor 102begin at block 200.
- First ambient temperatureis measured as indicated at a block 202 labeled MEASURE INSTRUMENT TEMPERATURE T2.
- sensor currentis measured as indicated at a block 204.
- the measured current valueis converted into an analyte concentration value, such as glucose concentration value (observed concentration), as indicated at a block 206.
- correction for temperature effectis performed in a final glucose concentration calculation as indicated at a block 208.
- G 1is said observed analyte concentration value
- T 2is said measured ambient temperature value
- I1, I2, S1, and S2are predetermined parameters. This completes the sequence as indicated at a block 210.
- Amperometric biosensors 108are known to be sensitive to temperature. This temperature effect occurs because diffusion of the mediator to the working electrode is temperature dependent. Diffusion typically induces a temperature effect of 1 - 2% bias per degree centigrade. Therefore temperatures as low as 10°C would produce results with a bias of about -25% and temperatures as high as 40°C would produce results with a bias about +25%.
- the system 100 instrumentprovides results between 0 to 50°C. The only available temperature measurement comes from a thermistor inside the instrument. In order to reduce the temperature bias it was necessary to develop a temperature correction algorithm.
- the temperature effectwas determined experimentally by biosensor system 100 whole blood glucose assay over the entire glucose (50 to 600 mg/dL) and temperature range (10 to 40°C) expected to be encountered. Actual blood glucose readings and sample temperatures were measured. This was done for six different sensor 108 lots. When the "compound interest” temperature correction method was used, several lots had percent biases of -10% to -13% at the extreme temperatures.
- the "compound interest” algorithmdid not work well because the temperature coefficient, tc, changed with glucose concentration.
- a "polynomial” correction algorithmwas invented to handle the varying temperature coefficient problem. By using a polynomial correction algorithm, the percent bias was limited to within +/-10%. The equation for the polynomial correction method is described in Equation #2. The grand sum of the absolute bias for both methods indicated that the polynomial correction method had less overall bias. Also, at the very extreme temperatures of 2 and 49°C, the polynomial correction method had lower bias (below 13.5%) where as the compound interest method was as high as -25%.
- the polynomial correction methodprovided an improvement over the "compound interest" correction method.
- G 2G 1 - T 2 2 - 24 2 * I ⁇ 2 - T 2 - 24 * I ⁇ 1 T 2 2 - 24 2 * S ⁇ 2 + T 2 - 24 * S ⁇ 1 + 1
- G 1is the observed glucose concentration
- T 2is the sample temperature
- I1, 12, S1, and S2are the predetermined coefficients.
- Table 1shows an example of the temperature correction results.
- T 2is the sample temperature.
- G Ris the reference glucose valve.
- Iis the measured current.
- G 1is the observed glucose concentration (without temperature correction).
- %Bis the percent bias without temperature correction.
- G 2is the temperature corrected glucose concentration.
- %B Cis the percent bias after temperature correction.
- the datashows the percent bias before and after the correction algorithm was applied.
- the algorithm and coefficientswere able to reduce the percent bias at the extreme temperatures of 10 to 40°C to within +/-7%.
- thermocouplewas inserted into a sensor without chemistry, and temperature data was collected every second after the blood was added to the sensor.
- Table 2Lot C Actual YSI Glucose and Current Response Sample Temp. YSI Current Slope Intercept 8.7°C 54.2 1063 8.7°C 412.5 4358 9.20 564.6 16.7°C 54.9 1148 16.7°C 414.9 4750 9.98 610.2 23.9°C 55.7 1223 23.9°C 418 5359 11.42 587.1 30.6oC 49.3 1203 30.6oC 408.4 5787 12.77 573.7 38.2oC 51.6 1275 38.2oC 418.7 6833 15.14 493.8
- the observed glucose concentration(G 1 ) was plotted against the sample temperature (T 2 ).
- the 2nd order polynomial curvewas used to fit the plot and the a1 and a2 constants for that level of glucose were obtained as provided in Table 4.
- a computer programsuch as Slidewrite by Advanced Graphics Software Inc., or any other equivalent curve fitting program can be used.
- the a1 values obtained for the different levels of glucosewere plotted against the glucose concentration.
- the datawas plotted using a linear fit, and the coefficients S1 (slope of the linear fit) and I1 (intercept of the linear fit) were generated.
- the Slidewrite program on a PC by Advanced Graphics Software Inc., or any other equivalent curve fitting programcan be used.
- the a2 values obtained for the different levels of glucosewere also plotted against the glucose concentration.
- the datawas plotted using a linear fit, and the coefficients S2 (slope of the linear fit) and 12 (intercept of the linear fit) were generated.
- G 1T 2 2 * a ⁇ 2 + T 2 * a ⁇ 1 + a ⁇ 0
- G 2 (Corrected)G 1 (observed)
- G 224 2 * a ⁇ 2 + 24 * a ⁇ 1 + a ⁇ 0
Landscapes
- Health & Medical Sciences (AREA)
- Chemical & Material Sciences (AREA)
- Life Sciences & Earth Sciences (AREA)
- Organic Chemistry (AREA)
- Biochemistry (AREA)
- General Health & Medical Sciences (AREA)
- Hematology (AREA)
- Proteomics, Peptides & Aminoacids (AREA)
- Engineering & Computer Science (AREA)
- Analytical Chemistry (AREA)
- Immunology (AREA)
- Zoology (AREA)
- Molecular Biology (AREA)
- Physics & Mathematics (AREA)
- Wood Science & Technology (AREA)
- Electrochemistry (AREA)
- Pathology (AREA)
- Bioinformatics & Cheminformatics (AREA)
- General Engineering & Computer Science (AREA)
- Biotechnology (AREA)
- Genetics & Genomics (AREA)
- Biophysics (AREA)
- Chemical Kinetics & Catalysis (AREA)
- Emergency Medicine (AREA)
- Microbiology (AREA)
- General Physics & Mathematics (AREA)
- Investigating Or Analysing Biological Materials (AREA)
- Measuring Or Testing Involving Enzymes Or Micro-Organisms (AREA)
- Indication And Recording Devices For Special Purposes And Tariff Metering Devices (AREA)
- Investigating Or Analyzing Materials Using Thermal Means (AREA)
- Radar Systems Or Details Thereof (AREA)
- Analysing Materials By The Use Of Radiation (AREA)
- Amplifiers (AREA)
Abstract

Description
- The present invention relates to a biosensor, and, more particularly, to a new and improved method and apparatus for correcting ambient temperature effect in biosensors.
- The quantitative determination of analytes in body fluids is of great importance in the diagnoses and maintenance of certain physiological abnormalities. For example lactate, cholesterol and bilirubin should be monitored in certain individuals. In particular, the determination of glucose in body fluids is of great importance to diabetic individuals who must frequently check the level of glucose in their body fluids as a means of regulating the glucose intake in their diets. While the remainder of the disclosure herein will be directed towards the determination of glucose, it is to be understood that the procedure and apparatus of this invention can be used for the determination of other analytes upon selection of the appropriate enzyme. The ideal diagnostic device for the detection of glucose in fluids must be simple, so as not to require a high degree of technical skill on the part of the technician administering the test. In many cases, these tests are administered by the patient which lends further emphasis to the need for a test which is easy to carry out. Additionally, such a device should be based upon elements which are sufficiently stable to meet situations of prolonged storage.
- Methods for determining analyte concentration in fluids can be based on the electrochemical reaction between an enzyme and the analyte specific to the enzyme and a mediator which maintains the enzyme in its initial oxidation state. Suitable redox enzymes include oxidases, dehydrogenases, catalase and peroxidase. For example, in the case where glucose is the analyte, the reaction with glucose oxidase and oxygen is represented by equation (A).

- In a colorimetric assay, the released hydrogen peroxide, in the presence of a peroxidase, causes a color change in a redox indicator which color change is proportional to the level of glucose in the test fluid. While colorimetric tests can be made semi-quantitative by the use of color charts for comparison of the color change of the redox indicator with the color change obtained using test fluids of known glucose concentration, and can be rendered more highly quantitative by reading the result with a spectrophotometric instrument, the results are generally not as accurate nor are they obtained as quickly as those obtained using an electrochemical biosensor. As used herein, the term biosensor is intended to refer to an analytical device that responds selectively to analytes in an appropriate sample and converts their concentration into an electrical signal via a combination of a biological recognition signal and a physico-chemical transducer. Aside from its greater accuracy, a biosensor is an instrument which generates an electrical signal directly thereby facilitating a simplified design. Furthermore, a biosensor offers the advantage of low material cost since a thin layer of chemicals is deposited on the electrodes and little material is wasted.
H2O2 → O2 + 2H+ + 2e- (B)
The electron flow is then converted to the electrical signal which directly correlates to the glucose concentration. - In the initial step of the reaction represented by equation (A), glucose present in the test sample converts the oxidized flavin adenine dinucleotide (FAD) center of the enzyme into its reduced form, (FADH2). Because these redox centers are essentially electrically insulated within the enzyme molecule, direct electron transfer to the surface of a conventional electrode does not occur to any measurable degree in the absence of an unacceptably high overvoltage. An improvement to this system involves the use of a nonphysiological redox coupling between the electrode and the enzyme to shuttle electrons between the (FADH2) and the electrode. This is represented by the following scheme in which the redox coupler, typically referred to as a mediator, is represented by M:
Glucose + GO(FAD) → gluconolactone + GO(FADH2)
GO(FADH2) + 2MOX → GO(FAD) + 2Mred + 2H+
2Mred → 2MOX + 2e- (at the electrode) - In this scheme, GO(FAD) represents the oxidized form of glucose oxidase and GO(FADH2) indicates its reduced form. The mediating species Mred shuttles electrons from the reduced enzyme to the electrode thereby oxidizing the enzyme causing its regeneration in situ which, of course, is desirable for reasons of economy. The main purpose for using a mediator is to reduce the working potential of the sensor. An ideal mediator would be re-oxidized at the electrode at a low potential under which impurity in the chemical layer and interfering substances in the sample would not be oxidized thereby minimizing interference.
- Many compounds are useful as mediators due to their ability to accept electrons from the reduced enzyme and transfer them to the electrode. Among the mediators known to be useful as electron transfer agents in analytical determinations are the substituted benzo- and naphthoquinones disclosed in
U.S. Patent 4,746,607 ; the N-oxides, nitroso compounds, hydroxylamines and oxines specifically disclosed inEP 0 354 441 ; the flavins, phenazines, phenothiazines, indophenols, substituted 1,4-benzoquinones and indamins disclosed inEP 0 330 517 and the phenazinium/phenoxazinium salts described inU.S. Patent 3,791,988 . A comprehensive review of electrochemical mediators of biological redox systems can be found inAnalytica Clinica Acta. 140 (1982), Pp 1-18. - Among the more venerable mediators is hexacyanoferrate, also known as ferricyanide, which is discussed bySchläpfer et al in Clinica Chimica Acta., 57 (1974), Pp. 283-289. In
U.S. Patent 4,929,545 there is disclosed the use of a soluble ferricyanide compound in combination with a soluble ferric compound in a composition for enzymatically determining an analyte in a sample. Substituting the iron salt of ferricyanide
since the ferricyanide is reduced to ferrocyanide by its acceptance of electrons from the glucose oxidase enzyme. - Another way of expressing this reaction is by use of the following equation (C):
Glucose + GO(FAD) → Gluconolactone + GO(FADH2) GO(FADH2) + 2 FE(CN3)3-6 → GO(FAD) + 2 FE(CN)64-+ 2H+ 2 FE(CN)64- → 2 FE(CN)63- + 2e- (at the electrode) (C)
The electrons released are directly proportional to the amount of glucose in the test fluid and can be related thereto by measurement of the current which is produced upon the application of a potential thereto. Oxidation of the ferrocyanide at the anode renews the cycle. - Important objects of the present invention are to provide a new and improved method and apparatus for correcting ambient temperature effect in biosensors; to provide such method and apparatus that eliminates or minimizes the ambient temperature effect in analyte concentration value identified by a biosensor; and to provide such method and apparatus that overcome many of the disadvantages of prior art arrangements.
- In brief, a method and apparatus are provided for correcting ambient temperature effect in biosensors. An ambient temperature value is measured. A sample is applied to the biosensors, then a current generated in the test sample is measured. An observed analyte concentration value is calculated from the current through a standard response curve. The observed analyte concentration is then modified utilizing the measured ambient temperature value to thereby increase the accuracy of the analyte determination.
- In accordance with a feature of the invention, the analyte concentration value is calculated by solving the following equation:

where G1 is said observed analyte concentration value, T2 is said measured ambient temperature value and 11, I2, S1, and S2 are predetermined parameters. - The present invention together with the above and other objects and advantages may best be understood from the following detailed description of the preferred embodiments of the invention illustrated in the drawings, wherein:
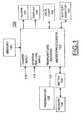
FIG. 1 is a block diagram representation of biosensor in accordance with the present invention;FIG. 2 is a flow chart illustrating logical steps performed in accordance with the present invention of the method correcting ambient temperature effect in biosensors by the biosensor ofFIG. 1 .- Having reference now to the drawings, in
FIG. 1 there is shown a block diagram representation of biosensor system designated as a whole by thereference character 100 and arranged in accordance with principles of the present invention.Biosensor system 100 includes amicroprocessor 102 together with an associatedmemory 104 for storing program and user data. Ameter function 106 coupled tobiosensor 108 is operatively controlled by themicroprocessor 102 for recording test values, such as blood glucose test values. An ON/OFF input at aline 110 responsive to the user ON/OFF input operation is coupled to themicroprocessor 102 for performing the blood test sequence mode ofbiosensor system 100. A system features input at aline 112 responsive to a user input operation is coupled to themicroprocessor 102 for selectively performing the system features mode ofbiosensor 100. A signal input indicated at aline 120 is coupled to themicroprocessor 102 providing temperature information from athermistor 122 in accordance with the invention.Microprocessor 102 contains suitable programming to perform the methods of the invention as illustrated inFIG. 2 . - A
display 150 is coupled to themicroprocessor 102 for displaying information to the user including test results. Abattery monitor function 160 is coupled to themicroprocessor 102 for detecting a low or dead battery condition. Analarm function 162 is coupled to themicroprocessor 102 for detecting predefined system conditions and for generating alarm indications for the user ofbiosensor system 100. A data port or communications interface 164 couples data to and from a connected computer (not shown). - In accordance with the invention, to reduce the temperature bias,
biosensor system 100 performs a temperature correction method of the preferred embodiment. - Referring to
FIG. 2 , logical steps performed in accordance with the method for correcting ambient temperature effect inbiosensors 108 by thebiosensor processor 102 begin at block 200. First ambient temperature is measured as indicated at ablock 202 labeled MEASURE INSTRUMENT TEMPERATURE T2. Then sensor current is measured as indicated at ablock 204. Next the measured current value is converted into an analyte concentration value, such as glucose concentration value (observed concentration), as indicated at ablock 206. Then correction for temperature effect is performed in a final glucose concentration calculation as indicated at ablock 208. The temperature corrected glucose concentration is calculated utilizing the following equation:
where G1 is said observed analyte concentration value, T2 is said measured ambient temperature value and I1, I2, S1, and S2 are predetermined parameters. This completes the sequence as indicated at ablock 210. Amperometric biosensors 108 are known to be sensitive to temperature. This temperature effect occurs because diffusion of the mediator to the working electrode is temperature dependent. Diffusion typically induces a temperature effect of 1 - 2% bias per degree centigrade. Therefore temperatures as low as 10°C would produce results with a bias of about -25% and temperatures as high as 40°C would produce results with a bias about +25%. Thesystem 100 instrument provides results between 0 to 50°C. The only available temperature measurement comes from a thermistor inside the instrument. In order to reduce the temperature bias it was necessary to develop a temperature correction algorithm.- The temperature effect was determined experimentally by
biosensor system 100 whole blood glucose assay over the entire glucose (50 to 600 mg/dL) and temperature range (10 to 40°C) expected to be encountered. Actual blood glucose readings and sample temperatures were measured. This was done for sixdifferent sensor 108 lots. When the "compound interest" temperature correction method was used, several lots had percent biases of -10% to -13% at the extreme temperatures. The formula for the "compound interest" correction method is:
where G1 is the observed glucose concentration, tc is the temperature coefficient determined experimentally and T is the sample temperature. - The "compound interest" algorithm did not work well because the temperature coefficient, tc, changed with glucose concentration. A "polynomial" correction algorithm was invented to handle the varying temperature coefficient problem. By using a polynomial correction algorithm, the percent bias was limited to within +/-10%. The equation for the polynomial correction method is described in Equation #2. The grand sum of the absolute bias for both methods indicated that the polynomial correction method had less overall bias. Also, at the very extreme temperatures of 2 and 49°C, the polynomial correction method had lower bias (below 13.5%) where as the compound interest method was as high as -25%.
- Therefore, the polynomial correction method provided an improvement over the "compound interest" correction method.
- After running the glucose assay at different temperatures the current response at each temperature was calculated through the 24°C (sample temperature) standard response curve to obtain the observed glucose concentration.
- The observed glucose concentration and the sample temperature were then used to calculate the corrected glucose concentration using the following equation:

where G1 is the observed glucose concentration, T2 is the sample temperature and I1, 12, S1, and S2 are the predetermined coefficients. These coefficients were determined experimentally. See the following exemplary procedure for details. - Table 1 shows an example of the temperature correction results. T2 is the sample temperature. GR is the reference glucose valve. I is the measured current. G1 is the observed glucose concentration (without temperature correction). %B is the percent bias without temperature correction. G2 is the temperature corrected glucose concentration. %BC is the percent bias after temperature correction.
- The data shows the percent bias before and after the correction algorithm was applied. The algorithm and coefficients were able to reduce the percent bias at the extreme temperatures of 10 to 40°C to within +/-7%.
Table 1: Temperature Correction for Lot C I1 0.17706 I2 -0.0086 S1 0.01529 S2 0.00004 Lot C T2 GR I G1 %B G2 %BC 8.7 50 1024 38.3 -23.4% 49.1 -1.8% 8.7 100 1484 78.6 -21.4% 102.9 2.9% 8.7 200 2404 159.1 -20.5% 210.6 5.3% 8.7 400 4243 320.1 -20.0% 426.0 6.5% 8.7 600 6082 481.2 -19.8% 641.4 6.9% 16.7 50 1109 45.7 -8.6% 50.6 1.3% 16.7 100 1608 89.4 -10.6% 100.4 0.4% 16.7 200 2606 176.8 -11.6% 199.9 0.0% 16.7 400 4602 351.6 -12.1% 398.9 -0.3% 16.7 600 6598 526.4 -12.3% 597.9 -0.3% 23.9 50 1158 50.0 0.0% 50.0 0.0% 23.9 100 1729 100.0 0.0% 100.0 0.0% 23.9 200 2871 200.0 0.0% 200.0 0.0% 23.9 400 5155 400.0 0.0% 400.0 0.0% 23.9 600 7439 600.0 0.0% 600.0 0.0% 30.6 50 1212 54.7 9.5% 50.8 1.5% 30.6 100 1851 110.6 10.6% 100.8 0.8% 30.6 200 3128 222.5 11.2% 200.9 0.5% 30.6 400 5682 446.1 11.5% 401.1 0.3% 30.6 600 8236 669.8 11.6% 601.3 0.2% 38.2 50 1251 58.1 16.2% 50.4 0.8% 38.2 100 2008 124.4 24.4% 103.3 3.3% 38.2 200 3522 257.0 28.5% 209.0 4.5% 38.2 400 6550 522.1 30.5% 420.4 5.1% 38.2 600 9578 787.3 31.2% 631.8 5.3% - The following describes an exemplary procedure used for determining the temperature correction coefficients (I1, I2, S1, S2 in Equation 2). First venous heparinized whole blood (-45% hematocrit) from a single donor was spiked close to different glucose concentrations (values determined by the Yellow Springs Instrument, YSI, reference method and corrected for any known sample interferences) and tested in
system 100 instruments at different environmental chamber temperatures (Table 1, e.g. samples of 50 and 400 mg/dL glucose at 8.7, 16.7, 23.9, 30.6 and 38.2°CX.) The Yellow Springs Instrument and method are described byConrad et al., in the February 1989 "Journal of Pediatrics" Pages 281-287 and byBurmeister et al., in "Analytical Letters", 28(4), 581-592 (1995). High relative humidity (65 to 85%) was maintained in the chamber in order to prevent evaporative cooling, and the sample was equilibrated to the chamber temperature; this way the temperature effect would result only from the chemistry. The actual sample temperature was measured for each glucose spike. To determine the sample temperature, a 0.0005" thermocouple was inserted into a sensor without chemistry, and temperature data was collected every second after the blood was added to the sensor.Table 2 : Lot C Actual YSI Glucose and Current Response Sample Temp. YSI Current Slope Intercept 8.7°C 54.2 1063 8.7°C 412.5 4358 9.20 564.6 16.7°C 54.9 1148 16.7°C 414.9 4750 9.98 610.2 23.9°C 55.7 1223 23.9°C 418 5359 11.42 587.1 30.6oC 49.3 1203 30.6oC 408.4 5787 12.77 573.7 38.2oC 51.6 1275 38.2oC 418.7 6833 15.14 493.8 - Next, the current response at exactly 50, 100, 200, 400, and 600 mg/dL glucose for each temperature was determined through the curves using the slope and intercepts determined in Table 2. Using these calculated current values the observed glucose concentration was determined through the 24°C curve as provided in Table 3.
Table 3: Lot C - Current Through the YSI 50 and 400 mg/dL Curves and the Observed Glucose mg/dL Through the 24°C Curve Sample Temperature °C YSI Reference Glucose mg/dL Current 23.9°C Curve Observed Glucose mg/dL 8.7 50 1024 38.3 8.7 100 1484 78.6 8.7 200 2404 159.1 8.7 400 4243 320.1 8.7 600 6082 481.2 16.7 50 1109 45.7 16.7 100 1608 89.4 16.7 200 2606 176.8 16.7 400 4602 351.6 16.7 600 6598 526.4 23.9 50 1158 50.0 23.9 100 1729 100.0 23.9 200 2871 200.0 23.9 400 5155 400.0 23.9 600 7439 600.0 30.6 50 1212 57.7 30.6 100 1851 110.6 30.6 200 3128 222.5 30.6 400 5682 446.1 30.6 600 8236 669.8 38.2 50 1251 58.1 38.2 100 2008 124.4 38.2 200 3522 257.0 38.2 400 6550 522.1 38.2 600 9578 787.3 - Next for each spike of blood, the observed glucose concentration (G1) was plotted against the sample temperature (T2). The 2nd order polynomial curve was used to fit the plot and the a1 and a2 constants for that level of glucose were obtained as provided in Table 4. For example, a computer program such as Slidewrite by Advanced Graphics Software Inc., or any other equivalent curve fitting program can be used.
Table 4: Lot C - 2nd Order Polynomial Coefficients Coefficient 50 mg/ dL 100 mg/dL 200 mg/dL 400 mg/dL 600 mg/dL a0 29.689 68.654 146.318 301.709 457.305 a1 1.08071 1.06138 1.04494 1.00696 0.95187 a2 -0.00881 0.01035 0.04829 0.12417 0.20045 Corr.Coef.R 0.9990 1.000 0.9998 0.9996 0.9995 - The a1 values obtained for the different levels of glucose were plotted against the glucose concentration. The data was plotted using a linear fit, and the coefficients S1 (slope of the linear fit) and I1 (intercept of the linear fit) were generated. The Slidewrite program on a PC by Advanced Graphics Software Inc., or any other equivalent curve fitting program can be used.
- The a2 values obtained for the different levels of glucose were also plotted against the glucose concentration. The data was plotted using a linear fit, and the coefficients S2 (slope of the linear fit) and 12 (intercept of the linear fit) were generated.
- To derive the algorithm: at each level of glucose, the observed glucose concentration (G1) is related to the sample temperature (T2) in a 2nd order polynomial relationship.
Or
- And at a sample temperature of 24°C, G2 (Corrected) = G1 (observed)
Or
- Subtracting equation (3) from equation (2) gives:

- From the linear plots generated at steps 4 and 5:

and
- Combining equation (5), (6), and (7) gives equation (2).
- While the present invention has been described with reference to the details of the embodiments of the invention shown in the drawing, these details are not intended to limit the scope of the invention as claimed in the appended claims.


Claims (19)
- Apparatus (100) for reducing bias in an electrochemical enzyme-based biosensor by correcting ambient temperature effect, the apparatus comprising:means (122) for measuring an ambient temperature value;means (106, 108) responsive to an applied sample to the electrochemical enzyme-based biosensor for measuring a current generated in the test sample, the current being associated with a first analyte concentration value, the applied sample having an actual analyte concentration; andprocessor means (102) for calculating a second analyte concentration value utilizing the measured ambient temperature value and the first analyte concentration value to thereby increase the accuracy of the second analyte concentration calculation;characterized in thatthe processor means (102) for calculating the second analyte concentration value reduces the percent bias between the first analyte concentration value and the actual analyte concentration to within a range of ± 13.5 percent at ambient temperatures ranging from 2 degrees Celsius to 49 degrees Celsius.
- The apparatus (100) of claim 1, wherein the processor means (102) for calculating the second analyte concentration value reduces the percent bias between the first analyte concentration value and the actual analyte concentration to within a range of ± 10 percent at ambient temperatures ranging from 10 degrees Celsius to 40 degrees Celsius.
- The apparatus (100) of claim 1, wherein the processor means (102) for calculating the second analyte concentration value reduces the percent bias between the first analyte concentration value and the actual analyte concentration to within a range of ± 7 percent at ambient temperatures ranging from 10 degrees Celsius to 40 degrees Celsius.
- The apparatus (100) of one of claims 1 to 3, wherein the actual concentration of the applied sample ranges from 50 to 600 mg/dL.
- The apparatus (100) of one of claims 1 to 4, wherein the apparatus is battery powered.
- The apparatus (100) of one of claims 1 to 5, wherein the analyte is glucose.
- The apparatus (100) of one of claims 1 to 5, wherein the electrochemical enzyme-based biosensor includes a flavin adenine dinucleotide (FAD)-dependent enzyme.
- The apparatus (100) of one of claims 1-7, wherein the means (122) for measuring the ambient temperature value includes a thermistor coupled to the processor means (102).
- The apparatus (100) of claim 8, wherein the means (106, 108) responsive to the applied sample to the electrochemical enzyme-based biosensor is coupled to the processor means (102) to receive a signal representing the current generated in the test sample,
- The apparatus (100) of one of claims 8 or 9, wherein an alarm function (162) is coupled to the processor means (102) for generating alarm indications.
- An electro-chemical enzyme-based biosensor comprising:a biosensor means for receiving a fluid sample; andthe apparatus (100) of one of claims 1-10.
- A method for reducing bias in an electrochemical enzyme-based biosensor by correcting ambient temperature effect, the method comprising:measuring an ambient temperature value (202);receiving a sample on the electrochemical enzyme-based biosensor, the received sample having an actual analyte concentration value;measuring a current generated in the sample (204), the measured current being associated with a first analyte concentration value; anddetermining a second analyte concentration value utilizing the measured ambient temperature value and the first analyte concentration value to thereby increase the accuracy of the second analyte concentration determination;characterized in thatthe step for determining the second analyte concentration value reduces the percent bias between the first analyte concentration value and the actual analyte concentration to within a range of ± 13.5 percent at ambient temperatures ranging from 2 degrees Celsius to 49 degrees Celsius.
- The method of claim 12, wherein the step for determining the second analyte concentration value reduces the percent bias between the first analyte concentration value and the actual analyte concentration to within a range of ± 10 percent at ambient temperatures ranging from 10 degrees Celsius to 40 degrees Celsius.
- The method of claim 12, wherein the step for determining the second analyte concentration value reduces the percent bias between the first analyte concentration value and the actual analyte concentration to within a range of ± 7 percent at ambient temperatures ranging from 10 degrees Celsius to 40 degrees Celsius.
- The method of one of claims 12 to 14, wherein the actual concentration of the received sample ranges from 50 to 600 mg/dL.
- The method of one of claims 12 to 15, wherein the electrochemical enzyme-based biosensor is battery powered.
- The method of one of claims 12 to 16, wherein the analyte is glucose.
- The method of one of claims 12 to 16, wherein the electrochemical enzyme-based biosensor includes a flavin adenine dinucleotide (FAD)-dependent enzyme.
- The method of one of claims 12-18, further comprising generating an alarm indication in response to detecting a predefined system condition.
Applications Claiming Priority (3)
| Application Number | Priority Date | Filing Date | Title |
|---|---|---|---|
| US08/854,440US6391645B1 (en) | 1997-05-12 | 1997-05-12 | Method and apparatus for correcting ambient temperature effect in biosensors |
| EP20090000924EP2048499A1 (en) | 1997-05-12 | 1998-04-29 | Method and apparatus for correcting ambient temperature effect in biosensor |
| EP98107778AEP0878713B1 (en) | 1997-05-12 | 1998-04-29 | Method and apparatus for correcting ambient temperature effect in biosensors |
Related Parent Applications (2)
| Application Number | Title | Priority Date | Filing Date |
|---|---|---|---|
| EP98107778.7Division | 1998-04-29 | ||
| EP09000924.2Division | 2009-01-23 |
Publications (1)
| Publication Number | Publication Date |
|---|---|
| EP2264451A1true EP2264451A1 (en) | 2010-12-22 |
Family
ID=25318702
Family Applications (3)
| Application Number | Title | Priority Date | Filing Date |
|---|---|---|---|
| EP10173366AWithdrawnEP2264451A1 (en) | 1997-05-12 | 1998-04-29 | Method and apparatus for correcting ambient temperature effect in biosensor |
| EP98107778AExpired - LifetimeEP0878713B1 (en) | 1997-05-12 | 1998-04-29 | Method and apparatus for correcting ambient temperature effect in biosensors |
| EP20090000924WithdrawnEP2048499A1 (en) | 1997-05-12 | 1998-04-29 | Method and apparatus for correcting ambient temperature effect in biosensor |
Family Applications After (2)
| Application Number | Title | Priority Date | Filing Date |
|---|---|---|---|
| EP98107778AExpired - LifetimeEP0878713B1 (en) | 1997-05-12 | 1998-04-29 | Method and apparatus for correcting ambient temperature effect in biosensors |
| EP20090000924WithdrawnEP2048499A1 (en) | 1997-05-12 | 1998-04-29 | Method and apparatus for correcting ambient temperature effect in biosensor |
Country Status (11)
| Country | Link |
|---|---|
| US (1) | US6391645B1 (en) |
| EP (3) | EP2264451A1 (en) |
| JP (1) | JP4124513B2 (en) |
| AT (1) | ATE424558T1 (en) |
| AU (1) | AU729232B2 (en) |
| CA (1) | CA2236314C (en) |
| DE (1) | DE69840614D1 (en) |
| DK (1) | DK0878713T3 (en) |
| ES (1) | ES2321348T3 (en) |
| NZ (1) | NZ329792A (en) |
| TW (1) | TW565695B (en) |
Families Citing this family (65)
| Publication number | Priority date | Publication date | Assignee | Title |
|---|---|---|---|---|
| NZ524206A (en)* | 1997-12-04 | 2004-05-28 | Roche Diagnostics Corp | Instrument for determining the concentration of a medically significant component of a sample |
| US7390667B2 (en) | 1997-12-22 | 2008-06-24 | Roche Diagnostics Operations, Inc. | System and method for analyte measurement using AC phase angle measurements |
| US7494816B2 (en) | 1997-12-22 | 2009-02-24 | Roche Diagnostic Operations, Inc. | System and method for determining a temperature during analyte measurement |
| US7407811B2 (en) | 1997-12-22 | 2008-08-05 | Roche Diagnostics Operations, Inc. | System and method for analyte measurement using AC excitation |
| US8071384B2 (en) | 1997-12-22 | 2011-12-06 | Roche Diagnostics Operations, Inc. | Control and calibration solutions and methods for their use |
| US6576117B1 (en) | 1998-05-20 | 2003-06-10 | Arkray | Method and apparatus for electrochemical measurement using statistical technique |
| US6780296B1 (en) | 1999-12-23 | 2004-08-24 | Roche Diagnostics Corporation | Thermally conductive sensor |
| US6604050B2 (en) | 2000-06-16 | 2003-08-05 | Bayer Corporation | System, method and biosensor apparatus for data communications with a personal data assistant |
| EP2388587B1 (en)* | 2000-11-30 | 2018-01-10 | Panasonic Healthcare Holdings Co., Ltd. | Method of quantifying substrate |
| US7004928B2 (en) | 2002-02-08 | 2006-02-28 | Rosedale Medical, Inc. | Autonomous, ambulatory analyte monitor or drug delivery device |
| JP2004350861A (en)* | 2003-05-28 | 2004-12-16 | Tanita Corp | Health management device |
| US7718439B2 (en) | 2003-06-20 | 2010-05-18 | Roche Diagnostics Operations, Inc. | System and method for coding information on a biosensor test strip |
| US7597793B2 (en) | 2003-06-20 | 2009-10-06 | Roche Operations Ltd. | System and method for analyte measurement employing maximum dosing time delay |
| US7488601B2 (en) | 2003-06-20 | 2009-02-10 | Roche Diagnostic Operations, Inc. | System and method for determining an abused sensor during analyte measurement |
| US7604721B2 (en) | 2003-06-20 | 2009-10-20 | Roche Diagnostics Operations, Inc. | System and method for coding information on a biosensor test strip |
| US8206565B2 (en) | 2003-06-20 | 2012-06-26 | Roche Diagnostics Operation, Inc. | System and method for coding information on a biosensor test strip |
| US8148164B2 (en) | 2003-06-20 | 2012-04-03 | Roche Diagnostics Operations, Inc. | System and method for determining the concentration of an analyte in a sample fluid |
| US7645373B2 (en) | 2003-06-20 | 2010-01-12 | Roche Diagnostic Operations, Inc. | System and method for coding information on a biosensor test strip |
| US7452457B2 (en) | 2003-06-20 | 2008-11-18 | Roche Diagnostics Operations, Inc. | System and method for analyte measurement using dose sufficiency electrodes |
| US7645421B2 (en) | 2003-06-20 | 2010-01-12 | Roche Diagnostics Operations, Inc. | System and method for coding information on a biosensor test strip |
| US8058077B2 (en) | 2003-06-20 | 2011-11-15 | Roche Diagnostics Operations, Inc. | Method for coding information on a biosensor test strip |
| EP1713926B1 (en) | 2004-02-06 | 2012-08-01 | Bayer HealthCare, LLC | Oxidizable species as an internal reference for biosensors and method of use |
| JP5011100B2 (en)* | 2004-03-31 | 2012-08-29 | バイエル・ヘルスケア・エルエルシー | Method and apparatus for implementing threshold-based correction functions for biosensors |
| US7556723B2 (en) | 2004-06-18 | 2009-07-07 | Roche Diagnostics Operations, Inc. | Electrode design for biosensor |
| US7569126B2 (en) | 2004-06-18 | 2009-08-04 | Roche Diagnostics Operations, Inc. | System and method for quality assurance of a biosensor test strip |
| US7964089B2 (en) | 2005-04-15 | 2011-06-21 | Agamatrix, Inc. | Analyte determination method and analyte meter |
| US20060281187A1 (en) | 2005-06-13 | 2006-12-14 | Rosedale Medical, Inc. | Analyte detection devices and methods with hematocrit/volume correction and feedback control |
| JP5385607B2 (en) | 2005-07-20 | 2014-01-08 | バイエル・ヘルスケア・エルエルシー | Gated current measuring instrument |
| KR101577176B1 (en) | 2005-09-30 | 2015-12-14 | 바이엘 헬스케어 엘엘씨 | Gated voltammetry analyte determination |
| US8801631B2 (en) | 2005-09-30 | 2014-08-12 | Intuity Medical, Inc. | Devices and methods for facilitating fluid transport |
| EP1928302B1 (en) | 2005-09-30 | 2012-08-01 | Intuity Medical, Inc. | Fully integrated wearable or handheld monitor |
| RU2455925C2 (en) | 2006-02-27 | 2012-07-20 | БАЙЕР ХЕЛТКЭА ЭлЭлСи | Determination of investigated substance with correction to temperature for systems of biosensors |
| US8529751B2 (en) | 2006-03-31 | 2013-09-10 | Lifescan, Inc. | Systems and methods for discriminating control solution from a physiological sample |
| US7966859B2 (en) | 2006-05-03 | 2011-06-28 | Bayer Healthcare Llc | Underfill detection system for a biosensor |
| BRPI0711433A2 (en) | 2006-05-08 | 2011-11-16 | Bayer Healthcare Llc | Abnormal output detection system for a biosensor |
| ES2825036T3 (en) | 2006-10-24 | 2021-05-14 | Ascensia Diabetes Care Holdings Ag | Transient decay amperometry |
| KR100959722B1 (en)* | 2006-12-27 | 2010-05-25 | 인텔리전트 센서 테크놀로지 인코포레이티드 | Taste recognition device and taste recognition system using the device |
| ES2693097T3 (en) | 2007-05-30 | 2018-12-07 | Ascensia Diabetes Care Holdings Ag | System and method for managing health data |
| US8778168B2 (en)* | 2007-09-28 | 2014-07-15 | Lifescan, Inc. | Systems and methods of discriminating control solution from a physiological sample |
| JP5773241B2 (en) | 2007-10-15 | 2015-09-02 | バイエル・ヘルスケア・エルエルシーBayer HealthCareLLC | Method and assembly for determining the temperature of a test sensor |
| WO2009076302A1 (en) | 2007-12-10 | 2009-06-18 | Bayer Healthcare Llc | Control markers for auto-detection of control solution and methods of use |
| JP5812603B2 (en) | 2007-12-10 | 2015-11-17 | バイエル・ヘルスケア・エルエルシーBayer HealthCareLLC | Slope-based correction |
| US8603768B2 (en) | 2008-01-17 | 2013-12-10 | Lifescan, Inc. | System and method for measuring an analyte in a sample |
| US9833183B2 (en) | 2008-05-30 | 2017-12-05 | Intuity Medical, Inc. | Body fluid sampling device—sampling site interface |
| WO2009148624A1 (en) | 2008-06-06 | 2009-12-10 | Intuity Medical, Inc. | Detection meter and mode of operation |
| EP3984454A1 (en) | 2008-06-06 | 2022-04-20 | Intuity Medical, Inc. | Medical diagnostic devices and methods |
| US8551320B2 (en)* | 2008-06-09 | 2013-10-08 | Lifescan, Inc. | System and method for measuring an analyte in a sample |
| JP5738770B2 (en) | 2008-12-08 | 2015-06-24 | バイエル・ヘルスケア・エルエルシーBayer HealthCareLLC | Biosensor system with signal conditioning |
| US8801273B2 (en) | 2009-06-08 | 2014-08-12 | Bayer Healthcare Llc | Method and assembly for determining the temperature of a test sensor |
| US8668819B2 (en) | 2009-11-10 | 2014-03-11 | Bayer Healthcare Llc | Underfill recognition system for a biosensor |
| EP2506768B1 (en) | 2009-11-30 | 2016-07-06 | Intuity Medical, Inc. | Calibration material delivery devices and methods |
| US8391940B2 (en)* | 2010-02-04 | 2013-03-05 | Lifescan, Inc. | Methods and systems to correct for hematocrit effects |
| RU2568884C2 (en) | 2010-03-22 | 2015-11-20 | БАЙЕР ХЕЛТКЭА ЭлЭлСи | Compensation of discrepancy for biosensor |
| EP2577303B1 (en) | 2010-06-07 | 2022-08-03 | Ascensia Diabetes Care Holdings AG | Underfill management system for a biosensor |
| CN103210310B (en) | 2010-06-07 | 2015-03-18 | 拜尔健康护理有限责任公司 | Slope-based compensation including secondary output signals |
| CA2803797A1 (en) | 2010-06-25 | 2011-12-29 | Intuity Medical, Inc. | Analyte monitoring methods and systems |
| CN101900704A (en)* | 2010-07-26 | 2010-12-01 | 北京软测科技有限公司 | Method for improving blood measuring accuracy by insertion algorithm |
| US9632054B2 (en) | 2010-12-31 | 2017-04-25 | Cilag Gmbh International | Systems and methods for high accuracy analyte measurement |
| US9782114B2 (en) | 2011-08-03 | 2017-10-10 | Intuity Medical, Inc. | Devices and methods for body fluid sampling and analysis |
| JP6082396B2 (en) | 2011-09-21 | 2017-02-15 | バイエル・ヘルスケア・エルエルシーBayer HealthCare LLC | Biosensor with error compensation |
| US9903830B2 (en) | 2011-12-29 | 2018-02-27 | Lifescan Scotland Limited | Accurate analyte measurements for electrochemical test strip based on sensed physical characteristic(s) of the sample containing the analyte |
| WO2014205412A1 (en) | 2013-06-21 | 2014-12-24 | Intuity Medical, Inc. | Analyte monitoring system with audible feedback |
| US9243276B2 (en) | 2013-08-29 | 2016-01-26 | Lifescan Scotland Limited | Method and system to determine hematocrit-insensitive glucose values in a fluid sample |
| US9459231B2 (en) | 2013-08-29 | 2016-10-04 | Lifescan Scotland Limited | Method and system to determine erroneous measurement signals during a test measurement sequence |
| AU2022330044A1 (en)* | 2021-08-20 | 2024-03-07 | University Of Cincinnati | Aptamer sensors with temperature correction |
Citations (11)
| Publication number | Priority date | Publication date | Assignee | Title |
|---|---|---|---|---|
| US3791988A (en) | 1972-03-23 | 1974-02-12 | Hoffmann La Roche | Diagnostic test for glucose |
| US4431004A (en)* | 1981-10-27 | 1984-02-14 | Bessman Samuel P | Implantable glucose sensor |
| US4746607A (en) | 1985-02-07 | 1988-05-24 | Eastman Kodak Company | Use of substituted quinone electron transfer agents in analytical determinations |
| EP0330517A2 (en) | 1988-02-26 | 1989-08-30 | Solarcare Technologies Corporation | Method, system and devices for the assay and detection of biochemical molecules |
| EP0354441A2 (en) | 1988-08-09 | 1990-02-14 | Roche Diagnostics GmbH | Method for the colorimetric determination of analyte using enzymatic oxydation |
| US4929545A (en) | 1989-04-14 | 1990-05-29 | Boehringer Mannheim Corporation | Method and reagent for determination of an analyte via enzymatic means using a ferricyanide/ferric compound system |
| WO1991000998A1 (en)* | 1989-07-07 | 1991-01-24 | Disetronic Holding Ag | Glucose-level measurement device |
| JPH04328459A (en)* | 1991-04-26 | 1992-11-17 | Nikko Kyodo Co Ltd | How to correct temperature dependence of chemical sensors |
| US5366609A (en)* | 1993-06-08 | 1994-11-22 | Boehringer Mannheim Corporation | Biosensing meter with pluggable memory key |
| US5395504A (en)* | 1993-02-04 | 1995-03-07 | Asulab S.A. | Electrochemical measuring system with multizone sensors |
| US5508171A (en)* | 1989-12-15 | 1996-04-16 | Boehringer Mannheim Corporation | Assay method with enzyme electrode system |
Family Cites Families (1)
| Publication number | Priority date | Publication date | Assignee | Title |
|---|---|---|---|---|
| US4750496A (en)* | 1987-01-28 | 1988-06-14 | Xienta, Inc. | Method and apparatus for measuring blood glucose concentration |
- 1997
- 1997-05-12USUS08/854,440patent/US6391645B1/ennot_activeExpired - Lifetime
- 1998
- 1998-02-18NZNZ329792Apatent/NZ329792A/enunknown
- 1998-02-26TWTW087102816Apatent/TW565695B/enactive
- 1998-04-29EPEP10173366Apatent/EP2264451A1/ennot_activeWithdrawn
- 1998-04-29DEDE69840614Tpatent/DE69840614D1/ennot_activeExpired - Lifetime
- 1998-04-29EPEP98107778Apatent/EP0878713B1/ennot_activeExpired - Lifetime
- 1998-04-29CACA002236314Apatent/CA2236314C/ennot_activeExpired - Fee Related
- 1998-04-29ESES98107778Tpatent/ES2321348T3/ennot_activeExpired - Lifetime
- 1998-04-29EPEP20090000924patent/EP2048499A1/ennot_activeWithdrawn
- 1998-04-29ATAT98107778Tpatent/ATE424558T1/ennot_activeIP Right Cessation
- 1998-04-29DKDK98107778Tpatent/DK0878713T3/enactive
- 1998-05-06JPJP12300898Apatent/JP4124513B2/ennot_activeExpired - Fee Related
- 1998-05-08AUAU64818/98Apatent/AU729232B2/ennot_activeCeased
Patent Citations (11)
| Publication number | Priority date | Publication date | Assignee | Title |
|---|---|---|---|---|
| US3791988A (en) | 1972-03-23 | 1974-02-12 | Hoffmann La Roche | Diagnostic test for glucose |
| US4431004A (en)* | 1981-10-27 | 1984-02-14 | Bessman Samuel P | Implantable glucose sensor |
| US4746607A (en) | 1985-02-07 | 1988-05-24 | Eastman Kodak Company | Use of substituted quinone electron transfer agents in analytical determinations |
| EP0330517A2 (en) | 1988-02-26 | 1989-08-30 | Solarcare Technologies Corporation | Method, system and devices for the assay and detection of biochemical molecules |
| EP0354441A2 (en) | 1988-08-09 | 1990-02-14 | Roche Diagnostics GmbH | Method for the colorimetric determination of analyte using enzymatic oxydation |
| US4929545A (en) | 1989-04-14 | 1990-05-29 | Boehringer Mannheim Corporation | Method and reagent for determination of an analyte via enzymatic means using a ferricyanide/ferric compound system |
| WO1991000998A1 (en)* | 1989-07-07 | 1991-01-24 | Disetronic Holding Ag | Glucose-level measurement device |
| US5508171A (en)* | 1989-12-15 | 1996-04-16 | Boehringer Mannheim Corporation | Assay method with enzyme electrode system |
| JPH04328459A (en)* | 1991-04-26 | 1992-11-17 | Nikko Kyodo Co Ltd | How to correct temperature dependence of chemical sensors |
| US5395504A (en)* | 1993-02-04 | 1995-03-07 | Asulab S.A. | Electrochemical measuring system with multizone sensors |
| US5366609A (en)* | 1993-06-08 | 1994-11-22 | Boehringer Mannheim Corporation | Biosensing meter with pluggable memory key |
Non-Patent Citations (4)
| Title |
|---|
| ANALYTICA CLINICA ACTA., vol. 140, 1982, pages 1 - 18 |
| BURMEISTER ET AL., ANALYTICAL LETTERS, vol. 28, no. 4, 1995, pages 581 - 592 |
| CONRAD ET AL., JOURNAL OF PEDIATRICS, February 1989 (1989-02-01), pages 281 - 287 |
| SCHLAPFER ET AL., CLINICA CHIMICA ACTA., vol. 57, 1974, pages 283 - 289 |
Also Published As
| Publication number | Publication date |
|---|---|
| DE69840614D1 (en) | 2009-04-16 |
| EP2048499A1 (en) | 2009-04-15 |
| EP0878713A3 (en) | 2004-06-23 |
| ES2321348T3 (en) | 2009-06-04 |
| AU6481898A (en) | 1998-11-12 |
| JP4124513B2 (en) | 2008-07-23 |
| JPH10318963A (en) | 1998-12-04 |
| NZ329792A (en) | 1999-02-25 |
| EP0878713B1 (en) | 2009-03-04 |
| US6391645B1 (en) | 2002-05-21 |
| TW565695B (en) | 2003-12-11 |
| CA2236314A1 (en) | 1998-11-12 |
| EP0878713A2 (en) | 1998-11-18 |
| DK0878713T3 (en) | 2009-06-02 |
| CA2236314C (en) | 2004-02-10 |
| ATE424558T1 (en) | 2009-03-15 |
| AU729232B2 (en) | 2001-01-25 |
Similar Documents
| Publication | Publication Date | Title |
|---|---|---|
| EP0878713B1 (en) | Method and apparatus for correcting ambient temperature effect in biosensors | |
| US11584945B2 (en) | Method and apparatus for implementing threshold based correction functions for biosensors | |
| EP0741186B1 (en) | Method and apparatus for reduction of bias in amperometric sensors | |
| US10067082B2 (en) | Biosensor for determining an analyte concentration | |
| ZA200608724B (en) | Method and apparatus for implementing threshold based correction functions for biosensors | |
| HK1102097B (en) | Method and apparatus for implementing threshold based correction functions for biosensors | |
| CA2416606C (en) | Apparatus and method for reduction of bias in amperometric sensors |
Legal Events
| Date | Code | Title | Description |
|---|---|---|---|
| PUAI | Public reference made under article 153(3) epc to a published international application that has entered the european phase | Free format text:ORIGINAL CODE: 0009012 | |
| AC | Divisional application: reference to earlier application | Ref document number:0878713 Country of ref document:EP Kind code of ref document:P Ref document number:2048499 Country of ref document:EP Kind code of ref document:P | |
| AK | Designated contracting states | Kind code of ref document:A1 Designated state(s):AT BE CH DE DK ES FI FR GB GR IE IT LI LU NL PT SE | |
| 17P | Request for examination filed | Effective date:20110622 | |
| RAP1 | Party data changed (applicant data changed or rights of an application transferred) | Owner name:BAYER HEALTHCARE LLC | |
| RAP1 | Party data changed (applicant data changed or rights of an application transferred) | Owner name:ASCENSIA DIABETES CARE HOLDINGS AG | |
| STAA | Information on the status of an ep patent application or granted ep patent | Free format text:STATUS: THE APPLICATION IS DEEMED TO BE WITHDRAWN | |
| 18D | Application deemed to be withdrawn | Effective date:20171103 |