EP1843148B1 - Analysis of optical data using histograms - Google Patents
Analysis of optical data using histogramsDownload PDFInfo
- Publication number
- EP1843148B1 EP1843148B1EP06007461.4AEP06007461AEP1843148B1EP 1843148 B1EP1843148 B1EP 1843148B1EP 06007461 AEP06007461 AEP 06007461AEP 1843148 B1EP1843148 B1EP 1843148B1
- Authority
- EP
- European Patent Office
- Prior art keywords
- detection area
- analyte
- area
- sample
- wetted
- Prior art date
- Legal status (The legal status is an assumption and is not a legal conclusion. Google has not performed a legal analysis and makes no representation as to the accuracy of the status listed.)
- Active
Links
Images


Classifications
- G—PHYSICS
- G06—COMPUTING OR CALCULATING; COUNTING
- G06T—IMAGE DATA PROCESSING OR GENERATION, IN GENERAL
- G06T7/00—Image analysis
- G06T7/0002—Inspection of images, e.g. flaw detection
- G06T7/0012—Biomedical image inspection
- G—PHYSICS
- G01—MEASURING; TESTING
- G01N—INVESTIGATING OR ANALYSING MATERIALS BY DETERMINING THEIR CHEMICAL OR PHYSICAL PROPERTIES
- G01N21/00—Investigating or analysing materials by the use of optical means, i.e. using sub-millimetre waves, infrared, visible or ultraviolet light
- G01N21/84—Systems specially adapted for particular applications
- G01N21/8483—Investigating reagent band
- G—PHYSICS
- G06—COMPUTING OR CALCULATING; COUNTING
- G06T—IMAGE DATA PROCESSING OR GENERATION, IN GENERAL
- G06T7/00—Image analysis
- G06T7/40—Analysis of texture
- G06T7/41—Analysis of texture based on statistical description of texture
- G—PHYSICS
- G06—COMPUTING OR CALCULATING; COUNTING
- G06T—IMAGE DATA PROCESSING OR GENERATION, IN GENERAL
- G06T2207/00—Indexing scheme for image analysis or image enhancement
- G06T2207/10—Image acquisition modality
- G06T2207/10056—Microscopic image
- G—PHYSICS
- G06—COMPUTING OR CALCULATING; COUNTING
- G06T—IMAGE DATA PROCESSING OR GENERATION, IN GENERAL
- G06T2207/00—Indexing scheme for image analysis or image enhancement
- G06T2207/30—Subject of image; Context of image processing
- G06T2207/30004—Biomedical image processing
- G06T2207/30024—Cell structures in vitro; Tissue sections in vitro
Definitions
- the inventionlies in the field of optical analysis of small sample volumes, such as occur in the diagnosis of blood samples.
- Determining the concentration of various analytes in physiological samplesis of increasing importance in our society.
- the examination of such samplestakes place in various application areas, e.g. B. in clinical laboratories or in "home monitoring". This includes, above all, glucose measurement in diabetes management and cholesterol measurement in heart and vascular diseases.
- Medical blood diagnosticsalways requires the collection of a blood sample from the individual to be examined.
- test elements wetted with bloodare analyzed.
- These handheld devicesare of great importance, for example, in diagnosing diabetes.
- the measurement in these devicesis mainly carried out electrochemically or optically.
- the sampleis illuminated with light and the reflected light is detected to determine the analyte concentration.
- test elementssuch as test strips are used, which are wetted with the sample, such as blood or interstitial fluid.
- the samplethen reacts with the reagents that are applied to this test element. This can lead to a color change, which can then be detected.
- the detection area of the test elementis evenly wetted by the test liquid. Uneven or insufficient wetting of the detection area can lead to erroneous results. Especially when a small amount of test liquid is used, the distribution on the test element may not be uniform and only part of the detection area is wetted with sample material. In the conventional optically based measurement methods, the reflected light is often measured from the entire detection area, which leads to a high level of inaccuracy in the measured glucose, since it varies depending on the amount of sample applied much unwetted area is included in the determination. In the case of insufficient wetting of the detection area, the required size of the section to be measured for an error-free measurement can be undercut. This can either make it necessary for the patient to repeat the measurement or incorrect measurement values are generated.
- a capture moleculeis immobilized on the test field surface and a reaction with the analyte is optically detected.
- the frequency of light intensities at different locationsis determined.
- a threshold valueis set that only takes into account measured values for evaluation that are above a certain intensity. This allows signals to be distinguished from the non-reacting background of useful signals. Since an immunological reaction also takes place here, which must take into account non-specifically bound marker molecules, it is necessary to apply the sample both to areas with catcher molecules and to areas without catcher molecules.
- U.S.6847451The patent application U.S.6847451 describes a method for the optical determination of an analyte in a liquid on a test field.
- the analytereacts with an enzyme on the test field and a dye is formed that is optically detected.
- the patentsolves the problem that too small a sample quantity does not wet the entire test field and leads to incorrect results in the case of an integral evaluation. This is avoided by a spatially resolved measurement, in which only test areas whose intensity exceeds a threshold value are evaluated.
- a disadvantage of this methodis the integration over a large area of the test field, which can be inhomogeneous in itself. Since small concentrations are also to be measured, the threshold value must not be set too low.
- a system for determining the concentration of an analyte in a liquidwith an illumination or detection unit for detecting light intensities that are emitted from partial areas of a detection area of a test element. Furthermore, an evaluation unit is described which determines a frequency distribution for the detected light intensities, the frequency distribution having at least a first maximum, caused by unwetted partial areas or at least one reference area, and a second maximum, caused by wetted partial areas, and which identifies wetted areas on the basis of frequencies and from unwetted areas and selects at least one light intensity on the basis of the frequency distribution and determines the concentration of the analyte with small sample volumes from the at least one selected light intensity.
- Liquidsalso referred to as sample or test liquid
- physiological liquidssuch as blood (venous or capillary), blood components, interstitial liquid, plasma, serum, urine or saliva, but not limited thereto.
- bloodis primarily used as a sample. This is to be seen as an example of the concept of liquid and should not be understood as limiting.
- Blood samplesare required above all for self-tests by patients who regularly have to examine a blood parameter, such as in the case of diabetics.
- a blood parametersuch as in the case of diabetics.
- the puncture depthis chosen as low as possible. Only a small amount of blood is obtained.
- the analytical methodsmust be able to precisely measure smaller and smaller blood volumes.
- the system according to the inventionis therefore even suitable for the analysis of sample volumes below 100 nl.
- a preferred volume rangeis between 1 and 500 nl, a particularly preferred volume range is between 10 and 100 nl. However, larger volumes can also be measured.
- the sample volume to be analyzedcan be less than 1 nl, particularly with instruments that include automated sampling after the puncture.
- a histogramcan be used to illustrate the principle of evaluating frequencies.
- the light intensitiesare determined, for example, in the form of gray values and classified into intensity intervals.
- the frequency of the respective light intensity in an intensity intervalis plotted against the gray value.
- a number of partial areas in the detection areaare examined, with the location information not having to be used in the further evaluation. These partial areas are not real subdivisions of the detection area, but are created by the optical, spatially resolved measurement of the detection area. The number of these partial areas thus depends on the number of irradiated or detected areas. The more partial areas are examined, the more precisely the differentiation between intensity differences in different areas can be determined.
- the intensities of the wetted sub-areascorrelate with the concentration of the analyte in the sample.
- 256 intensitiesare distinguished. This number of intensity levels is sufficient to To achieve precision / resolution for determining the concentration of the analyte.
- the amount of datacan be kept to such a small extent that it can be processed using small data carriers, which can be processed either in an evaluation unit in the detector itself or in an evaluation unit separate from the detector.
- small data carrierswhich can be processed either in an evaluation unit in the detector itself or in an evaluation unit separate from the detector.
- the system according to the invention for calculating the concentration of the analytepreferably only certain frequencies and the associated intensities are used.
- the evaluation according to the invention without storing the complete image datashows a significant reduction in the power requirement and the memory requirement.
- a device which, due to the evaluation method, has a low storage requirementcan be produced with inexpensive components. The device can therefore be manufactured and operated more cost-effectively than conventional devices.
- the frequency distribution of the intensities on the detection areacan be determined.
- the partial areas of the detection areahave very similar intensities or the gray values determined from them.
- intensities of partial areascan be determined before or after application of the sample, which are detected by a reference area.
- This reference areacan be part of the detection area or outside of the detection area. No reaction takes place in or on this reference area, regardless of whether the reference area is wetted by the sample or not.
- the unwetted partial areas or the reference areacan be recognized by a first maximum, which has a narrow distribution of intensities or gray levels around the maximum.
- a maximum of frequenciesis characterized in that the curve representing the frequencies has a slope of zero at the point of the maximum.
- An unused test elementideally has intensities in a small intensity range on its detection area. If this is the case, it can be assumed that only a few or no imperfections can be found in the detection area. This is the prerequisite for an error-free measurement of a sample. If a significant number of intensities lie outside of this small "normal" intensity interval, it can be assumed that no error-free measurement is possible with this test element. This can be used as a quality control to exclude faulty test elements from the measurement.
- the test elementdarkens in the detected wavelength range at the wetted points of the detection area. This means a reduction in intensity in the wetted areas.
- the reagentOn the detection area, there is a corresponding number of test fields that have a similar intensity.
- a redistribution of frequencies of intensities caused by the discoloration of the detection areacan be seen.
- an accumulation of gray valuestakes place at a lower intensity.
- a second maximumcan be seen in the histogram, which originates from the wetted sub-areas.
- all gray values of the first peakare shifted to another gray value. The more homogeneously the reagent or the sample is distributed, the narrower the distribution around the mean intensity value of the shifted intensity values of the wetted areas.
- This distribution of the intensity frequencies before and after applying the sample to the detection areacan be used to determine the analyte.
- the intensity differences of the maximum values in the frequency distribution before and after wetting the detection areaare used to determine the concentration of the analyte.
- a further preferred embodimentis the evaluation based on the speed of the change in the frequencies of the emitted light intensities after the detection area has been wetted. A multivariate analysis can be carried out, especially for the temporal consideration of the change in frequency, but also for the other evaluation methods.
- Another preferred embodiment for determining the analyte concentrationis determining the slope of the intensity profile between the lowest intensity and the most frequent intensity of the wetted area.
- the intensity which has the greatest frequency of an intensity interval or gray valuecan be used to determine the analyte.
- a further preferred embodiment for determining the concentration of the analytecan be carried out on the basis of intensities which exceed an abundance threshold. This frequency threshold value ensures that the area that has the most homogeneous discoloration of the wetted area is used for the evaluation.
- the systemhas a quality control option based on the frequency distribution.
- the distribution of the intensitiesis small if the reagent is ideally distributed on the test element. The broader this intensity distribution, the more inhomogeneously the reaction took place.
- the inhomogeneity of the reactiondepends both on the distribution of the reagent in or on the detection area and on the spread of the drop on the detection area.
- this drop on the detection areacan have a different-sized edge area. The reaction of the blood in this edge area with the reagents in or on the detection area can behave differently than in the center of the sample drop.
- a method for determining the concentration of an analyte in a liquidis also described.
- an intensity frequency of the unwetted detection area of the test elementis determined. This can be done before applying a sample drop or after, depending on whether the detection area is completely wetted or not.
- the methodincludes the detection of light intensities of the light emitted by at least a partial area of the detection area. These light intensities are evaluated based on their frequencies as described above.
- the evaluation of light intensities using a histogramcan be used in various systems in which light intensities change due to the presence of an analyte.
- An example of such a systemis the determination of glucose in a biological sample such as blood, plasma, serum or interstitial fluid.
- sample volumesbetween 1 and 500 nl can be measured.
- a preferred rangeis between 10 and 100 nl and a particularly preferred range is between 10 and 50 nl.
- an instrumentwhich has a detection unit for detecting light intensities emitted by partial areas of a detection area of a test element and an evaluation unit which determines the concentration of the analyte on the basis of frequencies of light intensities of the light emitted by the partial areas
- the detection unitmay include a CMOS detector, the pixel of which is connected to at least one A/D converter.
- the evaluation unitcan be connected to a display unit, or the display unit can be integrated into the evaluation unit.
- the detection unit and evaluation unitare integrated on one chip. This offers the advantage that the instrument is highly integrated and can therefore be set up in a space-saving manner. Since the storage requirement is very small due to the reduced amount of data for the evaluation, the power consumption of such an integrated element is also significantly lower than that of conventional instruments.
- Test elementssuch as those from the documents can be used in conventional devices for determining a blood parameter EP-A 0 885 591 , EP-B 0 535 480 and EP-B 0 477 322 are known.
- the test elementcontains a detection area. This detection area preferably contains all the reagents necessary for the detection reaction of the target analyte in the sample and, if necessary, auxiliary substances.
- the detection elementcan also contain only parts or none at all of the reagents or auxiliary substances. Those familiar with the technology of analytical test elements or diagnostic test carriers skilled artisan such reagents and tools are well known as z. B.
- the detection elementcan contain, for example, enzymes, enzyme substrates, indicators, buffer salts, inert fillers and the like.
- the detection elementcan be made up of one or more layers and optionally contain an inert carrier, preferably on the side of the test element which is not brought into contact with the sample.
- the carrier material of the detection elementitself can be transparent, for example a transparent plastic film such as polycarbonate film, or have a transparent recess on the detection side.
- Test elementssuch as those described in the patent application can be used for the preferred reflection measurement WO 99/29429 are described. These contain a pigment layer (preferably TiO 2 ) in the detection layer.
- This diffusely scattering TiO 2 layercauses an increase in the reflection of the light which leads to a higher interaction of the incident light with the reagents. As a result, the measuring effect, such as the absorption of the light, can be increased.
- the dye formedpreferentially absorbs light at a wavelength of 660 nm.
- a test elementwhich serves to analyze very small sample volumes.
- This test elementcan be present in a system, with the sample being applied by the system.
- the sampleis preferably transported through the system to the test element and the application is transferred from a sample collection point to the test element. With this transfer, the sample drop on the test element assumes a specific shape as long as a sufficient sample quantity is reached. With the help of the histogram evaluation, this test droplet can be evaluated independently of its shape.
- the detection areacan be illuminated by one or more light sources.
- the detection areacan be illuminated homogeneously or only in partial areas. If only one light source is used, homogeneous illumination of the detection area can be improved by using frosted glass or other scattering units.
- An alternative to illuminating the detection area with at least one light sourceis to use ambient light (sunlight or artificial lighting) to illuminate the detection area. Since the ambient light is multispectral, a filter can be used between the test element and the detector to detect only a specific wavelength range.
- the system for the sequential illumination of the test elementcan be provided with different illumination units.
- a simple laser diode combined with a reflector that can be adjusted by micromechanicscan serve as the light source.
- the light beamcan scan the test element without gaps.
- a laser arraycan be used, preferably a VCSEL array (Vertical Cavity Surface Emitting Laser). Each laser in the array can be individually addressed.
- the VCSELoffer the advantage that the light is emitted with little beam divergence.
- These laser structureshave a beam divergence of about 5-8°. In this way, not only a small area is to be irradiated, in addition the amount of light on this area is very high.
- a laser diode arrayAnother possibility is a laser diode array.
- either the lightcan be coupled into an image guide that guides the excitation light to the test element, or the light is focused onto the different areas of the test element by means of a microlens array, which is arranged between the LED array and the test element.
- An OLED checkerboardOrganic Light Emitting Diodes
- an illumination LED and a detectorcan be arranged directly adjacent. By arranging several such lighting/detector units, a large area can be illuminated over a large area or sequentially and the reflection can be detected. Since both the illumination and the detection are arranged at a similar angle to the test element, this arrangement is particularly suitable for fluorescence measurement, since the excitation light and the light emitted by the detection area can be easily separated from one another by means of filters.
- the lighting unitcan consist of a monochrome or multispectral, coherent or incoherent radiation source.
- the radiation from the illumination unitserves to penetrate into the detection area, also referred to as the sample site, in order to measure the analyte directly or the color reaction of a reagent with the analyte.
- the lighting unitpreferably consists of one or more LEDs whose light at the sample location ensures either a specially selected spatial intensity distribution or homogeneous illumination.
- the illuminationcan be designed to be focused. The focus is then shifted towards the depth dimension.
- the excitationcan take place via a multispectral LED array.
- Coherent excitation with laser diodesfor example in the blue/ultraviolet spectral range, particularly in fluorimetry, is also conceivable.
- light with a wavelength of about 660 nmis used. This can be implemented through the choice of light source or through the installation of imaging units such as filters that are only transparent to a defined wavelength range.
- An imaging unitcan be installed between the lighting unit and the detection area.
- This imaging unitconsists of imaging optical elements such as lenses, mirrors, screens, prisms, light guides or holographic elements. This ensures that the detection area is illuminated.
- Another imaging unitis used to project the irradiated specimen onto the detection unit.
- This imaging unitalso consists of imaging optical elements such as lenses, mirrors, prisms, screens, light guides or holographic elements.
- a micro-optical lens arraycan be used, in which each individual element has delimited spatial areas of the test element Shows individual elements of the detection unit. When using a multispectral light source, it makes sense to place a filter in front of the detector or in front of the test element.
- Detection units for use in the present inventioncan consist of a planar or line-shaped element that enables the spatially and time-resolved measurement of the scattered radiation that is imaged by the detection area.
- This elementis preferably a two-dimensional CMOS array, a CCD array or a linear diode array, in which the spatially resolved imaging of the detection area is carried out by means of a scanning process.
- a simple photodiode without spatial resolutioncan often be sufficient. This can be used, for example, in combination with a spatially resolved irradiation of the detection area.
- the detection unitconverts the amount of light hitting an optically sensitive surface of the detector into an electrical signal. This electrical signal can be forwarded directly to the evaluation unit and processed further there.
- the optically sensitive surfaceis divided into sub-areas, which are also referred to as pixels. The larger the number of pixels, the smaller the sub-areas of the detected object can be distinguished.
- a CMOS detectoris used, which can have more than 1 million pixels. A preferred range is between 100 and 100,000 pixels, and a more preferred range is between 1000 and 10,000 pixels.
- These pixelsare preferably arranged in a square or rectangular shape, forming a two-dimensional array.
- the arrayconsists of at least one row and at least one column. The number of rows and number of columns can differ from each other. Depending on the geometry of the object to be detected, the array can also have a round or oval shape.
- a preferred arrangement of the pixelsis an array of 256 by 256 pixels.
- an A/D convertercan additionally be attached to each pixel.
- each row or each column of the arrayis connected to an A/D converter.
- the signalscan be read out in columns or rows.
- the CMOS detectorcan be integrated on one chip together with the at least one A/D converter. This chip can be a silicon chip known from the prior art, as in " CMOS image sensors" by D. Scheffler and J. Seijnaeve in Laser + Photonik; May 2005; pp. 32-35 described.
- the signals received by the detection unitare forwarded to an evaluation unit.
- This evaluation unitcan be integrated in the detection unit or be present separately from it.
- the evaluation unitcan in turn be connected to a display unit or the display unit can be integrated into the evaluation unit.
- the electrical signals from each pixel of the detection unitare counted in the evaluation unit. If the signals have not already been converted into digital values in the detection unit, this can be done in the evaluation unit.
- the signalscan be additionally amplified.
- the level of the individual signalcorresponds to an intensity of the light that was detected by individual pixels.
- the maximum signal that can be received by the detectoris set equal to 255 gray levels. If the detector does not receive any light, the signal corresponds to gray value 0. All intensities that lie between the maximum gray value of 255 and the minimum gray value of 0 are divided into 254 gray levels.
- a histogram evaluationis described which can determine the concentration of an analyte on the basis of frequency of light intensities, converted into gray values, of the light emitted by the partial areas.
- the detection area of the test elementcan first be measured without a sample. In doing so, a frequency distribution determined from gray values. If the unwetted test element has few or no imperfections, there is a narrow distribution of frequencies around a most common gray value in the histogram.
- the detection areaWhen the sample is applied to the detection area, at least part of the detection area is wetted with sample liquid. A reaction between the analyte in the sample and the reagent on the detection area can take place in this at least one partial area. This can result in a change in an optical property (such as a color change) of the reagent.
- the wetted portiondarkens. This darkening results from the release of a dye when the analyte reacts with the detection reagent. The released dye absorbs the light radiated onto the detection area, as a result of which less light is reflected at the detection area and thus detected. This darkening leads to a change in the gray values of these sub-areas.
- the concentration of the analytecan be determined on the basis of the change in the frequency distributions before and after wetting at least part of the detection area.
- the gray value shiftis referenced.
- the at least one gray value for calculating the analyte concentrationcan be freely selected.
- One gray levelis sufficient to determine the concentration of the analyte, but more than one can be selected.
- the relationship of the selected gray level(s) to the analyte concentration to be analyzedshould be known. This relationship is called referencing.
- the referencingcan take place either in relation to a gray value shift of the at least one selected gray value in relation to an unwetted partial area or in relation to a reference area.
- the gray value shiftie the difference between the selected gray value of the sample to be analyzed and the gray value of the non-wetted partial area or the reference area.
- This gray level shift or differenceis compared to gray level shifts for various known glucose concentrations. From this comparison, conclusions can be drawn immediately about the glucose concentration in the sample.
- An example of a representative gray value of the wetted sub-areasis the gray value with a maximum frequency.
- One way to determine this gray value shift from the measured valuesis to determine the distance between the maximum values of the frequencies before and after wetting.
- one of the at least one gray valuescan be taken that have a certain percentage, for example 50, 60, 70 or 80% of the frequency of the maximum frequency.
- the mean values from several gray values with a specific frequencycan also be used.
- the detection areais to be evaluated after the reaction has ended completely.
- an end point of the reactionshould be determined. This can be done by observing the rates of change in frequencies during the reaction process. It can be specified that the reaction is complete when the rate of change falls below a threshold value for the rate of change. At this point it can be assumed that the reaction is more than, for example, 95% complete.
- Another way of using the frequency distribution to determine the concentration of the analyteis to determine the gray value at which the slope of the intensity curve between the lowest intensity and the most frequent intensity is greatest. Frequencies that reach a certain percentage (e.g. 50%) of the maximum gradient can also be used here.
- the concentration of the analytecan be determined on the basis of gray values that exceed a frequency threshold.
- the selection of gray values with a sufficient frequencyavoids evaluating areas that exhibit insufficient homogeneity of sample and/or reagent.
- An example of an area with an inhomogeneous sample distributionis the edge area of the wetted areas of the detection area.
- the frequency threshold valuecan be selected in such a way that the edge area is not included in the analysis. However, only gray values that are representative of the wetted area should be used.
- a gray level threshold value for the gray levelmust be used to delimit the gray values of the wetted detection area.
- only frequencies of gray values that are below the gray level threshold valueare used to determine the analyte.
- an average frequency, which is used to evaluate the concentrationis determined from the frequencies of the wetted area that are above the frequency threshold value.
- a further preferred embodimentis the evaluation based on the speed of the change in the frequencies of the emitted light intensities after the detection area has been wetted. This requires a temporal observation of the change in the frequency distribution after wetting the detection area.
- the intensity of the partial areasis determined at predetermined time intervals before and/or after wetting the detection area and the frequency distribution of the gray value can be calculated from the intensities.
- the change in the frequency distribution of the gray valuestakes place the faster the more analyte is in the sample.
- This different rate of dye formation as a function of the analyte concentrationcan be used to determine the concentration based on the rate at which the detection area darkens. The speed of the darkening is reflected in the speed of the frequency shift.
- a further preferred embodiment for determining the concentration of the analytecan be based on at least some of the frequencies that have a lower intensity than the maximum value of the second maximum, caused by the wetted partial areas.
- This at least one gray value selected for determining the concentrationcan be compared with a corresponding reference system and the concentration of the analyte can be inferred from this.
- the frequency distributionit can also be determined whether sufficient wetting of the detection area has taken place. For this purpose, it is determined whether a sufficient number of pixels has undergone a gray value shift. If a certain number of all shifted intensities is exceeded, sufficient wetting of the detection area can be determined.
- the end point of the reactioncan be determined by determining the change in the frequency distribution over time after the sample has been applied. If the frequency distribution only changes within a certain range over a certain period of time, it can be assumed that the reaction is complete. This time interval can be in the range of minutes, but in a preferred embodiment is within 1-10 seconds. The interval in which the frequency distribution may still change is a few percent and should not exceed 5%.
- An alternative way of determining the analyte concentrationis to track the frequency distribution of intensities or gray values over time after wetting the detection area.
- multivariate evaluation methodscan be used, as are known in the prior art. For example, an evaluation of the histograms at different points in time of the ongoing reaction using the "Partial Least Squares” (PLS) method or the “ Principle component regression” (PCR) method possible, as described in the publication by H. Martens and T. Naes, "multivariate calibration", ISBN 0471 90979 3 are described. Other statistical methods can also be used for this purpose.
- PLSPartial Least Squares
- PCRPrinciple component regression
- the frequency distribution of intensitiescan also be used for quality control.
- edge effects in the form of an edge areacan play a decisive role and impair the measurement result.
- the edge area between the intensity accumulations around the frequency maximum of the unwetted and the wetted part of the detection areacan be seen in the histogram. Since the edge area is characterized by the inhomogeneous distribution of the sample on the detection area, it can include a different range of gray values depending on the analyte concentration in the sample.
- an altered analyte exchangecan take place between the blood drop and the reagent layer. Since it is usually a question of a disruption in the analyte exchange, there is less conversion of the analyte.
- the lower conversion of analytemeans a higher intensity detected in the edge area. This change depends on many factors, including viscosity and the concentration distribution of various blood parameters such as e.g. B. Glucose and hematocrit in the sample. Another cause of inhomogeneities is the texture of the test element in the detection area.
- test elementsare used that have a detection area that contains a number of layers.
- One of the layersis designed to prevent large sample components, such as red blood cells in a blood sample, from further penetration. The light is reflected differently from this layer in the edge area than from the opposite side of the detection area.
- the detection areais measured from the side opposite the blood sample. In contrast to this, the transmission measurement detects on the blood application side.
- test elementIn order to carry out an optimal evaluation of a detection area of a test element, it is possible to carry out a quality control before using the test element.
- the test elementis measured in a spatially resolved manner using the detection unit before it is wetted. Based on the frequency distribution of the measured intensities of the different partial areas, it can be examined whether the test element has sufficient homogeneity and whether the test element is suitable for use.
- quality criteriacan be used for this.
- a quality criterionis the number of intensities within a given intensity interval. The frequency proportion of the intensities that lie within the specified interval must exceed an interval threshold value so that the test element can be released for use.
- the test elementcan be excluded from use, as there is a risk that the measurement results will be disturbed by irregularities in the detection area.
- the width of the intensity intervaldepends on the properties of the detection area.
- the unsuitability of the test elementcan be indicated to the patient by the system through a warning signal, such as an acoustic or optical signal.
- a second option for checking the quality of the detection areais to alternatively or additionally compare the intensity—or the gray value—that belongs to the mean or maximum frequency with a quality threshold value. If the gray value that corresponds to the average or maximum frequency is below the quality threshold value, it can be assumed that the test element is dirty in the detection area and should therefore not be used.
- Another quality control optionis to compare the maximum frequency with a reference threshold. If this reference threshold value is not exceeded, it can be assumed that too many pixels have a changed gray value due to dirt and could falsify the measurement after wetting.
- FIG. 1aA system is shown in FIG. 1a which contains a test element (1) with a detection area (2) which is irradiated by a light source (3). Imaging units, such as lenses and/or diaphragms, can be fitted between the light source (3) and the test element (1).
- Imaging unitssuch as lenses and/or diaphragms, can be fitted between the light source (3) and the test element (1).
- both a screen (4) and a lens (5)are arranged between the light source and the detection area (2) of the test element (1) in order to illuminate the detection area (2) as homogeneously as possible.
- the light emitted by the detection area (2)is caught by a detector (6).
- This detector (6)should contain at least 10 pixels (17) in order to be able to detect the detection area (2) in a spatially resolved manner.
- the signals from the detector (6)are evaluated in an evaluation unit (7) which is connected to the detector (6).
- a preferred embodiment of the detectoris a CMOS detector that includes at least one A/D converter to convert the analog electrical signals into digital signals. These digital signals can be forwarded to the evaluation unit (7) in order to be subjected to the various evaluations there.
- the calculated measured valuescan be displayed via a display unit (7b) which is connected to the evaluation unit or is integrated into it.
- a detector (6)is used which has a converter in a range from 8 to 12 bits. The measuring range is determined with the help of the detector (6) divided into 256 gray values between its zero value and its maximum value.
- the evaluation unit (7)is designed to count the frequencies of the 256 gray values. These frequencies can be plotted against the intensity intervals, which are also referred to as gray values (11), in a histogram (10). Each intensity interval is assigned a gray value.
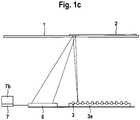
- FIG. 1ba system for transmission measurement is shown.
- the test element (1) with its detection area (2)is located between the light source (3) and the detector (6).
- Imaging unitscan also be used here both between the test element (1) and the light source (3) and between the test element (1) and detector (6).
- the detector (6)is also capable of spatially resolved measurement, which is why it has a large number of pixels (17).
- the detector (6)is in turn connected to an evaluation unit (7).
- a display unit (7b)is in turn connected to the evaluation unit (7) or integrated into it.
- This transmission arrangementcan preferably be used for fluorescence measurements.
- a filter (8)which blocks the excitation light is provided between the test element (1) and the detector (6).
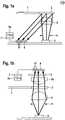
- FIG. 1cshows a system for spatially resolved illumination of the detection area (2).
- a light source (3)is used, which illuminates only a portion of the detection area (2). If only one light source (3) is used, the light is focused on different sub-areas of the detection area (2) via a reflector (not shown here).
- various light sources (3)which are arranged in an array (3a), as shown here, are directed onto the detection area (2). In this way, at least a partial area of the detection area (2) can be illuminated sequentially or simultaneously. If the detection area (2) is illuminated sequentially, which is also referred to as scanning, a single photodiode can be used as a detector (6).
- the detection area (2)is simultaneously illuminated by more than one light source (3) of the array (1a)
- a spatially resolved detector (6)is required for a spatially resolved measurement.
- the detector (6)is connected to an evaluation unit (7) which receives the measurement signals from the detector (6) for further evaluation.
- a display unit (7b)is connected to the evaluation unit (7) or integrated into it.
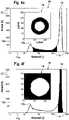
- FIG 2athe gray value distribution (9) of an unwetted test element (1) is shown.
- the displayis in the form of a histogram (10), with the gray values (11) (256 in the example shown) being plotted on the X-axis (11a), while the number of detected gray values (12) is plotted on the Y-axis ( 12a) is reproduced.
- the homogeneity of the detection area (2) of the test element (1)can be deduced from the distribution of the gray values (11).
- the gray values (11)are between 0 and 200, with the most common gray value of the unwetted detection area being 173. This is from the maximum (13) of the gray value histogram (10) in Figure 2a apparent.
- Figure 2bshows a darkening of the detection area (2) after application of a sample drop. Since the detection area (2) was only partially wetted, in this case slightly more than half of the partial areas, the histogram (10) has two maxima (13) and (13a) of gray values (11). Because of this darkening, the intensity of the light emitted by the wetted areas decreases and the pixels of the detector that measure these areas detect a lower signal. This leads to lower gray values in the histogram (10). The smaller part of the pixels, which corresponds to the unwetted area, still has a gray value (11) of approx. 173, while a larger part of the pixels now has a gray value (11) of 115 on average.
- the difference between the mean gray value (11) of the unwetted area of the detection area (2) and the gray value (11) of the darker area after wettingdepends on the discoloration of the detection area (2) and thus on the glucose concentration. Thus, the glucose concentration can be directly deduced from the change in the gray values (11).
- a typical reference curve (15)is shown, as is required to calculate the concentration of the analyte (in this example glucose) in a sample using the histogram analysis described.
- liquid samples with a known concentrationare examined using one of the methods described above. For example, a frequency shift of the gray values (called ⁇ GW) (16) of the maxima (13) and (13a) associated with a glucose concentration.
- ⁇ GWfrequency shift of the gray values
- Thiscan be used to show how the shift in the frequencies of the gray values (16) can be converted into a concentration.
- a large shift in frequencies (16)corresponds to a high analyte concentration and vice versa.
- the ⁇ GW valueis determined in the evaluation unit (7) using the intensities of the wetted detection area (2) measured by the detector (6). This is done using the same procedure as for determining the reference curve (15). Since the reference curve (15) is stored in the evaluation unit (7), the analyte concentration can be read off there immediately.
- FIGs 4a to 4eshows the relationship between the gray value distribution in the histogram (10) and the associated wetted areas.
- Figure 4ashows a black and white representation of a drop (14) which was applied to the detection area (2).
- the detection areahas an extension of approx. 650 * 650 ⁇ m.
- Figure 4bthe associated histogram (10) is shown, which represents the gray values (11) of the entire detection area (2). It can be seen here that the largest part of the detection area (2) is still unwetted, which is why the larger maximum (13) of gray values (11) is still around 173.
- Another maximum (13a)is at a gray value (11) of approx. 65. Considering how in Figure 4d shown, gray values (11) that lie around this maximum (13a), i.e.
- the drop representation (14) in Figure 4dshows the edge area of the drop.
- the gray values (11) of this edge arealie between the gray values (11) of the unwetted and the homogeneously wetted area.
- Figure 4fthe pixels of the unwetted part of the detection area (2) are shown. Since only part of the detection area (2) is wet in this example, the frequency of the gray values (11) around the maximum value is very high.
- figure 5shows a time course of the gray value distribution during the wetting process.
- timeis plotted on the x-axis (11a) versus gray values (11) on the y-axis (12a).
- the detection area (2)is unwetted and has a gray value (11) of approximately 173.
- the gray value (11)briefly decreases due to the darkening of the detector (6) and then continues from the gray value (11) at about 173 in two different directions.
- the unwetted part (14a) of the section of a partially wetted detection area (2) shown in image (14)remains at the gray value (11) of 173.
- the shape of the curve (14b')can be used to determine the analyte if the curve shapes for different concentrations of the analyte are known.
- the rate of change in frequencycan be used to determine the completion of the reaction.
- a speed threshold value for falling below the speed of the frequency changecan be defined. If the speed falls below the threshold value, this point in time can be used to start evaluating the analyte if this is necessary.
Landscapes
- Engineering & Computer Science (AREA)
- Physics & Mathematics (AREA)
- General Physics & Mathematics (AREA)
- Health & Medical Sciences (AREA)
- Life Sciences & Earth Sciences (AREA)
- Theoretical Computer Science (AREA)
- Computer Vision & Pattern Recognition (AREA)
- General Health & Medical Sciences (AREA)
- Pathology (AREA)
- Quality & Reliability (AREA)
- Biochemistry (AREA)
- Analytical Chemistry (AREA)
- Medical Informatics (AREA)
- Nuclear Medicine, Radiotherapy & Molecular Imaging (AREA)
- Radiology & Medical Imaging (AREA)
- Immunology (AREA)
- Chemical & Material Sciences (AREA)
- Molecular Biology (AREA)
- Probability & Statistics with Applications (AREA)
- Investigating Or Analysing Materials By The Use Of Chemical Reactions (AREA)
- Investigating Or Analysing Biological Materials (AREA)
- Investigating Or Analysing Materials By Optical Means (AREA)
- Investigating, Analyzing Materials By Fluorescence Or Luminescence (AREA)
Description
Translated fromGermanDie Erfindung liegt im Gebiet der optischen Analyse von kleinen Probevolumina, wie sie beispielsweise bei der Diagnostik von Blutproben auftreten.The invention lies in the field of optical analysis of small sample volumes, such as occur in the diagnosis of blood samples.
Die Konzentrationsbestimmung verschiedener Analyten in physiologischen Proben ist von wachsender Bedeutung in unserer Gesellschaft. Die Untersuchung solcher Proben findet in verschiedenen Anwendungsbereichen statt, z. B. in klinischen Labors oder im "Home-Monitoring". Hierzu zählt vor allem auch die Glukosemessung beim Diabetes Management sowie die Cholesterinmessung bei Herz- und Gefäßkrankheiten. Die medizinische Blutdiagnostik setzt stets die Gewinnung einer Blutprobe des zu untersuchenden Individuums voraus.Determining the concentration of various analytes in physiological samples is of increasing importance in our society. The examination of such samples takes place in various application areas, e.g. B. in clinical laboratories or in "home monitoring". This includes, above all, glucose measurement in diabetes management and cholesterol measurement in heart and vascular diseases. Medical blood diagnostics always requires the collection of a blood sample from the individual to be examined.
Die nach dem Stechvorgang durchgeführte Analytik wird häufig in einem kleinen, tragbaren Messgerät, einem so genannten "Handheld device" durchgeführt, in dem mit Blut benetzte Testelemente analysiert werden. Eine große Bedeutung haben diese Handheld devices zum Beispiel in der Diagnostik von Diabetes Erkrankungen. Die Messung in diesen Geräten wird vor allem elektrochemisch oder optisch durchgeführt. Bei den optisch basierten Messungen, wird die Probe mit Licht beleuchtet und das reflektierte Licht detektiert, um die Analytkonzentration zu bestimmen. Hierzu werden vor allem Testelemente wie Teststreifen verwendet, die mit der Probe, wie Blut oder interstitielle Flüssigkeit benetzt werden. Die Probe reagiert anschließend mit den Reagenzien, die auf diesem Testelement aufgebracht sind. Dies kann zu einer Farbänderung führen, die anschließend detektiert werden kann.The analysis carried out after the lancing process is often carried out in a small, portable measuring device, a so-called "handheld device", in which test elements wetted with blood are analyzed. These handheld devices are of great importance, for example, in diagnosing diabetes. The measurement in these devices is mainly carried out electrochemically or optically. In optically based measurements, the sample is illuminated with light and the reflected light is detected to determine the analyte concentration. For this purpose, primarily test elements such as test strips are used, which are wetted with the sample, such as blood or interstitial fluid. The sample then reacts with the reagents that are applied to this test element. This can lead to a color change, which can then be detected.
Bei der Benutzung herkömmlicher Verfahren zur Analyse der Testelemente ist es von großer Bedeutung, dass der Nachweisbereich des Testelementes gleichmäßig von der Testflüssigkeit benetzt ist. Die ungleichförmige oder unzureichende Benetzung des Nachweisbereiches kann zu fehlerhaften Ergebnissen führen. Besonders wenn eine geringe Menge von Testflüssigkeit benutzt wird, könnte die Verteilung auf dem Testelement nicht gleichförmig sein und nur ein Teil des Nachweisbereiches ist mit Probenmaterial benetzt. In den herkömmlichen optisch basierten Messmethoden wird häufig das reflektierte Licht vom gesamten Nachweisbereich vermessen, was zu einer hohen Ungenauigkeit der gemessenen Glucose führt, da je nach applizierter Probenmenge unterschiedlich viel unbenetzte Fläche in die Bestimmung mit eingeht. Bei unzureichender Benetzung des Nachweisbereiches kann so die notwendige Größe des zu vermessenden Ausschnitts für eine fehlerfreie Messung unterschritten werden. Dies kann für den Patienten entweder eine Wiederholung der Messung notwendig machen oder es werden falsche Messwerte generiert.When using conventional methods for analyzing the test elements, it is of great importance that the detection area of the test element is evenly wetted by the test liquid. Uneven or insufficient wetting of the detection area can lead to erroneous results. Especially when a small amount of test liquid is used, the distribution on the test element may not be uniform and only part of the detection area is wetted with sample material. In the conventional optically based measurement methods, the reflected light is often measured from the entire detection area, which leads to a high level of inaccuracy in the measured glucose, since it varies depending on the amount of sample applied much unwetted area is included in the determination. In the case of insufficient wetting of the detection area, the required size of the section to be measured for an error-free measurement can be undercut. This can either make it necessary for the patient to repeat the measurement or incorrect measurement values are generated.
Versuche, der unzureichenden oder ungleichförmigen Benetzung des Testelements abzuhelfen, haben bisher nicht zu einer befriedigenden Lösung geführt. Im einfachsten Fall ist der Patient gezwungen, visuell die Benetzung des Testelements zu verifizieren. Dies ist vor allem bei Diabetikern, die häufig schon eine verminderte Sicht haben, nicht gut möglich.Attempts to remedy the insufficient or non-uniform wetting of the test element have so far not led to a satisfactory solution. In the simplest case, the patient is forced to visually verify that the test element has been wetted. This is particularly difficult for diabetics, who often already have reduced vision.
In der Patentschrift
Auch in der Patentanmeldung
Aus den Nachteilen des Standes der Technik ergibt sich die Aufgabe ein System zu entwickeln, das eine einfachere und genauere Analytik gewährleistet.The disadvantages of the prior art result in the task of developing a system that ensures simpler and more precise analysis.
Erfindungsgemäß wird ein System zur Bestimmung der Konzentration eines Analyten in einer Flüssigkeit beschrieben, mit einer Beleuchtungs- bzw. Detektionseinheit zur Detektion von Lichtintensitäten die von Teilbereichen eines Nachweisbereiches eines Testelementes abgestrahlt werden. Weiterhin wird eine Auswerteeinheit beschrieben, die für die detektierten Lichtintensitäten eine Häufigkeitsverteilung ermittelt, wobei die Häufigkeitsverteilung mindestens ein erstes Maximum, hervorgerufen durch unbenetzte Teilbereiche oder mindestens einem Referenzbereich und ein zweites Maximum, hervorgerufen durch benetzte Teilbereiche aufweist, und welche aufgrund von Häufigkeiten benetzte Bereiche identifiziert und von unbenetzten Bereichen unterscheidet und auf Basis der Häufigkeitsverteilung mindestens eine Lichtintensität auswählt und aus der mindestens einen ausgewählten Lichtintensität die Konzentration des Analyt mit kleinen Probevolumina ermittelt. Durch die Berücksichtigung von Häufigkeiten von Intensitäten ist es möglich, homogen benetzte Bereiche zu identifizieren und auszuwerten, die wenig von Nebeneffekten, wie inhomogene Reagenz- und/oder Probeverteilung, variierende Viskositätseigenschaften der applizierten Flüssigkeit oder Verunreinigungen der Probe und/oder des Testelementes beeinflusst sind. Auf diese Weise können Ergebnisse erzielt werden, bei denen Messfehler, die auf Eigenschaften des Testelementes und der Flüssigkeit zurückzuführen sind, nahezu ausgeschlossen sind.According to the invention, a system for determining the concentration of an analyte in a liquid is described, with an illumination or detection unit for detecting light intensities that are emitted from partial areas of a detection area of a test element. Furthermore, an evaluation unit is described which determines a frequency distribution for the detected light intensities, the frequency distribution having at least a first maximum, caused by unwetted partial areas or at least one reference area, and a second maximum, caused by wetted partial areas, and which identifies wetted areas on the basis of frequencies and from unwetted areas and selects at least one light intensity on the basis of the frequency distribution and determines the concentration of the analyte with small sample volumes from the at least one selected light intensity. By considering the frequencies of intensities, it is possible to identify and evaluate homogeneously wetted areas that are little influenced by side effects such as inhomogeneous reagent and/or sample distribution, varying viscosity properties of the applied liquid or contamination of the sample and/or the test element. In this way, results can be achieved in which measurement errors that can be attributed to the properties of the test element and the liquid are almost impossible.
Als Flüssigkeiten (auch als Probe oder Probeflüssigkeit bezeichnet) sind vor allem physiologische Flüssigkeiten wie Blut (venös oder kapillar), Blutbestandteile, interstitielle Flüssigkeit, Plasma, Serum, Urin oder Speichel zu verstehen, aber nicht darauf eingeschränkt. Im weiteren Text wird vor allem von Blut als Probe gesprochen. Dies ist exemplarisch für den Begriff der Flüssigkeit zu sehen und nicht einschränkend zu verstehen.Liquids (also referred to as sample or test liquid) are to be understood primarily as physiological liquids such as blood (venous or capillary), blood components, interstitial liquid, plasma, serum, urine or saliva, but not limited thereto. In the rest of the text, blood is primarily used as a sample. This is to be seen as an example of the concept of liquid and should not be understood as limiting.
Blutproben werden vor allem bei Selbsttests des Patienten benötigt, der regelmäßig einen Blutparameter untersuchen muss, wie beispielsweise bei Diabetikern. Um dem Patienten möglichst wenig Schmerz beim Stechen zu bereiten, wird die Einstichtiefe möglichst niedrig gewählt. Dabei wird nur wenig Blut gewonnen. Aus diesem Grund müssen die Analysemethoden immer kleinere Blutvolumina präzise vermessen können. Das erfindungsgemäße System ist deshalb sogar für die Analyse von Probevolumina unterhalb von 100 nl geeignet. Ein bevorzugter Volumenbereich liegt zwischen 1 bis 500 nl, ein besonders bevorzugter Volumenbereich liegt zwischen 10 und 100 nl. Es können jedoch auch größere Volumina vermessen werden. Besonders bei Instrumenten, die eine automatisierte Probenahme nach dem Einstich beinhalten, kann die zu analysierende Probemenge noch unterhalb von 1 nl liegen. Aus diesem Grund wird ein System beschrieben, das ermöglicht, sehr kleine Probevolumina unabhängig von ihrer applizierten Form zu analysieren. Dies geschieht mit Hilfe von Häufigkeitsbestimmungen von Lichtintensitäten der reagierten Bereiche auf dem Nachweisbereich in Form eines Histogramms.Blood samples are required above all for self-tests by patients who regularly have to examine a blood parameter, such as in the case of diabetics. In order to cause the patient as little pain as possible when lancing, the puncture depth is chosen as low as possible. Only a small amount of blood is obtained. For this reason, the analytical methods must be able to precisely measure smaller and smaller blood volumes. The system according to the invention is therefore even suitable for the analysis of sample volumes below 100 nl. A preferred volume range is between 1 and 500 nl, a particularly preferred volume range is between 10 and 100 nl. However, larger volumes can also be measured. The sample volume to be analyzed can be less than 1 nl, particularly with instruments that include automated sampling after the puncture. For this reason, a system is described that makes it possible to analyze very small sample volumes, regardless of the form in which they are applied. This is done with the help of frequency determinations of light intensities of the reacted areas on the detection area in the form of a histogram.
Zur Veranschaulichung des Prinzips der Auswertung von Häufigkeiten, kann ein Histogramm herangezogen werden. Hierbei werden die Lichtintensitäten z.B. in Form von Grauwerten bestimmt und in Intensitätsintervalle eingeordnet. Die Häufigkeit der jeweiligen Lichtintensität in einem Intensitätsintervall wird gegen den Grauwert aufgetragen. Hierzu wird eine Detektionseinheit oder eine Bestrahlungseinheit benötigt, die ortsaufgelöst den Nachweisbereich detektiert oder bestrahlt. Es wird eine Mehrzahl von Teilbereichen auf dem Nachweisbereich untersucht, wobei die Ortsinformation bei der weiteren Auswertung nicht mit verwendet werden muss. Diese Teilbereiche sind keine realen Unterteilungen des Nachweisbereiches, sondern entstehen durch die optische, ortsaufgelöste Vermessung des Nachweisbereiches. Die Anzahl dieser Teilbereiche hängt somit von der Anzahl der bestrahlten bzw. detektierten Areale ab. Je mehr Teilbereiche untersucht werden, desto genauer kann die Unterscheidung von Intensitätsunterschieden verschiedener Bereiche ermittelt werden. Die Intensitäten der benetzten Teilbereiche korrelieren mit der Konzentration des Analyten der Probe. In einer bevorzugten Ausführungsform werden 256 Intensitäten unterschieden. Diese Anzahl an Intensitätsstufen ist ausreichend, um eine ausreichende Präzision / Auflösung zur Bestimmung der Konzentration des Analyten zu erreichen. Dabei kann die Datenmenge in einem so geringen Umfang gehalten werden, dass sie mittels kleiner Datenträger, die entweder in einer Auswerteeinheit im Detektor selbst oder in einer Auswerteeinheit getrennt vom Detektor, zu verarbeiten ist. Im Unterschied zu Systemen aus dem Stand der Technik, die zur Auswertung der ortsaufgelösten Messungen sämtliche Intensitätswerte weiterverarbeiten, werden in dem erfindungsgemäßen System zur Berechnung der Konzentration des Analyten bevorzugter weise nur bestimmte Häufigkeiten und die damit verknüpften Intensitäten benutzt. Besonders bei zeitaufgelösten Messungen, bei denen eine hohe Taktrate der Bildaufnahme nötig ist, weist die erfindungsgemäße Auswertung ohne Abspeicherung der kompletten Bilddaten eine deutliche Erniedrigung des Strombedarfs und des Speicherbedarfs auf. Auf diese Weise kann ein Gerät, das aufgrund der Auswertemethode einen niedrigen Speicherbedarf hat mit günstigen Bauelementen hergestellt werden. Das Gerät kann demnach kostengünstiger hergestellt und betrieben werden als herkömmliche Geräte.A histogram can be used to illustrate the principle of evaluating frequencies. Here, the light intensities are determined, for example, in the form of gray values and classified into intensity intervals. The frequency of the respective light intensity in an intensity interval is plotted against the gray value. This requires a detection unit or an irradiation unit that detects or irradiates the detection area in a spatially resolved manner. A number of partial areas in the detection area are examined, with the location information not having to be used in the further evaluation. These partial areas are not real subdivisions of the detection area, but are created by the optical, spatially resolved measurement of the detection area. The number of these partial areas thus depends on the number of irradiated or detected areas. The more partial areas are examined, the more precisely the differentiation between intensity differences in different areas can be determined. The intensities of the wetted sub-areas correlate with the concentration of the analyte in the sample. In a preferred embodiment, 256 intensities are distinguished. This number of intensity levels is sufficient to To achieve precision / resolution for determining the concentration of the analyte. The amount of data can be kept to such a small extent that it can be processed using small data carriers, which can be processed either in an evaluation unit in the detector itself or in an evaluation unit separate from the detector. In contrast to systems from the prior art, which further process all intensity values for the evaluation of the spatially resolved measurements, in the system according to the invention for calculating the concentration of the analyte preferably only certain frequencies and the associated intensities are used. Particularly in the case of time-resolved measurements, in which a high cycle rate of the image recording is required, the evaluation according to the invention without storing the complete image data shows a significant reduction in the power requirement and the memory requirement. In this way, a device which, due to the evaluation method, has a low storage requirement can be produced with inexpensive components. The device can therefore be manufactured and operated more cost-effectively than conventional devices.
Vor der Benetzung eines Testelements kann die Häufigkeitsverteilung der Intensitäten auf dem Nachweisbereich bestimmt werden. Die Teilbereiche des Nachweisbereiches weisen sehr ähnliche Intensitäten bzw. die daraus ermittelten Grauwerte auf. Alternativ können Intensitäten von Teilbereichen vor oder nach Aufgabe der Probe bestimmt werden, die von einem Referenzbereich detektiert werden. Dieser Referenzbereich kann Teil des Nachweisbereiches sein oder außerhalb des Nachweisbereiches liegen. In bzw. auf diesem Referenzbereich findet keine Reaktion statt, unabhängig ob der Referenzbereich von Probe benetzt wird oder nicht.Before a test element is wetted, the frequency distribution of the intensities on the detection area can be determined. The partial areas of the detection area have very similar intensities or the gray values determined from them. Alternatively, intensities of partial areas can be determined before or after application of the sample, which are detected by a reference area. This reference area can be part of the detection area or outside of the detection area. No reaction takes place in or on this reference area, regardless of whether the reference area is wetted by the sample or not.
Im Histogramm sind die unbenetzten Teilbereiche oder der Referenzbereich durch ein erstes Maximum zu erkennen, das eine schmale Verteilung von Intensitäten bzw. Graustufen um das Maximum aufweist. Ein Maximum der Häufigkeiten ist dadurch gekennzeichnet, dass die Kurve, die die Häufigkeiten wiedergibt an dem Punkt des Maximums eine Steigung von Null aufweist. Ein unbenutztes Testelement, weist auf seinem Nachweisbereich idealer weise Intensitäten in einem kleinen Intensitätsbereich auf. Ist dies der Fall, kann davon ausgegangen werden, dass auf dem Nachweisbereich nur wenige bis keine Störstellen anzufinden sind. Dies ist die Voraussetzung für eine fehlerlose Messung einer Probe. Liegt eine signifikante Anzahl von Intensitäten außerhalb dieses kleinen "normalen" Intensitätsintervalls, so ist davon auszugehen, dass keine fehlerlose Messung mit diesem Testelement möglich ist. Dies kann als Qualitätskontrolle herangezogen werden, um fehlerhafte Testelemente von der Messung auszuschließen.In the histogram, the unwetted partial areas or the reference area can be recognized by a first maximum, which has a narrow distribution of intensities or gray levels around the maximum. A maximum of frequencies is characterized in that the curve representing the frequencies has a slope of zero at the point of the maximum. An unused test element ideally has intensities in a small intensity range on its detection area. If this is the case, it can be assumed that only a few or no imperfections can be found in the detection area. This is the prerequisite for an error-free measurement of a sample. If a significant number of intensities lie outside of this small "normal" intensity interval, it can be assumed that no error-free measurement is possible with this test element. This can be used as a quality control to exclude faulty test elements from the measurement.
Bei Aufgabe beispielsweise eines Tropfens der Probe auf den Nachweisbereich findet eine Veränderung der Häufigkeitsverteilung der Intensitäten statt. Dies ist unabhängig von der Wellenlänge, mit der der Nachweisbereich bestrahlt wird. So kann Licht im Infrarot-Bereich, im sichtbaren wie im UV-Bereich verwendet werden. Auch eine Fluoreszenzmessung ist mit diesem Verfahren möglich. Repräsentativ wird eine Methode beschrieben in der bei einer Wellenlänge von 660 nm das Testelement bestrahlt oder detektiert wird. In diesem Fall befindet sich ein Reagenz in oder auf dem Nachweisbereich, der möglichst homogen verteilt ist und eine Reaktion mit dem Analyten vollzieht, wobei ein Farbstoff freigesetzt wird, welcher bei 660 nm Licht absorbiert. Befindet sich Analyt in der Probenflüssigkeit, so verdunkelt sich an den benetzten Stellen des Nachweisbereiches das Testelement in den detektierten Wellenlängenbereich. Dies bedeutet eine Intensitätsverminderung in den benetzten Teilbereichen. Bei einer homogenen Verteilung des Reagenz auf dem Nachweisbereich gibt es eine entsprechende Anzahl von Testfeldern, die eine ähnliche Intensität aufweisen. Im Histogramm ist eine Umverteilung von Häufigkeiten der Intensitäten, bedingt durch die Verfärbung des Nachweisbereiches, zu erkennen. Dabei findet eine Anhäufung von Grauwerten bei einer niedrigeren Intensität statt. Im Histogramm ist ein zweites Maximum zu erkennen, das von den benetzten Teilbereichen herrührt. Wenn der Nachweisbereich vollständig benetzt wird, werden alle Grauwerte des ersten Maximums zu einem anderen Grauwert verschoben. Je homogener das Reagenz bzw. die Probe verteilt sind, desto schmaler ist die Verteilung um den mittleren Intensitätswert der verschobenen Intensitätswerte der benetzten Bereiche.If, for example, a drop of the sample is placed on the detection area, there is a change in the frequency distribution of the intensities. This is independent of the wavelength with which the detection area is irradiated. Light in the infrared range, in the visible range and in the UV range can be used. A fluorescence measurement is also possible with this method. A representative method is described in which the test element is irradiated or detected at a wavelength of 660 nm. In this case, there is a reagent in or on the detection area, which is distributed as homogeneously as possible and reacts with the analyte, releasing a dye that absorbs light at 660 nm. If there is analyte in the sample liquid, the test element darkens in the detected wavelength range at the wetted points of the detection area. This means a reduction in intensity in the wetted areas. With a homogeneous distribution of the reagent on the detection area, there is a corresponding number of test fields that have a similar intensity. In the histogram, a redistribution of frequencies of intensities caused by the discoloration of the detection area can be seen. In this case, an accumulation of gray values takes place at a lower intensity. A second maximum can be seen in the histogram, which originates from the wetted sub-areas. When the detection area is completely wetted, all gray values of the first peak are shifted to another gray value. The more homogeneously the reagent or the sample is distributed, the narrower the distribution around the mean intensity value of the shifted intensity values of the wetted areas.
Diese Verteilung der Intensitätshäufigkeiten vor und nach Aufgabe der Probe auf den Nachweisbereich kann zur Bestimmung des Analyten herangezogen werden. In einer bevorzugten Ausführungsform werden die Intensitätsunterschiede der Maximalwerte in der Häufigkeitsverteilung vor und nach Benetzung des Nachweisbereiches zur Konzentrationsbestimmung des Analyten herangezogen. Eine weiter bevorzugte Ausführungsform ist die Auswertung auf Basis der Geschwindigkeiten der Veränderung der Häufigkeiten der abgestrahlten Lichtintensitäten nach Benetzung des Nachweisbereiches. Vor allem für die zeitliche Betrachtung der Veränderung der Häufigkeiten, aber auch für die anderen Auswerteverfahren, kann eine multivariate Analyse erfolgen.This distribution of the intensity frequencies before and after applying the sample to the detection area can be used to determine the analyte. In a preferred embodiment, the intensity differences of the maximum values in the frequency distribution before and after wetting the detection area are used to determine the concentration of the analyte. A further preferred embodiment is the evaluation based on the speed of the change in the frequencies of the emitted light intensities after the detection area has been wetted. A multivariate analysis can be carried out, especially for the temporal consideration of the change in frequency, but also for the other evaluation methods.
Eine weiter bevorzugte Ausführungsform zur Bestimmung der Analytkonzentration ist die Bestimmung der Steigung des Intensitätsverlaufes zwischen der niedrigsten Intensität und der häufigsten Intensität des benetzten Bereiches. Dabei kann beispielsweise die Intensität zur Bestimmung des Analyten herangezogen werden, die die größte Häufigkeit eines Intensitätsintervalls bzw. Grauwertes aufweist.Another preferred embodiment for determining the analyte concentration is determining the slope of the intensity profile between the lowest intensity and the most frequent intensity of the wetted area. In this case, for example, the intensity which has the greatest frequency of an intensity interval or gray value can be used to determine the analyte.
Eine weitere bevorzugte Ausführungsform zur Ermittlung der Konzentration des Analyten kann auf Basis von Intensitäten, die einen Häufigkeits-Schwellenwert überschreiten, durchgeführt werden. Mit diesem Häufigkeits-Schwellenwert wird sichergestellt, dass der Bereich zur Auswertung herangezogen wird, der die homogenste Verfärbung der benetzten Fläche aufweist.A further preferred embodiment for determining the concentration of the analyte can be carried out on the basis of intensities which exceed an abundance threshold. This frequency threshold value ensures that the area that has the most homogeneous discoloration of the wetted area is used for the evaluation.
Des Weiteren weist das System eine Möglichkeit zur Qualitätskontrolle aufgrund der Häufigkeitsverteilung auf. Wie bereits erwähnt, ist die Verteilung der Intensitäten bei idealer Verteilung des Reagenz auf dem Testelement gering. Je breiter diese Intensitätsverteilung ist, desto inhomogener hat die Reaktion stattgefunden. Die Inhomogenität der Reaktion ist sowohl abhängig von der Verteilung des Reagenz im oder auf dem Nachweisbereich, wie auch von der Ausbreitung des Tropfens auf dem Nachweisbereich. Je nach Viskosität und Bestandteilsverteilung des Blutes, kann dieser Tropfen auf dem Nachweisbereich einen unterschiedlich großen Randbereich aufweisen. Die Reaktion des Blutes in diesem Randbereich mit den Reagenzien im oder auf dem Nachweisbereich kann sich anders als im Zentrum des Probetropfens verhalten.Furthermore, the system has a quality control option based on the frequency distribution. As already mentioned, the distribution of the intensities is small if the reagent is ideally distributed on the test element. The broader this intensity distribution, the more inhomogeneously the reaction took place. The inhomogeneity of the reaction depends both on the distribution of the reagent in or on the detection area and on the spread of the drop on the detection area. Depending on the viscosity and the distribution of components in the blood, this drop on the detection area can have a different-sized edge area. The reaction of the blood in this edge area with the reagents in or on the detection area can behave differently than in the center of the sample drop.
Erfindungsgemäß wird ebenfalls ein Verfahren zur Bestimmung der Konzentration eines Analyten in einer Flüssigkeit beschrieben. Hierzu wird eine Intensitäts-Häufigkeit des unbenetzten Nachweisbereiches des Testelementes bestimmt. Dies kann vor Aufbringen eines Probetropfens oder danach geschehen, je nachdem ob der Nachweisbereich komplett benetzt wird oder nicht. Weiterhin beinhaltet das Verfahren die Detektion von Lichtintensitäten des von mindestens einem Teilbereich des Nachweisbereiches abgestrahlten Lichtes. Diese Lichtintensitäten werden auf Basis ihrer Häufigkeiten wie oben beschrieben ausgewertet.According to the invention, a method for determining the concentration of an analyte in a liquid is also described. For this purpose, an intensity frequency of the unwetted detection area of the test element is determined. This can be done before applying a sample drop or after, depending on whether the detection area is completely wetted or not. Furthermore, the method includes the detection of light intensities of the light emitted by at least a partial area of the detection area. These light intensities are evaluated based on their frequencies as described above.
Die Auswertung von Lichtintensitäten mittels Histogramm kann in verschiedenen Systemen eingesetzt werden, bei denen sich aufgrund der Anwesenheit eines Analyten Lichtintensitäten ändern. Ein Beispiel für solch ein System ist die Bestimmung von Glucose in einer biologischen Probe, wie beispielsweise Blut, Plasma, Serum oder interstitielle Flüssigkeit. Mit Hilfe dieser Auswerteverfahren können Probevolumina zwischen 1 und 500 nl vermessen werden. Ein bevorzugter Bereich liegt zwischen 10 und 100 nl und ein besonders bevorzugter Bereich liegt zwischen 10 und 50 nl.The evaluation of light intensities using a histogram can be used in various systems in which light intensities change due to the presence of an analyte. An example of such a system is the determination of glucose in a biological sample such as blood, plasma, serum or interstitial fluid. With the help of this evaluation method, sample volumes between 1 and 500 nl can be measured. A preferred range is between 10 and 100 nl and a particularly preferred range is between 10 and 50 nl.
Weiterhin wird ein Instrument beschrieben, das eine Detektionseinheit zur Detektion von Lichtintensitäten die von Teilbereichen eines Nachweisbereiches eines Testelements abgestrahlt werden sowie eine Auswerteeinheit, die auf Basis von Häufigkeiten von Lichtintensitäten des von den Teilbereichen abgestrahlten Lichtes die Konzentration des Analyt ermittelt, wobei die Detektionseinheit einen CMOS-Detektor enthalten kann, dessen Pixel mit mindestens einem A/D-Wandler verbunden ist. Weiterhin kann die Auswerteeinheit mit einer Anzeigeeinheit verbunden sein, bzw. die Anzeigeeinheit kann in die Auswerteeinheit integriert sein. In einem bevorzugten Instrument sind Detektionseinheit und Auswerteeinheit auf einem Chip integriert. Dies bietet den Vorteil, dass das Instrument stark integriert und damit Platz sparend aufgebaut werden kann. Da der Speicherbedarf aufgrund der reduzierten Datenmenge für die Auswertung sehr klein ist, ist zudem der Strombedarf eines solchen integrierten Elements deutlich niedriger als bei herkömmlichen Instrumenten.Furthermore, an instrument is described which has a detection unit for detecting light intensities emitted by partial areas of a detection area of a test element and an evaluation unit which determines the concentration of the analyte on the basis of frequencies of light intensities of the light emitted by the partial areas, the detection unit may include a CMOS detector, the pixel of which is connected to at least one A/D converter. Furthermore, the evaluation unit can be connected to a display unit, or the display unit can be integrated into the evaluation unit. In a preferred instrument, the detection unit and evaluation unit are integrated on one chip. This offers the advantage that the instrument is highly integrated and can therefore be set up in a space-saving manner. Since the storage requirement is very small due to the reduced amount of data for the evaluation, the power consumption of such an integrated element is also significantly lower than that of conventional instruments.
In üblichen Geräten zur Bestimmung eines Blutparameters, können Testelemente eingesetzt werden, wie sie aus den Dokumenten
In einer weiteren bevorzugten Ausführungsform wird ein Testelement benutzt, das zur Analyse sehr kleiner Probevolumina dient. Dieses Testelement kann in einem System vorliegen, wobei die Probenapplikation durch das System erfolgt. Hierzu wird bevorzugter weise die Probe durch das System zum Testelement transportiert und die Applikation von einem Probensammelort auf das Testelement übertragen. Bei diesem Übertrag nimmt der Probetropfen auf dem Testelement eine bestimmte Form an solange eine ausreichende Probenmenge erreicht ist. Mit Hilfe der Histogrammauswertung kann dieser Probetropfen unabhängig von seiner Form ausgewertet werden.In a further preferred embodiment, a test element is used which serves to analyze very small sample volumes. This test element can be present in a system, with the sample being applied by the system. For this purpose, the sample is preferably transported through the system to the test element and the application is transferred from a sample collection point to the test element. With this transfer, the sample drop on the test element assumes a specific shape as long as a sufficient sample quantity is reached. With the help of the histogram evaluation, this test droplet can be evaluated independently of its shape.
Die Beleuchtung des Nachweisbereiches kann durch eine oder mehrere Lichtquellen geschehen. Dabei kann der Nachweisbereich homogen ausgeleuchtet sein oder nur in Teilbereichen. Bei der Verwendung von nur einer Lichtquelle kann eine homogene Ausleuchtung des Nachweisbereiches durch die Verwendung eines Milchglases oder anderer streuender Einheiten verbessert werden.The detection area can be illuminated by one or more light sources. The detection area can be illuminated homogeneously or only in partial areas. If only one light source is used, homogeneous illumination of the detection area can be improved by using frosted glass or other scattering units.
Eine Alternative zur Beleuchtung des Nachweisbereiches mit mindestens einer Lichtquelle, ist die Nutzung des Umgebungslichtes (Sonnenlicht oder künstliche Beleuchtung) zur Ausleuchtung des Nachweisbereiches. Da das Umgebungslicht multispektral ist, kann zur Detektion nur eines bestimmten Wellenlängenbereiches ein Filter zwischen Testelement und Detektor eingesetzt werden.An alternative to illuminating the detection area with at least one light source is to use ambient light (sunlight or artificial lighting) to illuminate the detection area. Since the ambient light is multispectral, a filter can be used between the test element and the detector to detect only a specific wavelength range.
Alternativ kann das System zur sequentiellen Beleuchtung des Testelementes mit verschiedenen Beleuchtungseinheiten versehen sein. Dies ist jedoch nicht zwingend nötig. Als Lichtquelle kann beispielsweise eine einfache Laserdiode kombiniert mit einem Reflektor der durch Mikromechanik verstellbar ist, dienen. Mit Hilfe des Reflektors kann der Lichtstrahl das Testelement lückenlos abrastern. Alternativ kann ein Laser-Array eingesetzt werden, bevorzugt ein VCSEL-Array (Vertical Cavity Surface Emitting Laser). Jeder Laser im Array ist hierbei einzeln adressierbar. Die VCSEL bieten den Vorteil, dass das Licht mit geringer Strahldivergenz abgestrahlt wird. Diese Laserstrukturen weisen eine Strahldivergenz von etwa 5-8° auf. Auf diese Weise ist nicht nur eine kleine Fläche zu bestrahlen, zusätzlich ist die Lichtmenge auf dieser Fläche sehr hoch. Eine weitere Möglichkeit ist ein Laserdioden-Array. Hierbei kann entweder das Licht in einen Bildleiter eingekoppelt werden, der das Anregungslicht zu dem Testelement führt oder das Licht wird mittels eines Mikrolinsenarrays, das zwischen dem LED Array und dem Testelement angeordnet ist, auf die verschiedenen Bereiche des Testelements fokussiert. Als weitere Beleuchtungseinheit könnte auch ein OLED-Schachbrett (Organic Light Emmitting Diodes) dienen. Hierbei kann direkt benachbart eine Beleuchtungs-LED und ein Detektor angeordnet sein. Durch Anordnung mehrerer solcher Beleuchtungs-/Detektoreinheiten kann eine große Fläche flächig oder sequentiell ausgeleuchtet und die Reflektion detektiert werden. Da sowohl die Beleuchtung als auch die Detektion in ähnlichem Winkel zum Testelement angeordnet sind, eignet sich diese Anordnung bevorzugt für Fluoreszenzmessung, da hierbei das Anregungslicht und das vom Nachweisbereich emittierte Licht mittels Filter gut von einander zu trennen sind.Alternatively, the system for the sequential illumination of the test element can be provided with different illumination units. However, this is not absolutely necessary. For example, a simple laser diode combined with a reflector that can be adjusted by micromechanics can serve as the light source. With the help of the reflector, the light beam can scan the test element without gaps. Alternatively, a laser array can be used, preferably a VCSEL array (Vertical Cavity Surface Emitting Laser). Each laser in the array can be individually addressed. The VCSEL offer the advantage that the light is emitted with little beam divergence. These laser structures have a beam divergence of about 5-8°. In this way, not only a small area is to be irradiated, in addition the amount of light on this area is very high. Another possibility is a laser diode array. In this case, either the light can be coupled into an image guide that guides the excitation light to the test element, or the light is focused onto the different areas of the test element by means of a microlens array, which is arranged between the LED array and the test element. An OLED checkerboard (Organic Light Emitting Diodes) could also serve as a further lighting unit. In this case, an illumination LED and a detector can be arranged directly adjacent. By arranging several such lighting/detector units, a large area can be illuminated over a large area or sequentially and the reflection can be detected. Since both the illumination and the detection are arranged at a similar angle to the test element, this arrangement is particularly suitable for fluorescence measurement, since the excitation light and the light emitted by the detection area can be easily separated from one another by means of filters.
Die Beleuchtungseinheit kann aus einer monochromen oder multispektralen, kohärenten oder inkohärenten Strahlungsquelle bestehen. Die Strahlung aus der Beleuchtungseinheit dient dazu in den Nachweisbereich, auch als Probenort bezeichnet, einzudringen, um den Analyten direkt oder die Farbreaktion eines Reagenz mit dem Analyt zu messen. Vorzugsweise besteht die Beleuchtungseinheit aus einer oder mehreren LED's deren Licht am Probenort entweder für eine speziell gewählte räumliche Intensitätsverteilung oder für eine homogene Ausleuchtung sorgt. Um eine Tiefeninformation zu erhalten, kann die Beleuchtung fokussiert ausgelegt werden. Der Fokus wird dann in Richtung der Tiefendimension verschoben. Wahlweise kann die Anregung über ein multispektrales LED Array erfolgen. Auch die kohärente Anregung mit Laserdioden beispielsweise im blauen / ultravioletten Spektralbereich insbesondere in der Fluorimetrie ist denkbar. In einer bevorzugten Ausführungsform wird Licht mit einer Wellenlänge von ca. 660 nm benutzt. Dies kann durch die Wahl der Lichtquelle umgesetzt werden oder durch den Einbau von abbildenden Einheiten wie Filter, die nur für einen definierten Wellenlängenbereich lichtdurchlässig sind.The lighting unit can consist of a monochrome or multispectral, coherent or incoherent radiation source. The radiation from the illumination unit serves to penetrate into the detection area, also referred to as the sample site, in order to measure the analyte directly or the color reaction of a reagent with the analyte. The lighting unit preferably consists of one or more LEDs whose light at the sample location ensures either a specially selected spatial intensity distribution or homogeneous illumination. In order to obtain depth information, the illumination can be designed to be focused. The focus is then shifted towards the depth dimension. Optionally, the excitation can take place via a multispectral LED array. Coherent excitation with laser diodes, for example in the blue/ultraviolet spectral range, particularly in fluorimetry, is also conceivable. In a preferred embodiment, light with a wavelength of about 660 nm is used. This can be implemented through the choice of light source or through the installation of imaging units such as filters that are only transparent to a defined wavelength range.
Zwischen der Beleuchtungseinheit und dem Nachweisbereich kann eine Abbildungseinheit eingebaut sein. Diese Abbildungseinheit besteht aus abbildenden optischen Elementen wie Linsen, Spiegeln, Blenden, Prismen, Lichtleitenden oder holographischen Elementen. Dadurch wird eine Beleuchtung des Nachweisbereichs gewährleistet. Eine weitere Abbildungseinheit dient zur Projektion des bestrahlten Probenkörpers auf die Detektionseinheit. Diese Abbildungseinheit besteht ebenfalls aus abbildenden optischen Elementen wie Linsen, Spiegeln, Prismen, Blenden, Lichtleitenden oder holographischen Elementen. Wahlweise kann ein mikrooptisches Linsenarray verwendet werden bei dem jedes Einzelelement abgegrenzte räumliche Bereiche des Testelements auf Einzelelemente der Detektionseinheit abbildet. Bei Verwendung einer multispektralen Lichtquelle ist es sinnvoll, einen Filter vor dem Detektor bzw. vor das Testelement anzubringen.An imaging unit can be installed between the lighting unit and the detection area. This imaging unit consists of imaging optical elements such as lenses, mirrors, screens, prisms, light guides or holographic elements. This ensures that the detection area is illuminated. Another imaging unit is used to project the irradiated specimen onto the detection unit. This imaging unit also consists of imaging optical elements such as lenses, mirrors, prisms, screens, light guides or holographic elements. Optionally, a micro-optical lens array can be used, in which each individual element has delimited spatial areas of the test element Shows individual elements of the detection unit. When using a multispectral light source, it makes sense to place a filter in front of the detector or in front of the test element.
Detektionseinheiten, zur Verwendung in der vorliegenden Erfindung, können aus einem flächigen oder zeilenförmigen Element bestehen, das die orts- wie auch die zeitaufgelöste Messung der gestreuten Strahlung, die vom Nachweisbereich abgebildet wird, ermöglicht. Vorzugsweise handelt es sich bei diesem Element um ein zweidimensionales CMOS-Array, ein CCD Array oder ein zeilenförmiges Diodenarray, bei dem die ortsaufgelöste Abbildung des Nachweisbereiches mittels eines Scanvorganges durchgeführt wird. Häufig kann auch eine einfache Photodiode ohne Ortsauflösung hinreichend sein. Diese kann beispielsweise in Kombination mit einer ortsaufgelösten Bestrahlung des Nachweisbereiches benutzt werden.Detection units for use in the present invention can consist of a planar or line-shaped element that enables the spatially and time-resolved measurement of the scattered radiation that is imaged by the detection area. This element is preferably a two-dimensional CMOS array, a CCD array or a linear diode array, in which the spatially resolved imaging of the detection area is carried out by means of a scanning process. A simple photodiode without spatial resolution can often be sufficient. This can be used, for example, in combination with a spatially resolved irradiation of the detection area.
Die Detektionseinheit wandelt die auf eine optisch sensitive Fläche des Detektors auftreffende Lichtmenge in ein elektrisches Signal um. Dieses elektrische Signal kann direkt an die Auswerteeinheit weiter geleitet werden und dort weiterverarbeitet werden. Bei einem ortsaufgelösten Detektor ist die optisch sensitive Fläche in Teilbereiche unterteilt, die auch als Pixel bezeichnet werden. Je größer die Anzahl der Pixel, desto kleinere Teilbereiche des detektierten Objektes können unterschieden werden. In einer bevorzugten Ausführungsform wird ein CMOS-Detektor eingesetzt, der mehr als 1 Million Pixel besitzen kann. Ein bevorzugter Bereich liegt zwischen 100 und 100.000 Pixel und ein besonders bevorzugter Bereich liegt zwischen 1000 und 10.000 Pixel. Diese Pixel sind bevorzugter weise in einer quadratischen oder rechteckigen Form angeordnet und bilden ein zweidimensionales Array. Das Array besteht aus mindestens einer Zeile und mindestens einer Spalte. Dabei können Zeilenzahl und Spaltenzahl von einander differieren. Je nach Geometrie des zu detektierenden Gegenstandes kann das Array auch eine runde oder ovale Form annehmen. Eine bevorzugte Anordnung der Pixel ist ein Array aus 256 mal 256 Pixeln.The detection unit converts the amount of light hitting an optically sensitive surface of the detector into an electrical signal. This electrical signal can be forwarded directly to the evaluation unit and processed further there. In the case of a spatially resolved detector, the optically sensitive surface is divided into sub-areas, which are also referred to as pixels. The larger the number of pixels, the smaller the sub-areas of the detected object can be distinguished. In a preferred embodiment, a CMOS detector is used, which can have more than 1 million pixels. A preferred range is between 100 and 100,000 pixels, and a more preferred range is between 1000 and 10,000 pixels. These pixels are preferably arranged in a square or rectangular shape, forming a two-dimensional array. The array consists of at least one row and at least one column. The number of rows and number of columns can differ from each other. Depending on the geometry of the object to be detected, the array can also have a round or oval shape. A preferred arrangement of the pixels is an array of 256 by 256 pixels.
In einer weiteren Ausführungsform kann an jedem Pixel zusätzlich ein A/D-Wandler angebracht sein. In einer bevorzugten Ausführungsform wird jede Zeile oder jede Spalte des Arrays mit einem A/D Wandlern verbunden. Auf diese Weise können die Signale spalten- bzw. zeilenweise ausgelesen werden. Weiterhin kann der CMOS-Detektor zusammen mit dem mindestens einen A/D-Wandler auf einem Chip integriert werden. Dieser Chip kann dabei ein aus dem Stand der Technik bekannter Siliziumchip sein, wie in "
Der A/D-Wandler wandelt das analoge elektrische Signal in einen digitalen Wert um. Dies ist hinlänglich im Stand der Technik beschrieben. In einer bevorzugten Ausführungsform wird ein im Stand der Technik bekannter 8 bit A/D-Wandler benutzt. Dieser A/D-Wandler wandelt die elektrischen Signale in 256 verschiedene Intensitätsstufen um. Dabei sind die Intensitätsstufen jeweils gleich groß. Auf diese Weise können die detektierten Messwerte mit deutlich weniger Speicheraufwand weiter verarbeitet werden. Zusätzlich oder alternativ kann ein Verstärker an jeden Pixel integriert werden. Dies führt zusätzlich zur Verstärkung der Signale und damit zur Möglichkeit auch kleinere Signaländerungen zu detektieren. Mit Hilfe dieser Datenumwandlung und/oder Verstärkung kann die Datenmenge, die an die Auswerteeinheit weitergeleitet wird stark reduziert werden. Daraus ergeben sich folgende Vorteile:
- 1. Es ist ein schnelles Auslesen der Daten möglich,
- 2. Es können gezielt bestimmte Bereiche ausgelesen werden
- 3. Nach einer groben Abrasterung des Nachweisbereiches, können besonders interessante Bereiche, genannt "ROI" (region of interest) festgelegt und ausgelesen werden.
- 1. It is possible to read out the data quickly,
- 2. Certain areas can be read out in a targeted manner
- 3. After a rough scanning of the detection area, particularly interesting areas, called "ROI" (region of interest) can be defined and read out.
Die von der Detektionseinheit empfangenen Signale werden an eine Auswerteeinheit weitergeleitet. Diese Auswerteeinheit kann in der Detektionseinheit integriert sein oder separat davon vorliegen. Die Auswerteeinheit kann wiederum mit einer Anzeigeeinheit verbunden sein bzw. die Anzeigeeinheit kann in die Auswerteeinheit integriert sein. In der Auswerteeinheit werden die elektrischen Signale von jedem Pixel der Detektionseinheit ausgezählt. Wenn die Signale nicht bereits in der Detektionseinheit in digitale Werte umgewandelt wurden, kann dies in der Auswerteeinheit geschehen. Außerdem können die Signale zusätzlich verstärkt werden. Die Höhe des einzelnen Signals entspricht dabei einer Intensität des Lichtes, die durch einzelne Pixel erfasst wurde.The signals received by the detection unit are forwarded to an evaluation unit. This evaluation unit can be integrated in the detection unit or be present separately from it. The evaluation unit can in turn be connected to a display unit or the display unit can be integrated into the evaluation unit. The electrical signals from each pixel of the detection unit are counted in the evaluation unit. If the signals have not already been converted into digital values in the detection unit, this can be done in the evaluation unit. In addition, the signals can be additionally amplified. The level of the individual signal corresponds to an intensity of the light that was detected by individual pixels.
In einer bevorzugten Ausführungsform wird das maximale Signal, das durch den Detektor empfangen werden kann, einem Grauwert von 255 gleichgesetzt. Empfängt der Detektor kein Licht, so entspricht das Signal dem Grauwert 0. Alle Intensitäten, die zwischen dem maximalen Grauwert 255 und dem minimalen Grauwert 0 liegen, werden in 254 Graustufen unterteilt. Erfindungsgemäß wird eine Histogrammauswertung beschrieben, die auf Basis von Häufigkeiten von Lichtintensitäten, umgerechnet in Grauwerte, des von den Teilbereichen abgestrahlten Lichtes, die Konzentration eines Analyten ermitteln kann. Bei der Vermessung einer Probe kann zunächst der Nachweisbereich des Testelementes ohne Probe vermessen werden. Dabei wird eine Häufigkeitsverteilung von Grauwerten ermittelt. Wenn das unbenetzte Testelement wenige bis keine Störstellen aufweist, findet sich eine schmale Verteilung von Häufigkeiten um einen häufigsten Grauwert herum im Histogramm.In a preferred embodiment, the maximum signal that can be received by the detector is set equal to 255 gray levels. If the detector does not receive any light, the signal corresponds to
Bei Applikation der Probe auf den Nachweisbereich, wird mindestens ein Teil des Nachweisbereiches mit Probeflüssigkeit benetzt. In diesem mindestens einen Teilbereich kann eine Reaktion zwischen dem Analyt in der Probe mit dem Reagenz auf dem Nachweisbereich stattfinden. Daraus kann eine Änderung einer optischen Eigenschaft (wie beispielsweise Farbänderung) des Reagenz eintreten. In einer bevorzugten Ausführungsform tritt eine Verdunkelung des benetzten Teilbereiches ein. Diese Verdunkelung rührt von der Freisetzung eines Farbstoffes, bei der Reaktion des Analyten mit dem Nachweisreagenz. Der freigesetzte Farbstoff absorbiert das auf den Nachweisbereich eingestrahlte Licht, wodurch weniger Licht am Nachweisbereich reflektiert und damit detektiert wird. Diese Verdunkelung führt zu einer Veränderung der Grauwerte dieser Teilbereiche. Im Histogramm ist dies durch eine Verschiebung von Grauwerten, mindestens eines Teils der Häufigkeiten, zu erkennen. Wenn die Reagenzien und die Probe im Nachweisbereich sehr homogen verteilt sind, werden nahezu alle Teilbereiche des benetzten Nachweisbereiches einen ähnlichen Grauwert aufweisen, was sich im Histogramm als ein zweites Maximum zusätzlich zum ersten Maximum der unbenetzten Areale an Häufigkeiten bei diesem Grauwert zeigt.When the sample is applied to the detection area, at least part of the detection area is wetted with sample liquid. A reaction between the analyte in the sample and the reagent on the detection area can take place in this at least one partial area. This can result in a change in an optical property (such as a color change) of the reagent. In a preferred embodiment, the wetted portion darkens. This darkening results from the release of a dye when the analyte reacts with the detection reagent. The released dye absorbs the light radiated onto the detection area, as a result of which less light is reflected at the detection area and thus detected. This darkening leads to a change in the gray values of these sub-areas. This can be seen in the histogram by a shift in gray values, at least some of the frequencies. If the reagents and the sample are very homogeneously distributed in the detection area, almost all sub-areas of the wetted detection area will have a similar gray value, which shows up in the histogram as a second maximum in addition to the first maximum of the non-wetted areas at frequencies at this gray value.
Aufgrund der Veränderung der Häufigkeitsverteilungen vor- und nach Benetzung mindestens eines Teils des Nachweisbereiches, kann die Konzentration des Analyten ermittelt werden. Hierzu wird eine Referenzierung der Grauwertverschiebung vorgenommen. Der mindestens eine Grauwert zur Berechnung der Analytkonzentration kann dabei frei gewählt werden. Ein Grauwert ist zur Bestimmung der Konzentration des Analyten ausreichend, es können jedoch auch mehrere ausgewählt werden. Die Beziehung des bzw. der ausgewählten Grauwerte zu der zu analysierenden Analytkonzentration sollte jedoch bekannt sein. Diese Beziehung wird als Referenzierung bezeichnet. Die Referenzierung kann entweder auf eine Grauwertverschiebung des mindestens einen ausgewählten Grauwertes in Bezug auf einen unbenetzten Teilbereich stattfinden oder in Bezug auf einen Referenzbereich. Bei dieser Referenzierung wird die Grauwertverschiebung, also die Differenz zwischen dem ausgewählten Grauwert der zu analysierenden Probe und dem Grauwert des unbenetzten Teilbereiches oder dem Referenzbereich bestimmt. Diese Grauwertverschiebung oder Differenz wird mit Grauwertverschiebungen für verschiedene, bekannte Glucosekonzentrationen verglichen. Aus diesem Vergleich kann sofort auf die Glucosekonzentration in der Probe geschlossen werden. Um einen reproduzierbaren Bezug zwischen dem ausgewählten Grauwert der zu bestimmenden Probe und dem Grauwert des Referenzierungssystems zu gewährleisten sollte darauf geachtet werden, dass dieser ausgewählte Grauwert repräsentativ für die Glucosekonzentration ist. Ein Beispiel für einen repräsentativen Grauwert, der benetzten Teilbereiche, stellt der Grauwert mit einer maximalen Häufigkeit dar.The concentration of the analyte can be determined on the basis of the change in the frequency distributions before and after wetting at least part of the detection area. For this purpose, the gray value shift is referenced. The at least one gray value for calculating the analyte concentration can be freely selected. One gray level is sufficient to determine the concentration of the analyte, but more than one can be selected. However, the relationship of the selected gray level(s) to the analyte concentration to be analyzed should be known. This relationship is called referencing. The referencing can take place either in relation to a gray value shift of the at least one selected gray value in relation to an unwetted partial area or in relation to a reference area. With this referencing, the gray value shift, ie the difference between the selected gray value of the sample to be analyzed and the gray value of the non-wetted partial area or the reference area, is determined. This gray level shift or difference is compared to gray level shifts for various known glucose concentrations. From this comparison, conclusions can be drawn immediately about the glucose concentration in the sample. To establish a reproducible relationship between the selected To ensure the gray value of the sample to be determined and the gray value of the referencing system, care should be taken to ensure that this selected gray value is representative of the glucose concentration. An example of a representative gray value of the wetted sub-areas is the gray value with a maximum frequency.
Eine Möglichkeit diese Grauwertverschiebung aus den gemessenen Werten festzulegen, ist die Bestimmung des Abstandes der Maximalwerte der Häufigkeiten vor- und nach Benetzung. Alternativ kann einer der mindestens einen Grauwerte genommen werden, die einen bestimmten Prozentsatz, beispielsweise 50, 60, 70 oder 80 %der Häufigkeit der maximalen Häufigkeit aufweisen. Es können auch die Mittelwerte aus mehreren Grauwerten mit einer bestimmten Häufigkeit benutzt werden.One way to determine this gray value shift from the measured values is to determine the distance between the maximum values of the frequencies before and after wetting. Alternatively, one of the at least one gray values can be taken that have a certain percentage, for example 50, 60, 70 or 80% of the frequency of the maximum frequency. The mean values from several gray values with a specific frequency can also be used.
In einer Ausführungsform soll die Auswertung des Nachweisbereiches nach vollständig abgelaufener Reaktion stattfinden. Hierzu sollte ein Endpunkt der Reaktion ermittelt werden. Dies kann durch Beobachtung der Geschwindigkeiten der Änderung der Häufigkeiten während des Reaktionsprozesses geschehen. Dabei kann festgelegt werden, dass die Reaktion abgeschlossen ist, wenn ein Geschwindigkeits-Schwellenwert für die Änderungsgeschwindigkeit unterschritten wird. Zu diesem Zeitpunkt kann davon ausgegangen werden, dass die Reaktion zu mehr als beispielsweise 95 % abgelaufen ist.In one embodiment, the detection area is to be evaluated after the reaction has ended completely. For this purpose, an end point of the reaction should be determined. This can be done by observing the rates of change in frequencies during the reaction process. It can be specified that the reaction is complete when the rate of change falls below a threshold value for the rate of change. At this point it can be assumed that the reaction is more than, for example, 95% complete.
Eine weitere Möglichkeit die Häufigkeitsverteilung zur Bestimmung der Konzentration des Analyten zu benutzen, ist die Bestimmung des Grauwertes bei dem die Steigung des Intensitätsverlaufes zwischen der niedrigsten Intensität und der häufigsten Intensität am größten ist. Hier können auch Häufigkeiten herangezogen werden, die einen bestimmten Prozentsatz (z.B. 50 %) der maximalen Steigung erreichen.Another way of using the frequency distribution to determine the concentration of the analyte is to determine the gray value at which the slope of the intensity curve between the lowest intensity and the most frequent intensity is greatest. Frequencies that reach a certain percentage (e.g. 50%) of the maximum gradient can also be used here.
Alternativ kann auf Basis von Grauwerten, die einen Häufigkeits-Schwellenwert überschreiten, die Konzentration des Analyten ermittelt werden. Durch die Auswahl von Grauwerten mit einer ausreichenden Häufigkeit wird vermieden, Bereiche auszuwerten, die eine unzureichende Homogenität von Probe und/oder Reagenz aufweisen. Ein Beispiel für einen Bereich mit inhomogener Probeverteilung ist der Randbereich der benetzten Bereiche des Nachweisbereiches. Um eine Verfälschung der Messergebnisse durch diesen inhomogenen Bereich zu eliminieren, kann der Häufigkeits-Schwellenwert so gewählt werden, dass der Randbereich nicht mit in die Analyse aufgenommen wird. Dabei sollen aber nur Grauwerte herangezogen werden, die repräsentativ für den benetzten Bereich sind. Da auch in dem nicht benetzten Bereich dieser Häufigkeits-Schwellenwert überschritten werden kann, muss zur Abgrenzung der Grauwerte des benetzten Nachweisbereiches ein Graustufen-Schwellenwert für die Graustufe eingesetzt werden. Zur Analytbestimmung werden, in einer bevorzugten Ausführungsform nur Häufigkeiten von Grauwerten verwendet, die unterhalb des Graustufen-Schwellenwertes liegen. In einer weiteren Ausführungsform wird aus den Häufigkeiten des benetzten Bereiches die oberhalb des Häufigkeits-Schwellenwertes liegen eine mittlere Häufigkeit ermittelt, die zur Auswertung der Konzentration herangezogen wird.Alternatively, the concentration of the analyte can be determined on the basis of gray values that exceed a frequency threshold. The selection of gray values with a sufficient frequency avoids evaluating areas that exhibit insufficient homogeneity of sample and/or reagent. An example of an area with an inhomogeneous sample distribution is the edge area of the wetted areas of the detection area. In order to eliminate any falsification of the measurement results due to this inhomogeneous area, the frequency threshold value can be selected in such a way that the edge area is not included in the analysis. However, only gray values that are representative of the wetted area should be used. Since this frequency threshold value is also in the non-wetted area can be exceeded, a gray level threshold value for the gray level must be used to delimit the gray values of the wetted detection area. In a preferred embodiment, only frequencies of gray values that are below the gray level threshold value are used to determine the analyte. In a further embodiment, an average frequency, which is used to evaluate the concentration, is determined from the frequencies of the wetted area that are above the frequency threshold value.
Eine weiter bevorzugte Ausführungsform ist die Auswertung auf Basis der Geschwindigkeiten der Veränderung der Häufigkeiten der abgestrahlten Lichtintensitäten nach Benetzung des Nachweisbereiches. Hierzu ist eine zeitliche Beobachtung der Veränderung der Häufigkeitsverteilung nach Benetzung des Nachweisbereiches nötig. Dabei wird in vorgegebenen Zeitabständen vor und/oder nach Benetzung des Nachweisbereiches die Intensität der Teilbereiche ermittelt und aus den Intensitäten kann die Häufigkeitsverteilung der Grauwert berechnet werden. In einer bevorzugten Ausführungsform, bei der ein Farbstoff bei der Reaktion des Analyten mit einem Reagenz auf dem Nachweisbereich entsteht, findet die Änderung der Häufigkeitsverteilung der Grauwerte um so schneller statt je mehr Analyt in der Probe ist. Diese unterschiedliche Geschwindigkeit der Farbstoffbildung in Abhängigkeit der Analytkonzentration kann dazu benutzt werden, anhand der Geschwindigkeit der Abdunkelung des Nachweisbereiches eine Konzentrationsbestimmung durchzuführen. Die Geschwindigkeit der Abdunkelung spiegelt sich in der Geschwindigkeit der Häufigkeitsverschiebung wieder.A further preferred embodiment is the evaluation based on the speed of the change in the frequencies of the emitted light intensities after the detection area has been wetted. This requires a temporal observation of the change in the frequency distribution after wetting the detection area. The intensity of the partial areas is determined at predetermined time intervals before and/or after wetting the detection area and the frequency distribution of the gray value can be calculated from the intensities. In a preferred embodiment, in which a dye is formed in the reaction of the analyte with a reagent on the detection area, the change in the frequency distribution of the gray values takes place the faster the more analyte is in the sample. This different rate of dye formation as a function of the analyte concentration can be used to determine the concentration based on the rate at which the detection area darkens. The speed of the darkening is reflected in the speed of the frequency shift.
Eine weitere bevorzugte Ausführungsform zur Bestimmung der Konzentration des Analyten kann auf Basis von mindestens einem Teil der Häufigkeiten geschehen, die eine niedrigere Intensität aufweisen als der Maximalwert des zweiten Maximums, hervorgerufen durch die benetzten Teilbereiche.A further preferred embodiment for determining the concentration of the analyte can be based on at least some of the frequencies that have a lower intensity than the maximum value of the second maximum, caused by the wetted partial areas.
Dieser mindestens eine zur Bestimmung der Konzentration ausgewählte Grauwert, kann mit einem entsprechenden Referenzsystem verglichen werden und daraus auf die Konzentration des Analyten geschlossen werden.This at least one gray value selected for determining the concentration can be compared with a corresponding reference system and the concentration of the analyte can be inferred from this.
Mit Hilfe der Häufigkeitsverteilung kann zusätzlich ermittelt werden, ob eine ausreichende Benetzung des Nachweisbereiches stattgefunden hat. Hierzu wird ermittelt, ob eine ausreichende Anzahl von Pixeln eine Grauwertverschiebung erfahren hat. Bei Überschreiten einer bestimmten Zahl aller verschobener Intensitäten, kann eine ausreichende Benetzung des Nachweisbereiches festgestellt werden.With the help of the frequency distribution, it can also be determined whether sufficient wetting of the detection area has taken place. For this purpose, it is determined whether a sufficient number of pixels has undergone a gray value shift. If a certain number of all shifted intensities is exceeded, sufficient wetting of the detection area can be determined.
Des Weiteren kann der Reaktionsendpunkt bestimmt werden, indem nach Aufgabe der Probe die Änderung der Häufigkeitsverteilung mit der Zeit ermittelt wird. Wenn sich die Häufigkeitsverteilung über einen bestimmten Zeitraum nur noch innerhalb eines bestimmten Bereiches verändert kann davon ausgegangen werden, dass die Reaktion abgeschlossen ist. Dieses Zeitintervall kann im Bereich von Minuten liegen, liegt in einer bevorzugten Ausführungsform jedoch innerhalb von 1-10 Sekunden. Das Intervall, in dem sich die Häufigkeitsverteilung hierbei noch verändern darf, liegt bei wenigen Prozent und sollte 5 % nicht übersteigen.Furthermore, the end point of the reaction can be determined by determining the change in the frequency distribution over time after the sample has been applied. If the frequency distribution only changes within a certain range over a certain period of time, it can be assumed that the reaction is complete. This time interval can be in the range of minutes, but in a preferred embodiment is within 1-10 seconds. The interval in which the frequency distribution may still change is a few percent and should not exceed 5%.
Eine alternative Möglichkeit die Analytkonzentration zu bestimmen, ist die zeitliche Verfolgung der Häufigkeitsverteilung von Intensitäten bzw. Grauwerten nach Benetzung des Nachweisbereiches. Hierzu können multivariate Auswerteverfahren herangezogen werden, wie sie im Stand der Technik bekannt sind. Beispielsweise ist eine Auswertung der Histogramme zu verschiedenen Zeitpunkten der ablaufenden Reaktion mit Hilfe der "Partial Least Square" (PLS) Methode oder der "
Die Häufigkeitsverteilung von Intensitäten kann weiterhin zur Qualitätskontrolle eingesetzt werden. Je nach Größe der Blutmenge und Verteilung des Analyten auf dem Nachweisbereich, können Randeffekte in Form eines Randbereiches eine entscheidende Rolle spielen und das Messergebnis beeinträchtigen. Von einem Randbereich kann vor allem dann gesprochen werden, wenn der Nachweisbereich nicht vollständig benetzt ist. Im Histogramm zeigt sich der Randbereich zwischen den Intensitätsanhäufungen um das Häufigkeitsmaximum des unbenetzten und des benetzten Teils des Nachweisbereiches. Da der Randbereich durch inhomogene Verteilung der Probe auf dem Nachweisbereich charakterisiert ist, kann er je nach Analytkonzentration in der Probe ein unterschiedlich breites Intervall von Grauwerten umfassen. Trotz einer weitgehend homogenen Verteilung der Probe in der Fleckmitte findet man eine veränderte Probenverteilung in den Randbereichen. In diesen Randbereichen kann ein veränderter Analytaustausch zwischen Bluttropfen und Reagenzienschicht stattfinden. Da es sich meist um eine Störung des Analytaustausches handelt, findet eine geringere Umsetzung des Analyten statt. In einer bevorzugten Ausführungsform bedeutet die geringere Umsetzung von Analyt eine höhere detektierte Intensität der im Randbereich. Diese Änderung ist von vielen Faktoren abhängig, unter anderem von der Viskosität sowie von der Konzentrationsverteilung verschiedener Blutparameter wie z. B. Glucose und Hämatokrit in der Probe. Eine andere Ursache für Inhomogenitäten ist die Beschaffenheit des Testelementes im Nachweisbereich. Auch diese Inhomogenitäten können zu verändertem Austausch von Analyt mit den Reagenzien führen. Insbesondere bei der Analyse kleiner Volumina, bei denen das Rand/Fläche-Verhältnis zu Gunsten der Ränder stark anwächst, führt eine einfache Mittelung über den Probenfleck zu stark verfälschten Messergebnissen. Eine Mittelung über alle inhomogen und homogen benetzten Teilbereiche könnte bei sehr kleinen Probenmengen zu unzureichender Genauigkeit der Messergebnisse führen. Bei sehr kleinen Probevolumina kann der Randbereich des Tropfens in seiner Ausdehnung ähnlich groß sein wie der homogene Kernbereich des Tropfens. Dies kann dazu führen, dass kein Grauwert der benetzten Teilbereiche einen unteren Häufigkeits-Schwellenwert überschreitet. Ist dies der Fall, kann ein zusätzlicher Algorithmus angewendet werden, der die Häufigkeiten des Randbereiches mit berücksichtigt.The frequency distribution of intensities can also be used for quality control. Depending on the size of the blood volume and the distribution of the analyte on the detection area, edge effects in the form of an edge area can play a decisive role and impair the measurement result. One can speak of an edge area in particular when the detection area is not completely wetted. The edge area between the intensity accumulations around the frequency maximum of the unwetted and the wetted part of the detection area can be seen in the histogram. Since the edge area is characterized by the inhomogeneous distribution of the sample on the detection area, it can include a different range of gray values depending on the analyte concentration in the sample. Despite a largely homogeneous distribution of the sample in the middle of the spot, a different sample distribution can be found in the edge areas. In these edge areas, an altered analyte exchange can take place between the blood drop and the reagent layer. Since it is usually a question of a disruption in the analyte exchange, there is less conversion of the analyte. In a preferred embodiment, the lower conversion of analyte means a higher intensity detected in the edge area. This change depends on many factors, including viscosity and the concentration distribution of various blood parameters such as e.g. B. Glucose and hematocrit in the sample. Another cause of inhomogeneities is the texture of the test element in the detection area. These inhomogeneities can also lead to altered exchange of analyte with the reagents. Especially when analyzing small volumes, where the edge/area ratio increases significantly in favor of the edges, a simple averaging over the sample spot leads to highly falsified measurement results. Averaging over all inhomogeneously and homogeneously wetted sub-areas could lead to insufficient accuracy of the measurement results in the case of very small sample quantities. In the case of very small sample volumes, the extent of the edge area of the drop can be similar to that of the homogeneous core area of the drop. This can result in no gray value of the wetted partial areas exceeding a lower frequency threshold value. If this is the case, an additional algorithm can be applied that also takes into account the frequency of the edge area.
Je nachdem, ob der Nachweisbereich von der Seite vermessen wird, auf der das Blut appliziert wird, oder von der gegenüberliegenden Seite, kann das Reflektionsverhalten unterschiedlich sein. So konnte festgestellt werden, dass besonders in den Randbereichen, die beschriebene inhomogene Verteilung der Probe, zu unterschiedlichen Anreicherungen verschiedener Bestandteile in verschiedenen Bereichen des Nachweisbereiches führt. In einer bevorzugten Ausführungsform werden beispielsweise Testelemente benutzt, die einen Nachweisbereich aufweisen, der mehrere Schichten enthält. Eine der Schichten ist dazu ausgelegt, dass große Bestandteile der Probe, wie beispielsweise rote Blutkörperchen in einer Blutprobe am weiteren Eindringen gehindert werden. Von dieser Schicht wird das Licht im Randbereich anders reflektiert als von der gegenüberliegenden Seite des Nachweisbereiches. In einer bevorzugten Ausführungsform wird der Nachweisbereich von der, der Blutaufgabe gegenüberliegenden Seite, vermessen. Im Gegensatz dazu wird bei der Transmissionsmessung auf der Blutaufgabeseite detektiert.Depending on whether the detection area is measured from the side on which the blood is applied or from the opposite side, the reflection behavior can differ. It was thus possible to determine that, particularly in the edge areas, the inhomogeneous distribution of the sample described leads to different accumulations of different components in different areas of the detection area. In a preferred embodiment, for example, test elements are used that have a detection area that contains a number of layers. One of the layers is designed to prevent large sample components, such as red blood cells in a blood sample, from further penetration. The light is reflected differently from this layer in the edge area than from the opposite side of the detection area. In a preferred embodiment, the detection area is measured from the side opposite the blood sample. In contrast to this, the transmission measurement detects on the blood application side.
Um eine optimale Auswertung eines Nachweisbereiches eines Testelementes durchzuführen, ist es möglich eine Qualitätskontrolle vor der Benutzung des Testelementes durchzuführen. Hierzu wird das Testelement vor Benetzung mit Hilfe der Detektionseinheit ortsaufgelöst vermessen. Anhand der Häufigkeitsverteilung der gemessenen Intensitäten der verschiedenen Teilbereiche kann untersucht werden, ob das Testelement eine ausreichende Homogenität aufweist und das Testelement zur Benutzung geeignet ist. Hierzu können verschiedene Qualitätskriterien herangezogen werden. Ein Qualitätskriterium ist die Anzahl von Intensitäten innerhalb eines vorgegebenen Intensitätsintervalls. Der Häufigkeitsanteil der Intensitäten, die innerhalb des vorgegebenen Intervalls liegen, muss einen Intervall-Schwellenwert überschreiten, damit das Testelement zur Benutzung freigegeben werden kann. Wenn beispielsweise weniger als 90 % der gemessenen Intensitäten in diesem Intervall vorzufinden sind, dann kann das Testelement von der Benutzung ausgeschlossen werden, da zu befürchten ist, dass die Messergebnisse durch Unregelmäßigkeiten des Nachweisbereiches gestört werden. Hierbei hängt die breite des Intensitätsintervalls von den Eigenschaften des Nachweisbereiches ab. Die Untauglichkeit des Testelementes kann dabei von dem System durch ein Warnsignal, wie z.B. ein akustisches oder optisches Signal dem Patienten angezeigt werden.In order to carry out an optimal evaluation of a detection area of a test element, it is possible to carry out a quality control before using the test element. For this purpose, the test element is measured in a spatially resolved manner using the detection unit before it is wetted. Based on the frequency distribution of the measured intensities of the different partial areas, it can be examined whether the test element has sufficient homogeneity and whether the test element is suitable for use. Various quality criteria can be used for this. A quality criterion is the number of intensities within a given intensity interval. The frequency proportion of the intensities that lie within the specified interval must exceed an interval threshold value so that the test element can be released for use. For example, if less than 90% of the measured intensities are found in this interval, then the test element can be excluded from use, as there is a risk that the measurement results will be disturbed by irregularities in the detection area. Here, the width of the intensity interval depends on the properties of the detection area. The unsuitability of the test element can be indicated to the patient by the system through a warning signal, such as an acoustic or optical signal.
Eine zweite Möglichkeit die Qualität des Nachweißbereiches zu überprüfen ist, alternativ oder zusätzlich die Intensität -beziehungsweise den Grauwert- der zu der mittleren oder maximalen Häufigkeit gehört, mit einem Qualitäts-Schwellenwert zu vergleichen. Liegt der Grauwert, der der mittleren bzw. maximalen Häufigkeit entspricht unterhalb des Qualitäts-Schwellenwertes, so ist davon auszugehen, dass das Testelement im Nachweisbereich verschmutzt ist und sollte aus diesem Grund nicht zur Benutzung herangezogen werden.A second option for checking the quality of the detection area is to alternatively or additionally compare the intensity—or the gray value—that belongs to the mean or maximum frequency with a quality threshold value. If the gray value that corresponds to the average or maximum frequency is below the quality threshold value, it can be assumed that the test element is dirty in the detection area and should therefore not be used.
Eine weitere Möglichkeit der Qualitätskontrolle ist der Vergleich der maximalen Häufigkeit mit einem Referenz-Schwellenwert. Wenn dieser Referenz-Schwellenwert nicht überschritten wird, ist davon auszugehen, dass aufgrund von Verschmutzung zu viele Pixel einen veränderten Grauwert aufweisen und nach Benetzung die Messung verfälschen könnten.Another quality control option is to compare the maximum frequency with a reference threshold. If this reference threshold value is not exceeded, it can be assumed that too many pixels have a changed gray value due to dirt and could falsify the measurement after wetting.
- Figur 1a:Figure 1a:
- Schematische Darstellung eines Systems zur Beleuchtung eines Testelements inklusive einer Detektionseinheit zur Detektion der reflektierten Strahlung sowie einer AuswerteeinheitSchematic representation of a system for illuminating a test element including a detection unit for detecting the reflected radiation and an evaluation unit
- Figur 1b:Figure 1b:
- Schematische Darstellung eines Systems zur Beleuchtung eines Testelements inklusive einer Detektionseinheit zur Detektion der transmittierten Strahlung sowie einer AuswerteeinheitSchematic representation of a system for illuminating a test element including a detection unit for detecting the transmitted radiation and an evaluation unit
- Figur 1c:Figure 1c:
- Schematische Darstellung eines Systems zur ortsaufgelösten Beleuchtung eines Testelements inklusive einer Detektionseinheit zur Detektion reflektierter Strahlung sowie einer AuswerteeinheitSchematic representation of a system for spatially resolved illumination of a test element including a detection unit for detecting reflected radiation and an evaluation unit
- Figur 2a:Figure 2a:
- Grauwertverteilung eines unbenetzten TeststreifensGray value distribution of an unwetted test strip
- Figur 2b:Figure 2b:
- Grauwertverteilung nach Benetzung eines Teils des NachweisbereichesGray value distribution after wetting part of the detection area
- Figur 3:Figure 3:
- Darstellung einer Referenzkurve zur Ermittlung von Analytkonzentrationen in unbekannten ProbenDisplay of a reference curve for determining analyte concentrations in unknown samples
- Figur 4a:Figure 4a:
- Darstellung eines Tropfens auf einem NachweisbereichDepiction of a drop on a detection area
- Figur 4b:Figure 4b:
- Darstellung der Intensitätsverteilung (umgerechnet in Grauwerte) des Tropfens aus 4a in einem HistogrammRepresentation of the intensity distribution (converted into gray values) of the drop from 4a in a histogram
- Figur 4c:Figure 4c:
- Darstellung der dunkelsten Punkte auf dem Nachweisbereich in einem HistogrammDisplay of the darkest points on the detection area in a histogram
- Figur 4d:Figure 4d:
- Darstellung der am häufigsten vertretenen Grauwerte im benetzten Bereich in einem HistogrammDisplay of the most frequently represented gray values in the wetted area in a histogram
- Figur 4e:Figure 4e:
- Darstellung des Randbereiches des aufgegebenen Tropfens in einem HistogrammDisplay of the edge area of the dropped drop in a histogram
- Figur 4f:Figure 4f:
- Darstellung des unbenetzten Bereiches auf dem Nachweisbereich in einem Histogramm.Display of the unwetted area on the detection area in a histogram.
- Figur 5:Figure 5:
- Darstellung eines Zeitverlaufes der Grauverteilung bei Benetzung eines Teiles des NachweisbereichesRepresentation of a time course of the gray distribution when a part of the detection area is wetted
In Figur la ist ein System dargestellt, das ein Testelement (1) mit einem Nachweisbereich (2) enthält, welches von einer Lichtquelle (3) bestrahlt wird. Zwischen der Lichtquelle (3) und dem Testelement (1) können abbildende Einheiten angebracht sein, wie beispielsweise Linsen und/oder Blenden. In diesem Beispiel sind sowohl eine Blende (4) wie auch eine Linse (5) zwischen Lichtquelle und Nachweisbereich (2) des Testelementes (1) angeordnet, um den Nachweisbereich (2) möglichst homogen auszuleuchten. Das von dem Nachweisbereich (2) abgestrahlte Licht wird von einem Detektor (6) aufgefangen. Dieser Detektor (6) sollte mindestens 10 Pixel (17) beinhalten, um den Nachweisbereich (2) ortsaufgelöst detektieren zu können. In einer Auswerteeinheit (7), die mit dem Detektor (6) verbunden ist, werden die Signale des Detektors (6) ausgewertet. Eine bevorzugte Ausführungsform des Detektors ist ein CMOS-Detektor, der mindestens einen A/D-Wandler beinhaltet, um die analogen elektrischen Signale in digitale Signale umzuwandeln. Diese digitalen Signale können an die Auswerteeinheit (7) weitergeleitet werden, um dort den verschiedenen Auswertungen unterzogen zu werden. Die berechneten Messwerte können über eine Anzeigeeinheit (7b), die an die Auswerteeinheit angeschlossen oder in diese integriert ist angezeigt werden. In einer bevorzugten Ausführungsform wird ein Detektor (6) verwendet der einen Wandler in einem Bereich von 8 bis 12 bit aufweist. Der Messbereich wird mit Hilfe des Detektors (6) zwischen seinem Null-Wert und seinem Maximalwert in 256 Grauwerte unterteilt. Die Auswerteeinheit (7) ist dazu ausgelegt, die Häufigkeiten der 256 Grauwerte zu zählen. Diese Häufigkeiten können in einem Histogramm (10) gegenüber den Intensitätsintervallen, die man auch als Grauwerte (11) bezeichnet, aufgetragen werden. Jedes Intensitätsintervall wird hierbei einem Grauwert zugeteilt.A system is shown in FIG. 1a which contains a test element (1) with a detection area (2) which is irradiated by a light source (3). Imaging units, such as lenses and/or diaphragms, can be fitted between the light source (3) and the test element (1). In this example, both a screen (4) and a lens (5) are arranged between the light source and the detection area (2) of the test element (1) in order to illuminate the detection area (2) as homogeneously as possible. The light emitted by the detection area (2) is caught by a detector (6). This detector (6) should contain at least 10 pixels (17) in order to be able to detect the detection area (2) in a spatially resolved manner. The signals from the detector (6) are evaluated in an evaluation unit (7) which is connected to the detector (6). A preferred embodiment of the detector is a CMOS detector that includes at least one A/D converter to convert the analog electrical signals into digital signals. These digital signals can be forwarded to the evaluation unit (7) in order to be subjected to the various evaluations there. The calculated measured values can be displayed via a display unit (7b) which is connected to the evaluation unit or is integrated into it. In a preferred embodiment, a detector (6) is used which has a converter in a range from 8 to 12 bits. The measuring range is determined with the help of the detector (6) divided into 256 gray values between its zero value and its maximum value. The evaluation unit (7) is designed to count the frequencies of the 256 gray values. These frequencies can be plotted against the intensity intervals, which are also referred to as gray values (11), in a histogram (10). Each intensity interval is assigned a gray value.
In
Figur lc stellt ein System zur ortsaufgelösten Beleuchtung des Nachweisbereiches (2) dar. Bei dieser Anordnung wird eine Lichtquelle (3) benutzt, die nur einen Teilbereich des Nachweisbereiches (2) ausleuchtet. Wenn nur eine Lichtquelle (3) benutzt wird, so wird das Licht über einen Reflektor (hier nicht dargestellt) auf verschiedene Teilbereiche des Nachweisbereiches (2) fokussiert. In dem hier abgebildeten System werden verschiedene Lichtquellen (3), die, wie hier dargestellt, in einem Array (3a) angeordnet sind, auf den Nachweisbereich (2) gerichtet. Auf diese Weise können sequentiell oder gleichzeitig mindestens ein Teilbereich des Nachweisbereiches (2) ausgeleuchtet werden. Wenn der Nachweisbereich (2) sequentiell ausgeleuchtet wird, was man auch als abrastern bezeichnet, so kann eine einzelne Photodiode als Detektor (6) benutzt werden. Wenn jedoch der Nachweisbereich (2) gleichzeitig durch mehr als eine Lichtquelle (3) des Array's (1a) ausgeleuchtet wird, dann wird für eine ortsaufgelöste Messung ein ortsauflösender Detektor (6) benötigt. Auch hier ist der Detektor (6) mit einer Auswerteeinheit (7) verbunden, die die Messsignale des Detektors (6) zur weiteren Auswertung erhält. Eine Anzeigeeinheit (7b) ist mit der Auswerteeinheit (7) verbunden oder in diese integriert.FIG. 1c shows a system for spatially resolved illumination of the detection area (2). In this arrangement, a light source (3) is used, which illuminates only a portion of the detection area (2). If only one light source (3) is used, the light is focused on different sub-areas of the detection area (2) via a reflector (not shown here). In the system shown here, various light sources (3), which are arranged in an array (3a), as shown here, are directed onto the detection area (2). In this way, at least a partial area of the detection area (2) can be illuminated sequentially or simultaneously. If the detection area (2) is illuminated sequentially, which is also referred to as scanning, a single photodiode can be used as a detector (6). However, if the detection area (2) is simultaneously illuminated by more than one light source (3) of the array (1a), then a spatially resolved detector (6) is required for a spatially resolved measurement. Here, too, the detector (6) is connected to an evaluation unit (7) which receives the measurement signals from the detector (6) for further evaluation. A display unit (7b) is connected to the evaluation unit (7) or integrated into it.
Alle weiteren Messungen, die in den
In
In
Zur Berechnung einer unbekannten Probe, wird der Δ GW Wert in der Auswerteeinheit (7) mit Hilfe der vom Detektor (6) gemessenen Intensitäten des benetzten Nachweisbereiches (2) ermittelt. Dies wird mit dem gleichen Verfahren wie zur Ermittlung der Referenzkurve (15) durchgeführt. Da die Referenzkurve (15) in der Auswerteeinheit (7) gespeichert ist, kann die Analytkonzentration dort sofort abgelesen werden.To calculate an unknown sample, the Δ GW value is determined in the evaluation unit (7) using the intensities of the wetted detection area (2) measured by the detector (6). This is done using the same procedure as for determining the reference curve (15). Since the reference curve (15) is stored in the evaluation unit (7), the analyte concentration can be read off there immediately.
In den
Claims (20)
- A system for determining the concentration of an analyte in a liquid sample containing- a detection unit (6) for the detection of light intensities (11) emitted from subareas of an detection area (2) of a test element (1) and- an evaluation unit (7) suitable for establishing a frequency distribution (9) for the detected light intensities (11), wherein the frequency distribution (9) has at least one first maximum (13) caused by at least one unwetted subarea (14a) or at least one reference area, and a second maximum (13a) caused by wetted subareas (14b) and is suitable for identifying wetted areas (14b) of the test element (1) due to frequencies and distinguishing them from unwetted areas (14a) and selecting at least one light intensity of the wetted area on the basis of the frequency distribution (9) and establishing the concentration of the analyte from the at least one selected light intensity.
- The system according to claim 1,characterized in that the concentration of the analyte is determined based on intensity frequencies after application of the sample to the detection area (2) or before and after application of the sample to the detection area (2).
- The system according to claim 1 or 2,characterized in that the test element (1) contains a reagent that is substantially homogenously distributed in or on the detection area (2).
- The system according to claim 1, 2 or 3,characterized in that a sample volume of between 0.1 and 500 nL is used.
- The system according to any one of claims 1 to 4,characterized in that the concentration of the analyte is determined based on rates of changes of the frequencies of the emitted light intensities (11) after wetting the detection area (2).
- The system according to any one of claims 1 to 5,characterized in that the concentration of the analyte is determined based on maximum values of the frequency distribution of the intensities (11) before and after wetting the detection area (2).
- The system according to any one of claims 1 to 6,characterized in that the evaluation is performed by means of multivariate analytical methods.
- The system according to any one of claims 1 to 7,characterized in that the slope of the course of the intensities between the lowest intensity and the most frequent intensity is used to determine the analyte concentration.
- The system according to any one of claims 1 to 8,characterized in that the concentration of the analyte is determined based on intensities (11) exceeding a frequency threshold value.
- The system according to any one of claims 1 to 9,characterized in that a quality control takes place based on the form of frequency distributions before and/or after wetting.
- The system according to any one of claims 1 to 10,characterized in that sufficient wetting of the detection area (2) is observed based on exceeding a certain frequency of the intensities (11) that change after application of a sample.
- The system according to claim 10,characterized in that sufficient homogeneity of the detection area (2) is deduced based on the frequency distribution before wetting of the detection area (2).
- The system according to any one of claims 1 to 11,characterized in that an evaluation of the detection area (2) is performed if the rate of change of the frequencies after application of the sample to the detection area (2) is below a rate threshold value.
- A method for the determination of the concentration of an analyte in a liquid having the steps ofapplying a liquid to an detection area (2) of a test element (1);detecting light intensities (11) of the light emitted from subareas;establishing a frequency distribution (9) of the detected light intensities (11), wherein the frequency distribution (9) has at least one first maximum (13) caused by at least one unwetted subarea (14a) or at least one reference area and a second maximum (13a) caused by wetted subareas (14b),identifying and distinguishing the wetted areas (14b) from unwetted areas (14a);calculating the concentration of the analyte based on at least one light intensity of the wetted area (14b) that was selected due to its frequency.
- The method according to claim 14,characterized in that a frequency distribution of the light intensities is determined before the liquid is applied to the detection area (2).
- The method according to claim 15,characterized in that a quality control is performed based on the frequency distribution.
- The method according to claim 16,characterized in that a proportion of frequencies that are within a certain intensity interval is determined.
- The method according to claim 16,characterized in that the test element (1) is not used if the proportion of the frequencies within the interval does not exceed an interval threshold value.
- The system according to claim 1,characterized in that the evaluation unit (7) is integrated on a chip.
- The system according to claim 19,characterized in that the detection unit (6) contains a CMOS detector integrated together with at least one analogue-digital converter on the chip.
Priority Applications (13)
| Application Number | Priority Date | Filing Date | Title |
|---|---|---|---|
| PL06007461.4TPL1843148T3 (en) | 2006-04-08 | 2006-04-08 | Analysis of optical data using histograms |
| EP10008491.2AEP2244086B1 (en) | 2006-04-08 | 2006-04-08 | Analysis of optical data using histograms |
| ES10008491TES2883201T3 (en) | 2006-04-08 | 2006-04-08 | Optical data analysis with the help of histograms |
| PL10008491TPL2244086T3 (en) | 2006-04-08 | 2006-04-08 | Analysis of optical data using histograms |
| ES06007461TES2929039T3 (en) | 2006-04-08 | 2006-04-08 | Analysis of optical data with the help of histograms |
| EP06007461.4AEP1843148B1 (en) | 2006-04-08 | 2006-04-08 | Analysis of optical data using histograms |
| CA2771025ACA2771025C (en) | 2006-04-08 | 2007-04-03 | System and method for determining the concentration of an analyte in a liquid sample |
| CN200780012727XACN101421608B (en) | 2006-04-08 | 2007-04-03 | Analysis of optical data using histograms |
| CA2648147ACA2648147C (en) | 2006-04-08 | 2007-04-03 | System and method for determining the concentration of an analyte in a liquid sample |
| HK09109598.8AHK1131431B (en) | 2006-04-08 | 2007-04-03 | Analysis of optical data with the aid of histograms |
| PCT/EP2007/002968WO2007115732A1 (en) | 2006-04-08 | 2007-04-03 | Analysis of optical data with the aid of histograms |
| JP2009503474AJP5159760B2 (en) | 2006-04-08 | 2007-04-03 | Analysis of optical data using histograms. |
| US12/247,393US7889329B2 (en) | 2006-04-08 | 2008-10-08 | Analysis of optical data with the aid of histograms |
Applications Claiming Priority (1)
| Application Number | Priority Date | Filing Date | Title |
|---|---|---|---|
| EP06007461.4AEP1843148B1 (en) | 2006-04-08 | 2006-04-08 | Analysis of optical data using histograms |
Related Child Applications (2)
| Application Number | Title | Priority Date | Filing Date |
|---|---|---|---|
| EP10008491.2ADivision-IntoEP2244086B1 (en) | 2006-04-08 | 2006-04-08 | Analysis of optical data using histograms |
| EP10008491.2ADivisionEP2244086B1 (en) | 2006-04-08 | 2006-04-08 | Analysis of optical data using histograms |
Publications (2)
| Publication Number | Publication Date |
|---|---|
| EP1843148A1 EP1843148A1 (en) | 2007-10-10 |
| EP1843148B1true EP1843148B1 (en) | 2022-08-31 |
Family
ID=36928299
Family Applications (2)
| Application Number | Title | Priority Date | Filing Date |
|---|---|---|---|
| EP10008491.2AActiveEP2244086B1 (en) | 2006-04-08 | 2006-04-08 | Analysis of optical data using histograms |
| EP06007461.4AActiveEP1843148B1 (en) | 2006-04-08 | 2006-04-08 | Analysis of optical data using histograms |
Family Applications Before (1)
| Application Number | Title | Priority Date | Filing Date |
|---|---|---|---|
| EP10008491.2AActiveEP2244086B1 (en) | 2006-04-08 | 2006-04-08 | Analysis of optical data using histograms |
Country Status (8)
| Country | Link |
|---|---|
| US (1) | US7889329B2 (en) |
| EP (2) | EP2244086B1 (en) |
| JP (1) | JP5159760B2 (en) |
| CN (1) | CN101421608B (en) |
| CA (2) | CA2648147C (en) |
| ES (2) | ES2883201T3 (en) |
| PL (2) | PL2244086T3 (en) |
| WO (1) | WO2007115732A1 (en) |
Families Citing this family (20)
| Publication number | Priority date | Publication date | Assignee | Title |
|---|---|---|---|---|
| US8401290B2 (en)* | 2008-07-24 | 2013-03-19 | Libredigital, Inc. | Method and system for processing to enhance digital images |
| EP2151686A1 (en) | 2008-08-04 | 2010-02-10 | Roche Diagnostics GmbH | Analysis system with encryption detection |
| ES2408965T3 (en) | 2008-08-04 | 2013-06-24 | F. Hoffmann-La Roche Ag | Coding procedure to encode medical articles |
| TWI384427B (en)* | 2009-04-29 | 2013-02-01 | Utechzone Co Ltd | Background establishment method and device |
| EP2306178A1 (en)* | 2009-09-30 | 2011-04-06 | Roche Diagnostics GmbH | Method for controlling a photometric measuring unit of a measuring device for generating and examining a body liquid sample and measuring system |
| US20110245637A1 (en)* | 2010-03-31 | 2011-10-06 | Nellcor Puritan Bennett Llc | Ambient light use in physiological sensors |
| CN102985810B (en) | 2010-07-20 | 2016-04-27 | 霍夫曼-拉罗奇有限公司 | Devices for identifying analytes in body fluids |
| US8409866B2 (en)* | 2010-10-21 | 2013-04-02 | Nokia Corporation | Apparatus and associated methods |
| GB201120862D0 (en)* | 2011-12-05 | 2012-01-18 | Airbus Operations Ltd | A wingtip fin of an aircraft |
| CN104024834A (en)* | 2011-12-28 | 2014-09-03 | 拜尔保健公司 | Analyte monitor |
| CA2872215C (en) | 2012-06-22 | 2018-03-13 | F. Hoffmann-La Roche Ag | Method and device for detecting an analyte in a body fluid |
| WO2014015420A1 (en)* | 2012-07-24 | 2014-01-30 | Fio Corporation | Immunoassay rapid diagnostic test universal analysis device, system, method and computer readable medium |
| WO2014180939A1 (en) | 2013-05-08 | 2014-11-13 | Roche Diagnostics Gmbh | Stabilization of enzymes by nicotinic acid |
| CN108463708B (en)* | 2015-11-06 | 2021-10-08 | 密歇根大学董事会 | Droplet-based microfluidic rheometer system |
| CN106996916B (en)* | 2016-01-25 | 2020-05-01 | 苑高强 | A method for identifying substances |
| CN107037206B (en)* | 2017-03-31 | 2019-03-05 | 深圳市在田翊方科技有限公司 | A kind of time-resolved fluoroimmunoassay chromatography |
| EP3477270B1 (en)* | 2017-10-25 | 2021-07-28 | Roche Diabetes Care GmbH | Methods and devices for performing an analytical measurement based on a color formation reaction |
| ES3036495T3 (en) | 2018-02-19 | 2025-09-19 | Hoffmann La Roche | Method and devices for performing an analytical measurement |
| US11668652B2 (en)* | 2019-01-14 | 2023-06-06 | Uvic Industry Partnerships Inc. | Optical fiber-based sensor for determining the concentration of fluoride in water |
| CN115115852B (en)* | 2022-06-02 | 2025-07-18 | 中海石油(中国)有限公司天津分公司 | Ground crude oil viscosity prediction method based on wall heart fluorescence image gray value |
Citations (1)
| Publication number | Priority date | Publication date | Assignee | Title |
|---|---|---|---|---|
| US20050115873A1 (en)* | 2003-12-02 | 2005-06-02 | De Villers Pierre | Method and apparatus for non-contact and rapid determination of liquid content |
Family Cites Families (39)
| Publication number | Priority date | Publication date | Assignee | Title |
|---|---|---|---|---|
| US4097845A (en)* | 1976-11-01 | 1978-06-27 | Rush-Presbyterian-St. Luke's Medical Center | Method of and an apparatus for automatic classification of red blood cells |
| US4453266A (en)* | 1980-04-21 | 1984-06-05 | Rush-Presbyterian-St. Luke's Medical Center | Method and apparatus for measuring mean cell volume of red blood cells |
| JPS60100032A (en)* | 1983-11-04 | 1985-06-03 | Nireko:Kk | Automatic quantitative measurement method for microscopic images of sintered ore, etc. |
| US4873633A (en)* | 1985-10-18 | 1989-10-10 | Cetus Corporation | User controlled off-center light absorbance reading adjuster in a liquid handling and reaction system |
| JPS62134559A (en)* | 1985-12-07 | 1987-06-17 | Japan Spectroscopic Co | Method and apparatus for automatic analysis of blood cell |
| AU597485B2 (en)* | 1987-04-22 | 1990-05-31 | John Lysaght (Australia) Limited | Non-contact determination of the position of a rectilinear feature of an article |
| US5030554A (en)* | 1987-12-04 | 1991-07-09 | Coulter Corporation | Conservative whole blood sample preparation technique |
| DE4012216A1 (en) | 1990-04-14 | 1991-10-17 | Boehringer Mannheim Gmbh | TEST CARRIER FOR THE ANALYSIS OF LIQUIDS |
| EP0572571B1 (en)* | 1991-02-27 | 2003-12-03 | Roche Diagnostics Corporation | Apparatus and method for analyzing body fluids |
| DE4132743A1 (en) | 1991-10-02 | 1993-04-08 | Boehringer Mannheim Gmbh | TEST CARRIER FOR THE ANALYSIS OF LIQUIDS |
| JP2575270B2 (en)* | 1992-11-10 | 1997-01-22 | 浜松ホトニクス株式会社 | Method for determining base sequence of nucleic acid, method for detecting single molecule, apparatus therefor and method for preparing sample |
| TW239881B (en)* | 1992-12-22 | 1995-02-01 | Sienna Biotech Inc | |
| US5396260A (en)* | 1992-12-22 | 1995-03-07 | The Center For Innovative Technology | Video instrumentation for the analysis of mineral content in ores and coal |
| WO1994019767A1 (en) | 1993-02-26 | 1994-09-01 | E-Y Laboratories, Inc. | Optical specimen analysis system and method |
| US5408535A (en)* | 1993-09-07 | 1995-04-18 | Miles Inc. | Video test strip reader and method for evaluating test strips |
| FR2713779B1 (en)* | 1993-12-10 | 1996-03-08 | Lorraine Laminage | Automatic process of maceral analysis and determination of the reflecting power of vitrinite in coals. |
| JP3562847B2 (en)* | 1994-11-15 | 2004-09-08 | 謙 石原 | Hemoglobin concentration measuring device |
| JP2707426B2 (en)* | 1995-03-31 | 1998-01-28 | 名古屋電機工業株式会社 | Road surface condition detection device |
| US5691204A (en)* | 1995-04-21 | 1997-11-25 | Abbott Laboratories | Compositions and methods for the rapid analysis of reticulocytes |
| JPH08299310A (en)* | 1995-05-02 | 1996-11-19 | Toa Medical Electronics Co Ltd | Non-invasive blood analysis device and method therefor |
| DE19611347A1 (en) | 1996-03-22 | 1997-09-25 | Boehringer Mannheim Gmbh | System for the quantitative, spatially resolved evaluation of test elements |
| FI111217B (en) | 1997-06-19 | 2003-06-30 | Nokia Corp | Device for sampling |
| DE19753847A1 (en) | 1997-12-04 | 1999-06-10 | Roche Diagnostics Gmbh | Analytical test element with capillary channel |
| US20030153023A1 (en) | 1999-05-13 | 2003-08-14 | Starzl Timothy W. | Enumeration method of analyte detection |
| CA2331897C (en)* | 1998-05-14 | 2008-11-18 | Luminex Corporation | Multi-analyte diagnostic system and computer implemented process for same |
| WO2000078998A1 (en)* | 1999-06-18 | 2000-12-28 | Polymer Technology Systems, Inc. | Apparatus and method for determining substances contained in a body fluid |
| WO2001079529A1 (en)* | 2000-04-17 | 2001-10-25 | Purdue Research Foundation | Biosensor and related method |
| US7756305B2 (en)* | 2002-01-23 | 2010-07-13 | The Regents Of The University Of California | Fast 3D cytometry for information in tissue engineering |
| JP2003287532A (en)* | 2002-03-28 | 2003-10-10 | Fuji Photo Film Co Ltd | Blood test unit |
| US6847451B2 (en)* | 2002-05-01 | 2005-01-25 | Lifescan, Inc. | Apparatuses and methods for analyte concentration determination |
| JP2004144672A (en)* | 2002-10-25 | 2004-05-20 | Advance Co Ltd | Component analyzing method and component analyzer based on color development information |
| US8574895B2 (en)* | 2002-12-30 | 2013-11-05 | Sanofi-Aventis Deutschland Gmbh | Method and apparatus using optical techniques to measure analyte levels |
| US7522762B2 (en)* | 2003-04-16 | 2009-04-21 | Inverness Medical-Biostar, Inc. | Detection, resolution, and identification of arrayed elements |
| JP2004325358A (en)* | 2003-04-25 | 2004-11-18 | Nakayama:Kk | Apparatus and method for measuring cast iron component ratio |
| EP1624412B1 (en)* | 2003-05-15 | 2008-12-17 | Fujitsu Limited | Biological information measuring device |
| US7239394B2 (en)* | 2003-06-04 | 2007-07-03 | Inverness Medical Switzerland Gmbh | Early determination of assay results |
| EP1743172A2 (en)* | 2004-04-16 | 2007-01-17 | University of Massachusetts | Detection and quantification of intracellular pathogens |
| US7887750B2 (en)* | 2004-05-05 | 2011-02-15 | Bayer Healthcare Llc | Analytical systems, devices, and cartridges therefor |
| EP1843147A1 (en)* | 2006-04-08 | 2007-10-10 | Roche Diagnostics GmbH | Spatially resolved analysis of optical data of a test element |
- 2006
- 2006-04-08ESES10008491Tpatent/ES2883201T3/enactiveActive
- 2006-04-08ESES06007461Tpatent/ES2929039T3/enactiveActive
- 2006-04-08PLPL10008491Tpatent/PL2244086T3/enunknown
- 2006-04-08PLPL06007461.4Tpatent/PL1843148T3/enunknown
- 2006-04-08EPEP10008491.2Apatent/EP2244086B1/enactiveActive
- 2006-04-08EPEP06007461.4Apatent/EP1843148B1/enactiveActive
- 2007
- 2007-04-03WOPCT/EP2007/002968patent/WO2007115732A1/enactiveApplication Filing
- 2007-04-03CACA2648147Apatent/CA2648147C/enactiveActive
- 2007-04-03JPJP2009503474Apatent/JP5159760B2/enactiveActive
- 2007-04-03CACA2771025Apatent/CA2771025C/enactiveActive
- 2007-04-03CNCN200780012727XApatent/CN101421608B/enactiveActive
- 2008
- 2008-10-08USUS12/247,393patent/US7889329B2/enactiveActive
Patent Citations (1)
| Publication number | Priority date | Publication date | Assignee | Title |
|---|---|---|---|---|
| US20050115873A1 (en)* | 2003-12-02 | 2005-06-02 | De Villers Pierre | Method and apparatus for non-contact and rapid determination of liquid content |
Also Published As
| Publication number | Publication date |
|---|---|
| CN101421608B (en) | 2011-10-19 |
| US20090116015A1 (en) | 2009-05-07 |
| EP2244086A2 (en) | 2010-10-27 |
| ES2929039T3 (en) | 2022-11-24 |
| PL1843148T3 (en) | 2022-11-21 |
| ES2883201T3 (en) | 2021-12-07 |
| HK1131431A1 (en) | 2010-01-22 |
| CA2771025C (en) | 2016-02-16 |
| EP2244086A3 (en) | 2011-12-07 |
| CN101421608A (en) | 2009-04-29 |
| EP1843148A1 (en) | 2007-10-10 |
| US7889329B2 (en) | 2011-02-15 |
| JP5159760B2 (en) | 2013-03-13 |
| CA2648147A1 (en) | 2007-10-18 |
| CA2771025A1 (en) | 2007-10-18 |
| EP2244086B1 (en) | 2021-06-09 |
| PL2244086T3 (en) | 2021-11-22 |
| JP2009533654A (en) | 2009-09-17 |
| WO2007115732A1 (en) | 2007-10-18 |
| CA2648147C (en) | 2012-06-12 |
Similar Documents
| Publication | Publication Date | Title |
|---|---|---|
| EP1843148B1 (en) | Analysis of optical data using histograms | |
| EP1936362B1 (en) | Test element with referencing | |
| EP0876596B1 (en) | Process and device for determining an analyte contained in a scattering matrix | |
| EP1117989B1 (en) | Method for the photometric analysis of test elements | |
| EP1241979B1 (en) | Method and device for determining local distribution of a measuring parameter | |
| EP3260846B1 (en) | Device for detecting an analyte in a bodily fluid | |
| DE102006025714B4 (en) | Apparatus and method for discriminating among lateral flow assay test indicators | |
| DE60035174T2 (en) | INVASIVE METHOD FOR IN VIVO ANALYTIC MEASUREMENT | |
| EP2316023B1 (en) | Analysis system with code recognition | |
| DE10163775A1 (en) | Analysis system for determining an analyte concentration taking into account sample and analyte-independent changes in light intensity | |
| EP0819943A2 (en) | Analysing system with means for detecting insufficient dose | |
| EP1843147A1 (en) | Spatially resolved analysis of optical data of a test element | |
| EP2034293B1 (en) | Method and device for evaluating a dry chemical test element | |
| EP1890132A1 (en) | Method for analysing a sample of a liquid | |
| DE19628562A1 (en) | Optical system evaluating quality of fluid distribution onto test piece, e.g. medical test strip | |
| DE4314835A1 (en) | Method and device for analysing glucose in a biological matrix | |
| EP2502054B1 (en) | Method and device for inspecting a bodily fluid | |
| DE19519051B4 (en) | Method and device for the polarimetric determination of the blood sugar concentration | |
| DE19630160A1 (en) | Optical system evaluating quality of fluid distribution onto test piece, e.g. medical test strip | |
| WO2019008461A1 (en) | DEVICE AND METHOD FOR OBTAINING AT LEAST 2D ANALYTICAL INFORMATION AND DETECTING ELEMENT DESIGNATED THEREFOR | |
| EP2306178A1 (en) | Method for controlling a photometric measuring unit of a measuring device for generating and examining a body liquid sample and measuring system | |
| EP1890133B1 (en) | Method for analysing the sample of a liquid | |
| DE112021007066T5 (en) | Lateral flow test device | |
| DE102007054309A1 (en) | Highly dispersive matrix interaction length increasing method for determining concentration of e.g. blood, involves, involves detecting electromagnetic radiation, where amount of detected radiation is different from noise of detectors | |
| HK1131431B (en) | Analysis of optical data with the aid of histograms |
Legal Events
| Date | Code | Title | Description |
|---|---|---|---|
| PUAI | Public reference made under article 153(3) epc to a published international application that has entered the european phase | Free format text:ORIGINAL CODE: 0009012 | |
| AK | Designated contracting states | Kind code of ref document:A1 Designated state(s):AT BE BG CH CY CZ DE DK EE ES FI FR GB GR HU IE IS IT LI LT LU LV MC NL PL PT RO SE SI SK TR | |
| AX | Request for extension of the european patent | Extension state:AL BA HR MK YU | |
| 17P | Request for examination filed | Effective date:20080410 | |
| AKX | Designation fees paid | Designated state(s):AT BE BG CH CY CZ DE DK EE ES FI FR GB GR HU IE IS IT LI LT LU LV MC NL PL PT RO SE SI SK TR | |
| 17Q | First examination report despatched | Effective date:20080611 | |
| RAP1 | Party data changed (applicant data changed or rights of an application transferred) | Owner name:ROCHE DIABETES CARE GMBH Owner name:F.HOFFMANN-LA ROCHE AG | |
| STAA | Information on the status of an ep patent application or granted ep patent | Free format text:STATUS: EXAMINATION IS IN PROGRESS | |
| GRAP | Despatch of communication of intention to grant a patent | Free format text:ORIGINAL CODE: EPIDOSNIGR1 | |
| STAA | Information on the status of an ep patent application or granted ep patent | Free format text:STATUS: GRANT OF PATENT IS INTENDED | |
| RIN1 | Information on inventor provided before grant (corrected) | Inventor name:KOCHERSCHEIDT, GERRIT Inventor name:ASFOUR, JEAN-MICHEL Inventor name:HAAR, HANS-PETER Inventor name:PETRICH, WOLFGANG | |
| INTG | Intention to grant announced | Effective date:20220405 | |
| GRAS | Grant fee paid | Free format text:ORIGINAL CODE: EPIDOSNIGR3 | |
| GRAA | (expected) grant | Free format text:ORIGINAL CODE: 0009210 | |
| STAA | Information on the status of an ep patent application or granted ep patent | Free format text:STATUS: THE PATENT HAS BEEN GRANTED | |
| REG | Reference to a national code | Ref country code:DE Ref legal event code:R081 Ref document number:502006016483 Country of ref document:DE Owner name:ROCHE DIABETES CARE GMBH, DE Free format text:FORMER OWNERS: ROCHE DIAGNOSTICS GMBH, 68305 MANNHEIM, DE; F. HOFFMANN-ROCHE AG, BASEL, CH | |
| AK | Designated contracting states | Kind code of ref document:B1 Designated state(s):AT BE BG CH CY CZ DE DK EE ES FI FR GB GR HU IE IS IT LI LT LU LV MC NL PL PT RO SE SI SK TR | |
| REG | Reference to a national code | Ref country code:CH Ref legal event code:EP Ref country code:GB Ref legal event code:FG4D Free format text:NOT ENGLISH | |
| REG | Reference to a national code | Ref country code:AT Ref legal event code:REF Ref document number:1515644 Country of ref document:AT Kind code of ref document:T Effective date:20220915 | |
| REG | Reference to a national code | Ref country code:DE Ref legal event code:R096 Ref document number:502006016483 Country of ref document:DE | |
| REG | Reference to a national code | Ref country code:IE Ref legal event code:FG4D Free format text:LANGUAGE OF EP DOCUMENT: GERMAN | |
| REG | Reference to a national code | Ref country code:NL Ref legal event code:FP | |
| REG | Reference to a national code | Ref country code:ES Ref legal event code:FG2A Ref document number:2929039 Country of ref document:ES Kind code of ref document:T3 Effective date:20221124 | |
| REG | Reference to a national code | Ref country code:LT Ref legal event code:MG9D | |
| PG25 | Lapsed in a contracting state [announced via postgrant information from national office to epo] | Ref country code:SE Free format text:LAPSE BECAUSE OF FAILURE TO SUBMIT A TRANSLATION OF THE DESCRIPTION OR TO PAY THE FEE WITHIN THE PRESCRIBED TIME-LIMIT Effective date:20220831 Ref country code:LV Free format text:LAPSE BECAUSE OF FAILURE TO SUBMIT A TRANSLATION OF THE DESCRIPTION OR TO PAY THE FEE WITHIN THE PRESCRIBED TIME-LIMIT Effective date:20220831 Ref country code:LT Free format text:LAPSE BECAUSE OF FAILURE TO SUBMIT A TRANSLATION OF THE DESCRIPTION OR TO PAY THE FEE WITHIN THE PRESCRIBED TIME-LIMIT Effective date:20220831 Ref country code:FI Free format text:LAPSE BECAUSE OF FAILURE TO SUBMIT A TRANSLATION OF THE DESCRIPTION OR TO PAY THE FEE WITHIN THE PRESCRIBED TIME-LIMIT Effective date:20220831 | |
| PG25 | Lapsed in a contracting state [announced via postgrant information from national office to epo] | Ref country code:IS Free format text:LAPSE BECAUSE OF FAILURE TO SUBMIT A TRANSLATION OF THE DESCRIPTION OR TO PAY THE FEE WITHIN THE PRESCRIBED TIME-LIMIT Effective date:20221231 Ref country code:GR Free format text:LAPSE BECAUSE OF FAILURE TO SUBMIT A TRANSLATION OF THE DESCRIPTION OR TO PAY THE FEE WITHIN THE PRESCRIBED TIME-LIMIT Effective date:20221201 | |
| PG25 | Lapsed in a contracting state [announced via postgrant information from national office to epo] | Ref country code:RO Free format text:LAPSE BECAUSE OF FAILURE TO SUBMIT A TRANSLATION OF THE DESCRIPTION OR TO PAY THE FEE WITHIN THE PRESCRIBED TIME-LIMIT Effective date:20220831 Ref country code:PT Free format text:LAPSE BECAUSE OF FAILURE TO SUBMIT A TRANSLATION OF THE DESCRIPTION OR TO PAY THE FEE WITHIN THE PRESCRIBED TIME-LIMIT Effective date:20230102 Ref country code:DK Free format text:LAPSE BECAUSE OF FAILURE TO SUBMIT A TRANSLATION OF THE DESCRIPTION OR TO PAY THE FEE WITHIN THE PRESCRIBED TIME-LIMIT Effective date:20220831 Ref country code:CZ Free format text:LAPSE BECAUSE OF FAILURE TO SUBMIT A TRANSLATION OF THE DESCRIPTION OR TO PAY THE FEE WITHIN THE PRESCRIBED TIME-LIMIT Effective date:20220831 | |
| PG25 | Lapsed in a contracting state [announced via postgrant information from national office to epo] | Ref country code:SK Free format text:LAPSE BECAUSE OF FAILURE TO SUBMIT A TRANSLATION OF THE DESCRIPTION OR TO PAY THE FEE WITHIN THE PRESCRIBED TIME-LIMIT Effective date:20220831 Ref country code:EE Free format text:LAPSE BECAUSE OF FAILURE TO SUBMIT A TRANSLATION OF THE DESCRIPTION OR TO PAY THE FEE WITHIN THE PRESCRIBED TIME-LIMIT Effective date:20220831 | |
| REG | Reference to a national code | Ref country code:DE Ref legal event code:R097 Ref document number:502006016483 Country of ref document:DE | |
| PLBE | No opposition filed within time limit | Free format text:ORIGINAL CODE: 0009261 | |
| STAA | Information on the status of an ep patent application or granted ep patent | Free format text:STATUS: NO OPPOSITION FILED WITHIN TIME LIMIT | |
| 26N | No opposition filed | Effective date:20230601 | |
| PG25 | Lapsed in a contracting state [announced via postgrant information from national office to epo] | Ref country code:SI Free format text:LAPSE BECAUSE OF FAILURE TO SUBMIT A TRANSLATION OF THE DESCRIPTION OR TO PAY THE FEE WITHIN THE PRESCRIBED TIME-LIMIT Effective date:20220831 | |
| REG | Reference to a national code | Ref country code:CH Ref legal event code:PL | |
| PG25 | Lapsed in a contracting state [announced via postgrant information from national office to epo] | Ref country code:LU Free format text:LAPSE BECAUSE OF NON-PAYMENT OF DUE FEES Effective date:20230408 | |
| REG | Reference to a national code | Ref country code:BE Ref legal event code:MM Effective date:20230430 | |
| PG25 | Lapsed in a contracting state [announced via postgrant information from national office to epo] | Ref country code:MC Free format text:LAPSE BECAUSE OF FAILURE TO SUBMIT A TRANSLATION OF THE DESCRIPTION OR TO PAY THE FEE WITHIN THE PRESCRIBED TIME-LIMIT Effective date:20220831 | |
| PG25 | Lapsed in a contracting state [announced via postgrant information from national office to epo] | Ref country code:MC Free format text:LAPSE BECAUSE OF FAILURE TO SUBMIT A TRANSLATION OF THE DESCRIPTION OR TO PAY THE FEE WITHIN THE PRESCRIBED TIME-LIMIT Effective date:20220831 Ref country code:LI Free format text:LAPSE BECAUSE OF NON-PAYMENT OF DUE FEES Effective date:20230430 Ref country code:CH Free format text:LAPSE BECAUSE OF NON-PAYMENT OF DUE FEES Effective date:20230430 | |
| REG | Reference to a national code | Ref country code:IE Ref legal event code:MM4A | |
| PG25 | Lapsed in a contracting state [announced via postgrant information from national office to epo] | Ref country code:BE Free format text:LAPSE BECAUSE OF NON-PAYMENT OF DUE FEES Effective date:20230430 | |
| PG25 | Lapsed in a contracting state [announced via postgrant information from national office to epo] | Ref country code:IE Free format text:LAPSE BECAUSE OF NON-PAYMENT OF DUE FEES Effective date:20230408 | |
| PGFP | Annual fee paid to national office [announced via postgrant information from national office to epo] | Ref country code:NL Payment date:20240320 Year of fee payment:19 | |
| PG25 | Lapsed in a contracting state [announced via postgrant information from national office to epo] | Ref country code:IE Free format text:LAPSE BECAUSE OF NON-PAYMENT OF DUE FEES Effective date:20230408 | |
| PGFP | Annual fee paid to national office [announced via postgrant information from national office to epo] | Ref country code:GB Payment date:20240321 Year of fee payment:19 | |
| PGFP | Annual fee paid to national office [announced via postgrant information from national office to epo] | Ref country code:PL Payment date:20240325 Year of fee payment:19 Ref country code:IT Payment date:20240320 Year of fee payment:19 Ref country code:FR Payment date:20240320 Year of fee payment:19 | |
| REG | Reference to a national code | Ref country code:AT Ref legal event code:MM01 Ref document number:1515644 Country of ref document:AT Kind code of ref document:T Effective date:20230408 | |
| PGFP | Annual fee paid to national office [announced via postgrant information from national office to epo] | Ref country code:DE Payment date:20240320 Year of fee payment:19 | |
| PGFP | Annual fee paid to national office [announced via postgrant information from national office to epo] | Ref country code:ES Payment date:20240502 Year of fee payment:19 | |
| PG25 | Lapsed in a contracting state [announced via postgrant information from national office to epo] | Ref country code:AT Free format text:LAPSE BECAUSE OF NON-PAYMENT OF DUE FEES Effective date:20230408 | |
| PG25 | Lapsed in a contracting state [announced via postgrant information from national office to epo] | Ref country code:AT Free format text:LAPSE BECAUSE OF NON-PAYMENT OF DUE FEES Effective date:20230408 | |
| PG25 | Lapsed in a contracting state [announced via postgrant information from national office to epo] | Ref country code:BG Free format text:LAPSE BECAUSE OF FAILURE TO SUBMIT A TRANSLATION OF THE DESCRIPTION OR TO PAY THE FEE WITHIN THE PRESCRIBED TIME-LIMIT Effective date:20220831 | |
| PG25 | Lapsed in a contracting state [announced via postgrant information from national office to epo] | Ref country code:BG Free format text:LAPSE BECAUSE OF FAILURE TO SUBMIT A TRANSLATION OF THE DESCRIPTION OR TO PAY THE FEE WITHIN THE PRESCRIBED TIME-LIMIT Effective date:20220831 | |
| PG25 | Lapsed in a contracting state [announced via postgrant information from national office to epo] | Ref country code:CY Free format text:LAPSE BECAUSE OF FAILURE TO SUBMIT A TRANSLATION OF THE DESCRIPTION OR TO PAY THE FEE WITHIN THE PRESCRIBED TIME-LIMIT; INVALID AB INITIO Effective date:20060408 | |
| PG25 | Lapsed in a contracting state [announced via postgrant information from national office to epo] | Ref country code:HU Free format text:LAPSE BECAUSE OF FAILURE TO SUBMIT A TRANSLATION OF THE DESCRIPTION OR TO PAY THE FEE WITHIN THE PRESCRIBED TIME-LIMIT; INVALID AB INITIO Effective date:20060408 |