EP1302804A2 - Method for the optical determination of characteristical parameters of a sample - Google Patents
Method for the optical determination of characteristical parameters of a sampleDownload PDFInfo
- Publication number
- EP1302804A2 EP1302804A2EP02021433AEP02021433AEP1302804A2EP 1302804 A2EP1302804 A2EP 1302804A2EP 02021433 AEP02021433 AEP 02021433AEP 02021433 AEP02021433 AEP 02021433AEP 1302804 A2EP1302804 A2EP 1302804A2
- Authority
- EP
- European Patent Office
- Prior art keywords
- detector
- channels
- detection
- sample
- shift
- Prior art date
- Legal status (The legal status is an assumption and is not a legal conclusion. Google has not performed a legal analysis and makes no representation as to the accuracy of the status listed.)
- Withdrawn
Links
- 238000000034methodMethods0.000titleclaimsabstractdescription29
- 230000003287optical effectEffects0.000titleclaimsabstractdescription11
- 238000001514detection methodMethods0.000claimsabstractdescription31
- 230000005855radiationEffects0.000claimsabstractdescription15
- 238000003384imaging methodMethods0.000claimsdescription8
- 230000008569processEffects0.000claimsdescription5
- 238000005259measurementMethods0.000claimsdescription4
- 238000001228spectrumMethods0.000claimsdescription3
- 238000006073displacement reactionMethods0.000claimsdescription2
- 238000011144upstream manufacturingMethods0.000claimsdescription2
- 230000000694effectsEffects0.000claims1
- 239000000975dyeSubstances0.000description30
- 230000005284excitationEffects0.000description20
- 230000003595spectral effectEffects0.000description20
- 238000010521absorption reactionMethods0.000description13
- 239000000523sampleSubstances0.000description12
- 238000000295emission spectrumMethods0.000description8
- 238000002360preparation methodMethods0.000description5
- 238000000799fluorescence microscopyMethods0.000description3
- 238000002189fluorescence spectrumMethods0.000description3
- XKRFYHLGVUSROY-UHFFFAOYSA-NArgonChemical compound[Ar]XKRFYHLGVUSROY-UHFFFAOYSA-N0.000description2
- 102100023882Endoribonuclease ZC3H12AHuman genes0.000description2
- 101710112715Endoribonuclease ZC3H12AProteins0.000description2
- 238000010586diagramMethods0.000description2
- 238000001917fluorescence detectionMethods0.000description2
- 239000007850fluorescent dyeSubstances0.000description2
- 230000005283ground stateEffects0.000description2
- 230000010354integrationEffects0.000description2
- 238000011835investigationMethods0.000description2
- 238000000386microscopyMethods0.000description2
- 238000012216screeningMethods0.000description2
- 238000000926separation methodMethods0.000description2
- 230000000638stimulationEffects0.000description2
- 230000007704transitionEffects0.000description2
- 206010067482No adverse eventDiseases0.000description1
- 239000013543active substanceSubstances0.000description1
- 230000006978adaptationEffects0.000description1
- 229910052786argonInorganic materials0.000description1
- WZSUOQDIYKMPMT-UHFFFAOYSA-Nargon kryptonChemical compound[Ar].[Kr]WZSUOQDIYKMPMT-UHFFFAOYSA-N0.000description1
- 230000006399behaviorEffects0.000description1
- 239000012472biological sampleSubstances0.000description1
- 238000004364calculation methodMethods0.000description1
- 230000008859changeEffects0.000description1
- 238000004624confocal microscopyMethods0.000description1
- 239000013078crystalSubstances0.000description1
- 230000001419dependent effectEffects0.000description1
- 238000011161developmentMethods0.000description1
- 230000018109developmental processEffects0.000description1
- 238000009792diffusion processMethods0.000description1
- 230000005281excited stateEffects0.000description1
- 239000000835fiberSubstances0.000description1
- 238000002060fluorescence correlation spectroscopyMethods0.000description1
- 230000006870functionEffects0.000description1
- 238000013537high throughput screeningMethods0.000description1
- 238000002372labellingMethods0.000description1
- 230000015654memoryEffects0.000description1
- 231100000252nontoxicToxicity0.000description1
- 238000000399optical microscopyMethods0.000description1
- 210000001747pupilAnatomy0.000description1
- 238000001758scanning near-field microscopyMethods0.000description1
- 238000004621scanning probe microscopyMethods0.000description1
- 230000035945sensitivityEffects0.000description1
- 238000004611spectroscopical analysisMethods0.000description1
- 230000004936stimulating effectEffects0.000description1
- 230000001629suppressionEffects0.000description1
Images


Classifications
- G—PHYSICS
- G01—MEASURING; TESTING
- G01J—MEASUREMENT OF INTENSITY, VELOCITY, SPECTRAL CONTENT, POLARISATION, PHASE OR PULSE CHARACTERISTICS OF INFRARED, VISIBLE OR ULTRAVIOLET LIGHT; COLORIMETRY; RADIATION PYROMETRY
- G01J3/00—Spectrometry; Spectrophotometry; Monochromators; Measuring colours
- G01J3/28—Investigating the spectrum
- G01J3/2803—Investigating the spectrum using photoelectric array detector
- G—PHYSICS
- G02—OPTICS
- G02B—OPTICAL ELEMENTS, SYSTEMS OR APPARATUS
- G02B21/00—Microscopes
- G02B21/0004—Microscopes specially adapted for specific applications
- G02B21/002—Scanning microscopes
- G—PHYSICS
- G01—MEASURING; TESTING
- G01N—INVESTIGATING OR ANALYSING MATERIALS BY DETERMINING THEIR CHEMICAL OR PHYSICAL PROPERTIES
- G01N21/00—Investigating or analysing materials by the use of optical means, i.e. using sub-millimetre waves, infrared, visible or ultraviolet light
- G01N21/62—Systems in which the material investigated is excited whereby it emits light or causes a change in wavelength of the incident light
- G01N21/63—Systems in which the material investigated is excited whereby it emits light or causes a change in wavelength of the incident light optically excited
- G01N21/64—Fluorescence; Phosphorescence
Definitions
- the inventionrelates to a method and an arrangement in the Fluorescence microscopy, especially laser scanning microscopy, the Fluorescence correlation spectroscopy and scanning near field microscopy, for the investigation of predominantly biological samples, Preparations and related components.
- Fluorescence detection based methods for screening active substances (High throughput screening) and flow cytometerare included on Fluorescence detection based methods for screening active substances (High throughput screening) and flow cytometer.
- Simultaneous examinations of samples with Multiple fluorophoresare thus used with overlapping fluorescence spectra also possible in spatial structures of thick samples.
- the spectral resolution of the detection unitis increased.
- the wavelength of the emitted photonis generally red due to the Stokes shift compared to the excitation radiation, so it has a longer wavelength.
- the Stokes shiftenables the fluorescence radiation to be separated from the excitation radiation.
- the fluorescent lightis split off from the excitation radiation with suitable dichroic beam splitters in combination with block filters and observed separately. This makes it possible to display individual cell parts stained with different dyes. In principle, however, several parts of a preparation can also be colored simultaneously with different specific dyes (multiple fluorescence). To distinguish between the fluorescence signals emitted by the individual dyes, special dichroic beam splitters are used.
- LSMis essentially divided into 4 modules: light source, scan module, Detection unit and microscope. These modules are discussed in more detail below described. Reference is also made to DE19702753A1.
- lasers with different wavelengthsare used in an LSM.
- the choice of the excitation wavelengthdepends on the absorption properties of the dyes to be examined.
- the excitation radiationis generated in the light source module.
- Various lasersare used here (argon, argon krypton, TiSa laser).
- the wavelengthsare selected and the intensity of the required excitation wavelength is set in the light source module, for example by using an acousto-optical crystal.
- the laser radiationthen reaches the scan module via a fiber or a suitable mirror arrangement.
- the laser radiation generated in the light sourceis focused into the specimen with the aid of the objective (2) and diffraction-limited via the scanner, the scanning optics and the tube lens.
- the focus rasterscans the sample in the xy direction.
- the pixel dwell times when scanning over the sampleare usually in the range of less than a microsecond to a few seconds.
- confocal detectiondescanned detection
- MDBdichroic beam splitter
- the fluorescent lightis then focused on a diaphragm (confocal diaphragm / pinhole) which is located exactly in a plane conjugate to the focal plane. This suppresses fluorescent light components outside of the focus.
- the optical resolution of the microscopecan be adjusted by varying the aperture size.
- Another dichroic block filter(EF) is located behind the diaphragm, which again suppresses the excitation radiation. After passing the block filter, the fluorescent light is measured using a point detector (PMT).
- PMTpoint detector
- the excitation of the dye fluorescencetakes place in a small volume in which the excitation intensity is particularly high. This area is only slightly larger than the detected area when using a confocal arrangement. The use of a confocal diaphragm can thus be omitted and the detection can take place directly after the lens (non-descanned detection).
- the plane (optical section) that is in the focal plane of the objectiveis reproduced by both detection arrangements in conjunction with the corresponding single-photon or multi-photon absorption.
- a three-dimensional image of the samplecan then be generated with the aid of a computer.
- the LSMis therefore suitable for examining thick specimens.
- the excitation wavelengthsare determined by the dye used with its specific absorption properties. Dichroic filters matched to the emission properties of the dye ensure that only the fluorescent light emitted by the respective dye is measured by the point detector.
- the fluorescent lightis switched off using a Prism spectrally split.
- the processdiffers from that Arrangement described above with dichroic filters only in that the characteristics of the filter used can be adjusted. However, it will furthermore preferably the emission band of one for each point detector Dye recorded.
- the location of the emission spectrum of the dyes usedis unknown or occurs a displacement of the Emission spectrum (Fig. 3c), so is a high-resolution detection of the Dye fluorescence necessary.
- the wavelength shiftcan be up to to be several 10 nm.
- the sampleis also used in conjunction with a spectrometer LSM used. This is a conventional one instead of a point detector mostly high-resolution spectrometer used (Patent Dixon, et al. US 5,192,980). However, these can only be spotted or averaged over an area record an emission spectrum. So it's a kind of Spectroscopy.
- the mostly weak fluorescence signal of the Sample on a large number of individual channels in the spectrometer(mostly 512 or 1024 individual channels) distributed or becomes a narrow fluorescence band detected according to the spectral resolution. Therefore the signal is pro Single channel extremely small and possibly no longer detectable.
- the background of the method according to the inventionis spectral split detection of fluorescence, with different Spectral components is summed.
- the emission light in the Scan module or in a microscope (with multiphoton absorption)with the help of a Element for separating the excitation radiation from the detected one Radiation such as the main color splitter (MDB) or an AOTF according to 7346DE or split off from the excitation light according to 7323DE.
- MDBmain color splitter
- 7346DEAOTF
- split off from the excitation light according to 7323DEsplit off from the excitation light according to 7323DE.
- the light of the sampleis confocal with the help of an imaging optic PO Detection through an aperture (pinhole) PH focused, causing fluorescence, that was created out of focus is suppressed. At a the aperture is not required for unscanned detection.
- the lightis now using of an angle-dispersive element Dl broken down into its spectral components. As angle-dispersive elements come prisms, grids and for example acousto-optical elements in question. That from the dispersive element in his spectral components split light is then on a Line detector DE shown. This line detector DE therefore measures that Emission signal depending on the wavelength and converts this into electrical signals around.
- an interconnection of individual channelsi.e. a summation over individual channels of the Line detector.
- a line filtercan also be used for the detection unit Suppression of the excitation wavelengths are connected upstream.
- a possible embodiment of the optical beam path of the in Fig. 4 Fig. 5shows the detector unit shown in the block diagram.
- a confocal detectionis the light L of the sample with the pinhole optics PO focused through the confocal aperture PH. With an undescanned Detection in the event of multi-photon absorption can be this aperture omitted.
- the first imaging mirror M2collimates the fluorescent light. The light then strikes a line grating G, for example a grating with a line count of 651 lines per mm. The grating diffracts the light in different directions according to its wavelength.
- the second imaging mirror M1focuses the individual spectrally split Wavelength components on the corresponding channels of the line detector DE
- the use of a line secondary electron multiplieris particularly advantageous from the company Hamamatsu H7260.
- the detectorowns 32 channels and high sensitivity.
- the free spectral range of the above described embodimentis about 350 nm.
- the use of the unit in an imaging systemis advantageous because the signal per detection channel due to the relatively wide detected spectral band is still relatively large.
- a shift in the Fluorescence spectrumcan be twisted by, for example, the Grid, from M1, from M2, to the angle phi and / or through one Shift of the line receiver in the direction of the wavelength splitting around dl (see fig).
- the spectral resolution in the optical arrangements shown aboveis determined by the number of individual channels.
- each individual channeldetects a spectral band of the emission spectrum with a spectral width of approximately 10 nm. If not all individual channels of the detector can be read out simultaneously, according to the state of the art, the individual channels are read out sequentially (multiplexing). According to the invention, this is summed up over individual channels with different patterns.
- Fig. 6shows schematically in each line the different individual channels of the line detector, whose N individual signals correspond to C.
- the measured signals of the individual channelsare c c , j (in Fig. 6 as
- To calculate the N times n spectral values S mdifferences of sums over individual channels are now formed according to the following algorithm: .... .... .... .... .... .... .... .... .... .... .... .... .... .... .... ....
- the spectral values S(intermediate values) calculated in this way can subsequently graphically on the displayed image, e.g. during a spectral scan being represented.
- the summation over various individual channels and thus the measurement of the c k, jis shown schematically in Fig. 7.
- the signals of the individual channelsare in turn transformed with an amplifier A into voltage signals.
- the individual voltage signalsare then integrated in an integrator 1 during the pixel dwell time.
- a comparator Kwhich compares the integrated signal with a reference signal is connected downstream of the integrator. If the integrated signal is smaller than the comparator threshold, then no or too small a fluorescence signal would be measured in the corresponding individual channel. In such a case, the signal of the individual channel should not be processed further, since this channel only contributes a noise component to the overall signal.
- the comparatoractuates a switch S via SR and the individual channel is switched off for the pixel just measured. With the aid of the comparators in combination with the switches, the spectral range relevant for the pixel currently being measured is automatically selected.
- the integrated voltage signal of the individual channelscan then be used a demultiplexer MPX connected to the switch register SR different total points can be switched through the register Reg1.
- Fig. 7shows 8 different sum points SP.
- the control of the register Reg1is carried out by a control line V1 from the computer.
- the summation patterncan be controlled with pixel accuracy, i.e. in one Period of a few ⁇ s.
- a sum point SPforms part of the summation amplifier SV, which carries out the summation of the selected individual channels.
- a total of 8 sum amplifiers SVare shown in Fig. 7.
- the sum signals c k, jare then converted into digital signals with an analog-digital converter and further processed by the computer or DSP.
- the sum amplifier SVcan also be operated with a variable non-linear characteristic.
- a change of the summation pattern by V1can be made image-wise after the recording or during the scanning of an image point or an image line / column.
- the requirements for the switching speed of the MPXdepend on the type of setting. If, for example, a pixel-by-pixel setting is made, the scan must take place within the integration time for this pixel (ie in a few microseconds). If the setting is made image-wise, the scan must take place within a few milliseconds to seconds.
- the signals of the individual channelsare calculated using the algorithm described above using the c k, j .
Landscapes
- Physics & Mathematics (AREA)
- Spectroscopy & Molecular Physics (AREA)
- General Physics & Mathematics (AREA)
- Chemical & Material Sciences (AREA)
- Analytical Chemistry (AREA)
- Optics & Photonics (AREA)
- Investigating, Analyzing Materials By Fluorescence Or Luminescence (AREA)
- Spectrometry And Color Measurement (AREA)
Abstract
Translated fromGermanDescription
Translated fromGermanDie Erfindung bezieht sich auf ein Verfahren und eine Anordnung in derFluoreszenzmikroskopie, insbesondere der Laser Scanning Mikroskopie, derFluoreszenz-Korrelationsspektroskopie und der Scanning Nahfeldmikroskopie,zur Untersuchung von vorwiegend biologischen Proben,Präparaten und zugehörigen Komponenten. Mit eingeschlossen sind aufFluoreszenzdetektion basierenden Verfahren zum Screenen von Wirkstoffen(High Throughput Sceening) sowie Durchflußzytometer. Durch den Übergangvon der Detektion von wenigen breiten spektralen Farbstoffbändern zursimultanen Aufnahme kompletter Spektren eröffnen sich neue Möglichkeitenbei der Identifikation, Separation und Zuordnung der meist analytischen oderfunktionalen Probeneigenschaften zu räumlichen Teilstrukturen oderdynamischen Prozessen. Simultan-Untersuchungen von Proben mitMehrfachfluorophoren werden damit bei überlappenden Fluoreszenzspektrenauch in räumlichen Strukturen von dicken Proben möglich. Durch dieAnordnung wird die spektrale Auflösung der Detektionseinheit erhöht.The invention relates to a method and an arrangement in theFluorescence microscopy, especially laser scanning microscopy, theFluorescence correlation spectroscopy and scanning near field microscopy,for the investigation of predominantly biological samples,Preparations and related components. Are included onFluorescence detection based methods for screening active substances(High throughput screening) and flow cytometer. Through the transitionfrom the detection of a few broad spectral dye bands toSimultaneous recording of complete spectra opens up new possibilitiesin the identification, separation and assignment of the mostly analytical orfunctional sample properties to spatial substructures ordynamic processes. Simultaneous examinations of samples withMultiple fluorophores are thus used with overlapping fluorescence spectraalso possible in spatial structures of thick samples. Through theArrangement, the spectral resolution of the detection unit is increased.
Ein klassisches Anwendungsgebiet der Lichtmikroskopie zur Untersuchungvon biologischen Präparaten ist die Fluoreszenzmikroskopie (Lit.: Pawley,"Handbook of biological confocal Microscopy"; Plenum Press 1995). Hierbeiwerden bestimmte Farbstoffe zur spezifischen Markierung von Zellteilenverwendet.
Die eingestrahlten Photonen einer bestimmten Energie regen dieFarbstoffmoleküle durch die Absorption eines Photons aus demGrundzustand in einen angeregten Zustand an. Diese Anregung wird meistals Einphotonen-Absorption bezeichnet (Abb. 1a). Die so angeregtenFarbstoffmoleküle können auf verschiedene Weise in den Grundzustandzurück gelangen. In der Fluoreszenzmikroskopie ist der Übergang unterAussendung eines Fluoreszenzphotons am wichtigsten. Die Wellenlänge desemittierten Photons ist aufgrund der Stokesverschiebung im Vergleich zur Anregungsstrahlung generell rot verschoben, besitzt also eine größereWellenlänge. Die Stokesverschiebung ermöglicht die Trennung derFluoreszenzstrahlung von der Anregungsstrahlung.
Das Fluoreszenzlicht wird mit geeigneten dichroitischen Strahlteilern inKombination mit Blockfiltern von der Anregungsstrahlung abgespalten undgetrennt beobachtet. Dadurch ist die Darstellung einzelner, mit verschiedenenFarbstoffen eingefärbten Zellteilen, möglich. Grundsätzlich können jedochauch mehrere Teile eines Präparates gleichzeitig mit verschiedenen sichspezifisch anlagernden Farbstoffen eingefärbt werden (Mehrfachfluoreszenz).Zur Unterscheidung, der von den einzelnen Farbstoffen ausgesendetenFluoreszenzsignale, werden wiederum spezielle dichroitischen Strahlteilerverwendet.A classic application of light microscopy for the investigation of biological preparations is fluorescence microscopy (Lit .: Pawley, "Handbook of biological confocal Microscopy"; Plenum Press 1995). Here certain dyes are used for the specific marking of cell parts.
The irradiated photons of a certain energy excite the dye molecules by absorbing a photon from the ground state to an excited state. This excitation is usually referred to as single-photon absorption (Fig. 1a). The dye molecules excited in this way can return to the ground state in various ways. In fluorescence microscopy, the transition with the emission of a fluorescence photon is most important. The wavelength of the emitted photon is generally red due to the Stokes shift compared to the excitation radiation, so it has a longer wavelength. The Stokes shift enables the fluorescence radiation to be separated from the excitation radiation.
The fluorescent light is split off from the excitation radiation with suitable dichroic beam splitters in combination with block filters and observed separately. This makes it possible to display individual cell parts stained with different dyes. In principle, however, several parts of a preparation can also be colored simultaneously with different specific dyes (multiple fluorescence). To distinguish between the fluorescence signals emitted by the individual dyes, special dichroic beam splitters are used.
Neben der Anregung der Farbstoffmoleküle mit einem hochenergetischenPhoton (Einphotonen-Absorption) ist auch eine Anregung mit mehrerenPhotonen geringerer Energie möglich (Abb. 1b). Die Summe der Energien derEinzelphotonen entspricht hierbei ungefähr einem Vielfachen deshochenergetischen Photons. Diese Art der Anregung der Farbstoffe wird alsMehrphotonen-Absorption bezeichnet (Lit.: Corle, Kino; "Confocal ScanningOptical Microscopy and Related Imaging Systems"; Academic Press 1996).Die Farbstoffemission wird durch diese Art der Anregung jedoch nichtbeeinflußt, d.h. das Emissionsspektrum erfährt bei der Mehrphotonen-Absorptioneinen negativen Stokesshift, besitzt also eine geringereWellenlänge im Vergleich zur Anregungsstrahlung. Die Trennung derAnregungs- von der Emissionsstrahlung erfolgt in der gleichen Art und Weisewie bei der Einphotonen-Absorption.In addition to stimulating the dye molecules with a high-energyPhoton (single-photon absorption) is also an excitation with severalLower energy photons possible (Fig.1b). The sum of the energies of theSingle photons corresponds approximately to a multiple of thehigh-energy photons. This type of stimulation of the dyes is calledMulti-photon absorption (Lit .: Corle, Kino; "Confocal ScanningOptical Microscopy and Related Imaging Systems "; Academic Press 1996).However, this type of excitation does not result in dye emissioninfluenced, i.e. the emission spectrum is experienced by multiphoton absorptiona negative Stokes shift, so it has a lower oneWavelength compared to the excitation radiation. The separation of theExcitation radiation emits in the same wayas with single-photon absorption.
Der Stand der Technik soll im folgenden beispielhaft anhand eines konfokalenLaser-Scanning- Mikroskopes (LSM) erläutert werden (Abb. 2).The following is an example of the state of the art based on a confocalLaser scanning microscope (LSM) are explained (Fig. 2).
Ein LSM gliedert sich im wesentlichen in 4 Module: Lichtquelle, Scanmodul,Detektionseinheit und Mikroskop. Diese Module werden im folgenden näherbeschrieben. Es wird zusätzlich auf DE19702753A1 verwiesen.An LSM is essentially divided into 4 modules: light source, scan module,Detection unit and microscope. These modules are discussed in more detail belowdescribed. Reference is also made to DE19702753A1.
Zur spezifischen Anregung der verschiedenen Farbstoffe in einem Präparatwerden in einem LSM Laser mit verschiedenen Wellenlängen eingesetzt. DieWahl der Anregungswellenlänge richtet sich nach den Absorptionseigenschaftender zu untersuchenden Farbstoffe. Die Anregungsstrahlungwird im Lichtquellenmodul erzeugt. Zum Einsatz kommen hierbeiverschiedene Laser (Argon, Argon Krypton, TiSa-Laser). Weiterhin erfolgt imLichtquellenmodul die Selektion der Wellenlängen und die Einstellung derIntensität der benötigten Anregungswellenlänge, z.B. durch den Einsatz einesakusto optischen Kristalls. Anschließend gelangt die Laserstrahlung über eineFaser oder eine geeignete Spiegelanordnung in das Scanmodul.
Die in der Lichtquelle erzeugte Laserstrahlung wird mit Hilfe des Objektivs (2)beugungsbegrenzt über die Scanner, die Scanoptik und die Tubuslinse in dasPräparat fokussiert. Der Fokus rastert punktförmig die Probe in x-y-Richtungab. Die Pixelverweilzeiten beim Scannen über die Probe liegen meist imBereich von weniger als einer Mikrosekunde bis zu einigen Sekunden.
Bei einer konfokalen Detektion (descanned Detection) des Fluoreszenzlichtes,gelangt das Licht das aus der Fokusebene (Specimen) und aus dendarüber- und darunterliegenden Ebenen emittiert wird, über die Scanner aufeinen dichroitischen Strahlteiler (MDB). Dieser trennt das Fluoreszenzlichtvom Anregungslicht. Anschließend wird das Fluoreszenzlicht auf eine Blende(konfokale Blende / Pinhole) fokussiert, die sich genau in einer zurFokusebene konjugierten Ebene befindet. Dadurch werdenFluoreszenzlichtanteile außerhalb des Fokus unterdrückt. Durch Variieren derBlendengröße kann die optische Auflösung des Mikroskops eingestelltwerden. Hinter der Blende befindet sich ein weiterer dichroitischer Blockfilter(EF) der nochmals die Anregungsstrahlung unterdrückt. Nach Passieren desBlockfilters wird das Fluoreszenzlicht mittels eines Punktdetektors (PMT)gemessen.
Bei Verwendung einer Mehrphotonen-Absorption erfolgt die Anregung derFarbstofffluoreszenz in einem kleinen Volumen in dem dieAnregungsintensität besonders hoch ist. Dieser Bereich ist nur unwesentlichgrößer als der detektierte Bereich bei Verwendung einer konfokalenAnordnung. Der Einsatz einer konfokalen Blende kann somit entfallen und dieDetektion kann direkt nach dem Objektiv erfolgen (non descannte Detektion).For specific stimulation of the different dyes in a preparation, lasers with different wavelengths are used in an LSM. The choice of the excitation wavelength depends on the absorption properties of the dyes to be examined. The excitation radiation is generated in the light source module. Various lasers are used here (argon, argon krypton, TiSa laser). Furthermore, the wavelengths are selected and the intensity of the required excitation wavelength is set in the light source module, for example by using an acousto-optical crystal. The laser radiation then reaches the scan module via a fiber or a suitable mirror arrangement.
The laser radiation generated in the light source is focused into the specimen with the aid of the objective (2) and diffraction-limited via the scanner, the scanning optics and the tube lens. The focus raster scans the sample in the xy direction. The pixel dwell times when scanning over the sample are usually in the range of less than a microsecond to a few seconds.
In the case of confocal detection (descanned detection) of the fluorescent light, the light which is emitted from the focal plane (specimen) and from the planes above and below it reaches a dichroic beam splitter (MDB) via the scanner. This separates the fluorescent light from the excitation light. The fluorescent light is then focused on a diaphragm (confocal diaphragm / pinhole) which is located exactly in a plane conjugate to the focal plane. This suppresses fluorescent light components outside of the focus. The optical resolution of the microscope can be adjusted by varying the aperture size. Another dichroic block filter (EF) is located behind the diaphragm, which again suppresses the excitation radiation. After passing the block filter, the fluorescent light is measured using a point detector (PMT).
When using a multi-photon absorption, the excitation of the dye fluorescence takes place in a small volume in which the excitation intensity is particularly high. This area is only slightly larger than the detected area when using a confocal arrangement. The use of a confocal diaphragm can thus be omitted and the detection can take place directly after the lens (non-descanned detection).
In einer weiteren Anordnung zur Detektion einer durch Mehrphotonenabsorptionangeregten Farbstofffluoreszenz erfolgt weiterhin eine descannteDetektion, jedoch wird diesmal die Pupille des Objektives in dieDetektionseinheit abgebildet (nichtkonfokal descannte Detektion).In a further arrangement for the detection of a by multi-photon absorptionexcited dye fluorescence continues to be descannedDetection, but this time the pupil of the lens is in theDetection unit mapped (non-confocal descanned detection).
Von einem dreidimensional ausgeleuchteten Bild wird durch beideDetektionsanordnungen in Verbindung mit der entsprechenden Einphotonenbzw. Mehrphotonen-Absorption nur die Ebene (optischer Schnitt)wiedergegeben, die sich in der Fokusebene des Objektivs befindet. Durch dieAufzeichnung mehrerer optische Schnitte in der x-y Ebene in verschiedenenTiefen z der Probe kann anschließend rechnergestützt ein dreidimensionalesBild der Probe generiert werden.
Das LSM ist somit zur Untersuchung von dicken Präparaten geeignet. DieAnregungswellenlängen werden durch den verwendeten Farbstoff mit seinenspezifischen Absorptionseigenschaften bestimmt. Auf die Emissionseigenschaftendes Farbstoffes abgestimmte dichroitische Filter stellen sicher,daß nur das vom jeweiligen Farbstoff ausgesendete Fluoreszenzlicht vomPunktdetektor gemessen wird.From a three-dimensionally illuminated image, only the plane (optical section) that is in the focal plane of the objective is reproduced by both detection arrangements in conjunction with the corresponding single-photon or multi-photon absorption. By recording several optical sections in the xy plane at different depths z of the sample, a three-dimensional image of the sample can then be generated with the aid of a computer.
The LSM is therefore suitable for examining thick specimens. The excitation wavelengths are determined by the dye used with its specific absorption properties. Dichroic filters matched to the emission properties of the dye ensure that only the fluorescent light emitted by the respective dye is measured by the point detector.
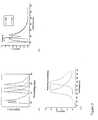
In biomedizinischen Applikationen werden zur Zeit mehrere verschiedeneZellregionen mit verschiedenen Farbstoffen gleichzeitig markiert(Multifluoreszenz). Die einzelnen Farbstoffe können mit den Stand derTechnik entweder aufgrund verschiedener Absorptionseigenschaften oderEmissionseigenschaften (Spektren) getrennt nachgewiesen werden (Abb 3a).Aufgetragen sind beispielhaft Emissionssignale in Abhängigkeit von derWellenlänge für verschiedene Farbstoffe (1-4). Zum getrennten Nachweiserfolgt eine zusätzliche Aufspaltung des Fluoreszenzlichts von mehrerenFarbstoffen mit den Nebenstrahlteilern (DBS) und eine getrennte Detektionder einzelnen Farbstoffemissionen in verschiedenen Punktdetektoren (PMTx). Eine flexible Anpassung der Detektion und der Anregung anentsprechende neue Farbstoffeigenschaften durch den Anwender ist mit deroben beschriebenen Anordnung nicht möglich. Statt dessen müssen für jeden(neuen) Farbstoff neue dichroitische Strahlteiler und Blockfilter kreiert werden.Several different ones are currently used in biomedical applicationsCell regions marked with different dyes at the same time(Multi fluorescence). The individual dyes can with the state of theTechnique either based on different absorption properties orEmission properties (spectra) can be detected separately (Fig. 3a).Emission signals are plotted as a function of the exampleWavelength for different dyes (1-4). For separate proofthere is an additional splitting of the fluorescent light from severalDyes with the secondary beam splitter (DBS) and a separate detectionof individual dye emissions in different point detectors (PMTx). Flexible adaptation of detection and excitationcorresponding new dye properties by the user is with theThe arrangement described above is not possible. Instead, everyone has to(new) dye new dichroic beam splitters and block filters can be created.
In einer bekannten Anordnung wird das Fluoreszenzlicht mit Hilfe einesPrismas spektral aufgespalten. Das Verfahren unterscheidet sich von deroben beschriebenen Anordnung mit dichroitischen Filtern nur dadurch, dassder verwendete Filter in seiner Charakteristik einstellbar ist. Es wird jedochweiterhin pro Punktdetektor vorzugsweise das Emissionsband einesFarbstoffs aufgezeichnet.In a known arrangement, the fluorescent light is switched off using aPrism spectrally split. The process differs from thatArrangement described above with dichroic filters only in thatthe characteristics of the filter used can be adjusted. However, it willfurthermore preferably the emission band of one for each point detectorDye recorded.
Eine schnelle lokale Messung des Emissionsspektrums ist mit beidenAnordnungen nur bedingt möglich, da die Einstellung des Emissionsbereichesauf mechanischen Bewegungen des dichroitischen Filters bzw. von Blendenberuht und somit der maximale spektrale Auflösung auf einige 5nm begrenztist. Eine hohe spektrale Auflösung wird z.B. dann benötigt wenn sich dieEmissionsspektren wie in Abb. 3b dargestellt überlagern. Abb. 3b zeigt einsolches Verhalten von zwei in der Natur vorkommenden Farbstoffen CFP undGFP. Diese Farbstoffe sind zur Untersuchung von Lebendpräparatenbesonders geeignet da sie keine toxischen Wirkungen auf die zuuntersuchenden Proben ausüben.A quick local measurement of the emission spectrum is possible with bothArrangements are only possible to a limited extent because the emission range is seton mechanical movements of the dichroic filter or diaphragmsbased and thus the maximum spectral resolution limited to a few 5nmis. A high spectral resolution is e.g. then needed if theSuperimpose emission spectra as shown in Fig. 3b. Fig. 3b shows asuch behavior of two naturally occurring dyes CFP andGFP. These dyes are used to examine live specimensParticularly suitable as it has no toxic effects on the bodyexaminating samples.
Ist die Lage des Emissionsspektrums der verwendeten Farbstoffe unbekanntoder tritt eine von der Umgebung abhängige Verschiebung desEmissionsspektrums (Abb. 3c) auf, so ist eine hochaufgelöste Detektion derFarbstofffluoreszenzen notwendig. Die Wellenlängenverschiebung kann biszu mehreren 10 nm betragen. Zur Vermessung des Emissionsspektrums inder Probe werden heutzutage Spektrometer auch in Verbindung mit einemLSM eingesetzt. Hierbei wird statt eines Punktdetektors ein herkömmlichesmeist hochauflösendes Spektrometer eingesetzt (Patent Dixon, et al. US5,192,980). Diese können jedoch nur punktuell oder gemittelt über ein Gebietein Emissionsspektrum aufzeichnen. Es handelt sich also um eine Art derSpektroskopie. Zusätzlich wird das zumeist schwache Fluoreszenzsignal derProbe auf eine große Anzahl von Einzelkanälen im Spektrometer (meist 512oder 1024 Einzelkanäle) verteilt bzw. wird ein schmales Fluoreszenzbandentsprechend der spektralen Auflösung detektiert. Deshalb ist das Signal proEinzelkanal äußerst gering und unter Umständen nicht mehr detektierbar.The location of the emission spectrum of the dyes used is unknownor occurs a displacement of theEmission spectrum (Fig. 3c), so is a high-resolution detection of theDye fluorescence necessary. The wavelength shift can be up toto be several 10 nm. To measure the emission spectrum inNowadays, the sample is also used in conjunction with a spectrometerLSM used. This is a conventional one instead of a point detectormostly high-resolution spectrometer used (Patent Dixon, et al. US5,192,980). However, these can only be spotted or averaged over an arearecord an emission spectrum. So it's a kind ofSpectroscopy. In addition, the mostly weak fluorescence signal of theSample on a large number of individual channels in the spectrometer (mostly 512or 1024 individual channels) distributed or becomes a narrow fluorescence banddetected according to the spectral resolution. Therefore the signal is proSingle channel extremely small and possibly no longer detectable.
Aufgabe der Erfindung ist daher die Schaffung eines neuen Verfahrens zureffizienten spektral aufgelösten Detektion von Fluoreszenzfarbstoffen miteinem Zeilendetektor. Die spektrale Auflösung ist bei den oben dargestelltenoptischen Anordnungen durch die Anzahl der Einzelkanäle festgelegt. Könnennicht alle Einzelkanäle des Detektor simultan ausgelesen werden, so erfolgtnach dem Stand ein sequentielles Auslesen der Einzelkanäle so genanntesmultiplexen. Das Multiplexen kann zum einem während der Pixelverweilzeitbeim Scannen über eine Probe erfolgen. Dies hat den Nachteil, dass sich dieIntegrationszeit pro Einzelkanal in dem ein Signal detektiert werden kann umdie Anzahl der Multiplexstellungen verringert. Zusätzlich bei der Vermessungbreiter Fluoreszenzspektren geht das Signal in den nicht ausgelesenenEinzelkanälen verloren. In einer weiteren Methode des Multiplexens könnendie Signale der Einzelkanäle jeweils zwischengespeichert werden. Dieeinzelnen Speicher werden dann nacheinander ausgelesen. Während derAuslesezeit können jedoch keine neuen Daten aufgenommen werden.Deshalb würde sich bei dieser Art des Multiplexens dieAuslesegeschwindigkeit des Zeilendetektors verringern. Dieerfindungsgemäße Methode bzw. Anordnung hat somit folgende Aufgaben:
In all den o.g. Systemen werden Fluoreszenzfarbstoffe zur spezifischenMarkierung der Präparate eingesetzt. Die o.g. Aufgabe wird durch Verfahrenund Anordnungen gemäß den unabhängigen Patentansprüchen gelöst.
Bevorzugte Weiterbildungen sind Gegenstand der abhängigen Ansprüche.In all of the above systems, fluorescent dyes are used for the specific labeling of the preparations. The above object is achieved by methods and arrangements according to the independent claims.
Preferred developments are the subject of the dependent claims.
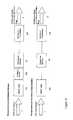
Hintergrund des erfindungsgemäßen Verfahrens ist eine spektralaufgespaltete Detektion der Fluoreszenz, wobei über verschiedenenSpektralkomponenten summiert wird. Dazu wird das Emissionslicht imScanmodul oder im Mikroskop (bei Mehrphotonen-Absorption) mit Hilfe einesElementes zur Trennung der Anregungsstrahlung von der detektiertenStrahlung wie dem Hauptfarbteiler (MDB) oder einem AOTF gemäß 7346DEoder gemäß 7323DE vom Anregungslicht abgespalten. Bei Durchlichtanordnungenkann ein derartiges Element auch völlig entfallen. EinBlockschaltbild der nun folgenden Detektoreinheit ist in Abb. 4 dargestellt.Das Licht der Probe wird mit Hilfe einer abbildenden Optik PO bei konfokalerDetektion durch eine Blende (Pinhole) PH fokussiert, wodurch Fluoreszenz,die außerhalb des Fokus entstand, unterdrückt wird. Bei einernichtdescannten Detektion entfällt die Blende. Das Licht wird nun mit Hilfeeines winkeldispersiven Elements Dl in seine Spektralanteile zerlegt. Alswinkeldispersive Elemente kommen Prismen, Gitter und beispielsweiseakusto optische Elemente in Frage. Das vom dispersiven Element in seinespektralen Komponenten aufgespaltete Licht wird im Anschluß auf einenZeilendetektor DE abgebildet. Dieser Zeilendetektor DE mißt also dasEmissionssignal in Abhängigkeit von der Wellenlänge und wandelt dies inelektrische Signale um. Mit Hilfe eines erfindungsgemäßen, im folgendennäher erläuterten Binningverfahrens erfolgt ein Zusammenschalten voneinzelnen Kanälen, d.h. eine Summation über einzelne Kanäle desZeilendetektors. Zusätzlich kann der Detektionseinheit noch ein Linienfilter zurUnterdrückung der Anregungswellenlängen vorgeschaltet werden.The background of the method according to the invention is spectralsplit detection of fluorescence, with differentSpectral components is summed. For this purpose, the emission light in theScan module or in a microscope (with multiphoton absorption) with the help of aElement for separating the excitation radiation from the detected oneRadiation such as the main color splitter (MDB) or an AOTF according to 7346DEor split off from the excitation light according to 7323DE. With transmitted light arrangementssuch an element can also be completely eliminated. OnThe block diagram of the following detector unit is shown in Fig. 4.The light of the sample is confocal with the help of an imaging optic PODetection through an aperture (pinhole) PH focused, causing fluorescence,that was created out of focus is suppressed. At athe aperture is not required for unscanned detection. The light is now usingof an angle-dispersive element Dl broken down into its spectral components. Asangle-dispersive elements come prisms, grids and for exampleacousto-optical elements in question. That from the dispersive element in hisspectral components split light is then on aLine detector DE shown. This line detector DE therefore measures thatEmission signal depending on the wavelength and converts this intoelectrical signals around. With the help of an inventive, in the followingbinning process explained in more detail, an interconnection ofindividual channels, i.e. a summation over individual channels of theLine detector. In addition, a line filter can also be used for the detection unitSuppression of the excitation wavelengths are connected upstream.
Eine mögliche Ausführungsform des optischen Strahlenganges der in Abb. 4im Blockschaltbild gezeigten Detektoreinheit ist in Abb. 5 dargestellt. DerAufbau beschreibt im wesentlichen einen Cerny Turner Aufbau. Bei einer konfokalen Detektion wird das Licht L der Probe mit der Pinholeoptik POdurch die konfokale Blende PH fokussiert. Bei einer nichtdescanntenDetektion im Falle einer Mehrphotonen-Absorption kann diese Blendeentfallen. Der erste abbildende Spiegel M2 kollimiert das Fluoreszenzlicht.Anschließend trifft das Licht auf ein Liniengitter G, beispielsweise ein Gittermit einer Linienzahl von 651 Linien pro mm Das Gitter beugt das Lichtentsprechend seiner Wellenlänge in verschiedene Richtungen. Der zweiteabbildende Spiegel M1 fokussiert die einzelnen spektral aufgespaltenenWellenlängenanteile auf die entsprechenden Kanäle des Zeilendetektors DEBesonders vorteilhaft ist der Einsatz eines Zeilen-Sekundärelektronenvervielfachersder Firma Hamamatsu H7260. Der Detektor besitzt32 Kanäle und eine hohe Empfindlichkeit. Der freie Spektralbereich der obenbeschriebenen Ausführungsform beträgt etwa 350 nm. Der freie Spektralbereichwird in dieser Anordnung gleichmäßig auf die 32 Kanäle desZeilendetektors verteilt, wodurch sich eine optische Auflösung von etwa 10nm ergibt. Der Einsatz der Einheit in einem bildgebenden System istvorteilhaft, da das Signal pro Detektionskanal aufgrund des relativ breitendetektierten Spektralbandes noch relativ groß ist. Eine Verschiebung desFluoreszenzspektrums kann durch eine Verdrehung beispielsweise desGitters, von M1, von M2, um den Winkel phi und/oder durch eineVerschiebung des Zeilenempfängers in Richtung der Wellenlängenaufspaltungum dl erfolgen (siehe Abb).A possible embodiment of the optical beam path of the in Fig. 4Fig. 5 shows the detector unit shown in the block diagram. Of theStructure essentially describes a Cerny Turner structure. At aconfocal detection is the light L of the sample with the pinhole optics POfocused through the confocal aperture PH. With an undescannedDetection in the event of multi-photon absorption can be this apertureomitted. The first imaging mirror M2 collimates the fluorescent light.The light then strikes a line grating G, for example a gratingwith a line count of 651 lines per mm. The grating diffracts the lightin different directions according to its wavelength. The secondimaging mirror M1 focuses the individual spectrally splitWavelength components on the corresponding channels of the line detector DEThe use of a line secondary electron multiplier is particularly advantageousfrom the company Hamamatsu H7260. The detector owns32 channels and high sensitivity. The free spectral range of the abovedescribed embodiment is about 350 nm. The free spectral rangeIn this arrangement, the 32 channels of theLine detector distributed, resulting in an optical resolution of about 10nm results. The use of the unit in an imaging system isadvantageous because the signal per detection channel due to the relatively widedetected spectral band is still relatively large. A shift in theFluorescence spectrum can be twisted by, for example, theGrid, from M1, from M2, to the angle phi and / or through oneShift of the line receiver in the direction of the wavelength splittingaround dl (see fig).
Die spektrale Auflösung ist bei den oben dargestellten optischenAnordnungen durch die Anzahl der Einzelkanäle festgelegt. In den obenbeschriebenen Ausführungsformen detektiert jeder Einzelkanal einSpektralband des Emissionsspektrums mit einer spektralen Breite von ca. 10nm. Können nicht alle Einzelkanäle des Detektor simultan ausgelesenwerden, so erfolgt nach dem Stand ein sequentielles Auslesen derEinzelkanäle (Multiplexen).
Erfindungsgemäß wird hierbei über Einzelkanäle mit verschiedenen Musternsummiert.The spectral resolution in the optical arrangements shown above is determined by the number of individual channels. In the above-described embodiments, each individual channel detects a spectral band of the emission spectrum with a spectral width of approximately 10 nm. If not all individual channels of the detector can be read out simultaneously, according to the state of the art, the individual channels are read out sequentially (multiplexing).
According to the invention, this is summed up over individual channels with different patterns.
Können beispielsweise 8 Kanäle simultan ausgelesen werden, so erfolgt beiVerwendung des oben beschriebenen 32 Kanaldetektors eine Summationüber jeweils 4 Kanäle. Das Auslesen der gesamten N=32 Kanäle erfolgt, dannin n=4 Schritten, wobei das Summationsfenster um jeweils einen Einzelkanal(L/n=4/4=1) verschoben wird. Abb. 6 zeigt schematisch jeweils in einer Zeiledie verschiedenen Einzelkanäle des Zeilendetektors, deren N Einzelsignale Centsprechen.
Die gemessenen Signale der Einzelkanäle werden mitck,j (in Abb. 6 alsFor example, if 8 channels can be read out simultaneously, the 32 channel detector described above is used for summation over 4 channels each. The entire N = 32 channels are read out, then in n = 4 steps, the summation window being shifted by one individual channel (L / n = 4/4 = 1). Fig. 6 shows schematically in each line the different individual channels of the line detector, whose N individual signals correspond to C.
The measured signals of the individual channels arec c, j (in Fig. 6 as
Blöcke dargestellt) bezeichnet, wobeik = 1..N die Kanalnummer undj = 0..n-1die Vielfachen der Verschiebung L/n sind. Fällt das Signal am Rand desDetektors nicht ab, so kann wie in Abb. 6 grau dargestellt, der letzteEinzelkanal des Detektors so abgedeckt (ausgeblendet) werden, dass nureine Breite von L/n zur Messung zur Verfügung steht. Dies ist zur Vermeidungvon Artefakten bei der Berechnung notwendig.
Zur Berechnung der N mal n SpektralwerteSm werden nun Differenzen vonSummen über Einzelkanäle nach folgendem Algorithmus gebildet:


To calculate the N times n spectral valuesSm , differences of sums over individual channels are now formed according to the following algorithm:
Die so berechneten Spektralwerte S (Zwischenwerte) können im Anschlußgraphisch auf dem angezeigten Bild, z.B. während eines Spektralscansdargestellt werden.The spectral values S (intermediate values) calculated in this way can subsequentlygraphically on the displayed image, e.g. during a spectral scanbeing represented.
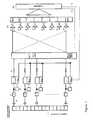
Die Summation über verschiedene Einzelkanäle und damit die Messung derck,j ist in Abb. 7 schematisch dargestellt. Die Signale der Einzelkanälewerden hierbei wiederum mit einem Verstärker A in Spannungssignale transformiert.Anschließend werden die einzelnen Spannungssignale in einemIntegrator 1 während der Pixelverweilzeit aufintegriert.
Dem Integrator nachgeschaltet ist ein Komparator K der einen Vergleich desaufintegrierten Signals mit einem Referenzsignal durchführt.
Falls das aufintegrierte Signal kleiner als die Komparatorschwelle ist, sowürde in dem entsprechenden Einzelkanal kein oder ein zu kleinesFluoreszenzsignal gemessen. In einem solchen Falle soll das Signal desEinzelkanals nicht weiter verarbeitet werden, da dieser Kanal nur einenRauschanteil zum Gesamtsignal beiträgt. Der Komparator betätigt in einemsolchen Falle über SR einen Schalter S und der Einzelkanal wird für dengerade gemessenen Pixel ausgeschalten. Mit Hilfe der Komparatoren inKombination mit den Schaltern wird also automatisch der für den geradegemessenen Bildpunkt relevante Spektralbereich ausgewählt.The summation over various individual channels and thus the measurement of theck, j is shown schematically in Fig. 7. The signals of the individual channels are in turn transformed with an amplifier A into voltage signals. The individual voltage signals are then integrated in an
A comparator K which compares the integrated signal with a reference signal is connected downstream of the integrator.
If the integrated signal is smaller than the comparator threshold, then no or too small a fluorescence signal would be measured in the corresponding individual channel. In such a case, the signal of the individual channel should not be processed further, since this channel only contributes a noise component to the overall signal. In such a case, the comparator actuates a switch S via SR and the individual channel is switched off for the pixel just measured. With the aid of the comparators in combination with the switches, the spectral range relevant for the pixel currently being measured is automatically selected.
Im Anschluß kann das integrierte Spannungssignal der Einzelkanäle miteinem mit dem Switch-Register SR verbundenen Demultiplexer MPX aufverschiedene Summenpunkte durch das Register Reg1 geschaltet werden. InAbb. 7 sind 8 verschiedene Summenpunkte SP eingezeichnet. Die Steuerungdes Registers Reg1 erfolgt durch eine Steuerleitung V1 vom Rechner. DieSteuerung des Summationsmusters kann pixelgenau erfolgen, d.h. in einemZeitraum von einigen µs.The integrated voltage signal of the individual channels can then be useda demultiplexer MPX connected to the switch register SRdifferent total points can be switched through the register Reg1. InFig. 7 shows 8 different sum points SP. The controlof the register Reg1 is carried out by a control line V1 from the computer. TheThe summation pattern can be controlled with pixel accuracy, i.e. in onePeriod of a few µs.
Jeweils ein Summenpunkt SP bildet jeweils einen Teil desSummationsverstärkers SV, der die Summation der angewähltenEinzelkanäle durchführt. Insgesamt sind in Abb. 7 8 Summenverstärker SVdargestellt. Die Summensignaleck,j werden im Anschluß mit jeweils einemAnalog-Digital-Wandler in digitale Signale umgewandelt und vom Computeroder DSP weiterverarbeitet. Die Summenverstärker SV können auch miteiner veränderlichen nichtlinearen Kennlinie betrieben.A sum point SP forms part of the summation amplifier SV, which carries out the summation of the selected individual channels. A total of 8 sum amplifiers SV are shown in Fig. 7. The sum signalsck, j are then converted into digital signals with an analog-digital converter and further processed by the computer or DSP. The sum amplifier SV can also be operated with a variable non-linear characteristic.
In der oben beschriebenen Anordnung wurde eine Integratorschaltung zurDetektion der Einzelkanalsignale verwendet. Uneingeschränkt kann jedochauch eine Photonenzählung in den Einzelkanälen erfolgen.In the arrangement described above, an integrator circuit forDetection of the single channel signals used. Unrestrictedly, howeverphoton counting is also carried out in the individual channels.
Eine Änderung des Summationsmusters durch V1 kann bildweise nach derAufnahme oder während des Scannens eines Bildpunktes bzw. einer Bildzeile/ -spalte erfolgen Die Anfordungen an die Schaltgeschwindigkeit des MPXhängen von der Art der Einstellung ab. Erfolgt beispielsweise einebildpunktweise Einstellung so muß der Scan innerhalb der Integrationszeit fürdiesen Bildpunkt erfolgen (also in einigen Mikrosekunden). Erfolgt dieEinstellung bildweise so muß die Scan innerhalb von einigen Millisekungenbis Sekunden erfolgen.
Die Berechnung der Signale der Einzelkanäle erfolgt mit dem obenbeschriebenen Algorithmus unter Verwendung derck,j.A change of the summation pattern by V1 can be made image-wise after the recording or during the scanning of an image point or an image line / column. The requirements for the switching speed of the MPX depend on the type of setting. If, for example, a pixel-by-pixel setting is made, the scan must take place within the integration time for this pixel (ie in a few microseconds). If the setting is made image-wise, the scan must take place within a few milliseconds to seconds.
The signals of the individual channels are calculated using the algorithm described above using theck, j .
In den beide oben beschriebenen Anordnungen wurde vorzugsweise eineIntegratorschaltung zur Detektion der Einzelkanalsignale verwendet.In the two arrangements described above, one was preferredIntegrator circuit used for the detection of the single channel signals.
Uneingeschränkt kann jedoch auch eine Photonenzählung in denEinzelkanälen erfolgen und die Photonenzahlen addiert werden.
Vorteilhaft erfolgt erfindungsgemäß eine speichermäßige bildpunktweiseZuordnung der erfaßten jeweiligen Wellenlängenverteilung ( λ- stack) zurjeweiligen Bildpunktkoordinate x,y oder z und/ oder eine zusätzliche zeitlicheZuordnung bei gemessenen zeitveränderlichen Abläufen.However, it is also possible to count the photons in the individual channels without restrictions and add the number of photons.
According to the invention, a memory-like pixel-by-pixel assignment of the respective wavelength distribution (λ-stack) to the respective pixel coordinate x, y or z and / or an additional time assignment in the case of measured time-varying processes takes place.
Claims (12)
Translated fromGermanwobei das von der Probe rückgestreute, reflektierte und/ oder fluoreszierteund/ oder transmittierte Signal mit einem ortsauflösenden Detektor inmehreren Kanälen detektiert wird, indem die von der Probe kommendeStrahlung spektral aufgespalten auf den Detektor abgebildet wird, , wobeieine Verknüpfung von Detektionskanälen erfolgt, so daß die Anzahl derausgelesenen und weiterverarbeiteten Meßwerte kleiner ist als die Zahl derDetektionskanäleMethod for the optical detection of characteristic quantities of an illuminated sample,
wherein the backscattered, reflected and / or fluorescent and / or transmitted signal is detected in several channels with a spatially resolving detector by imaging the radiation coming from the sample spectrally split onto the detector, whereby detection channels are linked, so that the number of readings and further processed measured values is smaller than the number of detection channels
wobei die Verschiebung um mindestens einen Detektorkanal erfolgtMethod according to one of the preceding claims,
wherein the shift takes place by at least one detector channel
wobei die Größe der Verschiebung veränderbar istMethod according to one of the preceding claims,
the size of the shift is changeable
wobei mittels eines Algorithmus aus den ausgelesenen MeßwertenZwischenwerte zum Zwecke des effizienten Auslesens einer Detektorzeileermittelt werden.Method according to one of the preceding claims,
whereby, using an algorithm, intermediate values are determined from the read measured values for the purpose of efficiently reading a detector line.
spektral aufgelöste Messung von Spektren über ein dem Detektorvorgeordnetes dispersives Element erfolgtMethod according to one of the preceding claims, wherein a
spectrally resolved measurement of spectra takes place via a dispersive element arranged upstream of the detector
wobei die spektral aufgespaltene Strahlung relativ zum Detektor verschobenwird.Method according to one of the preceding claims,
wherein the spectrally split radiation is shifted relative to the detector.
das dispersive Element um mindestens eine Achse schwenkbar istMethod according to one of the preceding claims, wherein
the dispersive element is pivotable about at least one axis
bei feststehendem dispersiven Element in mindestens einer seinerSchwenkachsen die räumlich verändernde Wirkung der Schwenkung in dieserAchse durch eine Scaneinheit und/oder Verschiebung des Detektors erfolgt.Method according to one of the preceding claims, wherein
in the case of a fixed dispersive element in at least one of its pivot axes, the spatially changing effect of the pivoting in this axis takes place by means of a scanning unit and / or displacement of the detector.
Applications Claiming Priority (2)
| Application Number | Priority Date | Filing Date | Title |
|---|---|---|---|
| DE10151216ADE10151216A1 (en) | 2001-10-16 | 2001-10-16 | Method for the optical detection of characteristic quantities of an illuminated sample |
| DE10151216 | 2001-10-16 |
Publications (2)
| Publication Number | Publication Date |
|---|---|
| EP1302804A2true EP1302804A2 (en) | 2003-04-16 |
| EP1302804A3 EP1302804A3 (en) | 2004-09-22 |
Family
ID=7702774
Family Applications (1)
| Application Number | Title | Priority Date | Filing Date |
|---|---|---|---|
| EP02021433AWithdrawnEP1302804A3 (en) | 2001-10-16 | 2002-09-25 | Method for the optical determination of characteristical parameters of a sample |
Country Status (4)
| Country | Link |
|---|---|
| US (1) | US6703621B2 (en) |
| EP (1) | EP1302804A3 (en) |
| JP (2) | JP2003185582A (en) |
| DE (1) | DE10151216A1 (en) |
Families Citing this family (28)
| Publication number | Priority date | Publication date | Assignee | Title |
|---|---|---|---|---|
| EP2264428B1 (en) | 1997-01-31 | 2017-05-03 | Xy, Llc | Optical apparatus with focussing reflector for converging radiation onto a flow of particles |
| US6071689A (en) | 1997-12-31 | 2000-06-06 | Xy, Inc. | System for improving yield of sexed embryos in mammals |
| US6149867A (en) | 1997-12-31 | 2000-11-21 | Xy, Inc. | Sheath fluids and collection systems for sex-specific cytometer sorting of sperm |
| US7208265B1 (en) | 1999-11-24 | 2007-04-24 | Xy, Inc. | Method of cryopreserving selected sperm cells |
| US7713687B2 (en)* | 2000-11-29 | 2010-05-11 | Xy, Inc. | System to separate frozen-thawed spermatozoa into x-chromosome bearing and y-chromosome bearing populations |
| CA2822983C (en) | 2000-11-29 | 2017-05-09 | Xy, Llc | System to separate frozen-thawed spermatozoa into x-chromosome bearing and y-chromosome bearing populations |
| WO2002046710A1 (en)* | 2000-12-08 | 2002-06-13 | Foundation For Research And Technology-Hellas | An imaging method and apparatus for the non-destructie analysis of paintings and monuments |
| WO2004009237A2 (en)* | 2002-07-22 | 2004-01-29 | Xy, Inc. | Sperm cell process system |
| EP2284256A3 (en)* | 2002-08-01 | 2012-08-29 | Xy, Llc | Low pressure sperm separation system |
| US8486618B2 (en) | 2002-08-01 | 2013-07-16 | Xy, Llc | Heterogeneous inseminate system |
| MXPA05001654A (en) | 2002-08-15 | 2005-10-18 | Xy Inc | High resolution flow cytometer. |
| US7169548B2 (en) | 2002-09-13 | 2007-01-30 | Xy, Inc. | Sperm cell processing and preservation systems |
| MX350776B (en) | 2003-03-28 | 2017-09-15 | Inguran Llc * | Apparatus, methods and processes for sorting particles and for providing sex-sorted animal sperm. |
| NZ544103A (en)* | 2003-05-15 | 2010-10-29 | Xy Llc | Efficient haploid cell sorting for flow cytometer systems |
| DE10343276A1 (en)* | 2003-09-18 | 2005-04-14 | Carl Zeiss Jena Gmbh | Multi-photon fluorescence microscopy |
| JP2005116251A (en)* | 2003-10-06 | 2005-04-28 | Nikon Corp | Receiver and fluorescent confocal microscope |
| NZ550196A (en) | 2004-03-29 | 2010-11-26 | Inguran Llc | Method for sorting sperm cells into X or Y chromosome-bearing enriched populations comprising a composition which inhibits motility and a DNA-selective dye |
| DE102004031049A1 (en)* | 2004-06-25 | 2006-01-12 | Leica Microsystems Cms Gmbh | Optical arrangement for spectrally selective detection of light of a light beam |
| AU2005266930B2 (en) | 2004-07-22 | 2010-09-16 | Inguran, Llc | Process for enriching a population of sperm cells |
| JP4720146B2 (en)* | 2004-10-28 | 2011-07-13 | 株式会社ニコン | Spectroscopic apparatus and spectral system |
| JP4987233B2 (en)* | 2005-01-06 | 2012-07-25 | オリンパス株式会社 | Laser scanning microscope |
| DE102005046510B4 (en)* | 2005-09-29 | 2022-02-17 | Leica Microsystems Cms Gmbh | Microscope system for FCS measurements |
| JP5307629B2 (en)* | 2009-05-22 | 2013-10-02 | オリンパス株式会社 | Scanning microscope equipment |
| WO2013188602A1 (en)* | 2012-06-13 | 2013-12-19 | Kla-Tencor Corporation | Optical surface scanning systems and methods |
| JP6292759B2 (en)* | 2013-03-12 | 2018-03-14 | 住友重機械工業株式会社 | Mark sensor and mark determination method using light detection element |
| EP3513235B1 (en) | 2016-09-16 | 2023-06-07 | Leica Microsystems CMS GmbH | Light microscope |
| EP3538941B1 (en) | 2016-11-10 | 2025-04-23 | The Trustees of Columbia University in the City of New York | Rapid high-resolution imaging methods for large samples |
| DE102021126145A1 (en)* | 2021-10-08 | 2023-04-13 | Heidelberg Engineering Gmbh | Arrangement with a detector |
Citations (4)
| Publication number | Priority date | Publication date | Assignee | Title |
|---|---|---|---|---|
| DE4017317A1 (en)* | 1990-05-30 | 1991-12-05 | Bodenseewerk Perkin Elmer Co | System for enhancing spectrometer resolution - shifts spectrum periodically relative to detector array |
| WO2000006979A1 (en)* | 1998-07-31 | 2000-02-10 | The Research Foundation Of State University Of New York | Sensors for detection and spectroscopy |
| WO2002012864A1 (en)* | 2000-08-08 | 2002-02-14 | Carl Zeiss Jena Gmbh | Method and assembly for increasing the spectral and spatial resolution of a detector |
| WO2002012863A1 (en)* | 2000-08-08 | 2002-02-14 | Carl Zeiss Jena Gmbh | Method and assembly for detecting the wavelength-dependent behavior of an illuminated specimen |
Family Cites Families (20)
| Publication number | Priority date | Publication date | Assignee | Title |
|---|---|---|---|---|
| FR2615280B1 (en)* | 1987-05-11 | 1996-07-19 | Canon Kk | DEVICE FOR MEASURING THE MOTION DISTANCE RELATIVE OF TWO MOBILE OBJECTS IN RELATION TO THE OTHER |
| EP0411966B1 (en)* | 1989-08-04 | 1994-11-02 | Canon Kabushiki Kaisha | Position detection method and apparatus |
| ATE89411T1 (en)* | 1989-11-02 | 1993-05-15 | Heidenhain Gmbh Dr Johannes | POSITION MEASUREMENT DEVICE. |
| GB9000740D0 (en)* | 1990-01-12 | 1990-03-14 | Univ Salford | Measurement of luminescence |
| DE4111903A1 (en)* | 1991-04-12 | 1992-10-15 | Bayer Ag | SPECTROSCOPY-CORRECTED LIGHT-SCREEN MICROSCOPY |
| US6134003A (en)* | 1991-04-29 | 2000-10-17 | Massachusetts Institute Of Technology | Method and apparatus for performing optical measurements using a fiber optic imaging guidewire, catheter or endoscope |
| US5198816A (en)* | 1991-08-30 | 1993-03-30 | Eg&G, Inc. | General purpose system for digitizing an analog signal |
| GB9320261D0 (en)* | 1993-10-01 | 1993-11-17 | Unicam Ltd | Spectrophotometer |
| US5742389A (en)* | 1994-03-18 | 1998-04-21 | Lucid Technologies Inc. | Spectrophotometer and electro-optic module especially suitable for use therein |
| US5673144A (en)* | 1994-09-14 | 1997-09-30 | International Business Machines, Corporation | Oblique viewing microscope system |
| JP3095970B2 (en)* | 1995-02-06 | 2000-10-10 | 日本分光株式会社 | Deconvolution processing method and apparatus |
| US5627639A (en)* | 1995-06-06 | 1997-05-06 | Lockheed Missiles & Space Company, Inc. | Coded aperture imaging spectrometer |
| US6151185A (en)* | 1996-09-05 | 2000-11-21 | Canon Kabushiki Kaisha | Position detecting apparatus, positioning apparatus, and information recording apparatus using the same |
| US6167173A (en)* | 1997-01-27 | 2000-12-26 | Carl Zeiss Jena Gmbh | Laser scanning microscope |
| DE19707227A1 (en)* | 1997-02-24 | 1998-08-27 | Bodenseewerk Perkin Elmer Co | Light scanner |
| JP2888813B2 (en)* | 1997-08-29 | 1999-05-10 | 株式会社東芝 | High resolution pixel output method and apparatus |
| US6097034A (en)* | 1998-02-12 | 2000-08-01 | Instrumentarium Oy | Radiation source assembly and transducer for analyzing gases or other substances |
| US6053613A (en)* | 1998-05-15 | 2000-04-25 | Carl Zeiss, Inc. | Optical coherence tomography with new interferometer |
| US6128078A (en)* | 1999-04-09 | 2000-10-03 | Three Lc, Inc. | Radiation filter, spectrometer and imager using a micro-mirror array |
| DE10004233B4 (en)* | 2000-02-01 | 2005-02-17 | Leica Microsystems Heidelberg Gmbh | The microscope assemblage |
- 2001
- 2001-10-16DEDE10151216Apatent/DE10151216A1/ennot_activeWithdrawn
- 2002
- 2002-01-16USUS10/051,205patent/US6703621B2/ennot_activeExpired - Lifetime
- 2002-09-25EPEP02021433Apatent/EP1302804A3/ennot_activeWithdrawn
- 2002-10-10JPJP2002296999Apatent/JP2003185582A/enactivePending
- 2005
- 2005-12-28JPJP2005377505Apatent/JP2006098419A/enactivePending
Patent Citations (4)
| Publication number | Priority date | Publication date | Assignee | Title |
|---|---|---|---|---|
| DE4017317A1 (en)* | 1990-05-30 | 1991-12-05 | Bodenseewerk Perkin Elmer Co | System for enhancing spectrometer resolution - shifts spectrum periodically relative to detector array |
| WO2000006979A1 (en)* | 1998-07-31 | 2000-02-10 | The Research Foundation Of State University Of New York | Sensors for detection and spectroscopy |
| WO2002012864A1 (en)* | 2000-08-08 | 2002-02-14 | Carl Zeiss Jena Gmbh | Method and assembly for increasing the spectral and spatial resolution of a detector |
| WO2002012863A1 (en)* | 2000-08-08 | 2002-02-14 | Carl Zeiss Jena Gmbh | Method and assembly for detecting the wavelength-dependent behavior of an illuminated specimen |
Also Published As
| Publication number | Publication date |
|---|---|
| JP2003185582A (en) | 2003-07-03 |
| JP2006098419A (en) | 2006-04-13 |
| DE10151216A1 (en) | 2003-04-24 |
| US20030071227A1 (en) | 2003-04-17 |
| US6703621B2 (en) | 2004-03-09 |
| EP1302804A3 (en) | 2004-09-22 |
Similar Documents
| Publication | Publication Date | Title |
|---|---|---|
| EP1264169B1 (en) | Improvement of spectral and/or spatial resolution in a laser scanning microscope | |
| DE10038526B4 (en) | Method and arrangement for recording the wavelength-dependent behavior of an illuminated sample | |
| EP1302804A2 (en) | Method for the optical determination of characteristical parameters of a sample | |
| EP1504300B1 (en) | Method and arrangement for analyzing samples | |
| DE10151217B4 (en) | Method for operating a laser scanning microscope | |
| EP2516993B1 (en) | High-resolution microscope and method for determining the two- or three-dimensional positions of objects | |
| EP3295236B1 (en) | Evaluation of signals of fluorescence scanning microscopy using a confocal laser scanning microscope | |
| DE10033180B4 (en) | Method for the detection of dyes in fluorescence microscopy | |
| EP1396739B1 (en) | Method and arrangement for adjustable modulation of spectral composition and/or intensity of pump light and/or probe light | |
| EP1248132B1 (en) | Method and arrangement for depth resolving optical detection of a probe | |
| EP0977069A2 (en) | Method and apparatus for confocal microscopy | |
| EP3217205A1 (en) | Device and method for multispot scanning microscopy | |
| EP4189358B1 (en) | Method for detecting emission light, detection device and laser scanning microscope | |
| DE10118463A1 (en) | Depth-resolved optical imaging method for use in biological scanning microscopy, uses phase or frequency modulation of the imaging light | |
| DE10227111A1 (en) | Spectral microscope and method for data acquisition with a spectral microscope | |
| WO2004113987A1 (en) | Method to be used in fluorescence microscopy | |
| WO2002014811A1 (en) | Light detector unit and method for detecting luminescence light and confocal microscope for luminescence microscopy | |
| DE102019119147A1 (en) | MICROSCOPE AND METHOD OF MICROSCOPY | |
| DE102023134043A1 (en) | microscope |
Legal Events
| Date | Code | Title | Description |
|---|---|---|---|
| PUAI | Public reference made under article 153(3) epc to a published international application that has entered the european phase | Free format text:ORIGINAL CODE: 0009012 | |
| 17P | Request for examination filed | Effective date:20020925 | |
| AK | Designated contracting states | Designated state(s):AT BE BG CH CY CZ DE DK EE ES FI FR GB GR IE IT LI LU MC NL PT SE SK TR | |
| AX | Request for extension of the european patent | Extension state:AL LT LV MK RO SI | |
| PUAL | Search report despatched | Free format text:ORIGINAL CODE: 0009013 | |
| AK | Designated contracting states | Kind code of ref document:A3 Designated state(s):AT BE BG CH CY CZ DE DK EE ES FI FR GB GR IE IT LI LU MC NL PT SE SK TR | |
| AX | Request for extension of the european patent | Extension state:AL LT LV MK RO SI | |
| RIC1 | Information provided on ipc code assigned before grant | Ipc:7G 01J 3/28 B Ipc:7G 01N 21/64 B Ipc:7G 01J 3/443 B Ipc:7G 01J 3/50 B Ipc:7G 06T 7/00 B Ipc:7G 02B 21/00 A | |
| AKX | Designation fees paid | Designated state(s):AT BE BG CH CY CZ DE DK EE ES FI FR GB GR IE IT LI LU MC NL PT SE SK TR | |
| 17Q | First examination report despatched | Effective date:20090728 | |
| REG | Reference to a national code | Ref country code:HK Ref legal event code:WD Ref document number:1057100 Country of ref document:HK | |
| RAP1 | Party data changed (applicant data changed or rights of an application transferred) | Owner name:CARL ZEISS MICROSCOPY GMBH | |
| STAA | Information on the status of an ep patent application or granted ep patent | Free format text:STATUS: THE APPLICATION IS DEEMED TO BE WITHDRAWN | |
| 18D | Application deemed to be withdrawn | Effective date:20160401 |