EP0871026A2 - Spectrophotometric analysis - Google Patents
Spectrophotometric analysisDownload PDFInfo
- Publication number
- EP0871026A2 EP0871026A2EP98302120AEP98302120AEP0871026A2EP 0871026 A2EP0871026 A2EP 0871026A2EP 98302120 AEP98302120 AEP 98302120AEP 98302120 AEP98302120 AEP 98302120AEP 0871026 A2EP0871026 A2EP 0871026A2
- Authority
- EP
- European Patent Office
- Prior art keywords
- analytes
- concentration
- estimating
- methb
- regression
- Prior art date
- Legal status (The legal status is an assumption and is not a legal conclusion. Google has not performed a legal analysis and makes no representation as to the accuracy of the status listed.)
- Withdrawn
Links
- 238000002798spectrophotometry methodMethods0.000titledescription8
- 238000005259measurementMethods0.000claimsabstractdescription25
- 239000012491analyteSubstances0.000claimsabstractdescription23
- 230000003595spectral effectEffects0.000claimsabstractdescription13
- 239000008280bloodSubstances0.000claimsabstractdescription8
- 210000004369bloodAnatomy0.000claimsabstractdescription8
- 108010061951MethemoglobinProteins0.000claimsdescription39
- 108010003320CarboxyhemoglobinProteins0.000claimsdescription25
- 108010054147HemoglobinsProteins0.000claimsdescription15
- 102000001554HemoglobinsHuman genes0.000claimsdescription15
- INGWEZCOABYORO-UHFFFAOYSA-N2-(furan-2-yl)-7-methyl-1h-1,8-naphthyridin-4-oneChemical compoundN=1C2=NC(C)=CC=C2C(O)=CC=1C1=CC=CO1INGWEZCOABYORO-UHFFFAOYSA-N0.000claimsdescription3
- 108010064719OxyhemoglobinsProteins0.000claimsdescription3
- 108010002255deoxyhemoglobinProteins0.000claimsdescription3
- 238000010238partial least squares regressionMethods0.000claimsdescription2
- 210000000624ear auricleAnatomy0.000abstractdescription3
- 238000000691measurement methodMethods0.000abstract1
- 238000000034methodMethods0.000description18
- 230000009102absorptionEffects0.000description11
- 238000010521absorption reactionMethods0.000description11
- 230000000875corresponding effectEffects0.000description7
- 230000004913activationEffects0.000description5
- 239000002131composite materialSubstances0.000description5
- 238000013186photoplethysmographyMethods0.000description5
- 230000006870functionEffects0.000description4
- 238000012108two-stage analysisMethods0.000description3
- 238000002835absorbanceMethods0.000description1
- 238000004458analytical methodMethods0.000description1
- 238000004364calculation methodMethods0.000description1
- 238000010205computational analysisMethods0.000description1
- 230000002596correlated effectEffects0.000description1
- 230000009849deactivationEffects0.000description1
- 238000010586diagramMethods0.000description1
- 210000001061foreheadAnatomy0.000description1
- 230000031700light absorptionEffects0.000description1
- 238000012806monitoring deviceMethods0.000description1
- 230000008569processEffects0.000description1
- 230000010349pulsationEffects0.000description1
- 238000000611regression analysisMethods0.000description1
- 239000013598vectorSubstances0.000description1
Images


Classifications
- G—PHYSICS
- G01—MEASURING; TESTING
- G01N—INVESTIGATING OR ANALYSING MATERIALS BY DETERMINING THEIR CHEMICAL OR PHYSICAL PROPERTIES
- G01N33/00—Investigating or analysing materials by specific methods not covered by groups G01N1/00 - G01N31/00
- G01N33/48—Biological material, e.g. blood, urine; Haemocytometers
- G01N33/50—Chemical analysis of biological material, e.g. blood, urine; Testing involving biospecific ligand binding methods; Immunological testing
- G01N33/72—Chemical analysis of biological material, e.g. blood, urine; Testing involving biospecific ligand binding methods; Immunological testing involving blood pigments, e.g. haemoglobin, bilirubin or other porphyrins; involving occult blood
- G01N33/721—Haemoglobin
- A—HUMAN NECESSITIES
- A61—MEDICAL OR VETERINARY SCIENCE; HYGIENE
- A61B—DIAGNOSIS; SURGERY; IDENTIFICATION
- A61B5/00—Measuring for diagnostic purposes; Identification of persons
- A61B5/145—Measuring characteristics of blood in vivo, e.g. gas concentration or pH-value ; Measuring characteristics of body fluids or tissues, e.g. interstitial fluid or cerebral tissue
- A61B5/1455—Measuring characteristics of blood in vivo, e.g. gas concentration or pH-value ; Measuring characteristics of body fluids or tissues, e.g. interstitial fluid or cerebral tissue using optical sensors, e.g. spectral photometrical oximeters
- G—PHYSICS
- G01—MEASURING; TESTING
- G01N—INVESTIGATING OR ANALYSING MATERIALS BY DETERMINING THEIR CHEMICAL OR PHYSICAL PROPERTIES
- G01N21/00—Investigating or analysing materials by the use of optical means, i.e. using sub-millimetre waves, infrared, visible or ultraviolet light
- G01N21/17—Systems in which incident light is modified in accordance with the properties of the material investigated
- G01N21/25—Colour; Spectral properties, i.e. comparison of effect of material on the light at two or more different wavelengths or wavelength bands
- G01N21/31—Investigating relative effect of material at wavelengths characteristic of specific elements or molecules, e.g. atomic absorption spectrometry
- G01N21/314—Investigating relative effect of material at wavelengths characteristic of specific elements or molecules, e.g. atomic absorption spectrometry with comparison of measurements at specific and non-specific wavelengths
- G—PHYSICS
- G01—MEASURING; TESTING
- G01N—INVESTIGATING OR ANALYSING MATERIALS BY DETERMINING THEIR CHEMICAL OR PHYSICAL PROPERTIES
- G01N33/00—Investigating or analysing materials by specific methods not covered by groups G01N1/00 - G01N31/00
- G01N33/48—Biological material, e.g. blood, urine; Haemocytometers
- G01N33/50—Chemical analysis of biological material, e.g. blood, urine; Testing involving biospecific ligand binding methods; Immunological testing
- G01N33/72—Chemical analysis of biological material, e.g. blood, urine; Testing involving biospecific ligand binding methods; Immunological testing involving blood pigments, e.g. haemoglobin, bilirubin or other porphyrins; involving occult blood
- G01N33/721—Haemoglobin
- G01N33/726—Devices
Definitions
- the present inventionrelates to spectrophotometric analysis for measuring the concentrations of each of a plurality of analytes in a sample. More particularly, the present invention relates to photoplethysmographic analysis for determining concentrations of various hemoglobin species in blood.
- estimates of the concentration of various analytes in a sampleare determined by (a) transmitting light from one or more emitters through the sample, (b) measuring the amount of light transmitted through the sample from each emitter, and (c) using the measured light in a calibration equation to obtain the analyte estimates.
- each emittertypically emits light having distinct spectral content and center wavelength.
- the present inventionis an improved method and system for spectrophotometric analysis, and in particular, for estimating the concentration of each analyte of a set of analytes in a tissue sample.
- the present inventionutilizes measurements of transmitted light from each of a plurality of electro-optical channels, wherein each channel: (a) emits light (e.g., by a light emitting diode (LED) or laser diode) having a distinct spectral content (and typically a unique center wavelength) into the tissue sample, and (b) detects the intensity of light transmitted through the tissue sample. Accordingly, the intensity of light transmitted from each emitter through the tissue sample and measured by a photodetector can be used in a calibration equation to estimate the concentration of each blood analyte in the tissue sample.
- LEDlight emitting diode
- the present inventionprovides increased accuracy for estimating the concentrations of the analytes within a tissue sample while minimizing the number of channels used (e.g., minimizing the number of emitters with distinct spectral contents used).
- the distinct spectral contents of the light transmitted by each emitterhave a fairly narrow band and have center wavelengths in the range of 600 nanometers (nm) to 1000 nanometers (nm).
- other spectral regionsmay be utilized such as 500-600 nm and 1000-1400 nm.
- the present inventionincreases the accuracy of estimating analyte concentrations through a two-stage analysis.
- This two-stage analysisis useful when the analytes to be measured absorb the emitted light in the following manner: for a first collection of one or more of the analytes to be measured, the absorption characteristics for analytes of this collection are sufficiently distinct from one another and from the remaining analytes, that accurate estimates may be derived for these analytes regardless of the concentrations of the other analytes.
- the first stage of the present inventiondetermines an estimated concentration for each analyte in the first collection of analytes without considering the concentrations of the remaining analytes.
- the computed concentration for each analyte in the first collectionis assumed to be accurate, and the concentrations of the remaining analytes are determined by exploiting a mathematically over-determined system. Because in the second stage there are fewer analyte concentrations to be determined than there are emitters used, an increase in accuracy may be obtained beyond, for example, simply utilizing an exactly determined system having the same number of unknown analyte concentrations as there are emitters.
- the two-stage computational technique of the present inventionis particularly useful.
- the novel two-stage computational techniqueis used to more accurately measure the concentration (as a percentage of total hemoglobin) of oxyhemoglobin (O 2 Hb), deoxyhemoglobin (RHb), carboxyhemoglobin (COHb) and methemoglobin (MetHb) by obtaining light measurements at four distinct center wavelengths (within the range of 600 nm to 1000 nm) transmitted through tissue of a patient.
- the first collection of analytesincludes only MetHb so that in the first stage, MetHb is determined using calibration coefficients derived from linear or non-linear least squares regression. Subsequently, in the second stage, the concentrations of the other three hemoglobin types are computed by utilizing calibration coefficients derived from least squares regression on samples having a MetHb concentration the same (or substantially the same) as the concentration computed in the first stage. Note that the present two-stage technique is especially useful in the present context since the presence of significant amounts of MetHb interferes with the ability to estimate the concentrations of the other types of hemoglobin.
- the present inventiondetermines whether the measured MetHb concentration is within a predetermined range before the estimated concentration of this analyte is used in the second stage of calculations.
- the method of the present inventionmay also be used to enhance spectrophotometric analysis where the system is initially over-determined. Therefore, it is within the scope of the present invention that this method provides increased accuracy in estimating any N analytes (N>2) using N+M emitters (M ⁇ 0). In the example discussed above, if five or more emitters are used to estimate the concentrations of the four hemoglobin species MetHb, O 2 Hb, RHb, and COHb, then the system is initially over-determined.
- photoplethysmographyutilizes a plurality of electro-optical channels for communicating or transmitting light through a tissue-under-test.
- Each channelincludes an emitter that transmits light having a distinct spectral content.
- the light emitted on each channel through the tissue-under-testis subsequently detected by a photodetector. Since the tissue- under-test is typically a finger, earlobe, or other well vascularized tissue, the light detected by the photodetector on each channel can be characterized as a waveform having two components.
- the first waveform componentvaries with the pulsation of the patient's blood (this component denoted the AC component).
- the second componentis the nonvarying contribution to the transmitted light level and corresponds to the total light passing through the tissues of the patient without being absorbed or scattered (this latter component denoted the DC component).
- dA ⁇ A⁇ I I
- ⁇is a difference of transmitted light at two time instants and I is a measurement of the instantaneous transmitted light intensity obtained from the DC component.
- differential absorptionsare computed, from measurements taken virtually simultaneously on each channel, these differentials may be used to estimate the concentration of various analytes in the patient's blood. Accordingly, various computational techniques have been utilized for computing analyte concentrations from such differential absorptions. For example, statistical regression techniques may be used to determine the calibration coefficients equation which uses differential absorptions for in order to estimate analyte concentrations, as one skilled in the art will understand.
- xHba 1 dA 1 + a 2 dA 2 b 1 dA 1 + b 2 dA 2
- a 1 , a 2 , b 1 , b 2are the calibration coefficients.
- the concentrations of the four hemoglobin species: O 2 Hb, RHb, COHb and MetHbare estimated by using at least four channels. Accordingly, if there are exactly four channels, then four differential absorption measurements dA 1 , dA 2 , dA 3 and dA 4 may be measured for a test sample and combined in a predetermined equation for estimating the concentrations of each of the four hemoglobin types.
- xHba 1 dA 1 + a 2 dA 2 + a 3 dA 3 + a 4 dA 4 b 1 dA 1 + b 2 dA 2 + b 3 dA 3+ b 4 dA 4
- xHbcan be any one of the four hemoglobin species: O 2 Hb, RHb, COHb, MetHb
- the constants a 1 , a 2 , a 3 , a 4 , b 1 , b 2 , b 3 , and b 4are calibration coefficients determined by nonlinear least squares regression.
- the constants a 1 , a 2 , a 3 , a 4 , b 1 , b 2 , b 3 , and b 4have distinct values for each of the four hemoglobin species.
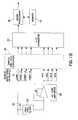
- Fig. 1shows one embodiment for a photoplethysmographic apparatus implementing the present invention.
- Laser drive circuitry 10includes four laser diodes (not shown) that are time division multiplexed by the drive circuitry 10, each laser emitting light having a spectral content different from the other lasers. Moreover, each such laser is activated sequentially at a corresponding 1/8th duty cycle where the next 1/8 duty cycle after each laser activation is a time when all diodes are turned off or deactivated so that the apparatus can measure the ambient light levels (i.e., dark time).
- the light emitted by the laser diodesis directed at a tissue-under-test 12 which could be, for example, a finger or earlobe when measurements of light transmitted through the tissue-under-test are to be obtained.
- the tissue-under-test 12may be a forehead or cheek when measurements of the light reflected from the tissue-under-test are to be obtained.
- the intensity of the light transmitted through the tissue-under-test 12is represented by waveform representation 13.
- the letters A through Deach refer to a specific light intensity transmitted through the tissue-under-test 12 by a corresponding one of the laser diodes activated during its corresponding duty cycle.
- the photodetector 14receives the transmitted light and converts it into a current which is passed along to a switched gain amplifier 15.
- the switched gain amplifier 15amplifies each current resulting from an activation of one of the laser diodes, and each such current is amplified at its own individual gain.
- the preamplifier 16, included in the switched gain amplifier 15is also a transimpedence amplifier that converts the current out of the photodetector 14 into a voltage level. This voltage level output is illustrated in waveform representation 17, and this output is passed on to the ambient light subtraction circuit 18 which subtracts, for each laser diode, the associated signals from its deactivation time from each of the signals for its activation time, thereby leaving only the information attributable to the activation time signal.
- This informationis passed on to the composite gain amplifier 19 which further increases the amplitude of these time division multiplexed signals.
- the output for each laser diode from the composite gain amplifier 19,is split into two separate paths. One path is denoted the composite path 20, and the other is denoted the AC path 22. Signals on the AC path 22 first go through the high pass filter 24 and then go through to the AC gain amplifier 26.
- One result of the split paths 20 and 22is that through the use of various filters, as one skilled in the art will understand, eight analog waveforms are created and these waveforms are subsequently passed into a sample-and-hold converter 30. Accordingly, for each laser diode activation, the sample-and-hold converter 30 holds a composite value (e.g.
- each AC valueis a composite signal with the DC offset removed by the high pass filter 24 and the remaining AC signal gained up by the AC gain amplifier 26.
- the information deposited into the sample and hold converter 30is passed along into the analog to digital converter 34 where the analog information is converted into digital values.
- the resulting digital valuesare then sent to the microprocessor 38 which stores these values in the memory 42. It is these values that the microprocessor 38 uses for computing the blood analyte values by the present invention so that the results can be sent to the display module 46 for output to the user.
- the four hemoglobin values shown on the right hand side of the display module 46are illustrations of analyte values computed by the present invention.
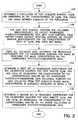
- step 104a population of test subjects is determined, wherein there are variations in the concentrations of O 2 Hb, RHb, COHb, and MetHb between subjects.
- the variationsshould be substantially similar to the variations in the general population.
- step 108for each test subject, simultaneously collect: (a) noninvasive photoplethysmographic data from each of the four emitters , and (b) invasive measurements for the concentrations of each of O 2 Hb, RHb, COHb and MetHb.
- measurements of the different spectral contentsare obtained from each of the four channels, wherein the four center wavelengths corresponding to these channels may be, for example, 632 nm, 671 nm, 813 nm and 957 nm.
- step 120regression coefficients are determined for MetHb using the corresponding photoplethysmographic data and invasive MetHb concentration measurements for each of the test subjects.
- the invasive MetHb measurementsare statistically correlated with the photoplethysmographic data, where the calibration coefficients are chosen to give the smallest possible estimation error (as in least squares regression).
- MetHbyields spectral content measurements that are sufficiently dominant between 600-1000 nm so that it can be accurately measured regardless of the concentrations of O 2 Hb, RHb, and COHb. Therefore, MetHb is the analyte contained in the first collection of the present invention.
- step 124calibration coefficients for the particular calibration equation are determined for the analytes O 2 Hb, RHb, and COHb.
- step 132an alternative set of calibration coefficients to those of step 124 is determined, wherein for each analyte O 2 Hb, RHb and COHb, regression coefficients are determined for the particular calibration equation form (e.g., equation (4),) using all the data collected regardless of MetHb concentration.
- equation forme.g., equation (4)
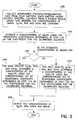
- step 236noninvasive photoplethysmographic data for a patient tissue-under-test is collected from the four emitters.
- step 240an estimate of the concentration of MetHb is obtained using the regression coefficients determined in step 120 of Fig. 2.
- step 244a determination is made as to whether the estimated concentration of MetHb is less than 1%. If so, then by assuming that the estimated concentration of MetHb is the actual concentration, each of the analytes O 2 Hb, RHb and COHb are determined by using the calibration coefficients obtained in step 124.
- step 240the estimated concentration of MetHb is determined to be greater than or equal to 1 %
- step 252is performed where the concentrations of the analytes O 2 Hb, RHb and COHb are determined using the calibration coefficients determined in step 132.
- step 256the estimated concentrations of the four analytes are output.
- the present inventionmay be used measure any analytes with the following properties: (1) a first collection of analytes has absorbance characteristics at the center wavelengths being used that are so distinct from one another and from the remaining analytes that they may be very accurately measured regardless of the concentrations of other analytes, and (2) by constraining analytes in the first collection to some pre-determined ranges, analytes in the remaining collection may be accurately calibrated and, hence, measured.
- the method of the present inventionis also applicable to initially over-determined systems.
- the initial number of center wavelengths usedis greater than the number of analytes to be measured, then the initial system is over-determined instead of exactly determined as in the above embodiment.
- the present inventionmay be used to further increase the number of center wavelengths used as compared to analytes being measured, thereby increasing measurement accuracy.
- any one of a number of statistical regression analysis techniqueswith or in place of the nonlinear least squares techniques in the above embodiments.
- the following techniquesare also within the scope of the present invention: linear least squares regression, partial least squares regression, principle component regression, latent root regression, Fourier regression and ridge regression.
Landscapes
- Health & Medical Sciences (AREA)
- Life Sciences & Earth Sciences (AREA)
- Physics & Mathematics (AREA)
- Engineering & Computer Science (AREA)
- Hematology (AREA)
- Biomedical Technology (AREA)
- Chemical & Material Sciences (AREA)
- Immunology (AREA)
- Molecular Biology (AREA)
- Pathology (AREA)
- Urology & Nephrology (AREA)
- Spectroscopy & Molecular Physics (AREA)
- General Health & Medical Sciences (AREA)
- General Physics & Mathematics (AREA)
- Biochemistry (AREA)
- Analytical Chemistry (AREA)
- Cell Biology (AREA)
- Biotechnology (AREA)
- Medicinal Chemistry (AREA)
- Food Science & Technology (AREA)
- Microbiology (AREA)
- Medical Informatics (AREA)
- Heart & Thoracic Surgery (AREA)
- Veterinary Medicine (AREA)
- Biophysics (AREA)
- Surgery (AREA)
- Optics & Photonics (AREA)
- Animal Behavior & Ethology (AREA)
- Public Health (AREA)
- Measurement Of The Respiration, Hearing Ability, Form, And Blood Characteristics Of Living Organisms (AREA)
- Investigating Or Analysing Materials By Optical Means (AREA)
- Investigating Or Analysing Biological Materials (AREA)
- Measuring Pulse, Heart Rate, Blood Pressure Or Blood Flow (AREA)
Abstract


Description
The present invention relates to spectrophotometric analysis for measuring theconcentrations of each of a plurality of analytes in a sample. More particularly, thepresent invention relates to photoplethysmographic analysis for determiningconcentrations of various hemoglobin species in blood.
In spectrophotometric analysis, estimates of the concentration of various analytes ina sample are determined by (a) transmitting light from one or more emitters throughthe sample, (b) measuring the amount of light transmitted through the sample fromeach emitter, and (c) using the measured light in a calibration equation to obtain theanalyte estimates. To maximize the information obtained from the sample-under-test,each emitter typically emits light having distinct spectral content and centerwavelength.
Typically, theoretical relationships along with statistical regression techniques areused to develop a calibration equation. In particular, a pre-specified equation form ischosen which relates the measured light to the analytes of interest. Constantspresent in this equation, called calibration coefficients, are then determined from atest collection of measured light vectors corresponding to known quantities of theanalytes, as one skilled in the art will understand. However, to effectively utilizesuch a methodology the analytes must be distinguishable at the center wavelengthsof light used. That is, the contribution of any one analyte to the measured light fromall emitters cannot be a linear combination of the corresponding contributions of oneor more other analytes. Moreover, no subcollection of the analytes should absorblight so strongly that absorption of light due to other analytes in the sample cannotbe measured. Additionally, to cost-effectively provide such spectrophotometricanalysis, there is an emphasis on minimizing the number of emitters used. It is wellknown, however, that there must be at least as many distinct emitters (each with itsown unique spectral content) used as there are analytes whose concentrations are to be determined. Furthermore, in order to obtain accurate concentration estimates,additional emitters are often used, thereby creating a mathematically over-determinedsystem. Thus, in conventional spectrophotometry, there is a cost versusaccuracy tradeoff, wherein both cost and accuracy increase with an increase in thenumber of emitters used in such systems.
Accordingly, it would be advantageous to have a method and system for increasingthe accuracy of such spectrophotometric analysis without incurring the costassociated with increasing the number of emitters. In photoplethysmography,maintaining a high degree of accuracy at a low cost is particularly important. That is,a high degree of accuracy is required in order to ensure patient safety and alert theclinician of critical situations, while cost containment pressures on the medicalcommunity necessitate low cost monitoring devices.
The present invention is an improved method and system for spectrophotometricanalysis, and in particular, for estimating the concentration of each analyte of a setof analytes in a tissue sample. The present invention utilizes measurements oftransmitted light from each of a plurality of electro-optical channels, wherein eachchannel: (a) emits light (e.g., by a light emitting diode (LED) or laser diode) having adistinct spectral content (and typically a unique center wavelength) into the tissuesample, and (b) detects the intensity of light transmitted through the tissue sample.Accordingly, the intensity of light transmitted from each emitter through the tissuesample and measured by a photodetector can be used in a calibration equation toestimate the concentration of each blood analyte in the tissue sample.
The present invention provides increased accuracy for estimating the concentrationsof the analytes within a tissue sample while minimizing the number of channels used(e.g., minimizing the number of emitters with distinct spectral contents used). In oneembodiment of the present invention, the distinct spectral contents of the lighttransmitted by each emitter have a fairly narrow band and have center wavelengths in the range of 600 nanometers (nm) to 1000 nanometers (nm). However, it is alsowithin the scope of the present invention that other spectral regions may be utilizedsuch as 500-600 nm and 1000-1400 nm.
The present invention increases the accuracy of estimating analyte concentrationsthrough a two-stage analysis. This two-stage analysis is useful when the analytes tobe measured absorb the emitted light in the following manner: for a first collection ofone or more of the analytes to be measured, the absorption characteristics foranalytes of this collection are sufficiently distinct from one another and from theremaining analytes, that accurate estimates may be derived for these analytesregardless of the concentrations of the other analytes. Accordingly, the first stage ofthe present invention determines an estimated concentration for each analyte in thefirst collection of analytes without considering the concentrations of the remaininganalytes.
In a second stage of the two-stage analysis, the computed concentration for eachanalyte in the first collection is assumed to be accurate, and the concentrations ofthe remaining analytes are determined by exploiting a mathematically over-determinedsystem. Because in the second stage there are fewer analyteconcentrations to be determined than there are emitters used, an increase inaccuracy may be obtained beyond, for example, simply utilizing an exactlydetermined system having the same number of unknown analyte concentrations asthere are emitters.
Accordingly, it is an aspect of the present invention to utilize statistical techniques,such as linear or non-linear least squares regression, in two distinct stages forincreasing analyte concentration estimation accuracy.
In photoplethysmography, the two-stage computational technique of the presentinvention is particularly useful. For example, in one embodiment of the presentinvention the novel two-stage computational technique is used to more accurately measure the concentration (as a percentage of total hemoglobin) of oxyhemoglobin(O2Hb), deoxyhemoglobin (RHb), carboxyhemoglobin (COHb) and methemoglobin(MetHb) by obtaining light measurements at four distinct center wavelengths (withinthe range of 600 nm to 1000 nm) transmitted through tissue of a patient. SinceMetHb can be estimated accurately regardless of the concentration of O2Hb, RHband COHb, the first collection of analytes includes only MetHb so that in the firststage, MetHb is determined using calibration coefficients derived from linear or non-linearleast squares regression. Subsequently, in the second stage, theconcentrations of the other three hemoglobin types are computed by utilizingcalibration coefficients derived from least squares regression on samples having aMetHb concentration the same (or substantially the same) as the concentrationcomputed in the first stage. Note that the present two-stage technique is especiallyuseful in the present context since the presence of significant amounts of MetHbinterferes with the ability to estimate the concentrations of the other types ofhemoglobin.
Moreover, it is a further aspect of the present invention to perform tests on theresults from the first stage prior to utilizing these results in the second stage.Accordingly, if the values from the first stage are deemed to be outside apredetermined range, then it is a further aspect of the present invention to then usealternative calibration equations for estimating the remaining analyte concentrations.Referring once again to photoplethysmography, the present invention determineswhether the measured MetHb concentration is within a predetermined range beforethe estimated concentration of this analyte is used in the second stage ofcalculations. In particular, since it is known that MetHb typically varies within arelatively narrow range of approximately 0 to 1% of total hemoglobin, a value ofgreater than or equal to 1% of the total hemoglobin is considered above normal. Inthis case, alternative calibration equations are used to compute the O2Hb, RHb, andCOHb concentrations.
As one skilled in the art will understand, the method of the present invention mayalso be used to enhance spectrophotometric analysis where the system is initiallyover-determined. Therefore, it is within the scope of the present invention that thismethod provides increased accuracy in estimating any N analytes (N>2) using N+Memitters (M≥0). In the example discussed above, if five or more emitters are used toestimate the concentrations of the four hemoglobin species MetHb, O2Hb, RHb, andCOHb, then the system is initially over-determined. For the first collection havingonly MetHb and the remaining collection having O2Hb, RHb and COHb, additionalaccuracy in estimating the concentrations of O2Hb, RHb and COHb is provided oncethe concentration of MetHb has been estimated according to the first stage of thepresent invention.
An embodiment of the invention will now be described, by way of example, referencebeing made to the Figures of the accompanying diagrammatic drawings in which:-
Before describing the steps of the present invention in detail, a brief description ofthe computational analysis used in photoplethysmography is provided. In particular,photoplethysmography utilizes a plurality of electro-optical channels forcommunicating or transmitting light through a tissue-under-test. Each channel includes an emitter that transmits light having a distinct spectral content. The lightemitted on each channel through the tissue-under-test is subsequently detected by aphotodetector. Since the tissue- under-test is typically a finger, earlobe, or other wellvascularized tissue, the light detected by the photodetector on each channel can becharacterized as a waveform having two components. The first waveformcomponent varies with the pulsation of the patient's blood (this component denotedthe AC component). The second component is the nonvarying contribution to thetransmitted light level and corresponds to the total light passing through the tissuesof the patient without being absorbed or scattered (this latter component denoted theDC component). For each such channel, a differential absorption is approximatedas:dA ≅ΔA =ΔI I
Since such differential absorptions are computed, from measurements taken virtuallysimultaneously on each channel, these differentials may be used to estimate theconcentration of various analytes in the patient's blood. Accordingly, variouscomputational techniques have been utilized for computing analyte concentrationsfrom such differential absorptions. For example, statistical regression techniquesmay be used to determine the calibration coefficients equation which usesdifferential absorptions for in order to estimate analyte concentrations, as one skilledin the art will understand. For example, two such channels can be used to computetwo differential absorptions, dA1 and dA2, in order to estimate relativeconcentrations of O2Hb and RHb, where the predetermined function is given by:xHb =aR2 +bR +c, whereinR =dA 1 dA 2 xHb =a 1 dA 1 +a 2 dA 2 b 1 dA 1 +b 2 dA 2
Note, however, it is not necessary to limit such estimation techniques to twodifferential absorption measurements. In particular, by providing a larger number ofchannels for transmitting light having additional distinct spectral contents, a largernumber of analyte concentrations may be estimated. For example, in oneembodiment of the present invention, the concentrations of the four hemoglobinspecies: O2Hb, RHb, COHb and MetHb, are estimated by using at least fourchannels. Accordingly, if there are exactly four channels, then four differentialabsorption measurements dA1, dA2, dA3 and dA4 may be measured for a test sampleand combined in a predetermined equation for estimating the concentrations of eachof the four hemoglobin types. That is, extending function (3) above to fourdifferential absorption measurements, the following equation is obtained:xHb =a 1 dA 1 +a 2 dA 2 +a 3 dA 3 +a 4 dA 4 b 1 dA 1 +b 2 dA 2 +b 3 dA 3+b 4 dA 4
Fig. 1 shows one embodiment for a photoplethysmographic apparatus implementingthe present invention. Laser drive circuitry 10 includes four laser diodes (not shown)that are time division multiplexed by the drive circuitry 10, each laser emitting lighthaving a spectral content different from the other lasers. Moreover, each such laseris activated sequentially at a corresponding 1/8th duty cycle where the next 1/8 dutycycle after each laser activation is a time when all diodes are turned off ordeactivated so that the apparatus can measure the ambient light levels (i.e., darktime). The light emitted by the laser diodes is directed at a tissue-under-test 12which could be, for example, a finger or earlobe when measurements of lighttransmitted through the tissue-under-test are to be obtained. Alternatively, thetissue-under-test 12 may be a forehead or cheek when measurements of the lightreflected from the tissue-under-test are to be obtained. Assuming measurements oflight transmitted through the tissue-under-test 12 are to be used, the intensity of thelight transmitted through the tissue-under-test 12 is represented by waveformrepresentation 13. The letters A through D each refer to a specific light intensitytransmitted through the tissue-under-test 12 by a corresponding one of the laserdiodes activated during its corresponding duty cycle. The photodetector 14 receivesthe transmitted light and converts it into a current which is passed along to aswitched gain amplifier 15. The switched gain amplifier 15 amplifies each currentresulting from an activation of one of the laser diodes, and each such current isamplified at its own individual gain. The preamplifier 16, included in the switched gain amplifier 15 is also a transimpedence amplifier that converts the current out ofthe photodetector 14 into a voltage level. This voltage level output is illustrated inwaveform representation 17, and this output is passed on to the ambient lightsubtraction circuit 18 which subtracts, for each laser diode, the associated signalsfrom its deactivation time from each of the signals for its activation time, therebyleaving only the information attributable to the activation time signal. Thisinformation is passed on to the composite gain amplifier 19 which further increasesthe amplitude of these time division multiplexed signals. The output for each laserdiode from the composite gain amplifier 19, is split into two separate paths. Onepath is denoted the composite path 20, and the other is denoted the AC path 22.Signals on the AC path 22 first go through the high pass filter 24 and then gothrough to the AC gain amplifier 26. One result of the split paths 20 and 22 is thatthrough the use of various filters, as one skilled in the art will understand, eightanalog waveforms are created and these waveforms are subsequently passed into asample-and-hold converter 30. Accordingly, for each laser diode activation, thesample-and-hold converter 30 holds a composite value (e.g. from COMP 1, COMP2, COMP 3 and COMP 4) as well as an AC value (e.g. from AC 1, AC 2, AC3 andAC4), wherein each AC value is a composite signal with the DC offset removed bythe high pass filter 24 and the remaining AC signal gained up by the AC gainamplifier 26. Finally, the information deposited into the sample and hold converter30 is passed along into the analog to digital converter 34 where the analoginformation is converted into digital values. The resulting digital values are then sentto the microprocessor 38 which stores these values in the memory 42. It is thesevalues that the microprocessor 38 uses for computing the blood analyte values bythe present invention so that the results can be sent to the display module 46 foroutput to the user. The four hemoglobin values shown on the right hand side of thedisplay module 46 are illustrations of analyte values computed by the presentinvention.
The flowchart of Fig. 2 describes the high level steps performed in determiningvarious sets of calibration coefficients for subsequently estimating the concentrationsof MetHb, O2Hb, RHb and COHb according to the present invention. In particular, instep 104 a population of test subjects is determined, wherein there are variations inthe concentrations of O2Hb, RHb, COHb, and MetHb between subjects. Preferably,the variations should be substantially similar to the variations in the generalpopulation. In step 108, for each test subject, simultaneously collect: (a)noninvasive photoplethysmographic data from each of the four emitters , and (b)invasive measurements for the concentrations of each of O2Hb, RHb, COHb andMetHb. In particular, for the noninvasive photoplethysmographic data,measurements of the different spectral contents are obtained from each of the fourchannels, wherein the four center wavelengths corresponding to these channelsmay be, for example, 632 nm, 671 nm, 813 nm and 957 nm.
Subsequently, in steps 120, 124 and 132, three collections of calibration coefficientsare obtained for a particular calibration equation such as equation (4). Accordingly,in step 120, regression coefficients are determined for MetHb using thecorresponding photoplethysmographic data and invasive MetHb concentrationmeasurements for each of the test subjects. In particular, the invasive MetHbmeasurements are statistically correlated with the photoplethysmographic data,where the calibration coefficients are chosen to give the smallest possible estimationerror (as in least squares regression).
Further note that in step 120, the concentrations of the other species of hemoglobinare ignored. MetHb yields spectral content measurements that are sufficientlydominant between 600-1000 nm so that it can be accurately measured regardless ofthe concentrations of O2Hb, RHb, and COHb. Therefore, MetHb is the analytecontained in the first collection of the present invention.
In step 124, calibration coefficients for the particular calibration equation aredetermined for the analytes O2Hb, RHb, and COHb. However, instead of using all of the data collected, this step excludes data collected where the MetHb concentrationis invasively measured as greater than 1%. That is, in one embodiment, theconcentrations of each of O2Hb, RHb and COHb are determined from equation (4),where the constants ai, bi, i = 1, 2, 3, 4, are estimated through least squaresregression. It is important to note that the regression process for this step uses onlyphotoplethysmographic data where the concentration of MetHb (invasivelymeasured) is between .0% to 1%. However, other ranges are also within the scopeof the present invention. It is important also to note that in this case three analyteconcentrations are being calibrated at four different center wavelengths, so thesystem is over-determined and regression may be used to obtain regressioncoefficients that when used in equation (4) yields more accurate concentrationmeasurements than regression coefficients obtained by using an exactly-determinedsystem (i.e., calibrating four analytes using four distinct center wavelengths).
In step 132, an alternative set of calibration coefficients to those of step 124 isdetermined, wherein for each analyte O2Hb, RHb and COHb, regression coefficientsare determined for the particular calibration equation form (e.g., equation (4),) usingall the data collected regardless of MetHb concentration. Thus, note that there aretwo sets of regression coefficients for the analytes O2Hb, RHb and COHb, one setderived from data for a subset of the test population and one set derived from datafor the entire test population, wherein the set of regression coefficients from thesubset of the test population is believed to provide more accurate analyteconcentration estimates when the patient's MetHb concentration is less than 1%.
Referring now to Fig. 3, a flowchart is presented illustrating the steps that areperformed when using the present invention to noninvasively estimate theconcentrations of unknown amounts of MetHb, O2Hb, RHb and COHb. Accordingly,in step 236, noninvasive photoplethysmographic data for a patient tissue-under-testis collected from the four emitters. In step 240, an estimate of the concentration ofMetHb is obtained using the regression coefficients determined in step 120 of Fig. 2.
That is, the same calibration equation of step 120 is used with the regressioncoefficients determined in step 120 and the differential absorptions dAi, i = 1, 2, 3, 4.Subsequently, in step 244, a determination is made as to whether the estimatedconcentration of MetHb is less than 1%. If so, then by assuming that the estimatedconcentration of MetHb is the actual concentration, each of the analytes O2Hb, RHband COHb are determined by using the calibration coefficients obtained in step 124.Alternatively, if in step 240, the estimated concentration of MetHb is determined tobe greater than or equal to 1 %, then step 252 is performed where the concentrationsof the analytes O2Hb, RHb and COHb are determined using the calibrationcoefficients determined in step 132. Finally, in step 256, the estimatedconcentrations of the four analytes are output.
The above embodiment of the present invention can be readily generalized. Inparticular, the present invention may be used measure any analytes with thefollowing properties: (1) a first collection of analytes has absorbance characteristicsat the center wavelengths being used that are so distinct from one another and fromthe remaining analytes that they may be very accurately measured regardless of theconcentrations of other analytes, and (2) by constraining analytes in the firstcollection to some pre-determined ranges, analytes in the remaining collection maybe accurately calibrated and, hence, measured.
Moreover, the method of the present invention is also applicable to initially over-determinedsystems. In particular, as one skilled in the art will understand, if theinitial number of center wavelengths used is greater than the number of analytes tobe measured, then the initial system is over-determined instead of exactlydetermined as in the above embodiment. In this case, the present invention may beused to further increase the number of center wavelengths used as compared toanalytes being measured, thereby increasing measurement accuracy.
Further, it is within the scope of the present invention to utilize any one of a numberof statistical regression analysis techniques with or in place of the nonlinear leastsquares techniques in the above embodiments. In particular, the followingtechniques are also within the scope of the present invention: linear least squaresregression, partial least squares regression, principle component regression, latentroot regression, Fourier regression and ridge regression.
It is also within the scope of the present invention to utilize more than two sets ofregression coefficients for estimating the concentrations of analytes such as O2Hb,RHb and COHb. That is, instead of a first set of regression coefficients for MetHbconcentrations less than 1% and a second set for MetHb concentrations greaterthan or equal to 1%, a different set of regression coefficients may be provided for,e.g., each of the MetHb concentration ranges: 0 to less than 5%, 5% to less than10%, and greater than or equal to 10%.
Claims (10)
- An apparatus for performing spectrophotometric analyte concentrationmeasurement comprising:means for communicating beams of light each having a distinct spectralcontent across a tissue sample for obtaining values related to a measurementof the concentration of each of a plurality of analytes in the tissue sample;means for measuring the beams of light received across the tissue sample forobtaining light measurements;first estimating means for estimating a concentration of a collection of at leastone of said plurality of analytes using said measured light measurements;means for determining whether said first estimated concentration for each ofthe analytes in the collection satisfies a predetermined one or moreconstraints; andsecond estimating means for estimating a concentration of the remaininganalytes of said plurality of analytes when said means for determiningindicates that said predetermined one or more constraints have been met;wherein said second estimating means determines an estimatedmeasurement of the remaining analytes using said measured light and usingsaid first estimated concentration as a substantially exact measurement ofsaid collection of analytes.
- An apparatus as claimed in Claim 1, wherein said plurality of analytes isselected from the group consisting of: methemoglobin, oxyhemoglobin,deoxyhemoglobin and carboxyhemoglobin.
- An apparatus as claimed in Claim 1, wherein said means for determiningdetermines whether said first estimated concentration satisfies aconstraint that said first estimated concentration is less than a predeterminedconcentration in the tissue sample.
- An apparatus as claimed in Claim 1, wherein said collection of at least one ofsaid plurality of analytes includes only methemoglobin.
- An apparatus as claimed in Claim 4, wherein said means for determiningdetermines whether methemoglobin is less than approximately one percent ofa total amount of hemoglobin in the blood of the tissue sample.
- An apparatus as claimed in Claim 1, further including a third estimatingmeans for estimating a concentration of at least one of said remaininganalytes, said third estimating means used when said means for determiningdetermines that an estimated concentration for one or more analytes in saidcollection does not satisfy one of said predetermined one or more constraints.
- An apparatus as claimed in Claim 6, wherein said third estimating meansuses regression coefficients for estimating the remaining analytes, whereinsaid regression coefficients are the result of a statistical calibration on anexactly determined system.
- An apparatus as claimed in Claim 1, wherein said remaining analytes areselected from the group consisting of: oxyhemoglobin, deoxyhemoglobin andcarboxyhemoglobin.
- An apparatus as claimed in Claim 1, wherein said first estimating meansdetermines an estimate of the concentration of said collection usingregression coefficients.
- An apparatus as claimed in Claim 14, wherein said regression coefficients aredetermined using one of: least squares regression, partial least squaresregression, principle component regression and Fourier regression.
Applications Claiming Priority (2)
| Application Number | Priority Date | Filing Date | Title |
|---|---|---|---|
| US08/835,289US5891024A (en) | 1997-04-09 | 1997-04-09 | Two stage calibration and analyte measurement scheme for spectrophotomeric analysis |
| US835289 | 1997-04-09 |
Publications (2)
| Publication Number | Publication Date |
|---|---|
| EP0871026A2true EP0871026A2 (en) | 1998-10-14 |
| EP0871026A3 EP0871026A3 (en) | 1999-01-13 |
Family
ID=25269128
Family Applications (1)
| Application Number | Title | Priority Date | Filing Date |
|---|---|---|---|
| EP98302120AWithdrawnEP0871026A3 (en) | 1997-04-09 | 1998-03-20 | Spectrophotometric analysis |
Country Status (3)
| Country | Link |
|---|---|
| US (1) | US5891024A (en) |
| EP (1) | EP0871026A3 (en) |
| JP (1) | JPH10318915A (en) |
Cited By (4)
| Publication number | Priority date | Publication date | Assignee | Title |
|---|---|---|---|---|
| EP1273260A1 (en)* | 2001-07-02 | 2003-01-08 | Trion AG | Earlobes sensor |
| EP1385418A1 (en)* | 2001-05-07 | 2004-02-04 | Cardiosafe International AG | Device for monitoring a patient |
| EP3709872A4 (en)* | 2017-11-13 | 2021-08-04 | Sanmina Corporation | System and method for blood typing using ppg technology |
| US12156751B2 (en) | 2015-09-25 | 2024-12-03 | Trilinear Bioventures, Llc | System and method for determining blood disorders for a blood type using PPG technology |
Families Citing this family (109)
| Publication number | Priority date | Publication date | Assignee | Title |
|---|---|---|---|---|
| US7400918B2 (en)* | 1998-07-04 | 2008-07-15 | Edwards Lifesciences | Measurement of blood oxygen saturation |
| WO2000001294A1 (en)* | 1998-07-04 | 2000-01-13 | Whitland Research Limited | Non-invasive measurement of blood analytes |
| EP1104254A2 (en) | 1998-08-13 | 2001-06-06 | Whitland Research Limited | Optical device |
| US6199550B1 (en)* | 1998-08-14 | 2001-03-13 | Bioasyst, L.L.C. | Integrated physiologic sensor system |
| US6675031B1 (en) | 1999-04-14 | 2004-01-06 | Mallinckrodt Inc. | Method and circuit for indicating quality and accuracy of physiological measurements |
| JP2008194488A (en)* | 1999-11-30 | 2008-08-28 | Nippon Koden Corp | Hemoglobin concentration measuring device |
| US6397092B1 (en) | 1999-12-17 | 2002-05-28 | Datex-Ohmeda, Inc. | Oversampling pulse oximeter |
| US8224412B2 (en) | 2000-04-17 | 2012-07-17 | Nellcor Puritan Bennett Llc | Pulse oximeter sensor with piece-wise function |
| EP1274343B1 (en) | 2000-04-17 | 2012-08-15 | Nellcor Puritan Bennett LLC | Pulse oximeter sensor with piece-wise function |
| US6505133B1 (en) | 2000-11-15 | 2003-01-07 | Datex-Ohmeda, Inc. | Simultaneous signal attenuation measurements utilizing code division multiplexing |
| US6501974B2 (en) | 2001-01-22 | 2002-12-31 | Datex-Ohmeda, Inc. | Compensation of human variability in pulse oximetry |
| US6540688B1 (en) | 2001-10-11 | 2003-04-01 | Datex-Ohmeda, Inc. | Method and system for assessing collateral blood flow to a tissue region of interest |
| US6748254B2 (en) | 2001-10-12 | 2004-06-08 | Nellcor Puritan Bennett Incorporated | Stacked adhesive optical sensor |
| WO2003065632A2 (en)* | 2002-01-31 | 2003-08-07 | Datex-Ohmeda, Inc. | Sensor identification method and system |
| US6882874B2 (en)* | 2002-02-15 | 2005-04-19 | Datex-Ohmeda, Inc. | Compensation of human variability in pulse oximetry |
| US7190986B1 (en) | 2002-10-18 | 2007-03-13 | Nellcor Puritan Bennett Inc. | Non-adhesive oximeter sensor for sensitive skin |
| JP2006523846A (en)* | 2003-04-15 | 2006-10-19 | オプテイスカン・バイオメデイカル・コーポレーシヨン | Dual measurement analyte detection system |
| US7481793B2 (en)* | 2003-12-10 | 2009-01-27 | Boston Scientic Scimed, Inc. | Modular steerable sheath catheters |
| US7162288B2 (en) | 2004-02-25 | 2007-01-09 | Nellcor Purtain Bennett Incorporated | Techniques for detecting heart pulses and reducing power consumption in sensors |
| US7194292B2 (en)* | 2004-02-25 | 2007-03-20 | General Electric Company | Simultaneous signal attenuation measurements utilizing frequency orthogonal random codes |
| CA2460898A1 (en)* | 2004-03-09 | 2005-09-09 | James Samsoondar | Apparatus and method for combining in vivo and in vitro testing |
| JP2005274568A (en)* | 2004-03-22 | 2005-10-06 | Spectromedical Inc | Spectroscopic method and apparatus for total hemoglobin measurement |
| US20070103678A1 (en)* | 2005-02-14 | 2007-05-10 | Sterling Bernhard B | Analyte detection system with interferent identification and correction |
| US8251907B2 (en) | 2005-02-14 | 2012-08-28 | Optiscan Biomedical Corporation | System and method for determining a treatment dose for a patient |
| US7647083B2 (en)* | 2005-03-01 | 2010-01-12 | Masimo Laboratories, Inc. | Multiple wavelength sensor equalization |
| US8206650B2 (en)* | 2005-04-12 | 2012-06-26 | Chromedx Inc. | Joint-diagnostic spectroscopic and biosensor meter |
| US20100245803A1 (en)* | 2005-04-12 | 2010-09-30 | Chromedx Inc. | Blood sample holder for spectroscopic analysis |
| CA2507323A1 (en)* | 2005-05-13 | 2006-11-13 | Chromedx Inc. | Diagnostic whole blood and plasma apparatus |
| CA2517299A1 (en)* | 2005-08-26 | 2007-02-26 | Chromedx Inc. | Hollow needle assembly |
| US8140139B2 (en)* | 2005-06-14 | 2012-03-20 | Dominion Assets, Llc | Method and apparatus for the non-invasive sensing of glucose in a human subject |
| US7657295B2 (en) | 2005-08-08 | 2010-02-02 | Nellcor Puritan Bennett Llc | Medical sensor and technique for using the same |
| US7657294B2 (en) | 2005-08-08 | 2010-02-02 | Nellcor Puritan Bennett Llc | Compliant diaphragm medical sensor and technique for using the same |
| US7590439B2 (en) | 2005-08-08 | 2009-09-15 | Nellcor Puritan Bennett Llc | Bi-stable medical sensor and technique for using the same |
| US20070060808A1 (en) | 2005-09-12 | 2007-03-15 | Carine Hoarau | Medical sensor for reducing motion artifacts and technique for using the same |
| US7899510B2 (en) | 2005-09-29 | 2011-03-01 | Nellcor Puritan Bennett Llc | Medical sensor and technique for using the same |
| US8092379B2 (en) | 2005-09-29 | 2012-01-10 | Nellcor Puritan Bennett Llc | Method and system for determining when to reposition a physiological sensor |
| US7869850B2 (en) | 2005-09-29 | 2011-01-11 | Nellcor Puritan Bennett Llc | Medical sensor for reducing motion artifacts and technique for using the same |
| US7904130B2 (en) | 2005-09-29 | 2011-03-08 | Nellcor Puritan Bennett Llc | Medical sensor and technique for using the same |
| US7881762B2 (en) | 2005-09-30 | 2011-02-01 | Nellcor Puritan Bennett Llc | Clip-style medical sensor and technique for using the same |
| US8062221B2 (en) | 2005-09-30 | 2011-11-22 | Nellcor Puritan Bennett Llc | Sensor for tissue gas detection and technique for using the same |
| US7483731B2 (en) | 2005-09-30 | 2009-01-27 | Nellcor Puritan Bennett Llc | Medical sensor and technique for using the same |
| US7555327B2 (en) | 2005-09-30 | 2009-06-30 | Nellcor Puritan Bennett Llc | Folding medical sensor and technique for using the same |
| US7486979B2 (en) | 2005-09-30 | 2009-02-03 | Nellcor Puritan Bennett Llc | Optically aligned pulse oximetry sensor and technique for using the same |
| US8233954B2 (en) | 2005-09-30 | 2012-07-31 | Nellcor Puritan Bennett Llc | Mucosal sensor for the assessment of tissue and blood constituents and technique for using the same |
| US7477924B2 (en) | 2006-05-02 | 2009-01-13 | Nellcor Puritan Bennett Llc | Medical sensor and technique for using the same |
| US7522948B2 (en) | 2006-05-02 | 2009-04-21 | Nellcor Puritan Bennett Llc | Medical sensor and technique for using the same |
| US8073518B2 (en) | 2006-05-02 | 2011-12-06 | Nellcor Puritan Bennett Llc | Clip-style medical sensor and technique for using the same |
| JP4856477B2 (en)* | 2006-06-13 | 2012-01-18 | 株式会社日立メディコ | Biological light measurement device |
| US8145288B2 (en) | 2006-08-22 | 2012-03-27 | Nellcor Puritan Bennett Llc | Medical sensor for reducing signal artifacts and technique for using the same |
| US8219170B2 (en) | 2006-09-20 | 2012-07-10 | Nellcor Puritan Bennett Llc | System and method for practicing spectrophotometry using light emitting nanostructure devices |
| US8195264B2 (en) | 2006-09-22 | 2012-06-05 | Nellcor Puritan Bennett Llc | Medical sensor for reducing signal artifacts and technique for using the same |
| US8396527B2 (en) | 2006-09-22 | 2013-03-12 | Covidien Lp | Medical sensor for reducing signal artifacts and technique for using the same |
| US8175671B2 (en) | 2006-09-22 | 2012-05-08 | Nellcor Puritan Bennett Llc | Medical sensor for reducing signal artifacts and technique for using the same |
| US7869849B2 (en) | 2006-09-26 | 2011-01-11 | Nellcor Puritan Bennett Llc | Opaque, electrically nonconductive region on a medical sensor |
| US7574245B2 (en) | 2006-09-27 | 2009-08-11 | Nellcor Puritan Bennett Llc | Flexible medical sensor enclosure |
| US7890153B2 (en) | 2006-09-28 | 2011-02-15 | Nellcor Puritan Bennett Llc | System and method for mitigating interference in pulse oximetry |
| US7796403B2 (en) | 2006-09-28 | 2010-09-14 | Nellcor Puritan Bennett Llc | Means for mechanical registration and mechanical-electrical coupling of a faraday shield to a photodetector and an electrical circuit |
| US7680522B2 (en) | 2006-09-29 | 2010-03-16 | Nellcor Puritan Bennett Llc | Method and apparatus for detecting misapplied sensors |
| US8175667B2 (en) | 2006-09-29 | 2012-05-08 | Nellcor Puritan Bennett Llc | Symmetric LED array for pulse oximetry |
| US7476131B2 (en) | 2006-09-29 | 2009-01-13 | Nellcor Puritan Bennett Llc | Device for reducing crosstalk |
| US7684842B2 (en) | 2006-09-29 | 2010-03-23 | Nellcor Puritan Bennett Llc | System and method for preventing sensor misuse |
| US8068891B2 (en) | 2006-09-29 | 2011-11-29 | Nellcor Puritan Bennett Llc | Symmetric LED array for pulse oximetry |
| US8265723B1 (en) | 2006-10-12 | 2012-09-11 | Cercacor Laboratories, Inc. | Oximeter probe off indicator defining probe off space |
| US7894869B2 (en) | 2007-03-09 | 2011-02-22 | Nellcor Puritan Bennett Llc | Multiple configuration medical sensor and technique for using the same |
| US8265724B2 (en) | 2007-03-09 | 2012-09-11 | Nellcor Puritan Bennett Llc | Cancellation of light shunting |
| US8280469B2 (en) | 2007-03-09 | 2012-10-02 | Nellcor Puritan Bennett Llc | Method for detection of aberrant tissue spectra |
| EP2139383B1 (en) | 2007-03-27 | 2013-02-13 | Masimo Laboratories, Inc. | Multiple wavelength optical sensor |
| US8374665B2 (en) | 2007-04-21 | 2013-02-12 | Cercacor Laboratories, Inc. | Tissue profile wellness monitor |
| US8412293B2 (en)* | 2007-07-16 | 2013-04-02 | Optiscan Biomedical Corporation | Systems and methods for determining physiological parameters using measured analyte values |
| US8597190B2 (en) | 2007-05-18 | 2013-12-03 | Optiscan Biomedical Corporation | Monitoring systems and methods with fast initialization |
| US8346328B2 (en) | 2007-12-21 | 2013-01-01 | Covidien Lp | Medical sensor and technique for using the same |
| US8352004B2 (en) | 2007-12-21 | 2013-01-08 | Covidien Lp | Medical sensor and technique for using the same |
| US8366613B2 (en) | 2007-12-26 | 2013-02-05 | Covidien Lp | LED drive circuit for pulse oximetry and method for using same |
| US8577434B2 (en) | 2007-12-27 | 2013-11-05 | Covidien Lp | Coaxial LED light sources |
| US8442608B2 (en) | 2007-12-28 | 2013-05-14 | Covidien Lp | System and method for estimating physiological parameters by deconvolving artifacts |
| US8452364B2 (en) | 2007-12-28 | 2013-05-28 | Covidien LLP | System and method for attaching a sensor to a patient's skin |
| US8070508B2 (en) | 2007-12-31 | 2011-12-06 | Nellcor Puritan Bennett Llc | Method and apparatus for aligning and securing a cable strain relief |
| US8092993B2 (en) | 2007-12-31 | 2012-01-10 | Nellcor Puritan Bennett Llc | Hydrogel thin film for use as a biosensor |
| US8199007B2 (en) | 2007-12-31 | 2012-06-12 | Nellcor Puritan Bennett Llc | Flex circuit snap track for a biometric sensor |
| US8897850B2 (en) | 2007-12-31 | 2014-11-25 | Covidien Lp | Sensor with integrated living hinge and spring |
| US8437822B2 (en) | 2008-03-28 | 2013-05-07 | Covidien Lp | System and method for estimating blood analyte concentration |
| US8364224B2 (en)* | 2008-03-31 | 2013-01-29 | Covidien Lp | System and method for facilitating sensor and monitor communication |
| US8112375B2 (en) | 2008-03-31 | 2012-02-07 | Nellcor Puritan Bennett Llc | Wavelength selection and outlier detection in reduced rank linear models |
| US8071935B2 (en) | 2008-06-30 | 2011-12-06 | Nellcor Puritan Bennett Llc | Optical detector with an overmolded faraday shield |
| US7887345B2 (en) | 2008-06-30 | 2011-02-15 | Nellcor Puritan Bennett Llc | Single use connector for pulse oximetry sensors |
| US7880884B2 (en) | 2008-06-30 | 2011-02-01 | Nellcor Puritan Bennett Llc | System and method for coating and shielding electronic sensor components |
| US8364220B2 (en) | 2008-09-25 | 2013-01-29 | Covidien Lp | Medical sensor and technique for using the same |
| US8417309B2 (en) | 2008-09-30 | 2013-04-09 | Covidien Lp | Medical sensor |
| US8914088B2 (en) | 2008-09-30 | 2014-12-16 | Covidien Lp | Medical sensor and technique for using the same |
| US8423112B2 (en) | 2008-09-30 | 2013-04-16 | Covidien Lp | Medical sensor and technique for using the same |
| US8452366B2 (en) | 2009-03-16 | 2013-05-28 | Covidien Lp | Medical monitoring device with flexible circuitry |
| US8221319B2 (en) | 2009-03-25 | 2012-07-17 | Nellcor Puritan Bennett Llc | Medical device for assessing intravascular blood volume and technique for using the same |
| US8509869B2 (en) | 2009-05-15 | 2013-08-13 | Covidien Lp | Method and apparatus for detecting and analyzing variations in a physiologic parameter |
| US8634891B2 (en) | 2009-05-20 | 2014-01-21 | Covidien Lp | Method and system for self regulation of sensor component contact pressure |
| US8311601B2 (en) | 2009-06-30 | 2012-11-13 | Nellcor Puritan Bennett Llc | Reflectance and/or transmissive pulse oximeter |
| US9010634B2 (en) | 2009-06-30 | 2015-04-21 | Covidien Lp | System and method for linking patient data to a patient and providing sensor quality assurance |
| US8505821B2 (en) | 2009-06-30 | 2013-08-13 | Covidien Lp | System and method for providing sensor quality assurance |
| US8391941B2 (en) | 2009-07-17 | 2013-03-05 | Covidien Lp | System and method for memory switching for multiple configuration medical sensor |
| US8417310B2 (en) | 2009-08-10 | 2013-04-09 | Covidien Lp | Digital switching in multi-site sensor |
| US8428675B2 (en) | 2009-08-19 | 2013-04-23 | Covidien Lp | Nanofiber adhesives used in medical devices |
| US9066660B2 (en) | 2009-09-29 | 2015-06-30 | Nellcor Puritan Bennett Ireland | Systems and methods for high-pass filtering a photoplethysmograph signal |
| US9839381B1 (en) | 2009-11-24 | 2017-12-12 | Cercacor Laboratories, Inc. | Physiological measurement system with automatic wavelength adjustment |
| WO2011069122A1 (en) | 2009-12-04 | 2011-06-09 | Masimo Corporation | Calibration for multi-stage physiological monitors |
| WO2011156522A1 (en) | 2010-06-09 | 2011-12-15 | Optiscan Biomedical Corporation | Measuring analytes in a fluid sample drawn from a patient |
| US9554738B1 (en)* | 2016-03-30 | 2017-01-31 | Zyomed Corp. | Spectroscopic tomography systems and methods for noninvasive detection and measurement of analytes using collision computing |
| EP3888535A1 (en) | 2017-08-18 | 2021-10-06 | Trilinear BioVentures, LLC | System for detecting a sepsis condition |
| EP3505051A1 (en) | 2017-12-29 | 2019-07-03 | Sanmina Corporation | Vehicular health monitoring system and method |
| JP7090460B2 (en)* | 2018-04-18 | 2022-06-24 | キヤノン株式会社 | Biometric information measuring devices and programs |
| EP3906848A1 (en) | 2020-04-14 | 2021-11-10 | Trilinear BioVentures, LLC | System and method of screening for infection |
Family Cites Families (32)
| Publication number | Priority date | Publication date | Assignee | Title |
|---|---|---|---|---|
| US3638640A (en)* | 1967-11-01 | 1972-02-01 | Robert F Shaw | Oximeter and method for in vivo determination of oxygen saturation in blood using three or more different wavelengths |
| JPS5524004A (en)* | 1978-06-22 | 1980-02-20 | Minolta Camera Kk | Oxymeter |
| JPS56104646A (en)* | 1980-01-25 | 1981-08-20 | Minolta Camera Kk | Optical analyzer for forming ratio of element contained in organism |
| US4407290A (en)* | 1981-04-01 | 1983-10-04 | Biox Technology, Inc. | Blood constituent measuring device and method |
| US4603700A (en)* | 1983-12-09 | 1986-08-05 | The Boc Group, Inc. | Probe monitoring system for oximeter |
| US4714341A (en)* | 1984-02-23 | 1987-12-22 | Minolta Camera Kabushiki Kaisha | Multi-wavelength oximeter having a means for disregarding a poor signal |
| DK282085D0 (en)* | 1985-06-21 | 1985-06-21 | Radiometer As | METHOD AND APPARATUS FOR DETERMINING BLOOD COMPONENTS |
| US4819646A (en)* | 1986-08-18 | 1989-04-11 | Physio-Control Corporation | Feedback-controlled method and apparatus for processing signals used in oximetry |
| JPS63111837A (en)* | 1986-10-29 | 1988-05-17 | 日本光電工業株式会社 | Apparatus for measuring concentration of light absorbing substance in blood |
| JPS63252239A (en)* | 1987-04-09 | 1988-10-19 | Sumitomo Electric Ind Ltd | reflective oximeter |
| US4907876A (en)* | 1987-05-08 | 1990-03-13 | Hamamatsu Photonics Kabushiki Kaisha | Examination apparatus for measuring oxygenation in body organs |
| DE3889733T2 (en)* | 1987-07-24 | 1994-09-08 | Terumo Corp | DEVICE FOR MEASURING THE CONCENTRATION AND OXYGEN SATURATION OF HEMOGLOBIN. |
| US4819752A (en)* | 1987-10-02 | 1989-04-11 | Datascope Corp. | Blood constituent measuring device and method |
| US4854699A (en)* | 1987-11-02 | 1989-08-08 | Nippon Colin Co., Ltd. | Backscatter oximeter |
| US4846183A (en)* | 1987-12-02 | 1989-07-11 | The Boc Group, Inc. | Blood parameter monitoring apparatus and methods |
| US4800885A (en)* | 1987-12-02 | 1989-01-31 | The Boc Group, Inc. | Blood constituent monitoring apparatus and methods with frequency division multiplexing |
| US4883353A (en)* | 1988-02-11 | 1989-11-28 | Puritan-Bennett Corporation | Pulse oximeter |
| JPH06169902A (en)* | 1988-05-05 | 1994-06-21 | Sentinel Monitoring Inc | Pulse type non-invasion type oxymeter and technology for measuring it |
| DE3884191T2 (en)* | 1988-05-09 | 1994-01-13 | Hewlett Packard Gmbh | Processing method of signals, especially for oximetry measurements in living human tissue. |
| JPH06103257B2 (en)* | 1988-12-19 | 1994-12-14 | 大塚電子株式会社 | Method and apparatus for measuring absorption coefficient of substance using light scattering |
| US5061632A (en)* | 1989-01-31 | 1991-10-29 | Board Of Regents, The University Of Texas System | Capillary tube hemoglobinometer and oximeter |
| US5190038A (en)* | 1989-11-01 | 1993-03-02 | Novametrix Medical Systems, Inc. | Pulse oximeter with improved accuracy and response time |
| EP0613653B1 (en)* | 1990-02-15 | 1996-11-13 | Hewlett-Packard GmbH | Method for non-invasive measurement of oxygen saturation |
| US5349952A (en)* | 1991-03-05 | 1994-09-27 | Sensormedics Corp. | Photoplethysmographics using phase-division multiplexing |
| US5343818A (en)* | 1991-03-05 | 1994-09-06 | Sensormedics Corp. | Photoplethysmographics using energy-reducing waveform shaping |
| EP0527703B1 (en)* | 1991-08-12 | 1995-06-28 | AVL Medical Instruments AG | Device for measuring at least one gaseous concentration level in particular the oxygen concentration level in blood |
| US5277181A (en)* | 1991-12-12 | 1994-01-11 | Vivascan Corporation | Noninvasive measurement of hematocrit and hemoglobin content by differential optical analysis |
| US5385143A (en)* | 1992-02-06 | 1995-01-31 | Nihon Kohden Corporation | Apparatus for measuring predetermined data of living tissue |
| US5355880A (en)* | 1992-07-06 | 1994-10-18 | Sandia Corporation | Reliable noninvasive measurement of blood gases |
| US5553615A (en)* | 1994-01-31 | 1996-09-10 | Minnesota Mining And Manufacturing Company | Method and apparatus for noninvasive prediction of hematocrit |
| US5692503A (en)* | 1995-03-10 | 1997-12-02 | Kuenstner; J. Todd | Method for noninvasive (in-vivo) total hemoglobin, oxyhemogolobin, deoxyhemoglobin, carboxyhemoglobin and methemoglobin concentration determination |
| US5842979A (en)* | 1997-02-14 | 1998-12-01 | Ohmeda Inc. | Method and apparatus for improved photoplethysmographic monitoring of oxyhemoglobin, deoxyhemoglobin, carboxyhemoglobin and methemoglobin |
- 1997
- 1997-04-09USUS08/835,289patent/US5891024A/ennot_activeExpired - Lifetime
- 1998
- 1998-03-20EPEP98302120Apatent/EP0871026A3/ennot_activeWithdrawn
- 1998-04-06JPJP10093431Apatent/JPH10318915A/enactivePending
Cited By (4)
| Publication number | Priority date | Publication date | Assignee | Title |
|---|---|---|---|---|
| EP1385418A1 (en)* | 2001-05-07 | 2004-02-04 | Cardiosafe International AG | Device for monitoring a patient |
| EP1273260A1 (en)* | 2001-07-02 | 2003-01-08 | Trion AG | Earlobes sensor |
| US12156751B2 (en) | 2015-09-25 | 2024-12-03 | Trilinear Bioventures, Llc | System and method for determining blood disorders for a blood type using PPG technology |
| EP3709872A4 (en)* | 2017-11-13 | 2021-08-04 | Sanmina Corporation | System and method for blood typing using ppg technology |
Also Published As
| Publication number | Publication date |
|---|---|
| US5891024A (en) | 1999-04-06 |
| JPH10318915A (en) | 1998-12-04 |
| EP0871026A3 (en) | 1999-01-13 |
Similar Documents
| Publication | Publication Date | Title |
|---|---|---|
| US5891024A (en) | Two stage calibration and analyte measurement scheme for spectrophotomeric analysis | |
| EP1478265B1 (en) | Active pulse spectrophotometry | |
| EP0619981B1 (en) | Arterial blood monitoring probe | |
| EP0850013B1 (en) | Procedure for the determination of fractional oxygen saturation | |
| US5983122A (en) | Apparatus and method for improved photoplethysmographic monitoring of multiple hemoglobin species using emitters having optimized center wavelengths | |
| US5842979A (en) | Method and apparatus for improved photoplethysmographic monitoring of oxyhemoglobin, deoxyhemoglobin, carboxyhemoglobin and methemoglobin | |
| US6456862B2 (en) | Method for non-invasive spectrophotometric blood oxygenation monitoring | |
| Wang et al. | Noninvasive hemoglobin measurement using unmodified smartphone camera and white flash | |
| AU2003254135B2 (en) | Method for spectrophotometric blood oxygenation monitoring | |
| US6754515B1 (en) | Stabilization of noisy optical sources in photoplethysmography | |
| US8515514B2 (en) | Compensation of human variability in pulse oximetry | |
| US6526301B2 (en) | Direct to digital oximeter and method for calculating oxygenation levels | |
| US9341565B2 (en) | Multiple-wavelength physiological monitor | |
| US20030028086A1 (en) | Pulse oximetry method and system with improved motion correction | |
| JP2009507569A (en) | Continuous spectroscopic measurement of total hemoglobin | |
| US20120310060A1 (en) | Method of analyzing photon density waves in a medical monitor | |
| EP0555553A2 (en) | Improved arterial blood monitoring system | |
| AU1839300A (en) | Direct to digital oximeter and method for calculating oxygenation levels |
Legal Events
| Date | Code | Title | Description |
|---|---|---|---|
| PUAI | Public reference made under article 153(3) epc to a published international application that has entered the european phase | Free format text:ORIGINAL CODE: 0009012 | |
| AK | Designated contracting states | Kind code of ref document:A2 Designated state(s):AT BE CH DE DK ES FI FR GB GR IE IT LI LU MC NL PT SE | |
| AX | Request for extension of the european patent | Free format text:AL;LT;LV;MK;RO;SI | |
| PUAL | Search report despatched | Free format text:ORIGINAL CODE: 0009013 | |
| AK | Designated contracting states | Kind code of ref document:A3 Designated state(s):AT BE CH DE DK ES FI FR GB GR IE IT LI LU MC NL PT SE | |
| AX | Request for extension of the european patent | Free format text:AL;LT;LV;MK;RO;SI | |
| 17P | Request for examination filed | Effective date:19990707 | |
| RAP1 | Party data changed (applicant data changed or rights of an application transferred) | Owner name:DATEX-OHMEDA, INC. | |
| AKX | Designation fees paid | Free format text:DE ES FR GB IT NL | |
| STAA | Information on the status of an ep patent application or granted ep patent | Free format text:STATUS: THE APPLICATION IS DEEMED TO BE WITHDRAWN | |
| 18D | Application deemed to be withdrawn | Effective date:20031001 |