CN1926489B - Data presentation system for preventing abnormal conditions in processing plants - Google Patents
Data presentation system for preventing abnormal conditions in processing plantsDownload PDFInfo
- Publication number
- CN1926489B CN1926489BCN2005800068889ACN200580006888ACN1926489BCN 1926489 BCN1926489 BCN 1926489BCN 2005800068889 ACN2005800068889 ACN 2005800068889ACN 200580006888 ACN200580006888 ACN 200580006888ACN 1926489 BCN1926489 BCN 1926489B
- Authority
- CN
- China
- Prior art keywords
- spm
- data
- correlation
- correlation matrix
- shows
- Prior art date
- Legal status (The legal status is an assumption and is not a legal conclusion. Google has not performed a legal analysis and makes no representation as to the accuracy of the status listed.)
- Expired - Lifetime
Links
Images


Landscapes
- Testing And Monitoring For Control Systems (AREA)
Abstract
Description
Translated fromChinese相关申请的交叉参考Cross References to Related Applications
本申请要求于2004年3月3日提交、题为“加工厂中的异常状况预防”的美国临时专利申请No.60/549,796的权利,其全部公开内容全文合并于本申请中以用作各种目的。This application claims the benefit of U.S. Provisional Patent Application No. 60/549,796, entitled "Prevention of Abnormal Conditions in a Processing Plant," filed March 3, 2004, the entire disclosure of which is hereby incorporated by reference in its entirety into this application. kind of purpose.
本申请还涉及到以下专利申请:This application is also related to the following patent applications:
美国专利申请号:______,(代理备案号No.30203/39746),其与本申请同日提交、题为“用于加工厂中的异常状况预防的配置系统和方法”;U.S. Patent Application No.: ______, (Proxy Record No. 30203/39746), which was filed on the same day as this application, entitled "Configuration System and Method for Abnormal Situation Prevention in Processing Plant";
美国专利申请号:______,(代理备案号No.30203/40055),其与本申请同日提交、题为“加工厂中的异常状况预防”。U.S. Patent Application No.: ______, (Attorney Filing No. 30203/40055), filed on the same day as this application, entitled "Prevention of Abnormal Situations in Processing Plants".
以上参考的专利申请的全部公开内容全文合并于本申请请中以用作各种目的。The entire disclosures of the above-referenced patent applications are incorporated in their entireties into this application for all purposes.
技术领域technical field
本发明总体上涉及加工厂中诊断和维护的执行,具体涉及以减少或防止加工厂中的异常状况的方式来提供加工厂的预测性诊断能力。The present invention relates generally to the performance of diagnostics and maintenance in process plants, and more particularly to providing predictive diagnostic capabilities for process plants in a manner that reduces or prevents abnormal conditions in process plants.
背景技术Background technique
过程控制系统,例如用于化学、石油或其它过程中的过程控制系统,通常包括一个或更多个集中式或分布式过程控制器,这些过程控制器通过模拟、数字或模拟/数字混合总线,通信连接到至少一个主机或操作员工作站以及一个或更多个过程控制和仪器设备,例如现场设备等。现场设备可以是例如阀、阀门定位器、开关、变送器以及传感器(例如,温度、压力以及流速传感器),它们设置于加工厂环境中并且在过程中执行各种功能,例如打开或关闭阀、测量过程参数、增加或降低流体流动等。智能现场设备,例如符合公知的FOUNDATIONTM现场总线(下文中称为Fieldbus)协议或HART
通常设置于加工厂环境中的过程控制器,接收表示由现场设备产生或与现场设备有关的过程测量或过程变量的信号和/或属于现场设备的其它信息,并执行控制器应用程序。举例来说,该控制器应用程序实现不同的控制模块,这些控制模块根据接收到的信息进行过程控制决策、产生控制信号,并与正在诸如HART和Fieldbus现场设备之类的现场设备中执行的控制模块或块(block)协调工作。过程控制器中的控制模块通过通信线路或信号通路发送控制信号到现场设备,从而控制过程的操作。A process controller, typically located in a process plant environment, receives signals representing process measurements or process variables produced by or related to the field devices and/or other information pertaining to the field devices and executes a controller application. As an example, the controller application implements different control modules that make process control decisions based on the information received, generate control signals, and communicate with the control being performed in field devices such as HART and Fieldbus field devices Modules or blocks work together in harmony. The control modules in the process controllers send control signals to the field devices over communication lines or signal pathways to control the operation of the process.
来自现场设备和过程控制器的信息通常可用于一个或更多其它硬件设备,例如操作员工作站、维护工作站、个人计算机、便携式设备、数据历史记录器、报告发生器、集中数据库等,以使操作员或维护人员能够执行与过程有关的所需功能,例如改变过程控制程序的设置、修改过程控制器或智能现场设备中控制模块的操作、查看过程或加工厂中特定设备的当前状态、查看由现场设备和过程控制器产生的警报、仿真过程的操作以培训人员或测试过程控制软件、诊断加工厂中的问题或硬件故障等。Information from field devices and process controllers is often made available to one or more other hardware devices, such as operator workstations, maintenance workstations, personal computers, portable devices, data historians, report generators, centralized databases, etc., to enable operational process-related functions such as changing the settings of a process control program, modifying the operation of a control module in a process controller or intelligent field device, viewing the current status of a particular Alarms generated by field devices and process controllers, simulating the operation of a process to train personnel or test process control software, diagnosing problems or hardware failures in process plants, etc.
一个典型的加工厂在具有连接到一个或更多过程控制器的许多过程控制和测量设备,例如阀、变送器、传感器等的同时,还有许多其它对于过程操作来说必需或相关的辅助设备。这些附加设备包括,例如电源设备、发电和配电设备、诸如涡轮机、电动机之类的转动设备等,它们设置于一个典型工厂的多个地方。虽然这些附加设备不需要产生或使用过程变量,并且在许多情况下,会为了影响过程操作而不受过程控制器控制甚或不连接到过程控制器,但是对于过程的适当操作而言,这些设备不但是重要的而且最终是必需的。While a typical process plant has many process control and measurement devices, such as valves, transmitters, sensors, etc., connected to one or more process controllers, there are many other auxiliaries that are necessary or relevant to the operation of the process equipment. These additional equipment include, for example, power supply equipment, power generation and distribution equipment, rotating equipment such as turbines, electric motors, etc., which are located at various places in a typical plant. Although these additional devices are not required to generate or use process variables, and in many cases are not controlled or even connected to the process controller in order to affect process operation, these devices are not necessary for proper operation of the process. But important and ultimately required.
已知的,问题经常出现在加工厂环境中,特别是出现在具有大量现场设备和辅助设备的加工厂中。这些问题可表现为使设备、逻辑部件故障或失灵,例如处于不当模式的软件程序、进行了不适当调整的过程控制环、加工厂内设备之间通信的一个或更多故障等。这些或其它问题虽然实际上有多种,但是它们通常导致过程在通常与加工厂的次最优性能有关的异常状态操作(即,加工厂处于异常状况)。已开发许多诊断工具和应用程序,以便检测并且确定加工厂中的问题的原因,并且在问题已经发生并且被检测到时,帮助操作员或维护人员诊断和改正这些问题。例如,通常通过诸如直接或无线总线、以太网、调制解调器、电话线之类的通信连接连接到过程控制器的操作员工作站,具有适于运行软件或固件的处理器和存储器,例如由爱默生过程管理出售的DeltaTM和Ovation控制系统,这些系统包括众多控制模块和控制环诊断工具。同样地,可通过与控制器应用程序相同的通信连接或通过诸如用于过程控制的对象链接与嵌入技术(OPC)连接、便携式连接之类的不同通信连接连接到诸如现场设备的过程控制设备的维护工作站,通常包括一个或更多应用程序,这些应用程序设计为查看由加工厂中的现场设备产生的维护警报和警示,以测试加工厂中的设备并执行对加工厂中的现场设备和其它设备的维护活动。已经开发了相似的诊断应用程序,以诊断加工厂中辅助设备的问题。It is known that the problem often arises in process plant environments, especially in process plants with a large number of field devices and auxiliary equipment. These problems may manifest as malfunctioning or malfunctioning of equipment, logical components such as a software program in an improper mode, an improperly tuned process control loop, one or more failures in communication between equipment within a process plant, etc. These and other problems, though varied in nature, often result in the process operating in an abnormal state (ie, the process plant is in an abnormal condition) often associated with sub-optimal performance of the process plant. Many diagnostic tools and applications have been developed in order to detect and determine the cause of problems in process plants, and to assist operators or maintenance personnel in diagnosing and correcting problems when they have occurred and been detected. For example, an operator workstation typically connected to a process controller by a communication connection such as a direct or wireless bus, Ethernet, modem, telephone line, etc., having a processor and memory suitable for running software or firmware, such as those developed by Emerson Process Management sells DeltaTM and Ovation control systems that include numerous control modules and control loop diagnostic tools. Likewise, connections to process control devices such as field devices can be made through the same communication connection as the controller application or through a different communication connection such as Object Link and Embedded Technology (OPC) connections for process control, portable connections A maintenance workstation, typically consisting of one or more applications designed to view maintenance alarms and alerts generated by field devices in the process plant, to test the equipment in the process plant and to perform maintenance on field devices in the process plant and other Equipment maintenance activities. Similar diagnostic applications have been developed to diagnose problems with auxiliary equipment in process plants.
因此,例如由爱默生过程管理出售的资产管理解决方案(AMS)应用程序(至少部分公开在题为“用在现场设备管理系统中的集成通信网络”的美国专利NO.5,960,214中),能够与现场设备通信并且存储属于现场设备的数据以确定并跟踪现场设备的操作。在某些例子中,AMS应用程序可以用于与现场设备通信以改变该现场设备中的参数,从而使得该现场设备运行自身的应用程序,例如自校准程序或自诊断程序,以获得关于该现场设备的状态或健全程度(health)的信息。该信息可以包括,例如状态信息(例如,警报或其它相似事件是否已经发生)、设备配置信息(例如,现场设备当前的方式或可被配置的方式以及由该现场设备使用的测量单元的类型)、设备参数(例如,现场设备范围值以及其它参数)等。当然,这些信息可以由维护人员使用以监控、维护、以及/或诊断现场设备中的问题。Thus, for example, the Asset Management Solutions (AMS) application sold by Emerson Process Management (disclosed at least in part in U.S. Patent No. 5,960,214, entitled "Integrated Communications Network for Use in a Field Device Management System"), can Communicates with the field devices and stores data pertaining to the field devices to determine and track operation of the field devices. In some examples, an AMS application can be used to communicate with a field device to change parameters in the field device, causing the field device to run its own application, such as a self-calibration or self-diagnostic program, to obtain information about the field Information about the status or health of the device. This information may include, for example, status information (e.g., whether an alarm or other similar event has occurred), device configuration information (e.g., the way the field device is currently or can be configured and the type of measurement unit being used by the field device) , device parameters (for example, field device range values and other parameters), etc. Of course, this information can be used by maintenance personnel to monitor, maintain, and/or diagnose problems in field devices.
相似地,许多加工厂包括设备监控和诊断应用程序,例如由CSI系统提供的RBM产品(ware),或用于监控、诊断以及优化各种转动设备的操作状态的任何其它已知的应用程序。维护人员通常使用这些应用程序以维护和检查工厂中的转动设备的性能,以确定转动设备的问题,并且确定转动设备何时以及是否必须要修理或替换。同样地,许多加工厂包括电力控制和诊断应用程序,例如由Liebert以及ASCO公司提供的应用程序,以控制和维护发电和配电设备。公知地,在加工厂中运行控制优化应用程序,例如实时优化器(RTO+),以优化加工厂的控制活动。这样的优化应用程序通常使用复杂的算法和/或加工厂的模型,来预测如何改变输入来优化加工厂的与某些需要优化的变量例如利润相关的操作。Similarly, many process plants include equipment monitoring and diagnostic applications, such as the RBM ware provided by CSI Systems, or any other known application for monitoring, diagnosing, and optimizing the operating status of various rotating equipment. These applications are commonly used by maintenance personnel to maintain and check the performance of rotating equipment in a plant, to identify problems with rotating equipment, and to determine when and whether rotating equipment must be repaired or replaced. Likewise, many process plants include power control and diagnostic applications, such as those provided by Liebert and ASCO, to control and maintain power generation and distribution equipment. It is known to run control optimization applications, such as Real Time Optimizer (RTO+), in process plants to optimize the control activities of the process plant. Such optimization applications typically use complex algorithms and/or models of the process plant to predict how to change inputs to optimize the process plant's operations relative to certain variables that need to be optimized, such as profit.
在一个或更多操作员工作站或维护工作站中,这些以及其它的诊断和优化应用程序通常以泛系统(system-wide)为基础来实现,并且可以根据加工厂或加工厂中的设备和装置的操作状态,向操作员工作站或维护工作站提供预先配置的显示。典型的显示包括:警报显示,其接收由加工厂中的过程控制器或其它设备产生的警报;控制显示,其表示加工厂中的过程控制器和其它设备的操作状态;维护显示,其表示加工厂中各个设备的操作状态等。同样地,这些和其它诊断应用程序可以使操作员或维护人员重新调整控制环或复位其它控制参数,以对一个或更多现场设备运行测试,确定这些现场设备的当前状态,从而校准现场设备或其它装置,或执行对加工厂中各个设备和装置的其它问题的检测以及改正活动。These and other diagnostic and optimization applications are usually implemented on a system-wide basis in one or more operator workstations or maintenance workstations and can be based on the Operational status, providing pre-configured displays to operator workstations or maintenance workstations. Typical displays include: alarm displays, which receive alarms generated by process controllers or other equipment in a process plant; control displays, which indicate the operating status of process controllers and other equipment in a process plant; maintenance displays, which indicate process The operating status of each equipment in the factory, etc. Likewise, these and other diagnostic applications may allow an operator or maintenance person to retune control loops or reset other control parameters, to run tests on one or more field devices, to determine the current status of those field devices, to calibrate field devices or Other devices, or perform detection and corrective activities for other problems with various equipment and devices in the process plant.
虽然各种应用程序和工具对识别以及改正加工厂中的问题是非常有帮助的,但这些诊断应用程序通常配置为在问题已经出现在加工厂中之后才使用,因此就是在异常状况已经存在于加工厂中以后。令人遗憾地,在使用这些工具检测、识别以及改正异常状况之前,异常状况可能就存在一段时间了,这导致在问题被检测、识别以及改正过程的时间段中加工厂性能为次最优。在许多情况下,根据警报、警示或加工厂不佳性能,控制操作员会首先检测到存在一些问题。该操作员之后会将潜在问题通知给维护人员。该维护人员可能检测到也可能检测不到真正的问题,并且可能需要在真正运行测试或其它诊断应用程序之前进一步提示(prompt),或执行识别这些真正问题所需的其它活动。一旦识别出问题,维护人员可能需要确定部件并规划一份维护流程,所有的这些都会导致在一个问题出现和该问题得到改正之间出现一个明显的时间段,在该时间段内,加工厂运行在通常与工厂的次最优操作有关异常状况下。While various applications and tools are very helpful in identifying and correcting problems in a processing plant, these diagnostic applications are usually configured to be used after the problem has already After the processing plant. Unfortunately, abnormal conditions may exist for some time before they are detected, identified, and corrected using these tools, resulting in sub-optimal process plant performance during the time period during which the problem is detected, identified, and corrected. In many cases, control operators are the first to detect that something is wrong based on alarms, warnings or poor process plant performance. The operator then notifies maintenance personnel of the potential problem. The maintainer may or may not detect real problems, and may need to prompt further, or perform other activities needed to identify these real problems, before actually running tests or other diagnostic applications. Once a problem is identified, maintenance personnel may need to identify components and plan a maintenance process, all of which result in a significant period between when a problem occurs and when it is corrected, during which time the processing plant is running In exceptional conditions usually associated with sub-optimal operation of the plant.
另外,许多加工厂会经历一种导致加工厂在相对短的时间内出现重大的花费或损害的异常状况。例如,如果存在某些异常状况,那么即便它们存在很短时间,这些异常状况也能够带来对设备的重大损害、原材料的损失、或加工厂中非预期的重大停工期。因此,仅在加工厂中问题已经出现之后检测问题,不管问题改正得有多快,都可能导致加工厂中的重大损失或损害。因此,理想的情况是首先尽力防止异常状况出现,而不是简单地在异常状况出现后尽力反应和改正加工厂中的问题。Additionally, many processing plants experience an abnormal condition that results in significant cost or damage to the processing plant within a relatively short period of time. For example, if certain abnormal conditions exist, even if they exist for a short period of time, these abnormal conditions can cause significant damage to equipment, loss of raw materials, or unexpected significant downtime in processing plants. Therefore, detecting a problem only after it has already arisen in the processing plant, no matter how quickly the problem is corrected, can result in significant loss or damage in the processing plant. Therefore, the ideal situation is to try to prevent abnormal conditions in the first place, rather than simply try to react and correct problems in the processing plant after abnormal conditions occur.
目前,存在一种可以用于采集数据的技术,该技术能使用户在异常状况真正出现以前,预测在加工厂中发生的某些异常状况,从而在加工厂中出现任何重大损失之前,采取措施以防止所预测的异常状况。这个流程公开在题为“根源诊断”的美国专利申请序号No.09/972,078(部分基于美国专利申请NO.08/623,569,现美国专利No.6,017,143)中。这两个申请的全部公开内容合并于此以资参考。一般地,该技术在加工厂的许多设备,例如现场设备的每一个中,设置统计数据采集和处理模块或统计处理监控(SPM)模块。例如,统计数据采集和处理模块采集过程变量数据,并且确定某些与采集的数据有关的统计测量值,例如平均值、中间值、标准偏差等。这些统计测量值随后可以发送给用户,并且被分析以识别用于暗示已知异常状况即将发生的模式(pattern)。若检测到一个特定的可疑的将要发生的异常状况,则首先采取措施以改正潜在的问题,从而避免异常状况。但是,对于典型的维护人员来说,采集和分析数据可能是耗时并沉闷的,尤其是在具有大量用来采集统计数据的现场设备的加工厂中。而且进一步地,当一名维护人员能够采集统计数据时,该维护人员可能不知道怎样去最好地分析或查看数据,或确定这些数据都暗示了哪些即将发生的异常状况,如果有的话。Currently, there is a technology that can be used to collect data that enables the user to predict certain abnormal conditions that occur in the processing plant before they actually occur, so that measures can be taken before any major losses occur in the processing plant. In order to prevent the abnormal situation predicted. This procedure is disclosed in US Patent Application Serial No. 09/972,078 entitled "Root Root Diagnosis" (based in part on US Patent Application No. 08/623,569, now US Patent No. 6,017,143). The entire disclosures of these two applications are hereby incorporated by reference. Generally, this technique provides a statistical data acquisition and processing module or a statistical processing monitor (SPM) module in each of many devices in a processing plant, such as field devices. For example, the statistical data collection and processing module collects process variable data and determines certain statistical measurements related to the collected data, such as mean, median, standard deviation, and the like. These statistical measurements can then be sent to a user and analyzed to identify patterns that suggest that a known abnormal condition is about to occur. If a specific suspected impending abnormal condition is detected, first steps are taken to correct the underlying problem, thereby avoiding the abnormal condition. However, collecting and analyzing data can be time-consuming and tedious for typical maintenance personnel, especially in process plants with a large number of field devices used to collect statistical data. And further, while a maintenance person is able to collect statistical data, the maintenance person may not know how to best analyze or view the data, or determine what impending abnormal conditions, if any, these data indicate.
而且,一般地,配置工厂以收集和查看由各个SPM产生的全部统计过程数据是非常麻烦和沉闷的,尤其是在大型加工厂中。事实上,目前用户通常必须创建分别监控不同现场设备中感兴趣的每一个参数的OPC客户端,这意味着每个现场设备都必须分别配置以采集这些数据。这一配置过程非常耗时并且易受到人为错误的损害。Also, generally, configuring a plant to collect and view all the statistical process data produced by the various SPMs is very cumbersome and tedious, especially in large processing plants. In fact, currently users typically have to create OPC clients that monitor each parameter of interest in different field devices separately, which means that each field device must be configured separately to collect this data. This configuration process is time-consuming and vulnerable to human error.
发明内容Contents of the invention
一种用于可视化呈现数据的系统,其接收与加工厂相关的设备对应的信号处理数据收集模块所产生的信号处理数据。该信号处理数据收集模块可以产生诸如统计数据、频率分析数据、自回归数据、小波数据之类的数据。该系统显示代表设备并代表这些设备在加工厂中的情况(context)的图像。另外,显示以至少一台设备对应的信号处理数据为根据的数据。例如,可显示针对设备的信号处理数据。作为另一示例,可基于信号处理数据产生数据并显示所产生的数据。任选地,该系统可以提供允许用户选择以信号处理数据为根据的数据待在其上显示的一个或更多设备的用户界面。A system for visually presenting data, which receives signal processing data generated by a signal processing data collection module corresponding to equipment related to a processing plant. The signal processing data collection module can generate data such as statistical data, frequency analysis data, autoregressive data, wavelet data and the like. The system displays images representing the equipment and representing the context of those equipment in the process plant. In addition, data based on signal processing data corresponding to at least one device is displayed. For example, signal processing data for a device can be displayed. As another example, data may be generated based on signal processing data and the generated data displayed. Optionally, the system may provide a user interface that allows a user to select one or more devices on which data based on the signal processing data is to be displayed.
附图说明Description of drawings
图1是一个加工厂的示例方框图,该加工厂具有一个分布式控制和维护网络,其中该网络包括一个或更多个操作员和维护工作站、控制器、现场设备以及辅助设备;Figure 1 is an example block diagram of a process plant having a distributed control and maintenance network, wherein the network includes one or more operator and maintenance workstations, controllers, field devices, and auxiliary equipment;
图2是图1的加工厂的一部分的示例方框图,其示出了位于加工厂的不同部件中的异常状况预防系统的各个元件之间的通信互联;2 is an example block diagram of a portion of the process plant of FIG. 1 showing the communication interconnection between various elements of the abnormal condition prevention system located in different parts of the process plant;
图3是在图1或图2的加工厂的一种设备中的一组统计过程监控模块的配置的显示;FIG. 3 is a display of the configuration of a set of statistical process monitoring modules in a device of the processing plant of FIG. 1 or FIG. 2;
图4是配置加工厂中的统计过程采集模块并且在加工厂的操作期间从这些模块采集统计数据的技术的流程图;4 is a flowchart of a technique for configuring statistical process collection modules in a processing plant and collecting statistical data from these modules during operation of the processing plant;
图5是一幅显示屏幕图,其示出了图1或图2的加工厂中OPC服务器所采集的工厂分级结构(hierarchy);Fig. 5 is a display screen diagram showing the plant hierarchy (hierarchy) collected by the OPC server in the processing plant of Fig. 1 or Fig. 2;
图6是一幅显示屏幕图,其示出了与具有统计过程监控模块的设备有关的工厂部件的分级结构;Figure 6 is a display screen diagram showing a hierarchy of plant components associated with equipment having a statistical process monitoring module;
图7是一幅显示屏幕图,其使用户能够选择在统计过程监控模块中待监控的一组统计过程监控参数;7 is a diagram of a display screen that enables a user to select a set of statistical process monitoring parameters to be monitored in the statistical process monitoring module;
图8是一幅显示屏幕图,其可以被提供以示出在具有统计过程监控模块的设备中产生的采集统计过程监控数据;FIG. 8 is a display screen diagram that may be provided to illustrate collecting statistical process monitoring data generated in a device having a statistical process monitoring module;
图9是一幅显示屏幕图,其示出了浏览器分级结构,该分级结构包括从设备中数据采集模块采集的统计数据元素;Fig. 9 is a display screen diagram showing a browser hierarchy, which includes statistical data elements collected from the data collection module in the device;
图10是一幅显示屏幕图,其示出了在现场设备中增加或配置统计数据采集模块的方式;Fig. 10 is a display screen diagram, which shows the way to add or configure the statistical data acquisition module in the field device;
图11是一幅显示屏幕图,其示出了用户可以操纵以查看趋势数据的方式;Figure 11 is a display screen diagram showing the manner in which a user may manipulate to view trend data;
图12是一幅显示屏幕图,其示出了用户可以操纵以查看从统计采集模块所采集的原始数据的方式;Figure 12 is a display screen diagram showing the manner in which a user may manipulate to view raw data collected from the statistics collection module;
图13是一幅显示屏幕图,其示出了统计过程监控参数对时间的曲线图;Figure 13 is a display screen diagram showing a graph of statistical process monitoring parameters versus time;
图14是一幅显示屏幕图,其示出了一组不同统计过程监控数据对时间的四条曲线,其中每个都具有在同一曲线上描述的一个或更多参数;14 is a display screen diagram showing a set of four different curves of statistical process monitoring data versus time, each of which has one or more parameters depicted on the same curve;
图15是一幅显示屏幕图,其示出了统计过程监控参数的直方图,包括控制界限和规定界限;Figure 15 is a display screen diagram showing a histogram of statistical process monitoring parameters, including control limits and regulatory limits;
图16是一幅显示屏幕图,示出了统计过程监控数据对时间的X管制图;Fig. 16 is a display screen diagram showing an X control diagram of statistical process monitoring data versus time;
图17是一幅显示屏幕图,示出了统计过程监控数据对时间的S管制图;Fig. 17 is a display screen diagram showing an S control diagram of statistical process monitoring data versus time;
图18是一幅显示屏幕图,示出了一组统计过程监控参数的二维散布图;Figure 18 is a display screen diagram showing a two-dimensional scatter plot of a set of statistical process monitoring parameters;
图19是一幅显示屏幕图,示出了一组三个统计过程监控参数的三维散布图;Figure 19 is a display screen diagram showing a three-dimensional scatter plot of a set of three statistical process monitoring parameters;
图20是一幅显示屏幕图,示出了一组四个统计过程监控参数的四维散布图;Figure 20 is a display screen diagram showing a four-dimensional scatter plot of a set of four statistical process monitoring parameters;
图21是一幅显示屏幕图,示出了一组统计过程监控参数的相关矩阵;Figure 21 is a display screen diagram showing a correlation matrix for a set of statistical process monitoring parameters;
图22是一幅显示屏幕图,示出了描述图21的相关矩阵的一部分的三维条形图;FIG. 22 is a display screen diagram showing a three-dimensional bar graph depicting a portion of the correlation matrix of FIG. 21;
图23是一幅显示屏幕图,示出了表示与期望相关域偏差的相关域曲线;Fig. 23 is a display screen diagram showing correlation domain curves showing deviations from expected correlation domains;
图24是一幅显示屏幕图,示出了一色码相关度矩阵;Figure 24 is a display screen diagram showing a color-coded correlation matrix;
图25是一幅显示屏幕图,示出了一个提供了对所选择设备的过程变量的两种测量值之间进行比较的比较图表,以及使用户能够查看其它比较的用户接口部件;25 is a display screen diagram showing a comparison chart providing a comparison between two measurements of a process variable for a selected device, and user interface components enabling a user to view other comparisons;
图26是一幅显示屏幕图,示出了两个统计监控过程参数对时间的曲线,表明了这些参数之间已知的相关性;Fig. 26 is a display screen diagram showing two statistically monitored process parameters versus time, showing known correlations between these parameters;
图27是一幅显示屏幕图,示出了一个相关值对时间的曲线;Figure 27 is a display screen diagram showing a correlation value versus time curve;
图28是一幅显示屏幕图,示出了多个相关值对时间的曲线;Fig. 28 is a display screen diagram showing a plurality of correlation value versus time curves;
图29是一幅显示屏幕图,示出了一个相关值和一个基准值对时间的曲线;Figure 29 is a display screen diagram showing a correlation value and a reference value versus time;
图30是一幅显示屏幕图,示出了对于一组统计过程监控参数的相关变化矩阵;Fig. 30 is a display screen diagram showing a correlation change matrix for a set of statistical process monitoring parameters;
图31是一幅显示屏幕图,示出了一个色码相关度变化矩阵;Figure 31 is a display screen diagram showing a color code correlation change matrix;
图32是一幅显示屏幕图,示出了一个总相关值对时间的曲线;Figure 32 is a display screen diagram showing a total correlation value versus time;
图33是一幅显示屏幕图,示出了一个色码相关度变化矩阵和一个总相关值对时间的曲线;Fig. 33 is a display screen diagram showing a color code correlation change matrix and a curve of total correlation value versus time;
图34是一幅相关值和对应于最佳拟合线的斜率的角的极坐标图;Figure 34 is a polar plot of correlation values and angles corresponding to the slope of the line of best fit;
图3 5是一幅显示屏幕图,示出了多个相关值以及对应于各个最佳拟合线的斜率的角的极坐标图;Figure 35 is a display screen diagram showing a plurality of correlation values and a polar plot of the angle corresponding to the slope of each line of best fit;
图36是一幅显示屏幕图,示出了多个相关变化值和对应于各个最佳拟合线的斜率的角的极坐标图;Fig. 36 is a display screen diagram showing a polar plot of a plurality of relative change values and angles corresponding to the slopes of the respective lines of best fit;
图37是准则机开发和执行系统的方框图,该系统使用户能够创建并将准则应用到从加工厂采集的统计过程监控数据;Figure 37 is a block diagram of a Criteria Machine Development and Implementation System that enables users to create and apply criteria to statistical process monitoring data collected from a processing plant;
图3 8是一幅显示屏幕图,示出了一个使用户能够为图37的准则机开发和执行系统创建准则的配置屏幕;Figure 38 is a display screen diagram showing a configuration screen that enables a user to create criteria for the criteria machine development and execution system of Figure 37;
图39是一幅显示屏幕图,示出了准则执行机操作概要,该概要总结了由图37的准则机所使用的准则以及由该准则机所产生的警报;Fig. 39 is a display screen diagram showing a rule enforcement machine operation summary summarizing the rules used by the rule machine of Fig. 37 and the alarms generated by the rule machine;
图40是一幅显示屏幕图,示出了使用户能够为图37的准则机开发和执行系统创建准则的第二配置屏幕;Figure 40 is a display screen diagram showing a second configuration screen enabling a user to create criteria for the criteria machine development and execution system of Figure 37;
图41是一幅显示屏幕图,示出了使用户能够为图37的准则机开发和执行系统的创建准则的第三配置屏幕;Fig. 41 is a display screen diagram showing a third configuration screen enabling a user to create rules for the rule machine development and execution system of Fig. 37;
图42是一幅显示屏幕图,示出了加工厂的一部分,该显示包括报警/警示信息;Figure 42 is a screen shot of a display showing a portion of a processing plant, the display including alarm/alert messages;
图43是另一幅显示屏幕图,示出了加工厂的一部分,该显示包括报警/警示信息;Figure 43 is another screen shot of a display showing a portion of a processing plant, the display including alarm/alert messages;
图44是再一幅显示屏幕图,示出了加工厂的一部分,该显示包括报警/警示信息;Figure 44 is another display screen view showing a portion of a processing plant, the display including alarm/alert messages;
图45是又一幅显示屏幕图,示出了加工厂的一部分,该显示包括报警/警示信息;Figure 45 is yet another display screen shot showing a portion of a processing plant, the display including alarm/alert messages;
图46是连接在另一加工厂中以执行异常状况检测和预防的接口设备的图;以及Figure 46 is a diagram of an interface device connected in another processing plant to perform abnormal condition detection and prevention; and
图47是连接在又一加工厂中以执行异常状况检测和预防的接口设备的图。Figure 47 is a diagram of an interface device connected in yet another processing plant to perform abnormal condition detection and prevention.
具体实施方式Detailed ways
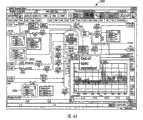
参照图1,在其中可以执行异常状况预防系统的示例性的加工厂10,包括通过一个或更多通信网络与辅助设备互相连接的许多控制和维护系统。特别地,图1的加工厂10包括一个或更多过程控制系统12和14。过程控制系统12可以是传统的过程控制系统,例如PROVOX或RS3系统或任何其它的控制系统,过程控制系统12包括操作员接口12A,该操作员接口连接到控制器12B和输入/输出(I/O)卡12C,该输入/输出(I/O)卡依次连接到各种现场设备,例如模拟现场设备和高速可寻址远程传感器(HART)现场设备15。可以是分布式过程控制系统的过程控制系统14,包括一个或更多操作员接口14A,操作员接口14A通过总线,例如以太网总线,连接到一个或更多分布式控制器14B。控制器14B可以是,例如由奥斯汀(Austin)、德克萨斯(Texas)的爱默生过程管理出售的DeltaVTM控制器或任何其它所需类型的控制器。控制器14B通过I/O设备连接到一个或更多现场设备16,例如Hart或Fieldbus现场设备或任何其它智能或非智能的现场设备,其包括,例如那些使用PROFIBUS


而且进一步地,维护系统,例如执行AMS应用程序或任何其它设备监控和通信应用程序的计算机,可以连接到过程控制系统12和14,或连接到其中的各个设备,以执行维护和监控活动。例如,通过任何需要的通信线路或网络(包括无线或便携式设备网络),维护计算机18可以连接到控制器12B和/或设备15,以便与设备15通信,并且在某些情况下,对设备15重配置或执行其它维护活动。同样地,维护应用程序,例如AMS应用程序,可以安装在与分布式过程控制系统14有关的一个或更多用户接口14A中,并且由这些用户接口来运行,以执行维护和监控功能,这些功能包括与设备16的操作状况有关的数据采集。Still further, a maintenance system, such as a computer executing an AMS application or any other equipment monitoring and communication application, may be connected to process
加工厂10还包括各种转动设备20,例如涡轮机、电动机等,它们通过一些永久性的或暂时性的通信链路(例如,连接到设备20以进行读取并在之后移除的总线、无线通信系统或便携式设备)连接到维护计算机22。维护计算机22可以存储并且执行已知的由例如CSI(爱默生过程管理公司)提供的监控和诊断应用程序23,或其它任何已知的用于诊断、监控以及优化转动设备20的操作状态的应用程序。维护人员通常使用应用程序23来维护并且检查工厂10中转动设备20的性能,以确定转动设备20的问题,并且确定转动设备20何时以及是否必须要修理或替换。在某些情况中,外部的咨询或服务组织可以暂时获取或测量与设备20有关的数据,并且使用该数据对设备20进行分析,从而检测问题、性能不佳或其它影响设备20的难题。在这些情况中,运行分析的计算机可以不通过任何通信线路连接到系统10的其余部分,或可以只是暂时连接到系统10的其余部分。The
同样地,具有与加工厂10有关的发电和配电设备25的发电和配电系统24,通过例如总线连接到其它计算机26,计算机26运行并检查加工厂10中的发电和配电设备25。计算机26可以执行已知的电力控制和诊断应用程序27,例如那些由Liebert以及ASCO或其它公司提供的程序,以控制和维护发电和配电设备25。而且,在许多情况下,外部的咨询员或服务组织可以使用暂时获取或测量的与设备25相关的数据的服务应用程序,并且使用该数据对设备25进行分析以检测问题、性能不佳或影响设备25的其它难题。在这些情况中,运行分析的计算机(例如,计算机26)可以不通过任何通信线路连接到系统10的其余部分,或可以只是暂时连接到系统10的其余部分。Likewise, a power generation and
如图1所示,计算机系统30执行异常状况预防系统35的至少一部分,并且特别地,计算机系统30存储并执行配置和数据采集应用程序38、可以包括统计采集和处理模块的查看或接口应用程序40、以及准则机开发和执行应用程序40,并且附加存储统计处理监控数据库43,统计处理监控数据库43存储过程中的某些设备中产生的统计数据。一般地,配置和数据采集应用程序38配置并且与许多统计数据采集和分析模块(图1中未示出)中的每个进行通信,这些模块位于现场设备15、16、控制器12B、14B、转动设备20或其辅助计算机22、发电设备25或其辅助计算机26以及加工厂中任何其它需要的设备和装置中,从而从这些模块中的每一个采集统计数据(或在某些情况中,采集过程变量数据),并利用这些数据来执行异常状况预防。配置和数据采集应用程序38可以通过硬布线总线45通信连接到加工厂中的每一个计算机或设备,或可替代地,可以通过任何其它需要的通信连接,包括例如无线连接、使用OPC的专用连接、例如依靠便携式设备以采集数据的间歇式连接等来通信连接。同样地,通过LAN或公共连接,例如以太网、电话连接等(图1所示为因特网连接46),应用程序38可以获得与加工厂10中现场设备和装置相关的数据,这些数据由例如第三方服务提供者采集。而且,通过各种技术和/或协议,包括例如以太网、Modbus、HTML、XML、专有技术/协议等,应用程序38可以通信连接到工厂10中的计算机/设备。因此,尽管在此处描述了使用OPC将应用程序38通信连接到加工厂10中的计算机/设备的具体示例,但是本领域的普通技术人员应该知道,也可使用将应用程序38连接到加工厂10中的计算机/设备的各种其它方法。通常,应用程序38可以在数据库43中存储所采集的数据。As shown in FIG. 1,
若采集到统计数据(或过程变量数据),则可使用查看应用程序40,以便以不同方式处理该数据和/或显示所采集或处理的统计数据(例如,存储在数据库43中的),以使用户例如维护人员,能够更好地确定异常状况存在或预测在将来存在,并且采取抢先的改正措施。准则机开发和执行应用程序42可以使用一个或更多存储在其中的准则,以分析采集的数据,从而确定加工厂10中异常状况存在或预测异常状况在将来存在。另外,准则机开发和执行应用程序42可以使操作员或其它用户创建待由准则机执行的附加准则,从而检测或预测异常状况。If statistical data (or process variable data) is collected,
图2示出了图1的示例性加工厂10的一部分50,以说明异常状况预防系统35执行统计数据采集的方式。虽然图2示出了异常状况预防系统应用程序38、40、42和数据库43以及HART和Fieldbus现场设备中的一个或更多数据采集模块之间的通信,但是可以理解,相似通信可以发生在异常状况预防系统应用程序38、40、42和加工厂10中的其它设备以及装置之间,包括图1所示的设备和装置中的任何一个。FIG. 2 shows a
图2所示的加工厂10的一部分50包括分布式过程控制系统54,该系统具有一个或更多过程控制器60,通过输入/输出(I/O)卡或设备68和70,其可以是符合任何所需的通信或控制器协议的任何所需类型的设备,过程控制器60连接到一个或更多现场设备64和66。尽管现场设备64在图中示为HART现场设备,而现场设备66在图中示为Fieldbus现场设备,但是这些现场设备可以使用任何其它所需的通信协议。另外,现场设备64和66可以是任何类型设备,例如传感器、阀、变送器、定位器等,并且可以符合任何所需的开放的、专有的或其它通信或程序化协议,应该理解,I/O设备68和70必须与现场设备64和66所使用的需要的协议兼容。A
无论如何,可由例如配置工程师、过程控制操作员、维护人员、工厂管理者、监督者等的工厂人员访问的一个或更多用户接口或计算机72和74(其可以是任何类型的个人计算机、工作站等),通过可以使用任何需要的硬布线或无线通信结构并使用任何需要的或适合的通信协议,例如以太网协议来实现的通信线路或总线76,连接到过程控制器60。另外,数据库78可以连接到通信总线76,以作为数据历史记录器来工作,其采集并且存储配置信息以及在线过程变量数据、参数数据、状态数据、以及与加工厂10中的过程控制器60和现场设备64和66有关的其它数据。因此,数据库78可以作为配置数据库来工作以存储当前配置,该当前配置包括过程配置模块以及用于过程控制系统54的控制配置信息,它们被下载并存储在过程控制器60以及现场设备64和66中。同样地,数据库78可以存储历史异常状况预防数据,其包括由加工厂10中的现场设备64和66采集的统计数据,或根据现场设备64和66采集的过程变量所确定的统计数据。Regardless, one or more user interfaces or computers 72 and 74 (which may be any type of personal computer, workstation, etc.) accessible by plant personnel such as configuration engineers, process control operators, maintenance personnel, plant managers, supervisors, etc. etc.), to the
虽然过程控制器60、I/O设备68和70、以及现场设备64和66通常向下设置于并遍布在有时严酷的工厂环境中,但是工作站72和74以及数据库78通常设置于控制室、维护室、或其它易于操作员、维护人员等使用的不太严酷的环境中。While
一般地,过程控制器60存储和执行一个或更多控制器应用程序,其使用许多不同的、独立执行的控制模块或块(block)以实现控制策略。这些控制模块的每个都可以由通常所称的功能块组成,其中每个功能块是整体控制程序的一部分或一个子程序,并且与其它功能块协作(通过所谓的链路通信),以实现加工厂中的过程控制环。如公知的,功能块可以是面向对象程序化协议中的对象,其通常执行输入功能、控制功能或输出功能中的一项功能,其中输入功能例如与变送器、传感器或其它过程参数测量设备有关的功能,控制功能例如与执行PID、模糊逻辑等控制的控制程序有关的功能,输出功能控制某些设备,例如阀的操作,以便在加工厂10中执行某些物理功能。当然,也存在混合以及其它类型的复合功能块,例如模型预测控制器(MPC)、优化器等。可以理解,虽然Fieldbus协议以及DeltaTM系统协议使用面向对象程序化协议中所设计和实现的控制模型和功能块,但控制模块可以使用任何需要的控制程序化方案来设计,包括例如时序功能块、梯形逻辑等,并且不限于使用功能块或任何其它特定程序化技术来设计。Generally, the
如图2所示,维护工作站74包括处理器74A、存储器74B以及显示设备74C。存储器74B以这样一种方式存储参照图1所述的异常状况预防应用程序38、40和42,即,使得这些应用程序能在处理器74A上执行,以便通过显示器74C(或任何其它显示设备,例如打印机)向用户提供信息。As shown in FIG. 2, the maintenance workstation 74 includes a processor 74A, a memory 74B, and a display device 74C. The memory 74B stores the abnormal
另外,如图2所示,现场设备64和66中的某些(并且可能全部的)包括数据采集和处理模块80和82。虽然为了讨论的目的,模块80和82已作为预先诊断模块(ADB)参照图2来描述,其中ADB是已知的可以增加到Fieldbus设备以采集和处理Fieldbus设备中的统计数据的基础现场总线(Foundation Fieldbus)功能块,但是模块80和82可以是或可以包括位于过程设备中的任何其它类型块或模块,它们采集设备数据并计算或确定针对该数据的一个或更多统计测量值或参数,而不论这些功能块是否位于Fieldbus设备中或符合Fieldbus协议。尽管图2的模块80和82显示为位于设备64之一中以及设备66之一中,但是这些或相似的模块可以位于许多现场设备64和66中,可以位于其它设备中,例如控制器60、I/O设备68、70或图1所示的任何设备。另外,模块80和82可以位于设备64和66的任何子集(subset)中。Additionally, as shown in FIG. 2 , some (and possibly all) of
一般地,模块80和82或这些模块的子部件,采集设备中例如过程变量数据的数据,这些模块位于设备中,并且出于许多原因对数据执行统计处理或分析。例如,示作与阀相关的模块80,可以具有阻塞阀检测程序,该程序分析阀过程变量数据以确定该阀是否处于阻塞状态。另外,模块80包括一组四个统计过程监控(SPM)模块或单元SPM1~SPM4,采集该阀中的过程变量或其它数据,并且对所采集的数据执行一项或更多统计计算,从而确定所采集数据的例如平均值、中间值、标准偏差、均方根值(RMS)、变化率、范围、最小值、最大值等,和/或检测所采集数据中的诸如漂移、偏差、噪声、峰值等事件。所产生的具体统计数据不是必须的,产生该数据的方法也不是必须的。因此,可以产生不同类型的统计数据以补充或代替上述具体类型的数据。另外,各种技术,包括公知的技术,可以用于产生这些数据。统计过程监控(SPM)模块这个术语在这里被用来描述对至少一个过程变量或其它过程参数执行统计过程监控的功能,并且可以由位于设备中甚至位于采集数据的设备外部的所需要的任何软件、固件或硬件来执行。可以理解,由于SPM通常设置于设备数据被采集的设备中,所以SPM能获取数量更多且质量上更准确的过程变量数据。结果,SPM模块通常能够比采集过程变量数据的设备外部的模块,更好地确定关于所采集的过程变量数据的统计计算。In general,
在另一个示例中,图2的模块82示作与变送器相关,其可以具有堵塞线路检测单元,该单元分析由变送器采集的过程变量数据,以确定工厂中是否有线路被堵塞。另外,模块82包括一组四个SPM模块或单元SPM1~SPM4,它们可以采集变送器中的过程变量或其它数据,并且对所采集的数据执行一个或更多统计计算,以确定所采集数据的例如平均值、中间值、标准偏差等。如果需要,可以按以上提及的美国专利NO.6,017,143所描述的方式执行或实现模块80和82的可能操作。虽然模块80和82被示作每个模块都包括四个SPM模块,然而模块80和82可能在其中具有任何其它数目的SPM模块,用于采集并且确定统计数据。同样地,尽管模块80和82被示作包括检测软件,以用于检测加工厂10中的特定状况,但是模块80和82也可以不具有这样的软件。而且更进一步,虽然此处讨论的SPM模块被示作ADB的子部件,但是它们可以替换为位于设备中的单独设置(stand-alone)的模块。而且,虽然此处讨论的SPM模块可以是公知的基础现场总线SPM模块,但是这里使用的统计过程监控(SPM)模块这个术语是指采集例如过程变量数据之类的数据,并对该数据执行某种统计处理以确定例如平均值、标准偏差等的统计测量值的任何类型的模块或部件。因此,这个术语趋于覆盖软件或固件或其它执行该功能的部件,不论这些部件是否是功能块、或其它类型模块、程序、例行程序或部件的形式,并且不论这些元件是否符合基础现场总线协议或其它协议,例如PROFIBUS、WORLDFIP、Device-Net、As-Internet、HART、CAN等协议。In another example, module 82 of FIG. 2 is shown associated with a transmitter, which may have a blocked line detection unit that analyzes process variable data collected by the transmitter to determine if a line is blocked in the plant. Additionally, module 82 includes a set of four SPM modules or units SPM1-SPM4 that can collect process variables or other data from the transmitter and perform one or more statistical calculations on the collected data to determine the For example, mean, median, standard deviation, etc. Possible operations of
在一个实施例中,在ADB80和82中的每个SPM模块可以是激活的(active)或未激活的。激活的SPM模块是当前监控过程变量(或其它过程参数)的模块,而未激活的SPM模块是当前没有监控过程变量的模块。一般地,SPM模块默认为未激活,并且因此,通常每一个都必须被单独配置以监控过程变量。图3示出了示例性配置显示84,其可以提供给用户、工程师等,以描述和改变设备的当前SPM配置。如显示84所示,对特定设备的SPM模块1、2和3已经全部被配置,而SPM模块4还没有被配置。被配置的SPM模块SPM1、SPM2和SPM3中的每一个与一设备(由模块标签(block tag)表示)中的一特定模块、模块类型、该模块中的参数索引(即被监控的参数)以及表示SPM模块监控功能的用户命令有关。而且更进一步地,每个被配置的SPM模块包括被确定的统计参数待与之比较的一组门限值,包括例如,平均值界限、高偏差界限(其规定表示信号中偏差太大的一个值)以及低动态(low dynamics)界限(其规定表示信号中偏差太小的一个值)。根本上,检测平均值的变化可以表示该过程向上偏移或向下偏移,检测高偏差意味着该过程中的部件正在经历未预见的噪声(例如,由增加的振动引起的),并且检测低偏差意味着过程信号正在被滤波,或部件正在变成可疑的静止,例如阻塞了阀。而且更进一步地,可以为每个SPM模块设置基准值,例如平均值以及标准偏差。这些基准值可以用于确定是否满足或超出设备中的各个界限。图3的SPM模块1和3都是激活的,因为它们已经接收到用户的命令以启动监控。另一方面,SPM模块2是未激活的,因为它处于空闲状态。而且,在该示例中,SPM功能对整个设备都是启用的,如方框86所示,并且被设置为每隔五分钟监控或计算,如方框88所示。当然,被授权的用户可以重配置设备中的SPM模块,以监控其它模块以及具有其它门限值、基准值等,例如监控设备中的其它功能块、与设备中的这些或其它模块相关的其它参数。In one embodiment, each SPM module in
虽然某些统计监控模块如图3的显示84所示,然而可以理解其它参数也可以或另外被监控。例如,参照图2讨论的SPM模块或ADB可以计算与过程有关的统计参数,并且可以基于这些值的变化触发某些告警。通过示例的方式,Fieldbus类型的SPM模块可以监控过程变量并且提供与该监控有关的15个不同的参数。这些参数包括模块标签、模块类型、平均值、标准偏差、均差、标准偏差变化、基准平均值、基准标准偏差、高偏差界限、低动态界限、平均值界限、状态、参数索引、时间戳以及用户命令。当前,两个最有用的参数被认为是平均值和标准偏差。但是,通常有用的其它SPM参数是基准平均值、基准标准偏差、均差、标准偏差变化以及状态。当然,SPM模块可以确定任何需要的统计测量或参数,并且可以向用户或请求应用程序提供有关一特定模块的其它参数。因此,SPM模块不限于此处所讨论的这些。While certain statistical monitoring modules are shown in
参照图2,通过总线或通信网络76以及控制器60,现场设备中的SPM模块(SPM1-SPM4)对外部客户来说是可利用的,例如对工作站74来说。附加地或者可替代地,通过例如OPC服务器89,由ADB80和82中的SPM模块(SPM1~SPM4)所产生或采集的参数以及其它信息,对工作站74是可利用的。该连接可以是无线连接、硬布线连接、间歇式连接(例如,使用一个或更多便携式设备的连接)或使用任何需要或适当的通信协议的任何其它需要的通信连接。当然,此处描述的任何通信连接可以使用OPC通信服务器,按照普通或相容的格式整合(integrate)从不同类型设备接收的数据。Referring to FIG. 2 , the SPM modules ( SPM1 - SPM4 ) in the field devices are available to external clients, such as workstation 74 , via bus or communication network 76 and
而且更进一步地,SPM模块可以设置在主机设备中、其它不是现场设备的设备中、或其它现场设备中,以对采集或产生例如原始过程变量数据的原始数据的设备外部执行统计过程监控。因此,例如图2的应用程序38可以包括一个或更多SPM模块,其通过例如OPC服务器89,采集原始过程变量数据,并且计算某些统计测量或参数,例如该过程变量数据的平均值、标准偏差等。虽然这些SPM模块不位于采集数据的设备中,并由于对于该数据的通信需要,因此使得SPM模块通常不能采集尽可能多的过程变量数据以执行统计计算,但是这些模块有助于为设备确定统计参数,或者不具有或不支持SPM功能的设备中的过程变量。另外,随着技术的提高,网络的可利用吞吐量可以随着时间增加,因此不位于采集原始数据的设备中的SPM模块能够采集更多过程变量数据,以执行统计计算。因此,在以下讨论中,可以理解,所述由SPM模块产生的任何统计测量或参数,可以由SPM模块产生,例如由ADB80和82中的SPM1-SPM4模块产生,或者由主机或包括其它现场设备的设备中的SPM模块产生。Still further, the SPM module may be located in a host device, in other devices that are not field devices, or in other field devices to perform statistical process monitoring external to devices that collect or generate raw data, such as raw process variable data. Thus, for example, application 38 of FIG. 2 may include one or more SPM modules that collect raw process variable data via, for example, OPC server 89, and calculate certain statistical measures or parameters, such as averages, standard deviation etc. Although these SPM modules are not located in the device that collects the data, and because of the need to communicate that data, SPM modules typically cannot collect as much process variable data as necessary to perform statistical calculations, but these modules help determine the statistical calculations for the device. parameters, or process variables in devices that do not have or support SPM functionality. Additionally, as technology improves, the available throughput of the network can increase over time, so SPM modules that are not located in the device that collected the raw data are able to collect more process variable data to perform statistical calculations. Therefore, in the following discussion, it will be understood that any statistical measurement or parameter produced by the SPM module may be produced by the SPM module, such as the SPM1-SPM4 modules in the ADB80 and 82, or by the host computer or other field devices including generated by the SPM module in the device.
随着加工厂中统计数据采集模块或SPM的增加,具有这么一种自动机构是有帮助的,即其从不同设备中的SPM模块采集统计参数以引导数据并且向专家系统提供检测结果,以进一步集成数据并作出决策。事实上,目前,查看大型过程中的全部统计过程数据是十分麻烦和沉闷的。当前,人们必须创建一个OPC客户端,其分别监控感兴趣的每一个SPM参数,并且为此,必须分别配置用于SPM采集的每个设备。如上所示,统计数据的配置和查看是非常耗时并且易受到人为错误的损害。With the increase of statistical data acquisition modules or SPMs in the processing plant, it is helpful to have an automatic mechanism that collects statistical parameters from SPM modules in different equipment to guide the data and provide detection results to the expert system for further processing. Integrate data and make decisions. In fact, currently, looking at all the statistical process data in a large process is cumbersome and tedious. Currently, one has to create an OPC client that monitors each SPM parameter of interest separately, and to do this, each device used for SPM acquisition has to be configured separately. As shown above, configuration and viewing of statistics is time-consuming and vulnerable to human error.
配置和数据采集应用程序38适于自动配置例如阀、变送器等的设备中的SPM模块,从而在过程操作期间从这些SPM模块采集过程中可用的SPM数据。图4是一个示例技术的流程图,该技术可以由应用程序38使用,以配置加工厂中的设备,从而采集SPM数据并且在加工厂10的操作期间自动采集该数据。在图4中,圆表示由应用程序38在加工厂中执行的动作,而矩形表示由应用程序38使用或产生的对象或项(item)。可以理解,虽然该示例讨论了从使用Fieldbus协议并具有采集统计数据的Fieldbus模块的特定类型变送器中采集SPM数据,但是该技术或相似技术可以用于从使用其它通信和功能模块协议的其它设备中,或从使用程序化范例而不是功能模块程序化范例的其它设备或这些设备的部件中,采集统计数据(或其它参数)。The configuration and data collection application 38 is adapted to automatically configure SPM modules in equipment such as valves, transmitters, etc., so that process-available SPM data is collected from these SPM modules during operation of the process. FIG. 4 is a flow diagram of an example technique that may be used by the application 38 to configure equipment in the process plant to collect SPM data and automatically collect this data during the operation of the
任何情况下,在第一框92中,应用程序38扫描过程控制网络(例如,加工厂)的分级结构,以确定加工厂中一列包括统计数据采集模块(例如,ADB)的设备。尽管框92可以搜索其它类型统计数据采集模块以及或除了ADB中Fieldbus类型的SPM,并且该方法不限于使用Fieldbus ADB或Fieldbus ADB中的SPM模块,但是为了讨论的目的,仍然假定统计数据采集模块采用上述Fieldbus ADB中的SPM模块形式。在一个实施例中,OPC服务器(例如,图2的服务器89)可以允许例如应用程序38的客户端存取控制和设备信息。例如,OPC自动控制2.0产品提供了浏览PC服务器内容的标准方法,并且这些或其它浏览方法可以用于自动变换OPC的分级结构以找出包含ADB的设备。另外,新型OPC规格包括XML定义,其可以用于集成数据并且使其在网络环境中可利用。In any event, in a
图5示出了示例性工厂分级结构94的一部分,该分级结构94由OPC服务器创建,描述了正由OPC服务器扫描的加工厂的设备和其它部件。分级结构94的顶级具有称为模块和输入输出(IO)的节点96和98,其中模块节点96包括控制策略信息,IO节点98包括硬件/设备信息。如图5的示例性分级结构所示,IO节点98包括与控制器(CTLR)、卡(C)以及端口(P)有关的子节点,其中,在该示例中,端口(P)与实际存在于控制器网络中的Fieldbus段(segment)有关。在该分级结构中进一步向下,Fieldbus设备被列在他们各自的端口下。在图5的示例中,包含ADB的各个Fieldbus设备在该设备下包括称为变频器(TRANSDUCER)800或变频器1300的节点。(在Rosemount 3051F设备中,ADB被称为变频器800,而在Rosemount3051S设备中,该ADB被称为变频器1300)。一个被称为变频器800的节点100如图5的分级结构所示。ADB节点100包括所关心的诊断信息。在特定情况中,应用程序38对ADB节点100中的统计过程监控(SPM)参数感兴趣,在图5的分级结构中,ADB节点100得以展开以示出与Rosemount3051F设备中的ADB有关的一些部件。当然,名称“变频器800”以及“变频器1300”只是由一家知名制造商提供的已知功能块的名称示例而已。其它ADB模块或SPM模块可以具有其它的名称,和/或在一个不同于使用OPC的系统的系统中这些名称可以不同。在其它实现方案中,不同的名称可以对应由其它制造商后来开发和/或提供和/或按照基础现场总线规格中描述的其它变频器块、功能块等的ADB模块或SPM模块,或可以是在任何其它智能通信协议(例如,数字协议)中的模块或其它软件部件,例如在命名的几个Profibus、HART、CAN、AS-Interface、HTML、XML等协议中的任何元件。FIG. 5 shows a portion of an
为找到ADB以及ADB中的SPM模块,框92(图4)自动转换或搜索OPC分级结构94,以定位工厂中包括ADB的所有设备。当然,框92可以预先编程为了解由OPC树94所使用的格式,以使框92能够转换或浏览树94,从而以最佳方式找出包括ADB的设备。虽然此处描述的方法基于DeltaVOPC树,但是对于其它OPC服务器以及由其它类型的查看工具所产生的工厂分级结构来说,可以对该方法进行修改。To find the ADB and the SPM modules in the ADB, block 92 (FIG. 4) automatically translates or searches the
在搜索分级结构或树94时,速度和鲁棒性之间通常有一个平衡。特别地,就找出所有具有ADB的设备而言,搜索分级结构94通常不会是百分之百可靠的,而是仅能找出一些具有ADB的设备。通常来说,找出具有ADB的设备的方法越准确,该方法就会越慢。举例来说,如果不同制造商具有在OPC树94中显示的设备,且该设备具有与3051F变送器中的ADB模块相同名称的模块,那么搜索分级结构可能错误地将该设备检测为具有ADB。反之,如果框92试图通过搜索大量子节点来确保只定位真正具有ADB的节点,从而消除该问题,那么该方法的速度就会降低。When searching a hierarchy or
在任何情况下,在一个实施例中,框92可以搜索分级结构或树94中的每一个节点,以便在某些设备中定位已知具有与ADB相关的名称的各个节点。虽然在某些情况下,例如大型加工厂中,这会消耗明显多的搜索时间,但是它是在加工厂中找出每个ADB进而找寻每个SPM的最准确方法。另一方面,框92可以向下搜索分级结构,直到到达或找到具有与已知统计监控模块相关的名称的节点,例如变频器800或变频器1300或任何其它由某些设备制造商使用来表示一个已知的统计监控模块的特定名称。如果找到这样的节点,那么与该节点有关的父(parent)节点可以作为具有ADB的设备被检测到。虽然该方法不象搜索一个特定OPC分级结构或树中的每个节点那么具有鲁棒性,但该方法应该要快一些。但是如果另一制造商制造出具有名为变频器800的OPC节点的设备,那么该方法仍将会错误的地将该其它设备检测为具有ADB。In any event, in one embodiment, block 92 may search each node in hierarchy or
可替代地,框92可以在每个节点下搜索,在已知与ADB唯一相关或暗示ADB的设备中找寻具有与已知ADB相关名称的附加项。因此,框92可以在定位了具有已知由至少一家制造商使用以明确ADB名称的节点之后,搜索子节点以查看特性/模块标签.子符串(Charcteristic/BLOCKTAG.STRING)项是否具有“先进诊断(ADVANCED DIAGNOSTICS)”值。在该实例示例中,仅具有ADB的设备的特性/模块标签.字符串OPC项具有“先进诊断”值。虽然该方法在定位仅具有ADB的设备时是非常具有鲁棒性的,但是该方法需要通过OPC服务器从设备读取值,这比只是浏览OPC分级结构明显需要更长的时间。因此,该方法虽然准确,但对于某些情况来说太慢。Alternatively, block 92 may search under each node, looking for additional items with names associated with known ADBs among devices known to be uniquely associated with or implying ADBs. Accordingly, block 92 may, after locating a node with a name known to be used by at least one manufacturer to unambiguously ADB, search the child nodes to see if the Characteristic/BLOCKTAG.STRING item has the "Advanced Diagnostics (ADVANCED DIAGNOSTICS)" value. In the instance example, only the device's Features/ModuleTags with ADB.String OPC item has an "Advanced Diagnostics" value. While this method is very robust in locating ADB-only devices, this method requires reading values from the device via an OPC server, which takes significantly longer than just browsing the OPC hierarchy. Therefore, this method, while accurate, is too slow for some situations.
可由图4的框92实施的另一方法是搜索OPC树94,该方法在速度和鲁棒性之间提供了折中,其包括在具有通常已知与ADB有关的名字的节点下搜索OPC分级结构,以查找也具有通常与ADB有关的名字的子节点。例如,该方法可以从OPC树94(图5)的顶部开始并且搜索IO节点98。然后,该方法可以递归搜索IO节点98下的每一个子节点。如果发现名为变频器800或变频器1300的子节点(或者已知与统计监控模块,例如ADB有关的其它的名字),则该方法检验该节点是否具有一个名为SPM_ACTIVE的子节点,或者具体与统计监控模块有关的任何其它子节点。如果在例如变频器800节点下发现SPM_ACTIVE,则框92将变频器800节点的父节点检测为包括ADB的设备。Another method that can be implemented by
当然,框92可以使用这些技术中的任何一种,或者这些技术的组合或任何其它需要的技术来搜索具有ADB(并且因此具有SPM)的设备。例如,一种实现方案可以力图至少识别已知由至少一家制造商的设备所实现的所有ADB,但是可能能够也可能不能够识别加工厂中的所有ADB。作为另一示例,一个实现方案可以力图识别已知由几家不同制造商的设备所实现的所有的ADB。而且,虽然这个扫描步骤被描述成使用OPC分级结构来执行,也就是一个由OPC服务器来产生的分级结构,但是该方法可应用于或者使用在由其它设备产生的分级结构中,例如控制器、存储加工厂中的配置分级结构的数据历史记录器、存储设备分级结构的工作站等。因此,其它实现方案不需使用OPC服务器和/或OPC分级结构,但是可能使用很多其它的计算设备、通信协议以及分级结构协议,其包括例如,已知的和最新的计算设备、通信协议以及分级结构协议。另外的实现方案举例来说可以使用web服务器、XML和/或专有计算设备和协议。Of course, block 92 may search for devices with ADB (and thus SPM) using any one of these techniques, or a combination of these techniques, or any other desired technique. For example, an implementation may attempt to at least identify all ADBs known to be implemented by at least one manufacturer's equipment, but may or may not be able to identify all ADBs in a process plant. As another example, an implementation may attempt to identify all ADBs known to be implemented by devices from several different manufacturers. Also, although this scanning step is described as being performed using an OPC hierarchy, that is, a hierarchy generated by an OPC server, the method is applicable or used in hierarchies generated by other devices, such as controllers, Data historians that store configuration hierarchies in processing plants, workstations that store device hierarchies, etc. Thus, other implementations need not use OPC servers and/or OPC hierarchies, but may use many other computing devices, communication protocols, and hierarchy protocols, including, for example, known and up-to-date computing devices, communication protocols, and hierarchies Structural agreement. Additional implementations may use web servers, XML, and/or proprietary computing devices and protocols, for example.
在发现和搜索包含ADB的设备的过程中,框92可以存储已检测到具有ADB、SPM模块或者其它类型数据采集模块的设备的列表,如图4中的方框108所示。如果需要,方框108所列出的设备可以按照它们的分级结构显示在一个树状视图中。这种分级结构的视图110的一个示例如图6所示。正如所理解的那样,图6视图中显示的分级结构110是由控制器产生的控制网络显示所显示的分级结构的一个子集,因为通常并非控制显示中的所有设备都包括ADB。实际上,图6中的视图110实际上是只包括具有ADB的设备的控制器分级结构的拷贝。正如所理解的那样,图6中的显示示出了设备PT-101和PT-102(连接到名为CTLR-002EC6的控制器的输入/输出设备I01的卡C01的端口P01)和设备PT-103、FT-201和FT-201(连接到名为CTLR-002EC6的控制器的输入/输出设备I01的卡C01的端口P02)中的每一个设备都具有ADB。During the process of discovering and searching for devices containing ADBs, block 92 may store a list of detected devices having ADBs, SPM modules, or other types of data acquisition modules, as shown at
为了从设备中读取任何SPM参数,通常需要知道该参数的OPC项ID。通常,即在Fieldbus SPM模块中,一个SPM参数的OPC项ID包括紧随着该项详细说明(specifier)的设备ID。为了定位设备ID,框92可以对每个已经确定包含ADB的设备节点查找子节点SPM_ACTIVE。接下来,框92可以获取结点“CV”的OPC项ID。例如,OPC项ID可以是“设备(DEVICE):0011513051022201100534-030003969/800/SPM ACTIVE.CV”。设备ID是OPC项ID减去后缀“SPM ACTIVE.CV”。因此,在该示例中,设备ID是“设备:0011513051022201100534-030003969/800/”。当然,这仅是在OPC系统中确定设备ID的一种方式,也可使用或替换使用其它技术。In order to read any SPM parameter from a device, it is usually necessary to know the OPC Item ID for that parameter. Normally, i.e. in Fieldbus SPM modules, the OPC item ID of an SPM parameter includes the device ID followed by the item specifier. To locate the device ID, block 92 may look up the child node SPM_ACTIVE for each device node that has been determined to contain an ADB. Next, block 92 may obtain the OPC item ID for node "CV". For example, the OPC Item ID may be "DEVICE: 0011513051022201100534-030003969/800/SPM ACTIVE.CV". The Device ID is the OPC Item ID minus the suffix "SPM ACTIVE.CV". So, in this example, the device ID is "device:0011513051022201100534-030003969/800/". Of course, this is only one way to determine the device ID in the OPC system, and other techniques can also be used or replaced.
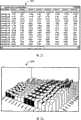
无论如何,在框92扫描分级结构以确定具有ADB的设备以后,应用程序38知道或者能容易地为这些设备的每一个设备确定设备标签、设备ID和设备位置。对包含5个具有ADB设备的简单系统而言,该数据的一个示例如下表所示。Regardless, after scanning the hierarchy at
表1Table 1
再次参考图4,框114可以接下来确定存储在方框108中的哪些设备已经配置为执行统计过程监控。为执行该功能,框114可以为存储在方框108中的每一设备从OPC服务器中读取SPM ACTIVE.CV值。例如,对上述表格中的PT-101,框114可以读取OPC项,即设备:0011513051022201100534-030003969/800/SPM ACTIVE.CV。该OPC项可以取值为0或255。在FieldbusSPM模块的例子中,如果该值为0,那么SPM模块为该设备所禁用,如果该值为255,则SPM模块为该设备所启用。一旦检验SPM是否为每一台设备所启用,框114就可以把所有设备划分为两类,即具有已配置的SPM的设备和具有还未配置的SPM的设备。这些设备的分类或者列表如图4的方框116和118所示。Referring again to FIG. 4 , block 114 may next determine which devices stored in
在框114确定列于方框108中的每个设备中的SPM是否启用之后,框120可以对各个启用SPM的设备,也就是那些列于或存储在方框116中的设备中的各个SPM模块进行状态检测。框120主要执行该步骤以确定在启用SPM的设备中的各个SPM模块当前是否已经配置为监控过程变量,并且如果是的话,配置为确定正在监控哪个过程变量。在该示例中,通过读取SPM模块的状态,可确定SPM模块当前是否正在监控过程变量。在FieldbusSPM模块中,可通过从OPC服务器中读取SPM[n]STATUS.CV项来检测状态。因此,例如,为从上述表格中读取设备PT-101中的SPM模块1的状态,框120可以读取OPC项ID,即设备:0011513051022201100534030003969/800/SPM1 STATUS.CV。After
一般地,状态值是一个范围在0~255的8位数。状态是8个不同位的组合,可以是开或闭。这些位是:未激活(1)、学习(2)、校验(4)、无检测(8)、均差(16)、高偏差(32)、低动态(64)和未许可(128)。所有被许可却没有配置的SPM模块具有未激活状态。如果SPM模块的状态是未激活或者未许可,则框120可以确定不监控该模块,这是因为它不产生任何有用的信息。然而,如果状态是其它任何可能情况,则框120可以监控SPM模块。Generally, the status value is an 8-digit number ranging from 0 to 255. State is a combination of 8 different bits that can be on or off. These bits are: inactive (1), learning (2), parity (4), no detection (8), mean difference (16), high deviation (32), low dynamic (64) and not permitted (128) . All SPM modules that are licensed but not configured have an inactive status. If the status of the SPM module is inactive or not licensed, block 120 may determine not to monitor the module because it does not generate any useful information. However, if the status is any other possibility, block 120 may monitor the SPM module.
类似的,框122可以自动配置不具有启用SPM的各台设备(即,方框118中列出的设备),从而启用这些设备中的至少一个SPM模块,以检测和监控过程变量,并因此产生关于该过程变量的统计数据。在许多情况中,例如具有柔斯芒特(Rosemount)3051F和3051S变送器的情况下,设备出厂时具有未配置的SPM,这通常要求用户在各台设备中人工配置SPM。在具有成千上万台具有ADB的设备的加工厂中,这是一个非常沉闷的过程。为了减轻这种人工配置,框122为每一设备自动配置至少一个SPM模块。为了执行该配置,框122可以确定或存储在设备中待监控的特殊过程变量的指示。这个变量可能是主过程输入、PID模块输出或者Fieldbus设备中可利用的其它功能块变量(输入和输出)中的任一些。关于哪个变量待监控的指示可以在配置过程中设置,由用户在一种情况下根据该情况基础来指定,或者由用户在程序38操作之前在总体上指定。Similarly, block 122 may automatically configure each device that does not have SPM enabled (i.e., the devices listed in block 118), thereby enabling at least one SPM module in these devices to detect and monitor process variables, and thereby generate Statistics about the process variable. In many cases, such as with the
虽然能监控任何过程变量,但是为统计目的而监控的逻辑变量是设备的主要模拟输入。对于柔斯芒特3051F/S变送器来说,该变量是所测得的压力或流量(例如,压差)。因此,框122可以配置为在设备的ADB中自动配置一个SPM模块,从而监控设备的主要模拟输入或输出。如果需要,用户仍能人工配置设备的其它SPM模块。可替代地,框122可以为每种类型的设备存储待监控的过程变量的列表,并且可以在任何情况下用该列表选择或者确定待监控的那些过程变量。虽然此处将框122描述为配置设备中的单个SPM模块以监控一个过程变量,但框122可以在特定设备中配置至少两个SPM模块,从而监控与该设备有关的至少两个过程变量。While any process variable can be monitored, logical variables monitored for statistical purposes are the primary analog input to the device. For Rosemount 3051F/S transmitters, the variable is measured pressure or flow (eg, differential pressure). Accordingly, block 122 may be configured to automatically configure an SPM module in the device's ADB to monitor the device's primary analog input or output. The user can still manually configure other SPM modules of the device if desired. Alternatively, block 122 may store a list of process variables to be monitored for each type of device, and this list may be used in any case to select or determine those process variables to be monitored. While
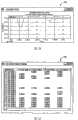
另外,DeltaV OPC服务器允许用户(给予足够的管理权限)将值写入设备中的特定项。因此,通过在OPC服务器中写入适合的项,可改变设备中的SPM参数。因此,通过将一列值写入OPC服务器,框122可将设备配置为监控针对主过程变量的SPM。在一个特别示例中,写入到OPC服务器的值如下表所示。Additionally, the DeltaV OPC Server allows users (given sufficient administrative rights) to write values to specific items in the device. Therefore, by writing suitable items in the OPC server, the SPM parameters in the device can be changed. Thus, block 122 may configure the device to monitor the SPM for the master process variable by writing a list of values to the OPC server. In a particular example, the values written to the OPC server are shown in the table below.
表2Table 2
此处,[设备ID]应当用在表2中所发现的设备ID来代替。因此对于设备PT-101而言,要写入的第一个OPC项为:设备:0011513051022201100534-030003969/800/SPM MONITORING CYCLE.CV。在将所有这些项写入到OPC服务器之后,配置该设备以监控SPM1模块中的主压力变量。当然,这不过是写入到Fieldbus设备中特定种类SPM模块的一个例子,应当理解写入其它类型SPM模块的其它方法也一样或者可替换,而写入命令是由那些SPM模块所使用的通信协议来确定的。Here, [device ID] should be replaced with the device ID found in Table 2. Therefore, for the device PT-101, the first OPC item to be written is: Device: 0011513051022201100534-030003969/800/SPM MONITORING CYCLE.CV. After writing all these items to the OPC server, configure the device to monitor the main pressure variable in the SPM1 module. Of course, this is just an example of writing to a specific type of SPM module in a Fieldbus device. It should be understood that other methods of writing to other types of SPM modules are the same or alternative, and the write command is the communication protocol used by those SPM modules. to be sure.
无论如何,图4的框120和122的操作创建了一组或一列带有ADB的设备内的待监控的SPM模块。该列图示为存储在图4的框124中,或者与之相关联。另外,图4中的框126规定了应用程序38应当监控的对于待监控的每个SPM模块的一组SPM参数。该SPM参数列126可以在应用程序38操作之前或操作期间由用户指定或选择,或者可以在配置过程期间分别为待监控的不同SPM模块独立地进行选择或指定。下表图示了对于每个Fieldbus SPM模块能够从OPC服务器读取的所有SPM参数。Regardless, the operations of
表3table 3
然而,对于所待监控的每个SPM模块,可能并不必须待监控所有这些参数。实际上,如果待监控太多的项,那么OPC服务器有可能过载。因此,应用程序38可以提供一种机制,通过该机制能够使用户选择待监控的一组SPM参数。图7示出了允许这种选择的一个屏幕示例,其中用户可以检查用户希望对框124所标识的每个SPM模块进行监控的SPM参数。However, it may not be necessary for all of these parameters to be monitored for each SPM module to be monitored. In fact, if too many items are to be monitored, the OPC server may be overloaded. Accordingly, the application 38 may provide a mechanism by which the user can select a set of SPM parameters to be monitored. FIG. 7 shows an example of a screen that allows this selection, where the user can review the SPM parameters that the user wishes to monitor for each SPM module identified by
框128使用待监控的SPM参数的列表(如框126所标识)和待监控SPM模块的列表(如框124所标识),来构建在过程操作期间要由应用程序38监控的一组SPM OPC项。如框130所示,框128可以存储该组OPC项,以用于监控过程的后续步骤。一般而言,框128为待监控的每个SPM模块(用框124表示)创建用于待监控的每个SPM参数(用框126表示)的SPM OPC项。换句话说,一旦对于这些模块中的每一个给出了待监控的一组SPM模块和待监控的一组SPM参数,框128就构建待监控的一组OPC项,作为用于待监控的SPM模块和待监控的SPM参数的每一种可能组合的OPC项。因此,举例来说,如果有10个SPM模块要监控,并且每个SPM模块有5个SPM参数要监控,那么框128将创建一个总数为50的OPC项。在该例中,OPC项ID是设备ID和来自上表的OPC后缀的组合。例如,为了读取设备PT-101中SPM1的均值,OPC项ID将会是:设备:0011513051022201100534030003969/800/SPM1 MEAN.CV。
在框130中已经识别且存储了所有的OPC项之后,框132和134监控SPM参数在过程操作期间的变化。例如,某些SPM参数可能会根据SPM模块的配置每隔5-60分钟发生变化,而其它SPM参数可能仅当配置SPM模块时才会发生变化。结果,当监控SPM参数的过程开始时,框132可以首先读取所有SPM参数的当前值(由框130的OPC项指定)。在一个实施例中,框132可以利用为读取每个OPC项ID调用的同步读取(SyncRead)功能,来执行该读取。如图4的框136所示,每个SPM参数的读取产生一组SPM数据点。After all OPC items have been identified and stored in
在第一次读取SPM参数之后,框134可以等待SPM参数的变化。也就是说,在从OPC服务器读取所监控的每个SPM参数的初值以获得第一组SPM数据点之后,框134接收或获取表示所监控任何一个SPM参数变化的附加数据。举例来说,根据SPM模块的配置,均值和标准差可能每隔5-60分钟变化一次。尽管如此,当任何一个SPM参数发生变化时,OPC服务器都会产生一数据变化(DataChange)事件,该事件由诸如应用程序38的OPC客户端捕获。可替代地,框134可以周期性地,或在当前时间轮询或读取所监控的每个SPM参数,以获得新的数据点(框136)。在这种方式下,即使SPM参数未发生变化,也读取该SPM参数。当然,框134可以在过程运行期间持续地操作以接收新的SPM参数,并将该SPM参数存储在数据库中供用户查看,或者由以下更详细描述的准则机来使用,或者用于任何其它目的。当然,如果需要,图4的例程90可以检测和配置主设备中的SPM模块或其它统计数据采集模块,以便使这些SPM模块能够向异常状况预防系统35(图1)的其它元件提供统计测量或参数。After the first read of the SPM parameter, block 134 may wait for a change in the SPM parameter. That is, after reading the initial values of each monitored SPM parameter from the OPC server to obtain the first set of SPM data points, block 134 receives or retrieves additional data representing changes in any one of the monitored SPM parameters. For example, the mean and standard deviation may vary every 5-60 minutes depending on the configuration of the SPM module. However, when any SPM parameter changes, the OPC server will generate a DataChange event, which is captured by the OPC client such as the application program 38 . Alternatively, block 134 may poll or read each monitored SPM parameter periodically, or at the current time, for new data points (block 136). In this way, the SPM parameter is read even if the SPM parameter has not changed. Of course, block 134 may operate continuously while the process is running to receive new SPM parameters and store the SPM parameters in a database for viewing by a user, or for use by the criteria engine described in more detail below, or for any other purpose . Of course, if desired, the routine 90 of FIG. 4 can detect and configure SPM modules or other statistical data collection modules in the master device so that these SPM modules can provide statistical measurements to other elements of the abnormal condition prevention system 35 (FIG. 1 ). or parameters.
实际上,在读取框136的任何一个SPM数据点之后的任何时刻,框138可以将这些数据点存储或保存在本地数据库中(例如图1和图2的数据库43),以便这些数据点可以在将来用于查看趋势或其它的查看目的而进行的参考。另外,框140可以用于以任何目的、以任何期望或有用的格式向用户展示SPM数据,例如检测或预测加工厂内的异常状况。如果需要,框140可以通过图1和图2中所示的查看应用程序40来实现。In fact, at any time after reading any of the SPM data points of
一般而言,查看应用程序40(可以由图4的框140来执行)可以以任何期望或有用的格式向用户显示SPM参数,以便使用户能够例如一眼就查看到最新的SPM数据。例如,查看应用程序40可以利用常规的浏览器型显示器来显示SPM数据。在图8中描绘了这种显示的一个例子,其中在显示屏幕的左侧提供图6的浏览器分级结构110,同时对于待监控的每一个SPM模块,在显示115的右侧描绘所监控的SPM参数(如图7的屏幕所指定的)。应当注意到,在显示部分115中根据设备对SPM数据进行分类,以便容易查找或查看与特定设备相关的数据。当然,用户可以在分级结构110中选择任何一项或一节点,以便查看与这些项或节点相关的SPM数据。另外,如果需要,查看应用程序40可以提供诸如图9的浏览器显示,它包含SPM模块元件和对于SPM模块元件所监控的SPM参数。因此,在图9的示例性分级结构141中,将名为SPM1的SPM模块142图示为位于名为3051-Flow的设备中。SPM1模块142以下的元件143表示所监控的SPM参数,并且可用于用户查看。在这种情况下,这些参数包括均值、均值变化、标准差、标准差变化、均值/标准差和标准差/均值。In general, viewing application 40 (which may be performed by
如果需要,查看应用程序40可以允许或使用户在现场设备内,甚或在这些模块所在的主机或其它设备内添加或重新配置一个或更多SPM模块。图10图示了一个显示屏幕144,在这种情况下,如窗口145所示,显示屏幕144使用户能够向名为P01的端口添加新的设备,另外也能够在该设备内添加或配置SPM模块。这里,该SPM模块命名为SPM1,它与设备标签FT3501-COLD1相关(其作为设备3051_LEVEL图示在屏幕144左侧的分级结构中),并且与名为AI1的模拟输入功能模块的OUT参数或变量有关(操作该参数或变量)。在这种情况下,查看应用程序40还使用户能够指定所关心的(即待监控的)SPM参数,以及对于该SPM模块的基线值和门限值,例如均值、均值变化、标准差变化等等。
此外,查看应用程序40可以使用户能够操纵整个分级结构,以获取对特定种类数据的查看,无论是直接来自SPM模块(或其它监控模块)的数据,还是通过例如应用程序40生成的数据。例如,图11图示了一个屏幕显示146,它描绘了屏幕左侧的工厂分级结构147,以及与屏幕146右侧视图148的分级结构中的设备相关的一个或更多SPM或其它模块。一旦选择了一个SPM模块(在这种情况下是3051S-1设备的SPM1),用户就可以使用下拉或弹出窗口149来选择查看来自该SPM1模块的数据的方式。在图11中,用户已经选择查看趋势图,而进一步的下拉或弹出窗口使用户能够指定要在趋势图中显示的具体SPM参数数据(或其组合)。在这种情况下,应当理解可以将具有趋势的某些可能类型的数据确定为来自一个或更多SPM模块的数据组合,并且可以在主机中(例如通过应用程序40),或者在可以访问到该原始数据的现场设备或其它设备中计算这些组合。In addition, the
图12图示了屏幕146,其中用户已经选择在弹出窗口149中直接查看数据。当然,这里在进一步的弹出窗口中的数据选择可以是不同的,并且可以指定由SPM模块所采集或生成的原始数据,而不用提供在主机设备内生成数据的选项(例如均值/标准差,等等)。当然,应当理解应用程序40可以获取来自SPM模块的数据,或者在某些情况下,可以根据从SPM模块采集的原始统计数据生成该数据。进一步,还可以提供其它类型的视图或选项以查看数据(其或者来自SPM模块,或者是根据来自SPM模块的数据生成的数据),例如直方图。同样,用户可以使用屏幕146和弹出窗口149来执行其它功能,例如删除SPM数据,开始新的数据采集循环,等等。FIG. 12 illustrates a
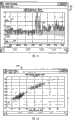
图13图示了可以由应用程序40生成的示例性趋势图150,示出了SPM均值对时间的曲线。在该显示中,用户可以使用控制按钮152回顾先前或后来的数据,转向数据的起点或终点,搜索数据内的界限等等。无论如何,诸如图13所示的趋势窗口,使用户能够查看任一SPM参数的历史形态。根据过程,有可能基于不同过程变量的趋势,特征化异常状态。然而,事实上用户可以对统计过程数据做什么并没有限制,应当理解用户可以使用该数据用于其它目的,除了检测加工厂内的当前或将来异常状况以外。此外,用户可以以任何使该数据易于读取、理解并使用的格式或视图来查看所采集的统计数据,以检测和预测加工厂内的事件。FIG. 13 illustrates an
一眼就能看出,图13的图看起来像过程变量随时间变化的正则图。然而,应当注意的是,这张图并不是单纯的过程变量数据随时间变化的曲线,而是在一定时间间隔内所计算的过程变量均值的曲线。尽管有可能使用DCS历史记录器来绘制过程变量的均值对时间的曲线,但此处的差别在于:过程变量的均值是在通常最初采集数据并且以更快的速率获取该数据的设备中计算的。因此,应该相信测量噪声不会在图13的图中出现到由数据历史记录器创建的图中的程度。另外,诸如均值的统计测量应当更准确,因为它通常基于更多的采集数据。As can be seen at a glance, the plot of Figure 13 looks like a regular plot of the process variable over time. However, it should be noted that this graph is not a simple curve of the process variable data changing with time, but a curve of the mean value of the process variable calculated in a certain time interval. Although it is possible to use a DCS Historian to plot the mean of a process variable versus time, the difference here is that the mean of a process variable is calculated in the device that normally acquired the data initially and at a faster rate . Therefore, it is believed that measurement noise does not appear in the graph of Figure 13 to the extent that the graph created by the data historian. Also, a statistical measure such as the mean should be more accurate since it is usually based on more collected data.
类似的,应用程序40可以绘制任何其它的SPM参数(例如,标准差、均值变化、标准差变化等等)对时间的曲线,以及SPM参数的任意数学组合(例如,标准差/均值等等)对时间的曲线。并且,应用程序40可以将这些曲线的任意组合置于同一幅图中或同一页面上,以便使不同统计数据间的比较对用户而言更加容易。图14图示了在同一时间帧上不同过程变量的统计测量的一组图,所有这些图都可以于同一时间在同一显示屏幕上展示给用户,或者于不同时间在相同或不同的显示屏幕上展示给用户。在图14中,左上方的图156绘出了标准差对时间的曲线,右上方的图158绘出了均值/标准差对时间的曲线,左下方的图160绘出了在相同比例尺上三条不同的均值(来自不同的SPM模块)对时间的曲线,而右下方的图162绘出了在相同比例尺上三条标准差(来自不同的SPM模块)对时间的曲线。当然,查看应用程序40可以在一幅图上显示任何所监控的SPM参数,或这些参数的任意数学组合随时间变化的曲线,并且可以在同一幅图上显示任意数目的不同SPM参数(或其数学组合)随时间变化的曲线,以帮助用户理解加工厂内发生了什么情况。Similarly,
统计过程控制经常用于过程控制工业,以确定某过程变量是否在可容许的界限以外。通常既有控制上限和控制下限(UCL,LCL),还有规定上限和规定下限(USL,LSL),它们可以基于由应用程序38所采集的SPM数据来计算。在一个实例中,控制界限可以表示为UCL=μ+3σ和LCL=μ-3σ,其中μ和σ分别是基准均值和基准标准差。另外,规定界限可以表示为:Statistical process control is often used in the process control industry to determine whether a process variable is outside tolerable limits. Typically there are both upper and lower control limits (UCL, LCL) and upper and lower specified limits (USL, LSL), which can be calculated based on the SPM data collected by the application 38 . In one example, the control limits can be expressed as UCL=μ+3σ and LCL=μ-3σ, where μ and σ are the reference mean and reference standard deviation, respectively. Alternatively, the prescribed bounds can be expressed as:
其中Δμ为用户指定的百分比均值界限。当然,查看应用程序40可以直接计算这些值,或者可以允许用户输入这些值。whereΔμ is the user-specified percentage mean limit. Of course, viewing
有了这些或类似点,查看应用程序40可以绘制均值相对于基准均值和控制界限的分布图,由此提供当工厂运行期间达到或超出均值界限时的可视化显示。该结果本质上是一个看起来类似于图15中图166的直方图。正如所理解的那样,控制上限和控制下限分别用线167和168表示,而规定上限和规定下限分别用线169和170表示。另外,在线172中绘出了均值点(即每个值的均值点数目),并利用直方图174绘出了基准均值点。如图166所示,如果过程处于控制之下,那么所有的数据都位于界限以内。如果存在异常状况,那么某些数据可能超出控制界限或规定界限167-170(落在所述界限以外)。另外,图166不同于标准的直方图,因为图166绘出了过程测量的均值(和基准均值),而不是过程测量自身。With these or similar points, the
如果需要,查看应用程序40可以将诸如上述讨论的控制界限和规定界限添加到均值、标准差或任何其它期望的统计测量(例如中值等)对时间的曲线中。当把这些界限添加到均值对时间的曲线上时,所得到的曲线称作X管制图(X-Chart)。16图示了用于统计均值的X管制图178的一个例子,其中均值对时间的曲线用线180表示,控制上限和控制下限分别用线181和182表示,规定上限和规定下限分别用线183和184表示。If desired, the
在这种情况下,可能最好是对控制上限和控制下限的计算进行调整,因为查看应用程序40并不绘制实际的过程变量,而是绘制在一定时间间隔上的均值。由于测量噪声得以降低,因此不存在人们在绘制过程变量值的标准X管制图中看到的同一偏差。可以对控制上限和控制下限进行的一种可能调整是将3σ部分除以用来计算每个均值的数据点的数目的平方根。根据该公式,可以如下计算控制上限和控制下限:In this case, it may be best to adjust the calculation of the upper and lower control limits, since the
其中N=(监控周期)*(60)*(每秒采样)Among them, N=(monitoring period)*(60)*(sampling per second)
此处,监控周期是计算均值和标准差的分钟数。可以使用15分钟的默认值。每秒的采样基于进行测量的设备的采样速率,举例来说,尽管还可以使用其它采样速率,但是采样速率对于柔斯芒特Rosemount 3051F变送器而言为10,而对于柔斯芒特Rosemount 3051S变送器而言为22。Here, the monitoring period is the number of minutes for calculating the mean and standard deviation. The default value of 15 minutes can be used. The samples per second are based on the sampling rate of the device making the measurement, for example the sampling rate is 10 for a Rosemount 3051F transmitter and 10 for a
另外,应用程序40可以产生S管制图,其中绘制了标准差对时间的曲线,以及控制界限和规定界限。在这种情况下,可以如下定义控制上限、控制下限以及规定上限和规定下限:Additionally, the
其中ΔHV为用户定义的百分比高变化界限,而ΔLD为用户定义的低动态界限,且ΔLD<0。where ΔHV is the user-defined percentage high variation limit, and ΔLD is the user-defined low dynamic limit, and ΔLD <0.
图17图示了S管制图190的一个例子。此处,标准差对时间的曲线用线192绘制,控制上限和控制下限分别用线193和194绘制,而规定上限和规定下限分别用线195和196绘制。在图17的例子中,过程变量的标准差跨越控制上限和控制下限的许多倍,并且跨越规定上限和规定下限的很多倍,因此潜在地表明当前或将来可能会出现异常状况。FIG. 17 illustrates an example of an S-
此外,应用程序40可以根据所采集的数据确定其它统计测量或值。例如,应用程序40可以根据下式计算变量x的分布指标或测量,它可以包含任何统计变量:Additionally,
应用程序40可以根据下式计算能力指标或测量:
并且可以根据下式计算两个变量(可以包含统计变量)之间的相关系数:And the correlation coefficient between two variables (which can include statistical variables) can be calculated according to the following formula:
在另一个例子中,根据下式可以计算两个变量之间的相关系数:In another example, the correlation coefficient between two variables can be calculated according to the following formula:
当然,查看应用程序40可以根据系统内的需要或需求执行对任何变量(包含统计变量及过程变量)的其它计算,以便确定加工厂内的一个或更多异常状况。因此,举例来说,应用程序40或其中的某些例程可以执行原理部件分析、回归分析、神经网络分析或者对所采集数据的任何其它单一变量分析或多变量分析,以执行异常状况检测和预防。Of course, viewing
一般而言,图13、图14、图16和图17的图都是以绘制一个或更多SPM参数对时间的曲线为基础。然而,查看应用程序40可以提供表示或图示与时间无关的一个或更多SPM变量之间相关度的图。在一个例子中,查看应用程序40可以产生绘出一个SPM参数相对于另一个SPM参数的散布图。查看应用程序40或用户可以确定相关系数,该相关系数表示了两个SPM参数(或两个SPM参数的某种组合)如何相关联。图18图示了绘出两个SPM均值参数相对于彼此的散布图200。这里,可以总地看出由于散布点的基本直线特性(即当一个均值增长时,另一个也趋向于增长),两个均值按照比例地相关。恰好落在一般散布区域之外的点可以表示工厂内的潜在问题。In general, the graphs of Figures 13, 14, 16 and 17 are based on plotting one or more SPM parameters versus time. However, viewing
当然,查看应用程序40并不限于提供如图18的两维散布图。实际上,查看应用程序40可以提供三维或更多维的散布图,这些散布图绘出了三个或更多SPM参数相对于彼此的散布图形。例如,图19图示了一个三维散布图210,它绘出了三个SPM参数相对于彼此的关系,尤其是三个过程变量的均值相对于彼此的关系。Of course, viewing
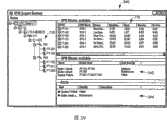
图20图示了一个四维散布图矩阵220,它图示了四个SPM参数之间的相关度。实质上,散布图矩阵220包括16个不同的两维散布图,这16个散布图中的每一个均绘出了四个SPM参数之一对四个SPM参数中另外一个的分布。这里,用户仍然可以快速地查看不同SPM参数之间的相关度或相互关系,以力图检测当前的异常状况,或者预测加工厂内将来可能出现的异常状况。FIG. 20 illustrates a four-dimensional scatterplot matrix 220 illustrating the correlations between four SPM parameters. In essence, the scattergram matrix 220 includes 16 different two-dimensional scattergrams, each of the 16 scattergrams plots the distribution of one of the four SPM parameters versus the other of the four SPM parameters. Here, the user can still quickly view the correlation or interrelationships between different SPM parameters in an attempt to detect current abnormal conditions, or predict possible future abnormal conditions in the processing plant.
同样,图18-20的散布图与其它已知散布图的不同之处在于这些散布图绘出了一个或更多过程变量的均值,而不是过程变量数据点本身。因此,通常在过程变量中出现的噪声得以降低,从而得到更平滑且更可理解的数据描绘。此外,应用程序40并不局限于仅绘制均值,而且还可以绘制其它统计变量如标准差、中值等之间的相互关系。此外,应用程序40可以绘制不同类型的统计变量相对于彼此的相关度,例如均值和标准差,以及统计变量的组合,例如一个过程变量的标准差/均值对另一个过程变量的均值。仅仅作为例子,应用程序40可以绘制任何一个监控过程变量的SPM模块的均值、标准差、均值变化、标准差变化或这些SPM变量的任意数学组合。Likewise, the scatterplots of FIGS. 18-20 differ from other known scatterplots in that these scatterplots plot the means of one or more process variables rather than the process variable data points themselves. As a result, the noise normally present in process variables is reduced, resulting in a smoother and more understandable depiction of the data. In addition, the
如果需要,并且通常如上面所指出的,查看应用程序40可以利用任何标准或已知的相关度计算,来计算或确定任意一对SPM参数的相关系数。当相关系数接近1(或-1)时,两个SPM参数之间存在强的线性相关(或负线性相关)。对于一组两个以上的SPM变量,可以确定相关矩阵,其中相关矩阵中的每一个元素均都定义了不同组的两个SPM参数之间的相关系数。图21图示了示例性相关矩阵230的一部分,该相关矩阵230具有加工厂串联回路内至少9个传感器测量的均值的相关系数。If desired, and generally as noted above, viewing
根据图21的相关矩阵230,可以确定哪些SPM参数具有彼此最强的相关度。明显地,类似图21的数字矩阵不容易查看。然而,应用程序40可以将该矩阵显示为三维柱状图,例如图22所示的柱状图240。在该三维柱状图240中,可以非常清楚地看到最强的相关度位于哪些地方。当然,应用程序40同样还可以以其它图形方式,例如线框图,等高线图等,来显示相关矩阵,所有这些都能够显示最强的相关度位于哪些地方。From the
在一个例子中,例如图23的屏幕显示241所示的例子中,查看应用程序40可以提供相关度图,图示期望过程条件下的一组相关点与当前或不希望有的过程条件下的一组相关点之间的差别。因此,图23的屏幕241包含第一相关度图242A和第二相关度图242B,第一相关度图242A图示期望过程条件下的一组相关点(用X标注),第二相关度图242B图示当前过程条件下的同样一组相关点,由此显示期望过程条件下与当前过程条件下的参数相关度之间的偏差,这可以表示过程内存在异常状况。这里,用X标注的每个相关点均为同一SPM模块或不同SPM模块的至少两个不同SPM参数的相关值。当然,如图23所示,对于一个或两个过程条件,都可以绘制基准均值μ和基准标准差σ。In one example, such as that shown in screen display 241 of FIG. 23 ,
同样,如图24的屏幕243所示,查看应用程序40可以创建色码相关度矩阵,其中根据其幅度,将特定相关点的值图示为一组不同颜色中的一种。这样一种相关点使用户更容易查看不同SPM参数之间的相关度,并由此检测加工厂内异常状况的出现,或者预测加工厂内将来可能出现的异常状况。同样,应当理解,可以对其它类型的SPM参数(不仅仅是均值)、SPM参数的数学组合以及不同类型的SPM参数,确定和用图表示该相关矩阵。Also, as shown in
更进一步,除了上述所讨论的以外,或者作为替代,应用程序40可以提供SPM数据的其它视图。作为一个例子,应用程序40可以按照时间沿X轴,SPM模块的均值和标准差沿Y和Z轴的三维趋势图的形式;按照沿X和Y轴绘出均值和标准差,沿Z轴绘出各自数量的三维直方图的形式;按照时间沿X轴,SPM模块的均值和标准差沿Y和Z轴,并且包含用于均值和标准差中的一个或两个的控制上限和控制下限和/或规定上限和规定下限的三维趋势图的形式,提供可视化的图形或图。当然,可视化SPM数据的方式几乎是无限的,并且本公开内容并不限于上述的特定方法。Still further, the
图25图示了一个绘图屏幕244,它可以由查看应用程序40生成,以使用户能够比较不同变量的曲线,例如SPM参数或相关变量或例如测量的数据和预测的数据之类的数据的SPM参数。在这种情况下,绘图屏幕244的一部分245可以使用户能够选择要在屏幕的绘图部分246上显示的数据的特定图线。例如,用户可以选择查看(在同一屏幕上的分级结构视图中选择的设备的)测量数据的图,预测数据(例如由模型生成的数据)的图,残余数据的图等,所有这些图都可以在同一幅图中。用户还可以选择执行图中的漂移检测和/或在绘图部分246上显示测量门限值。在图25的例子中,用户已经选择查看与预测数据并列的测量数据(可以是SPM数据或原始过程变量数据)的图,以便查看测量过程状态和预测过程状态之间的漂移或不一致。当然,应用程序40可以使用户能够选择绘制在一起的其它变量和数据(既有SPM数据,还有过程变量数据),以查看其它关系。FIG. 25 illustrates a graphing screen 244 that can be generated by the
作为另一个例子,查看应用程序40可以在同一幅图上产生两个(或更多)不同SPM参数的趋势图,从而使用户能够查看一个SPM参数相对于其它参数的预期或意外形态。图26图示了这样的一幅图250,其中两个SPM参数用线252(与阀门相关)和254(与变送器相关)来绘制。在该例中,用户或工程师可以预期两个SPM参数的正规发散(divergence),然后是两个SPM参数的收敛到特定的界限,例如用竖直线255和256示出的界限。然而,当在收敛到该界限之前,出现两个变量之间的发散之后,例如竖直线257和258所示,用户或工程师可以知道存在问题,或者将来可能会出现异常状况。As another example, viewing
应该相信,SPM参数的相关度可以给工厂、工厂一部分、一台设备等总的健全状况的某种指示。当工厂(或工厂的一部分,或一台设备等)处于正常操作状态时,某些变量可能与其它变量高度相关。随着时间的过去,某些相关值可能会发生变化。某些相关值的变化可能表示工厂不再以与它先前相同的性能来运行。因此,以下描述的一些例子提供一个或更多相关值如何随时间发生变化的可视化方法。It is believed that the correlation of SPM parameters can give some indication of the general health of a plant, a portion of a plant, a piece of equipment, or the like. When a plant (or part of a plant, or a piece of equipment, etc.) is in normal operating conditions, some variables may be highly correlated with other variables. Some related values may change over time. A change in some of the relevant values may indicate that the plant is no longer operating at the same performance as it was before. Accordingly, some examples described below provide visualizations of how one or more related values change over time.
为了查看相关值随时间发生的变化,可以在不同时刻计算相关值。诸如式11或式12的公式可以用来生成来自整个变量范围的数据的相关值。另外,可以将数据分为特定长度的若干段(例如,30分钟,1小时,6小时,1天,7天,特定的采样数目,等等),从而可以对每一段计算一个或更多相关值。因此,如果相关值从一段变化到下一段,这可以认为是相关值随时间发生的变化。作为另一个例子,可以基于数据的滑动窗来生成相关值,所述滑动窗具有特定的长度(例如,30分钟,1小时,6小时,1天,7天,特定的采样数目,等等)。In order to see how the correlation values change over time, the correlation values can be calculated at different times. Formulas such as
图27是单一相关值随时间变化的示例性图260。图28是多个相关值随时间变化的示例性图262。从图28中可以看出,在同一幅图上绘制的相关值越多,图形变得越凌乱。因此,以下将描述用于可视化与多个相关值相关的数据的其它示例性方法。FIG. 27 is an
在一个例子中,绘制相关值的变化。例如,可以绘制来自初始值、先前值、基准值、“正常”值、预期值等的相关值的变化。在该例中,该变化可以表示为相对变化(例如百分比),或者也可以表示为绝对变化。In one example, changes in relative values are plotted. For example, changes in relative values from initial values, previous values, baseline values, "normal" values, expected values, etc. can be plotted. In this example, the change may be expressed as a relative change (eg, a percentage), or it may be expressed as an absolute change.
通常,应当根据基础数据量来计算给定相关值的基准值,该基础数据量是以所需要生成作为相关值基础的数据的过程变量数据的数量为基础的。例如,可以基于短则5分钟或长则1天的数据段,生成均值数据。目前人们相信,利用至少30个均值数据点从均值数据得到的相关值能够提供统计上可靠的采样。(应当理解,在某些实现方案中,30以下的均值数据点可能提供统计上可靠的相关值,或者可能需要30以上的均值数据点)。在这种情况下,如果将均值数据点估计为5分钟的时间间隔,则相关度窗口应当近似为3小时或更长。In general, the reference value for a given correlation value should be calculated from an underlying data volume based on the amount of process variable data required to generate the data on which the correlation value is based. For example, mean data can be generated based on data segments as short as 5 minutes or as long as 1 day. It is currently believed that correlation values derived from mean data using at least 30 mean data points provide a statistically reliable sampling. (It should be understood that in some implementations, mean data points below 30 may provide statistically reliable correlation values, or mean data points above 30 may be required). In this case, if the mean data points are estimated to be 5 minute intervals, the correlation window should be approximately 3 hours or longer.
在某些实现方案中,在保存第一均值之前,生成均值数据包括训练时期。在这些实现方案中,生成均值的算法包括试图确定该过程的基准均值。可以通过验证两个连贯数据块的均值和标准差在彼此的特定容差以内,来确定基准均值的存在。这可能有助于确保该基准均值来自于过程处于稳定状态的时间段,而不是过程处于暂态的时间段。在确定了基准均值之后,该算法开始计算和提供可以由其它算法、过程等所使用的均值。这些均值可以用来计算相关值。因此,当用该算法计算第一均值时,该过程可以处于稳定状态并且处于正常运行状态。In some implementations, generating the mean data includes a training epoch before saving the first mean. In these implementations, the algorithm for generating the mean includes attempting to determine a baseline mean for the process. The existence of a baseline mean can be determined by verifying that the mean and standard deviation of two consecutive data blocks are within a specified tolerance of each other. This may help to ensure that the baseline mean is from a time period when the process was steady state, rather than a time period when the process was transient. After determining the baseline mean, the algorithm begins to calculate and provide a mean that can be used by other algorithms, procedures, and the like. These means can be used to calculate correlation values. Therefore, when the algorithm is used to calculate the first mean, the process can be in steady state and in normal operation.
在一个例子中,选择在确定了基准值之后计算的第一相关值作为基准相关度。如上面所讨论的,在许多情况下,当计算第一相关值时,该过程可以处于稳定状态并且处于正常运行状态。In one example, the first correlation value calculated after the reference value is determined is selected as the reference correlation degree. As discussed above, in many cases the process may be in a steady state and in normal operation when the first correlation value is calculated.
然而,在某些情况下,如果人们总是试图将第一相关值用作“正常”值,那么可能会发生问题。例如,该过程可能是这样的:即使在正常运行状态下,从一个相关块到下一个相关块的相关系数也是不规律的。如果两个变量本身具有很低的相关度,那么这尤其正确。同样,如果把生成均值的SPM块的监控周期配置得过高或过低,或者如果当生成该均值的算法进行训练时该过程未处于正常状态,那么第一相关值可能不是正常值的良好估计。In some cases, however, problems can occur if one always tries to use the first correlation value as the "normal" value. For example, the process may be such that even under normal operating conditions, the correlation coefficients from one correlation block to the next are irregular. This is especially true if the two variables themselves have a low correlation. Also, if the monitoring period of the SPM block that generates the mean is configured too high or too low, or if the process is not in a normal state when the algorithm that generates the mean is trained, then the first correlation value may not be a good estimate of the normal value .
因此,在某些情形下,将与第一相关值不同的相关值用作基准相关值可能是有用的。另外,可以确定例如当相关值相对较小和/或不规律时,无法选择基准相关值,或者选择某些绝对值(例如0)作为该基准相关值。Therefore, in some cases it may be useful to use a correlation value different from the first correlation value as a reference correlation value. In addition, it may be determined, for example, that a reference correlation value cannot be selected when the correlation value is relatively small and/or irregular, or that some absolute value (eg, 0) is selected as the reference correlation value.
以下描述了用于确定是否将第一相关值用作基准值的一些示例方法。在一个例子中,可以生成第一相关值与一个或更多后续相关值之间的差,以便查看第一相关值是否与后续相关值一致。如果第一相关值与后续相关值相差一定的程度,很可能不应当将第一相关值用作基准值。在一个特定例子中,将第一相关值与第二相关值进行比较。如果第一相关值与第二相关值相差小于一定程度(例如1%,2%,3%,4%,5%,6%,7%,等等),那么第一相关值可以选择作为基准相关值。如果差别大于规定的程度,那么第一相关值不能选择作为基准相关值。许多其它方法也可以用来确定第一相关值是否应当用作基准值。Some example methods for determining whether to use the first correlation value as a reference value are described below. In one example, the difference between a first correlation value and one or more subsequent correlation values may be generated to see if the first correlation value agrees with the subsequent correlation values. If the first correlation value differs to a certain extent from subsequent correlation values, it is likely that the first correlation value should not be used as a reference value. In one particular example, the first correlation value is compared to the second correlation value. If the difference between the first correlation value and the second correlation value is less than a certain degree (such as 1%, 2%, 3%, 4%, 5%, 6%, 7%, etc.), then the first correlation value can be selected as the reference related value. If the difference is greater than a specified degree, then the first correlation value cannot be selected as the reference correlation value. Many other methods can also be used to determine whether the first correlation value should be used as the reference value.
在一个例子中,可以基于所生成的多个相关值(例如,对这些相关值取平均,采用中值相关值,等等)来生成基准值。在其它例子中,可以基于来自另一类似过程所生成的一个或更多相关值、基于仿真、基于模型等来生成基准值。In one example, a reference value can be generated based on a plurality of correlation values generated (eg, averaging the correlation values, taking a median correlation value, etc.). In other examples, the baseline value may be generated based on one or more related values generated from another similar process, simulation-based, model-based, or the like.
一旦已经为每个相关值确定了初始值、先前值、基准值、“正常”值,预期值等,就可以计算相关度变化阵列。相关度变化阵列可以包括每个相关值与其相应的初始值、基准值、“正常”值、预期值等之间的差别。Once the initial value, previous value, baseline value, "normal" value, expected value, etc. have been determined for each correlation value, the correlation change array can be calculated. The correlation change array may include the difference between each correlation value and its corresponding initial value, baseline value, "normal" value, expected value, and the like.
该差别可以表示为相对变化(例如百分比)或绝对变化。由于计算相关值的典型方法生成0和1之间的相关值,因此绝对变化也应当在0和1之间。然而,如果使用百分比变化,那么百分比变化可能会变得非常大,尤其是当基准相关度接近0时。然而,当与使用绝对变化相比,使用百分比变化很有用和/或更可取时,可能会存在情况。This difference can be expressed as a relative change (eg, a percentage) or an absolute change. Since typical methods of calculating correlation values generate correlation values between 0 and 1, the absolute change should also be between 0 and 1. However, if percentage changes are used, the percentage changes can become very large, especially if the baseline correlation is close to 0. However, there may be situations when using percentage changes is useful and/or preferable to using absolute changes.
图29是相关值和基准值对时间的示例性图264。图264使用户能够看出相关值与基准值随时间变化的差别。然而,如果将更多相关值和基准值添加到图264中时,该图线可能会变得凌乱。FIG. 29 is an
图30是相关值与相应基准值的差别矩阵的示例性显示266。在该例中,对于确定为不具有基准的相关值而言,矩阵单元保留为空白。可选地,这些矩阵单元可以用某些指示来填充,这些指示表示已经确定相应的相关值不具有基准。FIG. 30 is an
图31是相关值与相应基准值的差别矩阵的示例性显示268。在显示268中,将相关值的差别描绘为着色方块,其中方块的颜色表示差别程度。例如,如果绝对差别小于0.2,就给予该方块第一种颜色。如果绝对差别大于0.4,就给予该方块第二种颜色。如果绝对差别在0.2和0.4之间,就给予该方块第三种颜色。FIG. 31 is an exemplary display 268 of a difference matrix of correlation values and corresponding reference values. In display 268, differences in correlation values are depicted as colored squares, where the color of the squares indicates the degree of difference. For example, if the absolute difference is less than 0.2, give the square the first color. If the absolute difference is greater than 0.4, give the square a second color. If the absolute difference is between 0.2 and 0.4, give the square a third color.
图30和图31的显示266和268,显示了瞬间或一个时间段的相关度差别。在其它例子中,可以将显示修改为允许用户显示多个瞬间或时期的相关度差别。例如,可以提供用户接口机制(例如滚动条,箭头按钮等),以允许用户查看不同时期或不同时间段的差别。例如,图31的显示268包括导航条269,以用于显示不同瞬间或不同时期的相关度差别。另外,显示266和268可以包括用于“活动(animating)”显示的用户接口机制,以显示这些差别如何随着若干瞬间或时间段来发生变化。同样,显示264也可以提供有类似的用户接口机制,以允许用户查看不同的时间段。
另外,可以组合多个相关度差别值以生成代表多个相关值差别的值。该值可以随时间来绘制。可以以各种方式来组合多个相关度差别值。例如,可以将一组相关度差别值看作是向量,并且向量的范数可以代表相关度值的差别。以下提供三个等式以用于计算向量的范数。范数可以根据这些等式中的任意一个,或不同的等式来计算。In addition, multiple correlation difference values may be combined to generate a value representing the difference of multiple correlation values. This value can be plotted over time. Multiple affinity difference values may be combined in various ways. For example, a set of correlation degree difference values can be regarded as a vector, and the norm of the vector can represent the difference of correlation degree values. Three equations are provided below for computing the norm of a vector. The norm can be calculated according to either of these equations, or a different equation.
1范数:
2范数:
无穷范数:
其中ΔCi是第i个相关度差别值,N是相关度差别值的数目。如果需要,可以省略等式13中的
图32是2-范数(等式14)值对时间的示例性图270,该2-范数值对应于多个相关度差别值。图33是示例性显示272,它包括用于特定时刻或时间段的多个相关度差别的相关度差别矩阵273,以及多个相关度差别的2-范数值对时间的图274。显示272还可以包括允许用户查看不同瞬间或时间段的相关度差别矩阵273和/或图274的用户接口机制(例如,滚动条,按钮等)。例如,显示272包括导航条275。另外,图274可以包括指示对应于相关度差别矩阵273的图274上瞬间或时间段的指示符。此外,显示272可以包括用户接口机制,以允许“活动”矩阵273,以显示矩阵273中的相关度差别如何在若干瞬间或时间段上发生变化。FIG. 32 is an
如先前所提及的,相关值可以表示两个变量之间线性相关程度的测量。当在一组数据上进行线性回归时可以确定相关值。通常,线性回归确定“最佳”拟合该组数据的一条线。线性回归拟合的结果常常是线的斜率和线的Y截距。该线的斜率和/或该线斜率随时间的变化可能在监控工厂、工厂的一部分、过程、一台设备的健康状况,和/或检测异常状况方面是有用的。只要给定了两组数据X和Y,就可以根据下述等式来计算最佳拟合线的斜率:As mentioned previously, a correlation value may represent a measure of the degree of linear correlation between two variables. Correlation values can be determined when performing linear regression on a set of data. In general, linear regression determines a line that "best" fits the set of data. The results of a linear regression fit are often the slope of the line and the Y-intercept of the line. The slope of the line and/or the change in the slope of the line over time may be useful in monitoring the health of a plant, a portion of a plant, a process, a piece of equipment, and/or detecting abnormal conditions. As long as two sets of data X and Y are given, the slope of the best-fit line can be calculated according to the following equation:
其中xi是X数据组的第i个采样,yi是Y数据组的第i个采样,是X数据组中采样的均值,是Y数据组中采样的均值,而N是数据组X和Y中每一个数据组的采样数目。Wherexi is the i-th sample of the X data set, yi is the i-th sample of the Y data set, is the mean value sampled in the X data set, is the mean of the samples in the Y data set, and N is the number of samples in each of the data sets X and Y.
通过将其绘制在极坐标图上,能够可视化相关值和相应的斜率。特别地,相关值的绝对值能够对应于极径,而极角可以根据下式来确定:By plotting this on a polar plot, it is possible to visualize the correlation values and corresponding slopes. In particular, the absolute value of the correlation value can correspond to the polar radius, while the polar angle can be determined according to:
θ=tan-1m (式17)θ=tan-1 m (Equation 17)
其中m是由等式16或其它等式确定的斜率。反正切函数的值域为。因此,使用该方法只有一半极坐标平面能够包含相关点。可选择地,为了利用整个极坐标平面,可以使用等式:where m is the slope determined by
θ=2.tan-1m (式18)θ=2.tan-1 m (Formula 18)
在这种情况下,图上显示的极角不能够表示该线的准确斜率。然而,如果用户发现它在视觉上更加吸引人的话,这可能是合乎需要的折衷权衡。图34显示了如何在极坐标图276上绘制相关值和相应于最佳拟合线斜率的极角的一个例子。In this case, the polar angles shown on the graph do not represent the exact slope of the line. However, this may be a desirable trade-off if users find it more visually appealing. FIG. 34 shows an example of how the correlation values and polar angles corresponding to the slope of the line of best fit can be plotted on a
图35是使用极坐标绘制的相关值和极角的示例性显示278。在显示278中,中心表示相关度接近0,而外侧表示相关度接近1。因此外环中显示的点是最高相关度的点,而中心圆中显示的点是最低相关度的点。可以将环着色以助于表示不同的相关度等级。显示278还可以包括用户接口机制(例如滚动条,按钮等),以允许用户查看不同瞬间或时间段的图。例如,显示278包括导航条279。FIG. 35 is an
在另一个例子中,相关值和基准之间的差别可以绘制在极坐标图上。在该例中,计算相关度变化的幅度,作为相关值与其基准之间差别的绝对值,并且极角是简单利用例如等式18计算的相关值角度。因此,接近它们基准值的相关值将趋向于导致位于图中心的相关度变化值。如果相关值与其基准相比发生了显著的变化,它将趋向于导致远离图中心的相关度变化值。图36是使用极坐标绘制的相关度变化值的示例性显示280。显示280的环表示相关值与其基准值之间不同等级的幅度差别,并且可以进行彩色编码。在示例性显示280中,中心环表示小于0.2的相关度差别。中间的环表示小于0.4且大于或等于0.2的相关度差别。外环表示小于0.6且大于或等于0.4的相关度差别。在不同实现方案中,可以使用不同数目的环和不同的半径。显示280还可以包括用户接口机制(例如滚动条,按钮等),以允许用户查看不同瞬间或时间段的图。例如,显示280包括导航条281。In another example, the difference between the relative value and the reference can be plotted on a polar plot. In this example, the magnitude of the change in correlation is calculated as the absolute value of the difference between the correlation value and its reference, and the polar angle is simply the correlation value angle calculated using, for example,
在某些情形下,诸如图35和36的极坐标图可以在一幅图中绘制多个瞬间或时间段的相关值或相关度差别值。例如,不同瞬间或时间段的相关值或相关度差别可以用线(可选择地,带有箭头)连接到一起,以帮助用户查看相关值或相关度变化值如何随时间变化。In some cases, polar plots such as FIGS. 35 and 36 can plot correlation values or correlation difference values for multiple instants or time periods in one graph. For example, correlation values or correlation differences at different instants or time periods may be connected together with lines (optionally with arrows) to help users see how correlation values or correlation variation values change over time.
诸如图35和36的显示可以与其它显示结合,以帮助用户监控过程的健全状况。例如,图23图示了包含有极坐标图的显示241。Displays such as FIGS. 35 and 36 can be combined with other displays to help the user monitor the health of the process. For example, FIG. 23 illustrates a display 241 that includes a polar plot.
以上关于图11-36描述的统计数据(例如均值、标准差、均值变化、标准差变化、相关度、相关度变化、基准等)可以由加工厂中的各种设备生成,例如现场设备、I/O设备、过程控制器、工作站、服务器、数据历史记录器等等。例如,均值可以在现场设备中生成,而这些均值的相关度可以在工作站中生成。作为另一个例子,均值和均值相关度都可以在现场设备中生成。The statistical data described above with respect to FIGS. 11-36 (e.g., mean, standard deviation, mean change, standard deviation change, correlation, correlation change, benchmark, etc.) can be generated by various devices in a process plant, such as field devices, I /O devices, process controllers, workstations, servers, data historians, and more. For example, mean values can be generated in field devices and correlations of these mean values can be generated in workstations. As another example, both the mean and the mean correlation can be generated in the field device.
尽管查看应用程序40可以向用户或工程师提供某些或所有上述讨论的视图,以便使用户能够手动地检测加工厂内异常状况的存在或可疑的将来存在,但准则机开发和执行应用程序42还可以用来基于SPM数据自动地检测异常状况。在图37中更详细地图示了图1和2的准则机开发和执行应用程序42的一个可能实施例。如图37所示,准则机开发和执行应用程序42包括可以是任何类型的基于专家机准则的准则机290,和一组准则292,准则可以存储在可以由准则机290访问的数据库中(例如图2的存储器78B内)。准则机290采集或监控来自例如图1和图2的数据库43、现场设备、图2的通信服务器89、数据历史记录器等的统计过程监控数据(在框294表示)。当然,该SPM数据可以包括任何一种上述讨论的数据和例如通过应用程序38获取的数据,以及加工厂内生成的任何其它数据,既包括SPM数据也包括过程变量数据。换句话说,准则机290可以接收SPM数据和各种其它类型的数据,包括例如过程配置数据、控制策略数据、控制输出数据、过程变量数据、历史数据、仿真数据、优化数据、警报、告警、警报/告警管理数据、文件管理数据、帮助/指南数据、转动设备数据、实验室分析数据、工业专用数据、环境规章数据等等。While the
准则机290将准则292应用于SPM和其它数据,以根据准则292中的至少一条准则确定是否存在这样的情况:该情况表明如框296所示,应当将警报或告警发送给用户。当然,如果需要,如果准则表示存在问题的话,除了提供或设置告警以外,准则机290还可以采取其它动作。这些动作可以包括,例如切断过程或过程的更多部件,切换控制参数以改变过程控制等等。Criteria engine 290 applies criteria 292 to the SPM and other data to determine, based on at least one of the criteria 292, whether there is a condition indicating that an alert or warning should be sent to the user as indicated by block 296. Of course, the rules engine 290 may take other actions besides providing or setting an alert, if desired, if the rules indicate a problem. These actions may include, for example, shutting down the process or further components of the process, switching control parameters to change process control, and the like.
另外,准则开发应用程序或例程298使用户能够基于统计数据模式及其相关度,开发一个或更多专家系统准则(例如用作准则292之一),由此检测已知的工厂、单元、设备、控制回路等的异常状况。因此,尽管专家机290所用的至少某些准则292可以预先设置或预先配置,但准则开发应用程序298使用户能够基于所监控加工厂内的经验,创建其它准则。例如,如果用户知道SPM异常状况或事件的特定组合表示过程中的特定问题,那么用户可以使用准则开发应用程序298来创建适当的准则以检测该状况,并且如果需要的话,基于检测到的该状况的存在而生成告警或警报,或者采取某些其它动作。In addition, criteria development application or routine 298 enables a user to develop one or more expert system criteria (e.g., for use as one of criteria 292) based on statistical data patterns and their correlations, thereby detecting known plant, unit, Abnormal conditions of equipment, control circuits, etc. Thus, while at least some of the criteria 292 used by the expert machine 290 may be pre-set or pre-configured, the criteria development application 298 enables the user to create other criteria based on experience within the monitored process plant. For example, if a user knows that a particular combination of SPM abnormal conditions or events represents a particular problem in the process, the user can use the criteria development application 298 to create appropriate criteria to detect that condition and, if desired, Generate an alert or alert, or take some other action, due to the presence of
当然,在加工厂的运行期间,配置为接收SPM数据(和任何其它所需数据)的准则机290应用准则292,以确定是否匹配任何一个准则。如果基于一个或更多准则292检测出过程中的问题,那么可以将警报显示给工厂操作员,或者发送给其它适当的人员。当然,如果需要,用于检测工厂和过程操作内各种异常状况的各种准则可以作为专家系统运行时间机290的一部分,专家系统运行时间机290可以寻找数据和SPM参数的模式、相关度以检测开发的异常状况。Of course, during operation of the process plant, the criteria engine 290 configured to receive the SPM data (and any other required data) applies the criteria 292 to determine whether any of the criteria are matched. If a problem in the process is detected based on one or more criteria 292, an alert may be displayed to a plant operator, or sent to other appropriate personnel. Of course, if desired, various criteria for detecting various abnormal conditions within plant and process operations can be included as part of the expert system runtime machine 290, which can look for patterns, correlations, and Detect development anomalies.
另外,可以被准则机290使用的某些数据是可以在生成SPM数据的设备内进行检测的SPM条件。在这种情况下,准则机290可以是通过例如OPC服务器从设备读取SPM参数和条件的客户端系统,或者可以是客户端系统的一部分。如上所讨论的,这些SPM参数可以存储到数据库中以备将来的使用,例如绘制均值和标准差对时间的图。在任何情况下,如果过程变量的均值或标准差的改变大于用户指定的数量,那么SPM模块自身可以检测出异常状况,例如均值变化、高变化、或低动态。接下来,连同这些现场设备所采集的所有统计监控数据一起,这些异常状况可以随后传递给客户端系统,例如准则机290。Additionally, some of the data that may be used by the criteria engine 290 are SPM conditions that may be detected within the device that generated the SPM data. In this case, the criteria machine 290 may be a client system that reads the SPM parameters and conditions from the devices through eg an OPC server, or may be part of the client system. As discussed above, these SPM parameters can be stored in a database for future use, such as plotting mean and standard deviation versus time. In any case, if the mean or standard deviation of a process variable changes by more than a user-specified amount, the SPM module itself can detect anomalous conditions, such as mean change, high variation, or low dynamics. Next, along with all statistical monitoring data collected by these field devices, these abnormal conditions can then be communicated to a client system, such as the criteria engine 290 .
现在,如果工厂工程师或其它用户知道,当过程变量的特定组合以特定方式变化时,应当触发特定的告警,或需要采取特定的动作,那么工程师就可以使用准则定义例程298来定义一个准则以检测这种状况,如果出现了这组条件,那么该准则的应用程序就能够触发告警。在一个例子中,准则定义应用程序298可以创建一配置屏幕,该配置屏幕使用户能够创建要存储在准则数据库292中的一个或更多如果-那么(IF-THEN)类型或布尔(Boolean)类型的准则。图38图示了配置屏幕300的一个可能例子。特别地,配置屏幕300包括命名部分302,使用户能够为所创建准则定义名称;条件部分304,使用户能够为IF-THEN类型的准则定义“IF”条件;和动作部分306,使用户能够在发现“IF”条件为真时,定义要采取的“THEN”动作。Now, if a plant engineer or other user knows that when a particular combination of process variables changes in a particular way, that a particular alarm should be triggered, or that a particular action be taken, the engineer can use the criterion definition routine 298 to define a criterion to This condition is detected, and the application of the criteria can trigger an alert if the set of conditions is present. In one example, the criteria definition application 298 may create a configuration screen that enables the user to create one or more IF-THEN or Boolean types to be stored in the criteria database 292 guidelines. One possible example of a
在图38的特定例子中,所创建的准则命名为“锅炉1检查(Boiler 1Check)”。另外,如图38所示,条件部分304包括一组分离的条件表述,其中每一个均包括设备310(其中放置了提供条件表述所用的SPM数据的SPM模块)、SPM模块名称312(限定了要提供SPM数据的设备内的特定SPM模块)、SPM数据类型314(限定了SPM模块所提供的数据类型)、比较表述316(限定了SPM数据的数学比较运算)和数值部分318(限定了利用比较表述316要与所接收的SPM数据进行比较的门限值或数值)的表示。此外,框320允许用户选择或定义要在每组条件表述之间应用的布尔逻辑操作数,例如与(AND)操作数、或(OR)操作数,以便定义逻辑上组合这些条件表述从而定义总的“IF”条件的方式。尽管仅将AND和OR布尔操作数图示为可能在图38中选择,但是还可以提供任何其它的布尔操作数(或其它期望类型的操作数),以便使用户能够创建更复杂的准则。此外,一组复选框322和324可以用来定义条件表述的编组。例如,选择复选框322(前半个括弧之前)表示一套括弧内定义的一组新的条件表述的开始,而选择复选框324(后半个括弧之前)表示一套括弧内定义的一组条件表述的结束。正如所理解的那样,在组合不同套括弧内的条件表述(或条件表述组)之前,可以使用它们之间的布尔操作数来组合一套括弧内的条件表述。In the particular example of FIG. 38, the created criterion is named "
因此,在图38的例子中,准则被定义为:(1)如果均值(由PT-101设备的SPM模块1测量)小于或等于102,并且标准差(由PT-102设备的SPM模块3测量)大于或等于1.234,或者(2)如果FT-201设备的SPM模块2的状态参数等于均值变化,并且FT-201设备的SPM模块4的状态参数等于均值变化,那么应当应用动作部分306中定义的动作。Thus, in the example of Figure 38, the criteria are defined as: (1) If the mean (measured by
如图38所示,动作部分306包括用户指定的警报名称部分330、严重性定义部分332和描述部分334。警报名称部分330定义与当发现条件部分304为真时生成的警报相关联的名称,或给予该警报的名称,严重性定义部分332定义该警报的严重性(例如故障、维护、通信或其它警报类型),而描述部分334提供与该警报相关的描述,它可以提供给该警报的用户或查看者。当然,尽管图38的动作部分306定义了要生成的警报,但是动作部分306还可以,或者改为定义要采取的其它动作,例如关闭工厂内的设备、单元等,切换或改变工厂内的控制设置,向工厂内的控制器提供新的设置点或控制条件等等。As shown in FIG. 38 , the
应当理解,在创建了一组准则并将其存储在图37的准则数据库292中之后,专家机开发和执行系统42可以基于在加工厂运行期间加工厂内的SPM模块所返回的数据或异常状况,自动地检测过程异常性。当然,应当理解系统42可以在加工厂运行期间持续地或周期性地操作或运行,以基于准则数据库292内的准则来检测加工厂内的异常状况。It should be understood that after creating a set of criteria and storing them in the criteria database 292 of FIG. , to automatically detect process anomalies. Of course, it should be understood that
如果需要,系统42可以提供查看屏幕,该屏幕向用户提供有关图37的准则机290的当前配置和状态的信息。图39图示了这种显示的一个例子。特别地,图39的显示340包括检测到的ADB分级结构110(正如最初关于图6和8所描述的一样),以及关于图8所描述的SPM数据115的摘要。另外,图39的屏幕340包括准则摘要部分342,它列出并概括了与已经为准则机290定义并由其执行的准则有关的某些信息。在图39的例子中,至少已经定义了三个准则,并且准则摘要部分342提供关于这三个准则中每一个所用设备的信息,以及由这三个准则中每一个生成的警报类型或严重性。同样在图39中示出,警报摘要部分344提供准则机290基于由此定义的准则所设置或发送的任何警报的指示。在图39的例子中,当前设置了两个警报,包括系统2故障(System2 Failed)警报和锅炉需要维护(Boiler NeedsService)警报。这些警报基于摘要部分342中未专门说明的准则由图37的准则机290生成,但是如果需要的话,它也可以通过在摘要部分342中向下滚动来访问。If desired, the
正如所理解的那样,可以通过关于图4描述的方法,提供可用的SPM模块主树形浏览器110和摘要115。同样,利用类似于图38的配置屏幕,可以由用户创建准则摘要部分342中的每一个准则。并且,如果SPM模块的状态中任何条件与所定义的任何准则相匹配的话,则显示警报。当然,应当理解,用户可以使用已知的异常性预先定义准则,或者为新状况修改现有的准则,或者如果必要的话创建全新的准则。As will be appreciated, the available SPM module
图40和图41图示了准则创建或定义的屏幕的其它例子。例如,准则定义屏幕350包括“简单”型布尔准则定义器,它提供一组条件表述351,其中每一个条件表述均具有第一元素352,第一元素352规定要测试的变量或SPM参数,还包括测试或比较条件354(它可以是任何数学运算或测试),还具有其它元素356,其可以是任何过程变量或SPM参数。这些元素中的每一个均可以手动地进行填充,或者如果需要的话可以从下拉菜单中进行选择。同样,与图38的屏幕类似,可以指定一个布尔操作数,以组合每个条件表述354,而结果部分360可以用来指定警报名称、严重性以及作为警报一部分的要提供给用户的消息,倘若定义的IF表述为真的话。40 and 41 illustrate other examples of criteria creation or definition screens. For example, the Criterion Definition Screen 350 includes a "simple" type Boolean Criterion Definer that provides a set of conditional expressions 351, each of which has a first element 352 that specifies the variable or SPM parameter to be tested, and Included is a test or comparison condition 354 (which could be any mathematical operation or test) and also has other elements 356 which can be any process variable or SPM parameter. Each of these elements can be populated manually, or selected from drop-down menus if desired. Also, similar to the screen of Figure 38, a Boolean operand can be specified to combine each conditional expression 354, and the results section 360 can be used to specify the alarm name, severity, and message to be provided to the user as part of the alarm, provided The defined IF statement is true.
图41图示了更“高级”类型的准则定义器370,它包括可以通过不同按钮374的选择而构造的IF部分372。按钮374可以包括或允许用户指定类型或特定参数(例如ADB参数,SPM参数,过程变量(PV)状态或参数等)、布尔操作数、在部分372中创建更复杂的IF表述要用到的数字和数学等价表述。包含警报名称定义部分、严重性定义部分和消息部分在内的部分376,可以用来定义要由该准则生成的警报或告警。当然,应用程序40可以提供定义要由准则机290执行准则的任何其它方式,以检测当前或预测的异常状况。FIG. 41 illustrates a more "advanced" type of criteria definer 370 that includes an IF section 372 that can be configured by selection of various buttons 374 . Buttons 374 may include or allow the user to specify types or specific parameters (such as ADB parameters, SPM parameters, process variable (PV) status or parameters, etc.), Boolean operands, numbers to be used in creating more complex IF expressions in section 372 and mathematical equivalent expressions. Section 376, which includes an alert name definition section, a severity definition section, and a message section, may be used to define the alerts or warnings to be generated by the criteria. Of course, the
此外,尽管图38、图40和图41的屏幕可以用来使用户能够定义IF-THEN类型的布尔准则,但是另外或替代地还可以定义其它类型的准则。例如,可以修改图38、图40和图41的屏幕,或者可以提供另外的屏幕以允许定义棋盘式分析表类型的准则(例如,类似于由微软的Excel
在操作期间,图37的准则机290可以使用许多不同的方法来匹配SPM模块的条件与准则数据库292中定义的准则。如果准则数据库292中的准则过于复杂,那么准则机290可以简单地用适当的逻辑处理机来编程。然而,如果某些准则变得非常复杂,使用已经开发的专家系统工具是有益的。During operation, the criteria engine 290 of FIG. 37 can use a number of different methods to match the conditions of the SPM module with the criteria defined in the criteria database 292 . If the criteria in the criteria database 292 are too complex, the criteria engine 290 can simply be programmed with an appropriate logic handler. However, if certain criteria become very complex, it is beneficial to use already developed expert system tools.
应当理解,一旦监控过程启动,所有准则就要通过任何适当的接口馈送到准则机292中。此后,每当SPM条件变化时,例如能够由图4的框132或134检测到的,就将这些条件馈送到准则机292中。在每一个时间间隔内,准则机292确定是否匹配任一准则的条件。如果满足任一准则,则准则机292将通知发回给主应用程序,从而可以向用户显示警报,或者基于满足特定准则的动作表述,采取某些其它动作。It should be understood that once the monitoring process is initiated, all criteria are fed into the criteria engine 292 through any suitable interface. Thereafter, whenever the SPM conditions change, such as can be detected by
图42图示了加工厂一部分的示例性屏幕显示380和告警显示382。如果满足一个或更多适当的准则,那么准则机292可以使告警显示382进行显示。告警显示382可以包括建议的校正动作、到工厂程序的链接、到查看性能/质量数据的链接等等。屏幕显示830还可以包括显示与该告警相关的设备、回路、测量等的显示部分周围的突显部分383。举例来说,准则机290可以向查看应用程序40发送数据,从而使它显示告警显示382和突显部分383。FIG. 42 illustrates exemplary screen displays 380 and
图43图示了加工厂一部分的另一示例性屏幕显示384,该显示384包含警报/告警信息。特别地,图385显示了与该警报/告警相关的各种统计参数。屏幕显示384还可以包括显示与该告警相关信息的信息窗口386和387。信息窗口386和387例如通过彩色编码,可以显示不同的重要性等级。如果满足一个或更多适当的准则,准则机290可以使窗口385、386和387进行显示。举例来说,准则机290可以向查看应用程序40发送数据,从而使它显示窗口385、386和387。FIG. 43 illustrates another exemplary screen display 384 of a portion of a processing plant that includes alarm/warning information. In particular, graph 385 shows various statistical parameters related to the alert/warning. Screen display 384 may also include information windows 386 and 387 that display information related to the alert. Information windows 386 and 387 may display different levels of importance, eg by color coding. Criteria engine 290 may cause windows 385, 386, and 387 to be displayed if one or more appropriate criteria are met. For example, rules engine 290 may send data to viewing
图44图示了加工厂一部分的又一示例性屏幕显示390,该显示390包含警报/告警信息。图45图示了加工厂一部分的再一示例性屏幕显示395,该显示395包含警报/告警信息。FIG. 44 illustrates yet another
尽管以上对准则机292进行了描述,另外地或替代地还可以使用其它类型的分析机。可以使用的其它类型分析机的例子包括数学计算系统(例如,来自Wolfram Research的Mathematica计算系统,来自MathWorks的MATLAB
尽管上述数据采集技术、可视化技术和准则机技术可以用来在图1的工厂配置中采集、查看和处理SPM数据,它同样也可以用于其它配置中。例如,它可以用于基于PC的环境中(例如DeltaV、AMS和Ovation),其中软件对各种服务器(例如OPC服务器、web服务器等)进行访问,以便获取工厂分级结构,并查找给定工厂中的设备,以及确定带有ADB和SPM功能的设备。另一种使用是直接用于现场硬化设备,如柔斯芒特Rosemount3420设备中,它具有内置OPC服务器,并且可以直接对现场设备进行访问。在这种情况下,设备自身可以存储数据采集和准则机应用程序,并运行这些应用程序而无须单独的平台,如用户工作站。另外,在该情况或其它情况下,此处描述的可视化应用程序或部件可以在其它设备上运行或执行,例如手持式设备,个人数据助理等,它们可以连接至孤立设备,以获取所采集的SPM数据、警报等,供用户查看。Although the data collection, visualization, and rule machine techniques described above can be used to collect, view, and process SPM data in the plant configuration of Figure 1, it can be used in other configurations as well. For example, it can be used in PC-based environments (such as DeltaV, AMS, and Ovation) where the software accesses various servers (such as OPC servers, web servers, etc.) devices, and devices with ADB and SPM functions. Another use is directly used in field hardening equipment, such as Rosemount 3420 equipment, which has a built-in OPC server and can directly access field devices. In this case, the device itself can store data acquisition and criterion machine applications and run them without a separate platform, such as a user workstation. Additionally, in this or other cases, the visualization applications or components described herein can be run or executed on other devices, such as handheld devices, personal data assistants, etc., which can be connected to stand-alone devices to obtain captured SPM data, alerts, etc. for users to view.
类似的,数据采集和查看应用程序可以通过远程查看设备访问现场设备或其它设备。因此,该软件可以驻存在web服务器中,或者可以通过web服务器进行访问,web服务器例如是由爱默生过程管理公司提供的资产入口和AMSweb(Asset Portal and AMSweb)。并且,尽管在图2中已经将OPC服务器图示为与包含SPM模块在内的现场设备分离,但是OPC服务器或其它服务器也可以位于一个或更多现场设备的自身中。同样,异常状况预防系统的数据采集应用程序38和准则机42可以位于与ADB和/或SPM模块同样的设备内,这些ADB和/或SPM模块生成例如其中带有ADB和/或SPM模块的现场设备的SPM数据。在这种情况下,无需OPC接口(尽管仍然可能会使用OPC接口),异常状况预防系统35就可以在与统计数据采集模块同样的设备中操作或执行。如果需要,由应用程序38和42生成的SPM数据或警报、告警等可以按照通常从现场设备访问数据的任何方式进行访问,例如通过控制器连接、通过手持式设备、通过无线的方式等等。Similarly, data acquisition and viewing applications can access field devices or other devices through remote viewing devices. Thus, the software may reside in or be accessed via a web server such as Asset Portal and AMSweb (Asset Portal and AMSweb) provided by Emerson Process Management. Also, although the OPC server has been illustrated in FIG. 2 as being separate from the field devices including the SPM module, the OPC server or other server may also be located in one or more of the field devices themselves. Likewise, the data collection application 38 and the
图46图示了在不需要使用分布式控制器、主机或其它更常规的用户接口来支持SPM模块和异常状况预防功能的加工厂中,实现异常状况预防的另一种方式。在图46的系统400中,某些或所有异常状况预防应用程序35和/或应用程序38-42可以存储在除主机工作站或个人计算机以外的设备上。图46的示例系统400包括连接至接口设备410的一组现场设备405(图示为Fieldbus现场设备,但是它们还可以是其它类型的设备),接口设备410例如可以是柔斯芒特Rosemount3420设备。在这种情况下,不是个人计算机的接口设备410,可以包括上述异常状况预防系统35的某些或所有功能。特别地,接口设备410可以包括浏览器412,浏览器412接收和组织现场设备405(可以是各种不同类型的现场设备)所传送的数据。如果需要,该浏览器或通信设备412可以包括OPC浏览器。数据采集应用程序38(或它的一部分)也可以存储在接口设备410的处理器中,并且在接口设备410的处理器上执行,以采集来自现场设备405的数据,包括上述的带有SPM模块的任何现场设备的SPM数据。另外,如以上所讨论的,接口设备410可以包括一个或更多SPM模块414,以便直接从一个或更多现场设备(例如不包括SPM模块或功能的现场设备)采集过程变量数据,并生成SPM参数。以这种方式,在接口设备410中存储和执行的SPM模块414能够补偿某些现场设备405中SPM模块的缺失,并且可以用来为自身不支持SPM模块或SPM功能的现场设备提供SPM数据。Figure 46 illustrates another way of implementing abnormal condition prevention in a process plant that does not require the use of distributed controllers, host computers, or other more conventional user interfaces to support the SPM module and abnormal condition prevention functions. In the
另外,准则机应用程序42(或其一部分,例如图37的准则机290)可以存储在接口设备410中并由其执行,而数据库43同样也可以位于接口设备410中。接口设备410可以通过硬布线连接,例如2-线,3-线,4-线等连接与诸如主机工作站430的其它设备进行通信,从而向这些设备提供SPM数据或通过其开发的数据,例如警报、数据图等,以便由用户查看。另外,如图46所示,接口设备410可以经由一个或更多无线通信连接,连接至web浏览器440并连接至手持式计算设备,例如电话、个人数据助理(PDA),膝上型计算机等。在该例中,一个或更多查看应用程序40可以在诸如主机工作站430的其它设备中,在web浏览器440或者在手持式计算设备450中存储和执行,并且这些应用程序可以与接口设备410进行通信,从而获取期望的数据,以便以如上述任一方式的任何方式处理和查看。如果需要,设备430、440和450可以包括图37的准则定义应用程序298,以便使用户能够生成要由接口设备410中的准则机执行的准则。同样,如图46所示,来自接口设备410的数据可以通过web浏览器640从主机430间接访问,并且经由任何期望的web连接提供给其它用户。当然,接口设备410可以包括web服务器,并且可以使用任何期望的协议,例如OPC、Modbus、Ethernet、HTML、XML等与诸如设备430、440、450和460的任何其它设备进行通信。Additionally, the rule machine application 42 (or a portion thereof, such as the rule machine 290 of FIG. 37 ) may be stored in and executed by the
图47图示了另一个加工厂配置500,其中可能与图46的接口设备类似或相同的接口设备410,连接在一组现场设备510(构成热交换器515的一部分)与过程控制系统520之间。这里,接口设备410可以包括图46的设备410的所有应用程序和功能,可以向主机530提供用于查看的数据,并且可以向控制器系统520提供由准则机生成的警报或告警。控制器系统520可以将这些警报或告警与其它控制器类型的警报和告警整合到一起,以便由例如操作员工作站540处的控制操作员来查看。当然,如果需要,主机工作站530可以包括任何期望的查看应用程序,以便以包括这里所讨论的任一方式在内的任何所需方式,来查看在接口设备410中采集或由接口设备410提供的数据。同样,可以使该数据能够通过web浏览器550由其它用户进行查看。因此,应当理解,这里所讨论的与异常状况预防系统3 5相关的各种应用程序可以分布在不同的设备中,并且不需要全部都在具有用户接口的设备中操作。相反,数据(诸如SPM数据)可以在诸如接口设备410的一个设备中采集和处理,并发送,以便在完全不同的设备中查看。同样,准则可以在诸如主机、web浏览器、PDA等的用户接口设备中创建,并发送给诸如接口设备410的不同设备,以便在准则机中执行。47 illustrates another
尽管在图1和图2的例子中,将与异常状况预防系统35相关的应用程序38、40和42图示为存储在同一个工作站或计算机上,但是这些应用程序中的某些或其它实体也可以在加工厂10内或与之相关的其它工作站或计算机设备中存储和执行。此外,异常状况预防系统35内的应用程序可以进行分解,在两个或更多计算机或机器上执行,并且可以配置为通过有线、无线、和/或间歇式通信连接彼此协力共同操作。进一步,这里所描述的异常状况预防系统35可以包括应用程序38、40和42中的任一个或全部,并且可以包括但并不必需包括这里所描述的ADB或SPM模块。此外,尽管这里所描述的例子使用Fieldbus SPM模块形式的SPM模块,但是这里所使用的术语“SPM模块”意图是指和包括任何其它类型的统计过程监控模块、例程等,它们采集过程数据或变量,并执行某些统计操作或监控,而无论这些模块或例程是否符合已知的Fieldbus协议。Although in the examples of FIGS. 1 and 2, the
此外,尽管以上描述涉及计算统计数据的诸如ADB模块和SPM模块的一些模块,但是也可以使用可以生成其它类型的信号处理数据的其它类型的信号处理数据采集模块。例如,可以生成频率分析数据(例如基于傅立叶变换或过程变量的某些其它变换而生成的数据)、自回归数据、小波数据、利用神经网络生成的数据、利用模糊逻辑生成的数据等的信号处理数据采集模块,也可以用于异常状况预防系统中。因此,这里使用的术语“信号处理数据采集模块”意图是指以及包括任何类型的监控模块、软件例程、硬件等,它们采集过程数据或变量,并执行某些信号处理操作或监控,例如生成统计数据,数学变换过程数据(例如,使用傅立叶变换、离散傅立叶变换、快速傅立叶变换、短时傅立叶变换、Z变换、希尔伯特变换、Radon变换、魏格纳变换、小波变换等),从变换的过程数据中提取信息,滤波,使用模糊逻辑、神经网络、自回归技术等从过程数据中提取信息。Furthermore, while the above description refers to modules such as ADB modules and SPM modules that calculate statistical data, other types of signal processing data acquisition modules that can generate other types of signal processing data may also be used. For example, signal processing that can generate frequency analysis data (such as data generated based on a Fourier transform or some other transformation of a process variable), autoregressive data, wavelet data, data generated using neural networks, data generated using fuzzy logic, etc. The data acquisition module can also be used in the abnormal condition prevention system. Accordingly, the term "signal processing data acquisition module" as used herein is intended to refer to and include any type of monitoring module, software routine, hardware, etc., which acquires process data or variables and performs certain signal processing operations or monitoring, such as generating Statistical data, mathematical transformation of process data (for example, using Fourier transform, discrete Fourier transform, fast Fourier transform, short-time Fourier transform, Z-transform, Hilbert transform, Radon transform, Wigner transform, wavelet transform, etc.), from Extract information from transformed process data, filter, extract information from process data using fuzzy logic, neural networks, autoregressive techniques, etc.
进一步,尽管已经描述了一些例子,在这些例子中收集和分析了来自单个加工厂内的信号数据采集模块的信号处理数据,但是应当理解类似的技术也可以用于多个加工厂的情况。例如,可以收集来自多个加工厂的信号处理数据,然后可以将该数据提供给分析机和/或查看应用程序。Further, while examples have been described in which signal processing data from signal data acquisition modules within a single process plant are collected and analyzed, it should be understood that similar techniques may be used in the context of multiple process plants. For example, signal processing data from multiple processing plants can be collected, which can then be provided to an analysis engine and/or viewing application.
尽管已经描述了使用特定通信协议和技术的例子,但是也可以使用各种其它协议和技术,包括用于访问来自信号处理数据采集模块的配置数据和信号处理数据的已知协议和技术。例如,除了OPC以外的其它协议和技术可以用来识别和/或配置信号处理数据采集模块,收集信号处理数据等等。其它技术可以包括,例如使用因特网协议、以太网、XML、专有协议等,并且其它实现方案可以使用web服务器和/或专用计算设备,例如过程控制器、I/O设备、工作站、现场设备等。类似地,也可以使用包含专有数据在内的其它类型的分级结构数据。Although examples using specific communication protocols and techniques have been described, various other protocols and techniques may be used, including known protocols and techniques for accessing configuration data and signal processing data from signal processing data acquisition modules. For example, other protocols and technologies than OPC may be used to identify and/or configure signal processing data acquisition modules, collect signal processing data, and so on. Other technologies may include, for example, use of Internet Protocol, Ethernet, XML, proprietary protocols, etc., and other implementations may use web servers and/or dedicated computing devices, such as process controllers, I/O devices, workstations, field devices, etc. . Similarly, other types of hierarchical data including proprietary data may be used.
尽管异常状况预防系统和与这里描述的异常状况预防系统相关的应用程序,优选在软件中实施,但它们也可以在硬件、固件等中实施,并且可以由与过程控制系统相关的其它任何处理器来实施。因此,这里所描述的元素可以在标准的多用途CPU中实施,或者在所需要的专门设计的硬件或固件上实施,例如专用集成电路(ASIC)或其它硬布线设备。当在软件中实施时,软件例行程序可以存储在任何计算机可读存储器内,例如磁盘、激光盘(例如DVD)或其它存储介质,计算机或处理器的RAM或ROM,任何数据库等等。同样,该软件可以经由任何已知或期望的传送方法传送给用户或加工厂,例如,通过计算机可读盘或者其它可移动的计算机存储机制,或者通过诸如电话线、因特网等通信信道(这些都被视作与经由可移动存储介质来提供这种软件是相同的或可互换的)。Although the abnormal condition prevention system and applications related to the abnormal condition prevention system described herein are preferably implemented in software, they can also be implemented in hardware, firmware, etc., and can be implemented by any other processor associated with the process control system. to implement. Thus, elements described herein may be implemented in a standard general purpose CPU, or on specially designed hardware or firmware as required, such as an application specific integrated circuit (ASIC) or other hardwired device. When implemented in software, the software routines may be stored in any computer readable memory, such as a magnetic disk, laser disk (eg DVD) or other storage medium, RAM or ROM of a computer or processor, any database, etc. Likewise, the software may be delivered to the user or to the processor via any known or desired delivery method, for example, via a computer readable disk or other removable computer storage mechanism, or via a communication channel such as a telephone line, the Internet, etc. are deemed to be the same as or interchangeable with providing such software via removable storage media).
因此,尽管已经根据具体的例子对本公开进行了描述,但是,这些例子仅仅是示例性的,而不是限制性的,对于本领域的普通技术人员来说,在不脱离本发明的精神和范围的前提下,可以对所披露的实施例进行更改,添加或删除是显而易见的。Therefore, although the present disclosure has been described in terms of specific examples, these examples are illustrative only and are not restrictive, and will be understood by those skilled in the art without departing from the spirit and scope of the present invention. It is obvious that changes, additions or deletions can be made to the disclosed embodiments.
Claims (22)
Applications Claiming Priority (5)
| Application Number | Priority Date | Filing Date | Title |
|---|---|---|---|
| US54979604P | 2004-03-03 | 2004-03-03 | |
| US60/549,796 | 2004-03-03 | ||
| US10/972,155US7389204B2 (en) | 2001-03-01 | 2004-10-22 | Data presentation system for abnormal situation prevention in a process plant |
| US10/972,155 | 2004-10-22 | ||
| PCT/US2005/006319WO2005093531A2 (en) | 2004-03-03 | 2005-02-25 | Data presentation system for abnormal situation prevention in a process plant |
Related Child Applications (1)
| Application Number | Title | Priority Date | Filing Date |
|---|---|---|---|
| CN201210004733.3ADivisionCN102520717B (en) | 2004-03-03 | 2005-02-25 | Data presentation system for abnormal situation prevention in a process plant |
Publications (2)
| Publication Number | Publication Date |
|---|---|
| CN1926489A CN1926489A (en) | 2007-03-07 |
| CN1926489Btrue CN1926489B (en) | 2012-02-15 |
Family
ID=37818208
Family Applications (3)
| Application Number | Title | Priority Date | Filing Date |
|---|---|---|---|
| CNB2005800068427AExpired - LifetimeCN100555136C (en) | 2004-03-03 | 2005-02-25 | Unusual condition prevention method and system in the processing factory |
| CN 200580006879Expired - LifetimeCN100582978C (en) | 2004-03-03 | 2005-02-25 | Configuration system and method for abnormal situation prevention in a process plant |
| CN2005800068889AExpired - LifetimeCN1926489B (en) | 2004-03-03 | 2005-02-25 | Data presentation system for preventing abnormal conditions in processing plants |
Family Applications Before (2)
| Application Number | Title | Priority Date | Filing Date |
|---|---|---|---|
| CNB2005800068427AExpired - LifetimeCN100555136C (en) | 2004-03-03 | 2005-02-25 | Unusual condition prevention method and system in the processing factory |
| CN 200580006879Expired - LifetimeCN100582978C (en) | 2004-03-03 | 2005-02-25 | Configuration system and method for abnormal situation prevention in a process plant |
Country Status (1)
| Country | Link |
|---|---|
| CN (3) | CN100555136C (en) |
Cited By (2)
| Publication number | Priority date | Publication date | Assignee | Title |
|---|---|---|---|---|
| TWI667660B (en)* | 2018-11-20 | 2019-08-01 | 帆宣系統科技股份有限公司 | Intelligent pre-diagnosis and health management system modeling method and computer program product |
| TWI673723B (en)* | 2018-09-20 | 2019-10-01 | 帆宣系統科技股份有限公司 | Intelligent pre-diagnosis and health management system and method |
Families Citing this family (27)
| Publication number | Priority date | Publication date | Assignee | Title |
|---|---|---|---|---|
| US7702401B2 (en)* | 2007-09-05 | 2010-04-20 | Fisher-Rosemount Systems, Inc. | System for preserving and displaying process control data associated with an abnormal situation |
| CN100468247C (en)* | 2007-09-13 | 2009-03-11 | 浙江工业大学 | A collection terminal device of a monitoring system |
| CN101175125B (en)* | 2007-09-14 | 2010-05-26 | 浙江工业大学 | A front-end computer device of a monitoring system |
| CN101231519B (en)* | 2007-09-14 | 2010-12-01 | 浙江工业大学 | Back-end machine apparatus for monitoring system |
| US8843221B2 (en)* | 2009-12-09 | 2014-09-23 | Comau Spa | Automation management system and method |
| US9342072B2 (en)* | 2010-09-24 | 2016-05-17 | Fisher-Rosemount Systems, Inc. | Methods and apparatus to display process control device information |
| US20120098834A1 (en)* | 2010-10-25 | 2012-04-26 | General Electric Company | Smart plot methodology |
| TWI515522B (en) | 2010-12-28 | 2016-01-01 | 萬國商業機器公司 | Method, computer program, and computer for determining system situation |
| EP2520991B1 (en)* | 2011-05-02 | 2014-03-19 | Siemens Aktiengesellschaft | Method for controlled intervention into the behaviour of a sub-module |
| US8659415B2 (en)* | 2011-07-15 | 2014-02-25 | General Electric Company | Alarm management |
| CN103135518B (en)* | 2011-12-02 | 2019-11-12 | 费希尔控制国际公司 | Program flow control monitoring routine, method and system related thereto |
| CN103812734A (en)* | 2012-11-14 | 2014-05-21 | 上海工程技术大学 | Circuit breaker pressure resistant testing process monitoring system based on OPC (Ole for Process Control) technology |
| EP2752724B1 (en)* | 2013-01-08 | 2016-06-01 | VEGA Grieshaber KG | Method for monitoring of field devices, controller, program element and computer-readable medium |
| CN104570976A (en)* | 2013-10-22 | 2015-04-29 | 富泰华工业(深圳)有限公司 | Monitoring system and method |
| EP3002651B1 (en)* | 2014-09-30 | 2021-01-13 | Endress+Hauser Group Services AG | Monitoring means and monitoring method for monitoring at least one step of a process run on an industrial site |
| CN205427588U (en)* | 2014-10-04 | 2016-08-03 | 布里斯托公司商用名远程自动化解决方案 | System for be used for making up equipment level for process mill |
| ES2654335T3 (en) | 2014-10-23 | 2018-02-13 | Comau S.P.A. | System to monitor and control an industrial installation |
| JP6278278B2 (en)* | 2015-08-27 | 2018-02-14 | 横河電機株式会社 | Wireless relay device, wireless communication system, and wireless communication method |
| CN106814949A (en)* | 2015-12-01 | 2017-06-09 | 北京触控科技有限公司 | A kind of cocos game editing machine control interfaces management method |
| JP7384551B2 (en)* | 2017-03-14 | 2023-11-21 | 株式会社堀場エステック | Diagnostic system, diagnostic method, diagnostic program and flow control device. |
| IT201800005091A1 (en) | 2018-05-04 | 2019-11-04 | "Procedure for monitoring the operating status of a processing station, its monitoring system and IT product" | |
| CN109029543A (en)* | 2018-06-26 | 2018-12-18 | 深圳市威富智能设备有限公司 | A kind of abnormality detection system and method |
| CN112889090A (en)* | 2018-08-17 | 2021-06-01 | 道特里斯艾欧公司 | System and method for performing modeling and control of a physical dynamic system using artificial intelligence |
| TWI766386B (en)* | 2019-11-28 | 2022-06-01 | 日商富士金股份有限公司 | Operation information collecting system for fluid control equipment, fluid control equipment, operation information collecting method for fluid control equipment, and computer program |
| TWI841108B (en) | 2020-07-27 | 2024-05-01 | 美商瓦特洛威電子製造公司 | Method of controlling thermal system and process control system for controlling heater system |
| CN113552856B (en)* | 2021-09-22 | 2021-12-10 | 成都数之联科技有限公司 | Process parameter root factor positioning method and related device |
| CN119375572B (en)* | 2024-10-09 | 2025-09-30 | 卡斯柯信号有限公司 | Analog signal online anomaly detection method, electronic device and readable storage medium |
Citations (1)
| Publication number | Priority date | Publication date | Assignee | Title |
|---|---|---|---|---|
| US5812394A (en)* | 1995-07-21 | 1998-09-22 | Control Systems International | Object-oriented computer program, system, and method for developing control schemes for facilities |
- 2005
- 2005-02-25CNCNB2005800068427Apatent/CN100555136C/ennot_activeExpired - Lifetime
- 2005-02-25CNCN 200580006879patent/CN100582978C/ennot_activeExpired - Lifetime
- 2005-02-25CNCN2005800068889Apatent/CN1926489B/ennot_activeExpired - Lifetime
Patent Citations (1)
| Publication number | Priority date | Publication date | Assignee | Title |
|---|---|---|---|---|
| US5812394A (en)* | 1995-07-21 | 1998-09-22 | Control Systems International | Object-oriented computer program, system, and method for developing control schemes for facilities |
Non-Patent Citations (1)
| Title |
|---|
| 同上. |
Cited By (2)
| Publication number | Priority date | Publication date | Assignee | Title |
|---|---|---|---|---|
| TWI673723B (en)* | 2018-09-20 | 2019-10-01 | 帆宣系統科技股份有限公司 | Intelligent pre-diagnosis and health management system and method |
| TWI667660B (en)* | 2018-11-20 | 2019-08-01 | 帆宣系統科技股份有限公司 | Intelligent pre-diagnosis and health management system modeling method and computer program product |
Also Published As
| Publication number | Publication date |
|---|---|
| CN1926489A (en) | 2007-03-07 |
| CN1926487A (en) | 2007-03-07 |
| CN1926488A (en) | 2007-03-07 |
| CN100555136C (en) | 2009-10-28 |
| CN100582978C (en) | 2010-01-20 |
Similar Documents
| Publication | Publication Date | Title |
|---|---|---|
| CN102520717B (en) | Data presentation system for abnormal situation prevention in a process plant | |
| CN1926489B (en) | Data presentation system for preventing abnormal conditions in processing plants | |
| EP1725919B1 (en) | Configuration system and method for abnormal situation prevention in a process plant | |
| EP1728133B1 (en) | Abnormal situation prevention in a process plant | |
| US7853431B2 (en) | On-line monitoring and diagnostics of a process using multivariate statistical analysis | |
| WO2007047375A1 (en) | Statistical signatures used with multivariate statistical analysis for fault detection and isolation and abnormal condition prevention in a process | |
| WO2008014344A2 (en) | Model based method for detecting abnormal operation of a level regulatory control loop and associated apparatus |
Legal Events
| Date | Code | Title | Description |
|---|---|---|---|
| C06 | Publication | ||
| PB01 | Publication | ||
| C10 | Entry into substantive examination | ||
| SE01 | Entry into force of request for substantive examination | ||
| C14 | Grant of patent or utility model | ||
| GR01 | Patent grant | ||
| CX01 | Expiry of patent term | Granted publication date:20120215 | |
| CX01 | Expiry of patent term |