CN1795478A - System, device and method for drawing a map - Google Patents
System, device and method for drawing a mapDownload PDFInfo
- Publication number
- CN1795478A CN1795478ACNA2004800146718ACN200480014671ACN1795478ACN 1795478 ACN1795478 ACN 1795478ACN A2004800146718 ACNA2004800146718 ACN A2004800146718ACN 200480014671 ACN200480014671 ACN 200480014671ACN 1795478 ACN1795478 ACN 1795478A
- Authority
- CN
- China
- Prior art keywords
- data
- map
- markers
- area
- representing
- Prior art date
- Legal status (The legal status is an assumption and is not a legal conclusion. Google has not performed a legal analysis and makes no representation as to the accuracy of the status listed.)
- Granted
Links
Images


Classifications
- G—PHYSICS
- G01—MEASURING; TESTING
- G01C—MEASURING DISTANCES, LEVELS OR BEARINGS; SURVEYING; NAVIGATION; GYROSCOPIC INSTRUMENTS; PHOTOGRAMMETRY OR VIDEOGRAMMETRY
- G01C21/00—Navigation; Navigational instruments not provided for in groups G01C1/00 - G01C19/00
- G01C21/38—Electronic maps specially adapted for navigation; Updating thereof
- G01C21/3804—Creation or updating of map data
- G01C21/3833—Creation or updating of map data characterised by the source of data
- G01C21/3852—Data derived from aerial or satellite images
- G—PHYSICS
- G09—EDUCATION; CRYPTOGRAPHY; DISPLAY; ADVERTISING; SEALS
- G09B—EDUCATIONAL OR DEMONSTRATION APPLIANCES; APPLIANCES FOR TEACHING, OR COMMUNICATING WITH, THE BLIND, DEAF OR MUTE; MODELS; PLANETARIA; GLOBES; MAPS; DIAGRAMS
- G09B29/00—Maps; Plans; Charts; Diagrams, e.g. route diagram
- G09B29/10—Map spot or coordinate position indicators; Map reading aids
- G09B29/106—Map spot or coordinate position indicators; Map reading aids using electronic means
- G—PHYSICS
- G06—COMPUTING OR CALCULATING; COUNTING
- G06T—IMAGE DATA PROCESSING OR GENERATION, IN GENERAL
- G06T11/00—2D [Two Dimensional] image generation
- G06T11/20—Drawing from basic elements, e.g. lines or circles
- G—PHYSICS
- G06—COMPUTING OR CALCULATING; COUNTING
- G06V—IMAGE OR VIDEO RECOGNITION OR UNDERSTANDING
- G06V30/00—Character recognition; Recognising digital ink; Document-oriented image-based pattern recognition
- G06V30/40—Document-oriented image-based pattern recognition
- G06V30/42—Document-oriented image-based pattern recognition based on the type of document
- G06V30/422—Technical drawings; Geographical maps
- G—PHYSICS
- G09—EDUCATION; CRYPTOGRAPHY; DISPLAY; ADVERTISING; SEALS
- G09B—EDUCATIONAL OR DEMONSTRATION APPLIANCES; APPLIANCES FOR TEACHING, OR COMMUNICATING WITH, THE BLIND, DEAF OR MUTE; MODELS; PLANETARIA; GLOBES; MAPS; DIAGRAMS
- G09B29/00—Maps; Plans; Charts; Diagrams, e.g. route diagram
- G09B29/10—Map spot or coordinate position indicators; Map reading aids
Landscapes
- Engineering & Computer Science (AREA)
- Physics & Mathematics (AREA)
- Theoretical Computer Science (AREA)
- General Physics & Mathematics (AREA)
- Remote Sensing (AREA)
- Radar, Positioning & Navigation (AREA)
- Business, Economics & Management (AREA)
- Educational Technology (AREA)
- Educational Administration (AREA)
- Mathematical Physics (AREA)
- Automation & Control Theory (AREA)
- Computer Vision & Pattern Recognition (AREA)
- Artificial Intelligence (AREA)
- Multimedia (AREA)
- Management, Administration, Business Operations System, And Electronic Commerce (AREA)
- Processing Or Creating Images (AREA)
- Instructional Devices (AREA)
- Image Processing (AREA)
Abstract
Description
Translated fromChinese优先权要求priority claim
[0001]本申请要求2003年12月18日提交的美国临时专利申请No.60/530283的优先权,通过引用将其内容结合到本文中。[0001] This application claims priority to U.S. Provisional Patent Application No. 60/530,283, filed December 18, 2003, the contents of which are incorporated herein by reference.
发明领域field of invention
[0002]一般来说,本发明涉及绘图法,更具体来说,涉及城市地区的地图绘制。[0002] The present invention relates generally to cartography and, more particularly, to mapping urban areas.
发明背景Background of the invention
[0003]具体来说,二十世纪在全球经历了城市地区的指数增长,在其下半叶,城市周边的郊区的巨大发展受到高速公路以及以汽车为基础的社会的主导的推动。例如,大多数北美人现在住进具有低建筑密度和人口活动比率的郊区的这种状况一般无法经济地维持公共交通运输。居住、工作、购物和闲暇不仅密度低和高土地消耗,而且活动一般也是隔离和独立的。因此,当前存在对于这种依靠汽车的影响的普遍关注-在空气污染、极大增加的延误方面,在成本、时间和得到工作的困难上降低人们生活质量的不断增加的总旅程方面,以及在其它许多方面。[0003] Specifically, the twentieth century experienced exponential growth of urban areas across the globe, and in its second half, the enormous growth of suburban areas around cities was driven by the dominance of highways and car-based societies. For example, most North Americans now live in suburban areas with low building density and population activity rates, which generally cannot economically sustain public transportation. Living, working, shopping and leisure are not only low density and high land consumption, but the activities are also generally segregated and independent. Thus, there is currently widespread concern about the impact of this reliance on cars - in terms of air pollution, greatly increased delays, in terms of the ever-increasing total journeys that reduce people's quality of life in terms of cost, time and difficulty in getting jobs, and in terms of Many other aspects.
[0004]已经推出一系列政策和实践来处理这种情况,共同发展土地使用和交通运输的形式,从而节省能源,使污染物的散发减至最小,鼓励可达性,同时尽量减少移动性-例如通过在公共运输节点附近发展密集活动中心。全球若干地区致力于把这些目标转换为区域策略发展构架。[0004] A range of policies and practices have been introduced to deal with this situation, co-developing forms of land use and transportation that conserve energy, minimize emission of pollutants, encourage accessibility while minimizing mobility - For example by developing dense activity centers near public transport nodes. Several regions around the world are working to translate these goals into regional strategic development frameworks.
[0005]一般来说,随着全球人口越来越集中在城市地区,任何给定城市地区的生活质量都极大地受到城市地区配备支持本地居民需求的基础设施的良好程度的影响。城市规划是用于规划如何增加、更换和维护这种基础设施的众所周知的学科。城市规划还包含本领域的技术人员会想到的许多其它问题。[0005] In general, as the global population becomes increasingly concentrated in urban areas, the quality of life in any given urban area is greatly influenced by how well equipped the urban area is with the infrastructure to support the needs of the local population. Urban planning is a well-known discipline for planning how to add, replace and maintain such infrastructure. Urban planning also encompasses many other issues that would occur to those skilled in the art.
[0006]至少在发达国家,大部分城市地区实现不同程度的城市规划。此过程往往受到政策因素的极大影响,因为围绕纳税和财产权的问题必定伴随着城市规划过程。最近在北美洲,存在朝“瘦身政府”政策的趋势,其中基于政府的集中城市规划在很大程度上被放弃,有利于允许城市地区以放任主义方式增长,相信自由市场是区域应当如何增长的最佳决定因素。其它管理机构仍然可能实行更激进的政策,包括大量集中规划,观点是政府控制的中央规划是适应当地居民的需求的最有效方式。当然,任何给定地区采用的方式通常处于这些极端之间。不管所选的方式如何,伴随先有技术城市地图绘制和数据采集技术的一个问题在于,极少存在可经过分析而对于如何可以最有效实现城市规划提供客观看法的硬数据。[0006] At least in developed countries, most urban areas achieve varying degrees of urban planning. This process is often heavily influenced by policy factors, as issues around taxation and property rights necessarily accompany the urban planning process. Recently in North America, there has been a trend towards "skinny government" policies, in which centralized government-based urban planning is largely abandoned in favor of allowing urban areas to grow in a laissez-faire manner, believing that free markets are how areas should grow best determinant. Other governing bodies are still likely to pursue more radical policies, including extensive centralized planning, in the view that government-controlled central planning is the most efficient way of adapting to the needs of local populations. Of course, the approach employed in any given region usually falls between these extremes. Regardless of the approach chosen, one problem with prior art urban mapping and data collection techniques is that there is very little hard data that can be analyzed to provide an objective view of how urban planning can most effectively be implemented.
[0007]当今存在的、在某个地区不一致地收集的硬数据表明,更多数据、而且是正确种类的数据在城市规划中可能极为有效。例如,在2003年,大家知道多伦多市有地铁系统,它在很大程度上依靠投币箱来维持,而极少依靠政府津贴。假设造成这种现象的一个主要因素在于,存在地铁站附近生活(“居住区”)的大的人口密度,以及在同样处于地铁站附近、居民工作(“就业区”)的市区中心存在至少一个集中区域。在纽约可观察到类似现象。但是,生成支持这种假设的报告所需的工作是巨大、复杂、费时且昂贵的。作为一种方法,该工作可涉及收集多伦多的街道地图和地铁地图,然后在居住和就业区挨家挨户进行调查以证实人们事实上利用地铁去上班。最后,挨家挨户调查所收集的数据可与地图相关,从而最终得出具有支持该假设的结论的报告。但是,可以注意到,报告仅包含几组数据点,而并没有包括可能影响居住区和就业区的简单密度是否足以支持地铁路线的其它数据。这种报告也没有描述支配密度的建筑环境的结构。此外,这种报告不易于与其它城市地区如何处理从居住区到就业区的交通的情况进行比较,以便提供对于哪个城市地区最好地处理其交通运输需求的客观评估。本领域的技术人员会想到关于特定城市地区如何相对另一个地区进行运作的更复杂问题,并且解答这类问题的报告的生成将面临相似的障碍和复杂度。[0007] The hard data that exists today, collected inconsistently in an area, suggests that more data, and the right kind of data, can be extremely effective in urban planning. For example, in 2003, it was known that the city of Toronto had a subway system that relied heavily on coin boxes and very little on government subsidies. It is hypothesized that a major factor for this phenomenon is the presence of large population densities living near subway stations ("residential areas") and the presence of at least a concentration area. A similar phenomenon can be observed in New York. However, the effort required to generate reports supporting this assumption is large, complex, time-consuming, and expensive. As one approach, the effort could involve collecting street and subway maps of Toronto, and then conducting door-to-door surveys in residential and employment areas to verify that people actually use the subway to get to work. Finally, the data collected from the door-to-door surveys can be correlated with maps, resulting in reports with conclusions supporting the hypothesis. However, it can be noted that the report only includes a few sets of data points and does not include other data that could affect whether the simple density of residential and employment areas is sufficient to support a subway route. Nor does this report describe the structure of the built environment that governs density. Furthermore, such reports are not readily comparable to how other urban areas handle traffic from residential to employment areas in order to provide an objective assessment of which urban area best handles its transportation needs. More complex questions about how a particular urban area is functioning relative to another will occur to those skilled in the art, and the generation of reports answering such questions would face similar obstacles and complexities.
[0008]如前面所述,先有技术的城市地图在生成城市规划实践的上述类型的报告中是极有用的元素。先有技术的城市地图主要标识交通运输路线的物理特征,并且包括那些地图上的类似标识符的街道名称和站名。地图可包括关于特定区域是否更多地以居住、商业或工业活动为主的指示,但仅此而已。一般来说,这类地图对于在城市地区中导航很有用,但在尝试为城市规划生成复杂报告时只提供有限的信息。[0008] As previously stated, prior art city maps are extremely useful elements in generating reports of the type described above for urban planning practices. Prior art city maps primarily identify physical features of transportation routes, and include street names and station names like identifiers on those maps. The map may include an indication as to whether a particular area is dominated by more residential, commercial, or industrial activity, but nothing more. In general, such maps are useful for navigating urban areas, but provide limited information when attempting to generate complex reports for urban planning.
[0009]更新近的先有技术的城市地图提供可用于不只是在城市地区中导航的信息。这些地图至少部分采用从卫星、飞机等获取的遥感数据来生成。Baltsavias、Emmanuel P.和A.Gruen.的“解决方案集中:用于监测城市的航摄照片、LIDAR和IKONOS的比较”(Remotely Sensed Cities,编者:Victor Mesev、Taylor和Francis,London,2003年)(“Baltsavias”)是一个先有技术参考文献,它公开这样一种城市地图的实例。Baltsavias包括使用其中包括航空/数字正射成像、激光探测和测距(“LIDAR”)IKONOS(每像素4米彩色和每像素1米黑白光卫星图)在内的当前高分辨率遥感技术来提取例如下列地球空间信息的审查和评估:[0009] More recent prior art city maps provide information that can be used for more than just navigating in urban areas. These maps are generated at least in part using remote sensing data obtained from satellites, aircraft, and the like. Baltsavias, Emmanuel P. and A. Gruen. "Solution Focus: Comparison of Aerial Photographs, LIDAR and IKONOS for Monitoring Cities" (Remotely Sensed Cities, editors: Victor Mesev, Taylor and Francis, London, 2003) ("Baltsavias") is a prior art reference which discloses an example of such a city map. Baltsavias consist of extraction using current high-resolution remote sensing techniques including aerial/digital ortho-imaging, laser detection and ranging (“LIDAR”) IKONOS (4 meters per pixel color and 1 meter per pixel black and white light satellite imagery) Examples include the review and evaluation of the following geospatial information:
1)数字地形模型(“DTM”,表示消除了自然和人造特征的地球裸露表面的高程模型);1) Digital Terrain Model (“DTM”, meaning an elevation model of the Earth’s bare surface from which natural and man-made features have been removed);
2)数字表面模型(“DSM”,又称作“第一表面”模型,其中,在高程模型中捕捉人造和自然特征);以及2) Digital Surface Models ("DSM", aka "First Surface" models, where man-made and natural features are captured in elevation models); and
3)诸如建筑物、道路、植被等的城市对象的标识,以及诸如建筑物等的三维城市对象的重构。3) Identification of urban objects such as buildings, roads, vegetation, etc., and reconstruction of 3D urban objects such as buildings.
Baltsavias描述了开发三维城市模型的要求,并简述已经开发的两个商业应用,即:InJECT,INPHO GmbH(Stuggard,Germany)的产品,以及CyberCity AG(Bellikon,Switzerland)推出的CyberCityModeler(CC-Modeler)。Baltsavias描述了原型系统、即CyberCity空间信息系统(“CC-SIS”),它是对于把三维城市模型与可能链接到外部地理信息系统(“GIS”)数据的关系数据库相结合的尝试。为了标识对象,用户手动标识屏幕上的点,只有在那时该应用才自动构建包括相关那些点以及标识对象所需的几何结构的拓扑。该应用要求使用数字正射投影像片,以构建城市模型所需的分辨率获取这些像片是昂贵的。此外,Baltsavias没有解释如何取得建筑物的用途或类型以及它与其邻近或者整个城市规模中的其它建筑物的关系。该应用不允许用户评估地区的运作方式或者与其它城市地区进行比较。一般来说,Baltsavias局限于如何提供对城市地区的构成和功能进行描述及可视化。Baltsavias described the requirements for developing 3D city models and briefly described two commercial applications that have been developed, namely: InJECT, a product of INPHO GmbH (Stuggard, Germany), and CyberCityModeler (CC-Modeler ). Baltsavias describes a prototype system, the CyberCity Spatial Information System ("CC-SIS"), which is an attempt to combine a three-dimensional city model with a relational database that may be linked to external geographic information system ("GIS") data. To identify an object, the user manually identifies points on the screen, and only then does the application automatically build a topology including those points associated and the geometry needed to identify the object. The application requires the use of digital orthoprojection photos, which are expensive to acquire at the resolution required to build the city model. Furthermore, Baltsavias does not explain how the purpose or type of the building was obtained and its relationship to other buildings in its neighborhood or on a city-wide scale. The app doesn't allow users to evaluate how the district is doing or compare it to other urban areas. In general, Baltsavias are limited to how they provide descriptions and visualizations of the composition and function of urban areas.
[0010]增加的城市地图复杂性的另一个实例见于Barnsley、Michael J.、A.M.Steel和S.Barr.的“通过分析以LIDAR和多谱图像数据标识的建筑物的空间构成确定城市土地用途”(Remotely SensedCities,编者:Victor Mesev、Taylor&Francis,London,2003年)(“Barnsley”)。Barnsley采用每像素4米彩色卫星图的IKONOS以及每平方米0.4点采样密度的LIDAR(2米)图像数据的组合从其它周围对象、如树木或铺有路面的道路中提取建筑物对象的存在。提取的结果与基本数据进行比较以便保证结果的准确度。采用四个测试区域,其中主要土地用途是住宅或工业。给定数据集的限制,几个门限被施加到数据以改善结果。Barnsley发展了基于图形的模式识别系统,通过高度和结构配置来推断土地用途。在Barnsley中用于半自动提取建筑物对象以及标识建筑物的形态属性的差异和建筑形式模式的结构成分的技术和技巧在区别一般土地使用类型(例如住宅对工业)方面是成功的,但是在识别和表征这些一般土地使用类型中的独特模式时存在问题,给定所使用的测量技术,无法表征不同的住宅和工业模式。一般来说,Barnsley没有讲授如何对不同的住宅和工业用途的独特建筑形式进行分类和描述。[0010] Another example of increasing urban map complexity is found in "Determining Urban Land Use by Analyzing the Spatial Composition of Buildings Identified with LIDAR and Multispectral Imagery Data" by Barnsley, Michael J., A.M. Steel, and S. Barr. (Remotely Sensed Cities, Ed. Victor Mesev, Taylor & Francis, London, 2003) (“Barnsley”). Barnsley used a combination of IKONOS color satellite imagery at 4 meters per pixel and LIDAR (2 meters) imagery data at a sampling density of 0.4 points per square meter to extract the presence of building objects from other surrounding objects such as trees or paved roads. The extracted results are compared with the base data to ensure the accuracy of the results. Four test areas were employed, where the main land use was residential or industrial. Given the limitations of the dataset, several thresholds were applied to the data to improve the results. Barnsley developed graph-based pattern recognition systems to infer land use by height and structural configuration. The techniques and techniques used in Barnsley for the semi-automatic extraction of building objects and the identification of differences in the morphological attributes of buildings and the structural components of building form patterns were successful in distinguishing general land use types (e.g. residential versus industrial), but were less effective in identifying And there are problems in characterizing the unique patterns within these general land use types, given the measurement techniques used, it is not possible to characterize the different residential and industrial patterns. In general, Barnsley does not teach how to classify and describe distinct architectural forms for different residential and industrial uses.
[0011]提供更复杂的城市地图的仍未实现的尝试的一个实例见于Eguchi、Ronald、C.Huyck、B.Houshmand、D.Tralli和M.Shinozuka的“采用合成孔径雷达技术的建筑物详细清单的新应用”(the 2ndMulti-Lateral Workshop on Development of Earthquake and TsunamiDisasters Mitigation Technologies and their Integration for the Asia-Pacific region,2000年3月1-2日,Kobe,Japan)(“Eguchi”)。采用干涉测量合成孔径雷达(IFSAR)航空技术、空中摄影和县税收评定数据,Eguchi尝试根据他们从遥感数据中提取的建筑物占地面积和高度来识别建筑物类型,并采用县税收评定数据来验证结果。Eguchi提供了所使用的技术的初步结果以及未来研究计划,从而打下努力完成他们可从其中测量建筑物密度和发展的整个城市规模的建筑物详细清单的基础。虽然已经打下基础,但是没有成功或者如何取得这种成功的指示。[0011] An example of a still unrealized attempt to provide a more complex city map is found in Eguchi, Ronald, C. Huyck, B. Houshmand, D. Tralli and M. Shinozuka, "Detailed Inventory of Buildings Using Synthetic Aperture Radar Technology" New Applications of Earthquake and Tsunami Disasters Mitigation Technologies and their Integration for the Asia-Pacific region, March 1-2, 2000, Kobe, Japan) (“Eguchi”). Using interferometric synthetic aperture radar (IFSAR) aerial technology, aerial photography, and county tax assessment data, Eguchi attempted to identify building types based on building footprints and heights they extracted from remote sensing data and used county tax assessment data to Validation results. Eguchi provided initial results of the techniques used, as well as plans for future research, laying the groundwork for efforts to complete a detailed city-scale inventory of buildings from which they can measure building density and growth. While the groundwork has been laid, there is no indication of success or how to achieve it.
[0012]另一个实例是Mesev、Victor的“城市土地使用重构:从地址点信息的图像模式识别”(the International Archives ofPhotogrammetry,Remote Sensing and Spatial Information SciencesConference,Regensburg,Germany,2003年6月27-29日)(“Mesev”)。Mesev检查英国陆军测绘局采集的地址点数据的使用,以便检查英国布里斯托尔的发展的空间模式。地址点数据包含关于一般土地使用类型、住宅对商业的信息,以及Mesev尝试根据各种空间索引/技术、即点的密度与最接近邻域分析,来识别相同土地使用类型的不同区域、如住宅#1和住宅#2之间的差异。来自这个空间识别系统的这种信息用于告知城市地区的多谱图像分类。Mesev引入对于称作Cities Revealed的公司(The GeoInformation Group,Telford House,Fulbourn,Cambridge,CB1 5HB,United Kingdom--http://www.crworld.co.uk)提供的高分辨率空中摄影所使用的一些初步结果。对于大城市地区,Cities Revealed的遥感影像的取得相当昂贵。用于模式识别的数据是英国特有的,但不可用于所有地区,因为英国在很大程度上依赖英国陆军测绘局。同样,空间索引对于其它城市土地使用类不是完全成功的,例如对于商业和工业,其中关于建筑物特征的信息将比只是建筑物布局更有用。Another example is Mesev, Victor's "Urban Land Use Reconstruction: From the Image Pattern Recognition of Address Point Information" (the International Archives ofPhotogrammetry, Remote Sensing and Spatial Information Sciences Conference, Regensburg, Germany, June 27-2003 29) (“Mesev”). Mesev examines the use of address point data collected by the British Army Mapping Office in order to examine the spatial patterns of development in Bristol, UK. Address point data contains information about general land use types, residential versus commercial, and Mesev attempts to identify different areas of the same land use type, such as residential The difference between #1 and
发明概述Summary of the invention
[0013]本发明的一个目的是提供一种绘制地图的新颖方法及系统,它消除或者减少先有技术的上述缺点中的至少一个。[0013] It is an object of the present invention to provide a novel method and system for mapping which eliminates or reduces at least one of the above-mentioned disadvantages of the prior art.
[0014]本发明的一个方面提供一种城市地区地图,其中包括:第一组标记,表示所述地区的地貌特征;以及第二组标记,表示位于所述地区内的多个不同类型的建筑形式及其位置。地图还包括第三组标记,表示与所述地貌特征和所述建筑形式关联的人类活动的模式。[0014] One aspect of the present invention provides a map of an urban area including: a first set of markers representing topographical features of the area; and a second set of markers representing a plurality of different types of buildings located within the area form and its location. The map also includes a third set of markers representing patterns of human activity associated with the land features and the built forms.
[0015]本发明的另一个方面提供一种设备,它包括连接到计算机处理器的遥感设备。遥感设备采集有关城市地区的成像数据。计算机处理器解释成像数据以产生城市地区地图,其中包括标识表示地貌特征的第一组标记、表示不同类型的建筑形式的第二组标记以及表示与地貌特征和建筑形式关联的人类活动的模式的第三组标记的表示。地图还可包括第四组标记,表示其它类型的标记中的至少一个出现的强度等级。[0015] Another aspect of the invention provides a device that includes a remote sensing device coupled to a computer processor. Remote sensing equipment collects imaging data about urban areas. A computer processor interprets the imaging data to produce a map of an urban area that includes identifying a first set of markers representing landform features, a second set of markers representing different types of built form, and patterns of human activity associated with the landform features and built form A representation of the third set of tokens. The map may also include a fourth set of markers representing an intensity level of occurrence of at least one of the other types of markers.
附图概述Figure overview
[0016]现在参照某些实施例和附图、仅通过举例来说明本发明,附图包括:The present invention will now be described by way of example only with reference to certain embodiments and accompanying drawings, which include:
图1是包含多个城市地区的地理地域的一部分的表示;Figure 1 is a representation of a portion of a geographic region containing multiple urban areas;
图2是被遥感的图1的地域中的某个城市地区内的区域的表示;Figure 2 is a remotely sensed representation of an area within an urban area in the territory of Figure 1;
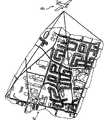
图3是图2中执行的遥感的更详细表示;Figure 3 is a more detailed representation of the remote sensing performed in Figure 2;
图4是图3中执行的遥感的更详细表示;Figure 4 is a more detailed representation of the remote sensing performed in Figure 3;
图5是图2-4中检测的、输入到用于根据本发明的一个实施例生成地图的设备中的数据的表示;Figure 5 is a representation of the data detected in Figures 2-4 that is input into a device for generating a map according to one embodiment of the present invention;
图6是图5的存储装置中存储的数据库的表示,它可用于解释图2-4中检测的原始数据;Figure 6 is a representation of a database stored in the storage device of Figure 5 that can be used to interpret the raw data detected in Figures 2-4;
图7更详细地说明图6的数据库中的对象;Figure 7 illustrates the objects in the database of Figure 6 in more detail;
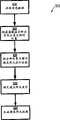
图8是流程图,说明根据本发明的一个实施例生成地图的一种方法;Figure 8 is a flowchart illustrating a method of generating a map according to one embodiment of the present invention;
图9说明表示根据图8的方法的执行被分析的地区内的某个区域的检测数据;Figure 9 illustrates detection data representing an area within the region being analyzed according to the performance of the method of Figure 8;
图10说明图9所示的区域中的一小块;Figure 10 illustrates a small portion of the area shown in Figure 9;
图11说明采用图8的方法生成的图10中的块的地图;Figure 11 illustrates a map of the blocks in Figure 10 generated using the method of Figure 8;
图12说明为了产生不同的地图格式而采用图8的方法的变体生成的图11的地图;FIG. 12 illustrates the map of FIG. 11 generated using a variation of the method of FIG. 8 in order to generate a different map format;
图13说明与图12的地图相同格式的地图,其中,地图表示图9中的区域;Figure 13 illustrates a map in the same format as the map of Figure 12, wherein the map represents the area in Figure 9;
图14说明与图13的地图相同格式、扩展到地区级的地图;Figure 14 illustrates a map in the same format as the map of Figure 13, expanded to the district level;
图15说明根据本发明的另一个实施例用于生成地图的设备;Figure 15 illustrates a device for generating a map according to another embodiment of the present invention;
图16说明由图15的设备生成的图9中的区域的地图,它描述区域中的住宅密度;Figure 16 illustrates a map of the area in Figure 9 generated by the apparatus of Figure 15, which depicts the density of dwellings in the area;
图17表示流程图,说明根据本发明的另一个实施例生成地图的方法;以及Figure 17 shows a flowchart illustrating a method of generating a map according to another embodiment of the present invention; and
图18说明示范图表,它可在执行图17中的方法时产生。FIG. 18 illustrates exemplary graphs that may be generated when the method of FIG. 17 is performed.
本发明的描述Description of the invention
[0017]图1说明包含多个城市地区44的地域40。在图1的实例中,地域40是由美国-加拿大边界大致平分的北美洲的一部分,但要理解,这只是本文的理论可适用的地域的一个实例。因此,地域40中的城市地区44包括各个众所周知的城市地区,其中包括以441表示的多伦多、以442表示的底特律以及以443表示的纽约-其它区域只用参考标号44表示。应当理解,在本实施例中,区域44并不表示其行政意义,而是在地理意义上表明城市地区。因此,例如多伦多441的区域表示大多伦多地区或整个“黄金马蹄”,跨越沿安大略湖的北海岸从汉密尔顿到Bowmanville的市区。类似地,底特律442和纽约443表示其各自的大城市区域。[0017] FIG. 1 illustrates a
[0018]图1还示出两个遥感装置48,即通过地域40上方的飞机481和卫星482。装置48包括成像设备,使装置48能够用于根据诸如空中摄影、航空/数字正射成像、LIDAR、IKONOS、RADAR之类的预期和适当遥感形态来遥感与城市地区44关联的数据。其它类型的装置48及其相应的形态是本领域的技术人员会想到的。FIG. 1 also shows two remote sensing devices 48 , an aircraft 481 and a satellite 482 passing over the
[0019]图2说明针对地区44(即多伦多441)内的特定区域52遥感数据的装置48(即飞机481)。一般来说,装置48可用于检测与特定地区44中的多个区域关联的数据,从而遥感包含整个地区44的数据。因此,要理解,为了说明本发明的各种实施例,作为实例来说明区域52。[0019] FIG. 2 illustrates a device 48 (ie, an aircraft 481 ) for remotely sensing data for a
[0020]图3更详细地说明区域52,以及在本实施例中,区域52由装置48感测为照片。区域52(和/或其部分和/或地区44的其它部分)可按照包括地貌形式、建筑形式、活动模式和使用强度的多个标记及其各个等级来表征。地貌形式包括区域52的自然物理特征,其中包括景观和物理对象,诸如地形、树木、河流和溪流。描述地貌形式的更具体术语方式可见于Anderson、James R.、E.E.Hardy、J.T.Roach和R.E.Witmer 1976年的“与遥感器数据配合使用的土地用途和土地覆盖分类系统”(Geological Survey Professional Paper 964),其内容通过引用结合于本文中。相比之下,建筑形式包括在地貌形式之上人工建造的任何事物,诸如道路、房屋、建筑物、公园、停车场、纪念碑等。(下表I提供可能的建筑形式类型的详细列表。)活动模式包括区域52中发生的人类活动的性质,并且可包括关于就业、居住、娱乐、工业、商业和/或其组合的信息。最后,使用强度是标识特定活动发生的程度或数量的度量。强度还可包括特定活动或者活动混合的程度,以便描述对于分类方案的活动标记的变化范围的可能性。下面将更详细地论述关于这些标记的其它详细情况。[0020] FIG. 3 illustrates
[0021]图4更详细地说明区域52的一小部分,装置48通过其上方并感测以树木561和溪流562的形式的地貌形式56、以及以房屋601、办公大厦602和公寓大楼603的形式的建筑形式60。[0021] FIG. 4 illustrates in more detail a small portion of
[0022]图5说明装置48感测的包括区域52的照片的数据64从装置48传送到设备68、以便根据本发明的一个实施例绘制地图的传送。设备68一般可用于解释数据64,以便至少部分根据上述标记的部分或全部来生成区域52的地图。在本实施例中,设备68为服务器,但也可以是台式计算机、客户机、终端、个人数字助理或其它任何计算装置。设备68包括连接到输出装置76以便向用户提供输出的塔式机72以及用于接收来自用户的输入的一个或多个输入装置80。在本实施例中,输出装置76是监测器,输入装置80包括键盘801和鼠标802。其它输出装置和输入装置是本领域的技术人员会想到的。塔式机72还连接到存储装置84、如硬盘驱动器或廉价磁盘冗余阵列(“RAID”),它包含用于解释数据64的参考数据,下面将提供它的更详细情况。塔式机72通常包含经由总线耦合到随机存取存储器的至少一个中央处理器(“CPU”)。在本实施例中,塔式机72还包括网络接口卡,并连接到根据需要可能是内联网、互联网或者用于互连多个计算机的其它任何类型的网络的网络88。设备68可把设备68生成的地图输出到网络88,和/或设备68除了数据64之外还可接收用于至少部分根据上述标记的部分或全部来生成区域52的地图的数据。[0022] FIG. 5 illustrates the transfer of data 64 sensed by device 48, including a photograph of
[0023]图6说明可存储在存储装置84中以帮助塔式机72中的CPU进行数据64的解释的数据库和表的种类的简化表示。图6中,存储装置84存储二维表92。表92包括由标记为“原始数据”的左栏96和标记为“解释”的右栏100组成的建筑形式数据。因此,表92中的每个记录在左栏96中包含与遥感数据64中可得到的原始数据对应的对象104,以及在右栏100中包含标识对象104的相应解释的对象108。更具体来说,对象1041对应于房屋,对象1042对应于办公大厦,以及对象104n对应于公寓大楼。[0023] FIG. 6 illustrates a simplified representation of the types of databases and tables that may be stored in storage device 84 to assist the CPU in tower 72 in the interpretation of data 64. In FIG. 6 , the storage device 84 stores a two-dimensional table 92 . Table 92 includes architectural form data consisting of a left column 96 labeled "Raw Data" and a
[0024]预计从数据64中得到的原始数据将包含多个人工产物和其它唯一标识符,以及表92将包含有关这类标识符的信息,以便为塔式机72中的CPU提供在区分数据64中包含的各种类型的建筑形式时使用的附加信息。图7更详细地说明对象104,以便提供可与表92中的每个对象关联的标识符的种类的实例。例如,注意到,每个对象104包含阴影112。注意,1122最长,阴影112n比阴影1122更短,以及阴影1121比阴影112n更短。从数据64中得到的这种阴影长度可用来推断给定对象104的高度,因而可帮助塔式机72中的CPU来推断与从数据64中得到的给定对象关联的建筑形式的类型。通过确定数据64中的对象的相对高度,塔式机72中的CPU可进行关于要给予特定对象104的适当解释的相对判定。在这个实例中,阴影112用来确定给定对象的高度,但应当理解,更复杂的方式可用来推断高度-例如通过使用LIDAR。因此,当收集数据64时,可能希望采用感测形态、即摄影和LIDAR的组合,以及组合那种感测数据以便推导关于区域52中的对象的更多信息和标识。[0024] It is expected that the raw data derived from data 64 will contain a number of artifacts and other unique identifiers, and table 92 will contain information about such identifiers in order to provide the CPU in tower 72 with the ability to distinguish between data 64 contains additional information for use with various types of architectural forms. FIG. 7 illustrates objects 104 in greater detail to provide examples of the kinds of identifiers that may be associated with each object in table 92. For example, note that each object 104 contains a shadow 112 . Note that 1122 is longest, shadow 112n is shorter than shadow 1122 , and shadow 1121 is shorter than shadow 112n . Such shadow lengths derived from data 64 can be used to infer the height of a given object 104 and thus assist the CPU in tower machine 72 to infer the type of architectural form associated with a given object derived from data 64 . By determining the relative heights of the objects in the data 64 , the CPU in the tower 72 can make a relative determination as to the appropriate interpretation to be given to a particular object 104 . In this example, shadows 112 are used to determine the height of a given object, but it will be appreciated that more sophisticated ways can be used to infer the height - for example by using LIDAR. Therefore, when collecting data 64 it may be desirable to employ a sensing modality, ie a combination of photography and LIDAR, and combine that sensing data in order to derive more information and identification about objects in
[0025]这时应当理解,各种不同的标识符可用于塔式机72中的CPU执行的计算操作中,以便进一步帮助区别区域52中找到的各种建筑形式。例如,对象104n的每端上两个正方形116的出现表示电梯井的存在,以及对象104n的矩形结合电梯井的存在以及它比对象1042更短的高度可用来确定对象104n是公寓大楼。作为附加实例,对象1041包括其顶部的峰线120,进一步指示对象1041为房屋。[0025] It should be understood at this point that various identifiers may be used in the computing operations performed by the CPU in tower 72 to further assist in distinguishing between the various architectural forms found in
[0026]作为标识符的另一个实例,类似对象1041的数据64中的元素的闭合分组可用于进一步指示这种元素实际上是房屋601。作为标识符的又一个实例,在数据64所包含的给定元素附近所检测的大空地可表示停车场,从而消除了数据64中的给定元素实际上是房屋601的可能性。[0026] As another example of an identifier, a closed grouping of elements in data 64 like object 1041 may be used to further indicate that such element is actually house 601 . As yet another example of an identifier, a large open space detected near a given element contained in data 64 may indicate a parking lot, thereby eliminating the possibility that the given element in data 64 is actually house601 .
[0027]作为附加标识符,在某些地理区域,尤其是在北美洲,存在有限数量的重复建筑形式类型。由于这个有限数量,因此,除了诸如以上列示的标识符(或者例如可能时常被确定为有用的其它标识符)之类的标识符之外,还可采用概率公式表达来提高准确确定特定建筑形式类型的可能性。表I表示可伴随可用于存储装置84中的数据库中的每种类型(例如表92)并与塔式机72中运行的软件结合以便实际区别某些建筑形式类型与其它类型的这类建筑形式类型和标识符的列表。[0027] As an additional identifier, in certain geographic regions, especially in North America, there are a limited number of repeating building form types. Because of this limited number, probabilistic formulations, in addition to identifiers such as those listed above (or other identifiers such as may from time to time be determined to be useful), may be employed to improve the accuracy of determining specific building form type of possibility. Table I represents such building forms that may accompany each type in a database (such as table 92) available in storage device 84 and in conjunction with software running in tower 72 to actually distinguish certain building form types from others. A list of types and identifiers.
表ITable I
建筑形式类型
[0028]因此,一旦塔式机72接收数据64,它可对其执行顺序扫描(或另外的适当分析技术),分析表示区域52的数据64中找到的元素,并把那些所分析元素与表92、具体为原始数据左栏86中的信息进行比较,从而最终识别区域52中的那个特定位置上的建筑形式的类型。更具体来说,一旦数据64经过分析,并且其中的对象经过隔离,塔式机72中的CPU可检测房屋601、办公大厦602和公寓大楼603的存在和位置。一般来说,本领域的技术人员会知道,塔式机72中的CPU执行的任务可基于当前适用于确定地形的类型和为建筑物建模的市场出售的软件中存在的已知技术。例如参见美国陆军工程兵团的http://www.tec.army.mil/TD/tvd/survey/index.html。本领域的技术人员现在会理解,这类已知技术提供操作和软件过程来识别各种地貌形式和建筑形式的存在以及表明其配置,但在其当前形式中,一般不适合执行识别不同类型的建筑形式的任务。(即,在军事环境中,采集这类信息的目的是为了获得战场优势以便侵略或防卫城市地区,而不是为了对该地区的规划改进。)[0028] Thus, once the tower 72 receives the data 64, it may perform a sequential scan (or another suitable analysis technique) on it, analyze the elements found in the data 64 representing the
[0029]现在参照图8,一种用于生成地图的方法一般表示为300。为了帮助说明该方法,假定方法300采用设备68以及与其相关的上述方面来操作。此外,方法300的以下论述产生对设备68的进一步理解。(但是要理解,设备68和/或方法300可以改变,并且不需要完全按照本文所述相互结合进行工作,以及这类变更处于本发明的范围之内。)[0029] Referring now to FIG. 8 , a method for generating a map is indicated generally at 300 . To help illustrate the method, it is assumed that
[0030]首先以步骤310开始,接收城市地区的遥感数据。这个步骤主要按照前面所述来执行,其中的遥感装置48通过给定城市地区44上方,并且随着其成像技术被激活,装置48采集特定地区44的数据、如数据64。数据64则采用适当的网络接口传送给设备68的塔式机72-例如经由无线连接直接从装置48传送,或者通过从装置48移开并插入塔式机72上的读取装置中的物理介质来传送,或者根据需要通过其它任何方式来传送。[0030] First start with
[0031]随后,在步骤320,遥感数据被分析为具有位置坐标的对象。这个步骤可根据分析数据64以提取各个对象并对其分配坐标的任何已知或所需技术来进行,如本领域的技术人员会想到的那样。例如。图9说明数据64中的区域52,它被分为逻辑网格124,其中具有(X,Y)坐标系以及坐标(0,0)上的原点128。图9还说明网格124中突出显示为块132的四个正方形。块132在网络124的坐标(6,2)开始。为了帮助进一步说明方法300,将更详细地论述块132,作为方法300可如何处理数据64的一个实例。[0031] Subsequently, at
[0032]图10更详细地说明数据64的块132。因此,对块132执行步骤320时,对那个块132执行的图像处理产生如图10标记的对象1361、1362、1363...1366的标识。注意,块132中表示对象1361、1362、1363...1366的方式是表示这类对象中的对象1361、1362、1363...1366的外观,作为封装在数据64中的、装置48的原始采集数据。因此,对象1361、1362、1363...1366包含多个人工产物和其它标识符,但对象1361、1362、1363...1366当前以其它方式未标识。这样,还在对块132执行步骤320时,创建列示那些对象及其位置的数据库。表II说明在对块132执行步骤320时创建的位置坐标列表。[0032] FIG. 10 illustrates block 132 of data 64 in more detail. Thus, when
表IITable II
块132中的对象和位置
[0033]仍然参照图8,方法300从步骤320进行到步骤325,这时,在步骤320被分析的对象与一组预计建筑形式进行比较。因此,得到已标识对象1361、1362、1363...1366,然后每一个与装置84中、具体为表92中存储的一组预计建筑形式进行比较。采用表92和上述解释技术(或者可能需要的其它这类解释技术),可得到与各对象136关联的原始数据的解释。在这种比较过程中,将确定对象1361类似对象1042;对象1362类似对象104n;以及对象1363、1364、1365和1366类似对象1041。[0033] Still referring to FIG. 8,
[0034]在步骤330,确定各对象的建筑形式的类型。因此,采用步骤325的比较结果,塔式机72确定在步骤320所标识的对象136中每个的身份,并添加到表II的信息中,从而产生包含那个特定对象的建筑形式类型的、表III的形式的新表。[0034] At
表IIITable III
块132中的各对象的建筑形式类型
[0035]在步骤335,建筑形式地图根据步骤320-330的执行结果来生成。这样,塔式机72采用表III中的信息重新绘制块132。如图11所示,塔式机72因而从块132和表III中产生块132a,并把块132a输出到输出装置76。(应当理解,块132a还可保存在存储装置84中,或者发送给网络88上的另一个计算装置,或者以其它方式输出。)因此,块132a以插图形式表示区域52中的建筑形式,并提供关于块132a中呈现的各图标的建筑形式类型的图例。类似地,塔式机72因此可在显示器76上呈现所有区域52和/或所有地区44。在本实施例中,可以设想提供全程导航工具,以便允许用户使用输入装置80围绕区域52(或地区44)移动,并根据需要放大或缩小。[0035] In
[0036]作为步骤335的补充步骤或者作为步骤335的变体,块132可按照图12所示的形式产生,如块132b所示,其中,由网格124上的一组坐标限定的特定正方形根据那个特定正方形内找到的最普遍类型的建筑物形式来标记。[0036] As a supplementary step to step 335 or as a variant of
[0037]用于生成图12的地图的方法还可适用于生成区域52(以图13中表示为区域52a的形式)和/或整个地区44(以图14中表示为地区441a的形式)的地图。在图13中,区域52已经在输出装置76上呈现为区域52a,并分为四个分区1361、1362、...1364。每个分区136根据那个分区136中主要的建筑形式的类型来加阴影。因此,分区1361表示为主要由办公大厦602组成;分区1362表示为主要由公寓大楼603组成;而分区1363和1364则表示为主要由房屋601组成。要理解,可包括其它建筑形式分区类型,例如办公大厦602和房屋601的混合,在其中,给定分区由不止一个主要建筑形式类型组成。还要理解,用来确定一个分区136开始以及另一个分区结束的位置的标准没有具体限制,而是可基于诸如用户选择、行政区划界、地貌、交通运输路线及其组合之类的任何数量的因素,和/或可基于更“模糊”的逻辑类型,其中塔式机72配置成根据以特定建筑形式类型的突出性为特征的区域52中的正方形的分组来创建分区。应当理解,分区的具体形状没有因此而被限制,这类形状取决于用来定义分区的标准。作为一个实例,在例如多伦多的城市中,Danforth大街呈现沿着称为“希腊城”的区域的公共标记-这个长方形区域可选作特定分区的标准。因此,其中街道呈现公共标记、使得把那个街道定义为分区是需要或合理的任何区域也是如此。还可设想新的地图可根据对于这种标准的用户输入变更迅速被生成。[0037] The method used to generate the map of FIG. 12 may also be adapted to generate region 52 (in the form of region 52a in FIG. 13) and/or the entire area44 (in FIG. )map. In FIG. 13 ,
[0038]现在会理解,在对于整个地区44生成图13所示的类型的地图的情况下,可方便地比较不同地区44之间由主要建筑形式类型及其分布表征的分区的比较。例如,在对于多伦多441创建图14中的类型的地图以及对纽约443创建另一个地图(未示出)的情况下,可对每个相应地区44上的主要建筑形式类型及其分布进行比较。这时还应当理解,图14中的示例地图包括基于表I所示的建筑形式类型的列表的大量建筑形式类型。但是,应当注意,表I中的列表不是穷举的,其它建筑形式是本领域的技术人员现在会想到的。例如,半永久单个独立的活动房屋是表I中未列出的附加建筑形式类型。[0038] It will now be appreciated that where a map of the type shown in FIG. 13 is generated for an entire region 44, comparisons of subregions characterized by major building form types and their distributions between different regions 44 may be conveniently compared. For example, where a map of the type in FIG.14 is created for
[0039]图11-14所示的地图主要针对建筑形式。但是,在本发明的其它实施例中,可生成包含除建筑形式以外的信息的地图。这类地图包括可用来表征特定地区的其它标记,包括地貌形式、活动模式和使用强度。采用现有遥感和绘图技术,地貌形式的添加较为简单。可用作执行地貌形式的这种添加的组成部分的现有商业包的实例包括用于图像处理的ERDAS Imagine(Leica Geosystems GIS & Mapping,LLC,Worldwide Headquarters,2801 Buford Highway,N.E.,Atlanta,GA30329-2137USA)以及PCI.Geomatics(50 West Wilmot Street,RichmondHill,Ontario Canada,L4B 1M5)。来自ESRI ArcGIS(ESRI,380 NewYork Street,Redlands,CA 92373-8100,USA)和Mapinfo(MapInfo,26Wellington Street East,Suite 500,Toronto,ON M5E 1S2)的商业包可用于绘图。[0039] The maps shown in Figures 11-14 are directed primarily at architectural forms. However, in other embodiments of the invention, maps containing information other than architectural forms may be generated. Such maps include other markers that can be used to characterize a particular area, including topographical form, activity patterns, and intensity of use. Addition of topographical forms is relatively simple using existing remote sensing and mapping techniques. Examples of existing commercial packages that can be used as an integral part of implementing this addition of geomorphic forms include ERDAS Imagine for image processing (Leica Geosystems GIS & Mapping, LLC, Worldwide Headquarters, 2801 Buford Highway, N.E., Atlanta, GA 30329- 2137USA) and PCI. Geomatics (50 West Wilmot Street, Richmond Hill, Ontario Canada, L4B 1M5). Commercial packages from ESRI ArcGIS (ESRI, 380 NewYork Street, Redlands, CA 92373-8100, USA) and Mapinfo (MapInfo, 26 Wellington Street East, Suite 500, Toronto, ON M5E 1S2) were available for mapping.
[0040]在前一个实施例中,一定程度的活动模式由于识别建筑形式类型的过程而可推断-即,房屋和公寓表示“居住”的活动,而办公大厦则表示“就业”的活动模式。但是,在其它实施例中,采用与被制图地区对应的地理空间和/或人口统计数据来添加活动模式和/或使用强度。地理空间数据可包括标识地球上的自然或建造特征和边界的地理位置及特征的信息。地理空间数据信息其中还可从遥感、绘图及测量技术中得出。人口统计数据可看作是地理空间数据的子集,并且可包含说明给定地区44中的生活条件的关于出生、死亡、年龄、收入等的统计数据。[0040] In the former embodiment, a certain degree of activity patterns can be inferred due to the process of identifying building form types - ie, houses and apartments represent "living" activities, while office buildings represent "employment" activity patterns. However, in other embodiments, activity patterns and/or usage intensities are added using geospatial and/or demographic data corresponding to the mapped area. Geospatial data may include information identifying the geographic location and characteristics of natural or built features and boundaries on Earth. Geospatial data information, among other things, can also be derived from remote sensing, mapping and surveying techniques. Demographic data may be considered a subset of geospatial data, and may include statistical data about births, deaths, age, income, etc. that describe living conditions in a given area 44 .
[0041]作为上述的一个实例,在图15中,人口统计数据140连同数据64被输入到塔式机72以用于生成增强地图。本文所使用的人口统计数据140的来源可能是多方面的,包括由政府机构采集和保存的数据,例如人口普查数据、纳税数据、土地登记数据、就业情况调查,并且包含由非政府机构采集和保存的数据。因此,人口统计数据140实际上被输入到塔式机72中的方式将取决于它当前存在的形式以及包含对隐私法的适当考虑。因此,当塔式机72接收人口统计数据140和遥感数据64时,塔式机72还将包括相关与被采集人口统计数据140相关的地区44和/或区域52中的物理区域的功能性。(应当注意,为了保密,随时可用的人口普查数据往往聚集到空间单元、例如普查地段或点查区域,而不是按照地址。为了将其与建筑形式类型相关,数据可被分解并与各个建筑物相关。)[0041] As an example of the above, in FIG. 15, demographic data 140 is input to tower machine 72 along with data 64 for generating an enhanced map. Demographic data 140 as used herein may come from a variety of sources, including data collected and maintained by government agencies such as census data, tax tax data, land registry data, employment surveys, and includes data collected and maintained by non-government agencies. saved data. Thus, the manner in which demographic data 140 is actually entered into tower 72 will depend on the form in which it currently exists and include appropriate consideration of privacy laws. Thus, when tower 72 receives demographic data 140 and telemetry data 64 , tower 72 will also include functionality related to the physical area in region 44 and/or
[0042]这样,可用来确定地区44、区域52、块132内的活动模式和/或使用强度或者其中的任何给定建筑形式的人口统计数据140的一个重要来源是人口普查数据。包含地址的人口普查数据可与采用方法300所检测的建筑形式相关。人口普查数据例如可用来确定多少个人居住在图10中标识为对象1363的房屋内。这样,可确定居住在任何分区136内的人口密度。分区136则可按照插图方式表示为居住分区,并且以表明生活在那个分区内的人们的实际密度的方式进行。采用这种数据输出的地图的一个实例如图16所示。分区136a1表示为每平方米有零至十人居住在那个分区136a1。分区136a2表示为每平方米有100人以上居住在那个分区136a2。分区136a3和136a4表示为每平方米有十至一百人居住在那些分区内。这时应当理解,图16中的地图的类型可扩展到地区规模,并且同样容易允许对其生成那种类型的地图的不同地区44之间的比较。(注意,虽然选择了每平方米的人数的单位,但也可采用适当的单位,例如每公顷的人数等。)[0042] Thus, one important source of demographic data 140 that can be used to determine activity patterns and/or intensity of use within a region 44,
[0043]但是,作为附加说明,虽然图16中的地图描述为采用人口统计数据140来生成,但也能够根据来自表I的所确定建筑形式类型来推断占用率的平均水平,并使用那个推断的水平来形成图16的地图。[0043] However, as an additional note, although the map in FIG. 16 is described as being generated using demographic data 140, it is also possible to infer the average level of occupancy from the determined building form types from Table 1, and use that inference to form the map of Figure 16.
[0044]通过相同的标记,其它类型的人口统计数据140可用来确定在图10中标识为对象1361的办公大厦工作的员工数量。创建具体分区的其它类型的活动模式、使用强度和其它标记是本领域的技术人员现在会想到的。但是,下表IV提供活动模式以及用于使用强度的量度的示范列表,以便补充可用于采用本文的理论来生成地图的那些模式。[0044] By the same notation, other types of demographic data 140 may be used to determine the number of employees working in the office building identified as object1361 in FIG. 10 . Other types of activity patterns, usage intensities, and other indicia to create specific partitions will now occur to those skilled in the art. However, Table IV below provides an exemplary list of activity patterns and measures for use intensity to complement those patterns that can be used to generate maps employing the theory herein.
表IVTable IV
活动模式和使用强度
[0045]一般来说,这时应当理解,地区44的地图可采用本文的理论以自动和比较高效的方式来生成。此外,还应当理解,可在地区级生成这类地图以包括多个分区,其中那些分区的每个是根据可用来表征城市地区的一组标记之间的一组趋势或共同性可唯一标识的。地区44的这类分区地图可用于城市规划目的,从而与其它城市地区进行比较,和/或凭其自身来确定如何最佳地在城市地区中增加、更换和/或维护基础设施。分区地图可根据具体城市规划项目或问题来生成。例如,如果要确定特定地区是否能够支持新的地铁线路,则可生成分区地图,它标识居住分区和就业分区,目的是选择这类分区之间的地铁线路的路径,只要这类分区看来具有能够支持新地铁线路的人口。这类分区地图还可用于各种其它规划目的,包括机场、蜂窝电话部署、新高速公路建设、下水道和水处理设施、电力线和供应要求等。用于其它类型的规划目的的其它类型的分区地图是本领域的技术人员现在会想到的。[0045] In general, it should be understood at this point that maps of region 44 can be generated in an automated and relatively efficient manner using the teachings herein. Furthermore, it should also be understood that such maps can be generated at the district level to include multiple subregions, where each of those subdivisions is uniquely identifiable based on a set of trends or commonalities between a set of markers that can be used to characterize urban areas . Such zoning maps of area 44 may be used for urban planning purposes, to compare with other urban areas, and/or on their own to determine how best to add, replace, and/or maintain infrastructure in an urban area. Zoning maps can be generated according to specific urban planning projects or issues. For example, if you want to determine whether a particular area can support a new subway line, you can generate a zoning map that identifies residential and employment zoning for the purpose of routing subway lines between such zoning areas, whenever such zoning appears to have Population able to support the new metro line. Zoning maps of this type can also be used for a variety of other planning purposes, including airports, cell phone deployments, new highway construction, sewer and water treatment facilities, power lines and supply requirements, and more. Other types of zoning maps for other types of planning purposes will now occur to those skilled in the art.
[0046]现在参照图17,一种用于生成地图的方法一般表示为500。方法500可采用设备68以及与其相关的上述方面来操作。大家要理解,设备68和/或方法500可以改变,并且不需要完全按照本文所述相互结合进行工作。在步骤510,接收地理数据。如前面所述,数据可根据卫星图像来接收,或者可作为现有GIS数据来接收。在步骤515,分析所接收数据。数据采用与在要生成的最终地图中呈现的预期类型的标记对应的任何技术来分析。分析数据的一种方式如前面对于方法300所述,但是,可采用任何类型的处理技术,其中包括已知的图像处理和GIS处理技术。随后,在步骤520,标记被产生并与在步骤510接收的地理数据的地区中它们相应的地理空间位置关联。可产生任何类型的标记或多个标记或者其组合,其中包括建筑形式、活动模式、使用强度等。在步骤525,在步骤510接收的地理数据的地区中的分区边界采用任何预期标准、如前面所述的标准来定义。在步骤530,在步骤520产生的标记被汇总并重叠到所定义分区边界上,以便生成根据特定选择的标记集合标识的分区所组成的地区的地图。[0046] Referring now to FIG. 17, a method for generating a map is indicated generally at 500. Method 500 is operable employing
[0047]要重申的是,用来定义分区的标准或其它方式没有具体限制。例如,表V-VII表示可对于区域52上称作“分区1”的示范分区由设备68产生和/或由方法500产生的测量结果的一个实例。分区“1”例如可出现在地图中,例如图14所示的类型。表V涉及地貌的强度测量;表VI涉及建筑形式的强度测量;而表VII则涉及活动的强度测量。与相应表中的各字段关联的值反映强度等级,以百分比表示。[0047] To reiterate, there is no specific limitation on the criteria or other means used to define the partitions. For example, Tables V-VII represent one example of measurements that may be generated by
表VTable V
分区“1”的地貌和强度
表VITable VI
分区“1”的建筑形式和强度
表VIITable VII
分区“1”的活动和强度
[0048]由设备68制成表格时,表V-VII中收集的数据可产生图18所示的类型的图表,它被表征为类型“A”的分区。分区“1”作为类型“A”的这种表征可基于标记的每个类型/类别及关联强度的某些门限百分比。这类门限值的一个实例如表VIII所示。[0048] When tabulated by
表VIIITable VIII
类型“A”的分区的门限值
[0049]因此,采用类型“A”的分区(和/或多个不同的分区类型)的门限值,可生成不同城市地区的地图,从而定位存在公共的类型“A”的分区的位置。用于获取标识分区的地图的其它用途是本领域的技术人员现在会想到的。通过相同的标记,本领域的技术人员现在会想到,可使用不同类型的标记的任何数量和组合。此外,虽然表V-VIII都表示强度的百分比,但还应当理解,这些表只能查找特定类型的标记是否存在。[0049] Thus, using threshold values for type "A" subdivisions (and/or multiple different subdivision types), maps of different urban areas can be generated to locate locations where common type "A" subdivisions exist. Other uses for obtaining a map identifying subregions will now occur to those skilled in the art. By the same label, it will now occur to those skilled in the art that any number and combination of different types of labels may be used. Furthermore, while Tables V-VIII all represent percentages of intensity, it should also be understood that these tables can only look for the presence or absence of specific types of markers.
[0050]虽然本文只论述了本发明的各种特征和组件的特定组合,但本领域的技术人员非常清楚,可根据需要采用所公开的特征和组件的预期子集和/或这些特征和组件的备选组合。例如,可采用遥感数据的其它方式-例如通过互联网进行的电子调查,其中包含向拥有被调查地区内的特定建筑物的各个订户分发调查。[0050] Although only particular combinations of the various features and components of the present invention have been discussed herein, it will be apparent to those skilled in the art that a contemplated subset of the disclosed features and components and/or such features and components can be employed as desired alternative combinations. For example, other means of remote sensing data may be employed - such as electronic surveys conducted over the Internet, which involve distributing the survey to individual subscribers owning particular buildings within the surveyed area.
[0051]本领域的技术人员现在应当十分清楚,本发明提供新颖的地理信息系统(“GIS”)。还要理解,方法300仅仅是解释遥感数据以生成图11、图12、图13、图14和图16中的地图的类型及其变体和/或组合的一种特定方式,可根据需要采用其它方法。例如,另一种方式是首先使用地理空间数据把遥感数据中的区域分割或分析为呈现相似特性的“可管理”单元。随后,通过采用现成的GIS对于整个地区分析那个变量,普查地段位于具有高人口密度的地区中。然后,如果假定高人口密度是高建筑形式密度、例如高层建筑或板式公寓的结果,则那些相同普查地段的RS数据可被隔离和检查。得出的建筑形式则可采用其它影像数据(例如空中摄影)来检验,并采用表征特定建筑形式、即高层建筑或板式公寓的量度来呈现。在这种情况中,地理空间数据向遥感数据提供信息,并且可用在关于建筑形式的特征的假设中。一般来说,可得到并用于推断建筑形式的任何地理空间特征和表格数据可用于本发明的其它实施例中。[0051] It should now be apparent to those skilled in the art that the present invention provides a novel geographic information system ("GIS"). It is also to be understood that
[0052]此外,虽然图13和图14的建筑形式地图是可采用本发明产生的一种类型的输出,但现在还应当理解,所确定的建筑形式也可用于推断某些活动和/或其强度和/或用来产生地区44的其它类型分区地图的其它标记。[0052] Furthermore, while the built form maps of FIGS. 13 and 14 are one type of output that can be generated using the present invention, it should now also be understood that the determined built form can also be used to infer certain activities and/or their Intensity and/or other markers used to generate other types of zonal maps for region 44.
[0053]在本发明的另一个实施例中,图11、图12、图13、图14和图16所示类型的地图以及表示了其它标记的其它地图可在给定时间周期被生成,然后向观看者“重放”,以便显示特定地区或其部分随时间变化的动画。[0053] In another embodiment of the invention, maps of the type shown in Figures 11, 12, 13, 14, and 16, as well as other maps representing other markers, may be generated for a given period of time, and then "Replay" to the viewer so that an animation of a particular region or part of it changes over time.
[0054]本发明的另一个特定实施例是用于创建多个地区44的分区的测量结果的标准化,使得可便于在不同地区44之间进行比较。用于标识任何特定分区的测量结果可基于地貌、建筑形式、活动模型等等和/或其强度和/或组合的标记中任何一个或多个,结合特定地区的面积、体积或其它地理量度。例如,测量结果可包括给定区域的一种类型的活动模式与另一种类型的活动模式的比率。[0054] Another particular embodiment of the invention is the standardization of measurements used to create partitions of multiple regions 44 so that comparisons between different regions 44 can be facilitated. The measurements used to identify any particular subregion may be based on any one or more of topography, built form, activity model, etc., and/or signatures of strength and/or combinations thereof, in combination with area, volume, or other geographic measures of a particular region. For example, measurements may include a ratio of one type of activity pattern to another type of activity pattern for a given area.
[0055]本文的理论可具有广泛的应用,特别是用于城市规划和商业应用。例如:[0055] The theory herein may have wide application, especially for urban planning and business applications. For example:
1.可提供与不同地区关联的标记的标准化地图。在提供了解时,它们对于城市专家以及对于公众可能有用。1. A standardized map of markers associated with different regions may be provided. They may be useful to urban specialists as well as to the general public in providing insight.
2.这些地区之间的比较由于创建这类地图的标准化方式而能够方便地执行。2. Comparisons between these regions can be easily performed due to the standardized way in which such maps are created.
3.特定地区的增长模式可通过定期标识新分区的范围和分类以及所建立区域中的变化(关于建筑形式、活动和强度)来识别。3. Growth patterns in specific areas can be identified through the regular identification of the extent and classification of new subdivisions and changes (regarding built form, activity and intensity) in established areas.
4.可对于城市地区进行策略投资决策-在办公、零售或住宅开发中,或者在土地或对于房屋或其它建筑形式购买中。4. Strategic investment decisions can be made for urban areas - in office, retail or residential developments, or in land or for housing or other building form purchases.
5.测量发展的总密度以及净密度,特别是对于测量新的发展。5. Measure the gross density of the development as well as the net density, especially for measuring new developments.
6.可执行城市强化的地区上的机会的标识。例如,通过标识地铁或轻轨站附近的闲置地或者未充分利用的土地。6. Identification of opportunities in areas where urban enhancement can be performed. For example, by identifying vacant or underutilized land near subway or light rail stations.
7.作为评估基础设施的新投资(例如铁路线)或分区投资(例如“大盒子”零售中心)的效果的方式。7. As a way of assessing the effect of new investments in infrastructure (eg rail lines) or zoning investments (eg "big box" retail centres).
8.在城市地区级,本文的实施例可用作建设基础设施投资(公共交通、道路、下水道、供水等)的一致、综合且充分有益的地区增长规划以及建筑物和活动的部署的必要伴随策略的基础和工具。这种了解的重要性的一个实例在于,美国政府最近开始要求所有城市地区,如果它们为了都市交通运输目的而接收来自公路基金的分配,则它们具有促进对公共交通运输的增强依赖性的地区策略。这要求地区取得对其组成分区、活动和运动模式以及当前和预计强度的区域性了解。因此,本文的理论可结合到用于执行实际城市规划的广义方法中,并且作为用于计算政府许可分配的公式的组成部分。8. At the urban district level, the embodiments herein can be used as a necessary accompaniment to consistent, comprehensive and sufficiently beneficial district growth planning and deployment of buildings and activities for building infrastructure investments (public transport, roads, sewers, water, etc.) Fundamentals and tools of strategy. An example of the importance of this understanding is that the U.S. government recently began requiring all urban areas that have regional strategies that promote increased reliance on public transportation if they receive allocations from the Highway Fund for urban transportation purposes . This requires regions to gain a regional understanding of their constituent subdivisions, activity and movement patterns, and current and projected intensities. Therefore, the theory in this paper can be incorporated into a generalized approach for implementing practical urban planning and as an integral part of the formula used to calculate the allocation of government permits.
[0056]本发明提供一种用于绘制地图的新颖系统及方法。根据本文的理论生成的地图提供在地区规模上了解建筑形式和活动及其强度的现有模式和趋势以及通信模式的构架。在这些方面,由于城市地区极大地变化,因此,先有技术不允许不同城市地区的方便比较。例如,Ranstadt地区(由阿姆斯特丹、鹿特丹、海牙及其它城市组成)是多核的。伦敦地区是高度集中的。珠江三角洲(可能是世界上最大的城市地区)趋向于高度混合活动的基础,具有若干高度紧凑和密集节点(香港、深圳、广州、珠海)。同样,多伦多具有非常紧凑的中心和低密度周边郊区,看来处于具有极低密度远郊外延和中心城市强化的大波动的增强过程中的模式。实际上与所有北美洲城市地区所具有的一样,在过去四十年中,多伦多经历了郊区办公空间的激增,其大部分位于沿主要公路和免费高速公路的大量小和中等低密度群。在北美城市地区,这种办公发展现在或多或少构成区域办公空间的一半。本发明提供一种用于生成地图以便了解上述条件和模式的新颖系统及方法。可提供采用本文的理论生成的地图,它允许不同地区之间的一致、综合、有效和/或低成本的便捷比较。采用先有绘图技术,这在城市地区中一般是不可能的,也不可能提供为土地使用/交通政策和程序公式提供便捷且适当的基础的信息等级。[0056] The present invention provides a novel system and method for mapping. Maps generated from the theory in this paper provide a framework for understanding existing patterns and trends in built form and activity and their intensity, as well as communication patterns, at a regional scale. In these respects, the prior art does not allow easy comparison of different urban areas since urban areas vary greatly. For example, the Ranstadt region (consisting of Amsterdam, Rotterdam, The Hague, and other cities) is multicore. The London area is highly concentrated. The Pearl River Delta (possibly the largest urban region in the world) tends to be a highly mixed-activity base with several highly compact and dense nodes (Hong Kong, Shenzhen, Guangzhou, Zhuhai). Likewise, Toronto, with its very compact center and low-density surrounding suburbs, appears to be in a pattern of intensification with very low-density outer suburban outreach and large fluctuations of central city intensification. As with virtually all North American urban areas, Toronto has experienced a proliferation of suburban office space over the past forty years, much of it located in numerous small and moderately low-density clusters along major highways and freeways. In North American urban areas, such office developments now make up more or less half of regional office space. The present invention provides a novel system and method for generating maps to understand the conditions and patterns described above. A map generated using the theory herein may be provided that allows for consistent, comprehensive, efficient and/or low-cost easy comparisons between different regions. With prior mapping techniques, this is generally not possible in urban areas, nor is it possible to provide a level of information that provides a convenient and appropriate basis for formulating land use/transportation policies and procedures.
[0057]本发明的上述实施例用作本发明的实例,本领域的技术人员可对其进行变更和修改,而没有背离仅由所附权利要求定义的本发明的范围。[0057] The above-described embodiments of the present invention serve as examples of the present invention, and variations and modifications may be made thereto by those skilled in the art without departing from the scope of the present invention, which is defined only by the appended claims.
Claims (16)
Translated fromChineseApplications Claiming Priority (3)
| Application Number | Priority Date | Filing Date | Title |
|---|---|---|---|
| US53028303P | 2003-12-18 | 2003-12-18 | |
| US60/530,283 | 2003-12-18 | ||
| PCT/CA2004/002143WO2005059867A1 (en) | 2003-12-18 | 2004-12-16 | System, apparatus and method for mapping |
Related Child Applications (1)
| Application Number | Title | Priority Date | Filing Date |
|---|---|---|---|
| CN2011100890902ADivisionCN102169650B (en) | 2003-12-18 | 2004-12-16 | System, apparatus and method for mapping |
Publications (2)
| Publication Number | Publication Date |
|---|---|
| CN1795478Atrue CN1795478A (en) | 2006-06-28 |
| CN1795478B CN1795478B (en) | 2011-07-06 |
Family
ID=34700119
Family Applications (2)
| Application Number | Title | Priority Date | Filing Date |
|---|---|---|---|
| CN2004800146718AExpired - Fee RelatedCN1795478B (en) | 2003-12-18 | 2004-12-16 | System, device and method for drawing a map |
| CN2011100890902AExpired - Fee RelatedCN102169650B (en) | 2003-12-18 | 2004-12-16 | System, apparatus and method for mapping |
Family Applications After (1)
| Application Number | Title | Priority Date | Filing Date |
|---|---|---|---|
| CN2011100890902AExpired - Fee RelatedCN102169650B (en) | 2003-12-18 | 2004-12-16 | System, apparatus and method for mapping |
Country Status (6)
| Country | Link |
|---|---|
| US (6) | US7856312B2 (en) |
| EP (2) | EP2381434A1 (en) |
| CN (2) | CN1795478B (en) |
| AU (1) | AU2004298635B2 (en) |
| CA (2) | CA2627989C (en) |
| WO (1) | WO2005059867A1 (en) |
Cited By (6)
| Publication number | Priority date | Publication date | Assignee | Title |
|---|---|---|---|---|
| CN102521598A (en)* | 2011-12-16 | 2012-06-27 | 北京市城市规划设计研究院 | Identification method based on remote-sensing image |
| CN101447091B (en)* | 2006-12-04 | 2013-09-25 | Arm挪威股份有限公司 | Method and apparatus for processing graphics |
| CN107967109A (en)* | 2012-08-10 | 2018-04-27 | 微软技术许可有限责任公司 | 3D data environment navigational tools |
| CN110832349A (en)* | 2017-05-15 | 2020-02-21 | 奥斯特公司 | Augmenting panoramic LIDAR results with color |
| CN112131323A (en)* | 2019-06-25 | 2020-12-25 | 上海擎感智能科技有限公司 | Map display method and device |
| CN115033655A (en)* | 2022-08-09 | 2022-09-09 | 清华大学 | Urban and rural system map generation method and device, electronic equipment and readable storage medium |
Families Citing this family (76)
| Publication number | Priority date | Publication date | Assignee | Title |
|---|---|---|---|---|
| US7773985B2 (en)* | 2003-09-22 | 2010-08-10 | United Parcel Service Of America, Inc. | Symbiotic system for testing electromagnetic signal coverage in areas near transport routes |
| CN1795478B (en)* | 2003-12-18 | 2011-07-06 | 1626628安大略有限公司 | System, device and method for drawing a map |
| US7359555B2 (en)* | 2004-10-08 | 2008-04-15 | Mitsubishi Electric Research Laboratories, Inc. | Detecting roads in aerial images using feature-based classifiers |
| US7536025B2 (en)* | 2005-06-23 | 2009-05-19 | Folchetti John E | Process, system, or method for the determination of the percentage of area of a parcel of land available for development or preservation and the production of a report and map therefor on a fixed tangible medium |
| WO2007124512A2 (en)* | 2006-04-25 | 2007-11-01 | Google, Inc. | Registration of geographic objects at a geographic information system for publication |
| US8570278B2 (en) | 2006-10-26 | 2013-10-29 | Apple Inc. | Portable multifunction device, method, and graphical user interface for adjusting an insertion point marker |
| US7856605B2 (en) | 2006-10-26 | 2010-12-21 | Apple Inc. | Method, system, and graphical user interface for positioning an insertion marker in a touch screen display |
| CN101187982B (en)* | 2006-11-17 | 2011-08-24 | 东软集团股份有限公司 | A method and device from sectioning objects from an image |
| US8745041B1 (en) | 2006-12-12 | 2014-06-03 | Google Inc. | Ranking of geographic information |
| CN101617197B (en)* | 2007-02-16 | 2011-06-22 | 三菱电机株式会社 | Measuring device, measuring method and ground feature recognition device |
| FR2920243B1 (en)* | 2007-08-21 | 2009-10-30 | Airbus France Sas | METHODS AND DEVICES FOR REAL-TIME GENERATION OF MAPPING FUNDS |
| WO2009046351A1 (en)* | 2007-10-05 | 2009-04-09 | Autodesk, Inc. | Viewport overlays to expose alternate data representations |
| US8825387B2 (en) | 2008-07-25 | 2014-09-02 | Navteq B.V. | Positioning open area maps |
| US8099237B2 (en) | 2008-07-25 | 2012-01-17 | Navteq North America, Llc | Open area maps |
| US8374780B2 (en) | 2008-07-25 | 2013-02-12 | Navteq B.V. | Open area maps with restriction content |
| US8417446B2 (en)* | 2008-07-25 | 2013-04-09 | Navteq B.V. | Link-node maps based on open area maps |
| US8229176B2 (en) | 2008-07-25 | 2012-07-24 | Navteq B.V. | End user image open area maps |
| US8339417B2 (en)* | 2008-07-25 | 2012-12-25 | Navteq B.V. | Open area maps based on vector graphics format images |
| US20100177095A1 (en)* | 2009-01-14 | 2010-07-15 | Harris Corporation | Geospatial modeling system for reducing shadows and other obscuration artifacts and related methods |
| US20100182316A1 (en)* | 2009-01-22 | 2010-07-22 | Harris Corporation | Geospatial modeling system for 3d clutter data and related methods |
| US9875013B2 (en) | 2009-03-16 | 2018-01-23 | Apple Inc. | Methods and graphical user interfaces for editing on a multifunction device with a touch screen display |
| US8306941B2 (en)* | 2009-03-24 | 2012-11-06 | Weyerhaeuser Nr Company | System and method for identifying trees using LiDAR tree models |
| KR20110085728A (en)* | 2010-01-21 | 2011-07-27 | 삼성전자주식회사 | Apparatus and method for recognizing building area in portable terminal |
| US8692827B1 (en)* | 2011-01-24 | 2014-04-08 | Google Inc. | Carving buildings from a three-dimensional model, and applications thereof |
| US8677232B2 (en) | 2011-05-31 | 2014-03-18 | Apple Inc. | Devices, methods, and graphical user interfaces for document manipulation |
| CN102494673B (en)* | 2011-11-15 | 2013-08-14 | 中测新图(北京)遥感技术有限责任公司 | Aerial photography partitioning method |
| CN103137007B (en)* | 2011-11-22 | 2015-08-26 | 易图科技股份有限公司 | Thematic Map Generation System and Method |
| US9002114B2 (en)* | 2011-12-08 | 2015-04-07 | The Nielsen Company (Us), Llc | Methods, apparatus, and articles of manufacture to measure geographical features using an image of a geographical location |
| US9228846B2 (en)* | 2012-01-18 | 2016-01-05 | International Business Machines Corporation | Generating routes |
| US9501700B2 (en) | 2012-02-15 | 2016-11-22 | Xactware Solutions, Inc. | System and method for construction estimation using aerial images |
| US20140164264A1 (en)* | 2012-02-29 | 2014-06-12 | CityScan, Inc. | System and method for identifying and learning actionable opportunities enabled by technology for urban services |
| US9141113B1 (en) | 2012-04-26 | 2015-09-22 | The United States Of America As Represented By The Administrator Of The National Aeronautics And Space Administration | Probabilistic surface characterization for safe landing hazard detection and avoidance (HDA) |
| US9378509B2 (en) | 2012-05-09 | 2016-06-28 | The Nielsen Company (Us), Llc | Methods, apparatus, and articles of manufacture to measure geographical features using an image of a geographical location |
| US10115165B2 (en)* | 2012-08-22 | 2018-10-30 | University Of Alaska Fairbanks | Management of tax information based on topographical information |
| EP2936155B1 (en) | 2012-12-20 | 2018-12-12 | Roche Diabetes Care GmbH | Method for analyzing a sample of a body fluid |
| US8948927B1 (en)* | 2012-12-27 | 2015-02-03 | Google Inc. | Methods and systems for determining a distribution of balloons based on population densities |
| US8958603B2 (en)* | 2013-01-25 | 2015-02-17 | Regents Of The University Of Minnesota | Automated mapping of land cover using sequences of aerial imagery |
| US9082014B2 (en) | 2013-03-14 | 2015-07-14 | The Nielsen Company (Us), Llc | Methods and apparatus to estimate demography based on aerial images |
| US10248700B2 (en) | 2013-03-15 | 2019-04-02 | Remote Sensing Metrics, Llc | System and methods for efficient selection and use of content |
| US9542627B2 (en) | 2013-03-15 | 2017-01-10 | Remote Sensing Metrics, Llc | System and methods for generating quality, verified, and synthesized information |
| CN103177338B (en)* | 2013-03-19 | 2016-02-10 | 东南大学 | A Spatial Partitioning Method Oriented to Urban Partitioning Planning |
| EP3028464B1 (en) | 2013-08-02 | 2019-05-01 | Xactware Solutions Inc. | System and method for detecting features in aerial images using disparity mapping and segmentation techniques |
| EP2846289A1 (en)* | 2013-09-05 | 2015-03-11 | Universita'del Salento | Method for the evaluation of land conservation |
| US9396584B2 (en)* | 2013-12-19 | 2016-07-19 | Google Inc. | Obtaining geographic-location related information based on shadow characteristics |
| US9824276B2 (en)* | 2014-04-15 | 2017-11-21 | Open Range Consulting | System and method for assessing rangeland |
| US9589334B2 (en)* | 2014-05-08 | 2017-03-07 | Digitalglobe, Inc. | Automated tonal balancing |
| US9824489B2 (en) | 2014-11-05 | 2017-11-21 | Umm Al-Qura University | Grading and monitoring of a geographical region |
| CN104484677A (en)* | 2014-12-31 | 2015-04-01 | 贵州东方世纪科技股份有限公司 | Method for analyzing demographic data information by means of satellite images |
| US10474978B2 (en)* | 2015-04-28 | 2019-11-12 | Adp, Llc | Systems and methods for commute analysis and modeling |
| US10885097B2 (en) | 2015-09-25 | 2021-01-05 | The Nielsen Company (Us), Llc | Methods and apparatus to profile geographic areas of interest |
| US10817796B2 (en) | 2016-03-07 | 2020-10-27 | D-Wave Systems Inc. | Systems and methods for machine learning |
| CN106096295B (en)* | 2016-06-17 | 2018-06-22 | 东南大学 | A kind of urban land limit for height based on probability reference determines method |
| CN106096296A (en)* | 2016-06-17 | 2016-11-09 | 东南大学 | Urban land limit for height based on probability reference determines method |
| US10325349B2 (en)* | 2017-08-11 | 2019-06-18 | Intermap Technologies Inc. | Method and apparatus for enhancing 3D model resolution |
| US10535119B2 (en) | 2017-08-11 | 2020-01-14 | Intermap Technologies Inc. | Method and apparatus for enhancing 3D model resolution |
| CN107689083B (en)* | 2017-09-01 | 2020-09-15 | 武大吉奥信息技术有限公司 | Self-adaptive geometric surface information labeling method and device for geographic information system |
| US11062166B2 (en) | 2017-12-08 | 2021-07-13 | Geomni, Inc. | Computer vision systems and methods for geospatial property feature detection and extraction from digital images |
| US11586915B2 (en) | 2017-12-14 | 2023-02-21 | D-Wave Systems Inc. | Systems and methods for collaborative filtering with variational autoencoders |
| CN108596937A (en)* | 2018-04-28 | 2018-09-28 | 四川大学 | field boundary detection method and device |
| CN109284343B (en)* | 2018-07-25 | 2021-06-29 | 中国地震局地球物理研究所 | Building map construction method and platform for disaster insurance |
| EP3856571A4 (en) | 2018-09-25 | 2022-08-31 | Geomni, Inc. | Computer vision systems and methods for ground surface condition detection and extraction from digital images |
| CN109766400A (en)* | 2019-01-14 | 2019-05-17 | 北京天下图数据技术有限公司 | Plot labeling method and device, block identifying method and device |
| US11900264B2 (en) | 2019-02-08 | 2024-02-13 | D-Wave Systems Inc. | Systems and methods for hybrid quantum-classical computing |
| US11625612B2 (en)* | 2019-02-12 | 2023-04-11 | D-Wave Systems Inc. | Systems and methods for domain adaptation |
| US11009352B2 (en) | 2019-03-12 | 2021-05-18 | Nathan Mullennex | Water line mapping assembly |
| US11532093B2 (en) | 2019-10-10 | 2022-12-20 | Intermap Technologies, Inc. | First floor height estimation from optical images |
| US11094113B2 (en) | 2019-12-04 | 2021-08-17 | Geomni, Inc. | Systems and methods for modeling structures using point clouds derived from stereoscopic image pairs |
| US20210201186A1 (en)* | 2019-12-27 | 2021-07-01 | Paypal, Inc. | Utilizing Machine Learning to Predict Information Corresponding to Merchant Offline Presence |
| CN111340908B (en)* | 2020-02-10 | 2023-07-25 | 兰州交通大学 | Rail electronic map generation method |
| CN111401302B (en)* | 2020-04-07 | 2022-08-02 | 中国人民解放军海军航空大学 | Remote sensing image ship target integrated detection and fine-grained identification method |
| US11551366B2 (en) | 2021-03-05 | 2023-01-10 | Intermap Technologies, Inc. | System and methods for correcting terrain elevations under forest canopy |
| CN113483749B (en)* | 2021-07-06 | 2024-06-18 | 京东城市(北京)数字科技有限公司 | Road network construction method and device, navigation equipment and robot |
| CN113761622B (en)* | 2021-08-27 | 2022-08-19 | 广州市城市规划勘测设计研究院 | Parameterized city modeling method and device, storage medium and terminal equipment |
| US12056888B2 (en) | 2021-09-07 | 2024-08-06 | Intermap Technologies, Inc. | Methods and apparatuses for calculating building heights from mono imagery |
| US20230296365A1 (en) | 2022-03-15 | 2023-09-21 | Metal-Era, Llc | System of measuring objects in an environment |
| CN114741461B (en)* | 2022-03-21 | 2024-08-09 | 西安飞蜂智能科技有限公司 | Rural sewage clearing cost calculation method and system based on topology network |
Family Cites Families (14)
| Publication number | Priority date | Publication date | Assignee | Title |
|---|---|---|---|---|
| IE910580A1 (en)* | 1991-02-20 | 1992-08-26 | Shobunsha Publications Inc | Improved map production method |
| US5781146A (en)* | 1996-03-11 | 1998-07-14 | Imaging Accessories, Inc. | Automatic horizontal and vertical scanning radar with terrain display |
| US5978723A (en)* | 1996-11-22 | 1999-11-02 | Case Corporation | Automatic identification of field boundaries in a site-specific farming system |
| US5995894A (en)* | 1997-05-27 | 1999-11-30 | Case Corporation | System for analyzing spatially-variable harvest data by pass |
| WO2001071485A1 (en)* | 2000-03-17 | 2001-09-27 | Vicinity Corp. | System and method for abstracting and visualizing a route map |
| US7164883B2 (en)* | 2001-02-14 | 2007-01-16 | Motorola. Inc. | Method and system for modeling and managing terrain, buildings, and infrastructure |
| US7212670B1 (en)* | 2002-05-03 | 2007-05-01 | Imagetree Corp. | Method of feature identification and analysis |
| CN1795478B (en)* | 2003-12-18 | 2011-07-06 | 1626628安大略有限公司 | System, device and method for drawing a map |
| CA2559726C (en)* | 2004-03-24 | 2015-10-20 | A9.Com, Inc. | System and method for displaying images in an online directory |
| US7643936B1 (en)* | 2004-11-19 | 2010-01-05 | Sprint Spectrum L.P. | Method and system for automatic analysis and management of drive test routes |
| US7466244B2 (en)* | 2005-04-21 | 2008-12-16 | Microsoft Corporation | Virtual earth rooftop overlay and bounding |
| US8103445B2 (en)* | 2005-04-21 | 2012-01-24 | Microsoft Corporation | Dynamic map rendering as a function of a user parameter |
| US20060241859A1 (en)* | 2005-04-21 | 2006-10-26 | Microsoft Corporation | Virtual earth real-time advertising |
| US7970642B2 (en)* | 2005-12-27 | 2011-06-28 | Alex Anas | Computer based system to generate data for implementing regional and metropolitan economic, land use and transportation planning |
- 2004
- 2004-12-16CNCN2004800146718Apatent/CN1795478B/ennot_activeExpired - Fee Related
- 2004-12-16EPEP11165997Apatent/EP2381434A1/ennot_activeCeased
- 2004-12-16EPEP04802318Apatent/EP1614087A4/ennot_activeCeased
- 2004-12-16CACA2627989Apatent/CA2627989C/ennot_activeExpired - Fee Related
- 2004-12-16CACA002510110Apatent/CA2510110C/ennot_activeExpired - Fee Related
- 2004-12-16WOPCT/CA2004/002143patent/WO2005059867A1/ennot_activeApplication Discontinuation
- 2004-12-16AUAU2004298635Apatent/AU2004298635B2/ennot_activeCeased
- 2004-12-16CNCN2011100890902Apatent/CN102169650B/ennot_activeExpired - Fee Related
- 2005
- 2005-10-25USUS11/257,047patent/US7856312B2/ennot_activeExpired - Fee Related
- 2010
- 2010-11-12USUS12/944,905patent/US7979205B2/ennot_activeExpired - Fee Related
- 2011
- 2011-06-06USUS13/154,017patent/US8346471B2/ennot_activeExpired - Fee Related
- 2012
- 2012-12-04USUS13/693,103patent/US8606518B2/ennot_activeExpired - Fee Related
- 2013
- 2013-11-20USUS14/084,795patent/US9292741B2/ennot_activeExpired - Fee Related
- 2015
- 2015-12-17USUS14/972,325patent/US20160180746A1/ennot_activeAbandoned
Cited By (8)
| Publication number | Priority date | Publication date | Assignee | Title |
|---|---|---|---|---|
| CN101447091B (en)* | 2006-12-04 | 2013-09-25 | Arm挪威股份有限公司 | Method and apparatus for processing graphics |
| CN102521598A (en)* | 2011-12-16 | 2012-06-27 | 北京市城市规划设计研究院 | Identification method based on remote-sensing image |
| CN107967109A (en)* | 2012-08-10 | 2018-04-27 | 微软技术许可有限责任公司 | 3D data environment navigational tools |
| CN110832349A (en)* | 2017-05-15 | 2020-02-21 | 奥斯特公司 | Augmenting panoramic LIDAR results with color |
| CN110832349B (en)* | 2017-05-15 | 2023-10-10 | 奥斯特公司 | Panoramic color LIDAR system and method for a LIDAR system |
| US12061261B2 (en) | 2017-05-15 | 2024-08-13 | Ouster, Inc. | Augmenting panoramic LIDAR results with color |
| CN112131323A (en)* | 2019-06-25 | 2020-12-25 | 上海擎感智能科技有限公司 | Map display method and device |
| CN115033655A (en)* | 2022-08-09 | 2022-09-09 | 清华大学 | Urban and rural system map generation method and device, electronic equipment and readable storage medium |
Also Published As
| Publication number | Publication date |
|---|---|
| AU2004298635A1 (en) | 2005-06-30 |
| CN1795478B (en) | 2011-07-06 |
| US20060136126A1 (en) | 2006-06-22 |
| CA2510110A1 (en) | 2005-06-30 |
| CA2627989C (en) | 2013-01-29 |
| CA2627989A1 (en) | 2005-06-30 |
| US7856312B2 (en) | 2010-12-21 |
| CN102169650A (en) | 2011-08-31 |
| EP1614087A4 (en) | 2009-03-04 |
| WO2005059867A1 (en) | 2005-06-30 |
| US8606518B2 (en) | 2013-12-10 |
| EP1614087A1 (en) | 2006-01-11 |
| US20130103312A1 (en) | 2013-04-25 |
| EP2381434A1 (en) | 2011-10-26 |
| US20140078149A1 (en) | 2014-03-20 |
| CN102169650B (en) | 2013-04-10 |
| US8346471B2 (en) | 2013-01-01 |
| US20110074783A1 (en) | 2011-03-31 |
| US20110267355A1 (en) | 2011-11-03 |
| AU2004298635B2 (en) | 2008-02-28 |
| HK1158802A1 (en) | 2012-07-20 |
| CA2510110C (en) | 2009-03-17 |
| US9292741B2 (en) | 2016-03-22 |
| US20160180746A1 (en) | 2016-06-23 |
| US7979205B2 (en) | 2011-07-12 |
Similar Documents
| Publication | Publication Date | Title |
|---|---|---|
| CN1795478A (en) | System, device and method for drawing a map | |
| Yu et al. | Automated derivation of urban building density information using airborne LiDAR data and object-based method | |
| Bhaskaran et al. | Per-pixel and object-oriented classification methods for mapping urban features using Ikonos satellite data | |
| Di Sabatino et al. | Construction of digital elevation models for a southern European city and a comparative morphological analysis with respect to Northern European and North American cities | |
| Li et al. | Identification of undocumented buildings in cadastral data using remote sensing: Construction period, morphology, and landscape | |
| Alvares-Sanches et al. | Tracking a city’s center of gravity over 500 years of growth from a time series of georectified historical maps | |
| Varol et al. | Analysis of the association between image resolution and landscape metrics using multi-sensor LULC maps | |
| Rai et al. | Role of geoinformatics in urban planning | |
| CN118761560A (en) | A GIS-based urban land planning analysis method and system | |
| AU2007246203B2 (en) | System, apparatus and method for mapping | |
| Olaleye et al. | Land use change detection and analysis using remotely sensed data in Lekki Peninsula area of Lagos, Nigeria. | |
| Orlof et al. | Generating viewsheds based on the Digital Surface Model (DSM) and point cloud | |
| Shah et al. | Assessment Of Urban Utilities For Mumbai City Using 3d Modeling Techniques | |
| Falcone et al. | Generation of a US national urban land-use product | |
| Shao | Baselining UBC Vancouver Campus Urban Forest and Land Use: Developing and Validating Up-to-date Tree Inventory and Land Classification Map of the UBC Vancouver Campus | |
| Gacemi et al. | Automated Process for Classifying Built-up Areas Using Geospatial and Census Data, Applied to an Agglomeration of the Algerian Coast | |
| HK1158802B (en) | Apparatus and method for mapping | |
| Ahmed et al. | Exploring the Utilities of Unmanned Aerial Vehicle (UAV) Imageries for Assessing Planned Housing in a GIS format: A case study of Savar Upazilain Dhaka, Bangladesh | |
| Eze | The role of satellite remote sensing data and GIS in population census and management in Nigeria: A case study of an enumeration area in Enugu, Nigeria | |
| Agaja et al. | Geospatial Analysis of Primary Health Care Centres in Ughelli North and Warri South Local Government Areas of Delta State, Nigeria | |
| Lin | Constructing a GIS-based 3D urban model using LiDAR and aerial photographs | |
| Sharma et al. | uSIM2020-Building to Buildings: Urban and Community Energy Modelling, November 12th, 2020 Developing a 3D geometry for Urban energy modelling of Indian cities | |
| Hochmair et al. | Miami-Dade Urban Tree Canopy Analysis | |
| Shao | Mapping and modeling the urban landscape in Bangkok, Thailand: Physical-spectral-spatial relations of population-environmental interactions | |
| Shukla et al. | Deep Learning For Lidar Data Processing And Creation Of 3D City Model |
Legal Events
| Date | Code | Title | Description |
|---|---|---|---|
| C06 | Publication | ||
| PB01 | Publication | ||
| C10 | Entry into substantive examination | ||
| SE01 | Entry into force of request for substantive examination | ||
| C14 | Grant of patent or utility model | ||
| GR01 | Patent grant | ||
| CF01 | Termination of patent right due to non-payment of annual fee | Granted publication date:20110706 Termination date:20161216 | |
| CF01 | Termination of patent right due to non-payment of annual fee |