CN1718154B - Optical measurement system for living bodies and method thereof - Google Patents
Optical measurement system for living bodies and method thereofDownload PDFInfo
- Publication number
- CN1718154B CN1718154BCN2005100017696ACN200510001769ACN1718154BCN 1718154 BCN1718154 BCN 1718154BCN 2005100017696 ACN2005100017696 ACN 2005100017696ACN 200510001769 ACN200510001769 ACN 200510001769ACN 1718154 BCN1718154 BCN 1718154B
- Authority
- CN
- China
- Prior art keywords
- signal
- phase
- test
- mentioned
- index
- Prior art date
- Legal status (The legal status is an assumption and is not a legal conclusion. Google has not performed a legal analysis and makes no representation as to the accuracy of the status listed.)
- Expired - Fee Related
Links
Images


Classifications
- A—HUMAN NECESSITIES
- A61—MEDICAL OR VETERINARY SCIENCE; HYGIENE
- A61B—DIAGNOSIS; SURGERY; IDENTIFICATION
- A61B5/00—Measuring for diagnostic purposes; Identification of persons
- A61B5/16—Devices for psychotechnics; Testing reaction times ; Devices for evaluating the psychological state
- A—HUMAN NECESSITIES
- A61—MEDICAL OR VETERINARY SCIENCE; HYGIENE
- A61B—DIAGNOSIS; SURGERY; IDENTIFICATION
- A61B5/00—Measuring for diagnostic purposes; Identification of persons
- A61B5/145—Measuring characteristics of blood in vivo, e.g. gas concentration or pH-value ; Measuring characteristics of body fluids or tissues, e.g. interstitial fluid or cerebral tissue
- A61B5/1455—Measuring characteristics of blood in vivo, e.g. gas concentration or pH-value ; Measuring characteristics of body fluids or tissues, e.g. interstitial fluid or cerebral tissue using optical sensors, e.g. spectral photometrical oximeters
- A61B5/14551—Measuring characteristics of blood in vivo, e.g. gas concentration or pH-value ; Measuring characteristics of body fluids or tissues, e.g. interstitial fluid or cerebral tissue using optical sensors, e.g. spectral photometrical oximeters for measuring blood gases
- A61B5/14553—Measuring characteristics of blood in vivo, e.g. gas concentration or pH-value ; Measuring characteristics of body fluids or tissues, e.g. interstitial fluid or cerebral tissue using optical sensors, e.g. spectral photometrical oximeters for measuring blood gases specially adapted for cerebral tissue
- A—HUMAN NECESSITIES
- A61—MEDICAL OR VETERINARY SCIENCE; HYGIENE
- A61B—DIAGNOSIS; SURGERY; IDENTIFICATION
- A61B5/00—Measuring for diagnostic purposes; Identification of persons
- A61B5/68—Arrangements of detecting, measuring or recording means, e.g. sensors, in relation to patient
- A61B5/6801—Arrangements of detecting, measuring or recording means, e.g. sensors, in relation to patient specially adapted to be attached to or worn on the body surface
- A61B5/6813—Specially adapted to be attached to a specific body part
- A61B5/6814—Head
Landscapes
- Health & Medical Sciences (AREA)
- Life Sciences & Earth Sciences (AREA)
- Physics & Mathematics (AREA)
- Engineering & Computer Science (AREA)
- Veterinary Medicine (AREA)
- Public Health (AREA)
- General Health & Medical Sciences (AREA)
- Animal Behavior & Ethology (AREA)
- Surgery (AREA)
- Molecular Biology (AREA)
- Medical Informatics (AREA)
- Biophysics (AREA)
- Pathology (AREA)
- Biomedical Technology (AREA)
- Heart & Thoracic Surgery (AREA)
- Child & Adolescent Psychology (AREA)
- Educational Technology (AREA)
- Social Psychology (AREA)
- Psychology (AREA)
- Psychiatry (AREA)
- Hospice & Palliative Care (AREA)
- Developmental Disabilities (AREA)
- Neurology (AREA)
- Spectroscopy & Molecular Physics (AREA)
- Optics & Photonics (AREA)
- Measurement Of The Respiration, Hearing Ability, Form, And Blood Characteristics Of Living Organisms (AREA)
- Investigating Or Analysing Materials By Optical Means (AREA)
- Measurement And Recording Of Electrical Phenomena And Electrical Characteristics Of The Living Body (AREA)
Abstract
Translated fromChinese
Description
Translated fromChinese技术领域technical field
本发明,涉及例如日本公开专利特开2000-237194号公报中所公布的脑功能测试领域。 The present invention relates to the field of brain function tests disclosed in, for example, Japanese Laid-Open Patent Publication No. 2000-237194. the
背景技术Background technique
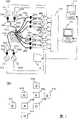
用图1(A)、(B)来说明脑功能测试的一个例子。图1(A)是脑功能测试装置的概要与被检验者的关系图,图1(B)表示的是对被检验者的头部照射光的照射装置的安装位置S与安装接受照射到被检验者的头部的光所透过的光的受光用光导纤维的位置D的排列的一个例子。 An example of a brain function test is illustrated with Figure 1 (A), (B). Fig. 1 (A) is the outline of the brain function testing device and the relationship diagram of the examinee, and Fig. 1 (B) shows the installation position S of the irradiation device for irradiating light on the head of the examinee and the installation position S to accept the irradiation to the examinee. An example of the arrangement of the position D of the light-receiving optical fiber through which the light from the examiner's head passes. the
脑功能测试装置,设置有: Brain function testing device, equipped with:
波长不同的多个光源102a~102d(光源102a和102c,例如波长为780nm,光源102b和102d,例如波长为830nm); A plurality of
将上述多个光源102a和102b(102c和102d)的光分别按互不相同的频率进行强度调制的振荡器101a和101b(101c和101d);
多个光照射装置,该多个光照射装置,分别通过光导纤维103a和103b由耦合器104a耦合、以及分别通过光导纤维103c和103d由耦合器104b耦合被强度调制过的光,通过光照射用光导纤维105a和105b将这些耦合光照射到被检验者106的头皮上不同的位置;和 A plurality of light irradiation devices, the plurality of light irradiation devices are respectively coupled by the
多个受光装置,该多个受光装置,由多个受光用光导纤维107a~107f和受光器108a~108f构成,多个受光用光导纤维107a~107f,被设置为其前端位于上述多个光照射装置的光照射位置附近、距上述光照射位置大致等距离(这里,取为30mm)的位置上,而受光器108a~108f设置在这些多条受光用光导纤维107a~107f的另一端。 A plurality of light-receiving devices, the plurality of light-receiving devices are composed of a plurality of light-receiving
在图1(A)的例子中,如图1(B)所示,把3条受光用光导纤维(记为D)107a~107c和107d~107f分别配置在光照射用光导纤维(记为S)105a和105b的周围,把生物体通过光聚光于光导纤维内,并进行检测。由受光器108a~108f分别将所检测到的生物体通过光进行光电变换。上述受光装置检测在被检验者的头部的内部所反射而透过的光并变换为电信号,作为受光器108a~108f使用光电倍增管或光电二极管为代表的光电变换元件。 In the example of FIG. 1(A), as shown in FIG. 1(B), three light-receiving optical fibers (denoted as D) 107a to 107c and 107d to 107f are arranged on the light-emitting optical fiber (denoted as S) respectively. ) around the 105a and 105b, the biological body is concentrated in the optical fiber by light and detected. The detected living organisms are photoelectrically converted by light from the
表示被受光器108a~108f光电变换过的生物体通过光强度的电信号(下称生物体通过光强度信号)分别被输入到锁定放大器109a~109h。这里,为了检测出由距光照射用光导纤维105a和105b的两方等距离的受光用光导纤维107c和107d所聚光的生物体通过光强度,受光器108c和108d将来自受光器108c和108d的信号分离为2个系统,然后输入到锁定放大器109c、109e和109d、109f。把来自振荡器101a和101b的强度调制频率作为参照频率输入到锁定放大器109a~109d,而把来自振荡器101c和101d的强度调制频率作为参照频率输入到锁定放大器109e~109h。因此,由锁定放大器109a~109d分离输出对于光源102a和102b的生物体通过光强度信号,由锁定放大器109e~109h分离输出对于光源102c和102d的生物体通过光强度信号。 Electrical signals (hereinafter referred to as "living body passing light intensity signals") indicating the intensity of the living body passing light photoelectrically converted by the
用模/数变换器(下称A/D变换器)110把作为锁定放大器109a~109h的输出的所分离出来的每种波长的通过光强度信号进行模/数变换后,送到测试控制用计算机111。在测试控制用计算机111中使用生物体通过光强度信号从各检测点的检测信号计算氧化血红蛋白浓度、脱氧血红蛋白浓度和总血红蛋白浓度的相对变化量,并作为多个测试点的经过时间信息存储到计算机111的存储装置内。这里,总血红蛋白浓度的相对变化量作为氧化血红蛋白浓度和脱氧血红蛋白浓度变化量之和给出。 Use the analog/digital converter (hereinafter referred to as the A/D converter) 110 to carry out the analog/digital conversion on the separated passing light intensity signal of each wavelength as the output of the lock-in
另一方面,为了进行被检验者的脑功能的测试,给予被检验者规定的刺激·任务,评价对刺激·任务的响应。因此,总体控制兼数据处理·结果显示用计算机114,把指令送到测试控制用计算机111,测试控制用计算机111根据指令,按照预先准备好的刺激·任务命令序列,对被检验者用刺激·任务命令出示装置113提示刺激·任务命令。对被检验者的脑子内的对刺激·任务命令的应答像上述那样进行光测试。总体控制兼数据处理·结果显示用计算机114和测试控制用计算机111进行必要的信息交换。 On the other hand, in order to test the brain function of the subject, predetermined stimuli and tasks are given to the subject, and responses to the stimuli and tasks are evaluated. Therefore, the
原来,在评价被检验者对刺激·任务的应答时,重复进行测试后,根据所得到的平均应答的信号幅度来检定信号的显著性,确定显著的活动区域。 Originally, when evaluating a subject's response to a stimulus or task, the test was repeated, and the significance of the signal was examined based on the signal amplitude of the average response obtained to determine a significant active region. the
【专利文献1】特开2000-237194号公报 [Patent Document 1] JP-A-2000-237194 Gazette
应答期间的取法中存在任意性,因包含在信号内的赝象而有不能显现充分的检测能力的场合。因此,要开发能够准确评价被检验者对刺激·任务的应答的有效的检测方法以及结果的显示方法。 There is arbitrariness in how the response period is taken, and sufficient detection capability may not be exhibited due to artifacts included in the signal. Therefore, it is necessary to develop an effective detection method and a result display method capable of accurately evaluating a subject's response to a stimulus/task. the
发明内容Contents of the invention
本发明,着眼于同源的活动为相位同步这样的原理,为评价被检验者的应答而着眼于对被检验者的刺激·任务和被检验者的应答结果的相位同步性来检测出活动区域。从信号的幅度和相位两个方面来解析同步性,图2(A)、(B)是说明信号同步性的简图。图2(A)所表示的是周期性地给出任务期间和休止期间时所得到的结果的信号例A、B。信号例A是幅度同步性和相位同步性都满足时的结果例,信号B是幅度无同步性而相位有同步性的结果例。图2(B)是将其列成表表示的结果。 The present invention focuses on the principle that homologous activities are phase-synchronized, and detects the active region by focusing on the phase synchronization between the stimulus and task of the subject and the response result of the subject in order to evaluate the response of the subject. . Analyzing synchronization from two aspects of signal amplitude and phase, Figure 2 (A), (B) is a simplified diagram illustrating signal synchronization. FIG. 2(A) shows signal examples A and B of the results obtained when the duty period and the idle period are periodically given. Signal example A is a result example when both the amplitude synchronization and phase synchronization are satisfied, and signal B is a result example where the amplitude is not synchronized but the phase is synchronized. Figure 2(B) is the result of tabulating it. the
本发明,着眼于为了评价被检验者的应答强调以幅度同步性为条件。即,将对应于给予被检验者的刺激·任务的信号作为基准信号,求出与对应于被检验者的应答的测试信号的相位差,并将相位同步性数值化,进而对该数值进行统计处理并把可靠度数值化,最后根据显著的数据把脑活动的部位和功能的结合状态显示出来。 The present invention focuses on emphasizing the condition of amplitude synchronization in order to evaluate the subject's response. That is, the signal corresponding to the stimulus and task given to the subject is used as a reference signal, the phase difference with the test signal corresponding to the response of the subject is obtained, and the phase synchronization is quantified, and the numerical value is further calculated. Process and quantify the reliability, and finally display the combined state of brain activity parts and functions based on significant data. the
附图说明Description of drawings
图1(A)是脑功能测试装置的概要与被检验者的关系图,图1(B)是安装对被检验者的头部照射光的照射装置的位置S与安装接受照射到被检验者的头部的光所透过的光的受光用光导纤维的位置D的排列的一个例子的示例图。 Fig. 1(A) is a diagram showing the outline of the brain function test device and the relationship between the subject, and Fig. 1(B) is the position S where the irradiation device is installed to irradiate the subject's head and the position S where the irradiation device is installed to accept the irradiation to the subject. An illustration of an example of the arrangement of the position D of the light-receiving optical fiber through which the light of the head passes. the
图2(A)、(B)是说明信号的同步性的简图。其中(A)是周期性给与任务期间和休止期间时所得到的结果的信号例A、B的示图,(B)是将其结果列成的表。 2(A) and (B) are diagrams illustrating synchronization of signals. Among them, (A) is a diagram of the signal examples A and B obtained when the mission period and the rest period are periodically given, and (B) is a table listing the results. the
图3是实施例1中的生物体测试装置的结构框图。 FIG. 3 is a block diagram showing the structure of a living body testing device in
图4(A)~(F)是由实施例1所得到的相位同步性解析结果的一例的说明图。其中(A)是探头的构成例;(B)是评价总血红蛋白量变化的测试结果的相位同步性的结果;(C)是以图的方式表示图4(B)的结果的示图; (D)是为进行比较,由同一测试结果,与图4(C)一样,表示像原来那样根据刺激期间的信号幅度所检定的结果的示图;(E)是用更加易于理解的形式向用户以图的方式显示图4(B)、图4(C)的结果的情况下的显示例的示图;(F)是对应于图4(C)以图的方式显示图4(D)的结果的示例图。 4(A) to (F) are explanatory diagrams showing an example of phase synchronization analysis results obtained in Example 1. FIG. Wherein (A) is the composition example of probe; (B) is the result of the phase synchronicity of the test result that evaluates total hemoglobin amount variation; (C) is the diagram that represents the result of Fig. 4 (B) in the form of graph; ( D) is for comparison, by the same test result, same as Fig. 4(C), expresses the diagram of the result verified according to the signal amplitude during stimulation as before; Figure 4(B), Figure 4(C) is a diagram showing a display example in the case of the results of Figure 4(C); (F) is a diagram showing Figure 4(D) corresponding to Figure 4(C) An example plot of the results. the
图5(A)是实施例2的探头的构成例及配置的示意图,同时,表示出相位同步性的评价结果;图5(B)是与图4(E)所示的一样,将图5(A)所示的结果可视化,把从上方看到的头的图显示在图象上的示图。 Fig. 5 (A) is the configuration example and the schematic diagram of disposition of the probe of
图6是从对应于成为基准信号的录音的听觉分辨所得到的信号来评价相位同步性高的测试通道的示图。 FIG. 6 is a diagram showing a test channel with high phase synchronization evaluated from a signal obtained by auditory discrimination corresponding to a recording used as a reference signal. the
图7是按显著水准1%判定从对应于录音的听觉分辨所得到的信号评价相位同步性的结果所得到的结果的示图。 FIG. 7 is a graph showing results obtained by judging the results of evaluating phase synchronization from signals obtained by auditory discrimination corresponding to recordings at a significance level of 1%. the
图8是对图6所示的从对应于成为基准信号的录音的听觉分辨所得到的信号来表示关于相位同步性高的测试通道的应答速度的示图。 FIG. 8 is a graph showing the response speed for a test channel with high phase synchronization for the signal obtained from the auditory discrimination corresponding to the recording used as the reference signal shown in FIG. 6 . the
图9是从对应于录音的听觉分辨所得到的信号评价相位同步性,并把应答速度信息显示在显示按显著水准1%判定其评价结果所得到的结果的图7上的示图。 Fig. 9 is a graph showing the results obtained by evaluating the phase synchronization from a signal obtained by auditory discrimination corresponding to a recording, and displaying response speed information on Fig. 7 showing the evaluation result judged at a significance level of 1%. the
图10是将被检验者的脑活动动态可视化后显示出来的一例的示图。 FIG. 10 is a diagram showing an example of dynamically visualized and displayed brain activity of a subject. the
符号一览表 List of symbols
101:振荡器,102:光源,103:光纤,104:结合器,105:光纤, 101: oscillator, 102: light source, 103: optical fiber, 104: combiner, 105: optical fiber,
106:测试对象(被检验者),107:受光用光纤,108:受光器, 106: Test object (inspected person), 107: Optical fiber for receiving light, 108: Optical receiver,
109:锁定放大器,110:模·数转换器(A/D),111:测试控制用计算机, 109: lock-in amplifier, 110: analog-to-digital converter (A/D), 111: computer for test control,
112:刺激·任务命令序列,113:刺激·任务命令呈示装置, 112: stimulus task order sequence, 113: stimulus task command presentation device,
114:综合控制兼数据处理结果·显示用计算机,210:本装置, 114: Integrated control and data processing result display computer, 210: This device,
201,204:接口,202:CPU,203:存储程序和数据的存储装置, 201, 204: interface, 202: CPU, 203: storage device for storing programs and data,
206:总线,211:显示装置,212:键盘,213:指示设备。 206: bus, 211: display device, 212: keyboard, 213: pointing device. the
具体实施方式Detailed ways
在由刺激和任务两个信号同步时,着眼于信号间的相位差为恒定这点,来探讨在实际数据中相位差恒定到何种程度。 Focusing on the fact that the phase difference between the signals is constant when the two signals of the stimulus and the task are synchronized, it is investigated to what extent the phase difference is constant in the actual data. the
在计算相位差时,使用希尔伯特变换,从所得到的瞬时相位计算出各时 刻的相位差。 When calculating the phase difference, the Hilbert transform is used to calculate the phase difference at each time from the obtained instantaneous phase. the
以下说明希尔伯特变换。分别用式(1)、(2)来定义实数函数f(t)的希尔伯特变换g(t)和逆希尔伯特变换。 The Hilbert transform will be described below. Use equations (1) and (2) to define the Hilbert transform g(t) and inverse Hilbert transform of the real function f(t) respectively. the
其中,表示卷积。 in, Indicates convolution.
把测试信号作为实数函数f(t),使用希尔伯特变换由式(3)来定义。 Taking the test signal as a real function f(t), it is defined by formula (3) using Hilbert transform. the
Z(t)=f(t)+jg(t) …… (3) Z(t)=f(t)+jg(t) ... (3)
如果用极坐标来表示该式,就成为式(4)、(5)和(6)。 If the formula is expressed in polar coordinates, it becomes formulas (4), (5) and (6). the
Z(t)=r(t)ejθ(t) …… (4) Z(t)=r(t)ejθ(t) ... (4)
其中, in,
r(t)表示f(t)的瞬时振幅,θ(t)表示瞬时相位。 r(t) represents the instantaneous amplitude of f(t), and θ(t) represents the instantaneous phase. the
在具体的算法中,将解析信号Z(t)作为测试信号f(t)的单侧傅立叶变换来求取。即,将对应于负频率的傅立叶变换设为0。为了使解析信号近似,计算测试信号f(t)的FFT,再把对应于负频率的FFT系数置换为零,对该结果进行逆FFT计算,来求出解析信号Z(t)。 In a specific algorithm, the analytical signal Z(t) is obtained as a one-sided Fourier transform of the test signal f(t). That is, the Fourier transform corresponding to negative frequencies is set to 0. In order to approximate the analytical signal, calculate the FFT of the test signal f(t), replace the FFT coefficient corresponding to the negative frequency with zero, and perform an inverse FFT calculation on the result to obtain the analytical signal Z(t). the
如果进行详细说明,使用如下的4步算法。设输入数据个数为n。 If specified, a 4-step algorithm is used as follows. Let the number of input data be n. the
第一步:计算输入数据的FFT,将其结果存储为矢量y; Step 1: Calculate the FFT of the input data and store its result as a vector y;
第二步:元素h(i),生成具有如下值的矢量h; The second step: element h(i), generate a vector h with the following values;
对于i=1,(n/2)+1;h(i)=1 For i=1, (n/2)+1; h(i)=1
对于i=2,3,…,(n/2);h(i)=2 For i=2, 3, ..., (n/2); h(i)=2
对于i=(n/2)+2,…,n;h(i)=0 For i=(n/2)+2,...,n; h(i)=0
第三步:计算y和h的元素单位的积; Step 3: Calculate the product of the element units of y and h;
第四步:计算在第三步得到的数据列的逆FFT,从结果中将最初n个元素作为解析信号Z(t)输出。 The fourth step: Calculate the inverse FFT of the data column obtained in the third step, and output the first n elements from the result as the analytical signal Z(t). the
为了客观地判断相位差恒定到何种程度,而进行统计性的探讨。在[-π,π]范围内用Nb个筐的直方图来表示相位差的分布,作为统计性指标按照式(7)、(8)和(9)定义并求出SI(Synchronization Index:同步指数)。 In order to objectively judge how constant the phase difference is, a statistical study is performed. In the range of [-π, π], the histogram of Nb baskets is used to represent the distribution of the phase difference, and as a statistical index, it is defined according to formulas (7), (8) and (9) and the SI (Synchronization Index: Synchronization index). the
其中, in,
Srandom=log2Nb …… (9) Srandom = log2 Nb ... (9)
(pi:第i个筐的概率密度) (pi : the probability density of the i-th basket)
在式(8)中出现的pi表示第i个筐中相位差存在的概率。 pi appearing in Equation (8) represents the probability that a phase difference exists in the i-th basket.
在相位差的分布完全均匀,即完全没有相位同步性的情况下,由于S=Srandom,所以SI=0。在完全同步的情况下,SI=1。因为实际的测试数据包含有多种噪声成分,得到SI=1或SI=0这样的极端的结果是极为稀少的。中间的情况,要统计地判断是否应考虑为存在相位同步性。 In the case where the distribution of the phase difference is completely uniform, that is, there is no phase synchronization at all, since S=Srandom , SI=0. In the case of perfect synchronization, SI=1. Because the actual test data contains various noise components, it is extremely rare to obtain extreme results such as SI=1 or SI=0. In the middle case, it is necessary to judge statistically whether or not phase synchronization should be considered to exist.
作为统计判断的方法,这里采用代理数据法,所谓代理数据法,是指用来进行如下的检定的架构。 As a statistical judgment method, a proxy data method is used here. The so-called proxy data method refers to a framework for performing the following tests. the
1.从源数据生成多个统计性质的明确的数据(利用随机数)。 1. Generate a number of unambiguous data of a statistical nature (using random numbers) from source data. the
2.对该随机数据计算成为问题的指标。 2. The random data calculation becomes the index of the problem. the
3.根据针对多个指标的样本值进行与源数据相关的指标的检定。 3. Perform verification of indicators related to source data based on sample values for multiple indicators. the
作为代理数据,例如采用在无存储随机过程中实施过与信号相同的过滤的数据。在从50个代理数据中得到的作为统计指标的SI的分布是正态分布(平均值为0.2236,标准偏差为0.0219)的情况下,作为显著水准1%的阈值,可以采用SI>0.2800。另外,为了探讨同步状态的时间变化,设定短(包含约数百点左右的数据)的时间窗,求出作为该期间内的统计指标的SI,并作 为时间窗的中心时刻的SI,每隔一定时间挪一挪时间窗,这样,也可以求出SI的时间变化。 As the proxy data, for example, data subjected to the same filtering as the signal in the non-memory random process is used. When the distribution of SI as a statistical index obtained from 50 proxy data is a normal distribution (mean value is 0.2236, standard deviation is 0.0219), SI>0.2800 can be adopted as the threshold value of the significance level of 1%. In addition, in order to investigate the time change of the synchronization state, a short time window (including data of about hundreds of points) is set, and the SI as a statistical index within the period is obtained, and used as the SI at the center time of the time window, Move the time window every certain time, so that the time change of SI can also be obtained. the
(实施例1) (Example 1)
图3是实施例1中的生物体测试装置的结构框图。本装置210对应于表示图1所示的测试控制用计算机111的测试功能的部分。是由与A/D变换器110的接口201、进行一系列处理的CPU202、存储程序和数据的存储装置203、与外部设备205的接口204和与这些部件相连接的总线206所构成。另外,在总线206上还连接有显示装置211、键盘212和指示设备(例如鼠标器)213,用来由测试控制用计算机111的操作者输入数据或向操作者进行解析结果的提示。这里,作为存储在存储装置203内的程序,被做成为:具有对信号实施必要的过滤的过滤程序、由被过滤过的信号群或外部信号解析相位同步性的相位同步性解析程序、由相位同步性解析的结果检出神经活动的活动检测程序、和用来以易于理解的形式向用户提示所检出的神经活动的图象化程序。将检出结果显示在显示装置211上。保存在存储装置203内的程序由中央运算处理装置202解释并执行。 FIG. 3 is a block diagram showing the structure of a living body testing device in
图4所表示的是由实施例1所得到的相位同步性解析结果的一例的说明图。 FIG. 4 is an explanatory diagram showing an example of the phase synchronization analysis results obtained in the first embodiment. the
图4(A)是探头的构成例子图。安装在被检验者头部的探头,交替地配置光照射用光导纤维S和受光用光导纤维D,光照射用光导纤维S和受光用光导纤维D之间形成用1~24表示的测试通道,该图是说明可以测试针对视觉刺激的总血红蛋白量变化的状态图。可以考虑安装的位置或被检验者的头的大小等、适当选择探头具备的光照射用光导纤维S和受光用光导纤维D的数量。对被检验者的视觉刺激采用16×16的红黑国际象棋棋盘刺激,红黑交替频率为8赫兹,间歇期为20秒,刺激(任务)期为18秒,重复6次。 FIG. 4(A) is a diagram showing a configuration example of a probe. The probe installed on the head of the subject is arranged alternately with the optical fiber S for light irradiation and the optical fiber D for light reception, and the test channels represented by 1 to 24 are formed between the optical fiber S for light irradiation and the optical fiber D for light reception. This figure is a state diagram illustrating that changes in the amount of total hemoglobin in response to visual stimuli can be tested. The number of light-emitting optical fibers S and light-receiving optical fibers D included in the probe can be appropriately selected in consideration of the installation position, the size of the subject's head, and the like. A 16×16 red and black chess board was used as the visual stimulus for the subjects, the alternating frequency of red and black was 8 Hz, the rest period was 20 seconds, the stimulation (task) period was 18 seconds, and repeated 6 times. the
图4(B)所表示的是评价总血红蛋白量变化的测试结果的相位同步性的结果图,是横轴为通道号,纵轴为各通道SI值(同步指数),用○表示重复次数为6次的SI值的平均值,另外,用折线表示统计的基准值(显著概率1%)的特性图。因此,在该例中,从通道1、2、4、5、6、8和10得到可评价为与国际象棋棋盘刺激已同步的信号。 What Fig. 4 (B) represented is the result figure of the phase synchronicity of the test result of evaluating total hemoglobin amount change, is that the horizontal axis is the channel number, and the vertical axis is the SI value (synchronization index) of each channel, and ○ indicates that the number of repetitions is The mean value of the SI values of the six times, and the characteristic diagram of the statistical reference value (
图4(C)表示的是以图形方式显示出图4(B)的结果图,按显著概率1%进行评价,对显著的通道1、2、4、5、6、8和10,用通道号表示,非显著的通道,用涂有黑点的方块表示,用空白的方块表示测试用光导纤维的位置。由图4(C)可知,检测到对应探头上部的头部位置的脑活动是活跃的。 Figure 4(C) shows the result graph of Figure 4(B) in a graphical way, and evaluates according to the significant probability of 1%. For the
图4(D)是为进行比较、由同样的测试结果,与图4(C)一样,表示出像传统的那样根据刺激期期间中的信号振幅检定出来的结果。可是,用根据信号振幅进行的检定不能按1%的显著水准进行检测,而是使用5%的显著水准。与图4(C)相比,在对应于探头的大部分的头部位置脑活动呈现活跃。由此可知,本发明的方法灵敏度高,能够检测到局部存在的活动。 Fig. 4(D) is for comparison, from the same test results, as in Fig. 4(C), it shows the result of the conventional test based on the signal amplitude during the stimulation period. However, the assay based on signal amplitude cannot be detected at a significance level of 1%, but a significance level of 5% is used. Compared with FIG. 4(C), the brain activity appears active at the head position corresponding to most of the probe. It can be seen that the method of the present invention has high sensitivity and can detect locally existing activities. the
图4(E)是将图4(B)、图4(C)的结果以更易于理解的形式以图形方式显示给用户的情况下的显示例,将分阶段变更评价检测结果的显著水准的结果作成等高线并与显示关联起来的图。即,在本发明的实施例1中,将显著水准取为0.001、0.005、0.01和0.05时,可以用图示的等高线表示活动区域。图4(C)所示的检测结果对应于显著水准为0.01的等高线。由大家熟知的图象化程序、只要将该等高线做成以颜色的深浅显示的图像,用户就能够以可视化的形式看到活动区域。 Fig. 4(E) is a display example when the results of Fig. 4(B) and Fig. 4(C) are graphically displayed to the user in an easier-to-understand form, and the significance level of the evaluation detection results is changed step by step. The results are plotted as contour lines and associated with the display. That is, in
图4(F)是对应于图4(C)以图形方式显示图4(D)的结果的显示例。如前面已经描述过的那样,在原来的、根据信号振幅进行的检定中,不能按1%的显著水准进行检测,该例中,显示出了使用了2%、5%显著水准的结果。该例中,因为仅得到两条等高线,所以,显示不得不变得散漫。 FIG. 4(F) is a display example in which the result of FIG. 4(D) is graphically displayed corresponding to FIG. 4(C). As described above, in the original test based on the signal amplitude, the detection cannot be performed at the 1% significance level. In this example, the results using the 2% and 5% significance levels are shown. In this example, since only two contour lines are obtained, the display has to be sloppy. the
(实施例2) (Example 2)
实施例2,是试行:作为刺激·任务序列、让被检验者一面听棒球实况广播的录音、一面想象自己作为击球员站着的情形这样的课题时的关于活动的评价。图5(A)是实施例2的探头的构成例及配置的示意图,同时表示出相位同步性的评价结果。图中用卵形的线表示的图是将从上方观察到的头的图作成图像,在上部用三角表示的图形是将看到的鼻子部分作成图像的图。将探头1、探头2、3和探头4分别配置在前头部、左右侧头部和后头部。探头1和探头2、3构成分别可得到22个测试通道的探头,探头4构成可得到24个测试通道的探头。 Example 2 is a trial implementation of an evaluation of activities when the subject imagines himself standing as a batter while listening to a recording of a baseball live broadcast as a stimulus-task sequence. FIG. 5(A) is a schematic diagram of a configuration example and arrangement of the probes of the second embodiment, and also shows the evaluation results of the phase synchronization. In the figure, the figure indicated by the oval line is an image of the head viewed from above, and the figure indicated by the triangle in the upper part is an image of the nose part seen.
图5(A)是实施例2的探头的构成例及配置的示意图,同时表示出相位同步性的结果;图5(B)是与图4(E)所示的一样,将图5(A)所示的结果可视化并将从上方观察到的头的图显示在图像上的图。 Fig. 5 (A) is the composition example and the schematic diagram of disposition of the probe of
从该结果可知,产生了:伴随录音的听觉分辨的在左右侧头下部(听觉区)的活动、击球的图象化引起的在后头上部(视觉区)的活动、在前头部由运动的模式形成准备引起的活动、和由具体的运动模式形成引起的在左右侧头上部(运动区)的活动。 From this result, it can be seen that: the activity of the left and right lower head (auditory area) accompanied by the auditory discrimination of the recording, the activity of the upper back of the head (visual area) caused by the image of hitting the ball, and the movement of the front head by movement The activity caused by the preparation of the pattern formation, and the activity caused by the specific movement pattern formation in the left and right upper head (motor area). the
在该例中,按照本发明,因为能够明确地检测到活动区域,所以也能够更加严密地进行被检验者的能活动的评价。 In this example, according to the present invention, since the active region can be clearly detected, it is also possible to perform more rigorous evaluation of the subject's ability to move. the
(实施例3) (Example 3)
可是,在实施例2中,虽然是将录音的听觉分辨作为基准信号来评价被检验者的脑活动的结果,但是评价所得到的结果的相位同步性的高低,将表示相位同步性高的通道的信号作为基准信号来进行评价,由此,能够更加严密地评价脑活动的作用区域。 However, in Example 2, although the result of evaluating the brain activity of the subject is evaluated using the auditory discrimination of the recording as a reference signal, the phase synchronization of the obtained results is evaluated, and the channels with high phase synchronization are evaluated. The signal of is evaluated as a reference signal, so that the active region of brain activity can be evaluated more closely. the
在实施例3中,首先从对应于成为基准信号的录音的听觉分辨所得到的信号评价相位同步性高的测试通道。图6是从对应于成为基准信号的录音的听觉分辨所得到的信号评价相位同步性高的测试通道的示图。该例中,探头2的第10号通道表示相位同步性最高的通道。 In Example 3, first, a test channel with high phase synchronization is evaluated from a signal obtained by auditory discrimination corresponding to a recording used as a reference signal. FIG. 6 is a diagram showing a test channel with high phase synchronization evaluated from a signal obtained by auditory discrimination corresponding to a recording used as a reference signal. In this example,
因此,把探头2的第10号通道的信号作为基准信号,从对应于录音的听觉分辨所得到的信号评价相位同步性。图7所示的是按显著水准1%判定从对应于录音的听觉分辨所得到的信号评价相位同步性的结果所得到的结果。与图5相比较,虽然是将相同的测试结果作为对象来进行解析,但是由于从对应于成为基准信号的录音的听觉分辨所得到的信号中选择相位同步性高的通道作为基准信号,所以更能检测出局部存在的活动区域。如果将图5和图7进行对比,就可以看出:改变基准通道后评价出来的结果,在探头1中使第13号通道无相位同步性;在探头2中使第15号通道有相位同步性,使第18号通道无相位同步性;在探头3中使第4号通道和第14号通道无相位同步性,使第11号通道有相位同步性;在探头4中使第13号通道和第16号通道无相位同步性。结果,如图7所示,使用图5(B)所示的那种可视信息也能够辨 认进一步所限定的区域内的活动。 Therefore, using the signal of the tenth channel of the
(实施例4) (Example 4)
可是,众所周知,脑活动,并非在脑区域的整个范围内同时发生,而是脑的某个区域的活动诱发其他区域的脑活动的所谓时间序列动作。在实施例3中,是进行了将实施例2的实验结果作为时间序列的脑活动的动作来评价的实验的例子。 However, it is well known that brain activity does not occur simultaneously over the entire range of brain regions, but is a so-called time-series action in which activity in a certain region of the brain induces brain activity in other regions. Example 3 is an example of an experiment in which the experimental results of Example 2 were evaluated as time-series brain activity movements. the
图8是由对应于图6所示的成为基准信号的录音的听觉分辨所得到的信号来表示关于相位同步性高的测试通道的应答速度的示图。这里,很难显示出作为刺激·任务命令序列的基准信号的录音的波形和与其相对应的应答波形,所以只能以针对图2所说明的刺激·任务命令序列的应答的形式模拟地显示出来。横轴是时间,纵轴是信号的大小。图9是由对应于录音的听觉分辨所得到的信号评价相位同步性,并把应答的速度信息显示在按显著水准1%判定其评价结果所得到的结果的图7上的示图。 FIG. 8 is a diagram showing the response speed for a test channel with high phase synchronization by a signal obtained by auditory discrimination corresponding to the recording used as the reference signal shown in FIG. 6 . Here, it is difficult to display the waveform of the recorded reference signal of the stimulus-task command sequence and the corresponding response waveform, so it can only be displayed in the form of a response to the stimulus-task command sequence illustrated in Figure 2 . The horizontal axis is time, and the vertical axis is the magnitude of the signal. FIG. 9 is a graph showing the results obtained by evaluating the phase synchronization of the signals obtained by auditory discrimination corresponding to recordings, and displaying the response speed information on the evaluation results at a significance level of 1%. the
如果研讨图8,探头2、第10号通道应答最快,在图9上把探头2、第10号通道的方框加上黑点表示出来。其次是探头2、第5号通道和探头3、第9号通道的应答快,即,它们所代表的探头2和探头3所示的区域S 1的应答最快;再其次是探头1、第6号通道和探头1、第10号通道的应答快,即,探头1所示的区域S2的应答速度为第二快;再其次是探头4的第5号通道和探头4的第4号通道的应答快,即,探头4所示的区域S3的应答速度为第三快;最后,探头3的第5号通道、探头3的第11号通道和探头2的第12号通道应答是第四快,即,探头2和探头3所示的区域S4的应答速度为第四快。 If we study Figure 8,
由该结果可知,首先,伴随录音的听觉分辨的左右侧头下部(听觉区)的活动呈现在图9的区域S1内;然后,在前头部由运动的模式形成准备引起的活动呈现在图9的区域S2内;接下来,由击球的图象化引起的后头上部(视觉区)的活动呈现在图9的区域S3内;最后,由具体的运动模式引起的左右侧头上部(运动区)的活动呈现在图9的区域S4内。 From this result, it can be seen that, firstly, the activities of the left and right lower head (auditory area) accompanied by the auditory discrimination of the recording appear in the area S1 of Fig. 9; 9 in the area S2; next, the activity of the upper back of the head (visual zone) caused by the imaging of the batting is presented in the area S3 of Figure 9; finally, the left and right side upper head (movement) Region) is represented in region S4 of FIG. 9 . the
从图8也可以看到,这里所说的快、慢,是比较的问题,如果按时间的长短来说,最长也不过是秒的量级。但是,如上上述,如果将其分成对应于应答快慢的组,并以用户可见的形式显示出来,那么就能够动态可视化地显 示被检验者的脑活动。 It can also be seen from Figure 8 that the fast and slow mentioned here are a matter of comparison. In terms of the length of time, the longest is only on the order of seconds. However, as mentioned above, if it is divided into groups corresponding to the speed of response and displayed in a user-visible form, then the brain activity of the examinee can be dynamically visualized. the
图10是动态可视化地显示被检验者的脑活动的一例。S1是对应于图9的区域S1的显示,用加了点的圆圈显示出左右侧头下部(听觉区)的活动区域。这里,让圆的面积和形状对应于相位同步性高的测试通道的位置和数量。以下相同。S2是对应于图9的区域S2的显示,用加了点的圆圈显示出在前头部由运动的模式形成准备引起的活动区域;S3是对应于图9的区域S3的显示,用加了点的圆圈显示出击球的图象化引起的后头上部(视觉区)的活动区域;S4是对应于图9的区域S4的显示,用加了点的圆圈显示出具体的运动模式的形成引起的左右侧头上部(运动区)的活动区域。所谓“整体”是把从S1至S4的显示综合起来的显示,与图7(B)所示的图相同。 FIG. 10 is an example of dynamically and visually displaying brain activity of a subject. S1 is a display corresponding to the area S1 in FIG. 9 , and the active areas of the left and right lower head (auditory area) are displayed by dotted circles. Here, let the area and shape of the circle correspond to the position and number of test channels with high phase synchronization. The following are the same. S2 is the display corresponding to the area S2 of Figure 9, and the active area caused by the pattern formation preparation of the front head is shown by the dotted circle; S3 is the display corresponding to the area S3 of Figure 9, with the added circle The dotted circle shows the active area of the upper part of the back of the head (visual area) caused by the imaging of hitting the ball; S4 is the display corresponding to the area S4 in Figure 9, and the dotted circle shows the formation of the specific motion pattern caused by Active areas on the left and right sides of the upper part of the head (motor area). The "overall" is a display that integrates the displays from S1 to S4, and is the same as the graph shown in FIG. 7(B). the
如果把从S1至S4的显示作成用户一看就懂的动画,并从S1至S4依次地显示在顺序显示装置211上,用户就能够犹如感觉到适时地观看被检验者的脑活动的区域正在移动。动画显示之后,再显示出“整体”,就能够评价整个脑活动的状态。 If the display from S1 to S4 is made into an animation that the user can understand at a glance, and sequentially displayed on the
由在各部位所观测的平均相位差的值来判断产生活动的速度,相位差越小活动产生的越快。 The speed of activity generation was judged by the average phase difference value observed at each site, the smaller the phase difference, the faster the activity generation. the
(实施例5) (Example 5)
为了动画地研讨脑活动的时间变化,如上所述,为了探讨同步状态的时间变化,而设定短(包含大约数百点的数据)的时间窗,求出该期间内作为统计的指标的SI,作为时间窗的中心时刻的SI,每隔一定时间挪一挪时间窗,由这样,求出SI的时间变化,由此也能够实现。例如,每隔一定时间挪一挪时间窗来求出SI的时间变化,以此为基础评价测试区域的相位同步性,并可以将该结果,例如,做成图7所示的显示中的时间变化来进行显示。按照这样的方法,就能够敏感地捕捉到相位差的变化,从而能够正确地提示:脑的部位在以何种时间的关联使脑中的多种功能在活动。 In order to study the temporal changes of brain activity in animation, as described above, in order to study the temporal changes of the synchronous state, a short time window (including about hundreds of points of data) is set, and the SI used as a statistical index within this period is obtained. , as the SI at the central time of the time window, the time window is shifted every certain time, and in this way, the time change of SI can be obtained, which can also be realized. For example, move the time window at regular intervals to obtain the time change of SI, based on this, evaluate the phase synchronization of the test area, and the result can be made, for example, as the time in the display shown in Figure 7 changes to display. According to such a method, the change of the phase difference can be captured sensitively, so that it can be correctly indicated: at what time relationship do the parts of the brain activate various functions in the brain. the
由于相位同步性不依赖于信号振幅,所以能够以更加准确的形式来表示脑活动部位或功能的结合,而不受人的头部结构的影响。 Since the phase synchronicity does not depend on the signal amplitude, it can represent the combination of brain active sites or functions in a more accurate form, independent of the structure of the human head. the
在脑功能所受到的损害的评价和脑功能受到损害的人的恢复状态的评价方面是有用的,可用于协助脑的康复。 It is useful in the evaluation of the impairment of brain function and the evaluation of the recovery state of a person whose brain function is impaired, and can be used to assist in the rehabilitation of the brain. the
Claims (6)
Translated fromChineseApplications Claiming Priority (3)
| Application Number | Priority Date | Filing Date | Title |
|---|---|---|---|
| JP2004201608AJP3954597B6 (en) | 2004-07-08 | Biological optical measurement device and optical measurement method | |
| JP2004-201608 | 2004-07-08 | ||
| JP2004201608 | 2004-07-08 |
Publications (2)
| Publication Number | Publication Date |
|---|---|
| CN1718154A CN1718154A (en) | 2006-01-11 |
| CN1718154Btrue CN1718154B (en) | 2011-06-15 |
Family
ID=34933499
Family Applications (1)
| Application Number | Title | Priority Date | Filing Date |
|---|---|---|---|
| CN2005100017696AExpired - Fee RelatedCN1718154B (en) | 2004-07-08 | 2005-01-19 | Optical measurement system for living bodies and method thereof |
Country Status (4)
| Country | Link |
|---|---|
| US (1) | US7285790B2 (en) |
| EP (1) | EP1614385B1 (en) |
| CN (1) | CN1718154B (en) |
| DE (1) | DE602005002307T2 (en) |
Families Citing this family (7)
| Publication number | Priority date | Publication date | Assignee | Title |
|---|---|---|---|---|
| US7647083B2 (en)* | 2005-03-01 | 2010-01-12 | Masimo Laboratories, Inc. | Multiple wavelength sensor equalization |
| JP4702107B2 (en)* | 2006-03-03 | 2011-06-15 | 株式会社日立製作所 | Biological light measurement device |
| JP5034477B2 (en)* | 2006-12-15 | 2012-09-26 | 株式会社日立製作所 | Biological light measurement device |
| US9063074B2 (en)* | 2010-12-30 | 2015-06-23 | Empire Technology Development Llc | Analyzing tissue morphology in three dimensions |
| JP6285774B2 (en)* | 2014-03-31 | 2018-02-28 | リオン株式会社 | Language listening inspection device and method |
| KR101944030B1 (en)* | 2015-02-16 | 2019-04-17 | 고쿠리츠켄큐카이하츠호진 상교기쥬츠 소고켄큐쇼 | Near Infrared Brain function measuring instrument and measurement method |
| JP2017023455A (en)* | 2015-07-23 | 2017-02-02 | 株式会社アドバンテスト | Near-infrared bioinstrumentation apparatus and probe thereof |
Citations (4)
| Publication number | Priority date | Publication date | Assignee | Title |
|---|---|---|---|---|
| US4058113A (en)* | 1975-11-13 | 1977-11-15 | Fields Louis G | Time perception device |
| EP0541315A1 (en)* | 1991-11-03 | 1993-05-12 | Doron Urbach | Apparatus and method for audiometry |
| US5331969A (en)* | 1985-07-30 | 1994-07-26 | Swinburne Limited | Equipment for testing or measuring brain activity |
| CN1491610A (en)* | 2002-10-22 | 2004-04-28 | 株式会社日立制作所 | In vivo measurement system |
Family Cites Families (5)
| Publication number | Priority date | Publication date | Assignee | Title |
|---|---|---|---|---|
| JPH0998972A (en) | 1995-10-06 | 1997-04-15 | Hitachi Ltd | Biological optical measurement device and image creation method |
| JP4076003B2 (en) | 1999-02-19 | 2008-04-16 | 株式会社日立製作所 | Biological light measurement device |
| DE60142170D1 (en) | 2000-10-16 | 2010-07-01 | Hitachi Medical Corp | OPTICAL ORGANISM MEASURING DEVICE |
| JP2003079626A (en) | 2001-09-10 | 2003-03-18 | Japan Science & Technology Corp | Brain function analysis method applying ultrasonic Doppler method and its brain function analysis system |
| JP2004237194A (en) | 2003-02-05 | 2004-08-26 | Mitsubishi Rayon Co Ltd | Water cleaner |
- 2005
- 2005-01-19CNCN2005100017696Apatent/CN1718154B/ennot_activeExpired - Fee Related
- 2005-01-28EPEP05001846Apatent/EP1614385B1/ennot_activeExpired - Lifetime
- 2005-01-28USUS11/044,040patent/US7285790B2/ennot_activeExpired - Fee Related
- 2005-01-28DEDE602005002307Tpatent/DE602005002307T2/ennot_activeExpired - Lifetime
Patent Citations (4)
| Publication number | Priority date | Publication date | Assignee | Title |
|---|---|---|---|---|
| US4058113A (en)* | 1975-11-13 | 1977-11-15 | Fields Louis G | Time perception device |
| US5331969A (en)* | 1985-07-30 | 1994-07-26 | Swinburne Limited | Equipment for testing or measuring brain activity |
| EP0541315A1 (en)* | 1991-11-03 | 1993-05-12 | Doron Urbach | Apparatus and method for audiometry |
| CN1491610A (en)* | 2002-10-22 | 2004-04-28 | 株式会社日立制作所 | In vivo measurement system |
Non-Patent Citations (2)
| Title |
|---|
| JP特開2000-237194A 2000.09.05 |
| JP特開2003-79626A 2003.03.18 |
Also Published As
| Publication number | Publication date |
|---|---|
| JP2006020836A (en) | 2006-01-26 |
| EP1614385A1 (en) | 2006-01-11 |
| US20060006343A1 (en) | 2006-01-12 |
| JP3954597B2 (en) | 2007-08-08 |
| EP1614385B1 (en) | 2007-09-05 |
| CN1718154A (en) | 2006-01-11 |
| DE602005002307T2 (en) | 2008-05-29 |
| US7285790B2 (en) | 2007-10-23 |
| DE602005002307D1 (en) | 2007-10-18 |
Similar Documents
| Publication | Publication Date | Title |
|---|---|---|
| Pinti et al. | A review on the use of wearable functional near‐infrared spectroscopy in naturalistic environments | |
| Chaouachi et al. | Affect and mental engagement: towards adaptability for intelligent systems | |
| US20140228653A1 (en) | Device and method for displaying fetal positions and fetal biological signals using portable technology | |
| RU2441585C1 (en) | Method for evaluation of attention level of operator during computer testing | |
| Quiñones-Camacho et al. | Getting in synch: Unpacking the role of parent–child synchrony in the development of internalizing and externalizing behaviors | |
| RU2003133212A (en) | ANALYSIS OF THE HEAT IMAGE WHEN TESTING ON A POLYGRAPH | |
| CN114366103B (en) | Attention assessment method, device and electronic equipment | |
| JP2003038443A (en) | Brain function test method and device, brain function test system, brain function test service method, and program and device therefor | |
| JP5280494B2 (en) | Multiple brain activation observation system | |
| CN1718154B (en) | Optical measurement system for living bodies and method thereof | |
| CN113827246A (en) | Magnetoencephalography data acquisition and analysis method and system | |
| CN107307870A (en) | A kind of driving condition brain monitoring system and method based near infrared spectrum | |
| CN110693510A (en) | Auxiliary diagnostic device for attention deficit hyperactivity disorder and using method thereof | |
| CN100462055C (en) | Biological information signal processing system combining biological optical measurement device and electroencephalogram measurement device and probe device used therefor | |
| Zhu et al. | A comprehensive decoding of cognitive load | |
| CN106691410A (en) | Pulse and red blood cell concentration monitoring instrument and method | |
| CN113951828A (en) | MCI screening method and system based on visual work memory task | |
| CN103476337A (en) | Biophotonic measurement device, biophotonic measurement device operating method, and biophotonic measurement data analysis and display method | |
| US7330745B2 (en) | Living body photometric device | |
| Manganas et al. | A comparative survey on simultaneous EEG-fMRI methodologies | |
| Solovey et al. | Brain Sensing with fNIRS in the Car | |
| KR101961148B1 (en) | An Simplified Apparatus Acquiring Material For Concealed Information Test | |
| JP3954597B6 (en) | Biological optical measurement device and optical measurement method | |
| TWI582727B (en) | Adaptive parameter prediction method and device for physiological reaction | |
| JP7246716B2 (en) | Brain function state measuring device and program for determining brain function state |
Legal Events
| Date | Code | Title | Description |
|---|---|---|---|
| C06 | Publication | ||
| PB01 | Publication | ||
| C10 | Entry into substantive examination | ||
| SE01 | Entry into force of request for substantive examination | ||
| C14 | Grant of patent or utility model | ||
| GR01 | Patent grant | ||
| CF01 | Termination of patent right due to non-payment of annual fee | Granted publication date:20110615 Termination date:20130119 | |
| CF01 | Termination of patent right due to non-payment of annual fee |