CN1668913A - Methods for evaluating biofilms - Google Patents
Methods for evaluating biofilmsDownload PDFInfo
- Publication number
- CN1668913A CN1668913ACNA03816745XACN03816745ACN1668913ACN 1668913 ACN1668913 ACN 1668913ACN A03816745X ACNA03816745X ACN A03816745XACN 03816745 ACN03816745 ACN 03816745ACN 1668913 ACN1668913 ACN 1668913A
- Authority
- CN
- China
- Prior art keywords
- biofilm
- image
- electromagnetic radiation
- image data
- development
- Prior art date
- Legal status (The legal status is an assumption and is not a legal conclusion. Google has not performed a legal analysis and makes no representation as to the accuracy of the status listed.)
- Pending
Links
Images


Classifications
- G—PHYSICS
- G01—MEASURING; TESTING
- G01N—INVESTIGATING OR ANALYSING MATERIALS BY DETERMINING THEIR CHEMICAL OR PHYSICAL PROPERTIES
- G01N21/00—Investigating or analysing materials by the use of optical means, i.e. using sub-millimetre waves, infrared, visible or ultraviolet light
- G01N21/62—Systems in which the material investigated is excited whereby it emits light or causes a change in wavelength of the incident light
- G01N21/63—Systems in which the material investigated is excited whereby it emits light or causes a change in wavelength of the incident light optically excited
- G01N21/64—Fluorescence; Phosphorescence
- G01N21/645—Specially adapted constructive features of fluorimeters
- G01N21/6452—Individual samples arranged in a regular 2D-array, e.g. multiwell plates
- G—PHYSICS
- G01—MEASURING; TESTING
- G01N—INVESTIGATING OR ANALYSING MATERIALS BY DETERMINING THEIR CHEMICAL OR PHYSICAL PROPERTIES
- G01N21/00—Investigating or analysing materials by the use of optical means, i.e. using sub-millimetre waves, infrared, visible or ultraviolet light
- G01N21/62—Systems in which the material investigated is excited whereby it emits light or causes a change in wavelength of the incident light
- G01N21/63—Systems in which the material investigated is excited whereby it emits light or causes a change in wavelength of the incident light optically excited
- G01N21/64—Fluorescence; Phosphorescence
- G01N21/6428—Measuring fluorescence of fluorescent products of reactions or of fluorochrome labelled reactive substances, e.g. measuring quenching effects, using measuring "optrodes"
- G—PHYSICS
- G01—MEASURING; TESTING
- G01N—INVESTIGATING OR ANALYSING MATERIALS BY DETERMINING THEIR CHEMICAL OR PHYSICAL PROPERTIES
- G01N21/00—Investigating or analysing materials by the use of optical means, i.e. using sub-millimetre waves, infrared, visible or ultraviolet light
- G01N21/62—Systems in which the material investigated is excited whereby it emits light or causes a change in wavelength of the incident light
- G01N21/63—Systems in which the material investigated is excited whereby it emits light or causes a change in wavelength of the incident light optically excited
- G01N21/64—Fluorescence; Phosphorescence
- G01N21/645—Specially adapted constructive features of fluorimeters
- G01N21/6456—Spatial resolved fluorescence measurements; Imaging
- G01N21/6458—Fluorescence microscopy
- G—PHYSICS
- G02—OPTICS
- G02B—OPTICAL ELEMENTS, SYSTEMS OR APPARATUS
- G02B21/00—Microscopes
- G—PHYSICS
- G02—OPTICS
- G02B—OPTICAL ELEMENTS, SYSTEMS OR APPARATUS
- G02B21/00—Microscopes
- G02B21/0004—Microscopes specially adapted for specific applications
- G02B21/002—Scanning microscopes
- G02B21/0024—Confocal scanning microscopes (CSOMs) or confocal "macroscopes"; Accessories which are not restricted to use with CSOMs, e.g. sample holders
- G02B21/0052—Optical details of the image generation
- G02B21/0076—Optical details of the image generation arrangements using fluorescence or luminescence
- G—PHYSICS
- G02—OPTICS
- G02B—OPTICAL ELEMENTS, SYSTEMS OR APPARATUS
- G02B21/00—Microscopes
- G02B21/0004—Microscopes specially adapted for specific applications
- G02B21/002—Scanning microscopes
- G02B21/0024—Confocal scanning microscopes (CSOMs) or confocal "macroscopes"; Accessories which are not restricted to use with CSOMs, e.g. sample holders
- G02B21/008—Details of detection or image processing, including general computer control
- G—PHYSICS
- G02—OPTICS
- G02B—OPTICAL ELEMENTS, SYSTEMS OR APPARATUS
- G02B21/00—Microscopes
- G02B21/24—Base structure
- G02B21/241—Devices for focusing
- G02B21/245—Devices for focusing using auxiliary sources, detectors
- G—PHYSICS
- G01—MEASURING; TESTING
- G01N—INVESTIGATING OR ANALYSING MATERIALS BY DETERMINING THEIR CHEMICAL OR PHYSICAL PROPERTIES
- G01N21/00—Investigating or analysing materials by the use of optical means, i.e. using sub-millimetre waves, infrared, visible or ultraviolet light
- G01N21/62—Systems in which the material investigated is excited whereby it emits light or causes a change in wavelength of the incident light
- G01N21/63—Systems in which the material investigated is excited whereby it emits light or causes a change in wavelength of the incident light optically excited
- G01N21/64—Fluorescence; Phosphorescence
- G01N2021/6417—Spectrofluorimetric devices
- G01N2021/6419—Excitation at two or more wavelengths
- G—PHYSICS
- G01—MEASURING; TESTING
- G01N—INVESTIGATING OR ANALYSING MATERIALS BY DETERMINING THEIR CHEMICAL OR PHYSICAL PROPERTIES
- G01N21/00—Investigating or analysing materials by the use of optical means, i.e. using sub-millimetre waves, infrared, visible or ultraviolet light
- G01N21/62—Systems in which the material investigated is excited whereby it emits light or causes a change in wavelength of the incident light
- G01N21/63—Systems in which the material investigated is excited whereby it emits light or causes a change in wavelength of the incident light optically excited
- G01N21/64—Fluorescence; Phosphorescence
- G01N2021/6417—Spectrofluorimetric devices
- G01N2021/6421—Measuring at two or more wavelengths
Landscapes
- Physics & Mathematics (AREA)
- Health & Medical Sciences (AREA)
- Chemical & Material Sciences (AREA)
- Analytical Chemistry (AREA)
- General Physics & Mathematics (AREA)
- Optics & Photonics (AREA)
- Immunology (AREA)
- Nuclear Medicine, Radiotherapy & Molecular Imaging (AREA)
- Life Sciences & Earth Sciences (AREA)
- Biochemistry (AREA)
- General Health & Medical Sciences (AREA)
- Pathology (AREA)
- Computer Vision & Pattern Recognition (AREA)
- General Engineering & Computer Science (AREA)
- Engineering & Computer Science (AREA)
- Chemical Kinetics & Catalysis (AREA)
- Investigating, Analyzing Materials By Fluorescence Or Luminescence (AREA)
- Measuring Or Testing Involving Enzymes Or Micro-Organisms (AREA)
Abstract
Description
Translated fromChinese技术领域technical field
本发明涉及一种采用共焦成像系统自动测量微生物生物膜的发育的方法,以及涉及确定测试化学物质对微生物基因表达和生物膜发育的影响的方法。The present invention relates to a method for automatically measuring the development of microbial biofilms using a confocal imaging system, and to a method for determining the effect of test chemicals on microbial gene expression and biofilm development.
本发明的背景技术Background Art of the Invention
微生物生物膜由附着于表面或者界面并且通常嵌入细胞外多聚糖基质的同类或异类微生物群体组成(Costerton等,1995,AnnualReview of Microbiology,41,435-464)。这些生物膜可以在几乎任何湿的表面上迅速形成,代表了该环境中微生物集落的正常模式(Wood等,2000,Journal of Dental Research,79,21-27)。尽管生物膜的发育通常与细菌有关,但是许多微生物包括真菌和藻类也可以形成生物膜。Microbial biofilms consist of homogeneous or heterogeneous populations of microorganisms attached to surfaces or interfaces and often embedded in an extracellular polysaccharide matrix (Costerton et al., 1995, Annual Review of Microbiology, 41, 435-464). These biofilms can form rapidly on almost any wet surface and represent the normal pattern of microbial colonization in this environment (Wood et al., 2000, Journal of Dental Research, 79, 21-27). Although the development of biofilms is usually associated with bacteria, many microorganisms including fungi and algae can also form biofilms.
在工业中,微生物生物膜引发了普遍存在的问题,污染机器、堵塞管道、附着于水上设备和运输船只的船体。生物膜在医药领域也是较为严重的问题,大量的人类感染均涉及生物膜,例如龋齿、牙周炎以及囊性纤维化肺炎(Costerton等,1999,Science,284,1318-1322)。由于医疗设备污染而引发的感染通常是由以生物膜形式存在的细菌所导致的(Gorman等,1994,Epidemiological Journal,112,551-559)。In industry, microbial biofilms cause widespread problems, fouling machinery, clogging pipes, and adhering to the hulls of aquatic equipment and transport vessels. Biofilm is also a serious problem in the field of medicine. A large number of human infections involve biofilm, such as dental caries, periodontitis, and cystic fibrosis pneumonia (Costerton et al., 1999, Science, 284, 1318-1322). Infections due to contamination of medical equipment are usually caused by bacteria in the form of biofilms (Gorman et al., 1994, Epidemiological Journal, 112, 551-559).
与自由游动的浮游细菌相比,生物膜中的细菌通常表现为显著不同的表型,其在工业和医学上可以引发严重的问题。其中最重要的是,这些细菌对抗生素治疗的耐药性增加。Soukos等(PharmaceuticalResearch,2000,17,405-409)报道了,与相同种类的浮游细胞相比,生物膜内的细菌对抗生素治疗的敏感性低1500倍。Bacteria in biofilms often display significantly different phenotypes compared to free-swimming planktonic bacteria, which can cause serious problems in industry and medicine. Foremost among these is the increased resistance of these bacteria to antibiotic treatment. Soukos et al. (Pharmaceutical Research, 2000, 17, 405-409) reported that bacteria within biofilms were 1500-fold less sensitive to antibiotic treatment compared to planktonic cells of the same species.
近来的研究表明,在生成细胞外基质和形成生物膜的过程中所涉及的微生物和活性基因持续分泌被称为“定额传感信号”的分子。目前人们已经着手生产这些天然产生的信号的分子模拟物,使之与微生物受体位点结合,从而控制生物膜的形成(Costerton & Stewart,2001,Scientific American,7月,61-65)。Recent studies have shown that microbes and active genes involved in the production of extracellular matrix and biofilm formation continuously secrete molecules known as "quota-sensing signals." Efforts have been made to produce molecular mimics of these naturally occurring signals that bind to microbial receptor sites to control biofilm formation (Costerton & Stewart, 2001, Scientific American, July, 61-65).
因此,控制微生物生物膜向多种工业提出了重大的挑战,包括食品、卫生、消费品、工程和制药工业。在最近十年,人们已经在该问题上做了大量的工作,但是由于缺乏适当的筛选检测,发现和研究出有效的抗生物膜的新型抗微生物制剂的尝试受到了阻碍。尽管可以通过高通量的筛选技术很容易地对浮游微生物进行检测,但是,就生物膜对抑制剂、定额传感信号模拟物或拮抗剂的敏感性的生成和评价需要花费大量的劳动和时间,而且在技术上存在着困难。Controlling microbial biofilms thus presents a significant challenge to a variety of industries, including food, hygiene, consumer product, engineering and pharmaceutical industries. In the last decade, considerable work has been done on this issue, but attempts to discover and develop new antimicrobial agents that are effective against biofilms have been hampered by the lack of appropriate screening assays. Although planktonic microorganisms can be easily detected by high-throughput screening techniques, generation and evaluation of biofilm susceptibility to inhibitors, ration sensing signal mimics, or antagonists is labor-intensive and time-intensive , and there are technical difficulties.
确定一种因素对生物膜生长和发育的影响的检测或方法必须涉及对生物膜的发育和结构的评价。由于电子显微技术具有高的分辨率,其通常被选择作为研究生物膜的组成和结构的方法(Listgarten,1976,Journal of Periodontology,47,1-18)。但是,该技术是非常耗时的,其制备过程可能导致结构变形,而且不适用于高通量筛选。An assay or method to determine the effect of a factor on biofilm growth and development must involve the evaluation of biofilm development and structure. Electron microscopy is often chosen as the method of choice to study the composition and structure of biofilms due to its high resolution (Listgarten, 1976, Journal of Periodontology, 47, 1-18). However, this technique is very time-consuming, its preparation process may lead to structural deformation, and it is not suitable for high-throughput screening.
激光扫描共焦显微技术(LSCM)的出现解决了大量的上述与电子显微技术有关的问题,所述激光扫描共焦显微技术能够对自然状态的生物膜结构进行研究,不需要脱水、固定或染色。LSCM的光截面性能可以在整个生物膜上沿着不断增加的深度得到非常薄的光截面(近似0.3μm),而不会产生由于焦点没有对准而导致的模糊。自发荧光的分子(例如,绿色荧光蛋白)或荧光标记的探针被激发,通过光电倍增管检测所得到的荧光,产生数字图像。所述数字化数据可以被重新组合得到有关结构的三维信息。目前,共焦显微技术已经被用于研究生物膜的结构(Wood等,2000,Journal of Dental Research 79,21-27)、生理学和生物化学(Palmet & Sternberg,1999,Current opinionin biotechnology 10,263-268)。但是,上述研究需要花费大量的时间,其具有高度的特异性,只能对一种或两种特定的生物膜结构进行研究。A number of the aforementioned problems associated with electron microscopy have been resolved with the advent of laser scanning confocal microscopy (LSCM), which enables the study of biofilm structures in their natural state, without the need for dehydration, fixation or staining. The optical cross-section performance of the LSCM allows very thin optical cross-sections (approximately 0.3 μm) along increasing depths throughout the biofilm without blurring due to misalignment. Autofluorescent molecules (eg, green fluorescent protein) or fluorescently labeled probes are excited and the resulting fluorescence is detected by a photomultiplier tube, generating a digital image. The digitized data can be recombined to obtain three-dimensional information about the structure. At present, confocal microscopy has been used to study the structure of biological membranes (Wood et al., 2000, Journal of Dental Research 79, 21-27), physiology and biochemistry (Palmet & Sternberg, 1999, Current opinion in
虽然LSCM提供了一种优异的研究生物膜形态学、结构和组成的工具,但是由于其成像和数据获取过程非常缓慢,因此,其并不是一个显而易见的用作高通量筛选平台的选择。Kuehn等(Applied andEnvironmental Microbiology,1998,64,4115-4172)报道了一种分析生物膜的“自动”LSCM,所述发明的核心是用于半自动图像分析的计算机程序。所述系统基于点扫描检测方法,并涉及需要用户输入/干预的“离线”半自动图像分析。这些数据获取和分析方法以及采用“玻璃液流单元”用于生物膜的生长严重限制了该方法在自动化和高通量筛选上的应用。美国专利6326190中公开了其它评价试验因素对生物膜的影响的筛选方法,在该申请中,采用了大量的方法例如菌落计数和活体染色来确定生物膜的生长。但是,需要特别注意的是,在采用共焦显微技术进行自动检测的问题较为突出。While LSCM provides an excellent tool for studying biofilm morphology, structure, and composition, it is not an obvious choice for use as a high-throughput screening platform due to its slow imaging and data acquisition processes. Kuehn et al. (Applied and Environmental Microbiology, 1998, 64, 4115-4172) reported an "automated" LSCM for the analysis of biofilms, the core of the invention being a computer program for semi-automated image analysis. The system is based on a point-scan detection method and involves "off-line" semi-automatic image analysis requiring user input/intervention. These data acquisition and analysis methods and the use of "glass flow cells" for biofilm growth severely limit the application of this method for automated and high-throughput screening. Other screening methods for evaluating the effect of test factors on biofilms are disclosed in US Patent 6,326,190. In this application, a variety of methods such as colony counting and vital staining are used to determine the growth of biofilms. However, special attention needs to be paid to the problem of automatic detection using confocal microscopy.
本发明解决了上述与采用基于LSCM方法有关的问题,所述方法用于分析生物膜的发育,可以进行自动检测。而且,本发明的方法提供了一个平台,对生物膜生长和发育的新型调节剂进行高通量筛选。与基于文献(例如WO9601438)所描述的图像内容分析的自动聚焦方法相反,本发明采用了位置传感分析。The present invention solves the above-mentioned problems associated with the use of LSCM-based methods for analyzing the development of biofilms, allowing automatic detection. Furthermore, the methods of the present invention provide a platform for high-throughput screening of novel modulators of biofilm growth and development. In contrast to autofocus methods based on image content analysis described in literature (eg WO9601438), the present invention employs position-sensing analysis.
WO9947963中公开了一种“共焦显微成像系统”,采用线扫描共焦成像系统和辅助的数据处理程序,在细胞提取物、细胞或高级生物体的组织上进行各种检测,从而鉴别有助于疾病诊断和治疗的药物制剂。所述成像系统可以对单个细胞和群体进行多参数荧光成像,从而可以非常快速地进行化合物筛选。所述系统能够以高分辨率确定荧光团的存在。但是,该申请中没有公开任何有关使用该系统表征微生物群体、生成其三维图像或分析生物膜的发育的内容。而且,WO9947963中描述的图像分析运算法则仅仅适合于分析来自单个平面的数据,而不适用于来自多个平面的数据。WO9947963 discloses a "confocal microscopic imaging system", which uses a line-scanning confocal imaging system and an auxiliary data processing program to perform various tests on cell extracts, cells or tissues of higher organisms, thereby identifying helpful Pharmaceutical preparations for disease diagnosis and treatment. The imaging system enables multiparametric fluorescence imaging of single cells and populations, allowing for very rapid compound screening. The system is capable of determining the presence of fluorophores with high resolution. However, the application does not disclose anything about using the system to characterize microbial populations, generate three-dimensional images of them, or analyze the development of biofilms. Furthermore, the image analysis algorithms described in WO9947963 are only suitable for analyzing data from a single plane, not data from multiple planes.
本申请人发现共焦成像系统,例如WO9947963中所描述的,当与本发明的图像分析方法结合使用时,可以用于表征生物膜,并可作为对调节生物膜发育的化合物进行高通量筛选的平台。Goodyer等人于2001年在Society for Biomolecular Screening,7th AnnualConference and Exhibition,巴尔的摩,USA Screening andsignaling events in live cells using novel GFP redistributionassays中报道了IN Cell Analyzer及其在高通量筛选中的应用。The applicants have discovered that a confocal imaging system, such as that described in WO9947963, when used in conjunction with the image analysis method of the present invention, can be used to characterize biofilms and as a high-throughput screen for compounds that modulate biofilm development platform. Goodyer et al reported IN Cell Analyzer and its application in high-throughput screening in Society for Biomolecular Screening,7th Annual Conference and Exhibition, Baltimore, USA Screening and signaling events in live cells using novel GFP redistribution assays in 2001.
本发明的简要描述Brief description of the invention
根据本发明的第一方面,提供了一种采用共焦成像系统在多表面上测量生物膜发育的自动方法,所述共焦成像系统包括:According to a first aspect of the present invention there is provided an automated method for measuring biofilm development on multiple surfaces using a confocal imaging system comprising:
a)形成包括一个或多个波长的电磁辐射光束的装置;a) devices for forming a beam of electromagnetic radiation comprising one or more wavelengths;
b)将所述光束指向并聚焦于生物膜的一个或多个平面的装置;b) means for directing and focusing said light beam on one or more planes of the biofilm;
c)检测由所述生物膜发出的电磁辐射的检测装置;以及c) detection means for detecting electromagnetic radiation emitted by said biofilm; and
d)用所述电磁辐射在多个平面上扫描生物膜的扫描装置,d) a scanning device for scanning biofilms in multiple planes with said electromagnetic radiation,
所述方法包括以下步骤:The method comprises the steps of:
i)在多个表面上生长生物膜;i) grow biofilms on multiple surfaces;
ii)用电磁辐射在多个平面上扫描生物膜,检测生物膜内一个或多个荧光部分的存在,从而生成多个图像;以及ii) scanning the biofilm with electromagnetic radiation in multiple planes to detect the presence of one or more fluorescent moieties within the biofilm, thereby generating multiple images; and
iii)在计算机软件的控制下通过数据处理系统分析所述图像,从而确定生物膜的结构。iii) analyzing said image by a data processing system under the control of computer software to determine the structure of the biofilm.
生物膜是对周围环境产生响应的动态结构(Watnick & Kolter,2000,Journal of Bacteriology,182,2675-2679)。在本发明上下文中,当词语“发育”用于生物膜时,其用于描述生物膜的生长、停滞或退化。Biofilms are dynamic structures that respond to their surroundings (Watnick & Kolter, 2000, Journal of Bacteriology, 182, 2675-2679). In the context of the present invention, when the word "development" is used for biofilms, it is used to describe the growth, stagnation or degeneration of biofilms.
在优选实施方式中,提高数据获取速度的装置为:In a preferred embodiment, the device for improving the data acquisition speed is:
a)光束形成装置,用于生成延长的包括一个或多个波长的电磁辐射光束,所述光束横向延伸至辐射传播所沿的光轴;a) beam forming means for generating an elongated beam of electromagnetic radiation comprising one or more wavelengths, said beam extending transversely to the optical axis along which the radiation propagates;
b)指向和聚焦装置,将所述延长的光束聚焦至位于第一平面内的第一延长区域上,所述生物膜位于第一平面内,并将生物膜发出的电磁辐射指向一个或多个第二延长区域,其中每个第二延长区域位于与第一平面共轭的不同的第二个平面上。b) pointing and focusing means for focusing the elongated light beam onto a first elongated region in a first plane in which the biofilm is located and directing the electromagnetic radiation emitted by the biofilm to one or more second elongated regions, wherein each second elongated region is located on a different second plane that is conjugate to the first plane.
c)在至少一个第二共轭平面,或在与至少一个第二共轭平面共轭的第三平面内,检测装置包括一个检测元件的矩形阵列,所述对象发出的电磁辐射与其重合;以及c) in at least one second conjugate plane, or in a third plane conjugate to at least one second conjugate plane, the detection means comprises a rectangular array of detection elements, with which electromagnetic radiation emitted by said object coincides; and
d)扫描装置,相对于所述生物膜移动延长光束或相对于延长光束移动生物膜从而对生物膜进行扫描,发出的电磁辐射传送至检测元件的矩形阵列,并通过检测元件转化为多个电信号,所述信号代表了发出的与扫描同步的电磁辐射。d) a scanning device that scans the biofilm by moving an elongated beam relative to the biofilm or moving the biofilm relative to the elongated beam, the emitted electromagnetic radiation is transmitted to a rectangular array of detection elements, and is converted by the detection elements into a plurality of electrical A signal representing electromagnetic radiation emitted synchronously with the scan.
优选地,在进行图像分析之前,所述方法还另外包括恢复每个图像的步骤。图像恢复是指为了提高图像质量或者获得不能从所观察的图像轻易得到的信息而对模糊的具有噪声的观察图像进行恢复的问题。影响空间分辨率的因素主要是发出的光子的散射和由于成像系统导致的偏差和变形。如果需成像的对象相对于光源至准直器的距离较小,所述退化现象可以认为是近似漂移恒定的,并且,忽略噪声,可以通过未变形图像和成像系统的转移函数之间的卷积过程进行模拟。文献中报道了许多图像恢复的方法。例如,Wiener滤波器、基于子波的规则化、监督去卷积方法、迭代盲去卷积法等。不同方法之间的比较参见例如Lixin Shen,2002,Journal of Electronic Imaging,11,5-10或Mignotte等,2002,Journal of Electronic Imaging(2002),11,11-24。Preferably, the method additionally comprises the step of restoring each image prior to image analysis. Image restoration refers to the problem of restoring blurred and noisy observed images in order to improve image quality or obtain information that cannot be easily obtained from the observed images. The factors affecting the spatial resolution are mainly the scattering of the emitted photons and the aberrations and distortions due to the imaging system. If the object to be imaged is small relative to the distance from the light source to the collimator, the degradation phenomenon can be considered to be approximately drift-constant, and, ignoring the noise, can be obtained by the convolution between the undeformed image and the transfer function of the imaging system The process is simulated. Many methods for image restoration have been reported in the literature. For example, Wiener filters, wavelet-based regularization, supervised deconvolution methods, iterative blind deconvolution methods, etc. For a comparison between different methods see for example Lixin Shen, 2002, Journal of Electronic Imaging, 11, 5-10 or Mignotte et al., 2002, Journal of Electronic Imaging (2002), 11, 11-24.
适当地,所生成的电磁辐射光束包括一个或多个在350-700nm范围内的波长。波长的优选范围为354-374nm,403-423nm,478-498nm,560-580nm,637-657nm和680-700nm。优选波长包括364nm,413nm,488nm,570nm,647nm和690nm。Suitably, the generated beam of electromagnetic radiation comprises one or more wavelengths in the range 350-700nm. Preferred ranges of wavelengths are 354-374 nm, 403-423 nm, 478-498 nm, 560-580 nm, 637-657 nm and 680-700 nm. Preferred wavelengths include 364nm, 413nm, 488nm, 570nm, 647nm and 690nm.
适当地,所述荧光部分为生物膜内微生物的内在特征。Suitably, said fluorescent moiety is an intrinsic characteristic of microorganisms within the biofilm.
优选地,所述荧光部分是生物膜内微生物所表达的基因的产物。例如,所述微生物可以通过基因转化从而以组成型或诱导性方式表达所述基因。更优选地,所述基因可以含有已经被改变从而优化表达微生物的荧光部分的密码子。Preferably, the fluorescent moiety is the product of a gene expressed by microorganisms within the biofilm. For example, the microorganism can be transformed to express the gene constitutively or inducibly. More preferably, the gene may contain codons that have been altered to optimize expression of the fluorescent moiety of the microorganism.
优选地,所述基因编码荧光蛋白。已经从多种生物体中分离出荧光蛋白和生色蛋白的荧光蛋白衍生物,包括AequoiraVictoria,Anemonia种属,例如A.majano和A.sulcata,Renilla种属,Ptilosarcus种属,Discosoma种属,Claularia种属,Dendronephthyla种属,Ricordia种属,Scolymia种属,Zoanthus种属,Montastraea种属,Heteractis种属,Conylactic种属和Goniopara种属。Preferably, the gene encodes a fluorescent protein. Fluorescent protein derivatives of fluorescent proteins and chromogenic proteins have been isolated from a variety of organisms, including AequoiraVictoria, Anemonia species such as A.majano and A.sulcata, Renilla species, Ptilosarcus species, Discosoma species, Claularia species, Dendronephthyla species, Ricordia species, Scolymia species, Zoanthus species, Montastraea species, Heteractis species, Conylactic species and Goniopara species.
衍生自Aequorea victoria的绿色荧光蛋白(GFP)的应用已经使研究工作革命性地进展至细胞和分子生物过程。然而,由于野生型(天然)GFP(wtGFP)的荧光特性,其用作细胞指针并不是很理想,人们在制备不同的GFP变异形式方面作了很大的努力,所述变异形式的性质更加适合用作细胞内指针(Heim等,1994,Proceedings of theNational Academy of Sciences(USA),91,12501;Ehrig等,1995,FEBS Letters,367,163-6;WO9627675;Crameri,A等,1996,NatureBiotechnology,14,315-9;US6172188;Cormack,B.P.等,1996,Gene,1973,33-38;US6194548;US6077707以及英国专利申请号0109858.1(Amersham Pharmacia Biotech UK Ltd))。英国专利申请No.0109858.1中公开的优选实施方式包括选自由以下构成的组的GFP衍生物:The application of green fluorescent protein (GFP) derived from Aequorea victoria has revolutionized research into cellular and molecular biological processes. However, due to the fluorescent properties of wild-type (native) GFP (wtGFP), which is not ideal for use as a cell pointer, great efforts have been made to produce different variants of GFP with properties more suitable for Used as an intracellular pointer (Heim et al., 1994, Proceedings of the National Academy of Sciences (USA), 91, 12501; Ehrig et al., 1995, FEBS Letters, 367, 163-6; WO9627675; Crameri, A et al., 1996, Nature Biotechnology, 14,315-9; US6172188; Cormack, B.P. et al., 1996, Gene, 1973, 33-38; US6194548; US6077707 and UK Patent Application No. 0109858.1 (Amersham Pharmacia Biotech UK Ltd)). A preferred embodiment disclosed in UK Patent Application No. 0109858.1 comprises a GFP derivative selected from the group consisting of:
F64L-V163A-E222G-GFP,F64L-S175G-E222G-GFP,F64L-S65T-S175G-GFP以及F64L-S65T-V163A-GFP。F64L-V163A-E222G-GFP, F64L-S175G-E222G-GFP, F64L-S65T-S175G-GFP, and F64L-S65T-V163A-GFP.
优选地,所述荧光蛋白为具有一个或多个突变的经修饰的GFP,所述突变选自由以下构成的组:Y66H,Y66W,Y66F,S65T,S65A,V68L,Q69K,Q69M,S72A,T203I,E222G,V163A,I167T,S175G,F99S,M153T,V163A,F64L,Y145F,N149K,T203Y,T203Y,T203H,S202F和L236R。最优选地,所述荧光蛋白为具有三个突变的经修饰的GFP,所述突变选自由以下构成的组,F64L-V163A-E222G,F64L-S175G-E222G,F64L-S65T-S175G以及F64L-S65T-V163。Preferably, the fluorescent protein is a modified GFP with one or more mutations selected from the group consisting of: Y66H, Y66W, Y66F, S65T, S65A, V68L, Q69K, Q69M, S72A, T203I, E222G, V163A, I167T, S175G, F99S, M153T, V163A, F64L, Y145F, N149K, T203Y, T203Y, T203H, S202F and L236R. Most preferably, the fluorescent protein is a modified GFP having three mutations selected from the group consisting of F64L-V163A-E222G, F64L-S175G-E222G, F64L-S65T-S175G and F64L-S65T -V163.
优选地,所述荧光部分为能够监测生物膜内环境变化或酶活性的生物传感器。例如,所述部分可以是荧光生物传感蛋白,其对生物膜内PH的改变产生响应(例如,Llopisis等,1998,Proceedings of theNational Academy of Sciences(USA)95,6803-6808)或对特定离子浓度敏感,例如钙离子。Preferably, the fluorescent moiety is a biosensor capable of monitoring environmental changes or enzyme activities within the biofilm. For example, the moiety may be a fluorescent biosensor protein that responds to changes in pH within the biofilm (e.g., Llopisis et al., 1998, Proceedings of the National Academy of Sciences (USA) 95, 6803-6808) or to specific ion Concentration sensitive, such as calcium ions.
可选择地,所述荧光部分由酶对化合物的作用而产生。优选地,所述酶选自由以下构成的组:β-半乳糖糖苷酶,硝基还原酶,碱性磷酸酶和β-内酰胺酶。所述酶可以由微生物天然表达或者是微生物经过遗传转化而以诱导型或组成型方式表达的酶。Alternatively, the fluorescent moiety is produced by the action of an enzyme on the compound. Preferably, the enzyme is selected from the group consisting of β-galactosidase, nitroreductase, alkaline phosphatase and β-lactamase. The enzyme may be expressed naturally by the microorganism or expressed in an inducible or constitutive manner through genetic transformation of the microorganism.
在优选实施方式中,所述方法另外还包括在进行检测步骤之前将荧光化合物添加至生物膜。In a preferred embodiment, the method additionally comprises adding a fluorescent compound to the biofilm prior to performing the detecting step.
优选地,所述荧光化合物选自由以下构成的组:Hoechst 33342,Cy2,Cy3,Cy5,CytoCy5,CypHer,香豆素,FITC,DAPI,Alexa 633DRAQ5,Alexa 488,吖啶酮,喹吖啶酮,荧光标记蛋白质,荧光标记凝集素和荧光标记抗体。“吖啶酮”和“喹吖啶酮”是指WO02099424和02099432中分别公开的荧光化合物。可选择地,在进行检测步骤之前,可以将未结合的荧光化合物从每个容器中除去。Preferably, the fluorescent compound is selected from the group consisting of Hoechst 33342, Cy2, Cy3, Cy5, CytoCy5, CypHer, Coumarin, FITC, DAPI, Alexa 633DRAQ5, Alexa 488, acridone, quinacridone, Fluorescently labeled proteins, fluorescently labeled lectins, and fluorescently labeled antibodies. "Acridone" and "quinacridone" refer to fluorescent compounds disclosed in WO02099424 and 02099432, respectively. Optionally, unbound fluorescent compound can be removed from each container prior to performing the detection step.
优选地,所述荧光化合物可以用于监测生物膜内环境的变化。因此,例如,微生物生物膜的氧化还原电势和PH受到局部环境变化的影响,所述变化可以通过本发明进行测量。pH敏感的染料,例如CyDye“CypHer”(参见Amersham Biosciences,基准PA15405),可用于确定生物膜内pH的变化。例如,与Cy5相比,CypHer在pH5.0时发出95%的荧光,在pH7.4发出5%荧光,从而可以定量测量生物膜内局部PH的变化。Preferably, the fluorescent compound can be used to monitor changes in the environment within the biofilm. Thus, for example, the redox potential and pH of microbial biofilms are affected by local environmental changes that can be measured by the present invention. pH-sensitive dyes, such as CyDye "CypHer" (see Amersham Biosciences, reference PA15405), can be used to determine changes in pH within biofilms. For example, CypHer fluoresces 95% at pH 5.0 and 5% at pH 7.4 compared to Cy5, allowing quantitative measurement of local pH changes within biofilms.
可选择地,所述荧光化合物可用于测量生物膜内或周围的化学物质的浓度,例如氧或钙的浓度,或特定蛋白质或核酸的浓度。Alternatively, the fluorescent compound can be used to measure the concentration of chemical species in or around the biofilm, such as the concentration of oxygen or calcium, or the concentration of specific proteins or nucleic acids.
优选地,所述表面为容器形式。更优选地,所述容器为微滴定板。所述微滴定板可以包括24、96、384个或更高密度的孔,例如864或1536个孔。优选地,所述微滴定板具有透明的底部,从而可以通过底部对生物膜进行成像(Gilbert等,2001,Journal of AppliedMicrobiology,91,248-254)。Preferably, said surface is in the form of a container. More preferably, the container is a microtiter plate. The microtiter plate may comprise 24, 96, 384 or higher densities of wells, such as 864 or 1536 wells. Preferably, the microtiter plate has a transparent bottom so that biofilms can be imaged through the bottom (Gilbert et al., 2001, Journal of Applied Microbiology, 91, 248-254).
适当地,通过对生物膜进行光学和共焦切割并随后进行3D体积分析,所述方法能够确定生物膜内的微生物集落的大小。Suitably, the method enables determination of the size of microbial colonies within a biofilm by optical and confocal sectioning of the biofilm followed by 3D volumetric analysis.
适当地,通过对生物膜进行光学和共焦切割并随后进行3D体积分析,所述方法能够确定生物膜的3D结构。Suitably, the method enables determination of the 3D structure of a biofilm by optical and confocal sectioning of the biofilm followed by 3D volumetric analysis.
适当地,通过对生物膜进行光学和共焦切割并随后进行3D体积分析,所述方法能够确定生物膜内微生物集落之间的距离分布。Suitably, by optical and confocal sectioning of biofilms followed by 3D volumetric analysis, the method enables the determination of the distance distribution between microbial colonies within biofilms.
适当地,所述方法能够确定生物膜结构内微生物集落的取向。所述集落的取向可以受外力的影响,例如液流、重力、电场等。Suitably, the method is capable of determining the orientation of microbial colonies within a biofilm structure. The orientation of the colony can be influenced by external forces, such as liquid flow, gravity, electric field, and the like.
适当地,所述方法能够确定生物膜结构内任意通道的存在和大小。上述通道为营养物进入生物膜提供了进入路径,并为有毒废物离开生物膜提供了出口路径。Suitably, the method is capable of determining the presence and size of any channels within the biofilm structure. The aforementioned channels provide an entry path for nutrients to enter the biofilm and an exit path for toxic waste to leave the biofilm.
因此,例如,从附图16A,C和D中可以看出,可以很容易地确定生物膜结构内的通道,其中黑色区域代表通道。优选地,所述方法能够确定生物膜结构内通道与其它通道之间的连接性,从而确定通道网络。更优选地,所述方法能够确定所述通道网络的分形维数。Thus, channels within biofilm structures can be readily identified, for example, as can be seen in Figures 16A, C and D, where black areas represent channels. Preferably, the method is capable of determining connectivity between channels and other channels within a biofilm structure, thereby defining a channel network. More preferably, said method is capable of determining the fractal dimension of said channel network.
生物膜可以被认为是一种多孔介质,其中不同分子可以扩散进入位于微生物集落之间的所述通道网络中。将网络的几何结构和扩散通过网络的性能联系起来是非常重要的,这是因为其可以非常容易地指示何种营养物可以进入生物膜,是氧气、抗生素还是其它分子。多孔介质是一种随机多重连接的材料,其中随机地封闭通道。这些通道所占据的自由空间部分称为孔隙。所述通道网络的Darcy渗透率等同于电阻网络的导电率;其描述了液体流过所述网络的容易程度。在孔隙率高于被称为临界孔隙率Ccr的值时,在网络中存在一连续通路,分子可以从网络的一端扩散至另一端。如果通道的分布是随机的,而且可以忽略长程相关性时,渗透率遵循接近于Ccr的普通指数定律,其不依赖于微观细节、连接的性质等。液体在网络中的流动与网络的渗透率相关,因此,最终依赖于网络的总的几何结构。在很多情况下,网络的几何结构可以描述为一个分形,可以为网络限定分形维数。在临界值时,包括在半径为R的球体内的通道的平均质量与RD成比例,其中D<3。因此,网络可以被认为是一多孔结构,与通常的三维固体相比,其填充三维空间不够充分,这样所述网络具有分形维数,其低于通常的欧几里德维数。总而言之,确定分形维数给出了关于网络几何形状的描述,因此,可以得到有关生物膜孔隙率的指示。具体描述参见例如Gouyet,Physique et Structure Fractales Publisher Mason,1992,第三章。Biofilms can be considered as a porous medium in which different molecules can diffuse into the network of channels located between microbial colonies. It is important to correlate the geometry of the network with the properties of diffusion through the network because it can easily indicate which nutrients can enter the biofilm, be it oxygen, antibiotics or other molecules. Porous media is a randomly multiply connected material in which channels are randomly closed. The portion of free space occupied by these channels is called the pore. The Darcy permeability of the channel network is equivalent to the conductivity of the resistive network; it describes the ease with which liquid flows through the network. At porosity above a value known as the critical porosity Ccr , there exists a continuous pathway in the network through which molecules can diffuse from one end of the network to the other. If the distribution of channels is random and long-range correlations can be neglected, the permeability follows a general exponential law close to Ccr which does not depend on microscopic details, the nature of the connections, etc. The flow of liquid in a network is related to the permeability of the network and thus ultimately depends on the overall geometry of the network. In many cases, the geometric structure of the network can be described as a fractal, and the fractal dimension can be defined for the network. At a critical value, the average mass of channels contained within a sphere of radius R is proportional toRD , where D<3. Thus, the network can be considered as a porous structure which does not fill the three-dimensional space sufficiently compared to the usual three-dimensional solid, such that the network has a fractal dimension which is lower than the usual Euclidean dimension. In summary, determining the fractal dimension gives a description of the network geometry and, therefore, an indication of the porosity of the biofilm. For a detailed description see eg Gouyet, Physique et Structure Fractales Publisher Mason, 1992,
在另一实施方式中,生物膜包括可光学区分的微生物群体。这些群体可以例如包括相同或不同的微生物种类,当用荧光标记处理时,可以基于不同的标记图案区分所述群体。优选地,该方法能够确定所述群体的空间分布。In another embodiment, the biofilm comprises an optically distinguishable population of microorganisms. These populations may, for example, comprise the same or different species of microorganisms which, when treated with fluorescent labels, can be distinguished on the basis of different labeling patterns. Preferably, the method is capable of determining the spatial distribution of said population.
在另一实施方式中,所述生物膜包括遗传学上可区分的微生物群体。这些群体包括不同的株或种属;例如,所述群体可以由野生型和经遗传工程得到的菌株构成,所述经遗传工程得到的菌株可以组成型表达GFP,或者由两个或多个菌株或种属构成,其以诱导型或组成型方式表达光学上不同的荧光报道基因。优选地,所述方法能够确定基因表达和群体的空间分布。In another embodiment, the biofilm comprises a genetically distinguishable population of microorganisms. These populations include different strains or species; for example, the population may consist of wild-type and a genetically engineered strain that expresses GFP constitutively, or of two or more strains or species constitutions that express optically distinct fluorescent reporters in an inducible or constitutive manner. Preferably, the method is capable of determining gene expression and the spatial distribution of the population.
根据本发明的第二方面,提供了一种筛选试验因素的方法,确定所述试验因素对生物膜的发育的影响,所述方法包括以下步骤:According to a second aspect of the present invention, a method for screening test factors is provided to determine the impact of said test factors on the development of biofilms, said method comprising the following steps:
i)存在所述试验因素时,实施前述的方法;i) when there are said test factors, implement the aforementioned method;
ii)对试验因素存在时所述生物膜的发育与不存在所述试验因素时生物膜发育的一个已知值进行比较。ii) comparing the development of said biofilm in the presence of the test factor to a known value for the development of the biofilm in the absence of said test factor.
其中,试验因素存在时所述生物膜的发育与不存在所述试验因素时生物膜发育的所述已知值的差异指示了所述试验因素对生物膜发育的影响。Wherein, the difference between the development of said biofilm in the presence of a test factor and said known value of biofilm development in the absence of said test factor is indicative of the effect of said test factor on biofilm development.
优选地,所述已知值储存于光学或电子数据库中。可选择地,可以对该值进行标准化(例如,代表生物膜的100%发育),并与试验因素存在时所述生物膜的发育的标准化值比较。这样,只有以特定最小量影响生物膜发育的试验因素被选择用于进一步的评价。Preferably said known values are stored in an optical or electronic database. Alternatively, the value can be normalized (eg, to represent 100% development of the biofilm) and compared to a normalized value for the development of the biofilm in the presence of the test factor. In this way, only experimental factors affecting biofilm development in specified minimal amounts were selected for further evaluation.
在本发明的第三方面,提供了一种筛选试验因素的方法,确定所述试验因素对生物膜的发育的影响,所述方法包括以下步骤:In a third aspect of the present invention, a method of screening test factors is provided to determine the impact of said test factors on the development of biofilms, said method comprising the following steps:
i)存在和不存在所述试验因素时,培育生物膜;以及i) growing the biofilm in the presence and absence of said test factor; and
ii)根据前述的方法测量生物膜的发育,ii) measuring biofilm development according to the aforementioned method,
其中,所述生物膜的发育在存在和不存在所述试验因素时的差异指示所述试验因素对生物膜发育的影响。wherein the difference in the development of said biofilm in the presence and absence of said test factor is indicative of the effect of said test factor on biofilm development.
因此,例如抗生素,如四环素、氨比西林和氯霉素可以显示出不同程度地抑制生物膜的发育(见附图17和18)。Thus, for example antibiotics such as tetracycline, ampicillin and chloramphenicol can be shown to inhibit biofilm development to varying degrees (see Figures 17 and 18).
优选地,对不存在和存在所述试验因素时生物膜发育的差异进行标准化,进行光学或电子存储,与参比化合物的值进行比较。因此,例如发育的差值可以存储入电子数据库中作为抑制百分数(或刺激百分数),该值与所述生物膜的标准抑制剂的对应值进行比较。这样,只有满足特定预定阈值的试验因素(例如,与参比化合物同样有效或更有效)才能被选择用于进一步测试。Preferably, the difference in biofilm development in the absence and presence of said test factor is normalized, stored optically or electronically, and compared to the value of a reference compound. Thus, for example, the difference in development can be stored in an electronic database as percent inhibition (or percent stimulation) and this value compared to the corresponding value for a standard inhibitor of said biofilm. In this way, only test factors that meet a certain predetermined threshold (eg, are as effective or more effective than a reference compound) are selected for further testing.
适当地,所述试验因素影响生物膜内的基因表达。优选地,所述试验因素影响生物膜内特定微生物群体的基因表达。Suitably, the assay factor affects gene expression within the biofilm. Preferably, the assay factor affects the gene expression of a particular population of microorganisms within the biofilm.
适当地,所述试验因素抑制生物膜发育。Suitably, said test factor inhibits biofilm development.
适当地,所述试验因素促进生物膜发育。在例如水处理工业和污水工业中对所述化合物特别感兴趣。Suitably, said test factor promotes biofilm development. Said compounds are of particular interest in eg the water treatment industry and the sewage industry.
优选地,所述试验因素为选自由以下构成的组中的物理因素:电磁辐射、电离辐射、电场、声能和磨损。电磁辐射的适当形式包括紫外辐射,而电离辐射的适当形式包括α-、β-和γ-辐射。磨损涉及用机械物体例如刷子或颗粒材料的形式的物理实体来进行物理摩擦或刮擦以磨损生物膜的表面。Preferably, said test factor is a physical factor selected from the group consisting of electromagnetic radiation, ionizing radiation, electric field, acoustic energy and abrasion. Suitable forms of electromagnetic radiation include ultraviolet radiation, while suitable forms of ionizing radiation include alpha-, beta- and gamma-radiation. Abrasion involves physical rubbing or scraping with mechanical objects such as brushes or physical entities in the form of particulate material to abrade the surface of the biofilm.
优选地,所述试验因素为荧光化合物或荧光标记的化合物,从而有利于测量其在整个生物膜中的分布。更优选地,所述试验因素选自由以下构成的组:有机化合物、无机化合物、肽、蛋白质、碳水化合物、脂类、核酸、多聚核苷酸和蛋白核酸。Preferably, the assay factor is a fluorescent compound or a fluorescently labeled compound, thereby facilitating measurement of its distribution throughout the biofilm. More preferably, said assay factor is selected from the group consisting of organic compounds, inorganic compounds, peptides, proteins, carbohydrates, lipids, nucleic acids, polynucleotides and protein nucleic acids.
根据本发明的第四方面,提供了一种如本文所述的共焦成像系统在测量生物膜发育中的应用。According to a fourth aspect of the present invention, there is provided a use of the confocal imaging system as described herein in measuring biofilm development.
根据本发明的第五方面,提供了一种采用荧光成像系统对经扫描的对象的三维结构进行分析的方法,包括:According to a fifth aspect of the present invention, there is provided a method for analyzing the three-dimensional structure of a scanned object using a fluorescence imaging system, comprising:
a)辐射源系统,形成包括一个或多个波长的电磁辐射光束;a) a radiation source system forming a beam of electromagnetic radiation comprising one or more wavelengths;
b)光学系统,将所述光束指向和聚焦于所述对象的一个或多个平面;b) an optical system directing and focusing said light beam on one or more planes of said object;
c)检测系统,检测对象发出的电磁辐射并生成图像数据;以及c) detection systems that detect electromagnetic radiation emitted by objects and generate image data; and
d)扫描系统,通过所述电磁辐射在多个平面上扫描所述对象,d) a scanning system for scanning said object in multiple planes by means of said electromagnetic radiation,
该方法包括对所述图像数据进行处理,确定与所述对象的三维结构有关的数据,该方法包括一自动图像数据阈值处理步骤,所述阈值处理步骤包括:The method includes processing said image data to determine data related to the three-dimensional structure of said object, the method including an automatic image data thresholding step, said thresholding step comprising:
i)分析图像数据内强度值;i) analyzing the intensity values within the image data;
ii)计算所述图像数据的阈值;以及ii) calculating a threshold for said image data; and
iii)采用所述阈值处理所述图像数据得到取阈值后的图像数据。iii) Processing the image data by using the threshold value to obtain thresholded image data.
对多个不同图像中的每一个进行自动确定阈值能够得到高通量图像分析系统,对由荧光成像系统生成的图像数据的三维结构进行分析。该方面特别适用于但不局限于生物膜。在每个图像的基础上进行自动阈值处理,或者在不同平面内对生物膜的一组图像中每一个进行自动阈值处理,可以克服以下问题:具有例如不同实验参数的生物膜的不同样品在平均图像强度上存在变化,例如不同的染料浓度、不同的激光功率或不同的相机曝光时间;由于样品内平面深度之间的区别导致生物膜样品的不同平面的图像在图像强度上存在不同;以及由于例如样品不均匀的照明或样品厚度或密度的不均匀变化导致图像的区域强度存在不同。Automatic thresholding of each of the plurality of different images enables a high-throughput image analysis system to analyze the three-dimensional structure of the image data generated by the fluorescence imaging system. This aspect applies in particular, but is not limited to, to biofilms. Automated thresholding on a per-image basis, or in a different plane for each of a set of images of biofilms, can overcome the problem of different samples with e.g. different experimental parameters of biofilms in Variations in average image intensity, such as different dye concentrations, different laser powers, or different camera exposure times; images of different planes of a biofilm sample that differ in image intensity due to differences between plane depths within the sample; and There are areas of the image that differ in intensity due to, for example, non-uniform illumination of the sample or non-uniform variations in sample thickness or density.
根据本发明的第六和第七方面,分别提供了一种计算机软件和存储所述计算机软件的数据载体,用于执行如本文所述的本发明的方法。According to the sixth and seventh aspects of the present invention, there are respectively provided a computer software and a data carrier storing the computer software for performing the method of the present invention as described herein.
附图的简要说明Brief description of the drawings
结合以下附图对本发明进行进一步描述,其中:The present invention is further described in conjunction with the following drawings, wherein:
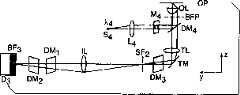
附图1为根据本发明对生物膜进行成像的线扫描共焦显微镜的示意图。Figure 1 is a schematic diagram of a line scanning confocal microscope for imaging biofilms according to the present invention.
附图2(a)和(b)分别为本发明的多种颜色实施方式的光路的顶视图和侧视图,其中没有扫描镜。Figures 2(a) and (b) are respectively a top view and a side view of the optical path of a multi-color embodiment of the present invention, without scanning mirrors.
附图2(c)为单光束自动聚焦系统的光路的顶视图。Accompanying drawing 2 (c) is the top view of the optical path of the single-beam autofocus system.
附图3(a)和3(b)分别为本发明的多色实施方式的光路的顶视图和侧视图,其具有扫描镜。Figures 3(a) and 3(b) are top and side views, respectively, of the optical path of a multicolor embodiment of the invention, with scanning mirrors.
附图3(c)为单光束自动聚焦系统的光路的顶视图。Accompanying drawing 3 (c) is the top view of the optical path of the single-beam autofocus system.
附图4为双光束自动聚焦系统的侧视图。Accompanying drawing 4 is the side view of double-beam automatic focusing system.
附图5(a)至5(c)描述了矩形CCD相机和读出寄存器。Figures 5(a) to 5(c) depict a rectangular CCD camera and readout register.
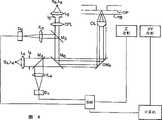
附图6示意性地描述了成像数据处理系统的数据处理组件。Figure 6 schematically depicts the data processing components of the imaging data processing system.
附图7表示根据本发明一个实施方式的图像分析程序的流程图。Figure 7 shows a flowchart of an image analysis program according to one embodiment of the present invention.
附图8表示所述分析程序的数据二元化步骤的流程图。Figure 8 shows a flow chart of the data binarization step of the analysis program.
附图9(a)和10(a)分别描述了在不同颜色通道进行扫描的生物膜的一个平面的图像。Figures 9(a) and 10(a) depict images of a plane of biofilm scanned in different color channels, respectively.
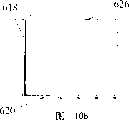
附图9(b)和10(b)分别描述了附图9(a)和10(a)的生物膜平面的图像的强度直方图。Figures 9(b) and 10(b) depict the intensity histograms of the images of the biofilm planes of Figures 9(a) and 10(a), respectively.
附图9(c)和10(c)分别描述了附图9(a)、9(b)、10(a)和10(b)的生物膜平面的二元化图像。Figures 9(c) and 10(c) depict binarized images of the biofilm planes of Figures 9(a), 9(b), 10(a) and 10(b), respectively.
附图11描述了所述分析程序的另一图像输出阈值处理步骤。Figure 11 depicts another image output thresholding step of the analysis program.
附图12描述了附图7中程序的子程序的流程图。Figure 12 depicts a flow chart of a subroutine of the program in Figure 7 .
附图13为所述3D对象分析子程序的流程图。Accompanying drawing 13 is the flow chart of described 3D object analysis subroutine.
附图14为所述3D对象互相关分析子过程的流程图。Figure 14 is a flow chart of the sub-process of the 3D object cross-correlation analysis.
附图15为显示用荧光染料Hoechst 33342染色的E.coli生物膜的显微图。Figure 15 is a micrograph showing E. coli biofilm stained with the fluorescent dye Hoechst 33342.
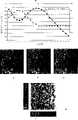
附图16A-D为表达GFP的生物膜的3D分析;附图16A、C和D为4、9&14μm的切片,附图16B为3D图像。附图16E描述了绿色和非绿色细菌的体积变化,其为所述细胞在Z平面内位置的函数。Figures 16A-D are 3D analyzes of biofilms expressing GFP; Figures 16A, C and D are 4, 9 & 14 μm sections, and Figure 16B is a 3D image. Figure 16E depicts the volume change of green and non-green bacteria as a function of the position of the cells in the Z plane.
附图17描述了经选择的抗生素对附着的培养物的差别抑制。填满的条代表了抗四环素的XL1-蓝色E.coli的附着培养物的体积。灰条代表了表达GFP、抗氨比西林的CL182 E.coli的附着培养物的体积。所示的为平均值+/-标准偏差(SD),其中n=4。Figure 17 depicts differential inhibition of attached cultures by selected antibiotics. Filled bars represent the volume of adherent cultures of tetracycline-resistant XL1-blue E. coli. Gray bars represent the volume of attached cultures of GFP-expressing, ampicillin-resistant CL182 E. coli. Shown are mean +/- standard deviation (SD), where n=4.
附图18描述了表达和不表达GFP的细胞的区别。发出绿色荧光的附着生物量的体积与同时为蓝色和绿色的量相比较,发现它们相等。空白条显示了附着培养物体积的平均绿色荧光,散列条显示了附着培养物体积的总蓝色荧光,灰条显示了蓝色和绿色荧光重叠的附着培养物的体积。其显示了所述分析对用Hoechst 33342染色的细菌的绿色荧光进行了正确地上局部化。所示的为平均值+/-标准偏差(SD),其中n=4。Figure 18 depicts the difference between cells expressing and not expressing GFP. The volume of attached biomass that fluoresced green was compared to the amount that was both blue and green and found to be equal. Blank bars show the average green fluorescence of the attached culture volume, hashed bars show the total blue fluorescence of the attached culture volume, and gray bars show the volume of the attached culture with overlapping blue and green fluorescence. It shows that the assay correctly uplocalizes the green fluorescence of bacteria stained with Hoechst 33342. Shown are mean +/- standard deviation (SD), where n=4.
本发明的详细描述Detailed description of the invention
本发明可以在游离荧光团或本身发出荧光的化合物的存在下对来自生物膜细胞的共焦平面的荧光信号进行成像,所述化合物包括潜在的候选药物。这些检测可以利用任一已知的荧光团或荧光标记,包括但不局限于荧光素、若丹明、Texas红、Amersham Biosciences染料Cy3、Cy5、Cy5.5和Cy7、Hoechst的核染剂和香豆素染料。(参见,Haugland R.P.Handbook of fluorescent probes and researchchemicals Ed.,1996,Molecular Probes,Inc.,Eugene,Oregon)。The present invention allows imaging of fluorescent signals from the confocal plane of biofilm cells in the presence of free fluorophores or compounds that fluoresce themselves, including potential drug candidates. These assays can utilize any known fluorophore or fluorescent label, including, but not limited to, fluorescein, rhodamine, Texas red, Amersham Biosciences dyes Cy3, Cy5, Cy5.5, and Cy7, Hoechst's nuclear stain, and Coumadin Vegetable dyes. (See, Haugland R.P. Handbook of fluorescent probes and research chemicals Ed., 1996, Molecular Probes, Inc., Eugene, Oregon).
光学结构optical structure
附图1显示了本发明的第一实施方式。所述显微镜包括光源100或110,其电磁辐射的光学范围例如为350-750nm,柱面透镜120,第一狭缝遮光板130,第一中继透镜140,分色镜150,物镜170,含有两维样品孔182阵列的微滴定板180,镜筒透镜190,滤波器200,第二狭缝遮光板210和检测器220。这些元件沿着光轴OA排列,其中遮光板130、210的狭缝132、212延伸垂直于附图1的平面。透镜140、170和190的焦距、所述透镜之间的间隔以及遮光板130和透镜140之间、物镜170和微滴定板180之间、透镜190和遮光板210之间的间隔提供了一共焦显微镜。在该实施方式中,来自灯100或激光110的电磁辐射通过柱状透镜120聚焦于一条线上,其形状通过第一狭缝遮光板130进行优化。Accompanying drawing 1 has shown the first embodiment of the present invention. Described microscope comprises
狭缝遮光板130描绘于所述光学系统的图像平面内,其位于与对象平面共轭的平面内。由狭缝遮光板130的狭缝132形成的照射条纹由透镜140、分色镜150和物镜170中继至微滴定板180上,所述微滴定板含有样品孔182的二维阵列。为了便于描述,附图1中的所述光学元件以横截面描述,微孔板以透视图表示。通过线184表示照明线投射至微孔板180,其还应该理解为垂直于附图1的平面。如箭头A和B所示,微孔板180可以通过图中未示出的装置在平行于阵列维数的二维(X,Y)空间内移动。The slit mask 130 is depicted in the image plane of the optical system, which lies in a plane conjugate to the object plane. The illumination fringe formed by slit 132 of slit mask 130 is relayed by lens 140 ,
在另一附加的实施方式中,狭缝遮光板130位于所述光学系统的Fourier平面内,其位于与物镜后焦平面(BFP)160共轭的平面内。In another additional embodiment, the slit mask 130 is located in the Fourier plane of the optical system, which is located in a plane conjugate to the objective back focal plane (BFP) 160 .
在此情况下,狭缝132位于附图的平面内,透镜140将狭缝132形成的照射条纹中继至物镜170的后焦平面160上,将所述照射条纹转化为与附图1平面相垂直的对象平面内的线184。In this case, the slits 132 lie in the plane of the drawing, and the lens 140 relays the illumination fringes formed by the slits 132 onto the back focal plane 160 of the objective 170, converting said illumination fringes to the plane of the
在另一实施方式中,将狭缝遮光板130完全移走。根据该实施方式,照射源为激光110,其发出的光聚焦于物镜170的后焦平面160。其可以通过附图1所示的柱面透镜120和球面透镜140的结合来实现,或者照明可以通过柱面透镜120直接聚焦于平面160内。In another embodiment, the slot mask 130 is completely removed. According to this embodiment, the source of illumination is a laser 110 which emits light that is focused on the back focal plane 160 of the objective 170 . It can be realized by a combination of cylindrical lens 120 and spherical lens 140 as shown in FIG. 1 , or the illumination can be focused directly in plane 160 by cylindrical lens 120 .
将照明光线投射至样品内的平面上,将其发出的荧光成像至检测器220上,沿着垂直于照明光线的方向移动板180,可以获得样品区域的成像,例如样品孔182内的样品,而且同步获得检测器220的读数。在附图1所示的实施方式中,物镜170收集荧光发射,经二向色分色镜150投射,经滤波器200和第二狭缝遮光板210由透镜190成像于检测器220,例如适于具有经无限远校正的物镜170的共焦系统。二向色分色镜150和滤波器200优选阻断在照明波长处的光。Projecting the illuminating light onto the plane in the sample, imaging the emitted fluorescence onto the detector 220, moving the plate 180 along the direction perpendicular to the illuminating light, can obtain the imaging of the sample area, such as the sample in the sample hole 182, Also the readings of the detector 220 are obtained synchronously. In the embodiment shown in accompanying drawing 1, the objective lens 170 collects the fluorescence emission, projects through the dichroic
检测器220示意性地为相机,可以是一维或二维的。如果采用一维检测器,不需要狭缝遮光板210。持续进行照明、检测和转移过程,直至预定区域被成像。如果以连续速率转移所述样品,则简化了机械移动。如果与暴露时间相比,相机的读出时间较短,则连续移动是最为有利的。在优选实施方式中,相机连续读出。在相连接的暴露时间和读出时间内样品位移d可以大于或小于照明线W的波宽,例如0.5W≤d≤5W。多孔板的所有孔能以类似方式成像。Detector 220 is illustratively a camera and may be one-dimensional or two-dimensional. If a one-dimensional detector is used, the slit mask 210 is not required. The illumination, detection and transfer process continues until the intended area is imaged. Mechanical movement is simplified if the sample is transferred at a continuous rate. Continuous movement is most beneficial if the camera readout time is short compared to the exposure time. In a preferred embodiment, the camera reads out continuously. The sample displacement d may be larger or smaller than the wave width of the illumination line W during the connected exposure time and readout time, for example, 0.5W≤d≤5W. All wells of a multiwell plate can be imaged in a similar manner.
或者,可将显微镜构造为照明线聚焦通过大量相邻的孔,主要受限于所述光学系统的视野。最后,可以同时采用多于一个的显微镜。照明条纹184的尺寸和形状由物镜后聚焦平面160的Fourier转化条纹的宽度和长度决定。例如线184的长度由160的线的宽度决定,相反,184的宽度由160的长度决定。由于衍射限制的性能,160处的照明条纹的长度应选择填满物镜后狭缝。对于本领域技术人员来说,在物镜偏差和物镜视野的限制范围内,照明条纹184的尺寸和形状显然可以由柱面透镜120的焦距和120处的光束大小决定,即由每一维的有效数值孔径决定。Alternatively, the microscope can be configured so that the line of illumination is focused through a large number of adjacent apertures, limited primarily by the field of view of the optical system. Finally, more than one microscope can be used simultaneously. The size and shape of the illumination fringes 184 are determined by the width and length of the Fourier transformed fringes at the objective rear focus plane 160 . For example, the length of line 184 is determined by the width of the line of 160 , and conversely, the width of 184 is determined by the length of 160 . Due to diffraction-limited performance, the length of the illumination fringe at 160 should be chosen to fill the objective rear slit. For those skilled in the art, the size and shape of the illumination stripe 184 can obviously be determined by the focal length of the cylindrical lens 120 and the beam size at 120 within the limits of the objective lens deviation and the objective lens field of view, that is, by the effective Numerical aperture is determined.
选择照明线184的维数从而优化信噪比。因此,它们是依赖于样品的。根据所述检测,分辨率可以在衍射限制和近似5μm之间变化。光束长度优选由物镜视野决定,例如在0.5至1.5mm之间。例如,NikonELWD,0.6NA,40X物镜的视野大约为0.75mm。用该物镜对633nm辐射的衍射限制的分辨率大约为0.6μm,或大约1100分辨元件。The dimensionality of the illumination lines 184 is chosen to optimize the signal-to-noise ratio. Therefore, they are sample-dependent. Depending on the detection, the resolution can vary between diffraction limited and approximately 5 μm. The beam length is preferably determined by the field of view of the objective lens, for example between 0.5 and 1.5 mm. For example, a Nikon ELWD, 0.6NA, 40X objective has a field of view of approximately 0.75mm. The diffraction-limited resolution of 633 nm radiation with this objective is about 0.6 μm, or about 1100 resolving elements.
有效深度分辨率主要由狭缝遮光板120的狭缝212的宽度决定,或者由一维检测器的宽度以及由物镜170和透镜190的结合得到的图像放大决定。共焦显微镜的最佳轴向分辨率接近1μm。The ConfocalHandbook(共焦手册,编辑J.B.Pawley,Handbook of Biological ConfocalMicroscopy,第二版,Plenum,纽约,1995)给出了几个轴向分辨率dz的表达式,但是其中有两个最为重要:The effective depth resolution is mainly determined by the width of the slit 212 of the slit mask 120 , or by the width of the one-dimensional detector and the image magnification obtained by the combination of the objective lens 170 and the lens 190 . The best axial resolution of confocal microscopes is close to 1 μm. The Confocal Handbook (Confocal Handbook, edited by J.B. Pawley, Handbook of Biological Confocal Microscopy, Second Edition, Plenum, New York, 1995) gives several expressions for the axial resolution dz, but two of them are the most important:
当λ为光的波长,NA为显微镜物镜的数值孔径,n是介质的折射率,α是用于计算NA的角度。两个公式均假设了理想的或尺寸为零的小孔。第一个等式沿着光轴(该方向通常是指z方向,而垂直于光轴的平面为x-y平面)利用Rayleigh判据。显微镜物镜聚焦在空气中将产生3D衍射限制的光斑,其具有位于x-y平面内焦点处的艾里斑横截面和另一沿x-z或y-z平面的分布。该方程最佳地描述了光致发光成像的轴向分辨率。第二个方程是采用轴旁(小角度)理论而衍生得到的,其假设所观察的对象为理想的平面镜。在低NA时,除了镜面反射所导致的因子2之外,第一个方程与第二个方程一致。应当认为这些方程仅仅是近似的,在某些情况下,不能准确地预测分辨率。Where λ is the wavelength of light, NA is the numerical aperture of the microscope objective, n is the refractive index of the medium, and α is the angle used to calculate NA. Both formulas assume ideal or zero-sized pores. The first equation uses Rayleigh's criterion along the optical axis (this direction is usually referred to as the z direction, and the plane perpendicular to the optical axis is the x-y plane). Focusing a microscope objective in air will produce a 3D diffraction-limited spot with an Airy disk cross-section at the focal point in the x-y plane and another distribution along the x-z or y-z plane. This equation best describes the axial resolution of photoluminescence imaging. The second equation is derived using on-axis (small angle) theory, which assumes that the observed object is an ideal plane mirror. At low NA, the first equation agrees with the second except for a factor of 2 due to specular reflection. These equations should be considered only approximate and, in some cases, cannot accurately predict resolution.
通常较为优选地是实验确定有效深度分辨率。例如,可以采用作为样品的荧光聚苯乙烯小珠得到,所述小珠的直径小于显微镜的分辨率限值。因此,通过逐步将聚焦平面通过小珠而获得的对象图像为亚分辨率对象的图像,可以作为对所述光学系统的点扩散函数的定义。Z方向上(轴方向)最大值一半处的总宽度作为对所述光学系统的轴向分辨率的定义。It is generally preferred to experimentally determine the effective depth resolution. For example, it can be obtained using fluorescent polystyrene beads as samples, the diameter of which is smaller than the resolution limit of the microscope. Thus, the sub-resolution object image obtained by progressively passing the focal plane through the bead can serve as a definition of the point spread function of the optical system. The total width at half of the maximum value in the Z direction (axial direction) is used as the definition of the axial resolution of the optical system.
照明的有效数值孔径(NA)小于物镜的NA。但是,由物镜的全NA收集荧光辐射。必须增加狭缝212的宽度,从而检测来自更大照明体积的发射光。在宽度比衍射限值大几倍的狭缝处,几何光学系统对检测体积元件的大小进行较为适当的近似估计:The effective numerical aperture (NA) of the illumination is smaller than the NA of the objective lens. However, fluorescence radiation is collected by the full NA of the objective. The width of the slit 212 must be increased in order to detect emitted light from a larger illuminated volume. At slits with a width several times larger than the diffraction limit, the geometrical optics makes a good approximation of the size of the detection volume element:
横宽:ad=dd/m,Horizontal width: ad = dd /m,
轴宽:zd,=√2ad√tanα,Shaft width: zd ,=√2ad √tanα,
其中m为放大倍率,dd为狭缝212的宽度,α为物镜170对着的半角。本发明的一个重要部分是照明狭缝132或在没有狭缝的实施方式中的等同物以及检测狭缝212是可以独立控制的。Where m is the magnification, dd is the width of the slit 212 , and α is the half-angle of the objective lens 170 . An important part of the invention is that the illumination slit 132, or equivalent in an embodiment without a slit, and the detection slit 212 are independently controllable.
多波长结构multi-wavelength structure
对于特定类型的检测,能够进行多波长荧光成像的实施方式是较为优选的。通常较为有利而且必须的是,应当同时进行两个或多个测定,这是由于生物响应中的一个重要参数是时间。For certain types of detection, embodiments capable of multi-wavelength fluorescence imaging are preferred. It is often advantageous and necessary that two or more assays should be performed simultaneously, since an important parameter in biological response is time.
独立波长或颜色的数量依赖于所进行的特定检测。在一个实施方式中,采用了三个照明波长。附图2(a)和2(b)分别描述了三种颜色的线扫描共焦成像系统的光路的顶视图和侧视图。通常,所述系统包括几个电磁辐射源Sn,准直透镜Ln,和用于生成准直光束的反射镜Mn,所述光束通过柱面透镜CL在第一空间滤波器SF1处聚焦为一延长光束,位于第一空间滤波器SF1和第二空间滤波器SF2之间的共焦显微镜,成像透镜IL,分光器DM1,和DM2以及检测器Dn,用于分离和检测样品发出的荧光辐射的不同波长组分。空间滤波器SF1和SF2优选为狭缝遮光板。The number of independent wavelengths or colors depends on the particular assay being performed. In one embodiment, three illumination wavelengths are used. Figures 2(a) and 2(b) respectively describe the top view and side view of the optical path of the three-color line-scanning confocal imaging system. Typically, the system comprises several electromagnetic radiation sources Sn , a collimating lens Ln , and a mirror Mn for generating a collimated beam focused at a first spatial filter SF1 by a cylindrical lens CL For an elongated light beam, a confocal microscope located between the first spatial filter SF1 and the second spatial filter SF2, the imaging lens IL, the beam splitter DM1 , and DM2 and the detector Dn are used to separate and detect the sample The different wavelength components of emitted fluorescent radiation. The spatial filtersSF1 andSF2 are preferably slit masks.
尤其是,附图2(a)描述了产生颜色λ1、λ2和λ3的光源S1、S2,S3,以及对各自光源发出的光进行准直的透镜L1、L2和L3。优选对透镜L1、L2和L3进行调整,从而对系统中的其它透镜的色度进行补偿。反射镜M1、M2和M3用于组合来自光源Sn的照明颜色。反射镜M1和M2是部分透光、部分反射的,优选为二向色的。例如,M2应优选透射λ3,优选反射λ2。因此,优选地,λ3大于λ2。共焦模式的显微镜操作需要将来自光源Sn的组合激发光束在对象平面OP上形成一条“线”,或高度偏心的椭圆形。结合上文对附图1的描述,可以采用不同的结构以完成上述操作。在附图2所述的实施方式中,组合照明光束通过柱面透镜CL聚焦成延长的椭圆形,其与空间滤波器SF1的狭缝一致。如附图2a和2b所绘,狭缝遮光板SF1位于系统的成像平面内,与照明光的传播方向垂直,其长轴位于附图2a页的平面内。透镜TL和OL将照明光线从含有SF1的平面中继至对象平面OP。旋转镜TM是出于方便。在另一实施方式中,DM3位于TL和OL之间,CL将照明光直接聚焦于BFP。对于本领域技术人员来说,其它实施方式是显而易见的。In particular, Figure 2(a) depicts light sources S1 , S2 , S 3 producing colors λ 1 , λ 2,andλ3 , and lenses L1 , L2 and L3 . LensesL1 ,L2 andL3 are preferably adjusted to compensate for the chromaticity of the other lenses in the system. MirrorsM1 ,M2 andM3 are used to combine the colors of the illumination from the light sourceSn . MirrorsM1 andM2 are partially transparent, partially reflective, preferably dichroic. For example, M2 should preferably transmit λ3 and preferably reflect λ2 . Therefore, preferably, λ3 is larger than λ2 . Microscope operation in confocal mode requires that the combined excitation beams from the light sourceS be formed into a "line", or highly decentered ellipse, on the object plane OP. In combination with the above description of FIG. 1 , different structures can be used to complete the above operations. In the embodiment shown in FIG. 2, the combined illumination beam is focused by a cylindrical lens CL into an elongated ellipse, which coincides with the slit of the spatial filterSF1 . As shown in Figures 2a and 2b, the slit mask SF1 is located in the imaging plane of the system, perpendicular to the propagation direction of the illuminating light, and its long axis is located in the plane of page 2a of Figure 2a. Lenses TL and OL relay illumination rays from the plane containing SF1 to the object plane OP. Swivel Mirror TM is made for convenience. In another embodiment, the DM3 is located between the TL and the OL, and the CL focuses the illumination light directly on the BFP. Other embodiments will be apparent to those skilled in the art.
参照附图2(b),样品发出的并由物镜OL收集的光通过镜筒透镜TL成像在空间滤波器SF2上。SF2优选为狭缝,其延伸垂直于该页的平面。因此,通过SF2的光基本上为照明线。SF2可以放于主成像平面内或者任何与之共轭的平面。DM3是部分反射、部分透光的,优选为“多色性的”。可以得到多波长“二向色”反射镜或“多向色”反射镜,其优选反射特定波长的波段,优选透射其它波段。Referring to FIG. 2(b), the light emitted by the sample and collected by the objective lens OL is imaged on the spatial filterSF2 through the tube lens TL. SF2 is preferably a slit extending perpendicular to the plane of the page. Therefore, the light passing through theSF2 is basically an illuminating line. SF2 can be placed in the principal imaging plane or any plane conjugate to it. DM3 is partially reflective, partially transparent, preferably "pleochroic". Multi-wavelength "dichroic" mirrors or "polychroic" mirrors are available which preferentially reflect certain wavelength bands and preferably transmit other wavelength bands.
在本文中,δλ1限定为由λ1激发的荧光。其通常为大于λ1的波长分布,δλ2和δλ3也类似限定。DM3优选反射λn,优选透射δλn,其中n=1,2,3。SF2透射的光成像至检测装置,所述检测装置位于与主成像平面共轭的平面内。在附图2(a)中,透镜IL在所有三个检测器Dn上形成空间滤波器SF2的图像。在要求各自检测器产生的图像之间的近乎完全配准的应用中,优选该实施方式。在另一实施方式中,单个透镜ILn与检测装置结合,透镜对IL和ILn用于将空间滤波器SF2的图像中继至各自的检测器Dn上。所述光通过反射镜DM1和DM2在检测器中被分离。所述反射镜为部分透光,部分反射,优选为二向色的。DM1优选反射δλ1,优选透射δλ2和δλ3。阻断滤波器BF1优选透射δλ1,有效地阻断其它存在的波长。DM2优选反射δλ2,优选透射δλ3。阻断滤波器BF2和BF3优选分别透射δλ2和δλ3,有效地阻断其它存在的波长。Herein,δλ1 is defined as fluorescence excited byλ1 . It is generally a wavelength distribution greater thanλ1 , andδλ2 andδλ3 are similarly defined. DM3 preferably reflects λn , preferably transmits δλn , where n=1,2,3. The light transmitted bySF2 is imaged to a detection device which lies in a plane conjugate to the principal imaging plane. In Fig. 2(a), lens IL forms the image of spatial filterSF2 on all three detectorsDn . This embodiment is preferred in applications requiring near perfect registration between the images produced by the respective detectors. In another embodiment, a single lensILn is combined with the detection means, and the pair of lenses IL andILn are used to relay the image of the spatial filterSF2 onto the respective detectorDn . The light is split in a detector by mirrors DM1 and DM2 . The mirror is partially transparent, partially reflective, preferably dichroic. DM1 preferably reflects δλ1 and preferably transmits δλ2 and δλ3 . The blocking filter BF1 preferably transmits δλ1 , effectively blocking other existing wavelengths. DM2 preferably reflects δλ2 and preferably transmits δλ3 . Blocking filters BF2 and BF3 preferably transmit δλ2 and δλ3 , respectively, effectively blocking other existing wavelengths.
自动聚焦auto focus
根据本发明的实施方式,样品位于多个平面中的每一个,其可以通过扫描装置移动至成像系统的对象平面内。因此,本发明提供了一种自动聚焦机构,其使成像系统视野内的当前选择的样品平面位于该系统的对象平面内。系统的视野深度决定了平面性的准确性。在优选实施方式中,视野深度近似为10μm,视野大约为1mm2。According to an embodiment of the invention, the sample is located in each of a plurality of planes that can be moved by the scanning device into the object plane of the imaging system. Accordingly, the present invention provides an autofocus mechanism that positions the currently selected sample plane within the field of view of an imaging system within the object plane of the system. The depth of field of the system determines the accuracy of the planarity. In a preferred embodiment, the depth of field is approximately 10 μm and the field of view is approximately 1 mm2 .
所述自动聚焦系统允许物镜以及其焦平面的精确移动。所述自动聚焦系统的操作具有可忽略的延迟,也就是说,相对于图像获取时间,响应时间较短,例如0.01-0.1s。此外,所述自动聚焦光源独立于照明光源和样品性能。在其它优势中,该结构允许独立于对象平面的位置确定沿着成像系统的光轴的样品载体位置。The autofocus system allows precise movement of the objective lens and its focal plane. The autofocus system operates with negligible delay, that is to say a short response time, eg 0.01-0.1 s, relative to the image acquisition time. Furthermore, the autofocus light source is independent of illumination source and sample properties. Among other advantages, the structure allows determination of the sample carrier position along the optical axis of the imaging system independently of the position of the object plane.
附图2和3提供了一个关于单光束自动聚焦的实施方式,其中显示了波长为λ4的独立光源S4和检测器D4。波长λ4必须区别于样品荧光,优选地,其波长不能激发可感知的样品荧光。因此,λ4优选位于近红外区域,例如800-1000nm。部分透光、部分反射的反射镜DM4优选为二向色的,反射λ4,透射λn和δλn,其中n=1,2,3。已知有适于本应用的基于光学的自动聚焦机构。例如,Applied Optics23,565-570(1984)中公开了用于生成适于进行伺服控制的位置错误信号的系统,其基于象散透镜。SPIE 200,73-78(1979)中公开了一种利用“斜光束”的聚焦错误检测系统。根据附图2和3很容易实施方式后一方案,其中D4为分离(split)检测器。Figures 2 and 3 provide an embodiment for single beam autofocus, showing a separate light sourceS4 and detectorD4 at wavelengthλ4 . The wavelengthλ4 must be distinct from the sample fluorescence, preferably at a wavelength that does not excite appreciable sample fluorescence. Therefore,λ4 is preferably located in the near-infrared region, such as 800-1000nm. The partially transparent, partially reflective mirror DM4 is preferably dichroic, reflecting λ4 , transmitting λn and δλn , where n=1,2,3. Optics based autofocus mechanisms suitable for this application are known. For example,
对于在孔的底部具有生物膜的微滴定板的应用,必须中断伺服环路,从而在孔之间移动。其可以导致大量的时间延迟,这是由于每次将照明移至另一孔时需要重新聚焦。For applications in microtiter plates with biofilms on the bottom of the wells, the servo loop must be interrupted to move between wells. It can cause a substantial time delay due to the need to refocus each time the illumination is moved to another well.
在本发明的优选实施方式中提供了对样品平面和对象平面的相对位置的连续闭合环路控制,如附图4所示。该系统利用两个独立电磁辐射光束。一个来源于S5聚焦于连续表面上,例如微滴定板的底部。另一个来源于S4聚焦于不连续平面上,例如微滴定板的孔底部。在一个实施方式中,来自S4和S5的光束分别具有波长λ4和λ5。波长为λ4的光束经L4准直,经过可变光阑I4的光圈,通过物镜OL聚焦于不连续表面上。In a preferred embodiment of the invention a continuous closed loop control of the relative positions of the sample plane and the object plane is provided, as shown in FIG. 4 . The system utilizes two separate beams of electromagnetic radiation. One originates fromS5 focusing on a continuous surface, such as the bottom of a microtiter plate. The other stems fromS4 focusing on a discontinuous plane, such as the bottom of a well in a microtiter plate. In one embodiment, the beams fromS4 andS5 have wavelengthsλ4 andλ5 , respectively. The light beam with wavelengthλ4 is collimated byL4 , passes through the aperture of variable diaphragmI4 , and focuses on the discontinuous surface through the objective lens OL.
波长为λ5的光束经L5准直,经过可变光阑I5的孔,通过透镜CFL和物镜OL聚焦与连续表面上。反射光分别通过透镜IL4和IL5聚焦于检测器D4和D5上。所述部分透光、部分反射的反射镜DM4优选为二向色的,反射λ4和λ5,透射λn和δλn,其中n=1,2,3。反射镜M4、M5和M6部分透光、部分反射。当λ4和λ5不同时,M6优选为二向色的。The light beam with wavelengthλ5 is collimated byL5 , passes through the aperture of variable diaphragmI5 , and is focused on the continuous surface by lens CFL and objective lens OL. The reflected light is focused onto detectorsD4 andD5 through lensesIL4 andIL5 , respectively. The partially transparent, partially reflective mirror DM4 is preferably dichroic, reflecting λ4 and λ5 , and transmitting λn and δλn , where n=1,2,3. Mirrors M4 , M5 and M6 are partially transparent and partially reflective. Whenλ4 andλ5 are different,M6 is preferably dichroic.
根据生物膜位于微滴定板中的实施方式,λ4聚焦于孔底部。对象平面可以通过可变的距离从孔底部发生偏移。其可通过调整λ4或者通过对伺服控制环路进行偏移调整来实现。为了便于描述,假设λ4聚焦于对象平面。According to an embodiment where the biofilm is in a microtiter plate,λ4 is focused on the bottom of the well. The object plane can be offset from the bottom of the hole by a variable distance. This can be achieved by adjustingλ4 or by offsetting the servo control loop. For ease of description, it is assumed thatλ4 is focused on the object plane.
自动聚焦系统的操作如下所述。如果样品孔的底部不在物镜OL的聚焦平面内,检测器D4产生出错信号,该信号通过开关SW传送至Z控制。Z控制对电机(未示出)进行控制,从而将微滴定板移向或远离物镜。The operation of the autofocus system is described below. If the bottom of the sample well is not in the focal plane of the objective OL, the detectorD4 generates an error signal which is sent to the Z control via the switch SW. The Z control controls a motor (not shown) to move the microtiter plate toward or away from the objective.
在单光束自动聚焦的优选实施方式中具有假闭合环路控制,所述实施方式的操作如下所述。在扫描结束时,当SW转换恢复至D4,板移至另一孔,计算机终端操控SW从而转换对取样固定装置的控制,所述装置维持Z控制输出在恒定水平。In the preferred embodiment of single-beam autofocus with pseudo-closed loop control, the operation of said embodiment is described below. At the end of the scan, when the SW switches back toD4 , the plate moves to the other well, and the computer terminal manipulates the SW to switch control of the sampling fixture, which maintains the Z control output at a constant level.
检测装置Detection device
所公开的设备的一个特征是采用了在于对象平面共扼的平面内具有多个独立检测元件的检测装置。如上所述,线照明主要在要求快速成像的应用中有利。与点照明相比,潜在速度的增加是线照明的平行性所固有的,但是,只有当成像系统能够同时检测出从每个样品点沿照明线发出的光时,才能实现。A feature of the disclosed apparatus is the use of detection means having a plurality of independent detection elements in a plane conjugate to the object plane. As mentioned above, line illumination is mainly beneficial in applications requiring fast imaging. The potential speed increase compared to point illumination is inherent in the parallelism of line illumination, but is only achievable if the imaging system can simultaneously detect light emanating from each sample point along the line of illumination.
一个实施方式中采用了连续读出线式相机,在一个优选实施方式中,矩形CCD用作线式相机。这两个实施方式在一个图像内的各线之间或者图像之间均没有死时间。本发明的另一优势是在如下所述的阶段扫描实施方式中可以获得更大的有效视野。In one embodiment a continuous readout line camera is used, and in a preferred embodiment a rectangular CCD is used as the line camera. Both of these embodiments have no dead time between lines within a picture or between pictures. Another advantage of the present invention is that a larger effective field of view can be obtained in the phase scanning embodiment as described below.
通过以下优选实施方式,可以进一步阐明对检测装置的性能的要求。物镜的分辨率限值小于1μm,通常为~0.5μm,检测器包括~1000个独立元件的矩阵。分辨率、视野(FOV)以及图像获取速率均不是独立变量,必须在这些性能参数之间进行折衷。通常,所述光学系统的放大倍率应设置为成像具有尽可能大的FOV,同时不能牺牲分辨率。例如,~1mm视野可以在像素为1μm时成像于多于1000个元件的矩阵中。如果检测元件为20μm见方,所述系统的放大倍率可以设为20X。应注意的是,其不能产生1μm的分辨率。The requirements for the performance of the detection device can be further clarified through the following preferred embodiments. The resolution limit of the objective is less than 1 μm, typically ~0.5 μm, and the detector consists of a matrix of ~1000 individual elements. Resolution, field of view (FOV), and image acquisition rate are not independent variables, and a tradeoff must be made between these performance parameters. In general, the magnification of the optical system should be set to image as large a FOV as possible without sacrificing resolution. For example, a ~1 mm field of view can be imaged in a matrix of more than 1000 elements with a pixel size of 1 μm. If the detection element is 20 μm square, the magnification of the system can be set to 2OX. It should be noted that it cannot produce a resolution of 1 μm.
像素不等同于分辨率。例如,如果物镜的固有分辨率限值为0.5μm,对象平面的每一0.5μm×0.5μm区域映射为一个像素,所得到的数字图像的实际分辨率不是0.5μm。为了达到实际的0.5μm分辨率,所述像素不需要对应于对象平面的~0.2μm×0.2的区域。在一个优选实施方式中,成像系统的放大倍率设置为达到所述光学系统的实际分辨率。Pixels are not the same as resolution. For example, if the intrinsic resolution limit of the objective lens is 0.5 μm, and each 0.5 μm × 0.5 μm area of the object plane is mapped to a pixel, the actual resolution of the resulting digital image is not 0.5 μm. To achieve a practical 0.5 μm resolution, the pixels need not correspond to an area of ~0.2 μm×0.2 of the object plane. In a preferred embodiment, the magnification of the imaging system is set to achieve the actual resolution of the optical system.
优选地,为了得到高检测效率、低噪声以及充分的读出速度,所使用的检测器为CCD相机。在附图5中,矩形CCD相机描述成具有m×n个检测器的阵列,其中m基本上小于n。荧光辐射的图像覆盖的一行优选邻近读数记录器。这使传送时间最小,避免了将虚假计数累计至位于被照射的行和读数记录器之间的行的信号上。Preferably, in order to obtain high detection efficiency, low noise and sufficient readout speed, the detector used is a CCD camera. In Figure 5, a rectangular CCD camera is depicted with an array of m x n detectors, where m is substantially smaller than n. A row of image overlays of fluorescent radiation is preferably adjacent to the readout recorder. This minimizes the transfer time and avoids accumulating spurious counts to the signal of the row located between the illuminated row and the readout recorder.
原则上,可以设置所述光学系统的放大倍率,从而狭缝SF2的图像高度在CCD相机上为一个像素,如附图5所示。In principle, the magnification of the optical system can be set so that the image height of the slit SF2 is one pixel on the CCD camera, as shown in FIG. 5 .
在实践中很难使照明线和相机的行轴线之间保持完全对齐,而且更难的是使三个相机和附图2及3所举例的多波长实施方式的照明对齐。通过将一些检测元件装配在相机的每一栏中,例如2个至5个,可以放宽对齐条件,同时使读出噪声或读出时间的损失最小。It is difficult in practice to maintain perfect alignment between the illumination lines and the row axes of the cameras, and it is even more difficult to align the three cameras with the illumination of the multi-wavelength embodiment exemplified in FIGS. 2 and 3 . By fitting a number of detection elements in each column of the camera, eg 2 to 5, alignment conditions can be relaxed with minimal loss of readout noise or readout time.
以下优选实施方式的另外一个优势通过下文进行描述。所述实施方式中具有一个或多个作为检测装置的矩形CCD相机和一个宽度可变的检测用空间滤波器,附图2和3中为SF2,附图1中为210,其每个均放置于与对象平面共扼的平面内。如上所述,在本发明的一个实施方式中,检测用空间滤波器可以省略,线式相机用作联合的检测用空间滤波器和检测装置。但是同样如上文所述,宽度可变的检测用空间滤波器可以对检测体积进行最优化,从而优化依赖样品的信噪比。以下优选实施方式保留了线式相机的优势,即速度,以及可变检测体积的灵活性。设置放大倍率从而将衍射限制的线的高度h成像至相机的一行上。所述检测用空间滤波器的宽度优选为可变的,其中:Another advantage of the following preferred embodiments is described below. In the described embodiment, there are one or more rectangular CCD cameras as detection devices and a spatial filter with variable width for detection, SF2 in accompanying
h≤d≤10hh≤d≤10h
在读数之前,装配位于相机中被照射的栏的检测器,该操作需要的时间与暴露时间和读出时间相比可忽略。The detector located in the illuminated column in the camera was assembled prior to reading, an operation requiring negligible time compared to exposure time and readout time.
在一个优选实施方式中,相机为Princeton InstrumentsNTE/CCD-1340/100-EMD。在优选实施方式中的读数速率在几个电子的读数噪声下为1MHz。所述象素格式为1340×100,可以对相机进行连接,从而将大多数(80%)的行移离感兴趣的区域,从而使相机的像素格式为有效的1340×20。In a preferred embodiment, the camera is a Princeton Instruments NTE/CCD-1340/100-EMD. The read rate in the preferred embodiment is 1 MHz at a read noise of a few electrons. The pixel format is 1340x100, and the camera can be connected to move most (80%) of the lines away from the region of interest, making the camera's pixel format effectively 1340x20.
除了上文所述的连续读数相机的优势,即接连获取数据之间没有死时间,其还具有另一个优势,即允许获得矩形图像,所述图像的长度仅仅受限于样品的范围。所述长度由相机宽度和线照明的范围中较小的一个所决定。在优选实施方式中,附着的生物膜位于96孔微滴定板的孔底部,其直径为7mm。照射1μm×1mm的条带,所述被照射区域产生的辐射成像于检测装置上。设计所述光学系统使得视野为~1mm2。可以在1×7mm的区域以1μm像素生成孔底部的图像。In addition to the advantage of continuous readout cameras described above in that there is no dead time between successive data acquisitions, it has the additional advantage of allowing the acquisition of rectangular images whose length is limited only by the extent of the sample. The length is determined by the smaller of the camera width and the extent of the line lighting. In a preferred embodiment, the attached biofilm is at the bottom of a well of a 96-well microtiter plate and is 7 mm in diameter. A strip of 1 μm×1 mm is irradiated, and the radiation generated in the irradiated area is imaged on a detection device. The optical system was designed such that the field of view was ~1 mm2 . An image of the bottom of the well can be generated with 1 μm pixels in an area of 1 × 7 mm.
环境控制environmental control
在本发明的一个实施方式中,在活的生物膜上进行检测。活细胞检测通常要求适当地近似于生理条件,从而可以正确进行检测。其中一个重要的参数为温度。较为可取的是,提供升高和降低温度的装置,从而特别使样品的温度维持在37℃。在另一实施方式中,必须对相对湿度,和/或CO2和/或O2进行控制从而维持活生物膜的生命力。此外,对于小样品体积来说,控制湿度从而使蒸发最小是非常重要的。In one embodiment of the invention, the assay is performed on a living biofilm. Live cell assays generally require that physiological conditions be properly approximated so that assays can be performed correctly. One of the important parameters is temperature. Preferably, means are provided for raising and lowering the temperature so that the temperature of the sample is maintained at 37°C in particular. In another embodiment, relative humidity, and/orCO2 and/orO2 must be controlled to maintain the viability of a living biofilm. Also, for small sample volumes, it is very important to control the humidity to minimize evaporation.
使微滴定板位于升高的温度优选为37℃并与共焦成像系统相适应的三个实施方式如下。Three embodiments of having the microtiter plate at an elevated temperature, preferably 37°C, and compatible with the confocal imaging system are as follows.
所述成像系统优选位于不透光的外壳内。在第一实施方式中,通过维持外壳内的整个内部空间在所需的温度,使样品板维持在该温度下。但是,在37℃下,除非有意维持升高的湿度,蒸发冷却将减少样品体积,从而限制检测时间。The imaging system is preferably located within a light-tight enclosure. In a first embodiment, the sample plate is maintained at the desired temperature by maintaining the entire interior space within the enclosure at that temperature. However, at 37°C, unless elevated humidity is intentionally maintained, evaporative cooling will reduce sample volume, thereby limiting assay time.
第二个实施方式为微孔板提供了加热盖子,允许板在所述静止盖子下移动。所述盖子具有位于孔上方的单个开口,与显微镜的光轴对齐。所述开口允许向工作孔内分配物质,同时维持加热并限制向板其余部分的流通。加热覆盖板和微孔板之间大约为0.5mm的空间允许微孔板自由移动,并使蒸发最小。当需检测的孔的内容物通过分配孔暴露于周围条件至多数秒时,所述内容物在测量期间不发生显著的温度改变。A second embodiment provides a heated cover for the microplate, allowing the plate to move under the stationary cover. The cover has a single opening above the aperture, aligned with the optical axis of the microscope. The openings allow distribution of substance into the working holes while maintaining heating and restricting circulation to the rest of the plate. A space of approximately 0.5 mm between the heated cover plate and the microplate allows free movement of the microplate and minimizes evaporation. When the contents of the well to be tested are exposed to ambient conditions through the dispensing well for up to several seconds, said contents do not undergo a significant temperature change during the measurement.
在第三个实施方式中,经加热的薄的蓝宝石窗口用作板底部外壳。沿着孔分隔物的电阻型加热器的模式使窗口温度维持在所需要的水平。In a third embodiment, a heated thin sapphire window is used as the board bottom case. A pattern of resistive heaters along the hole divider maintains the window temperature at the desired level.
在其它实施方式中,可以多种多样地结合所述三个公开的方法。In other embodiments, the three disclosed methods can be combined in various ways.
集成分配器integrated dispenser
本发明的一个实施方式提供了集成分配器。为了在96孔或384孔板上进行检测,需要在20-100ul范围内的添加体积。例如适于添加离子通道活性拮抗剂的单头分配器为IVEKK Dispense2000。具有可比性的元件可由CAVRO获得。一般来说,所需要的是能够将单一化合物分配至每个孔中。一个实施方式中提供了位于机器人移动装置上的单头分配器,其在分析站、含有所述单一化合物的源板和尖端清洗装置之间来回移动分配头。后者为固定尖端的分配器的清洗站和用于一次性尖端分配器的尖端更换站。所述系统相对便宜地提供了所需要的功能,但是其是低通量的,每个化合物吸取-分配-清洗循环需要大约30秒钟。通过将多头分配器结合于所述共焦成像系统中,例如Hamliton Microlab MPH-96,得到另一实施方式。所述MPH-96包括96个独立固定尖端的分配器,安装在能够进行如上所述吸取-分配-清洗循环机器人移动装置上。One embodiment of the present invention provides an integrated dispenser. For assays in 96- or 384-well plates, additive volumes in the range of 20-100ul are required. For example, a single-head dispenser suitable for adding ion channel activity antagonists is IVEKK Dispense2000. Comparable components are available from CAVRO. Generally, what is required is the ability to dispense a single compound into each well. In one embodiment there is provided a single head dispenser on a robotic mobile device that moves the dispense head back and forth between the analysis station, the source plate containing the single compound and the tip cleaning device. The latter are a washing station for fixed-tip dispensers and a tip-changing station for disposable-tip dispensers. The system provides the required functionality relatively inexpensively, but is low throughput, requiring approximately 30 seconds per compound aspiration-dispense-wash cycle. Another embodiment is obtained by incorporating a multi-head splitter into the confocal imaging system, eg Hamliton Microlab MPH-96. The MPH-96 consists of 96 individual fixed-tip dispensers mounted on a robotic mobile unit capable of aspiration-dispensing-rinsing cycles as described above.
在本发明的另一优选实施方式中,在自动筛选检测中采用的成像系统与板处理的自动装置例如Zymark Twister结合起来。In another preferred embodiment of the present invention, the imaging system employed in the automated screening assay is combined with a plate handling robot such as the Zymark Twister.
检测detection
可以根据本发明实施以下例1-3中描述的检测方法的大量变体。通常,采用一个或多个经荧光标记的物质的特征强度和/或空间分布和/或时间分布定量所述检测。Numerous variations of the detection methods described in Examples 1-3 below can be practiced according to the present invention. Typically, the detection is quantified using characteristic intensities and/or spatial distributions and/or temporal distributions of one or more fluorescently labeled species.
数据处理系统data processing system
附图6示意性地显示了根据本发明设置的系统的数据处理组件。所述系统基于Amersham Biosciences IN Cell AnalyzerTM系统,包括如上所述的共焦显微镜400,其包括了检测器D1,D2,D3,D4,D5,开关SW,控制单元401,图像数据存储器402以及输入/输出(I/O)装置404。应注意的是,还可以具有其它设置方式,包括省略D4和D5的设置,省略D4的设置以及省略D5的设置。所述图像数据存储器402可以是任意适当形式的存储装置或可以省略,传送输出数据并存储于辅助的计算机终端405。所述辅助的计算机终端405包括中央处理单元(CPU)408,内存410以及数据存储装置,例如硬盘驱动器412和I/O装置406,其有利于计算机和显微镜400的连接,以及通过屏幕I/O装置430有利于计算机和屏幕428的显示元件432的连接。操作系统程序414存储在硬盘驱动器412上,以已知的方式控制计算机终端405的低级操作。程序文件和数据420同样存储在硬盘驱动器412上,以已知方式通过辅助装置和存储在硬盘驱动器上的输出数据控制输出至运算器上。所述辅助装置包括作为屏幕元件428的显示器432,定点设备(未示出)以及键盘(未示出),其经过另外的I/O装置(未示出)接收运算器的输入和输出信息至运算器。图像处理和分析应用程序416、检测控制应用程序418、用于存储来自显微镜400的图像数据的数据库422和数据处理过程中产生的输出文件存储在硬盘驱动器412上的程序文件420内。所述图像处理和分析应用程序418可以是已知图像处理和分析软件包的定制版本,例如来自Media Cybernetics的Image-ProTM。Figure 6 schematically shows the data processing components of a system arranged according to the invention. The system is based on the Amersham Biosciences IN Cell AnalyzerTM system, including the above-mentioned
通过控制应用程序418控制采用共焦显微镜400得到的检测性能,并获得图像数据。在通过至少一个检测器D1,D2,D3获取微滴定板上至少一个孔的图像数据之后,图像数据被传送至计算机405,并存储在位于计算机终端硬盘驱动器412上的数据库内,在此利用图像处理和分析应用程序416处理图像数据,以下将对其进行详细描述。Detection performance using the
数据分析data analysis
通常,数据的获取和分析包括大量的不连续步骤。荧光被转化为一个或多个数字图像,其中数字值与入射至检测装置中每个像素的荧光辐射的强度成比例。在该步骤中,对经过视野的成像系统的不均匀响应进行校正,其中,减去背景的数据除以所谓的平面场文件。Typically, the acquisition and analysis of data involves a large number of discrete steps. The fluorescence is converted into one or more digital images, where the digital values are proportional to the intensity of the fluorescence radiation incident on each pixel in the detection device. In this step, a correction is made for the inhomogeneous response of the imaging system across the field of view, wherein the background-subtracted data is divided by a so-called flat-field file.
通过图像处理和分析应用程序(416)进行如附图7-14所述的数据分析。附图7表示了分析运算法则的流程图。分析从第一孔(i=1)的第一Z平面(Z=1)开始(500)。第一孔的第一Z平面的图像装载入计算机的内存中(510)。图像可以包括一个或多个彩色平面(例如红(R),绿(G),蓝(B)),对应于所述设备的三个相机所记录的图像。来自三个彩色平面的信息被分为(520)三个图像,对每个图像进行单独处理。以相同方式处理所有三个图像。首先,恢复图像从而补偿所述光学系统造成的变形和偏差(过程(541)中的红色图像;过程(542)中的绿色图像和过程(543)中的蓝色图像)。所述图像恢复可以例如是本领域公知的去卷积和其它任意图像恢复方法。图像恢复技术通常要求输入有关成像系统的光学性能的某些信息(530)。例如,如果采用去卷积技术,可能需要所述光学系统的点扩散函数(PSF)。Data analysis as described in Figures 7-14 is performed by an image processing and analysis application (416). Figure 7 shows a flowchart of the analysis algorithm. The analysis starts (500) from the first Z plane (Z=1) of the first hole (i=1). The image of the first Z-plane of the first hole is loaded into the memory of the computer (510). The image may comprise one or more color planes (eg red (R), green (G), blue (B)), corresponding to the images recorded by the device's three cameras. Information from the three color planes is divided (520) into three images, each image is processed separately. All three images were processed in the same way. First, the image is restored to compensate for distortions and aberrations caused by the optical system (red image in process (541 ); green image in process (542 ) and blue image in process ( 543 )). The image restoration may eg be deconvolution and other arbitrary image restoration methods known in the art. Image restoration techniques typically require input of certain information about the optical properties of the imaging system (530). For example, if deconvolution techniques are employed, the point spread function (PSF) of the optical system may be required.
第二,在图像数据处理运算法则中的图像数据阈值处理步骤中对每个图像进行阈值处理。在该实施方式中,阈值处理步骤涉及对每个图像进行二元化(过程(551)、(552)和(553)),其目的是将灰度图像转化为二元图像,例如1代表被生物膜中微生物占据的图像像素,0代表被位于微生物之间的自由空间占据的图像像素。在本发明的该实施方式中,二元化阈值的值确定不受用户的干预。单独为每个图像确定二元化阈值的值。另外,可以对每个彩色通道单独计算单个阈值,并用于每个孔的所有图像,也就是在不同平面的图像组。Second, each image is thresholded in an image data thresholding step in the image data processing algorithm. In this embodiment, the thresholding step involves binarizing each image (processes (551), (552) and (553)), the purpose of which is to convert a grayscale image into a binary image, e.g. 1 for being Image pixels occupied by microorganisms in the biofilm, 0 represents image pixels occupied by free spaces located between microorganisms. In this embodiment of the invention, the value of the binarization threshold is determined without user intervention. Determine the value of the binarization threshold for each image individually. Alternatively, a single threshold can be computed separately for each color channel and used for all images of each well, that is, groups of images in different planes.
附图8为分析运算法则的图像数据二元化过程(过程551,552和553)的流程图。附图9(a)-(c)描述了红色平面图像的二元化过程(551)的阶段,附图10(a)-(c)描述了绿色平面图像的二元化过程(552)的阶段。FIG. 8 is a flow chart of the image data binarization process (processes 551, 552 and 553) of the analysis algorithm. Accompanying drawing 9 (a)-(c) has described the stage of the binarization process (551) of red plane image, and accompanying drawing 10 (a)-(c) has described the phase of binarization process (552) of green plane image stage.
附图9(a)显示了红色(R)平面图像(614),在该实施方式中通过计算(602)强度直方图(616)在二元化过程中分析其强度值。如附图9(b)所示。所述强度直方图(616)对位于第一轴(618)上具有特定强度的图像的大量像素和位于第二轴(620)上的红色(614)图像的强度进行作图。采用该强度直方图(616),确定低于以下值的强度值,即被分析的像素集的预定比例的强度值。设想所述预定分位数的值在70%-95%,优选为85%-95%,较为优选地为大约90%的值(Q90)。90%分位数(Q90)代表位于图像(614)的90%总像素位于的强度值以下的值。由90%分位数(Q90)表示的强度用于为红色图像(614)设置最佳二元化阈值TR(606)。在该例中,二元化阈值TR为强度值24。Figure 9(a) shows a red (R) planar image (614) whose intensity values are analyzed in this embodiment during binarization by computing (602) an intensity histogram (616). As shown in Figure 9(b). The intensity histogram (616) plots a number of pixels of an image with a particular intensity on a first axis (618) and the intensity of a red (614) image on a second axis (620). Using the intensity histogram (616), intensity values below a predetermined proportion of the set of pixels being analyzed are determined. Values of said predetermined quantile are envisaged to be between 70% and 95%, preferably between 85% and 95%, more preferably around 90% (Q90 ). The 90% quantile (Q90 ) represents the value that lies below the intensity value at which 90% of the total pixels of the image (614) lie. The intensity represented by the 90% quantile (Q90 ) is used to set the optimal binarization thresholdTR (606) for the red image (614). In this example, the binarization thresholdTR is an intensity value of 24.
然后采用阈值(TR)对红色图像(614)进行二元化(608),从而得到二元化图像。在该假图像(mask)上,红色图像(614)的强度大于阈值(TR)的任意像素设置为1,红色图像(614)的强度等于或小于阈值(TR)的任意像素设置为0。设为1的像素通常对应于红色图像(614)中的细菌元素,设为0的像素通常对应于红色图像(614)中的背景元素。附图9(c)描述了红色二元化图像(622),其中设为1的像素显示为白色,设为0的像素显示为黑色。然后该二元化过程(551)结束(612)。The red image (614) is then binarized (608) using a threshold (TR ), resulting in a binarized image. On this fake image (mask), any pixel whose intensity of the red image (614) is greater than the threshold (TR ) is set to 1, and any pixel of the red image (614) whose intensity is equal to or less than the threshold (TR ) is set to 0 . Pixels set to 1 generally correspond to bacteria elements in the red image (614), and pixels set to 0 generally correspond to background elements in the red image (614). Figure 9(c) depicts a red binary image (622), where pixels set to 1 are displayed as white and pixels set to 0 are displayed as black. The binarization process (551) then ends (612).
以如上所述对红色(R)平面图像(614)进行二元化步骤的类似方式,对绿色(G)和蓝色(B)平面图像进行二元化(552,553)从而形成蓝色和绿色二元化图像,采用相同的预定分位数设定阈值。附图10(a)显示了绿色(G)平面图像(624)。附图10(b)显示了绿色平面图像(624)的强度直方图(626),与红色图像(614)相同,在第一和第二轴(618,620)上作图。在该例中,所述二元化阈值TG近似为强度值4,该值已经对绿色平面图像(624)进行了最优化。附图10(c)显示了绿色二元化图像(628)。设为1的像素显示为白色,设为0的像素显示为黑色。The green (G) and blue (B) planar images are binarized (552, 553) to form blue and Green binarized image, thresholded with the same predetermined quantile. Figure 10(a) shows a green (G) plane image (624). Figure 10(b) shows the intensity histogram (626) of the green planar image (624), plotted on the first and second axes (618, 620) as in the red image (614). In this example, the binarization thresholdTG is approximately an intensity value of 4, which has been optimized for the green plane image (624). Figure 10(c) shows a green binarized image (628). Pixels set to 1 appear white, and pixels set to 0 appear black.
附图11描述了另一可作为替换的图像二元化过程。该二元化过程适于对强度发生局部变化的图像进行二元化。所述局部变化强度可以是由经扫描的生物膜平面的不均匀照射,或者是由经扫描的生物膜的厚度或密度的变化引起的。在不均匀照射的情况下,可以采用图像校正的方法例如平面场校正使强度的局部变化最小。Figure 11 depicts an alternative image binarization process. This binarization procedure is suitable for binarizing images with locally varying intensities. The locally varying intensity may be caused by non-uniform illumination of the scanned biofilm plane, or by variations in the thickness or density of the scanned biofilm. In the case of non-uniform illumination, methods of image correction such as planar field correction can be employed to minimize local variations in intensity.
在所述可作为替换的二元化过程中,选择(630)图像例如红色(R)平面图像(614)的一个像素。具有固定面积的正方形的中心位于所选择像素附近,然后选择(632)图像的所述像素的局部区域。在扫描样品之前,确定正方形的面积。对于所选定的像素的局部区域,计算平均强度(AI)和强度(636)的标准偏差(SD)。然后计算(638)像素二元化阈值TP。所述像素二元化阈值(TP)的计算如下:In the alternative binarization process, a pixel of an image, such as the red (R) plane image (614), is selected (630). A square with a fixed area is centered around the selected pixel, and then a local area of the pixel of the image is selected (632). Before scanning the sample, determine the area of the square. For the selected local region of pixels, the mean intensity (AI) and the standard deviation (SD) of the intensity (636) are calculated. A pixel binarization thresholdTp is then calculated (638). The calculation of the pixel binarization threshold (TP ) is as follows:
TP=AI+(M×SD)TP =AI+(M×SD)
其中,M为常数,其优选值在0.2至4之间,优选在0.5至3之间,更优选地大约为1。当对其它图像进行二元化过程时,M的值在初始时是相同的,例如绿色和蓝色平面图像。Wherein, M is a constant, and its preferred value is between 0.2 and 4, preferably between 0.5 and 3, and more preferably about 1. The value of M is initially the same when performing the binarization process on other images, such as green and blue planar images.
接下来,对所选择的像素进行二元化(640)。如果所选定的像素的强度大于像素阈值(TP),则将像素设为1。如果所选定的像素的强度低于像素阈值(TP),则将像素设为0。进行检测(642)从而确定图像(614)中是否存在仍未进行二元化的其它像素。如果存在仍未进行二元化的像素,通过选择另一不同的图像平面(630)的像素,重复所述阈值处理步骤。在对图像平面的每一像素进行二元化之后,结束(644)二元化步骤,产生二元化图像。Next, the selected pixels are binarized (640). If the intensity of the selected pixel is greater than the pixel threshold (TP ), set the pixel to 1. If the intensity of the selected pixel is below the pixel threshold (TP ), the pixel is set to zero. A detection (642) is made to determine if there are other pixels in the image (614) that have not yet been binarized. If there are pixels that have not yet been binarized, the thresholding step is repeated by selecting pixels of a different image plane (630). After binarizing each pixel of the image plane, the binarization step ends (644), resulting in a binarized image.
第三,在分析运算法则中,采用任一公知的图像分析方法(例如,腐蚀扩大,采用例如Gaussian滤波器进行过滤)将杂散噪声从图像中去除(过程(561),(562)和(563))。第四,将所述三个彩色平面的经处理的图像存储于存储器中(572),(573),(574)。保存单个孔的每个Z平面的所有彩色平面的图像,从而在稍后阶段进行3D分析(参见过程(581)至(584))。所述图像还用作子程序(570)的输入。所述子程序(570)确定每个彩色平面内的生物膜体积,以及彩色平面之间的重叠体积。Third, in the analysis algorithm, any known image analysis method (e.g. erosion dilation, filtering using e.g. Gaussian filter) is used to remove spurious noise from the image (processes (561), (562) and ( 563)). Fourth, the processed images of the three color planes are stored in memory (572), (573), (574). An image of all color planes for each Z plane of a single well is saved for 3D analysis at a later stage (see procedures (581) to (584)). The image is also used as input to a subroutine (570). The subroutine (570) determines the volume of biofilm within each colored plane, as well as the volume of overlap between colored planes.
附图12显示了该子程序的流程图。第五,所述程序将体积测量结果存储于盘(571)内。第六,所述程序确定是否有另一个所述孔(575)的Z平面需要处理。如果有,采用来自下一Z平面(Z=Z+1)的图像,重复从过程(510)开始的整个过程。第七,如果没有其它的Z平面,所述程序为该孔(580)计算最后结果。这些最终结果包括,例如不同颜色平面的生物膜的总体积,或位于微生物之间的自由空间的总体积。第八,该程序执行3D对象分析。单独处理每个彩色平面组。对每个颜色组独立采用相同的子程序。在较早的阶段,将所述图像组存储于程序中。过程(581)采用红色组(572);过程(582)采用绿色组(573);过程(583)采用蓝色组(574)。所述子程序确定微生物集落,和位于集落之间的通道。其还为微生物集落和通道确定几何形状参数的统计分布。所述子程序的流程图显示于附图13中,每个彩色平面具有相同的流程图。第九,来自3D对象分析子程序的结果用作对象互相关子程序(584)的输入。所述子程序确定存在于不同颜色平面内的对象之间的任意相关。该子程序的流程图显示于附图14中。Accompanying drawing 12 has shown the flowchart of this subroutine. Fifth, the program stores the volume measurements in disk (571). Sixth, the program determines if there is another Z plane of the hole (575) that needs to be processed. If so, the entire process from process (510) is repeated using the image from the next Z plane (Z=Z+1). Seventh, if there are no other Z planes, the program calculates the final result for that hole (580). These end results include, for example, the total volume of biofilms in different color planes, or the total volume of free spaces located between microorganisms. Eighth, the program performs 3D object analysis. Each color plane group is processed individually. The same subroutine is employed independently for each color group. At an earlier stage, the set of images is stored in the program. Process (581) uses red group (572); process (582) uses green group (573); process (583) uses blue group (574). The subroutine identifies colonies of microorganisms, and passages between colonies. It also determines the statistical distribution of geometric shape parameters for microbial colonies and channels. A flowchart of the subroutine is shown in Figure 13, with the same flowchart for each color plane. Ninth, the results from the 3D Object Analysis subroutine are used as input to the Object Correlation subroutine (584). The subroutine determines any correlations between objects that exist in different color planes. A flowchart of this subroutine is shown in Figure 14 of the accompanying drawings.
第十,该孔的所有结果显示于屏幕(590)上,并存储于盘(591)上。在将结果显示于屏幕(590)之前,在验证过程中对结果进行验证从而确定质量,从而表示二元化过程(551,552,553)成功,从整体上确保图像像素没有被不正确地设置为1或0。如果例如没有对图像的二元化阈值进行正确地优化,或者如果二元化图像的进一步图像处理过程,例如除去散射(杂散)噪声(561,562,563),将相对大数量的设为1的像素错误地除去,将发生上述情况。Tenth, all results for the well are displayed on screen (590) and stored on disk (591). The results are validated during the verification process to determine the quality before displaying the results on the screen (590), thereby indicating that the binarization process (551, 552, 553) was successful, and overall ensuring that image pixels have not been set incorrectly is 1 or 0. If e.g. the binarization threshold of the image is not optimized correctly, or if further image processing of the binarized image, e.g. removal of scattered (spurious) noise (561, 562, 563), sets a relatively large number of 1's are incorrectly removed and the above will occur.
如果验证过程确定图像的二元化过程的质量差,由此是不成功的,重复对该图像的分析运算法则。在重复所述分析运算法则过程中,二元化阈值是变化的。因此,对于采用预定的分位数确定二元化阈值的实施方式,根据需要通过逐步增加或减少对分位数的百分数进行修饰。对于替代的二元化步骤,在重复分析过程中类似地对常数M的值进行修饰。在重复分析运算法则之后,通过验证过程对结果进行重新验证,从而确定二元化是否成功。如果二元化的结果再次被认为质量差以及由此的不成功,则再次重复分析运算法则,对分位数的百分数或者M值进行适当地进一步修饰。一旦验证过程认为二元化结果是成功的,所述结果显示在屏幕(590)上。If the verification process determines that the image's binarization process was of poor quality and thus was unsuccessful, the analysis algorithm for the image is repeated. During repetition of the analysis algorithm, the binarization threshold is varied. Thus, for embodiments where a predetermined quantile is used to determine the binarization threshold, the percentile of the quantile is modified by stepwise increase or decrease as necessary. For alternative binarization steps, the value of the constant M was similarly modified during repeated analyses. After repeated analysis of the algorithm, the results are revalidated through a validation process to determine whether the binarization was successful. If the result of the binarization is again considered to be of poor quality and thus unsuccessful, the analysis algorithm is repeated again, with appropriate further modifications to the percentiles of the quantiles or the M-values. Once the verification process deems the binarization result successful, the result is displayed on the screen (590).
所述验证过程涉及一个或多个步骤,其描述如下。可以在验证过程中执行的步骤的例子涉及检查a,a不大于分析运算法则的最终处理图像中被设置为1的像素的预定比例,例如大约80%。如果其大于被设置为1的像素的预定比例,则所述验证过程指示所述阈值过低。因此,所述结果被认为是不成功的,采用更大的阈值对所述图像重复所述分析运算法则。当采用90%的分位数设置二元化阈值时,由此大约90%的具有最低图像强度的像素将设为0。对二元化图像的包括去除散射噪声的进一步处理将设定从1至0的小比例像素,因此,低于大约10%的像素比例将设为1。如果在验证过程中,将大于大约80%的像素设为1,其确定了应对所述二元化阈值进行修饰,并重复所述图像的分析运算。The verification process involves one or more steps, which are described below. An example of a step that may be performed in the verification process involves checking that a is not larger than a predetermined proportion, eg about 80%, of the pixels in the final processed image of the analysis algorithm that are set to 1 . If it is greater than a predetermined proportion of pixels that are set to 1, the verification process indicates that the threshold is too low. Therefore, the result is considered unsuccessful and the analysis algorithm is repeated on the image with a larger threshold. When the 90% quantile is used to set the binarization threshold, then approximately 90% of the pixels with the lowest image intensity will be set to zero. Further processing of the binarized image including removal of scatter noise will set a small scale of pixels from 1 to 0, so pixels below about 10% will scale to 1. If during verification, more than about 80% of the pixels are set to 1, it is determined that the binarization threshold should be modified, and the image analysis operation is repeated.
可以在验证过程中执行的步骤的另一例子涉及检查低于预定比例的经处理图像的像素是否设为1,例如大约9%。如果低于9%的像素被设为1,所述验证过程指示所述阈值设置过高。因此所述结果被认为是不成功的,采用更低的阈值重复对该图像进行分析运算。Another example of a step that may be performed in the verification process involves checking that less than a predetermined proportion of the pixels of the processed image are set to 1, eg around 9%. If less than 9% of the pixels are set to 1, the verification process indicates that the threshold is set too high. The result is therefore considered unsuccessful and the image analysis operation is repeated with a lower threshold.
可以在验证过程中执行的步骤的另一例子涉及对样品一个平面图像中设为1的像素比例和所述样品的第二不同平面的设为1的像素比例进行比较。这两个比例之间不可能出现显著差别。如果与预定差值进行比较,确定所述差值在统计学上具有显著意义,则采用经适当修饰的阈值对所述图像重复进行分析运算,从而得到成功的结果。Another example of a step that may be performed in the verification process involves comparing the proportion of pixels set to 1 in an image of one plane of the sample with the proportion of pixels set to 1 in a second, different plane of said sample. There is unlikely to be a significant difference between these two proportions. If the difference is determined to be statistically significant compared to the predetermined difference, then the analysis operation is repeated on the image using an appropriately modified threshold to obtain a successful result.
可以在验证过程中执行的步骤的另一例子涉及对设为1的孤立像素数量进行计数。孤立是指像素完全被设为0的像素环绕。如果该数大于预定值,则所述验证过程指示将对应于图像的背景噪声的像素不正确地设为1,应采用增加的阈值对该图像重复进行分析运算。Another example of a step that may be performed in the verification process involves counting the number of isolated pixels that are set to one. Isolated means that the pixel is completely surrounded by pixels set to 0. If this number is greater than a predetermined value, the verification process indicates that the pixel corresponding to the background noise of the image is incorrectly set to 1 and the analysis operation should be repeated for the image with an increased threshold.
可以在验证过程中执行的步骤的另一例子为比较处理图像的经确认的细菌的统计学特性,例如平均大小或最可能的大小,和该特性的预定和期望值。如果在这些值之间存在显著差异,所述验证过程指示应对该二元化阈值进行修饰,并重复进行分析运算。所述验证过程的修饰形式的一个例子涉及比较一个样品图像平面内的经确认的细菌的统计特性和第二个不同的样品图像平面内的经确认的细菌的统计特性,从而检查其相似性。Another example of a step that may be performed in the verification process is comparing a statistical property of the validated bacteria of the processed images, eg mean size or most likely size, with predetermined and expected values for this property. If there are significant differences between these values, the validation process indicates that the binarization threshold should be modified and the analysis run repeated. An example of a modified form of the verification process involves comparing the statistical properties of the identified bacteria in one sample image plane with the statistical properties of the identified bacteria in a second, different sample image plane, thereby checking for similarity.
接下来,所述程序确定是否还存在另一个孔需要经过程(592)处理。如果存在另一个孔,则从过程(510)开始进行整个过程,采用另一孔(i=i+1)的第一Z平面(Z=1)。如果没有孔需要进行所述过程,则所述程序结束(593)。Next, the program determines if there is another hole that needs to be processed (592). If there is another hole, the whole process starts from process (510), using the first Z plane (Z=1) of the other hole (i=i+1). If there are no holes to perform the process, then the procedure ends (593).
附图12为附图7的子程序(570)的流程图。该子程序确定每个颜色通道内的生物膜体积。该子程序在步骤686,687和688中接收作为输入的来自过程(561),(562)和(563)的每个颜色通道的图像。首先,所述子程序计算用体积元素(体元)表示的三个新图像,它们同时存在于两个彩色平面内(过程(690)中为红色和绿色,过程(691)中为红色和蓝色,过程(692)中为绿色和蓝色)。其可以通过例如在两个彩色平面的图像之间,即体元对体元,取逻辑AND来实现。第二,计算六个不同的体积:生物膜在每个彩色平面内的体积(过程(693)中为红色,过程(696)中为绿色,过程(698)内为蓝色)和位于两个彩色平面之间的重叠体元的体积(过程(694),(695)和(697))。为了计算这些体积,需要知道体元的体积。其在之前的实验中已经确定,体元的体积值存储在计算机存储器(689)中。接下来,子程序将体积值返回至(699)主程序的过程(571)中。Accompanying drawing 12 is the flowchart of subroutine (570) of accompanying
附图13显示了3D对象分析子程序(581)的流程图,其确定生物膜集落和位于集落之间的通道的几何形状参数的统计学分布。所述子程序从其中一个来自程序(561)、(562)或(563)的彩色通道接收作为输入(700)的Z图像组。对微生物集落和自由通道的分析在两个不同的流程中进行:对于集落为(720)、(730)和(740),对于通道为(711)、(721)、(731)和(741)。对于集落分析,首先,在过程(720)确认每个独立集落为独立的对象。对象定义为一组相邻的体元,其与其它组的体元分隔开。该体元组在三维空间中占据一定的体积。过程(720)建立对象数据库,包括该对象中含有的所有体元的坐标。所述数据库输出至过程(584)供进一步分析。第二,在过程(730)中确定所述数据库中每个对象的几何特性。这些特性可以包括例如对象的体积、对象长轴和短轴的长度、对象的方向余弦、对象的纵横比。第三,在过程(740)中对每个孔计算所述形状参数的统计学分布。第四,在过程(590)中存储经计算的数据供进一步使用。另外,在自由通道分析流程中,首先,过程(711)转化图像,即将1转化为0,以及与之相反。第二,过程(721)确定通道网络中的节点和连接连线。节点是指至少两个通道会合的点,连线是指连接两个节点的通道部分。然后用由构成每个节点和连线的体元的坐标将图像转化为拓扑数据库。第三,过程(731)计算所有节点和连线的几何特性,例如连接在节点处的连线数量,连线的长度,连线的直径,连线的曲率等。第四,过程(741)确定节点和连线特性的统计学分布。过程(741)还计算网络的某些总体描述符,例如网络的连接性、弯曲度、分形维数等。第五,所有的结果输出至过程(590)。Figure 13 shows a flow chart of the 3D object analysis subroutine (581), which determines the statistical distribution of the geometrical shape parameters of biofilm colonies and channels located between the colonies. The subroutine receives as input (700) a set of Z images from one of the color channels from the program (561), (562) or (563). Analysis of microbial colonies and free passages is performed in two different procedures: (720), (730) and (740) for colonies and (711), (721), (731) and (741) for passages . For colony analysis, first, each individual colony is identified as an independent object at process (720). An object is defined as a group of adjacent voxels separated from other groups of voxels. The voxel group occupies a certain volume in three-dimensional space. The process (720) builds an object database, including the coordinates of all voxels contained in the object. The database is exported to process (584) for further analysis. Second, geometric properties of each object in the database are determined in process (730). These properties may include, for example, the volume of the object, the lengths of the major and minor axes of the object, the direction cosines of the object, the aspect ratio of the object. Third, a statistical distribution of the shape parameters is calculated for each hole in a process (740). Fourth, the calculated data is stored for further use in the process (590). In addition, in the free channel analysis flow, firstly, the process (711) converts the image, that is, converts 1 to 0 and vice versa. Second, the process (721) determines the nodes and connecting lines in the channel network. A node is a point where at least two channels meet, and a link is a portion of a channel connecting two nodes. The image is then converted into a topological database using the coordinates of the voxels that make up each node and link. Third, the process (731) calculates the geometric properties of all nodes and links, such as the number of links connected at the nodes, the length of the links, the diameter of the links, the curvature of the links, etc. Fourth, the process (741) determines the statistical distribution of node and link properties. The process (741) also computes some general descriptors of the network, such as the network's connectivity, tortuosity, fractal dimension, etc. Fifth, all results are output to process (590).
附图14为3D对象互相关分析子过程(584)的流程图。所述子过程接收三个输入。它们为孔的三个彩色平面的Z组。红色组(801)预先存储于(572),绿色组(802)预先存储于(573),蓝色组(803)预先存储于(574)。首先,所述程序计算三个新的图像,所述新图像对应于分别同时存在于过程(811)的红色和绿色图像、过程(812)的红色和蓝色图像,过程(813)的绿色和蓝色图像的体元。这些新的图像分别称为红绿重叠图像(RGO),红蓝重叠图像(RBO)和绿蓝重叠图像(BGO)。其通过例如在两个彩色平面的图像组之间就体元对体元进行逻辑AND而实现。在过程(821),(841),(851)和(861)中对RGO图像进行分析,以下将对其进行详细描述。在过程(822),(842),(852)和(862)中对RBO图像进行同样分析,以及在过程(823),(843),(853)和(863)中对GBO图像进行同样分析。就RGO图像而言,首先,在过程(821)中确认图像组中每个独立的体元群为单独的对象。对象定义为一组与所有其它体元组分隔开的相邻体元。该体元占据了由Z图像组限定的三维空间内的体积。过程(821)建立了对象数据库,其含有包括在该对象内的所有体元的坐标。第二,过程(841)比较三个数据库中含有的对象的体元坐标:由过程(821)生成的数据库,过程(581)生成的红色对象(833)数据库和过程(582)生成的绿色对象数据库。如果RGO数据库中的对象的体元坐标与红色对象数据库(833)和绿色对象数据库(832)中的体元坐标一致,这认为红色和绿色组之间的对象存在重叠。选择位于RGO数据库中的相应对象。或者删除RGO数据库中的相应对象。第三,过程(851)测量RGO数据库的对象的几何性质。所述性质可以包括例如对象体积、对象长轴和短轴的长度、对象的方向余弦、对象的纵横比、其相对于图像组的X,Y,Z轴的位置。第四,在过程(861)中计算该孔的形状参数的统计学分布。对于RBO图像组和GBO图像组进行与(821),(841),(851)和(861)一致的过程。Figure 14 is a flowchart of the 3D object cross-correlation analysis sub-process (584). The sub-process receives three inputs. They are the Z group of three colored planes for the hole. The red group (801) is pre-stored (572), the green group (802) is pre-stored (573), and the blue group (803) is pre-stored (574). First, the program calculates three new images corresponding to the red and green images of process (811), the red and blue images of process (812), the green and green images of process (813), respectively. Voxels of the blue image. These new images are called red-green overlay images (RGO), red-blue overlay images (RBO) and green-blue overlay images (BGO). This is achieved eg by a logical AND voxel-wise voxel between image sets of two color planes. The RGO image is analyzed in processes (821), (841), (851) and (861), which will be described in detail below. The same analysis is performed on RBO images in processes (822), (842), (852) and (862), and the same analysis is performed on GBO images in processes (823), (843), (853) and (863) . For RGO images, first, each individual voxel group in the set of images is identified as a separate object in a process (821). An object is defined as a group of adjacent voxels separated from all other groups of voxels. The voxel occupies a volume within the three-dimensional space defined by the set of Z images. The process (821) builds an object database containing the coordinates of all voxels included within the object. Second, the process (841) compares the voxel coordinates of the objects contained in the three databases: the database generated by the process (821), the red object (833) database generated by the process (581) and the green object generated by the process (582) database. If the voxel coordinates of an object in the RGO database agree with the voxel coordinates in the red object database (833) and the green object database (832), it is considered that there is an overlap of objects between the red and green groups. Select the corresponding object located in the RGO database. Or delete the corresponding object in the RGO database. Third, the process (851) measures the geometric properties of the objects of the RGO database. The properties may include, for example, the volume of the object, the length of the major and minor axes of the object, the direction cosines of the object, the aspect ratio of the object, its position relative to the X, Y, Z axes of the set of images. Fourth, in process (861) the statistical distribution of the shape parameter of the hole is calculated. The same process as (821), (841), (851) and (861) is performed for the RBO picture group and the GBO picture group.
最后,RGO数据库,RBO数据库和GBO数据库自过程(590)输出。Finally, the RGO database, RBO database and GBO database are output from the process (590).
实施例1Example 1
通过荧光染色对细菌生物膜进行显像Visualization of Bacterial Biofilms by Fluorescence Staining
在37℃将Escheriachia coli(E.coli,JM109)的非荧光菌株附着于Packard微滴定板(参见,Packard的目录号6005182)的孔中3个小时。通过清洗除去未吸附的细菌,附着的细胞在标准Luria培养基(Amersham Bioscienee)中在37℃下过夜。然后,通过添加荧光DNA染料Hoechst33342(1μM;Sigma),使所述细菌显像。在成像系统中显像时,细菌显示出较密集的但是不均匀的染色图案,指示生长呈片状(见附图15)。对生物膜的深度进行荧光强度扫描,指示膜的厚度为几微米。A non-fluorescent strain of Escheriachia coli (E. coli, JM109) was attached to the wells of a Packard microtiter plate (see, Cat. No. 6005182, Packard) for 3 hours at 37°C. Unadsorbed bacteria were removed by washing, and attached cells were incubated overnight at 37°C in standard Luria medium (Amersham Bioscienee). The bacteria were then visualized by adding the fluorescent DNA dye Hoechst 33342 (1 μM; Sigma). When visualized in the imaging system, bacteria showed a denser but uneven staining pattern, indicating growth in sheets (see Figure 15). Fluorescence intensity scans were performed for the depth of the biofilm, indicating a film thickness of a few micrometers.
实施例2Example 2
对附着的组成型表达GFP的E.coli集落进行3D显像3D visualization of attached E.coli colonies constitutively expressing GFP
第二个实验是如上述例1在微滴定板上生长E.coli,但是所述E.coli JM109可以组成型表达GFP,具有GFP-F64L-S175G-G222G突变。通过清洗除去未附着的细胞,在37℃培养剩余细胞大约10小时,不需要搅拌。对发育良好的生物膜进行扫描,所述生物膜既不生长过度也不是仅仅只有一个细胞的厚度,认为该生物膜代表了典型的样品。在488nm处进行扫描,使GFP显像。The second experiment was to grow E. coli on microtiter plates as in Example 1 above, but the E. coli JM109 can constitutively express GFP, with the GFP-F64L-S175G-G222G mutation. Unattached cells were removed by washing, and the remaining cells were incubated at 37°C for approximately 10 hours without agitation. Scans of well-developed biofilms that were neither overgrown nor only one cell thick were considered representative of typical samples. GFP was visualized by scanning at 488nm.
附图16A-D所示的图像覆盖了0.75×0.75mm的面积。一步1μm,将仪器的聚焦平面移动进入生物膜从而得到深度信息。附图16A,16C和16D所显示的三个图像代表所取的切片以及在生物膜内各自的z位置。附图16B显示的图像为3D图像,结合了所取的30个图像。水平和垂直线代表软件“切割线”,在图像的左侧和底部具有相关的切割轮廓。黑色区域指示不存在生物膜或者指示存在位于微生物集落之间的实际通道,所述微生物集落见附图中所示的明亮区域。The images shown in Figures 16A-D cover an area of 0.75 x 0.75 mm. In steps of 1 μm, the focal plane of the instrument is moved into the biofilm to obtain depth information. The three images shown in Figures 16A, 16C and 16D represent slices taken and their respective z positions within the biofilm. The image shown in Figure 16B is a 3D image combining 30 images taken. The horizontal and vertical lines represent software "cutting lines", with associated cutting outlines on the left and bottom of the image. Black areas indicate the absence of biofilm or the presence of actual channels between microbial colonies, which are shown as bright areas in the figures.
附图16E用图表显示了作为Z平面的位置函数的图像总强度的变化。Figure 16E graphically shows the change in total image intensity as a function of position in the Z plane.
实施例3Example 3
所附着的E.coli培养物的差异3D分析Differential 3D Analysis of Attached E.coli Cultures
E.coli CL182具有低的拷贝数矢量(pGEX-6p-1),其具有氨比西林耐药性并由IPTG相应的tac启动子表达GFPE. coli CL182 has a low copy number vector (pGEX-6p-1) that is ampicillin resistant and expresses GFP from the IPTG corresponding tac promoter
(F64L,S175G,E222G)。XL1-蓝色E.coli为具有转位子10的标准菌株,具有四环素耐药性。混合上述菌株,在经选择的抗生素的存在下(四环素、氨比西林和氯霉素)生长,采用IN Cell Ahalyzer显像。(F64L, S175G, E222G). XL1-blue E.coli is a standard strain with
E.coli培养物在37℃和经选择的压力下分批培养16小时。通过离心使细胞成小球状,清洗,并在冷PBS中重新悬浮。对培养物和溶液用OD600nm进行标准化(至1),用冷PBS进行10倍稀释。使细胞(100ul)沉淀,在4℃下附着于Packard微滴定板(Packard#6005182)的表面1小时。用PBS(100ul)清洗附着的E.coli两次。向附着细胞中加入含有或不含有IPTG(0.2μM),氨比西林(100μg/ml),四环素(10μg/ml)和氯霉素(34μg/ml)的Luria肉汤(100ul),在37℃培养4小时和16小时。用PBS(100ul)清洗细胞两次。在Hoechst33342(PBS中0.1μM)中培养10分钟。用PBS清洗细胞,依次用UV(365纳米)和蓝色(488nm)激光分别激发Hoechst33342和GFP并成像。用450BP65和565BP50滤波器捕获发出光,并收集作为12位图像;以1μm为间隔在每个条件下获得24个切片。E. coli cultures were grown in batches for 16 hours at 37°C under selective pressure. Cells were pelleted by centrifugation, washed, and resuspended in cold PBS. Cultures and solutions were normalized to OD600nm (to 1) and diluted 10-fold in cold PBS. Cells (100ul) were pelleted and attached to the surface of a Packard microtiter plate (Packard #6005182) for 1 hour at 4°C. The attached E. coli was washed twice with PBS (100ul). Add Luria broth (100 ul) with or without IPTG (0.2 μM), ampicillin (100 μg/ml), tetracycline (10 μg/ml) and chloramphenicol (34 μg/ml) to the attached cells, at 37°C Incubate for 4 hours and 16 hours. Cells were washed twice with PBS (100ul). Incubate in Hoechst 33342 (0.1 μM in PBS) for 10 minutes. Cells were washed with PBS, and Hoechst33342 and GFP were respectively excited and imaged with UV (365 nm) and blue (488 nm) lasers. Emission light was captured with 450BP65 and 565BP50 filters and collected as 12-bit images; 24 slices were acquired in each condition at 1 μm intervals.
采用附图7-14所描述的运算法则分析图像。在采用亚分辨率和超分辨率小珠进行实验之前确定体元维数。然后,所述分析提供了关于如前所述三维空间内的所有彩色平面内的生物膜数量的数据。此外,在3D中计算绿色和蓝色荧光生物膜的重叠。The images were analyzed using the algorithms described in Figures 7-14. Determine the voxel dimension before performing experiments with sub-resolution and super-resolution beads. The analysis then provided data on the amount of biofilm in all colored planes in three-dimensional space as previously described. Additionally, the overlap of green and blue fluorescent biofilms was calculated in 3D.
用氨比西林和四环素(附图13)清楚地显示和量化了对XL1-蓝色和CL182细胞的生长的差异抑制。如所预计的,氯霉素强烈抑制了XL1-蓝色和CL182的生长。此外,在不存在IPTG的情况下,观察到CL182的由tac启动子表达的GPP减少了25%。通过分析体元,获得有关生物膜的基因表达的重叠位置信息。附图17显示了在存在有抗生素时两个不同E.coli菌株的平均附着培养物体积(mm3)。在四个独立孔中重复该实验,计算这些孔之间的标准偏差。Differential inhibition of the growth of XL1-blue and CL182 cells was clearly shown and quantified with ampicillin and tetracycline (Fig. 13). As expected, chloramphenicol strongly inhibited the growth of XL1-blue and CL182. Furthermore, in the absence of IPTG, a 25% reduction in CL182 expression of GPP from the tac promoter was observed. By analyzing voxels, information about the overlapping position of gene expression in biofilms is obtained. Figure 17 shows the mean attached culture volume (mm3 ) of two different E. coli strains in the presence of antibiotics. The experiment was repeated in four independent wells and the standard deviation between these wells was calculated.
当在LB+IPTG存在的条件下培养CL182细胞,绿色和蓝色辐射像素的体积相等,其提示附着的生物量体积内的所有细胞均表达GFP(绿色:蓝色=9.72:9.71)。其得到了进一步分析的证实,所述分析显示蓝色的所有像素实际上也是绿色的(附图18)。然而,不表达GFP的XL1-蓝色细胞在Hoechst33342存在下在LB+IPTG中生长时显示强烈的蓝色染色。其可以区分XL1-蓝色细胞和CL182细胞(表达GFP)。When CL182 cells were cultured in the presence of LB+IPTG, the volumes of green and blue irradiated pixels were equal, suggesting that all cells within the attached biomass volume expressed GFP (green:blue=9.72:9.71). This was confirmed by further analysis, which showed that all pixels that were blue were in fact also green (FIG. 18). However, XL1-blue cells that do not express GFP show strong blue staining when grown in LB+IPTG in the presence of Hoechst33342. It can differentiate XL1-blue cells from CL182 cells (expressing GFP).
上述实施例应理解为本发明的示例。可以预测出本发明的其它实施例。应这样理解,任意实施例中描述的任意特征可以单独采用,或与描述的其它特征结合采用,以及可以与任意其它实施例或任意其它实施例的组合中一个或多个特征结合采用。而且,在不偏离本发明的范围的情况下,可以采用上文没有描述的等同物和变化,其在以下的权利要求中限定。The embodiments described above should be understood as examples of the present invention. Other embodiments of the invention are contemplated. It is to be understood that any feature described in any embodiment may be used alone or in combination with other described features, and may be used in combination with one or more features in any other embodiment or combination of any other embodiments. Furthermore, equivalents and changes not described above may be employed without departing from the scope of the present invention, which is defined in the following claims.
Claims (54)
Translated fromChineseApplications Claiming Priority (2)
| Application Number | Priority Date | Filing Date | Title |
|---|---|---|---|
| GBGB0211068.2AGB0211068D0 (en) | 2002-05-14 | 2002-05-14 | Method for assessing biofilms |
| GB0211068.2 | 2002-05-14 |
Publications (1)
| Publication Number | Publication Date |
|---|---|
| CN1668913Atrue CN1668913A (en) | 2005-09-14 |
Family
ID=9936672
Family Applications (1)
| Application Number | Title | Priority Date | Filing Date |
|---|---|---|---|
| CNA03816745XAPendingCN1668913A (en) | 2002-05-14 | 2003-04-28 | Methods for evaluating biofilms |
Country Status (10)
| Country | Link |
|---|---|
| US (1) | US20060275847A1 (en) |
| EP (1) | EP1504250A1 (en) |
| JP (1) | JP2005525551A (en) |
| KR (1) | KR20050007540A (en) |
| CN (1) | CN1668913A (en) |
| AU (1) | AU2003226568A1 (en) |
| CA (1) | CA2485611A1 (en) |
| GB (1) | GB0211068D0 (en) |
| IL (1) | IL165008A0 (en) |
| WO (1) | WO2003095995A1 (en) |
Cited By (18)
| Publication number | Priority date | Publication date | Assignee | Title |
|---|---|---|---|---|
| CN101839860A (en)* | 2010-07-01 | 2010-09-22 | 湖南科技大学 | Multi-wave excitation device of laser Raman spectrometer |
| CN103221806A (en)* | 2010-09-10 | 2013-07-24 | 奥林巴斯株式会社 | Optical analysis method using optical measurement in multiple wavelength bands |
| CN103403176A (en)* | 2010-12-21 | 2013-11-20 | 生物膜控制公司 | Method for measuring the resistance of films |
| CN104928347A (en)* | 2015-07-03 | 2015-09-23 | 北京科技大学 | Method for observing different gene phenotype cells and distribution in growth process of bacillus subtilis biological film in real time |
| CN105184853A (en)* | 2015-08-14 | 2015-12-23 | 深圳大学 | Unicell three-dimensional image generation method based on optical flow analysis |
| CN107462556A (en)* | 2017-07-26 | 2017-12-12 | 广东省生态环境技术研究所 | A kind of intuitively electroactive detection method of biomembrane |
| CN108474736A (en)* | 2015-11-05 | 2018-08-31 | 英思克斯公司 | System and method for the imaging of light science of heredity |
| CN109087272A (en)* | 2018-10-17 | 2018-12-25 | 天津师范大学 | For acquiring the noise reduction system and application method of simulative medicine twilight image |
| CN109564617A (en)* | 2016-06-13 | 2019-04-02 | 纳诺利弗股份有限公司 | The method of characterization and imaging micro-object |
| CN109642869A (en)* | 2016-04-15 | 2019-04-16 | 伯克利之光生命科技公司 | Methods, systems and kits for in-dock assays |
| CN109690613A (en)* | 2016-09-16 | 2019-04-26 | 凯杰有限公司 | Proximity interference compensation |
| CN110049818A (en)* | 2016-10-20 | 2019-07-23 | 海因生命科学股份有限公司 | For the multiple analytes in optical excitation reaction vessel array and the method and apparatus for acquiring the fluorescence from analyte |
| CN110823863A (en)* | 2019-10-31 | 2020-02-21 | 中国南方电网有限责任公司电网技术研究中心 | Method, device and equipment for detecting algae on the surface of insulating material |
| CN111094943A (en)* | 2017-06-27 | 2020-05-01 | 生命科技控股私人有限公司 | Method, microplate reader and computer program for analyzing liquid samples |
| US10908405B2 (en) | 2015-09-02 | 2021-02-02 | Inscopix, Inc. | Systems and methods for color imaging |
| US11789016B2 (en) | 2017-10-15 | 2023-10-17 | Phenomex Inc. | Methods, systems and kits for in-pen assays |
| TWI826990B (en)* | 2021-03-31 | 2023-12-21 | 大陸商深圳中科飛測科技股份有限公司 | Detection apparatus and detection method |
| US12251272B2 (en) | 2015-11-05 | 2025-03-18 | Inscopix, Inc. | Systems and methods for optogenetic imaging using semi-kinematic coupling |
Families Citing this family (40)
| Publication number | Priority date | Publication date | Assignee | Title |
|---|---|---|---|---|
| EP1817572A2 (en)* | 2004-11-16 | 2007-08-15 | Helicos Biosciences Corporation | An optical train and method for tirf single molecule detection and analysis |
| US8084260B2 (en)* | 2004-11-24 | 2011-12-27 | Applied Biosystems, Llc | Spectral calibration method and system for multiple instruments |
| US7582634B2 (en) | 2005-02-18 | 2009-09-01 | Wyeth | 7-substituted imidazo[4,5-c]pyridine antagonists of gonadotropin releasing hormone receptor |
| US7534796B2 (en) | 2005-02-18 | 2009-05-19 | Wyeth | Imidazo[4,5-b]pyridine antagonists of gonadotropin releasing hormone receptor |
| US7538113B2 (en) | 2005-02-18 | 2009-05-26 | Wyeth | 4-substituted imidazo[4,5-c]pyridine antagonists of gonadotropin releasing hormone receptor |
| JP4500206B2 (en)* | 2005-05-09 | 2010-07-14 | 株式会社三栄水栓製作所 | Biofilm evaluation method |
| US7531542B2 (en) | 2005-05-18 | 2009-05-12 | Wyeth | Benzooxazole and benzothiazole antagonists of gonadotropin releasing hormone receptor |
| US7582636B2 (en) | 2005-05-26 | 2009-09-01 | Wyeth | Piperazinylimidazopyridine and piperazinyltriazolopyridine antagonists of Gonadotropin Releasing Hormone receptor |
| JP2006337245A (en)* | 2005-06-03 | 2006-12-14 | Matsushita Electric Ind Co Ltd | Fluorescence reader |
| FR2898363B1 (en) | 2006-03-10 | 2008-06-13 | Biofilm Control Sarl | PRODUCTION OF IMAGE STUDIES, IN PARTICULAR FOR THE STUDY OF THE DEVELOPMENT OF BIOFILM IN A CULTURE ENVIRONMENT |
| WO2008032096A2 (en)* | 2006-09-14 | 2008-03-20 | Oxford Gene Technology Ip Limited | Apparatus for imaging single molecules |
| US7871791B2 (en)* | 2007-01-18 | 2011-01-18 | Allegheny-Singer Research Institute | Biofilm preparation using potassium permanganate |
| KR100884935B1 (en)* | 2007-10-29 | 2009-02-23 | 재단법인서울대학교산학협력재단 | Integrated analysis method of microorganism and biofilm chip used |
| US8712139B2 (en) | 2008-03-21 | 2014-04-29 | General Electric Company | Methods and systems for automated segmentation of dense cell populations |
| GB0807466D0 (en)* | 2008-04-24 | 2008-05-28 | Univ Nottingham Trent | Improvements relating to assays including a labelled reagent |
| WO2010108042A2 (en)* | 2009-03-18 | 2010-09-23 | University Of Utah Research Foundation | Non-coherent light microscopy |
| JP5012873B2 (en)* | 2009-10-14 | 2012-08-29 | カシオ計算機株式会社 | Image processing device |
| AU2010327159B2 (en) | 2009-12-04 | 2013-10-10 | Unisensor A/S | System and method for time-related microscopy of biological organisms |
| JP2013223835A (en)* | 2012-04-20 | 2013-10-31 | Nitto Denko Corp | Method for evaluating membrane fouling and method for washing separation membrane |
| WO2013192521A1 (en)* | 2012-06-22 | 2013-12-27 | The General Hospital Corporation | β-LACTAMASE TARGETED PHOTOSENSITIZER FOR PESTICIDE AND PEST DETECTION |
| KR101359268B1 (en)* | 2012-12-06 | 2014-02-11 | 고려대학교 산학협력단 | Apparatus for monitoring bio film |
| JP6394960B2 (en)* | 2014-04-25 | 2018-09-26 | パナソニックIpマネジメント株式会社 | Image forming apparatus and image forming method |
| JP6769949B2 (en)* | 2014-07-24 | 2020-10-14 | ユニバーシティー ヘルス ネットワーク | Data collection and analysis for diagnostic purposes |
| FR3030748B1 (en)* | 2014-12-17 | 2017-01-27 | Commissariat Energie Atomique | OBJECT OBSERVATION SYSTEM |
| WO2017041244A1 (en) | 2015-09-09 | 2017-03-16 | The Procter & Gamble Company | Fluorescent probes to assess stannous containing oral care products |
| DE102016110407A1 (en)* | 2016-06-06 | 2017-12-07 | Carl Zeiss Microscopy Gmbh | Digital microscope with a lens and an image sensor |
| US10280444B2 (en) | 2016-09-09 | 2019-05-07 | The Procter & Gamble Company | Method of quantitating sorption of stannous by microbial cells of a biofilm |
| EP3551745A4 (en) | 2016-12-12 | 2020-07-15 | Xcella Biosciences, Inc. | METHODS AND SYSTEMS FOR SCREENING USING MICROCAPILLAR ARRAYS |
| CA3048904A1 (en) | 2016-12-30 | 2018-07-05 | xCella Biosciences, Inc. | Multi-stage sample recovery system |
| US11871978B2 (en)* | 2017-04-20 | 2024-01-16 | Boise State University | Plasma scalpel for selective removal of microbes and microbial biofilms |
| JP7076698B2 (en) | 2017-11-17 | 2022-05-30 | 国立研究開発法人国立がん研究センター | Image analysis method, image analysis device, program, learned deep learning algorithm manufacturing method and learned deep learning algorithm |
| JP7198577B2 (en)* | 2017-11-17 | 2023-01-04 | シスメックス株式会社 | Image analysis method, device, program, and method for manufacturing trained deep learning algorithm |
| US12241901B2 (en)* | 2018-07-19 | 2025-03-04 | The University Of Washington | Systems and methods for accurate optical pH sensing of biofilms |
| CN111122567B (en)* | 2018-11-01 | 2022-09-16 | 华中科技大学苏州脑空间信息研究院 | High-flux optical tomography three-dimensional imaging system |
| DK3890876T3 (en) | 2018-12-06 | 2024-07-22 | Xcella Biosciences Inc | LATERAL FILLING OF MICROCAPILLAR ARRAYS |
| US11753671B2 (en) | 2018-12-26 | 2023-09-12 | Colgate-Palmolive Company | Visualization method for analyzing oral biofilm growth |
| US11733251B2 (en)* | 2019-02-01 | 2023-08-22 | Amgen Inc. | Methods and systems of performing an assay |
| JP7296239B2 (en)* | 2019-04-10 | 2023-06-22 | オムロン株式会社 | Optical measurement device, optical measurement method, and optical measurement program |
| CZ308044B6 (en) | 2019-07-09 | 2019-11-13 | Botanický ústav Akademie věd ČR, v.v.i. | Mobile device for non-destructive fluorescence resolution, imaging and quantification of microorganisms on the surface of materials |
| US20220299438A1 (en)* | 2021-03-21 | 2022-09-22 | Skyverse Technology Co,. LTD. | Detection Device, Detection Apparatus and Detection Method |
Family Cites Families (6)
| Publication number | Priority date | Publication date | Assignee | Title |
|---|---|---|---|---|
| US5474910A (en)* | 1993-10-15 | 1995-12-12 | Alfano; Robert R. | Method and device for detecting biological molecules and/or microorganisms within a desired area or space |
| US5796478A (en)* | 1997-07-25 | 1998-08-18 | Nalco Chemical Company | Monitoring of film forming living desposits |
| JP4812937B2 (en)* | 1998-03-16 | 2011-11-09 | ジーイー・ヘルスケア・バイオサイエンス・コーポレイション | Confocal microscope imaging system |
| AT410718B (en)* | 1998-10-28 | 2003-07-25 | Schindler Hansgeorg Dr | DEVICE FOR VISUALIZING MOLECULES |
| DE19906047C2 (en)* | 1999-02-12 | 2001-10-18 | Fraunhofer Ges Forschung | Method and device for the detection of biotic contamination on a surface |
| US6153400A (en)* | 1999-03-12 | 2000-11-28 | Akzo Nobel N.V. | Device and method for microbial antibiotic susceptibility testing |
- 2002
- 2002-05-14GBGBGB0211068.2Apatent/GB0211068D0/ennot_activeCeased
- 2003
- 2003-04-28WOPCT/GB2003/001816patent/WO2003095995A1/ennot_activeApplication Discontinuation
- 2003-04-28AUAU2003226568Apatent/AU2003226568A1/ennot_activeAbandoned
- 2003-04-28CNCNA03816745XApatent/CN1668913A/enactivePending
- 2003-04-28KRKR10-2004-7018311Apatent/KR20050007540A/ennot_activeWithdrawn
- 2003-04-28JPJP2004503941Apatent/JP2005525551A/enactivePending
- 2003-04-28EPEP03749948Apatent/EP1504250A1/ennot_activeWithdrawn
- 2003-04-28CACA002485611Apatent/CA2485611A1/ennot_activeAbandoned
- 2003-04-28USUS10/514,138patent/US20060275847A1/ennot_activeAbandoned
- 2004
- 2004-11-03ILIL16500804Apatent/IL165008A0/enunknown
Cited By (33)
| Publication number | Priority date | Publication date | Assignee | Title |
|---|---|---|---|---|
| CN101839860A (en)* | 2010-07-01 | 2010-09-22 | 湖南科技大学 | Multi-wave excitation device of laser Raman spectrometer |
| CN103221806A (en)* | 2010-09-10 | 2013-07-24 | 奥林巴斯株式会社 | Optical analysis method using optical measurement in multiple wavelength bands |
| CN103221806B (en)* | 2010-09-10 | 2015-11-25 | 奥林巴斯株式会社 | Use the optical analysis method of the measurement of the light of plural wavelength band |
| CN103403176A (en)* | 2010-12-21 | 2013-11-20 | 生物膜控制公司 | Method for measuring the resistance of films |
| CN103403176B (en)* | 2010-12-21 | 2016-09-28 | 生物膜控制公司 | For the method measuring the resistance of thin film |
| CN104928347A (en)* | 2015-07-03 | 2015-09-23 | 北京科技大学 | Method for observing different gene phenotype cells and distribution in growth process of bacillus subtilis biological film in real time |
| CN104928347B (en)* | 2015-07-03 | 2018-05-01 | 北京科技大学 | Different genes phenotype cell and the method for distribution during a kind of real-time monitored bacillus subtilis biofilm development |
| CN105184853A (en)* | 2015-08-14 | 2015-12-23 | 深圳大学 | Unicell three-dimensional image generation method based on optical flow analysis |
| CN105184853B (en)* | 2015-08-14 | 2018-04-10 | 深圳大学 | A kind of unicellular three-dimensional image generating method based on optical flow analysis |
| US10908405B2 (en) | 2015-09-02 | 2021-02-02 | Inscopix, Inc. | Systems and methods for color imaging |
| US11733501B2 (en) | 2015-09-02 | 2023-08-22 | Inscopix Inc. | Systems and methods for color imaging |
| US11690696B2 (en) | 2015-11-05 | 2023-07-04 | Inscopix, Inc. | Systems and methods for optogenetic imaging |
| US11197735B2 (en) | 2015-11-05 | 2021-12-14 | Inscopix, Inc. | Systems and methods for optogenetic imaging |
| US12251272B2 (en) | 2015-11-05 | 2025-03-18 | Inscopix, Inc. | Systems and methods for optogenetic imaging using semi-kinematic coupling |
| CN108474736A (en)* | 2015-11-05 | 2018-08-31 | 英思克斯公司 | System and method for the imaging of light science of heredity |
| CN108474736B (en)* | 2015-11-05 | 2022-01-25 | 英思克斯公司 | Systems and methods for optogenetic imaging |
| CN109642869A (en)* | 2016-04-15 | 2019-04-16 | 伯克利之光生命科技公司 | Methods, systems and kits for in-dock assays |
| US11798300B2 (en) | 2016-06-13 | 2023-10-24 | Nanolive Sa | Method of characterizing and imaging microscopic objects |
| CN109564617A (en)* | 2016-06-13 | 2019-04-02 | 纳诺利弗股份有限公司 | The method of characterization and imaging micro-object |
| CN109564617B (en)* | 2016-06-13 | 2023-09-26 | 纳诺利弗股份有限公司 | Method for characterizing and imaging microscopic objects |
| CN109690613B (en)* | 2016-09-16 | 2023-10-13 | 凯杰有限公司 | Proximity Impact Compensation |
| CN109690613A (en)* | 2016-09-16 | 2019-04-26 | 凯杰有限公司 | Proximity interference compensation |
| CN110049818B (en)* | 2016-10-20 | 2021-11-02 | 海因生命科学股份有限公司 | Methods and apparatus for optical excitation of multiple analytes in an array of reaction vessels and for collecting fluorescence from the analytes |
| CN110049818A (en)* | 2016-10-20 | 2019-07-23 | 海因生命科学股份有限公司 | For the multiple analytes in optical excitation reaction vessel array and the method and apparatus for acquiring the fluorescence from analyte |
| US11397148B2 (en) | 2017-06-27 | 2022-07-26 | Life Technologies Holdings Pte Ltd | Method of analyzing liquid samples, microplate reader and computer program |
| CN111094943A (en)* | 2017-06-27 | 2020-05-01 | 生命科技控股私人有限公司 | Method, microplate reader and computer program for analyzing liquid samples |
| US11946859B2 (en) | 2017-06-27 | 2024-04-02 | Life Technologies Corporation | Method of analyzing liquid samples, microplate reader and computer program |
| CN107462556A (en)* | 2017-07-26 | 2017-12-12 | 广东省生态环境技术研究所 | A kind of intuitively electroactive detection method of biomembrane |
| CN107462556B (en)* | 2017-07-26 | 2020-01-21 | 广东省生态环境技术研究所 | Visual biological membrane electric activity detection method |
| US11789016B2 (en) | 2017-10-15 | 2023-10-17 | Phenomex Inc. | Methods, systems and kits for in-pen assays |
| CN109087272A (en)* | 2018-10-17 | 2018-12-25 | 天津师范大学 | For acquiring the noise reduction system and application method of simulative medicine twilight image |
| CN110823863A (en)* | 2019-10-31 | 2020-02-21 | 中国南方电网有限责任公司电网技术研究中心 | Method, device and equipment for detecting algae on the surface of insulating material |
| TWI826990B (en)* | 2021-03-31 | 2023-12-21 | 大陸商深圳中科飛測科技股份有限公司 | Detection apparatus and detection method |
Also Published As
| Publication number | Publication date |
|---|---|
| CA2485611A1 (en) | 2003-11-20 |
| GB0211068D0 (en) | 2002-06-26 |
| US20060275847A1 (en) | 2006-12-07 |
| KR20050007540A (en) | 2005-01-19 |
| AU2003226568A1 (en) | 2003-11-11 |
| WO2003095995A1 (en) | 2003-11-20 |
| IL165008A0 (en) | 2005-12-18 |
| JP2005525551A (en) | 2005-08-25 |
| EP1504250A1 (en) | 2005-02-09 |
Similar Documents
| Publication | Publication Date | Title |
|---|---|---|
| CN1668913A (en) | Methods for evaluating biofilms | |
| Stephens et al. | Light microscopy techniques for live cell imaging | |
| Vonesch et al. | The colored revolution of bioimaging | |
| CN106461540B (en) | System and method for automated imaging of chromophore-labeled samples | |
| Shroff et al. | Photoactivated localization microscopy (PALM) of adhesion complexes | |
| Smith | Basic confocal microscopy | |
| CN101228428A (en) | fluorescence nanoscopy | |
| JP2010500574A (en) | Method for detecting a fluorescent signal in a biological sample | |
| KR100753616B1 (en) | Device and test method of microbe | |
| JP4106626B2 (en) | Fluorescence image measuring method and apparatus | |
| Ugawa et al. | High-speed 3D imaging flow cytometry with optofluidic spatial transformation | |
| Mol et al. | Automated STED nanoscopy for high-throughput imaging of cellular structures | |
| JP4779518B2 (en) | Fluorescence reader and microorganism counting device | |
| WO2007029821A1 (en) | Apparatus for counting the number of microorganisms | |
| JP5140956B2 (en) | Microbe counting device | |
| US20250180483A1 (en) | Device for measuring intrinsic autofluorescence of a biological sample and method using thereof | |
| Dahms et al. | Advanced microscopy in mycology | |
| Grohmann et al. | Techniques in studying biofilms and their characterization: microscopy to advanced imaging system in vitro and in situ | |
| JP2007060945A (en) | Microbe counting device | |
| JP4792880B2 (en) | Microorganism counting method and microorganism counting apparatus | |
| KR101188233B1 (en) | A diagnosis apparatus for biochip | |
| Mekuria et al. | Basic Principles and Applications of Live Cell Microscopy Techniques: A Review | |
| Cecic et al. | Technologies supporting analytical cytology: clinical, research and drug discovery applications | |
| Sharp | Section 2 Confocal laser scanning microscopy | |
| Spille | Three-dimensional single particle tracking in a light sheet microscope |
Legal Events
| Date | Code | Title | Description |
|---|---|---|---|
| C06 | Publication | ||
| PB01 | Publication | ||
| C10 | Entry into substantive examination | ||
| SE01 | Entry into force of request for substantive examination | ||
| C02 | Deemed withdrawal of patent application after publication (patent law 2001) | ||
| WD01 | Invention patent application deemed withdrawn after publication |