CN1535435A - Method and apparatus for analyzing manufacturing data - Google Patents
Method and apparatus for analyzing manufacturing dataDownload PDFInfo
- Publication number
- CN1535435A CN1535435ACNA028147685ACN02814768ACN1535435ACN 1535435 ACN1535435 ACN 1535435ACN A028147685 ACNA028147685 ACN A028147685ACN 02814768 ACN02814768 ACN 02814768ACN 1535435 ACN1535435 ACN 1535435A
- Authority
- CN
- China
- Prior art keywords
- data
- analysis
- mining
- data mining
- tool
- Prior art date
- Legal status (The legal status is an assumption and is not a legal conclusion. Google has not performed a legal analysis and makes no representation as to the accuracy of the status listed.)
- Granted
Links
Images


Classifications
- G—PHYSICS
- G06—COMPUTING OR CALCULATING; COUNTING
- G06Q—INFORMATION AND COMMUNICATION TECHNOLOGY [ICT] SPECIALLY ADAPTED FOR ADMINISTRATIVE, COMMERCIAL, FINANCIAL, MANAGERIAL OR SUPERVISORY PURPOSES; SYSTEMS OR METHODS SPECIALLY ADAPTED FOR ADMINISTRATIVE, COMMERCIAL, FINANCIAL, MANAGERIAL OR SUPERVISORY PURPOSES, NOT OTHERWISE PROVIDED FOR
- G06Q10/00—Administration; Management
- G06Q10/06—Resources, workflows, human or project management; Enterprise or organisation planning; Enterprise or organisation modelling
- G—PHYSICS
- G06—COMPUTING OR CALCULATING; COUNTING
- G06F—ELECTRIC DIGITAL DATA PROCESSING
- G06F16/00—Information retrieval; Database structures therefor; File system structures therefor
- G06F16/20—Information retrieval; Database structures therefor; File system structures therefor of structured data, e.g. relational data
- G06F16/24—Querying
- G06F16/245—Query processing
- G06F16/2453—Query optimisation
- G—PHYSICS
- G06—COMPUTING OR CALCULATING; COUNTING
- G06F—ELECTRIC DIGITAL DATA PROCESSING
- G06F16/00—Information retrieval; Database structures therefor; File system structures therefor
- G06F16/20—Information retrieval; Database structures therefor; File system structures therefor of structured data, e.g. relational data
- G06F16/24—Querying
- G06F16/245—Query processing
- G06F16/2458—Special types of queries, e.g. statistical queries, fuzzy queries or distributed queries
- G06F16/2465—Query processing support for facilitating data mining operations in structured databases
- G—PHYSICS
- G06—COMPUTING OR CALCULATING; COUNTING
- G06F—ELECTRIC DIGITAL DATA PROCESSING
- G06F17/00—Digital computing or data processing equipment or methods, specially adapted for specific functions
- G—PHYSICS
- G06—COMPUTING OR CALCULATING; COUNTING
- G06F—ELECTRIC DIGITAL DATA PROCESSING
- G06F16/00—Information retrieval; Database structures therefor; File system structures therefor
- G06F16/20—Information retrieval; Database structures therefor; File system structures therefor of structured data, e.g. relational data
- G06F16/25—Integrating or interfacing systems involving database management systems
- G06F16/254—Extract, transform and load [ETL] procedures, e.g. ETL data flows in data warehouses
- G—PHYSICS
- G06—COMPUTING OR CALCULATING; COUNTING
- G06F—ELECTRIC DIGITAL DATA PROCESSING
- G06F16/00—Information retrieval; Database structures therefor; File system structures therefor
- G06F16/20—Information retrieval; Database structures therefor; File system structures therefor of structured data, e.g. relational data
- G06F16/28—Databases characterised by their database models, e.g. relational or object models
- G06F16/283—Multi-dimensional databases or data warehouses, e.g. MOLAP or ROLAP
- Y—GENERAL TAGGING OF NEW TECHNOLOGICAL DEVELOPMENTS; GENERAL TAGGING OF CROSS-SECTIONAL TECHNOLOGIES SPANNING OVER SEVERAL SECTIONS OF THE IPC; TECHNICAL SUBJECTS COVERED BY FORMER USPC CROSS-REFERENCE ART COLLECTIONS [XRACs] AND DIGESTS
- Y10—TECHNICAL SUBJECTS COVERED BY FORMER USPC
- Y10S—TECHNICAL SUBJECTS COVERED BY FORMER USPC CROSS-REFERENCE ART COLLECTIONS [XRACs] AND DIGESTS
- Y10S707/00—Data processing: database and file management or data structures
- Y10S707/99931—Database or file accessing
- Y10S707/99933—Query processing, i.e. searching
- Y10S707/99935—Query augmenting and refining, e.g. inexact access
- Y—GENERAL TAGGING OF NEW TECHNOLOGICAL DEVELOPMENTS; GENERAL TAGGING OF CROSS-SECTIONAL TECHNOLOGIES SPANNING OVER SEVERAL SECTIONS OF THE IPC; TECHNICAL SUBJECTS COVERED BY FORMER USPC CROSS-REFERENCE ART COLLECTIONS [XRACs] AND DIGESTS
- Y10—TECHNICAL SUBJECTS COVERED BY FORMER USPC
- Y10S—TECHNICAL SUBJECTS COVERED BY FORMER USPC CROSS-REFERENCE ART COLLECTIONS [XRACs] AND DIGESTS
- Y10S707/00—Data processing: database and file management or data structures
- Y10S707/99931—Database or file accessing
- Y10S707/99933—Query processing, i.e. searching
- Y10S707/99936—Pattern matching access
- Y—GENERAL TAGGING OF NEW TECHNOLOGICAL DEVELOPMENTS; GENERAL TAGGING OF CROSS-SECTIONAL TECHNOLOGIES SPANNING OVER SEVERAL SECTIONS OF THE IPC; TECHNICAL SUBJECTS COVERED BY FORMER USPC CROSS-REFERENCE ART COLLECTIONS [XRACs] AND DIGESTS
- Y10—TECHNICAL SUBJECTS COVERED BY FORMER USPC
- Y10S—TECHNICAL SUBJECTS COVERED BY FORMER USPC CROSS-REFERENCE ART COLLECTIONS [XRACs] AND DIGESTS
- Y10S707/00—Data processing: database and file management or data structures
- Y10S707/99941—Database schema or data structure
- Y10S707/99942—Manipulating data structure, e.g. compression, compaction, compilation
- Y—GENERAL TAGGING OF NEW TECHNOLOGICAL DEVELOPMENTS; GENERAL TAGGING OF CROSS-SECTIONAL TECHNOLOGIES SPANNING OVER SEVERAL SECTIONS OF THE IPC; TECHNICAL SUBJECTS COVERED BY FORMER USPC CROSS-REFERENCE ART COLLECTIONS [XRACs] AND DIGESTS
- Y10—TECHNICAL SUBJECTS COVERED BY FORMER USPC
- Y10S—TECHNICAL SUBJECTS COVERED BY FORMER USPC CROSS-REFERENCE ART COLLECTIONS [XRACs] AND DIGESTS
- Y10S707/00—Data processing: database and file management or data structures
- Y10S707/99941—Database schema or data structure
- Y10S707/99944—Object-oriented database structure
- Y10S707/99945—Object-oriented database structure processing
Landscapes
- Engineering & Computer Science (AREA)
- Theoretical Computer Science (AREA)
- Physics & Mathematics (AREA)
- Databases & Information Systems (AREA)
- General Physics & Mathematics (AREA)
- Business, Economics & Management (AREA)
- General Engineering & Computer Science (AREA)
- Data Mining & Analysis (AREA)
- Economics (AREA)
- Strategic Management (AREA)
- Human Resources & Organizations (AREA)
- Entrepreneurship & Innovation (AREA)
- Computational Linguistics (AREA)
- Software Systems (AREA)
- Mathematical Physics (AREA)
- Game Theory and Decision Science (AREA)
- General Business, Economics & Management (AREA)
- Tourism & Hospitality (AREA)
- Quality & Reliability (AREA)
- Operations Research (AREA)
- Marketing (AREA)
- Educational Administration (AREA)
- Fuzzy Systems (AREA)
- Probability & Statistics with Applications (AREA)
- Development Economics (AREA)
- General Factory Administration (AREA)
- Management, Administration, Business Operations System, And Electronic Commerce (AREA)
Abstract
Translated fromChineseDescription
Translated fromChinese本申请要求如下专利申请的权益:(1)2001年7月16日申请的美国临时申请第60/305,256号;(2)2001年7月30日申请的美国临时申请第60/308,125号;(3)2001年7月30日申请的美国临时申请第60/308,121号;(4)2001年7月30日申请的美国临时申请第60/308,124号;(5)2001年7月30日申请的美国临时申请第60/308,123号;(6)2001年7月30日申请的美国临时申请第60/308,122号;(7)2001年8月6日申请的美国临时申请第60/309,787号;和(8)2001年8月3日申请的美国临时申请第60/310,632号,此处提及的全部都被合并。This application claims the benefit of the following patent applications: (1) U.S. Provisional Application No. 60/305,256, filed July 16, 2001; (2) U.S. Provisional Application No. 60/308,125, filed July 30, 2001;( 3) U.S. Provisional Application No. 60/308,121 filed on July 30, 2001; (4) U.S. Provisional Application No. 60/308,124 filed on July 30, 2001; (5) U.S. Provisional Application No. 60/308,124 filed on July 30, 2001; U.S. Provisional Application No. 60/308,123; (6) U.S. Provisional Application No. 60/308,122, filed July 30, 2001; (7) U.S. Provisional Application No. 60/309,787, filed August 6, 2001; and (8) US Provisional Application No. 60/310,632, filed August 3, 2001, all references herein are incorporated.
发明领域field of invention
本发明的一个或多个实施例涉及用于分析在工厂中产生的信息的方法和装置,其中工厂例如但不限于是集成电路(“IC”)制造或者装配工厂(即“半导体fab”或者称“fab”)。One or more embodiments of the invention relate to methods and apparatus for analyzing information generated in a factory, such as, but not limited to, an integrated circuit ("IC") manufacturing or assembly facility (ie, a "semiconductor fab" or "fab").
发明背景Background of the invention
图1示出了一种在集成电路(“IC”)制造或者装配工厂(即“半导体fab”或称“fab”)中根据原有技术的产品分析工具基础结构。如图1中所示,掩模车间1000产生十字线板1010。如图1中所示,在被用来在圆片或者衬底上装配(和测试)集成电路的fab中(术语圆片和衬底可被交换使用以表示所有类型的半导体圆片或衬底,其例如但不限定为玻璃衬底),当通过不同的工序步骤处理圆片时,生产进度跟踪系统1020(“WIP跟踪系统1020”)跟踪圆片。WIP跟踪系统1020跟踪例如但不限定为通过以下工具的圆片:注入工具1030;扩散、氧化、沉积工具1040;化学机械平面化工具1050(“CMP工具1050”);抗蚀剂涂层1060(例如但不限定为为涂覆光致抗蚀剂的工具);步进控制器工具1070;显影器工具1080;蚀刻/清洁工具1090;激光测试工具1100;参数检验工具1110;圆片分类工具1120;和最后测试工具1130。这些工具代表了大部分在工厂中用来生产集成电路的工具,然而这种列举意在说明,并不是详尽的。Figure 1 illustrates a product analysis tool infrastructure according to prior art in an integrated circuit ("IC") manufacturing or assembly facility (ie, a "semiconductor fab" or "fab"). As shown in FIG. 1 ,
如图1中所示,一个工厂包括大量用于获得工具水平(tool level)测试值和用于使各个处理自动化的系统。举例来说,如图1中所示,工具水平测试和自动化系统包括工具数据库1210,用以启用工具水平测试和自动化任务,例如处理工具管理(例如处理配方(process receipt)管理)和工具传感器测量数据采集和分析。例如(说明而非限制),PC服务器1230下载处理配方数据给工具(通过配方模块1233),从工具传感器(从传感器模块1235)接收工具传感器测量数据,其中,处理配方数据和工具传感器测量数据被存储在比如工具数据库1210中。As shown in Figure 1, a factory includes a large number of systems for obtaining tool level test values and for automating various processes. For example, as shown in FIG. 1 , the tool level testing and automation system includes a
再如图1中所示,工厂包括大量处理测量工具。比如,缺陷测量工具1260和1261;十字线板缺陷测量工具1265;覆盖缺陷测量工具1267;缺陷检查工具1270(“DRT 1270”);CD测量工具1280(“临界尺寸测量工具1280”);和电压对比测量工具1290,其中,处理测量工具由处理评价工具1300驱动。As also shown in Figure 1, the factory includes a large number of process measurement tools. For example,
仍然如图1中所示,操作具体分析工具驱动某些处理测量工具。例如,缺陷处理工具1310分析由缺陷测量工具1260和1261产生的数据;十字线板分析工具1320分析由十字线板缺陷测量工具1265产生的数据;覆盖分析工具1330分析由覆盖缺陷测量工具1267产生的数据;CD分析工具1340分析由CD测量工具1280产生的数据,而测试件(testware)工具1350分析由激光测试工具1100、参数检验工具1110、圆片分类工具1120和最后测试工具1130产生的数据。Still as shown in FIG. 1 , operation specific analysis tools drive certain process measurement tools. For example,
还如图1所示,数据库跟踪/相关工具通过通信网从一个或多个应用特定分析工具获得数据。例如,统计分析工具1400从例如缺陷管理工具1310、CD分析工具1340和测试件工具1350等工具处获得数据,并且将数据存储在关系数据库1410中。As also shown in FIG. 1, the database tracking/correlation tool obtains data from one or more application-specific analysis tools over a communication network. For example,
最后,成品管理方法被应用到存储在数据提取数据库1420中的数据,该数据是在通信网上从WIP跟踪系统1020和工具数据库1210中提取的。Finally, the finished product management method is applied to the data stored in the
在原有技术中,在fab中使用的成品管理系统受到许多问题困扰。图2说明一种在fab中使用的原有技术处理,此处的原有技术处理指的是生产线终端(end-of-line)监控。生产线终端监控是一种处理,其使用一个“跟踪指示符”反馈回路。举例来说,如图2中的方框2000所示,诸如低产量、低质量和/或装置的低速度的跟踪指示符(其为示例而非限定)得到识别。然后在方框2010,“坏批量”量度(例如与产生该跟踪指示符的圆片批量相关的测量值)与用作度量标准的规格相比较。如果该量度是“规格外”的,则处理在方框2030继续,其中采取对“规格外”事件的操作,并且对处理控制工程师提供反馈以该纠正“规格外”情况。反之,如果该量度是“规格内”的,则处理在方框2020继续进行,其中分析关于缺陷的过去历史的工厂资料。如果这是一个先前得到识别的问题,则处理在方框2040继续,否则(即没有过去资料)的话,处理在方框2050继续。在方框2040,根据对于过去被识别的问题的批量说明或者工具说明而采用操作,并且将反馈提供给处理控制工程师以采取与先前采取的操作类型相同的操作。如方框2050所示,进行对工具或器件工艺的历史数据的故障关联。如果发现关联,则处理在方框2060继续,否则,如果没有发现关联,则处理在方框2070继续。在方框2060,“坏的”工具或器件工艺受到“修理”,并将反馈提供给处理控制工程师。在方框2070,执行工厂维修工作。In the prior art, the finished product management system used in the fab suffers from many problems. Figure 2 illustrates a legacy technology process used in a fab, where legacy technology process refers to end-of-line monitoring. End-of-line monitoring is a process that uses a "tracking indicator" feedback loop. For example, as shown at block 2000 in FIG. 2 , tracking indicators such as low yield, low quality, and/or low speed of the device (which are examples and not limitations) are identified. Then at block 2010, a "bad lot" metric (eg, a measurement associated with the wafer lot from which the trace indicator was generated) is compared to the specification used as the metric. If the metric is "out of specification", processing continues at block 2030, where action is taken on the "out of specification" event and feedback is provided to the process control engineer to correct the "out of specification" condition. Conversely, if the metric is "in specification," processing continues at block 2020, where plant data regarding the past history of defects is analyzed. If this is a previously identified problem, processing continues at block 2040, otherwise (ie, no past data) processing continues at block 2050. At block 2040, an action is taken based on the batch specification or tool specification for a problem identified in the past, and feedback is provided to the process control engineer to take the same type of action as previously taken. As represented by block 2050, fault correlation to historical data for a tool or device process is performed. If an association is found, processing continues at block 2060 , otherwise, if no association is found, processing continues at block 2070 . At block 2060, the "bad" tool or device process is "repaired" and feedback is provided to the process control engineer. At block 2070, plant maintenance work is performed.
有若干问题与上述的生产线终端监视处理有关。例如:(a)低产量经常是由多种问题导致的;(b)“规格”极限值经常是作为未经确认的理论结果而设定的;(c)过去产品的故障历史的资料经常未得到记录,或者如果其被记录,该记录却没有被广泛分发;(d)数据和数据存取是分段的;以及(e)必须在执行关联分析之前产生一个有效假设,而关联的数目很大,并且用于执行关联分析的资源有限。There are several issues associated with the end-of-line monitoring process described above. For example: (a) low yields are often caused by various problems; (b) "specification" limits are often set as unconfirmed theoretical results; (c) data on past product failure histories are often not available is documented, or if it is documented, the record is not widely distributed; (d) data and data access are segmented; and (e) a valid hypothesis must be generated before association analysis can be performed, and the number of associations is small Large, and limited resources for performing association analysis.
例如,一个典型的数据反馈和问题处理的工程工程一般需要以下步骤:(a)确定问题(这一步骤的典型时间大约是1天);(b)选择关键的分析变量,举例来说,诸如有成品百分比、缺陷百分比等等(这一步骤的典型时间大约是一天);(c)形成关于选定的关键分析变量异常的一个假设(这一步骤的典型时间大约是一天);(d)用不同的“基本感性认识(gut feel)”方法排列假设(这一步骤的典型时间大约是一天);(e)开发实验性对策和一个实验性检验计划(这一步骤的典型时间大约是一天);(f)进行实验和收集数据(这一步骤的典型时间大约是一天);(g)拟合模型(这一步骤的典型时间大约是一天);(h)分析模型(这一步骤的典型时间大约是一天);(i)解释模型(这一步骤的典型时间大约是一天);和(j)运行确认测试以校验一种改进(这一步骤的典型时间大约是二十天),或者如果没有改进,则运行下一个起始于(c)的实验,其通常包括五个(5)迭代。结果,解决一个问题的典型时间大约是七(7)个月。For example, a typical engineering project for data feedback and problem solving generally requires the following steps: (a) identifying the problem (the typical time for this step is about 1 day); (b) selecting key analysis variables, such as There are percent finished, percent defective, etc. (typical time for this step is about one day); (c) form a hypothesis about anomalies in selected key analysis variables (typical time for this step is about one day); (d) Align hypotheses with different "gut feel" methods (typical time for this step is about one day); (e) develop experimental countermeasures and an experimental testing plan (typical time for this step is about one day ); (f) conducting experiments and collecting data (typical time for this step is about one day); (g) fitting the model (typical time for this step is about one day); (h) analyzing the model (typical time for this step is about one day); typical time is about one day); (i) interpret the model (typical time for this step is about one day); and (j) run validation tests to verify an improvement (typical time for this step is about twenty days) , or if there is no improvement, run the next experiment starting at (c), which typically consists of five (5) iterations. As a result, the typical time to resolve an issue is approximately seven (7) months.
随行距缩小并且更新的技术和原料被用于制造集成电路(例如铜金属化和新的低k介质膜),降低缺陷率(无论其是由处理或污染导致的)正日益变得更加重要。发现根本问题的时间(time-to-root-cause)是征服缺陷率的关键。这些问题并未由于向300毫米圆片的转变而变得更为容易。因而,在有许多事情同时交汇的情况下,成品率下降(yield ramping)正变为一个主要的障碍。As line pitches shrink and newer technologies and materials are used to fabricate integrated circuits (such as copper metallization and new low-k dielectric films), reducing defect rates (whether caused by handling or contamination) is becoming increasingly more important. The time-to-root-cause of discovering the root problem is the key to conquering the defect rate. These issues have not been made any easier by the move to 300mm wafers. Thus, with many things converging at the same time, yield ramping is becoming a major obstacle.
除了上面提出的问题之外,半导体工厂为了监控缺陷率和不断地降低缺陷密度而在缺陷检测设备和缺陷数据管理软件上花费了它们大量的资金,还出现了另一个问题。缺陷数据管理软件中目前的原有技术需要进行开发而使一个或多个以下内容可交付使用:(a)缺陷趋势(例如依据缺陷类型和大小的帕累托(pereto));(b)圆片级缺陷与成品率比较图表;以及(c)依据类型和大小而在一个特定和人工基础上的抑制比(kill ratio)。对于这些可交付使用内容中的每一个,一个主要的缺点就是用户必须拥有他/她想测定内容的先前资料。然而由于数据庞大,用户倾向于根本原因的概率是很低的。另外,即使对于每个变量都产生图表,即假定有大量的图表,实际上用户去分析每一个这样的图表也是不可能的。In addition to the problems raised above, another problem arises as semiconductor fabs spend their vast sums of money on defect inspection equipment and defect data management software in order to monitor defect rates and continually reduce defect densities. Current legacy techniques in defect data management software need to be developed to enable one or more of the following deliverables: (a) defect trends (e.g., pereto by defect type and size); Wafer-level defect vs. yield comparison graph; and (c) kill ratio by type and size on an ad-hoc and artificial basis. With each of these deliverables, a major drawback is that the user must have prior knowledge of the content he/she wants to measure. However, due to the large amount of data, the probability of users leaning towards the root cause is very low. In addition, even if a graph is generated for each variable, ie, assuming a large number of graphs, it is practically impossible for the user to analyze each such graph.
除了上面提出的问题之外,在半导体工厂中大部分被使用的数据是“间接计量(indirect metrology)数据”,这又出现了一个问题。本文中的术语“间接计量”指的是在间接量度上的数据采集,其中,间接量度假定是以可预测的方式涉及到fab内的生产过程。例如,当一条金属线路在IC上被图案化之后,一个临界尺寸扫描电子显微镜(“CD-SEM”)可能被用来在一组给定圆片上的各种位置测量该金属线路的宽度。在一个半导体fab内,一个商用值(business value)被分配给一个计量基础结构,这与一个计量的数据测量值怎样能迅速地被转化为可操作信息以停止该fab中一个“变坏的”加工的进程有关系。然而实际上,间接计量识别了大量的潜在问题,并且这些问题经常缺乏与特定的或者“可操作的”fab处理工具或者处理工具加工条件的清楚关系。由于需要不可预知的时间范围用以在数据内建立因果关系,在处理成套工具和大部分半导体fab的间接计量之间缺乏明确关系导致了在工程技术人员基础结构上的重大投资和重大的“报废”原料成本。In addition to the problems raised above, the fact that most of the data used in semiconductor factories is "indirect metrology data" presents another problem. The term "indirect metrology" in this context refers to the collection of data on indirect metrology where the indirect metrology is assumed to relate to the production process within the fab in a predictable manner. For example, after a metal line is patterned on an IC, a critical dimension scanning electron microscope ("CD-SEM") may be used to measure the width of the metal line at various locations on a given set of wafers. Within a semiconductor fab, a business value is assigned to a metrology infrastructure, and how quickly a metrology data measurement can be translated into actionable information to stop a "going bad" in the fab The process of processing is related. In practice, however, indirect metrology identifies a large number of potential problems, and these problems often lack a clear relationship to specific or "operational" fab processing tools or processing tool processing conditions. The lack of a clear relationship between process kits and indirect metering for most semiconductor fabs has resulted in significant investments in engineering staff infrastructure and significant "obsolescence" due to the unpredictable time horizons required to establish causal relationships within the data "Raw material costs.
除了计量之外,最近几年内已在配置数据提取系统上花费了大量资金,该系统用于记录在圆片正在被处理期间的半导体片处理工具的运转情况。尽管基于临时,处理工具数据目前至少在一些fabs中对于某一小部分处理工具是可用的,使用该数据以对应于正被制造的集成电路而优化处理工具的性能则受到限制。这是由于如何表示IC性能数据与如何表示处理工具临时数据之间的关系是断开的。例如,集成电路上的数据计量必定与给定的一批圆片(称为一个批量)、或者一个给定的圆片、或者圆片上集成电路的一个给定的子集有关。另一方面,来自处理工具临时数据的数据计量表示为在圆片处理期间的特定时刻的处理工具内不连续的运转情况。例如,如果处理工具有一个隔离处理室,那么当一个给定的圆片保持在该处理室中的时候,可以每毫秒记录处理室压力。在这个例子中,对于任何给定的圆片,处理室压力数据将被记录为一系列唯一的1000个测量值。因为IC数据量度是单一离散的测量值,所以这种数据格式不能用一个给定的IC数据量度"合并"到一个分析表里。与“合并”处理工具临时数据和离散数据量度有关的困难已经导致处理工具临时数据作为一种优化工厂效率的手段而言,其使用受到限制。In addition to metrology, a large amount of money has been spent in recent years on deploying data extraction systems that record the behavior of semiconductor wafer processing tools while wafers are being processed. Although on an ad hoc basis, processing tool data is currently available for a small subset of processing tools at least in some fabs, there are limitations to using this data to optimize the performance of the processing tools corresponding to the integrated circuits being fabricated. This is due to the disconnect between how IC performance data is represented and how process tool interim data is represented. For example, data metrics on integrated circuits must relate to a given batch of wafers (referred to as a lot), or to a given wafer, or to a given subset of integrated circuits on a wafer. Data metrics from process tool interim data, on the other hand, represent discrete operating conditions within the process tool at a particular point in time during wafer processing. For example, if a processing tool has an isolated process chamber, the process chamber pressure can be recorded every millisecond while a given wafer is held in the process chamber. In this example, chamber pressure data will be recorded as a series of unique 1000 measurements for any given wafer. Because IC data metrics are single discrete measurements, this data format cannot be "merged" into an analysis table with a given IC data metric. Difficulties associated with "merging" process tool temp data and discrete data metrics have resulted in limited use of process tool temp data as a means of optimizing plant efficiency.
除了上面提出的问题之外,还出现了一个问题,该问题涉及使用关系数据库以存储在fab中产生的数据。诸如ORACLE和SQL Server(其为示例而非限制)的关系数据库产生了组织和引用已定义了或者分配了数据单元之间关系的数据的需要。在使用中,这些关系数据库技术的用户(例如一个程序员)提供一种模式,其预先规定每个数据单元任何与任何其它数据单元相关。只要该数据库被填充,该数据库的一个操作用户就可以基于预先建立的关系而提出对包含在该数据库中的信息的查询。在这方面,当这样的关系数据库在一个fab中被使用时,原有技术的关系数据库有两个引起困难的固有问题。第一个问题是:一个用户(例如程序设计员)在为要建模的数据创建具体模式(即关系和数据库表)之前必须对数据有一个本质的认识。该模式实现了特别保护数据单元关系的控制。将数据放置到数据库里的软件和从该数据库检索数据的应用软件必须使用在数据库中的任两个数据单元之间的模式关系。第二个问题是:尽管关系数据库有用于检索小型数据交易(举例来说诸如为储蓄、航空机票发售等等)的良好的TPS率(即交易处理规格),但是它们不适当地执行而产生很大的数据集以支持例如为在fab中提高成品率所需(除其它需求之外)的数据库存和数据挖掘的决策支持系统。In addition to the issues raised above, a problem arises concerning the use of relational databases to store data generated in the fab. Relational databases such as ORACLE and SQL Server (which are examples and not limitations) create the need to organize and reference data that has defined or assigned relationships between data units. In use, a user of these relational database technologies (eg, a programmer) provides a schema that predefines how each data unit is related to any other data unit. Once the database is populated, an operational user of the database can formulate queries for information contained in the database based on pre-established relationships. In this regard, prior art relational databases have two inherent problems that cause difficulties when such relational databases are used in a fab. The first problem is: a user (such as a programmer) must have an essential understanding of the data before creating a specific schema (ie, relationships and database tables) for the data to be modeled. This mode implements the control of specially protected data unit relationships. Software that places data into a database and application software that retrieves data from that database must use the schema relationship between any two data units in the database. The second problem is that although relational databases have good TPS rates (i.e., transaction processing specifications) for retrieving small data transactions (such as, for example, savings, airline ticket sales, etc.), they do not perform properly and produce large Large data sets to support decision support systems such as data inventory and data mining needed (among other requirements) to improve yield in the fab.
除了上面提出的问题之外,还由于原有技术数据分析算法而出现了一个问题,其中该算法在半导体制造业中被用以量化生产的成品率问题。这类算法包括线性回归分析和决策树数据挖掘方法的人工操作。这些算法受两个基本问题困绕:(a)在一个给定的数据集内几乎总有不止一个成品率影响问题;然而,这些算法在一个给定的fab内最好也就是被用于找到“一个”回答而不是量化一套分立的成品影响问题;以及(b)这些算法不能完全被自动化以用于“离手(hands off)”分析;即线性回归分析需要分析前的人工准备和定义各变量类别,并且决策树数据挖掘需要有一个“人类用户”,以便定义分析中的目标变量以及为分析自身定义各种各样的参数。In addition to the problems raised above, a problem arises due to the original technology data analysis algorithm used in the semiconductor manufacturing industry to quantify the yield problem of production. Such algorithms include manual manipulation of linear regression analysis and decision tree data mining methods. These algorithms suffer from two fundamental problems: (a) there is almost always more than one yield impact problem within a given dataset; however, these algorithms are best used within a given fab to find "One" answers rather than quantifies a discrete set of finished product impact questions; and (b) these algorithms cannot be fully automated for "hands off" analysis; i.e., linear regression analysis requires manual preparation and definition prior to analysis Each variable category, and decision tree data mining requires a "human user" in order to define the target variables in the analysis and to define various parameters for the analysis itself.
除上面提出的问题之外,相当大的数据集中进行数据挖掘时还出现一个问题。例如根据原有技术,仅仅在利用某一级别领域的知识(即例如与一个数据流中有哪些字段表示“所关心的”信息有关的信息)来过滤数据集、从而减少待分析的数据内的变量的尺寸和数量之后,对相当大的数据集进行数据挖掘才是可能的。一旦产生这种经过简化的数据集,该数据集就被对照一个已知的分析技术/模型、通过让专家定义一个价值系统(例如何者重要的定义)、然后推测应驱动该分析系统的“标准答案”而受到挖掘。为了使这个方法有效,工具一般以人工加以配置并由要最终评估所得结果的人加以操作。这些人通常就是对被评估的处理负责的同一些人,这是因为需要的就是他们的行业专长(更准确的说是他们对特定处理的知识)以便收集数据和产生用以挖掘数据集的恰当询问。让这些行业专家负担所需要的数据挖掘和相关任务引导使得他们的时间使用效率低下,而且因为数据挖掘处理大量由人工干预驱动,所以从处理到处理获得的结果是不一致的。最后,即使在成功时,大部分“增益”已经损失或者减少。例如,人工地操作数据和分析的耗时处理在工时和设备方面是代价昂贵的,并且如果没有及早取得结果,则没有足够的时间来实现所发现的改变方案。In addition to the issues raised above, another problem arises when data mining is performed on fairly large datasets. For example, according to the prior art, only a certain level of domain knowledge (that is, information about which fields in a data stream represent "interested" information) is only used to filter the data set, thereby reducing the number of data to be analyzed. After the size and number of variables are determined, data mining is only possible on fairly large datasets. Once such a reduced data set is produced, the data set is compared against a known analysis technique/model by having experts define a value system (e.g. the definition of how important) and then infer the "criteria" that should drive the analysis system The answer" was excavated. In order for this method to be effective, the tools are typically manually configured and operated by the person who ultimately evaluates the resulting results. These people are usually the same people responsible for the process being assessed, since it is their industry expertise (more precisely, their knowledge of the particular process) that is required in order to collect the data and generate the appropriate data sets for mining the data set. ask. Burdening these industry experts with the required data mining and related task guidance makes their time an inefficient use, and because the data mining process is heavily driven by human intervention, inconsistent results are obtained from process to process. In the end, even when successful, most of the "gain" has been lost or reduced. For example, the time-consuming process of manually manipulating data and analysis is costly in terms of man-hours and equipment, and if results are not achieved early, there is not enough time to implement discovered change scenarios.
除了上面提出的问题之外,如下所示还出现了一个问题。成品率提高的一个重要部分和工厂的效率改善的监控工作被集中于生产线终端功能测试数据、在线参数数据、在线计量数据和用于装配集成电路的特定工厂处理工具之间的相关性上。在实现这种相关性时,必须确定特定的“数据的数值列”与工厂处理工具数据的全部列(该处理工具数据被表示为分类属性)之间涉及的关系。一个好的相关性是由处理工具(即分类的)数据的一个特殊列定义的,其使得该列的其中一个类别与一个选定数值列(即被称为因变量或者“DV”)的不期望的数值范围相关。这样一种分析的目的是识别出一个被怀疑导致不期望的DV读取的类别(如一个工厂处理工具),并将其从fab生产流程中除去,直到工程师能够确信处理工具正在正确运行时为止。虽然半导体fab数据库内给出大量数目的工具和“类似工具的”分类数据,仍难以用人工电子数据表格搜索技术(称为“通用性研究commonality study)”)来隔离一个劣等处理工具。尽管有这种限制,在半导体行业内仍然有用以检测坏的处理工具或者分类处理数据的技术。例如,这可以通过执行批量通用性分析来完成。然而,该技术需要先了解一个特定的处理层,并且如果一个用户对故障的特性没有充分了解,那么该技术可能是耗时的。另一种技术则是使用先进的数据挖掘算法,如神经网络或者决策树。这些技术可能是有效的,然而数据挖掘中所需要的广泛领域的专门知识却使这些技术难以建立。另外,公知这些数据挖掘算法由于用这种普通的数据分析技术需要大量算法开销因而是缓慢的。运用以上分析技术,与将精力耗费在坏的处理工具被发现后将其实际修复相比,用户一般会耗费更多的时间以设法通过一种基础的(rudiment)或者合成的分析来识别一个问题。In addition to the issues raised above, a problem arises as shown below. A significant portion of the yield improvement and fab efficiency improvement monitoring effort is focused on the correlation between end-of-line functional test data, in-line parametric data, in-line metrology data, and specific fab processing tools used to assemble integrated circuits. In implementing this correlation, it is necessary to determine the relationship involved between a particular "numeric column of data" and all columns of plant process tool data represented as categorical attributes. A good correlation is defined by a special column of the processing instrument (i.e. categorical) data such that one of the categories of the column differs from a selected numerical column (i.e. known as the dependent variable or "DV"). Depending on the desired value range. The purpose of such an analysis is to identify a class suspected of causing undesired DV reads (such as a fab processing tool) and remove it from the fab production flow until the engineer can be confident that the processing tool is operating correctly . Despite the large number of tools and "tool-like" category data given within semiconductor fab databases, it is still difficult to isolate an inferior processing tool using manual spreadsheet search techniques (known as a "commonality study"). Despite this limitation, there are still techniques within the semiconductor industry to detect bad processing tools or classify processing data. For example, this can be done by performing batch generality analysis. However, this technique requires prior knowledge of a specific processing layer and can be time-consuming if a user does not have a good understanding of the nature of the fault. Another technique is to use advanced data mining algorithms such as neural networks or decision trees. These techniques can be effective, but the broad domain expertise required in data mining makes them difficult to establish. Additionally, these data mining algorithms are known to be slow due to the large algorithmic overhead required with such common data analysis techniques. Using the above analysis techniques, the user will typically spend more time trying to identify a problem through a rudiment or synthetic analysis than spending energy actually fixing the bad processing tool after it is discovered .
最后,除了上面提出的问题之外,还有一个问题出现如下。因为适合搜索大规模数据集内的相关性,所以诸如神经网络、规则归纳搜索和决策树的挖掘算法当其与普通的线性统计相比时往往是更期望的方法。然而,当利用这些算法而在诸如Window 2000服务器这样的低成本硬件平台上分析大量数据集的时候,会产生几个限制。在这些限制当中,主要关心的是这些技术需要利用随机存取存储器和扩展的CPU加载。一个大型半导体制造数据集(例如大于40M字节)的一个神经网络分析往往会持续几个小时以上,并且甚至可能突破对Windows 2000操作系统的2G字节随机存取存储器限制。另外,尽管未必突破对单个Windows进程的随机存取存储器限制,在这些大规模数据集上的规则归纳或者决策树分析在分析完成之前可能仍然会持续几个小时。Finally, in addition to the issues raised above, one more issue arises as follows. Mining algorithms such as neural networks, rule-inductive search, and decision trees are often more desirable methods when compared to ordinary linear statistics because of their suitability for searching for correlations within large-scale data sets. However, several limitations arise when using these algorithms to analyze large datasets on low-cost hardware platforms such as Window 2000 servers. Among these limitations, the main concern is that these techniques require utilization of random access memory and extended CPU loading. A neural network analysis of a large semiconductor manufacturing dataset (eg, greater than 40Mbytes) would often last for several hours or more, and might even break the 2Gbyte RAM limit of the Windows 2000 operating system. In addition, rule induction or decision tree analysis on these large-scale datasets can still take hours before the analysis is complete, although not necessarily breaking the RAM limitations of a single Windows process.
在此技术中需要解决一个或多个上述问题。There is a need in the art to address one or more of the above issues.
发明内容Contents of the invention
有利的是,本发明的一个或多个实施例满足了本项技术中的上述需要。特别是,本发明的一个实施例是一种在集成电路装配工厂(“fab”)中用于获得数据挖掘信息的方法,该方法包括下列步骤:(a)从一个或多个系统、工具、和数据库中收集来自工厂的数据,所述系统、工具、和数据库在工厂中产生数据或者从工厂中收集数据;(b)将数据格式化并将格式化数据存储在一个源数据库中;(c)按照用户规定的配置文件提取在数据挖掘中使用的数据部分;(d)根据用户规定的分析配置文件而对被提取的数据部分进行数据挖掘;(e)将数据挖掘的结果存储在一个结果数据库中;和(f)提供对该结果的存取。Advantageously, one or more embodiments of the present invention fulfill the aforementioned needs in the art. In particular, one embodiment of the invention is a method for obtaining data mining information in an integrated circuit assembly factory ("fab"), the method comprising the steps of: (a) extracting information from one or more systems, tools, (b) format the data and store the formatted data in a source database; (c) ) extracting data portions used in data mining according to a user-specified profile; (d) performing data mining on the extracted data portion according to a user-specified analysis profile; (e) storing the results of data mining in a results in the database; and (f) providing access to the results.
附图说明Description of drawings
图1示出了一个成品分析工具基础结构,其存在于根据原有技术的一个集成电路(“IC”)制造或者装配工厂(一个“半导体fab”或者“fab”);Figure 1 illustrates a finished product analysis tool infrastructure that exists in an integrated circuit ("IC") manufacturing or assembly facility (a "semiconductor fab" or "fab") according to prior art;
图2示出了一个在fab中使用的原有技术处理,这种过去的处理在本文中称为生产线终端监控;Figure 2 illustrates a legacy technology process used in the fab, this past process is referred to herein as end-of-line monitoring;
图3示出了根据本发明的一个或多个实施例组成的一个Fab数据分析系统,以及当它施用于本发明的一个或多个实施例以供一个集成电路生产加工使用时,数据从原始的无格式输入直到数据挖掘结果的自动化流程;Fig. 3 shows a Fab data analysis system formed according to one or more embodiments of the present invention, and when it is applied to one or more embodiments of the present invention for the use of an integrated circuit production process, data from the original Automated process from unformatted input to data mining results;
图4示出了根据本发明的一个或多个实施例用于将非结构化数据事件结构化到智能库里的方法的逻辑数据流程;FIG. 4 shows a logical data flow of a method for structuring unstructured data events into a smart library according to one or more embodiments of the present invention;
图5示出了原始基于临时的(temporal-based)数据的一个例子,并且特别是处理工具射束电流作为时间函数的一个图表;Figure 5 shows an example of raw temporal-based data, and in particular a graph of the processing tool beam current as a function of time;
图6示出了图5中所示的原始基于临时的数据怎样被分解为分段;Figure 6 shows how the original interim-based data shown in Figure 5 is broken down into segments;
图7示出了与图6的分段1有关的原始基于临时的数据;Figure 7 shows the original interim-based data related to
图8示出了在BIN-S上分段7内的Y范围相关性的一个例子;Figure 8 shows an example of Y-range correlation within
图9示出了一个三级的分支数据挖掘行程;Figure 9 shows a three-level branch data mining itinerary;
图10示出了根据本发明一个或多个实施例由DataBrainCmdCenter执行的分配队列;Figure 10 illustrates the allocation queue executed by DataBrainCmdCenter according to one or more embodiments of the invention;
图11示出了根据本发明的一个或多个实施例构成的用户编辑和配置文件接口模块的一个分析模板用户界面部分;Figure 11 illustrates an analysis template user interface portion of a user editing and configuration file interface module constructed in accordance with one or more embodiments of the present invention;
图12示出了根据本发明的一个或多个实施例构成的分析模板部分的一个配置文件;Figure 12 illustrates a configuration file for analysis template sections constructed in accordance with one or more embodiments of the present invention;
图13示出了一个超棱椎(hyper-pyramid)立方体织构;Figure 13 shows a hyper-pyramid cube texture;
图14示出了一个超棱椎立方体并且高亮度显示一层;Figure 14 shows a hyperpyramid cube with one layer highlighted;
图15示出了一个超立方体层(自我组织映射(self organized map)),其来自一个从超棱椎立方体的第二层提取的超立方体;Figure 15 shows a hypercube layer (self organized map (self organized map)) from a hypercube extracted from the second layer of the hyperpyramid cube;
图16展示一个自我组织映射,其具有高、低和中区域而且每个高群(High Cluster)和低群(Low Cluster)区域均被标记用于将来的自动化映射匹配分析;Figure 16 shows a self-organizing map with high, low and middle regions and each of the high cluster (High Cluster) and low cluster (Low Cluster) regions are marked for future automated map matching analysis;
图17示出了通过一个超立方体的单元投影;Figure 17 shows cell projection through a hypercube;
图18示出了从一个数值的分配定义的“虚拟”类别;Figure 18 shows a "virtual" category defined from an assignment of values;
图19示出了对间隙分数(间隙分数=所有间隙(不在任何圆圈内)之和)和直径分数(直径分数=三个圆圈的DV平均直径)的计算,其中DV类别基于DV的数值分布;Figure 19 shows the calculation of Gap Score (Gap Score = sum of all gaps (not in any circle)) and Diameter Score (Diameter Score = DV average diameter of three circles), where DV categories are based on the numerical distribution of DV;
图20示出了对一个给定的IV的主分数的计算,考虑了三个因数:间隙分数的幅值、直径分数的幅值,以及在一系列DV分数列表上出现的IV的次数;Figure 20 shows the calculation of the principal score for a given IV, taking into account three factors: the magnitude of the gap score, the magnitude of the diameter score, and the number of times the IV appears on a list of DV scores;
图21示出了输入到一个DataBrain模块的数据矩阵的子集例子;Figure 21 shows an example subset of a data matrix input to a DataBrain module;
图22示出了一个数目(BIN)与类别(工具标识符)运行比较的例子;Figure 22 shows an example of a number (BIN) versus category (tool identifier) running comparison;
图23示出了对三个工具的分数阈值(scoring threshold)应用;Figure 23 shows the application of scoring thresholds to three tools;
图24示出了一个来自fab中的缺陷检验工具或者说缺陷检查工具的缺陷数据文件的例子;Figure 24 shows an example of a defect data file from a defect inspection tool in the fab or in other words a defect inspection tool;
图25示出了由数据转换算法创建的数据矩阵的例子;和Figure 25 shows an example of a data matrix created by a data transformation algorithm; and
图26示出了来自DefectBrain模块的一个典型输出。Figure 26 shows a typical output from the DefectBrain module.
具体实施方式Detailed ways
本发明的一个或多个实施例尤其通过提供一个或多个下列内容而使得成品率提高:(a)集成电路(“IC”)制造工厂(即“半导体fab”或者说“fab”)的数据馈送,即借助于建立多格式数据文件流;(b)标引数以万计的测量值的数据库,举例来说,其诸如(但不限于)为:标引在诸如(但不限于)一个Oracle文件系统中的数以万计测量值的混合数据库;(c)具有用于分析的多种数据集的快速出口的决策分析数据馈送;(d)使用“数据值系统”的自动问题应答的独立分析(unassisted analysis)自动化;(e)多种数据挖掘技术,举例来说,其诸如(但不限于)为:神经网络、规则归纳和多元(multi-variant)统计法;(f)可视化工具(visualizationtool),其借助于多种改进的统计法而适于进行查找;和(g)对端-端Web传送系统提供迅速配置的应用服务提供商(“ASP”)。使用本发明的一个或多个这种实施例,一个数据反馈和问题解决的典型工程处理一般需要下列步骤:(a)自动的问题定义(此步骤所用的典型时间大约是0天);(b)监控所有例如成品百分比、缺陷百分比等关键分析变量(此步骤所用的典型时间大约是0天);(c)形成关于所有关键分析变量异常的假设(此步骤所用的典型时间大约是一天);(d)使用统计可信度和固定性标准(fixability criteria)(即例如可能在基于经验的配置文件中被提供的指令)的排列假设,其表明如何计分或者估计假设,例如(但不限于)包括衡量特定的人工智能规则,请注意:用于分类数据(如工具数据)的固定性标准与用于数值数据(如传感器数据)的固定性标准是不同的(此步骤所用的典型时间大约是一天);(e)开发实验性策略和实验性测试计划(此步骤所用的典型时间大约是一天);(f)完成实验和收集数据(此步骤所用的典型时间大约是一天);(g)拟合模型(此步骤所用的典型时间大约是一天);(h)诊断模型(此步骤所用典型时间大约是一天);(i)解释模型(此步骤所用典型时间大约是一天);和(j)运行确认测试以便无重复地校验改进(此步骤所用的典型时间大约是二十天)。结果是解决一个问题的典型时间大约为一个半(1.5)月。One or more embodiments of the present invention enable improved yields, inter alia, by providing one or more of: (a) data from integrated circuit ("IC") manufacturing plants (i.e., "semiconductor fabs" or "fabs") feed, i.e. by means of streams of multi-format data files; (b) indexing databases of tens of thousands of measurements, such as, but not limited to, indexing in databases such as, but not limited to, an Oracle Hybrid database of tens of thousands of measurements in the file system; (c) decision analysis data feed with fast export of multiple data sets for analysis; (d) independent question answering using "data value system" Automation of unassisted analysis; (e) various data mining techniques such as, but not limited to, neural networks, rule induction, and multi-variant statistics; (f) visualization tools ( visualizationtool), which is adapted to perform lookups by means of various improved statistics; and (g) an application service provider ("ASP") that provides rapid deployment to an end-to-end Web delivery system. Using one or more such embodiments of the present invention, a typical engineering process of data feedback and problem solving generally requires the following steps: (a) automatic problem definition (typical time taken for this step is about 0 days); (b ) monitor all key analytical variables such as percent finished, percent defective, etc. (typical time taken for this step is approximately 0 days); (c) form hypotheses about abnormalities in all key analytical variables (typical time taken for this step is approximately one day); (d) rank assumptions using statistical confidence and fixability criteria (i.e., instructions such as might be provided in empirically based configuration files) that indicate how to score or estimate assumptions, such as (but not limited to) ) including measuring specific AI rules, note that the fixedness criteria used for categorical data (such as tool data) are different from those used for numerical data (such as sensor data) (the typical time taken for this step is about one day); (e) develop experimental strategies and experimental test plans (typical time for this step is about one day); (f) complete experiments and collect data (typical time for this step is about one day); (g ) fit the model (typical time for this step is about one day); (h) diagnose the model (typical time for this step is about one day); (i) interpret the model (typical time for this step is about one day); and ( j) Run validation tests to verify improvements without duplication (typical time taken for this step is around twenty days). The result is that the typical time to resolve a problem is approximately one and a half (1.5) months.
图3示出了根据本发明的一个或多个实施例组成的Fab数据分析系统,以及当该系统被应用到用于集成电路生产加工的本发明一个或多个实施例时,从原始未格式化的输入到数据挖掘结果的数据自动化流程。根据本发明的一个或多个这种实施例,通过使分析处理中的每个步骤以及从分析处理的一个阶段到下一阶段的流程自动化,可极大降低或消除人工数据挖掘进程以及将结果数据挖掘转变成工艺改进中的缺点。另外,按照本发明的一个或多个其它实施例,将用户或者客户入口设置到数据分析装置上,并且通过通常可用的已安装的接口如因特网浏览器而使得结果查看成为有效的。应用服务提供商(“ASP”)系统分布方法(即为本领域普通技术人员公知的基于Web的数据传送方法)是实现这种Web浏览器接口的一种优选方法。同样,图3中所示的Fab数据分析系统3000的一个或多个实施例可以由一个公司加以使用,其中对来自一个或多个fab站点的数据执行数据采集和分析;或者Fab数据分析系统3000的一个或多个实施例可以由多个公司加以使用,其中对来自每个公司的一个或多个fab站点数据执行数据采集分析。另外,对于一个或多个这样的实施例,用户或者客户的设置和/或查看结果可能不同于来自同一公司的不同部分的用户或者客户,或者是不同于来自不同公司的不同部分的用户或者客户,其中数据依据报表(account)管理方法的安全性要求而被分离。FIG. 3 shows a Fab data analysis system composed according to one or more embodiments of the present invention, and when the system is applied to one or more embodiments of the present invention for integrated circuit production and processing, from the original unformatted The automated process of inputting data into data mining results. According to one or more such embodiments of the invention, by automating each step in the analytical process and the flow from one stage of the analytical process to the next, the manual data mining process and the integration of results into Data mining turns into shortcomings in process improvement. Additionally, according to one or more other embodiments of the invention, user or client portals are provided on the data analysis device and results viewing is enabled through commonly available installed interfaces such as Internet browsers. The Application Service Provider ("ASP") system distribution method, a Web-based data delivery method known to those of ordinary skill in the art, is a preferred method of implementing such a Web browser interface. Likewise, one or more embodiments of the Fab
根据本发明的一个或多个实施例:(a)自动地检索、处理并且格式化数据,从而使数据挖掘工具能够利用其工作;(b)应用数值系统并且自动产生问题,从而使数据挖掘工具返回相应结果;和(c)结果被自动张贴并且可远程存取,从而使得能根据该结果而迅速采取校正措施。According to one or more embodiments of the invention: (a) automatically retrieve, process, and format data so that data mining tools can work with it; (b) apply numerical systems and automatically generate questions so that data mining tools A corresponding result is returned; and (c) the result is automatically posted and remotely accessible, enabling prompt corrective action based on the result.
如图3所示,ASP数据传送模块3010是一种数据采集处理或模块,其从fab中大量不同类型的数据源中的任何一个获得不同类型数据,例如(但不限于):(a)来自MES(“管理执行系统”)的批量设备历史数据;(b)来自设备接口数据源的数据;(c)来自fab提供的数据源中的处理工具配方和处理工具测试程序;以及(d)原始设备数据,其举例来说诸如(但不限于)为:传感器测试数据、E测试(电子测试)数据、缺陷测量数据、远程诊断数据类集和来自工厂提供数据源的后处理数据。根据本发明的一个或多个实施例,ASP数据传送模块3010接收和/或收集以自定义的和/或工具专用的格式传送的数据,该数据举例来说诸如(但不限于)是来自客户数据采集数据库(集中式的或是类型的)和/或直接来自数据源的数据,其中该客户数据采集数据库存储来自工具的原始数据输出。此外,这种数据接收或者收集可以是在预定基础上进行,或是按需进行。更进一步,数据可以被编码,并且可以作为FTP文件而在在一个安全的网络如自定义内联网中进行传输(例如作为安全的电子邮件)。根据本发明的一个实施例,ASP数据传送模块3010是一种软件应用,其运行于PC服务器上,并且根据为本领域普通技术人员所公知的大量方法中的任何一种方法而以C++、Perl和VB进行编码。举例来说,通常可用的典型数据包括:(a)一般包括大约12,000项/批量(一个批量圆片一般指的是25个通常在处理期间处于一个盒(cassette)内一同传送的圆片)的WIP(加工中的)信息,WIP信息一般被处理工程师存取;(b)设备接口信息,例如一般包括大约120,000项/批量的原始处理工具数据,请注意,过去设备接口信息一般是不被任何人存取的;(c)一般包括大约1000项/批量的处理计量信息,处理计量信息一般被处理工程师存取;(d)一般包括大约1,000项/批量的缺陷信息,该缺陷信息一般被成品工程师存取;(e)一般包括大约10,000项/批量的E测试(电子测试)信息,该E测试数据一般被设备工程师存取;和(f)一般包括大约2,000项/批量的分类(关于数据记录(Datalog)和位图)信息,该分类信息一般被产品工程师存取。人们能够容易地理解,这些数据能够积累高达大约每个圆片总共136,000个唯一的测量值。As shown in Figure 3, the ASP
如图3中所示,数据转换模块3020根据大量为本领域普通技术人员所知的方法中的任何一种,将由ASP数据传送模块3010接收到的原始数据转换和/或翻译成为一种包括关键字/列/数据的数据格式,并且转换后数据被存储在自适应数据库3030中。由数据转换模块3020执行的数据转换处理需要:分类原始数据;整理处理,该处理举例来说诸如(但不限于)为Fab测试、批量标识符(LotID)转换(例如这具有铸造(foundry)用途)、圆片标识符(WaferID)转换(例如Sleuth和Scribe ID)、和圆片/十字线板/电路小片坐标规范化和转换(其例如但不限定为取决于是否将沟槽(notch)或者圆片基准量度用于坐标规范化);以及数据规格,其举例来说诸如(但不限于)是对下列数据的规格限制:E测试数据、Bin传感器数据(例如对特定生产线终端传感器测试而言可能有10到100种故障型式)、计量数据、和计算数据,该计算数据例如(但不限于)有批量、圆片、区域和层数据等类型。根据本发明的一个实施例,数据转换模块3020是一种软件应用,其运行于在PC服务器上,并且根据为本领域普通技术人员所公知的大量方法中的任何一种而以C++、Perl和VB被编码。根据本发明的一个这样的实施例,由数据转换模块3020执行的数据转换处理需要根据本领域普通技术人员公知的许多方法中的任何一种、使用一组通用的转换器来将原始的数据文件转换成为“完全格式化的”工业不可知(agnostic)文件(即数据格式是“通用化(communized)”的,从而无论数据可以被转换成多少数据格式,都只使用少数格式)。根据本发明的一个或多个实施例,当不包含工业上特定的信息时,转换后文件保留存在于原始数据中的“级别”信息(用以使后续处理能够将较低粒度数据“积累”成较高粒度数据)。只要原始数据转换成这种格式,就将其送入自适应数据库3030以便存储。As shown in FIG. 3 , the
根据本发明的一个或多个实施例,通过使用下列分级模式来定义一种输入数据的普通文件格式:小工具标识符(WidgetID)、何处?、何时?、何数据?以及数值。例如,对一个半导体fab特别地作出以下这些定义,小工具标识符是通过下列一个或多个内容来标识的:批量标识符(LotID)、圆片标识符(WaferID)、沟槽标识符(SlotID)、十字线板标识符(ReticleID)、电路小片标识符(DieID)和子电路小片(Sub-die)的x、y直角坐标;何处?是通过一个或多个处理流程/流水线制造步骤和子步骤来标识的。何时?是通过一个或多个测量的日期/时间来标识的。何数据?是作为一个或多个测量名称来标识的,其例如但不限于是成品、测量类型/类别、和圆片分类。数值?例如但不限于被定义为成品51.4%。利用这样的一个实施例能够表示任何工厂数据。According to one or more embodiments of the invention, a common file format for input data is defined by using the following hierarchical schema: Widget Identifier (WidgetID), Where? ,when? , What data? and the value. For example, the following definitions are specifically made for a semiconductor fab. The gadget identifier is identified by one or more of the following: lot identifier (LotID), wafer identifier (WaferID), slot identifier (SlotID ), the crosshair board identifier (ReticleID), the circuit small piece identifier (DieID) and the x, y rectangular coordinates of the sub-circuit small piece (Sub-die); where? Is identified by one or more process flow/line manufacturing steps and sub-steps. when? are identified by the date/time of one or more measurements. What data? is identified as one or more measurement designations such as but not limited to Finished Goods, Measurement Type/Category, and Wafer Classification. value? For example but without limitation is defined as finished product 51.4%. Any plant data can be represented with such an embodiment.
根据本发明的一个或多个实施例,数据转换模块3020一般会翻译一种由ASP数据传送模块3010所收集的新类型数据。特别是,数据转换模块3020会造成“实时的(on-the-fly)”数据库“握手”,从而例如通过创建一个用于数据存取的散列码而将该新数据存储到自适应数据库3030中。最后,根据本发明的一个实施例,当数据到达Fab数据分析系统3000的时候,它被存储在自适应数据库3030中。According to one or more embodiments of the invention,
根据本发明的一个或多个实施例,ASP数据传送模块3010包含一个模块,该模块从SmartSys数据库收集处理工具传感器数据(SmartSysTM应用程序是可购自应用材料有限公司的一种软件应用程序,其收集、分析并且储存数据,例如来自fab的处理工具传感器数据)。另外,数据转换模块3020包含一个模块,该模块将SmartSysTM处理工具传感器数据转换成数据集,由主加载器模块3050和主编制器模块3060准备该数据集以用于数据挖掘。According to one or more embodiments of the invention, the ASP
根据本发明的一个或多个实施例,以一种数据转换算法使得来自单个处理(即工厂或者装配线)工具的基于临时的数据能够用于在计量数据度量与现存的非最佳化的fab(即工厂情况)之间建立一种“直接”链接。该数据转换算法的一个重要部分是一种将基于临时的工作条件数据转换成关键的集成电路特定统计值的方法,其中该工作条件数据是在圆片处理期间在处理(工厂或者装配线上的)工具内产生的,该统计值因此能以如下所述的方式由DataBrain引擎模块3080加以分析,从而提供自动化的数据挖掘故障缺陷探查分析。根据本发明的一个或多个实施例,要执行下列步骤以翻译此类基于临时的处理工具数据:According to one or more embodiments of the present invention, a data transformation algorithm enables interim-based data from a single process (i.e., factory or assembly line) tool to be used in metrology data metrics with existing non-optimized fab ( i.e. plant situation) to establish a "direct" link between. An important part of the data conversion algorithm is a method of converting temporary based operating condition data that is processed during wafer processing (factory or assembly line) into key integrated circuit specific statistics Generated within the tool, this statistical value can thus be analyzed by the
a.创建一个配置文件(使用一个如下所述的用户接口),其指定一个普通的基于临时的数据格式的数字化粒度;和a. Create a configuration file (using a user interface as described below) that specifies a common temporal-based data format digitization granularity; and
b.使用该配置文件,将由ASP数据传送模块3010所接收到的基于临时的处理工具数据从各种文件格式(例如但非限定为ASCII数据)翻译成普通的基于临时的数据文件格式。b. Use the configuration file to translate the temporary-based processing tool data received by the ASP
以下展示一个对于普通的、基于临时的数据文件格式的格式定义的实施例。有利的是,根据这些实施例,没有必要所有的数据字段对于一个认为“重要的”文件都是完整的。反之,如下所述,一些数据字段可以稍后由一个与半导体制造执行系统(MES)主机通信的“后处理”数据填充例程加以填充。An example of a format definition for a common, temporary-based data file format is shown below. Advantageously, according to these embodiments, it is not necessary that all data fields be complete for a document to be considered "important". Conversely, as described below, some data fields may be populated later by a "post-processing" data population routine that communicates with the Semiconductor Manufacturing Execution System (MES) host.
<标题的开始><start of title>
[产品标识符代码][Product Identifier Code]
[批量标识符代码][Batch Identifier Code]
[原(parent)批量标识符代码][Original (parent) batch identifier code]
[圆片标识符代码][wafer identifier code]
[沟槽标识符代码][groove identifier code]
[WIP模块][WIP module]
[WIP子模块][WIP submodule]
[WIP子模块步骤][WIP submodule steps]
[跟踪进入(TRACKIN)日期][tracking entry (TRACKIN) date]
[跟踪离开(TRACKOUT)日期][Tracking out (TRACKOUT) date]
[处理工具标识符][processing tool identifier]
[使用的处理工具配方][Handler Recipe Used]
<标题的结束><end of title>
<数据的开始><start of data>
<参数的开始><start of parameter>
[参数英文名][parameter English name]
[参数标识符号码][parameter identifier number]
[数据采集起动时间][Data collection start time]
时间增量1,数据值1
时间增量1,数据值2
时间增量3,数据值3
..........
<参数的结束><end of parameter>
<参数的开始><start of parameter>
[参数英文名][parameter English name]
[参数标识符号码][parameter identifier number]
[数据采集起动时间][Data collection start time]
[数据采集结束时间][Data collection end time]
时间增量1,数据值1
时间增量1,数据值2
时间增量3,数据值3
...... …
<参数的结束><end of parameter>
<数据的结束><end of data>
根据这个实施例,需要上面以斜体列出的项目来使得文件内容与集成电路数据度量恰当地合并。According to this embodiment, the items listed above in italics are required for proper merging of file content with integrated circuit data metrics.
如上所述,根据本发明的一个或多个实施例,一个配置文件对基于临时的数据的翻译规定粒度,该基于临时的数据将以该粒度被表示为圆片统计值。根据一个这样的实施例,一个配置文件可能也包含一些信息,这些信息关系到哪些基于临时的原始的数据格式是由该特定的配置文件所处理的,而且包含一个或多个选项,该选项关系到原始档案的数据存档。以下是一个配置文件的实施例的一个示例。As noted above, according to one or more embodiments of the invention, a configuration file specifies the granularity for the translation of temporal-based data at which the temporal-based data will be represented as wafer statistics. According to one such embodiment, a configuration file may also contain information concerning which temporary-based raw data formats are handled by the particular configuration file and one or more options related to Data archiving to the original archive. The following is an example of an embodiment of a configuration file.
<标题的开始><start of title>
[适用于本配置文件的文件扩展名][file extension for this configuration file]
[原始数据存档文件<Y或N>][raw data archive file <Y or N>]
[创建图像存档文件<文件数目/参数>][Create image archive file <number of files/parameters>]
[图像存档文件分辩率][image archive file resolution]
<标题的结束><end of title>
<分析标题的开始><start of analysis title>
[全局图表统计<ON/OFF>,N分段][Global chart statistics <ON/OFF>, N segment]
[X轴时间统计,N分段][X-axis time statistics, N segments]
[Y轴参数统计,N分段][Y-axis parameter statistics, N segment]
<分析标题的结束><end of analysis title>
以下解释上面列举的配置文件参数。The configuration file parameters listed above are explained below.
文件扩展名:在配置文件中的这一行列出文件扩展名和/或命名约定关键词,其指定:一个给定的原始的、普通的基于临时的数据文件将被使用一个给定配置文件内定义的参数翻译。File extensions: This line in the configuration file lists the file extensions and/or naming convention keywords that specify: a given raw, normal temporary based data file will be used as defined within a given configuration file The parameter translation.
原始数据存档文件:配置文件中的这一行指定:如果原始数据的一个存档拷贝应该保持,则使用这个选项会导致该文件被压缩并且存储在一个存档目录结构中。Raw data archive file: This line in the configuration file specifies that if an archived copy of the raw data should be kept, using this option will cause the file to be compressed and stored in an archive directory structure.
创建图像存档文件:配置文件中的这一行指定:是否原始基于临时的数据文件内的数据应该以一种标准的x-y格式被制成图形,从而可以存储并迅速检索该数据的“原始的”视图,无需存档和交互式地绘制出该原始数据文件的整个内容(这些文件可能很大并且对单个处理工具可能合计高达每个月10到20G字节)。图像选项的数目使x-y数据曲线的不同关键区域的多个瞬态能够得到存储,因此还可使用该数据的“拉近(zoomed-in)”视图。Create image archive file: This line in the configuration file specifies: whether the data in the original scratch-based data file should be graphed in a standard x-y format, so that the "raw" view of the data can be stored and quickly retrieved , without archiving and interactively mapping out the entire contents of this raw data file (these files can be large and can add up to as much as 10 to 20 gigabytes per month for a single processing tool). The number of image options enables multiple instants of different key regions of the x-y data curve to be stored, so a "zoomed-in" view of the data is also available.
图像存档文件分辩率:配置文件中的这一行定义标准图像压缩的什么级别将被应用到任何通过创建图像存档文件选项被记录的x-y图表上。Image Archive Resolution: This line in the configuration file defines what level of standard image compression will be applied to any x-y diagram recorded via the Create Image Archive option.
全局图表统计:配置文件中的这一行指定:系统会产生对全部由上述配置文件所处理的文件格式的全局统计值,关于如何产生这些统计值的说明描述如下。Global chart statistics: This line in the configuration file specifies that the system will generate global statistics for all file formats handled by the above configuration file. The instructions on how to generate these statistics are described below.
X轴时间图表统计:配置文件中的这一行指出:系统会产生对全部由上述配置文件所处理的文件格式的X轴时间范围定义的统计值,关于如何产生这些统计值的说明描述如下。X-axis time chart statistics: This line in the configuration file indicates that the system will generate statistics defined for the X-axis time range of all file formats processed by the above configuration file. The instructions on how to generate these statistics are described below.
百分比数据图表统计:配置文件中的这一行指定:系统会产生对全部由上述配置文件所处理的文件格式的百分比数据统计值,关于如何产生这些统计值的说明阐明如下。Percentage data chart statistics: This line in the configuration file specifies that the system will generate percentage data statistics for all file formats handled by the above configuration file. The instructions on how to generate these statistics are explained below.
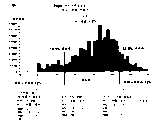
根据本发明一个或多个这样的实施例,下列统计(也被称为X轴时间图表统计)是对应于每个基于临时的数据的图表、在一个参数一个参数的基础上产生的。例如,对于一个给定的基于临时的数据集和一个给定的参数,数据被分成大量在配置文件内定义的分段。通过采用X轴的整个宽度(从最小的x值到最大的x值)并将它分成X轴范围中的N多个相等增量来定义X轴时间图表分段。对于每个分段产生并记录统计值。为理解这种统计如何起作用,首先参考图5,该图展示了一个原始的基于临时的数据的例子,且其特别是作为时间函数的处理工具射束电流的一个图表。图6则展示图5中所示的原始的基于临时的数据怎样被分解为分段,而图7展示的是与图6中的分段1有关的原始的基于临时的数据。According to one or more of these embodiments of the invention, the following statistics (also referred to as X-axis time graph statistics) are generated on a parameter by parameter basis for each temporally based data graph. For example, for a given temp-based data set and a given parameter, the data is divided into a number of segments defined in the configuration file. Defines X-axis time chart segments by taking the entire width of the X-axis (from the smallest x-value to the largest x-value) and dividing it into N equal increments in the X-axis range. Statistics are generated and recorded for each segment. To understand how such statistics work, reference is first made to Figure 5, which shows an example of raw temporal-based data, and in particular a graph of the treatment tool beam current as a function of time. FIG. 6 shows how the original temporal-based data shown in FIG. 5 is decomposed into segments, while FIG. 7 shows the original temporal-based data in relation to
以下是典型的分段统计(对于N多分段的一个例子,每分段10个统计值):The following are typical segment statistics (10 statistics per segment for an example of N multi-segment):
1.分段内区域1. In-segment area
2.分段中的数据的平均Y轴数值2. The average Y-axis value of the data in the segment
3.分段内的数据的Y轴数值的标准偏差3. The standard deviation of the Y-axis value of the data in the segment
4.分段的斜率4. The slope of the segment
5.分段的最小Y轴数值5. The minimum Y-axis value of the segment
6.分段的最大Y轴数值6. The maximum Y-axis value of the segment
7.来自先前的分段的Y轴平均值中的百分比变化7. Percent change in Y-axis mean from previous segment
8.来自下一个分段的Y轴平均值中的百分比变化8. The percentage change in the Y-axis mean from the next segment
9.来自先前的分段的Y轴标准偏差值中的百分比变化9. The percent change in the Y-axis standard deviation value from the previous segment
10.来自下一个分段的Y轴标准偏差值中的百分比变化10. The percentage change in the Y-axis standard deviation value from the next segment
图8展示在BIN_S上的分段7内Y范围的关系式的一个例子。通过使用以上信息,一个工艺工程师可以在处理工具内协调配方(处理工具调整),从而使之具有一个相应于较低BINS缺陷的范围。FIG. 8 shows an example of the relationship of the Y range in
根据本发明的一个实施例,下列29种统计值是从未经Tukey数据清理(data cleaning)的数据中计算得到的全局统计。According to an embodiment of the present invention, the following 29 statistical values are global statistics calculated from data without Tukey data cleaning (data cleaning).
1.曲线下的总面积1. Total area under the curve
2.为数10%或者更大的Y轴斜率变化2. A change in the slope of the Y-axis of 10% or more
3.X轴的95%数据宽度(即起始于数据中间,并且向左和向右以获得高达95%的数据)3. 95% data width of the X axis (i.e. start in the middle of the data and go left and right for up to 95% of the data)
4. 95%X轴数据宽度的Y轴平均值4. Y-axis average of 95% of X-axis data width
5. 95%X轴数据宽度的Y轴标准偏差5. Y-axis standard deviation of 95% X-axis data width
6. 95%X轴数据宽度的Y轴范围6. Y-axis range of 95% of X-axis data width
7.曲线下的X轴95%的面积7. 95% of the area under the curve on the X-axis
8.X轴最左边的2.5%的数据宽度8. The data width of the leftmost 2.5% of the X axis
9.曲线下的X轴最左边的2.5%面积9. The leftmost 2.5% area of the X-axis under the curve
10.X轴最右边的2.5%的数据宽度10. The data width of the rightmost 2.5% of the X axis
11.曲线下的X轴最右边的2.5%面积11. The rightmost 2.5% area under the curve on the X-axis
12.X轴的90%数据宽度(即起始于数据中间,并且向左和向右以获得90%)12. 90% data width of the X axis (i.e. start in the middle of the data, and go left and right to get 90%)
13. 90%的X轴数据宽度的Y轴平均值13. Y-axis average of 90% of X-axis data width
14. 90%X轴数据宽度的Y轴标准偏差14. Y-axis standard deviation of 90% X-axis data width
15. 90%X轴数据宽度的Y轴范围15. Y-axis range of 90% X-axis data width
16.曲线下的X轴90%的面积16. 90% of the area under the curve on the X-axis
17.X轴最左边的5%的数据宽度17. The data width of the leftmost 5% of the X axis
18.曲线下X轴最左边的5%面积18. The leftmost 5% area of the X-axis under the curve
19.X轴最右边的5%的数据宽度19. The data width of the rightmost 5% of the X axis
20.曲线下的X轴最右边的5%的面积。20. The area under the curve for the rightmost 5% of the X-axis.
21.X轴75%数据宽度(即起始于数据中间,并且向左和向右以获得75%)21. X-axis 75% data width (i.e. start in the middle of the data, and go left and right to get 75%)
22. 75%X轴数据宽度的Y轴平均值22. Y-axis average of 75% X-axis data width
23. 75%X轴数据宽度的标准偏差23. Standard Deviation of 75% X-Axis Data Width
24. 75%X轴数据宽度的Y轴范围24. Y-axis range of 75% X-axis data width
25.曲线下的X轴75%的面积25. 75% area under the X-axis under the curve
26.X轴最左边的12.5%的数据宽度26. The leftmost 12.5% of the data width of the X axis
27.曲线下的X轴最左边的12.5%面积27. The leftmost 12.5% area under the curve on the X-axis
28.X轴最右边的12.5%数据宽度28. The rightmost 12.5% data width of the X axis
29.曲线下的X轴最右边的12.5%面积29. The rightmost 12.5% area under the curve on the X-axis
尽管以上实施例中使用的百分比是通常的百分比,即90、95、75等,但是还有其它实施例,其中例如在重新定义数据的“心脏”范围而使其更大或更小变得重要的情况下,可以将这些百分比改成中间值。Although the percentages used in the above examples are the usual ones, i.e. 90, 95, 75, etc., there are other examples where it becomes important, for example, to redefine the "heart" of the data to make it larger or smaller In the case of , these percentages can be changed to intermediate values.
还有进一步的实施例,其中,与上面那些类似的全局统计利用5000%Tukey数据清理进行计算,并且还有的实施例中,与上面那些类似的全局统计用500%Tukey数据清理进行计算。Still further embodiments are in which global statistics similar to those above are computed with 5000% Tukey data cleaning, and still further embodiments in which global statistics similar to those above are computed with 500% Tukey data cleaning.
根据本发明的一个实施例,百分比数据统计和上面列举的X轴时间图表统计的10种统计相同。百分比数据与X轴时间统计之间的区别是定义分段的方法。对于X轴时间统计,分段是基于X轴的N个相等部分。但对于百分比数据统计,因为分段是按照包含在该分段内的数据的百分比来定义的,所以X轴上的分段宽度是变化的。例如,如果百分比数据分段被调整到有10个分段,那么第一个分段就应该是数据的第一个10%(用X轴作为参照,最左边10%的数据点)。According to an embodiment of the present invention, the percentage data statistics are the same as the 10 statistics of the X-axis time chart statistics listed above. The difference between percentage data and X-axis time statistics is the method by which segments are defined. For X-axis time statistics, segments are based on N equal parts of the X-axis. But for percentage data statistics, because the segment is defined according to the percentage of data contained in the segment, the segment width on the X-axis changes. For example, if the percentage data segments are scaled to have 10 segments, then the first segment should be the first 10% of the data (using the X-axis as a reference, the leftmost 10% of the data points).
如图3所示,主加载器模块3040(无论其是由时间产生(timegenerated)事件触发的还是由数据到达事件触发的)从自适应数据库3030(例如数据文件3035)中检索格式化数据,并将它转换到智能库3050中。根据本发明的一个实施例,智能库3050被实施为本领域普通技术人员所公知的Oracle关系数据库。根据本发明的另一实施例,当数据从fab中“滴(trickle)”入时,主加载器模块3040轮询自适应数据库3030中的目录,以便确定是否要检索并转送到智能库3050的数据量已经足够。As shown in FIG. 3 , the main loader module 3040 (whether it is triggered by a timegenerated event or a data arrival event) retrieves formatted data from an adaptive database 3030 (e.g., a data file 3035) and Convert it into
根据本发明的一个或多个实施例,主加载器模块3040和智能库3050包含了用于管理、引用并提取大量非结构化的关系数据的方法和装置。根据本发明的一个或多个实施例,智能库3050是一种包含智能库关系数据库组件和智能库文件系统组件的混合数据库。根据这样一个实施例,关系数据库组件(例如一个图表)使用一种散列标引算法来创建针对存储在分布式文件库中的离散数据的存取关键字。有利的是,这使非结构化的原始数据能够迅速转换为一种形式结构(formalstructure),从而绕过了各商业化数据库产品的限制并且利用了磁盘阵列中结构化文件存储所提供的速度。According to one or more embodiments of the invention, the
根据本发明的一个实施例,用于智能库3050的设计准备的第一步涉及定义可能存在的离散数据测量值的可应用级别。然而,根据本发明的一个或多个实施例,并不需要预计一个给定的离散数据有多少级别以便开始为该离散数据建立智能库3050的进程。相反,所需要的只是在智能库3050中的某一点定义新级别(或是子级或超级)与较早级别之间的关联。为便于理解这一点,请参考下面的示例。在一个fab内,一个常见的级别可能是一批圆片;这可以被标引为智能库3050中的级1。接下来,这批圆片内的每个具体的圆片可以被标引为级2。接下来,圆片上任一个具体的芯片子组可以被标引为级3(或被标引为更多级,这取决于子组类别的一致性)。有利的是,智能库3050的这种灵活性使任意给定的数据类型都能够被储存在智能库3050内,只要它的性质能够被标引到现有的、应用到该数据类型的最低粒度级即可。According to one embodiment of the invention, the first step in the design preparation for
有利的是,根据本发明的一个或多个实施例,智能库3050的数据加载处理比传统关系数据库的数据加载处理更为容易,这是因为对于智能库3050,每个新数据类型只须按照一种格式重写,该格式表示分立的制造级别和该具体级别标识符的数据测量值(或数据历史记录)之间的关系。例如在一个fab中,一个给定的数据文件必须被重写为包含“级1”标识符、“级2”标识符等等内容的各行,然后是为该批圆片组合记录的测量值。智能库3050的这种特性使得任何可应用数据都能够被加载而不必定义一个具体的关系数据库图表。Advantageously, according to one or more embodiments of the present invention, the data loading process of
有利的是,根据本发明的一个或多个实施例,智能库3050被设计成通过利用一种散列连接算法来快速累加和连接大量数据,从而输出大数据集以支持自动化的数据分析工作(将在下面详细描述)。在传统的关系数据库的设计中,这种大数据集输出需要在数据库内有大量“表连接(table-join)”(累加并输出数据)。如所周知,关系数据库表连接的使用导致如此大量数据集的输出处理高度集中于CPU,而有利的是,对于用“散列联接”算法从智能库3050输出大量数据集来说,情况并非如此。Advantageously, according to one or more embodiments of the present invention, the
图4说明了根据本发明实施例的一种用于将非结构化数据事件结构化而存入到智能库3050中的方法的逻辑数据流程。如图4所示,在方框4010,从fab数据仓库4000中检索fab数据。此fab数据可能具有许多不同形式中的任意一种形式,并且可能发源于许多不同源中的任意一个源,包括(但不限于)来自数据库中的历史数据,以及例如(但不限于)来自像传感器之类的处理工具监控装置的实时数据。接下来,尚未格式化的数据被馈送给数据分析器4020。应该理解,从fab仓库4000检索数据的方式和频率不影响数据分析器4020、数据库加载器4040或智能库3050的行为。接下来,数据分析器4020输出格式化的数据流4030,其中的格式化数据是一种可被数据库加载器4040接受的格式(这只是一个格式问题,并未引入任何有关数据的“知识”,即仅仅是如何使数据格式化)。接下来,数据库加载器4040读取格式化数据流4030。数据库加载器4040使用散列标引算法产生数据单元及其在文件系统4050中的位置之间的索引键(例如但不限定为,散列标引算法利用数据单元的数据级标识符来产生索引键)。接下来,数据被储存在文件系统4050中以便将来参考和使用,而参考文件系统4050的散列索引键被储存在关系数据库4060中。在本发明的一个或多个替换实施例中,通过将数据加载到以Oracle 9i数据集市中的级别加以区分和标引的表中来创建智能库3050。FIG. 4 illustrates a logical data flow of a method for storing unstructured data events into a
现在返回图3,主编制器模块3060存取智能库3050,并使用配置文件(其利用用户编辑和配置文件接口模块3055来产生)建立数据结构,以便用作数据挖掘程序的输入(在下面描述)。用户编辑和配置文件接口模块3055使用户能够创建由主编制器3050使用的结构数据的配置文件。例如,主编制器3050从智能库3050获得由配置文件规定的数据(其例如但不限于是特定参数值范围中的特定类型的数据),并且将它与配置文件所规定的来自智能库3050的其它数据(其例如但不限于是特定参数值范围中的另一特定类型的数据)组合。为完成上述工作,智能库3050的智能库关系数据库组件要参考智能库3050的智能库文件系统组件,以便使各种数据级别能够被快速合并成为信息的“向量高速缓存”,该“向量高速缓存”将被转换成在数据挖掘中使用的数据。配置文件使用户能够利用散列标引定义一个新的关系,从而产生一个新的信息“向量高速缓存”,然后再按照下述方式将新的“向量高速缓存”变成在数据挖掘中使用的数据(此数据在此将被称为“超立方体(hyhercube)”)。根据本发明的一个或多个实施例,主编制器模块3060是一种软件应用程序,其运行于PC服务器上,并按本领域普通技术人员公知的许多方法中的任意一种方法而以Oracle动态PL-SQL和Perl进行编码。Returning now to FIG. 3, the
操作中,主建造器模块3060使用配置文件接收和/或提取一个超立方体的定义。接下来,主编制器模块3060使用此超立方体定义来产生一个向量高速缓存定义。接下来,主编制器模块3060通过如下方式按照此向量高速缓存定义来创建信息的向量高速缓存:(a)利用散列索引键由智能库3050的智能库关系数据库组件检索由向量高速缓存定义所标识或规定的文件和数据单元列表;(b)由智能库3050的智能库文件系统组件检索文件库文件;和(c)以向量高速缓存定义中所标识的数据单元填充该向量高速缓存。接下来,主编制器模块3060按照下述方式使用超立方体定义由向量高速缓存信息产生超立方体,这些超立方体被分配一个标识符,此标识符在分析结果前进通过Fab数据分析系统3000时被用于识别该分析结果,并且被客户机用于复查分析结果。主编制器模块3060包含子模块,这些子模块建立超立方体、清洁超立方体(clean hypercube)数据以便按照本领域普通技术人员公知的许多方法中的任一种方法来去掉那些将不利地影响数据挖掘结果的数据,连接超立方体以便能够分析许多不同变量,并且将Bin和参量数据转换成为一种在数据挖掘中使用的形式(例如但不限于通过将事件驱动数据转换成为binned数据)。In operation, the
根据本发明的一个或多个实施例,主编制器模块3060包括数据清理器(data cleaner)或清除器(scruber)(其例如是按照本领域普通技术人员公知的许多方法中的任意一种方法所构造的Perl和C++软件应用程序),可以按照配置文件中提出的标准执行此数据清理,或者接收到用户输入时在一个特别基础上执行此数据清理。According to one or more embodiments of the present invention, the
根据本发明的一个或多个实施例,主编制器模块3060包括一个模块,它以各种文件格式导出电子表格给用户,该文件格式例如但不限于是SAS(一种本领域普通技术人员公知的数据库工具)、.jmp(对于观察并分析x-y数据而言JUMP绘图是为本领域普通技术人员公知的)、.xls(本领域普通技术人员公知的Microsoft Excel电子表格)以及.txt(本领域普通技术人员公知的文本文件格式)。根据本发明的一个或多个实施例,主编制器模块3060包括一个模块,它作为输入而接收用户产生的超立方体,并将向量高速缓存传送到DataBrain引擎模块3080用于分析。According to one or more embodiments of the present invention,
根据本发明的一个或多个实施例,数据转换模块3020、主加载器模块3040以及主编制器模块3060各自工作,提供自适应数据库3030、智能库3050的连续更新以及数据输出以用于数据挖掘。According to one or more embodiments of the present invention, the
仍如图3所示,WEB指令模块3070将从主编制器模块3060中输出的数据传送到DataBrain引擎模块3080用于分析。一旦被主编制器模块3060格式化的数据集文件可用于数据挖掘,自动化的数据挖掘处理即对照一个分析模板来分析数据集,以使在该分析模板中规定为相关的变量最大化或最小化,同时还要考虑到那些变量的相对重要的幅值。DataBrain引擎模块3080包括用户编辑和配置文件接口模块3055,它包含一个分析配置建立和模板编制器模块,该分析配置建立和模板编制器模块提供了用户接口,用以建立自定义的配置参数值和数据挖掘自动化文件以便DataBrain引擎模块3080使用。然后,DataBrain引擎模块3080通过在自学习神经网络内使用各变量的统计性质与各变量的相对贡献的组合来执行自动数据挖掘处理。一个给定的被定义的“重要”变量的统计分布和幅值(每一分析模板),或者例如但不限于是该变量对自组织神经网络图(“SOM”)结构的贡献,自动形成一个基础,可在此基础上产生相关问题然后将其交给最适合处理该特定类型的给定数据集的各种数据挖掘算法。Still as shown in FIG. 3 , the
根据本发明的一个或多个实施例,DataBrain引擎模块3080通过探查(explore)未知数据集内的统计比较以在大型未知数据集内提供灵活、自动、迭代的数据挖掘,从而提供“无手动”操作。这种算法灵活性在数据包含数字和分类属性的探查处理中特别有用。为充分探查这种数据所需的算法示例例如(但不限于)包括专用的方差分析(ANOVA)技术,该技术能够使分类数据和数字数据互相关联。另外,通常需要一个以上的算法,以便充分探查此种数据中的统计比较。可以在类似半导体制造业、电路板装配或平板显示器制造业等现代的分立的制造加工中找到此种数据。According to one or more embodiments of the invention, the
DataBrain引擎模块3080包含一种数据挖掘软件应用程序(这里指的是一种DataBrainCmdCenter应用程序),它使用包含在配置文件和数据集中的分析模板来执行数据挖掘分析。根据本发明的一个或多个实施例,DataBrainCmdCenter应用程序调用DataBrain模块来使用一个或多个下列数据挖掘算法:SOM(一种本领域普通技术人员公知的数据挖掘算法);规则归纳(“RI”,一种本领域普通技术人员公知的数据挖掘算法);MahaCu(一种数据挖掘算法,其使数字数据与分类或属性数据相关,这将在下面描述,该分类或属性数据例如但不限于为处理工具标识符);反向MahaCu(一种数据挖掘算法,其使分类或属性数据与数字数据相关,这将在下面描述,该分类或属性数据例如但不限于为处理工具标识符);多级分析自动化,其中利用SOM执行数据挖掘,并且其中使用如下方式将来自SOM的输出用于执行数据挖掘:(a)RI和(b)MahaCu;Pigin(一种在下面描述的发明性数据挖掘算法);DefectBrain(一种在下面详细描述的发明性数据挖掘算法);和Selden(一种本领域普通技术人员公知的数据挖掘算法)。The
根据本发明的一个或多个实施例,DataBrainCmdCenter应用程序使用一种中央控制应用程序,该中央控制应用程序能够运用多种数据挖掘算法和统计方法。特别是根据本发明的一个或多个实施例,该中央控制应用程序使来自一个数据挖掘分析的结果能够馈送后续分支分析或运算的输入。因此,通过以用户配置系统的配置文件所控制的分析的逻辑和深度来提供一种自动化且灵活的机制用于探查数据,DataBrainCmdCenter应用程序可进行无界数据探查(unbounded dataexploration)而不限制分析迭代的数量或类型。According to one or more embodiments of the invention, the DataBrainCmdCenter application uses a central control application capable of employing a variety of data mining algorithms and statistical methods. In particular, according to one or more embodiments of the invention, the central control application enables results from a data mining analysis to feed the input of subsequent branching analyzes or operations. Thus, by providing an automated and flexible mechanism for exploring data with the logic and depth of analysis controlled by user-configurable system profiles, the DataBrainCmdCenter application enables unbounded data exploration without limiting the number of analysis iterations quantity or type.
按照其最一般的形式,Fab数据分析系统3000分析从多个fab收到的数据,并非所有的fab都被同一合法实体所拥有或控制。因此,可以在数据挖掘分析运算的同时并行地分析不同的数据集,并将报告给不同的用户。另外,即使当所接收的数据得自于单个fab(即由单独一个合法实体所拥有或控制的一个fab)时,不同的数据集也可以在数据挖掘分析运算的同时并行地被该合法实体内的不同的组所分析。在此情况下,在服务器群(server farm)上有效地以并行方式执行这样的数据挖掘分析运算。根据本发明的一个或多个此类实施例,DataBrain引擎模块3080充当一个自动化指令中心并包括下列组件:(a)DataBrainCmdCenter应用程序(一种分支的分析判断和控制应用程序),它调用DataBrain模块并且进一步包括:(i)DataBrainCmdCenter队列管理器(系以本领域普通技术人员公知的多种方法中的任一种方法所构造),它包括在服务器群中的一组分布式从属队列,其中一个队列被配置为主队列;(ii)DataBrainCmdCenter负载均衡器应用程序(系以本领域普通技术人员公知的多种方法中的任一种方法所构造),它在该服务器群中平衡分配和工作负载;和(iii)DataBrainCmdCenter账户管理应用程序(系以本领域普通技术人员公知的多种方法中的任一种方法所构造),它实现用户账户及相关分析结果的创建、管理和状态监控;以及(b)用户编辑和配置文件接口模块3055(系以本领域普通技术人员公知的多种方法中的任一种方法所构造),它使用户能够提供分析模板信息,以便用于配置文件中的数据挖掘。In its most general form, the Fab
根据此实施例,DataBrainCmdCenter应用程序主要负责管理数据挖掘作业队列,并自动在连网的Windows服务器或服务器群的阵列中分配工作。DataBrainCmdCenter应用程序接口到用户编辑和配置文件接口模块3055以便接收系统配置参数的输入。根据本发明的一个或多个此类实施例,数据挖掘工作被定义为一组包括多个数据集和分析算法的分析运算。由DataBrainCmdCenter队列管理应用程序来管理工作,该应用程序是一种位于单个服务器(individual server)从属队列上的主队列管理器。该主队列管理器将数据挖掘工作从逻辑上分配给可使用的服务器(由DataBrain模块执行),从而能使工作同时运行。分支分析运算的结果由DataBrainCmdCenter应用程序集中,然后,如有必要则将它们馈送给例如由该工作的配置文件所确定的后续运算。According to this embodiment, the DataBrainCmdCenter application is primarily responsible for managing the queue of data mining jobs and automatically distributing the work among an array of networked Windows servers or server farms. The DataBrainCmdCenter application program interfaces to the user editing and configuration
另外,DataBrainCmdCenter应用程序控制服务器群的负载均衡。为了获得服务器群中的可用服务器资源的效率和控制,均衡是很有用的。通过按照本领域普通技术人员公知的许多方法中的任意一种方法对单个服务器群服务器队列和其它有关运行时间状态信息进行实时监控,则可实现适当的负载均衡。In addition, the DataBrainCmdCenter application controls the load balancing of the server farm. Balancing is useful in order to gain efficiency and control over the available server resources in a server farm. Proper load balancing can be achieved by real-time monitoring of individual server farm server queues and other pertinent runtime state information by any of a number of methods known to those of ordinary skill in the art.
根据本发明的一个或多个实施例,相对于按照本领域普通技术人员公知的许多方法中的任意一种方法所执行的自动分析,DataBrainCmdCente账户管理应用程序实现用户账户的创建、管理和状态监控。管理和状态通信提供控制反馈给DataBrainCmdCenter队列管理器应用程序和DataBrainCmdCenter负载均衡器应用程序。According to one or more embodiments of the invention, the DataBrainCmdCente account management application enables the creation, management, and status monitoring of user accounts relative to automated analysis performed by any of a number of methods known to those of ordinary skill in the art . Management and status communication provides control feedback to the DataBrainCmdCenter queue manager application and the DataBrainCmdCenter load balancer application.
根据本发明的一个或多个实施例,数据挖掘分析的一个步骤可用于分析数字数据,以便找到可提供相关性的数据群集(此步骤可能要求有多个数据挖掘步骤,这些数据挖掘步骤试图分析可以提供这种相关性的各种类型的数据)。此步骤由配置文件中规定的数据类型来驱动。然后,在随后的步骤中,可以分析相关数据以便确定可能与这些群集相关的参数数据(此步骤可能要求有多个数据挖掘步骤,这些数据挖掘步骤试图利用可能提供这类关联的不同类型数据来分析该数据)。此步骤还由配置文件中规定的数据类型以及所要执行的数据挖掘分析类型来驱动。然后,在随后的步骤中,可以对照分类数据来分析参数数据,以便确定可能与相关参数数据相关连的处理工具(此步骤可能要求有多个数据挖掘步骤,这些数据挖掘步骤试图利用可能提供此类相关性的各种类型的处理工具来分析该数据)。然后,在随后的步骤中,可对照分类数据来分析处理工具传感器数据以便确定可能错误的处理工具的各个方面(此步骤可能要求有多个数据挖掘步骤,这些数据挖掘步骤试图利用可能提供此类相关性的各种类型的传感器数据来分析该数据)。根据一个这样的实施例,数据挖掘分析技术的分层结构将要使用SOM,其次是规则归纳、接着是ANOVA,随后是统计方法。According to one or more embodiments of the invention, a step of data mining analysis may be used to analyze the numerical data in order to find data clusters that provide correlations (this step may require multiple data mining steps that attempt to analyze Various types of data can provide this correlation). This step is driven by the data types specified in the configuration file. Then, in a subsequent step, the relevant data can be analyzed in order to determine parametric data that may be associated with these clusters (this step may require multiple data mining steps that attempt to use different types of data that may provide such associations) analyze the data). This step is also driven by the type of data specified in the configuration file and the type of data mining analysis to be performed. Then, in a subsequent step, the parametric data can be analyzed against the categorical data in order to identify processing tools that may be associated with the relevant parametric data (this step may require multiple data mining steps that attempt to exploit various types of processing tools for class correlations to analyze this data). Then, in a subsequent step, the process tool sensor data can be analyzed against the categorical data to determine aspects of the process tool that may be at fault (this step may require multiple data mining steps that attempt to exploit information that may provide such Correlation of various types of sensor data to analyze the data). According to one such embodiment, the hierarchy of data mining analysis techniques is to use SOM, followed by rule induction, followed by ANOVA, followed by statistical methods.
图9示出了一种作为示例的三级分支的数据挖掘运算。如图9所示,DataBrainCmdCenter应用程序(在配置文件的用户产生的分析模板部分的方向下)执行SOM数据挖掘分析,其分析群集数字数据,该群集数字数据例如(但不限于)与成品率相关联,而成品率例如(但不限于)被定义为与fab中生产的IC的速度有关。接下来,还如图9所示,DataBrainCmdCenter应用程序(在用户产生的分析模板的方向下):(a)在来自SOM数据挖掘分析的输出上执行映射匹配分析(在下面描述)以便执行群集匹配,这是因为群集匹配与例如(但不限于)电子测试结果之类的参数数据有关;和(b)在来自SOM数据挖掘分析的输出上执行规则归纳数据挖掘分析以便提供群集的规则解释,这是因为规则解释与例如(但不限于)电子测试结果之类的参数数据有关。接下来,还如图9所示,DataBrainCmdCenter应用程序(在用户产生的分析模板的方向下):(a)在来自规则归纳数据挖掘分析的输出上执行反向的MahaCu和/或ANOVA数据挖掘分析,以便使分类数据与数字数据相关,这是因为它与处理工具设置相关,处理工具设置例如(但不限于)为在处理工具处所作的计量测量;和(b)在来自映射匹配数据挖掘分析的输出上执行MahaCu和/或ANOVA数据挖掘分析,以便使数字数据与分类数据相关,这是因为它与例如(但不限于)传感器测量的处理工具相关。FIG. 9 shows a data mining operation with three branches as an example. As shown in Figure 9, the DataBrainCmdCenter application (directed under the User Generated Analysis Templates section of the configuration file) performs a SOM data mining analysis that analyzes clustered numerical data related to, for example, but not limited to, yield While yield is defined, for example (but not limited to), to relate to the speed at which ICs are produced in the fab. Next, as also shown in Figure 9, the DataBrainCmdCenter application (under the direction of user-generated analysis templates): (a) performs a mapping matching analysis (described below) on the output from the SOM data mining analysis in order to perform cluster matching , because cluster matching is related to parametric data such as (but not limited to) electronic test results; and (b) performing rule-inductive data-mining analysis on the output from the SOM data-mining analysis in order to provide a rule-based interpretation of the cluster, which This is because rule interpretation is related to parametric data such as (but not limited to) electronic test results. Next, as also shown in Figure 9, the DataBrainCmdCenter application (under the direction of user-generated analysis templates): (a) perform reverse MahaCu and/or ANOVA data mining analysis on the output from the rule-inductive data mining analysis , in order to relate categorical data to numerical data as it relates to processing tool settings such as (but not limited to) metrological measurements made at the processing tool; Perform MahaCu and/or ANOVA data mining analysis on the output of to correlate numerical data with categorical data as it relates to processing tools such as (but not limited to) sensor measurements.
图10示出了根据本发明的一个或多个实施例而以DataBrainCmdCenter应用程序实现的分配排队。图11示出了根据本发明的一个或多个实施例来构造的用户编辑和配置文件接口模块3055的分析模板用户接口部分。图12示出了根据本发明的一个或多个实施例来构造的配置文件的分析模板部分。Figure 10 illustrates allocation queuing implemented with the DataBrainCmdCenter application in accordance with one or more embodiments of the invention. Figure 11 illustrates the analysis template user interface portion of the user edit and
根据本发明的一个或多个实施例,以一种在此称为“映射匹配”的算法利用SOM来实现自动且集中的分析(即提供问题陈述的自动定义)。特别是根据本发明的一个或多个实施例,SOM提供具有类似参数的圆片群集的映射。例如,如果在数据集中为每个参数创建一个这样的映射,即可用它们来确定在一个给定时刻对于一个给定产品存在多少特有的成品率问题。如即可用这些映射来定义所要提出的好的“问题”,以便于进一步的数据挖掘分析。According to one or more embodiments of the invention, the SOM is utilized in an algorithm referred to herein as "map matching" to enable automatic and focused analysis (ie, to provide automatic definition of the problem statement). In particular, according to one or more embodiments of the invention, the SOM provides a map of clusters of wafers with similar parameters. For example, if you create one such map for each parameter in your dataset, you can use them to determine how many unique yield problems exist for a given product at a given moment. For example, these mappings can be used to define good "questions" to be raised, so as to facilitate further data mining analysis.
因为自组织映射的性质实现了分析自动化,所以本发明的SOM映射匹配技术的用户只需要在fab内保持变量名标记列表,这些变量名标记对实现完全“无手动”的自动化是“有意义的”。SOM分析自动地组织数据并识别单独的和主要的(即有影响的)数据群集,其表示一个数据集内的不同“fab问题”。这种SOM群集与下面描述的映射匹配算法相结合,使每个“关心的”变量能够根据历史数据而被描述,其中已知历史数据在逐个群集的基础上影响到“关心的”变量的特征。通过这种方式,使用与映射匹配算法结合的SOM,使得fab能够以完全自动的“无手动”技术来处理多个成品率影响问题(或其它重要的问题)。Because the nature of self-organizing maps automates the analysis, users of the SOM map-matching techniques of the present invention need only maintain within the fab a list of variable name tokens that are "meaningful" to enable complete "hands-free" automation ". SOM analysis automatically organizes data and identifies separate and major (ie influential) data clusters that represent distinct "fab issues" within a data set. This SOM clustering, combined with the mapping matching algorithm described below, enables each "interesting" variable to be characterized in terms of historical data known to influence the characteristics of the "interesting" variable on a cluster-by-cluster basis . In this way, using a SOM combined with a map-matching algorithm enables a fab to address multiple yield-impacting issues (or other important issues) with a fully automated "hands-free" technique.
在能够运行一个数据集的SOM分析之前,必须为该数据集中的每一列产生自组织映射。为了产生这些映射而构造一个如图13所示的超棱锥立方体结构。图13所示的超棱锥立方体具有4层。根据本发明的一个或多个实施例,所有超棱锥立方体均形成得令每一层均为2^n×2^n,其中n为基于零的层数。另外,棱锥的每一层表示一个超立方体,即每一层超棱锥立方体表示数据集内的一列。图14所示的层应该是一个16列数据集的第2层(基于零)。根据一个或多个这样的实施例,该超棱锥立方体中形成得越深,则超立方体(2^n×2^n)的宽度即越大,而该超立方体棱锥的深度处于该数据集中的列数则保持为恒定。Before a SOM analysis of a dataset can be run, a self-organizing map must be generated for each column in the dataset. To generate these maps a hyperpyramidal cube structure as shown in FIG. 13 is constructed. The hyperpyramidal cube shown in FIG. 13 has 4 layers. According to one or more embodiments of the present invention, all hyperpyramidal cubes are formed such that each layer is 2̂n×2̂n, where n is the zero-based number of layers. In addition, each layer of the pyramid represents a hypercube, that is, each layer of the hyperpyramid cube represents a column in the data set. The layer shown in Figure 14 should be layer 2 (zero-based) of a 16-column dataset. According to one or more such embodiments, the deeper the hyperpyramid cube is formed, the larger the width of the hypercube (2^n×2^n), and the depth of the hypercube pyramid is in the data set The number of columns remains constant.
图15示出了一个可以来自超立方体的超立方体层(自我组织映射),其中该超立方体是从一个超棱锥立方体的第2层中提取的。如图15所示,每一层中的神经元(即细胞)表示那一列中的真实记录的一个近似值。超立方体随着棱锥深度增加而增大,并且该立方体中的神经元增加并收敛到数据立方体的每一层所表示的实际列中的实际记录值。由于所涉及的存储器限制和计算时间,使棱锥增大直到各神经元收敛到它们所代表的实际值为止的做法既不实用又不可行。作为替代,根据本发明的一个或多个实施例,使棱锥增大直到符合某一阈值为止,或者直到达到一个预先确定的最大深度为止。然后,根据本发明的一个或多个实施例,在该棱锥产生的最后一层立方体上执行SOM分析。Figure 15 shows a hypercube layer (self-organizing map) that can be derived from a hypercube extracted from
一旦为数据集的每一列均产生了一个SOM,则采用如下步骤来获得自动的映射匹配数据分析。Once a SOM has been generated for each column of the dataset, the following steps are taken to obtain automatic mapping matching data analysis.
I.瞬态(snapshot)的产生(迭代):给出一个数字的因变量(“DV”)(数据列),定位此DV所对应的数据立方体内的一个神经映射。利用此神经映射,产生详述三个区域的所有可能的色彩区域组合。这三个区域是:高(山丘),低(池塘),以及中间区域,并且神经映射上的任意给定细胞将落入这些区域的其中之一内。为了简化理解此类实施例,将绿色分配给高区域,将蓝色分配给中间区域并将红色分配给低区域。然后,作为第一步,确定一个δ,在每一时间间隔均需移动该δ来产生色彩区域的瞬态,需要用该瞬态作为自动映射匹配分析的基础。注意:需要移动两个阈值标记符来获得所有的瞬态组合,即:有一个标记符象征低区域的阈值,而有另一标记符象征高区域的阈值。通过改变这两个标记符并且使用δ,就能够产生所期望的所有瞬态组合。I. Generation of snapshots (iterations): Given a numerical dependent variable ("DV") (data column), locate a neural map within the data cube corresponding to this DV. Using this neural map, all possible color region combinations detailing the three regions are generated. The three regions are: high (hill), low (pond), and middle region, and any given cell on the neural map will fall into one of these regions. To simplify understanding of such embodiments, green is assigned to high regions, blue to mid regions and red to low regions. Then, as a first step, a δ is determined that needs to be shifted at each time interval to generate a transient of the color region that needs to be used as the basis for the automatic map matching analysis. NOTE: Both threshold markers need to be moved to obtain all transient combinations, ie: one marker symbolizes the low region threshold and the other symbol symbolizes the high region threshold. By varying these two markers and using δ, all desired combinations of transients can be produced.
δ值计算如下:δ=数据分布的百分比(这是一个用户配置值)*2σ。接下来,高标记符和低标记符被移动到这一列中的数据的平均值。在此初始状态中,神经映射中的所有细胞也将落入绿色或红色区域中。接下来,低标记符向左移动一个δ。然后,扫描所有细胞,并且基于下列步骤将适当的色彩赋予这些细胞。如果相关的细胞值为:(平均值-1.25σ)<细胞值<低标记符,则它被赋予红色。如果相关的细胞值为:(高标记符)<细胞值<(平均值+1.25σ),则它被赋予绿色。如果相关的细胞值为:(低标记符)<细胞值<(高),则它被赋予蓝色。The delta value is calculated as follows: delta = percentage of data distribution (this is a user-configurable value) * 2σ. Next, the high and low markers are moved to the average of the data in this column. In this initial state, all cells in the neural map will also fall into the green or red region. Next, the low marker is shifted one delta to the left. Then, all cells are scanned and the cells are assigned the appropriate color based on the following steps. If the associated cell value is: (mean - 1.25σ) < cell value < low marker, it is given a red color. If the associated cell value is: (high marker) < cell value < (mean + 1.25σ), it is given green color. If the associated cell value is: (low marker)<cell value<(high), it is given blue color.
在这些瞬态(迭代)中的每一个,标记所有的高区域与低区域,并且执行SOM自动分析(在下面描述)。然后,低标记符向左移动一个δ以便产生另一瞬态。然后,所有的高低区域被标记,并执行SOM自动分析。此过程继续进行,直到低标记符低于(平均值-1.25σ)为止。当此情况发生时,低标记符被重置到初始状态,而高标记符随后向右前进一个δ,并重复该过程。该过程将继续进行,直到高标记符大于(平均值+1.25σ)为止。这可用下列伪码示范。At each of these transients (iterations), all high and low regions are marked, and an automatic SOM analysis (described below) is performed. Then, the low marker is shifted one delta to the left to generate another transient. Then, all high and low areas are marked and an automatic SOM analysis is performed. This process continues until the low marker is below (mean - 1.25σ). When this happens, the low token is reset to its initial state, while the high token is then advanced one delta to the right, and the process repeated. This process will continue until the high marker is greater than (mean + 1.25σ). This can be demonstrated with the following pseudocode.
Set High_Marker=Mean value of column data. Set Low_Marker=Mean value of column data. Set Delta=(Percent of data distribution this is a user configuration value)*2sigma.<dp n="d29"/> Set Low_Iterator=Low_Marker; Set High_Interator=High_Marker Keep Looping when(High_Iterator<(mean+1.25 sigma) Begin Loop Keep Looping when(Low_Iterator>(mean-1.25 sigma) Begin Loop Go through each cell and color code the cells based on the procedure above and using the High_Iterator and Low_Iterator as threshold values. Capture this snapshot by tagging all the High and Low clusters. Perform Automated Map Matching analysis(see the next section below)on this snapshot. Set Low_Iterator=Low_Interator-Delta. End Loop Set High_Iterator=High_Iterator+Delta. End LoopSet High_Marker=Mean value of column data. Set Low_Marker=Mean value of column data. Set Delta=(Percent of data distribution this is a user configuration value)*2sigma.<dp n="d29"/> Set Low_Iterator = Low_Marker; Set High_Interator=High_Marker Keep Looping when(High_Iterator<(mean+1.25 sigma) Begin Loop Keep Looping when(Low_Iterator>(mean-1.25 sigma) Begin Loop Go through each cell and color code the cells based on the procedure above and using the High_Iterator and Low_Iterator as threshold values. Capture this snapshot by tagging all the High and Low clusters. Perform Automated Map Matching analysis (see the next section below) on this snapshot. Set Low_Iterator=Low_Interator-Delta. End Loop Set High_Iterator=High_Iterator+Delta. End Loop图16表示具有高、低和中间区域的自组织映射,其中每一高群集和低群集区域均被标记以便将来的自动映射匹配分析。Figure 16 shows a self-organizing map with high, low and middle regions, where each high-clustered and low-clustered region is marked for future automatic map matching analysis.
II.瞬态的自动映射匹配分析(迭代):由步骤一产生的这3种色彩区域中的每一个瞬态被分析如下:所关心的区域(用户指定是否在一个选定DV(列)神经映射的池塘(低)或者山丘(高)区域中的区域是所关心的)。一个所关心的区域将被称为源区域而另外一个对应的区域将被称为目标区域。用于获得其它自变量(“IV”)映射(亦即是数据立方体中不是DV列的那些列)的自动SOM等级的前提基于如下事实:相同的数据集的行(记录)被直线投影通过数据立方体。因此,如果一个数据集的第22行位于给定的DV神经映射的第10行第40列,那么该细胞位置(22,40)也同样将包含对应于所有其它IV的神经映射数据集的第22行。特别地,图17示出了一种通过超立方体的细胞投射。正如从图17中看到的,一个“最适合的”记录得以建立,从而当它被投影通过该超立方体的每一层时,它都最佳地匹配每一层的预期值。简单地提一下,目的是分析包括源和目标区域的记录并确定如何让它们彼此区分。因为组成每一组的那些记录与通过神经映射的相同,所以可以根据源组与目标组的差异程度来分类每一神经映射。然后使用这种计分将神经映射从最高到最低加以分类。计分较高即意味着神经映射中的两个组彼此差异非常大,而反之,计分较低则意味着两个组彼此非常类似。因此,目的是找到两个组之间差异最大处的IV神经映射。以下所示步骤用于实现上述目的。II.Automatic mapping matching analysis of transients (iterative) : Each transient in the 3 color regions produced by step one is analyzed as follows: the region of interest (user specified whether in a selected DV (column) neuron Regions in the mapped pond (low) or hill (high) regions are of interest). One region of interest will be called the source region and the other corresponding region will be called the target region. The premise of automatic SOM ratings for obtaining other independent variable ("IV") mappings (i.e. those columns in the data cube that are not DV columns) is based on the fact that the rows (records) of the same data set are projected rectilinearly through the data cube. Thus, if row 22 of a dataset is located at
a.按照紧密计分(Impacted score)将源群集从最高到最低加以分类。每一群集的紧密计分计算如下:紧密计分=(实际的列平均值-神经映射的平均值)*群集中各唯一记录的数目)/该列中的所有记录。a. Sort source clusters by Impacted score from highest to lowest. The tightness score for each cluster was calculated as follows: tightness score = (actual column mean - neural map mean) * number of each unique record in the cluster) / all records in that column.
b.从分类最高的源群集开始,并且根据如下判据标记它的目标群集邻点,使这些判据的每一个被相应地加权,而且实际上所赋予的结果计分是加权的平均值:b. Start with the highest classified source cluster, and label its target cluster neighbors according to the following criteria, each of which is weighted accordingly, and in effect the resulting score assigned is the weighted average:
1.它离该源群集有多近。本判据作为从目标群集到源群集的形心(centroid)距离来计算,其中形心细胞是占据该群集的中心的细胞。在两个细胞被确定之后,使用勾股定理计算其中心距离。1. How close it is to this source cluster. This criterion is computed as the centroid distance from the target cluster to the source cluster, where a centroid cell is the cell occupying the center of the cluster. After two cells have been identified, their center distances are calculated using the Pythagorean theorem.
2.该群集中唯一记录的数目。2. The number of unique records in the cluster.
3.周围细胞的平均值,其作为对周围细胞平均值的比值。3. The mean value of the surrounding cells as a ratio to the mean value of the surrounding cells.
这将给出一种一对多的关系,亦即一个源群集与它的许多目标群集邻点相关。This will give a one-to-many relationship, ie one source cluster is related to many of its target cluster neighbors.
c.将源群集中的所有记录标记为总数1而将目标群集中的所有记录标记为总数2。这将被用于以下列判据为基础来确定两个组有何差异。c. Mark all records in the source cluster with a total of 1 and all records in the target cluster with a total of 2. This will be used to determine how the two groups differ based on the following criteria.
d.利用一个计分函数来使用总数1和总数作为输入以便计算对应IV的“计分”。这样一种计分函数例如(但不限于)包含一个修改的T测试计分函数;一个彩色对比度计分函数;一个IV影响计分函数;等等。d. Utilize a scoring function to use
修改的T测试计分函数被实现如下:对于每一IV(神经)映射,计算总数1与总数2的修改的T测试。The modified T-test scoring function is implemented as follows: For each IV (neural) map, a modified T-test of
修改的T测试是以比较两个总数组的常规的T测试为基础的。区别是:在计算T测试计分之后,通过以该T测试计分乘以一个减少比值来计算最终计分。The modified T-test is based on the conventional T-test comparing two total arrays. The difference is that after calculating the T-test score, the final score is calculated by multiplying the T-test score by a reduction ratio.
修改的T测试=(减少比值)*T测试Modified T-Test = (Reduction Ratio)*T-Test
该减少比值是通过以下步骤计算的:计算目标总数中超出源总数平均值的记录数目;然后从目标总数中低于源总数平均值的记录数目中减去上述数目;最后,通过除以目标总数中的记录总数来计算出该减少比值。This reduction ratio is calculated by counting the number of records in the target total that exceed the average value of the source total; subtracting that number from the number of records in the target total that are below the average value of the source total; and finally, dividing by The total number of records in to calculate the reduction ratio.
减少比值=(低于源平均值的目标记录数目-超出源平均值的目标记录数目)/(目标区域中的记录总数)的绝对值。Reduction Ratio = Absolute value of (Number of Target Records Below Source Average - Target Number of Above Source Average)/(Total Number of Records in Target Region).
存储这个计分以用于IV神经映射的稍后分类。This score is stored for later classification of the IV neuromap.
彩色对比度计分函数被实现如下:比较IV神经映射上总数1和总数2之间的彩色对比度。The color contrast scoring function was implemented as follows: Compare the color contrast between
IV影响计分函数被实现如下:将以上所确定的彩色对比度计分乘以基于DV神经映射的一个紧密计分。The IV impact score function was implemented as follows: Multiply the color contrast score determined above by a compact score based on the DV neural map.
e.对于超立方体中的每个IV神经映射重复步骤d.。e. Repeat step d. for each IV neural map in the hypercube.
f.按照修改的T测试计分而对IV神经映射进行分级。如果在所有IV被使用之前或者在用户规定的阈值得到满足之前修改的T测试计分接近零,则将使用常规的T测试计分来分级剩余的IV神经映射。f. IV neural maps were graded according to modified T-test scoring. If the modified T-test score approaches zero before all IVs are used or before user-specified thresholds are met, the remaining IV neuromaps will be graded using conventional T-test scores.
g.如用户配置设定所规定的存储最高百分比IV神经映射。g. Store the highest percentage IV neural map as specified by the user configuration settings.
III.产生结果并将结果馈送给其它分析方法:选择具有最高总计分的IV的最高X%(由用户在配置文件中规定)。根据本发明的一个或多个实施例,将产生下列自动结果以便用户查看所获得的每一瞬态。III.Generate results and feed results to other analysis methods : Select top X% of IV with highest total score (specified by user in configuration file). According to one or more embodiments of the invention, the following automatic results will be generated for the user to review each transient obtained.
a.所获IV的一个神经映射被显示。独立变量的SOM映射将是背景映射,其中在上面以相异的外形色彩和清楚的群集标记勾划出因变量山丘和池塘群集的轮廓。映射的图标将表示成与色彩边界阈值的实际值结合的三种不同色彩(例如绿、红、蓝)。a. A neural map of the obtained IV is shown. The SOM map of the independent variable will be the background map where the dependent variable hill and pond clusters are outlined in distinct outline colors and clear cluster markers. The mapped icon will be represented as three different colors (eg green, red, blue) combined with the actual value of the color boundary threshold.
b.对这个特定获得的DV运算实际结果。这是IV如何对照给出选定的DV而彼此分级的实际结果。b. Calculate the actual result for this particular obtained DV. This is a practical consequence of how the IVs are graded against each other given the chosen DV.
c.将写出较小的数据集,其只包含构成源和目标区域的记录。这一较小的数据集将成为以其它数据分析方法所作的进一步分析的基础。例如,为了获得自动的“问题”,该较小的数据集被反馈到一个规则归纳数据分析方法引擎中,其具有根据映射匹配运算勾划出的适当区域。这些区域将构成规则归纳分析会加以解释的“问题”。规则归纳产生解释变量与统计有效性之间的相互作用的规则。它搜索数据库以便找到最佳匹配所产生问题的假说。c. A smaller data set will be written out containing only the records that make up the source and target regions. This smaller data set will form the basis for further analysis by other data analysis methods. For example, to obtain automated "questions," this smaller data set is fed into a rule-inductive data analysis method engine with appropriate regions delineated according to map-matching operations. These regions will constitute the "problems" that rule-inductive analysis will interpret. Rule induction produces rules that explain interactions between variables and statistical validity. It searches the database to find the hypothesis that best matches the question posed.
IV.对于所有DV重复上述的步骤I-III:对于配置文件中所有的用户规定的DV重复步骤I到步骤III。完成全部内务任务(housingkeepingtask),并准备产生自动映射匹配结果的报告,且将这些运算的答案馈送到其它数据分析方法。IV.Repeat steps I-III above for all DVs : Repeat steps I to III for all user-specified DVs in the configuration file. All housing keeping tasks are done and reports are prepared to generate automatic mapping matching results, and the answers to these operations are fed to other data analysis methods.
根据本发明一个或多个实施例,DataBrain模块包含一种发明性数据挖掘算法应用程序,该应用程序在此被称为“Pigin”。Pigin是这样一种发明性数据挖掘算法应用程序,它对于一个目标数字变量确定数据集内的哪些其它数字变量对该指定的目标变量有影响(即相关)。虽然Pigin并不分析分类数据(并且在该意义上,其范围比其它数据挖掘算法更窄),但是与其它标准数据挖掘算法相比,它更快地、并以更有效的存储器利用率来完成其分析。该算法处理目标变量,亦即由数据挖掘练习(excise)所解释并被称为因变量(“DV”)的变量。该算法按照下列步骤操作。步骤1:基于用户可配置的参数而将DV的数字分布作为一系列类别处理,其中该用户可配置参数确定将多少数据放到每个类别中。在图18中说明步骤1,该图展示由一个数字分布来定义“虚拟”类别。步骤2:一旦由步骤1定义了DV组(或分片(split)),就基于与数据集内其它数字变量(此后称为自变量或“IV”)的那个类别一致的数据,对每个DV分类计算出一系列置信(comfidence)分布圆。步骤3:基于每个IV的置信圆的整体扩展,将一个直径计分与一个间隙计分赋予该变量,以便稍后用于确定哪一IV与分析员“作为目标的”DV最高度相关。高的直径或间隙计分经常表示DV对IV的“更好的”相关性。步骤2和3在图19中加以说明,该图展示出计算间隙计分(一个间隙计分=所有间隙(不在任一圆内的)的总和)与直径计分(一个直径计分=三个圆的DV平均直径),其中DV分类是以DV的数字分布为基础的。本质上,图19是一个置信图表,其中每个菱形表示一个总数,而菱形的端点则产生一个在该图右边绘制的圆(这些圆被称为“95%置信圆”)。步骤4:迭代。一旦基于步骤1中的DV定义而赋予所有IV一个计分,则DV即被重新定义从而略微改变分片的定义。一旦这种重新定义发生了,则对照该新的DV分类定义对于所有的IV重新计算计分。改进DV分类定义的处理继续进行,直到由用户在分析模板中所规定的迭代数目已经满足为止。步骤5:整体计分。当所有迭代完成时,则基于在步骤1和4中描述的各种DV的定义,将会存在一系列IV等级。这些列表将被合并,从而形成一个与目标DV最为高度相关的IV的“主分类”列表。当对于一个给定的IV计算主计分时,要考虑三个因素:间隙计分的幅值,直径计分的幅值,以及IV出现于一系列DV计分列表上的次数。这三个因素与某些基本的“无意义(junk)结果”排斥判据结合,形成对于一个给定目标DV的最高度相关的列表。这一点于说明图20中。应该理解,虽然对于遇到的每个IV都使用一个间隙计分与一个直径计分来描述一个或多个这类实施例,但是本发明的实施例并不限于这些类型的计分,并且实际上还有利用其它计分函数来计算IV计分的另外实施例存在。According to one or more embodiments of the present invention, the DataBrain module includes an inventive data mining algorithm application, referred to herein as "Pigin". Pigin is an inventive application of data mining algorithms that, for a target numeric variable, determines which other numeric variables within a data set have an influence (ie, correlation) on that specified target variable. Although Pigin does not analyze categorical data (and in that sense its scope is narrower than other data mining algorithms), it does so faster and with more efficient memory utilization than other standard data mining algorithms its analysis. The algorithm deals with the target variable, ie the variable explained by the data mining excise and referred to as the dependent variable ("DV"). The algorithm operates in the following steps. Step 1: Process the digital distribution of DV as a series of categories based on a user configurable parameter that determines how much data to put into each category.
根据本发明的一个或多个实施例,DataBrain模块包括一个相关应用程序(MahaCu),它将数字数据与分类或属性数据(例如但不限定为处理工具标识符)相关,此应用程序提供:(a)按质量规则分等级的快速统计输出;(b)基于直径计分和/或间隙计分的等级计分;(c)用于消除未被充分表示(under-represented)的工具标识符的计分阈值;(d)选择所要显示的最高“发现物”的数目的能力;和(e)执行反向运算的能力,在反向运算中可让得自“发现物”(工具标识符)的结果作为因变量,而使得受这些“发现物”(工具标识符)影响的参数(数目)能够被显示。According to one or more embodiments of the invention, the DataBrain module includes a correlation application (MahaCu) that correlates numerical data with categorical or attribute data (such as but not limited to processing tool identifiers), this application provides: ( a) fast statistical output graded by quality rules; (b) grade scoring based on diameter scoring and/or gap scoring; (c) for eliminating under-represented tool identifiers scoring thresholds; (d) the ability to select the number of highest "findings" to be displayed; and (e) the ability to perform a reverse The results of , as the dependent variable, enable the parameters (number) affected by these "findings" (tool identifiers) to be displayed.
图21示出了一个数据矩阵子集的例子,该数据矩阵子集被输入到上述DataBrain模块相关应用程序。该示例示出生产线终端探查数据(BIN),其中处理工具标识符(Eq_Id)和处理次数(Trackin)是以一个批量为基础的。还可以在圆片、位置(十字线板)或电路小片基础上建立类似的数据矩阵。Figure 21 shows an example of a data matrix subset that is input to the above-mentioned DataBrain module related application. This example shows end-of-line probe data (BIN) where the processing tool identifier (Eq_Id) and processing times (Trackin) are on a batch basis. Similar data matrices can also be created on a wafer, site (crosshair) or die basis.
图22示出数目(BIN)与分类(工具标识符)运算的一个例子。使用BIN(数目)作为因变量,上述的DataBrain模块相关应用程序为数据矩阵中的每个Eq_Id(分类)创建类似的图表。在左边方格中的菱形的宽度表示已通过工具受到处理的批量数,而在右边方格中的圆的直径表示95%置信度。Fig. 22 shows an example of number (BIN) and classification (tool identifier) operations. Using BIN(number) as the dependent variable, the DataBrain module related application above creates a similar plot for each Eq_Id(category) in the data matrix. The width of the diamond in the left panel indicates the number of batches that have been processed by the tool, while the diameter of the circle in the right panel indicates the 95% confidence level.
为了分类大量的图表,各圆之间的间隙空间(即未被圆包围的区域)的总和以及最上面圆的顶部与最底下圆的底部之间的总距离二者之和被作为公式的一部分,用以计算被称为“间隙计分”或“直径计分”的计分。基于一种用户可选择的对优选类型的计分的相对加权,上述DataBrain模块相关应用程序依照重要性而对图表进行分类。To classify a large number of diagrams, the sum of the interstitial space between the circles (i.e. the area not enclosed by the circles) and the total distance between the top of the topmost circle and the bottom of the bottommost circle is taken as part of the formula , which is used to calculate scores known as "clearance scores" or "diameter scores". The DataBrain module-related application described above sorts graphs in order of importance based on a user-selectable relative weighting of the preferred type of scoring.
根据本发明的此一实施例的另一方面,上述DataBrain模块相关应用程序设置一个计分阈值。虽然通常多个处理工具用于一个IC的特定处理层,但是在常规的基础上只有它们的一个子集得到使用。多数情况下,常规未被使用的那些处理工具使数据扭曲,并可能在数据处理期间产生不想要的噪声。上述DataBrain模块相关应用程序可以使用用户定义的计分,从而能够在分析之前过滤掉未充分表示的工具。例如,若图23所示的三个工具的计分阈值被设定为90,则因为XTOOL1和XTOOL2包括多于90%的批量,所以XTOOL3将被过滤掉。According to another aspect of this embodiment of the present invention, the aforementioned DataBrain module-related application program sets a scoring threshold. Although usually multiple processing tools are used for a particular processing layer of an IC, only a subset of them are used on a routine basis. In most cases, those processing tools that are not routinely used distort the data and may generate unwanted noise during data processing. The aforementioned DataBrain module-related applications can use user-defined scoring, enabling the filtering out of underrepresented instruments prior to analysis. For example, if the scoring thresholds for the three tools shown in Figure 23 were set to 90, XTOOL3 would be filtered out because XTOOL1 and XTOOL2 comprise more than 90% of the batch.
根据本发明的一个或多个实施例,上述DataBrain模块相关应用程序提供一个“最高计分的数目”选项。用户可以使用这一特征来确定每个因变量可以显示的结果的最大数目。因此,虽然上述DataBrain模块相关应用程序对所有自变量执行分析,但是只有在“最高计分的数目”字段中输入的图表数将被显示。According to one or more embodiments of the present invention, the above-mentioned DataBrain module-related applications provide a "number of highest scoring" option. Users can use this feature to determine the maximum number of results that can be displayed for each dependent variable. Therefore, although the above-mentioned DataBrain module related application performs the analysis on all independent variables, only the number of graphs entered in the "Number of Highest Scores" field will be displayed.
根据本发明的一个或多个实施例,上述DataBrain模块相关应用程序还要执行一种反向运算(反向MahaCu),在该运算中令分类(例如但不限定为工具标识符)作为因变量,而依照重要性显示受到分类影响的数字参数(例如但不限定为BIN、电子测试、计量等等)。重要性(计分)和数目与工具标识符运算期间执行的相同。这些运算可以是“菊花链式”的,因此在正常运行期间检测到的工具标识符可以自动成为用于反向运算的因变量。According to one or more embodiments of the present invention, the above-mentioned DataBrain module-related application programs will also perform a reverse operation (reverse MahaCu), in which classification (such as but not limited to tool identifier) is used as a dependent variable , and the numerical parameters affected by the classification (such as but not limited to BIN, electronic test, metering, etc.) are displayed in order of importance. Importance (scoring) and number are the same as performed during tool identifier calculation. These operations can be "daisy-chained" so that a tool identifier detected during normal operation can automatically become the dependent variable for the reverse operation.
根据本发明的一个或多个实施例,DataBrain模块包括一个被称为DefectBrain模块的应用程序,它基于一种计分技术将缺陷问题分级。然而,为了执行此分析,缺陷数据必须像以下将要描述的那样被数据转换模块3020格式化。图24示出了一个缺陷数据文件的例子,该缺陷数据文件例如由fab中的缺陷检查工具或缺陷复查工具产生。特别的是,此类文件通常包括与x和y坐标、x和y电路小片坐标、大小、缺陷类型分类码以及圆片上每个缺陷的图像信息有关的信息。根据本发明的一个或多个实施例,数据转换模块3020将此缺陷数据文件转换成为一个矩阵,该矩阵包括电路小片级上的大小、分类(如缺陷类型)以及缺陷密度。图25示出了一个以数据转换算法创建的数据矩阵的例子。而根据本发明的一个或多个实施例,DefectBrain模块包括一个自动缺陷数据挖掘缺陷检测应用程序,它基于一种计分技术将缺陷问题分级。根据此应用程序,使用在此被称为“抑制比(Kill Ratio)”的一个参数来量化某一特定尺寸的仓(bin)或缺陷类型的影响。抑制比被定义如下:According to one or more embodiments of the invention, the DataBrain module includes an application program called the DefectBrain module, which ranks defect issues based on a scoring technique. However, in order to perform this analysis, the defect data must be formatted by the
还可以使用的另外一个参数是定义如下的损耗百分比(%Loss):Another parameter that can be used is the loss percentage (%Loss) defined as follows:

在上述定义中,坏的电路小片指的是不起作用的电路小片。In the above definitions, a bad die refers to a non-functional die.
图26示出了来自DefectBrain模块应用程序的一个标准输出。在图26中,包含特定缺陷类型(此示例中的微损伤(microgouge))的电路小片的数目相对于电路小片上的该类型缺陷的数目绘成图表。因为起作用的(即好的)和不起作用的(即坏的)电路小片信息存在于数据矩阵中,所以直接确定包含特定缺陷类型的哪种电路小片是好的或是坏的。因此,在图26,标绘出好的和坏的两种电路小片频率(die frequency),并以曲线显示坏的电路小片与包含缺陷的总电路小片数之比(即抑制比)。在这些曲线中,提取各曲线部分的斜率,并将其与所有由DefectBrain模块应用程序产生的其它图表中的曲线部分的斜率相比较,且使它们从最高到最低斜率分级。具有最高斜率的曲线应该是影响成品率的最重要的曲线,并且对于一个成品率改进工程师来说会是有价值的。Figure 26 shows a standard output from the DefectBrain module application. In FIG. 26, the number of die containing a particular defect type (microgouge in this example) is plotted against the number of defects of that type on the die. Since the active (ie good) and non-functional (ie bad) die information is present in the data matrix, it is straightforward to determine which die containing a particular defect type is good or bad. Therefore, in FIG. 26, the good and bad die frequencies are plotted, and the ratio of bad dies to the total number of dies containing defects (ie, the rejection ratio) is shown in a curve. From these curves, the slope of each curve section is extracted and compared to the slopes of the curve sections in all other graphs generated by the DefectBrain module application, and they are ranked from highest to lowest slope. The curve with the highest slope should be the most important curve affecting yield and will be of value to a yield improvement engineer.
在这类曲线中,一个重要特征是DefectBrain模块应用程序调整X轴上“缺陷数目”仓(bin)的最大数目的能力。如果该能力不可利用,则在电路小片上有异常数目缺陷的情况下,例如在噪扰(Nuisance)或虚假缺陷的实例情况下,斜率分级将会是错误的。An important feature in this type of curve is the ability of the DefectBrain module application to adjust the maximum number of "Number of Defects" bins on the X-axis. If this capability were not available, the slope grading would be wrong in the case of an abnormal number of defects on a die, such as in the case of Nuisance or spurious defects.
根据本发明的一个或多个实施例,DataBrain模块例如利用像以下这样的工具:数据清理器(data cleaner)(例如按照本领域普通技术人员公知的许多方法中的任意一种方法编制的Perl和C软件应用程序),数据转换器(例如按照本领域普通技术人员公知的许多方法中的任意一种方法编制的Perl和C软件应用程序),以及数据过滤器(例如按照本领域普通技术人员公知的许多方法中的任意一种方法编制的Perl和C软件应用程序),此数据清理、数据转换和/或数据过滤可以根据配置文件中提出的判据执行,或是在一个特别的基础上当接收到用户输入时执行。根据本发明的一个或多个实施例,DataBrain模块是运行于PC机服务器上的一个软件应用程序,并且按照本领域普通技术人员公知的许多方法中的任意一种方法以C++和SOM编码。According to one or more embodiments of the present invention, the DataBrain module utilizes tools such as the following: data cleaner (data cleaner) (for example, Perl and Perl compiled according to any one of many methods known to those of ordinary skill in the art) C software applications), data converters (e.g., Perl and C software applications programmed in any of a number of ways known to those of ordinary skill in the art), and data filters (e.g., in accordance with Perl and C software applications written in any of a number of ways), this data cleaning, data transformation and/or data filtering can be performed according to the criteria set forth in the configuration file, or on an ad hoc basis when receiving Executed on user input. According to one or more embodiments of the present invention, the DataBrain module is a software application running on a PC server, and is coded in C++ and SOM according to any one of many methods known to those of ordinary skill in the art.
根据本发明的一个或多个实施例,来自DataBrain引擎模块3080中的输出是结果数据库3090,该数据库被具体实施为一个微软FoxProTM数据库。另外,根据本发明的一个或多个实施例,WEB指令模块3070包括按照本领域普通技术人员公知的许多方法中的任意一种方法编制的安全ftp传输软件,该安全ftp传输软件能被用户或客户用来将数据传送给DataBrainEngine模块3080用于分析。According to one or more embodiments of the invention, the output from
上述数据挖掘处理的结果自身经常展示为某种回答对数据挖掘算法所提出问题的布尔规则(例如对应于规则归纳的情况),或者是对于被配置文件中的模板作为目标或者表示为“重要的”变量的某种相对等级或统计的贡献。根据所使用的是何种特定的数据挖掘算法,数据挖掘算法所提供的包括“结果”的数据的类型(即它是数字数据类型或分类变量类型)是一组预先确定的统计输出图形,其能够被用户定义,用以同时进行各个自动的数据挖掘分析运算。根据本发明的一个或多个实施例,此类自动输出可以伴随有用于第一次(first pass)数据挖掘的数据的一个“原始的”数据矩阵和/或一个较小的“结果”数据集,该“结果”数据集只包括由完整的数据挖掘处理的“结果”构成的数据列。在一个自动数据挖掘分析运算完成之后,所有这些信息均被储存在结果数据库3090中。The results of the data mining process described above often manifest themselves as some kind of Boolean rule answering questions posed to the data mining algorithm (e.g., as in the case of rule induction), either as targets for templates in configured files or as "significant" rules. "Some relative rank or statistical contribution of a variable. Depending on which particular data mining algorithm is used, the type of data provided by the data mining algorithm including the "results" (i.e. whether it is a numeric data type or a categorical variable type) is a predetermined set of statistical output graphs whose It can be defined by the user to perform various automatic data mining analysis operations at the same time. According to one or more embodiments of the invention, such automatic output may be accompanied by a "raw" data matrix and/or a smaller "result" data set of data for the first pass data mining , the "results" data set includes only data columns consisting of the "results" of the complete data mining process. All of this information is stored in the
结果分布:仍如图3所示,根据本发明的一个或多个实施例,WEB可视化模块3100运行图形和分析引擎3110,该图形和分析引擎存取由DataBrain引擎模块3080产生的结果数据库3090,以便例如而不限于提供储存在Web服务器数据库3120中的HTML报告。根据本发明的一个或多个实施例,WEB服务器数据库3120可以由用户利用(例如但不限定为)PC上的Web浏览器加以存取,以便按照本领域普通技术人员公知的许多方法中的任意一种方法来传送报告。根据本发明的一个或多个实施例,WEB可视化模块3100可实现结果的交互报告、Web浏览器激活产生的图和报告、用于导出的Power Point文件、配置文件的产生和修改、报表管理、结果的电子邮件通知以及实现信息共享的多用户存取。另外,根据本发明的一个或多个实施例,WEB可视化模块3100使用户能够创建多个用户(借助于适当的安全存取)可以查看并修改的微软PowerPoint(和/或Word)在线合作(collaborative)文档。根据本发明的一个或多个实施例,WEB可视化模块3100是一种运行于PC服务器上的软件应用程序,且其使用Java Applet、Microsoft Active Server Pages(ASP)代码和XML来编码。例如,WEB可视化模块3100包括一个管理模块(例如一个运行于PC服务器上的软件应用程序,且其按照本领域普通技术人员公知的许多方法中的任意一种方法以Web Microsoft ASP代码进行编码),它启动新用户设置(其例如但不限定为包括对各种系统功能的安全存取规定),并且启用用户特权(例如但不限定为包括对数据分析结果、配置文件设置等等的存取)。WEB可视化模块3100还包括一个作业察看器模块(例如一个运行于PC机服务器上的软件应用程序,其按照本领域普通技术人员公知的许多方法中的任意一种方法以Web MicrosoftASP代码被编码),它使用户能够查看分析结果并作出报告。WEB可视化模块3100还包括一个图表模块(例如一个运行于PC机服务器上的软件应用程序,且其按照本领域普通技术人员公知的许多方法中的任意一种方法以Web Microsoft ASP代码被编码),它使用户能够使用其Web浏览器创建特定的图表。WEB可视化模块3100还包括一个连接立方体模块(例如一个运行于PC机服务器上的软件应用程序,并且其按照本领域普通技术人员公知的许多方法中的任意一种方法以Web MicrosoftASP代码被编码),它使用户能够在数据挖掘和/或形成超立方体之前组合各数据集。WEB可视化模块3100还包括一个过滤模块(例如一个运行于PC机服务器上的软件应用程序,并且其按照本领域普通技术人员公知的许多方法中的任意一种方法以Web Microsoft ASP代码被编码),它使用户能够在对数据执行数据挖掘之前过滤在超立方体中所收集的这类数据,其中所述过滤是按照用户规定的判据执行的。WEB可视化模块3100还包括一个在线数据工具模块(例如一个运行于PC机服务器上的软件应用程序,并且其按照本领域普通技术人员公知的许多方法中的任意一种方法以Web Microsoft ASP代码被编码),它使用户能够在一个特定的基础上使用其Web浏览器执行数据挖掘。根据本发明的一个或多个实施例,用户可以配置所述配置文件,以使得WEB可视化模块3100准备统计处理控制(“SPC”)信息的图表,这些图表使用户能够使用Web浏览器跟踪预先确定的数据度量。Result distribution: still shown in Figure 3, according to one or more embodiments of the present invention,
本领域技术人员应该承认:以上描述仅仅是为了说明和描述。因此,这种描述并不意味着是详尽的,或者是将本发明限制为所公开的精确形式。例如,虽然在上面讨论了某些维数,但是它们只是说明性的,因为利用上述实施例可以构造出各种方案,并且这些方案的实际维数将根据电路要求而定。It should be recognized by those skilled in the art that the foregoing description has been presented for purposes of illustration and description only. Therefore, the description is not intended to be exhaustive or to limit the invention to the precise forms disclosed. For example, while certain dimensions are discussed above, they are illustrative only, as various schemes can be constructed using the above-described embodiments, and the actual dimensions of these schemes will depend on circuit requirements.
Claims (21)
Translated fromChineseApplications Claiming Priority (16)
| Application Number | Priority Date | Filing Date | Title |
|---|---|---|---|
| US30812101P | 2001-07-30 | 2001-07-30 | |
| US30812301P | 2001-07-30 | 2001-07-30 | |
| US30812201P | 2001-07-30 | 2001-07-30 | |
| US30812501P | 2001-07-30 | 2001-07-30 | |
| US30812401P | 2001-07-30 | 2001-07-30 | |
| US60/308,121 | 2001-07-30 | ||
| US60/308,123 | 2001-07-30 | ||
| US60/308,124 | 2001-07-30 | ||
| US60/308,125 | 2001-07-30 | ||
| US60/308,122 | 2001-07-30 | ||
| US31063201P | 2001-08-03 | 2001-08-03 | |
| US60/310,632 | 2001-08-03 | ||
| US30978701P | 2001-08-06 | 2001-08-06 | |
| US60/309,787 | 2001-08-06 | ||
| US10/194,920US6965895B2 (en) | 2001-07-16 | 2002-07-12 | Method and apparatus for analyzing manufacturing data |
| US10/194,920 | 2002-07-12 |
Publications (2)
| Publication Number | Publication Date |
|---|---|
| CN1535435Atrue CN1535435A (en) | 2004-10-06 |
| CN100370455C CN100370455C (en) | 2008-02-20 |
Family
ID=27575140
Family Applications (1)
| Application Number | Title | Priority Date | Filing Date |
|---|---|---|---|
| CNB028147685AExpired - Fee RelatedCN100370455C (en) | 2001-07-30 | 2002-07-29 | Method and apparatus for analyzing manufacturing data |
Country Status (4)
| Country | Link |
|---|---|
| US (1) | US6965895B2 (en) |
| KR (2) | KR20040045402A (en) |
| CN (1) | CN100370455C (en) |
| WO (1) | WO2003012696A2 (en) |
Cited By (16)
| Publication number | Priority date | Publication date | Assignee | Title |
|---|---|---|---|---|
| CN101965569A (en)* | 2008-03-06 | 2011-02-02 | 应用材料公司 | Yield Predictive Feedback for Control Equipment Engineering Systems |
| CN102073706A (en)* | 2010-12-30 | 2011-05-25 | 北京锐安科技有限公司 | Combined application method of distributed file storage system and relation database |
| CN102541916A (en)* | 2010-12-29 | 2012-07-04 | 沈阳中科博微自动化技术有限公司 | Method for recording and managing historical data of semiconductor equipment |
| US8229587B2 (en) | 2008-02-22 | 2012-07-24 | Muratec Automation Co., Ltd. | Semiconductor fabrication facility visualization system with performance optimization |
| CN102930045A (en)* | 2012-11-15 | 2013-02-13 | 沈阳中科博微自动化技术有限公司 | Multi-device formula management method of integrated circuit production line |
| CN103678392A (en)* | 2012-09-20 | 2014-03-26 | 阿里巴巴集团控股有限公司 | Data increment and merging method and device for achieving method |
| CN106649867A (en)* | 2016-12-30 | 2017-05-10 | 北京亚控科技发展有限公司 | A method of organizing object data |
| CN106776733A (en)* | 2016-11-22 | 2017-05-31 | 北京航天自动控制研究所 | The data staging methods of sampling in data handling system |
| CN103824177B (en)* | 2005-10-05 | 2018-03-20 | 邓白氏公司 | Modular web-based ASP application for multiple products |
| CN108229689A (en)* | 2013-01-17 | 2018-06-29 | 应用材料公司 | In semiconductor processing equipment deviation classification is carried out using radial primary function network and hypercube |
| CN108345450A (en)* | 2017-01-24 | 2018-07-31 | 西门子公司 | The method for generating the software architecture for managing data |
| CN108804745A (en)* | 2018-04-13 | 2018-11-13 | 上海机电工程研究所 | Flight vehicle aerodynamic test data management system and method |
| CN109074378A (en)* | 2016-03-30 | 2018-12-21 | 微软技术许可有限责任公司 | Modular Electronic Data Analysis Computing System |
| CN109643329A (en)* | 2016-09-29 | 2019-04-16 | 谷歌有限责任公司 | Generating charts from data in data tables |
| CN112527387A (en)* | 2020-11-20 | 2021-03-19 | 杭州大搜车汽车服务有限公司 | Application processing method and device |
| CN115685918A (en)* | 2022-10-25 | 2023-02-03 | 深圳中广核工程设计有限公司 | Test method, device and system for control loop of nuclear power plant |
Families Citing this family (156)
| Publication number | Priority date | Publication date | Assignee | Title |
|---|---|---|---|---|
| GB9618897D0 (en) | 1996-09-10 | 1996-10-23 | Bio Rad Micromeasurements Ltd | Micro defects in silicon wafers |
| US7617474B2 (en)* | 1997-09-17 | 2009-11-10 | Synopsys, Inc. | System and method for providing defect printability analysis of photolithographic masks with job-based automation |
| JP2002123530A (en)* | 2000-10-12 | 2002-04-26 | Hitachi Ltd | Method and apparatus for visualizing multidimensional data |
| DE10131956A1 (en)* | 2001-07-02 | 2003-01-23 | Siemens Ag | Process and system for commissioning MES components |
| US7056751B2 (en)* | 2002-11-20 | 2006-06-06 | Reveo, Inc. | Method and system for increasing yield of vertically integrated devices |
| US7219104B2 (en)* | 2002-04-29 | 2007-05-15 | Sap Aktiengesellschaft | Data cleansing |
| US20030233343A1 (en)* | 2002-06-18 | 2003-12-18 | International Business Machines Corporation | System and method for generating custom business reports for a WEB application |
| JP4584531B2 (en)* | 2002-08-02 | 2010-11-24 | 株式会社日立製作所 | Foreign matter monitoring system |
| EP1315358A1 (en)* | 2002-09-12 | 2003-05-28 | Agilent Technologies Inc. a Delaware Corporation | Data-transparent management system for controlling measurement instruments |
| US7738693B2 (en)* | 2002-12-24 | 2010-06-15 | Lam Research Corporation | User interface for wafer data analysis and visualization |
| US7953779B1 (en)* | 2002-10-08 | 2011-05-31 | Trilogy Development Group, Inc. | Configuration representation and modeling using configuration spaces |
| US20040133592A1 (en)* | 2002-10-28 | 2004-07-08 | Surya Sagi | Journal for capturing and data pump for transmitting detailed machine control information to client applications |
| KR101007613B1 (en)* | 2003-03-12 | 2011-01-12 | 토요엔지니어링 카부시키가이샤 | Device that supports registration and retrieval of data using keywords |
| CA2521140A1 (en)* | 2003-04-01 | 2004-10-14 | General Dynamics C4 Systems, Inc. | System and method for decision analysis and resolution |
| US20050144151A1 (en)* | 2003-04-02 | 2005-06-30 | Fischman Reuben S. | System and method for decision analysis and resolution |
| GB0308182D0 (en)* | 2003-04-09 | 2003-05-14 | Aoti Operating Co Inc | Detection method and apparatus |
| US20050004780A1 (en)* | 2003-07-03 | 2005-01-06 | Taiwan Semiconductor Manufacturing Co., Ltd | Virtual assistant for semiconductor tool maintenance |
| US7315851B2 (en)* | 2003-07-25 | 2008-01-01 | Macronix International Co., Ltd. | Methods for creating control charts using a computer system |
| US7313573B2 (en)* | 2003-09-17 | 2007-12-25 | International Business Machines Corporation | Diagnosis of equipment failures using an integrated approach of case based reasoning and reliability analysis |
| US7093207B1 (en)* | 2003-11-17 | 2006-08-15 | Kla-Tencor Technologies Corporation | Data analysis flow engine |
| US20050216228A1 (en)* | 2004-03-15 | 2005-09-29 | Tokyo Electron Limited | Method and system for correcting a fault in a semiconductor manufacturing system |
| JP2005301786A (en)* | 2004-04-14 | 2005-10-27 | Internatl Business Mach Corp <Ibm> | Evaluating apparatus, cluster generating apparatus, program, recording medium, evaluation method, and cluster generation method |
| US7647132B2 (en)* | 2004-05-05 | 2010-01-12 | Taiwan Semiconductor Manufacturing Company, Ltd. | Method and system for problem case packaging |
| US7444197B2 (en) | 2004-05-06 | 2008-10-28 | Smp Logic Systems Llc | Methods, systems, and software program for validation and monitoring of pharmaceutical manufacturing processes |
| US7799273B2 (en) | 2004-05-06 | 2010-09-21 | Smp Logic Systems Llc | Manufacturing execution system for validation, quality and risk assessment and monitoring of pharmaceutical manufacturing processes |
| EP1763795B1 (en)* | 2004-05-11 | 2013-09-04 | Angoss Software Corporation | A method and system for interactive decision tree modification and visualization |
| US20060004786A1 (en)* | 2004-06-07 | 2006-01-05 | Taiwan Semiconductor Manufacturing Company Ltd. | Design mechanism for semiconductor fab-wide data warehouse application |
| CN100413018C (en)* | 2004-06-14 | 2008-08-20 | 中芯国际集成电路制造(上海)有限公司 | Method and system for treating identity of semiconductor device |
| CN100428401C (en)* | 2004-06-14 | 2008-10-22 | 中芯国际集成电路制造(上海)有限公司 | Method and system for treating similarity of semiconductor device finished product ratio |
| US7105364B2 (en)* | 2004-09-14 | 2006-09-12 | Atmel Corporation | Method of increasing reliability of packaged semiconductor integrated circuit dice |
| CA2485814A1 (en)* | 2004-11-24 | 2006-05-24 | Auroral Zone Corporation | Method and apparatus for range processing in an n-dimensional space |
| US20060136444A1 (en)* | 2004-12-17 | 2006-06-22 | Taiwan Semiconductor Manufacturing Co., Ltd. | System and method for integrated information service |
| WO2006066330A1 (en)* | 2004-12-21 | 2006-06-29 | Ctre Pty Limited | Change management |
| US7555484B2 (en)* | 2005-01-19 | 2009-06-30 | Microsoft Corporation | Load balancing based on cache content |
| US7532999B2 (en)* | 2005-02-25 | 2009-05-12 | International Business Machines Corporation | Determining root cause of matching problem and/or fleet measurement precision problem for measurement system |
| US7340374B2 (en)* | 2005-02-25 | 2008-03-04 | International Business Machines Corporation | Determining fleet matching problem and root cause issue for measurement system |
| JP2006302952A (en)* | 2005-04-15 | 2006-11-02 | Toshiba Corp | Pattern measurement system and semiconductor device manufacturing method |
| US7103444B1 (en)* | 2005-04-28 | 2006-09-05 | International Business Machines Corporation | Method and apparatus for supervising manufacturing tools |
| US20070000434A1 (en)* | 2005-06-30 | 2007-01-04 | Accent Optical Technologies, Inc. | Apparatuses and methods for detecting defects in semiconductor workpieces |
| TWI391645B (en)* | 2005-07-06 | 2013-04-01 | Nanometrics Inc | Differential wavelength photoluminescence for non-contact measuring of contaminants and defects located below the surface of a wafer or other workpiece |
| TWI439684B (en) | 2005-07-06 | 2014-06-01 | Nanometrics Inc | Photoluminescence imaging with preferential detection of photoluminescence signals emitted from a specified material layer of a wafer or other workpiece |
| US20070008526A1 (en)* | 2005-07-08 | 2007-01-11 | Andrzej Buczkowski | Apparatus and method for non-contact assessment of a constituent in semiconductor workpieces |
| US20070043762A1 (en)* | 2005-08-17 | 2007-02-22 | Texas Instruments Incorporated | Object-oriented system and method for transforming and loading wafer test data |
| US20070067278A1 (en)* | 2005-09-22 | 2007-03-22 | Gtess Corporation | Data file correlation system and method |
| US20070112618A1 (en)* | 2005-11-09 | 2007-05-17 | Generation 5 Mathematical Technologies Inc. | Systems and methods for automatic generation of information |
| US7571151B1 (en)* | 2005-12-15 | 2009-08-04 | Gneiss Software, Inc. | Data analysis tool for analyzing data stored in multiple text files |
| US8849745B2 (en)* | 2005-12-23 | 2014-09-30 | International Business Machines Corporation | Decision support methods and apparatus |
| US7457772B2 (en)* | 2006-01-06 | 2008-11-25 | Tabin Joshua Z | Method and apparatus for interactive criteria-based commodity comparisons |
| US20080016441A1 (en)* | 2006-01-06 | 2008-01-17 | Tabin Joshua Z | Method and Apparatus to Facilitate Altering a Presentation Order for Search Results |
| US20070176119A1 (en)* | 2006-01-30 | 2007-08-02 | Accent Optical Technologies, Inc. | Apparatuses and methods for analyzing semiconductor workpieces |
| US20070283389A1 (en)* | 2006-06-01 | 2007-12-06 | Sharp Laboratories Of America, Inc. | Method and system for helping operate a media-playing set |
| US9300920B2 (en)* | 2006-03-03 | 2016-03-29 | Sharp Laboratories Of America, Inc. | Method and system for configuring media-playing sets |
| US7930266B2 (en)* | 2006-03-09 | 2011-04-19 | Intel Corporation | Method for classifying microelectronic dies using die level cherry picking system based on dissimilarity matrix |
| US20070245373A1 (en)* | 2006-03-31 | 2007-10-18 | Sharp Laboratories Of America, Inc. | Method for configuring media-playing sets |
| US8050793B1 (en)* | 2006-04-04 | 2011-11-01 | Advanced Micro Devices, Inc. | Method and apparatus for linking reticle manufacturing data |
| US8583695B2 (en)* | 2006-06-28 | 2013-11-12 | Bank Of America Corporation | Method and apparatus for evaluating statistical significance over time |
| US7992086B2 (en)* | 2006-06-30 | 2011-08-02 | Sharp Laboratories Of America, Inc. | System and method for adjusting a media-playing set |
| US7337033B1 (en)* | 2006-07-28 | 2008-02-26 | International Business Machines Corporation | Data mining to detect performance quality of tools used repetitively in manufacturing |
| US8589523B2 (en) | 2006-08-08 | 2013-11-19 | Sharp Laboratories Of America, Inc. | Personalized assistance with setup of a media-playing set |
| US20080040430A1 (en)* | 2006-08-10 | 2008-02-14 | Sharp Laboratories Of America, Inc. | System and method to facilitate operating a media-playing set |
| US7627432B2 (en) | 2006-09-01 | 2009-12-01 | Spss Inc. | System and method for computing analytics on structured data |
| US8134124B2 (en) | 2006-10-20 | 2012-03-13 | Fei Company | Method for creating S/tem sample and sample structure |
| US8357913B2 (en) | 2006-10-20 | 2013-01-22 | Fei Company | Method and apparatus for sample extraction and handling |
| US7882076B2 (en)* | 2006-12-14 | 2011-02-01 | Lam Research Corporation | Primary server architectural networking arrangement and methods therefor |
| US20080178214A1 (en)* | 2007-01-19 | 2008-07-24 | Sharp Laboratories Of America, Inc. | Context relevant controls |
| US9058307B2 (en) | 2007-01-26 | 2015-06-16 | Microsoft Technology Licensing, Llc | Presentation generation using scorecard elements |
| US7647326B2 (en)* | 2007-01-29 | 2010-01-12 | Sharp Laboratories Of America, Inc. | Method and system for evaluating media-playing sets |
| US8495663B2 (en)* | 2007-02-02 | 2013-07-23 | Microsoft Corporation | Real time collaboration using embedded data visualizations |
| US20080228685A1 (en)* | 2007-03-13 | 2008-09-18 | Sharp Laboratories Of America, Inc. | User intent prediction |
| US7656182B2 (en)* | 2007-03-21 | 2010-02-02 | International Business Machines Corporation | Testing method using a scalable parametric measurement macro |
| JP4697896B2 (en)* | 2007-03-24 | 2011-06-08 | 東京エレクトロン株式会社 | Semiconductor manufacturing apparatus, apparatus operating parameter management method, and program |
| US7539585B2 (en)* | 2007-06-14 | 2009-05-26 | International Business Machines Corporation | System and method for rule-based data mining and problem detection for semiconductor fabrication |
| US7987484B2 (en)* | 2007-06-24 | 2011-07-26 | Microsoft Corporation | Managing media content with a self-organizing map |
| US8078303B2 (en) | 2007-07-03 | 2011-12-13 | Southwire Company | Electronic supervisor |
| US7560946B2 (en)* | 2007-08-10 | 2009-07-14 | International Business Machines Corporation | Method of acceptance for semiconductor devices |
| US20090089024A1 (en)* | 2007-09-28 | 2009-04-02 | Chung-Ho Huang | Methods and arrangement for creating models for fine-tuning recipes |
| US20090187928A1 (en)* | 2007-10-22 | 2009-07-23 | Rextide Inc. | Primary Application Advertising Layer |
| US8078552B2 (en)* | 2008-03-08 | 2011-12-13 | Tokyo Electron Limited | Autonomous adaptive system and method for improving semiconductor manufacturing quality |
| US8396582B2 (en) | 2008-03-08 | 2013-03-12 | Tokyo Electron Limited | Method and apparatus for self-learning and self-improving a semiconductor manufacturing tool |
| US8190543B2 (en) | 2008-03-08 | 2012-05-29 | Tokyo Electron Limited | Autonomous biologically based learning tool |
| US8725667B2 (en)* | 2008-03-08 | 2014-05-13 | Tokyo Electron Limited | Method and system for detection of tool performance degradation and mismatch |
| DE102008014151A1 (en)* | 2008-03-14 | 2009-09-17 | Abb Technology Ag | Method and device for storing data, which in each case belong to an alarm or event message containing multiple attributes |
| TWI380391B (en)* | 2008-05-02 | 2012-12-21 | Inotera Memories Inc | Machine fault detection method |
| TWI380143B (en)* | 2008-06-25 | 2012-12-21 | Inotera Memories Inc | Method for predicting cycle time |
| US20100162126A1 (en)* | 2008-12-23 | 2010-06-24 | Palm, Inc. | Predictive cache techniques |
| SG174454A1 (en)* | 2009-03-20 | 2011-10-28 | Krishna Kumar Mehra | A mobile phone based mobile customer relationship loyalty methodology and servicing system with instant analytics features thereof |
| US8555381B2 (en)* | 2009-04-01 | 2013-10-08 | Honeywell International Inc. | Cloud computing as a security layer |
| US9218000B2 (en)* | 2009-04-01 | 2015-12-22 | Honeywell International Inc. | System and method for cloud computing |
| US9412137B2 (en)* | 2009-04-01 | 2016-08-09 | Honeywell International Inc. | Cloud computing for a manufacturing execution system |
| US8775433B2 (en)* | 2009-10-16 | 2014-07-08 | Oracle International Corporation | Self-indexing data structure |
| JP2011109290A (en)* | 2009-11-16 | 2011-06-02 | Hitachi Plant Technologies Ltd | Wireless transmission/reception device, and mobile management system |
| US9014827B2 (en)* | 2010-01-14 | 2015-04-21 | International Business Machines Corporation | Dynamically generating a manufacturing production work flow with selectable sampling strategies |
| US9002492B2 (en) | 2010-02-16 | 2015-04-07 | Applied Materials, Inc. | Methods and apparatuses for utilizing adaptive predictive algorithms and determining when to use the adaptive predictive algorithms for virtual metrology |
| US8458757B2 (en) | 2010-08-31 | 2013-06-04 | At&T Intellectual Property I, L.P. | Method and system for region-based monitoring of video assets |
| EP2447889A1 (en)* | 2010-10-29 | 2012-05-02 | Siemens Aktiengesellschaft | Method for modeling a defect management in a manufacturing process and for handling the defect during the production process based on said modeled defect management |
| US8332900B2 (en) | 2010-12-01 | 2012-12-11 | At&T Intellectual Property I, L.P. | Method and system for performance metric analysis of video assets |
| US8826354B2 (en) | 2010-12-01 | 2014-09-02 | At&T Intellectual Property I, L.P. | Method and system for testing closed caption content of video assets |
| US9172950B2 (en) | 2010-12-02 | 2015-10-27 | At&T Intellectual Property I, L.P. | Method and system using automated workflow for monitoring of video assets |
| US8544034B2 (en) | 2010-12-02 | 2013-09-24 | At&T Intellectual Property I, L.P. | Method and system for automated monitoring of video assets |
| US8701057B2 (en)* | 2011-04-11 | 2014-04-15 | Nvidia Corporation | Design, layout, and manufacturing techniques for multivariant integrated circuits |
| US10372878B2 (en)* | 2011-06-30 | 2019-08-06 | Verizon Patent And Licensing Inc. | Secure communications |
| US8768921B2 (en)* | 2011-10-20 | 2014-07-01 | International Business Machines Corporation | Computer-implemented information reuse |
| US9915940B2 (en)* | 2011-10-31 | 2018-03-13 | Applied Materials, Llc | Bi-directional association and graphical acquisition of time-based equipment sensor data and material-based metrology statistical process control data |
| US9953280B2 (en)* | 2011-11-15 | 2018-04-24 | Rockwell Automation Technologies, Inc. | Industry-specific workflows in a manufacturing execution system with premier integration |
| US9588503B2 (en) | 2011-11-15 | 2017-03-07 | Rockwell Automation Technologies, Inc. | Routing of enterprise resource planning messages |
| CN102591929B (en)* | 2011-12-23 | 2013-10-23 | 深圳职业技术学院 | A library data processing system and its data processing method |
| EP2648116A3 (en)* | 2012-04-03 | 2014-05-28 | Tata Consultancy Services Limited | Automated system and method of data scrubbing |
| US9378197B1 (en)* | 2012-08-16 | 2016-06-28 | Gmg Holdings, Llc | Statistical analysis method for automatically selecting a statistical analysis algorithm based on data values and input parameters |
| US20140208217A1 (en) | 2013-01-22 | 2014-07-24 | Splunk Inc. | Interface for managing splittable timestamps across event records |
| US9594814B2 (en) | 2012-09-07 | 2017-03-14 | Splunk Inc. | Advanced field extractor with modification of an extracted field |
| US8682906B1 (en) | 2013-01-23 | 2014-03-25 | Splunk Inc. | Real time display of data field values based on manual editing of regular expressions |
| US9753909B2 (en) | 2012-09-07 | 2017-09-05 | Splunk, Inc. | Advanced field extractor with multiple positive examples |
| US8751499B1 (en) | 2013-01-22 | 2014-06-10 | Splunk Inc. | Variable representative sampling under resource constraints |
| US8751963B1 (en) | 2013-01-23 | 2014-06-10 | Splunk Inc. | Real time indication of previously extracted data fields for regular expressions |
| US10394946B2 (en) | 2012-09-07 | 2019-08-27 | Splunk Inc. | Refining extraction rules based on selected text within events |
| US9881398B2 (en)* | 2012-11-06 | 2018-01-30 | Applied Materials, Inc. | Trend dynamic sensor imaging using contour maps to visualize multiple trend data sets in a single view |
| US8909642B2 (en) | 2013-01-23 | 2014-12-09 | Splunk Inc. | Automatic generation of a field-extraction rule based on selections in a sample event |
| US9152929B2 (en) | 2013-01-23 | 2015-10-06 | Splunk Inc. | Real time display of statistics and values for selected regular expressions |
| US20140244548A1 (en)* | 2013-02-22 | 2014-08-28 | Nvidia Corporation | System, method, and computer program product for classification of silicon wafers using radial support vector machines to process ring oscillator parametric data |
| US20140303912A1 (en)* | 2013-04-07 | 2014-10-09 | Kla-Tencor Corporation | System and method for the automatic determination of critical parametric electrical test parameters for inline yield monitoring |
| KR101538843B1 (en)* | 2013-05-31 | 2015-07-22 | 삼성에스디에스 주식회사 | Yield management system and method for root cause analysis using manufacturing sensor data |
| US9910429B2 (en)* | 2013-09-03 | 2018-03-06 | The Procter & Gamble Company | Systems and methods for adjusting target manufacturing parameters on an absorbent product converting line |
| CN103678529B (en)* | 2013-11-29 | 2017-01-18 | 上海华力微电子有限公司 | Integration method of wafer test data of multiple times |
| CN105874389B (en)* | 2013-12-30 | 2018-06-26 | Asml荷兰有限公司 | For designing the method and apparatus for measuring target |
| US9971801B2 (en)* | 2014-03-26 | 2018-05-15 | Interject Data Systems, Inc. | Grid cell data requests |
| US9262819B1 (en) | 2014-09-26 | 2016-02-16 | GlobalFoundries, Inc. | System and method for estimating spatial characteristics of integrated circuits |
| US10935962B2 (en)* | 2015-11-30 | 2021-03-02 | National Cheng Kung University | System and method for identifying root causes of yield loss |
| US10853482B2 (en) | 2016-06-03 | 2020-12-01 | Honeywell International Inc. | Secure approach for providing combined environment for owners/operators and multiple third parties to cooperatively engineer, operate, and maintain an industrial process control and automation system |
| US10310467B2 (en) | 2016-08-30 | 2019-06-04 | Honeywell International Inc. | Cloud-based control platform with connectivity to remote embedded devices in distributed control system |
| EP3577550A4 (en)* | 2017-02-02 | 2021-03-24 | The Strategy Collective DBA Blkbox | METHOD, DEVICE AND SYSTEM FOR MODEL SELECTION FOR DATA ANALYSIS FOR REAL-TIME DATA VISUALIZATION |
| US10482128B2 (en) | 2017-05-15 | 2019-11-19 | Oracle International Corporation | Scalable approach to information-theoretic string similarity using a guaranteed rank threshold |
| JP6799501B2 (en)* | 2017-06-06 | 2020-12-16 | 株式会社日立製作所 | Computer system and data analysis method |
| US10360671B2 (en)* | 2017-07-11 | 2019-07-23 | Kla-Tencor Corporation | Tool health monitoring and matching |
| US11187992B2 (en)* | 2017-10-23 | 2021-11-30 | Applied Materials, Inc. | Predictive modeling of metrology in semiconductor processes |
| US10503144B2 (en)* | 2017-10-24 | 2019-12-10 | Applied Materials, Inc. | Anomaly detection with correlation coeffiecients |
| EP3740931A1 (en)* | 2018-01-19 | 2020-11-25 | Zoe Life Technologies Holding AG | Knowledge system |
| JP6917930B2 (en)* | 2018-03-15 | 2021-08-11 | キオクシア株式会社 | Defect analysis device and defect analysis method |
| US11237550B2 (en) | 2018-03-28 | 2022-02-01 | Honeywell International Inc. | Ultrasonic flow meter prognostics with near real-time condition based uncertainty analysis |
| JP6782275B2 (en)* | 2018-04-10 | 2020-11-11 | 株式会社日立製作所 | Data catalog automatic generation system and its automatic generation method |
| JP6962858B2 (en)* | 2018-04-27 | 2021-11-05 | ファナック株式会社 | Image management device |
| US20190392001A1 (en)* | 2018-06-15 | 2019-12-26 | Deep Insight Solutions, Inc. dba Lucd | Systems and Methods for an Artificial Intelligence Data Fusion Platform |
| KR101940029B1 (en) | 2018-07-11 | 2019-01-18 | 주식회사 마키나락스 | Anomaly detection |
| KR102101974B1 (en) | 2019-01-23 | 2020-04-17 | 주식회사 마키나락스 | Anomaly detection |
| KR102838452B1 (en)* | 2019-02-14 | 2025-07-24 | 램 리써치 코포레이션 | Data capture and transformation to support data analytics and machine learning for substrate fabrication systems |
| US11615302B2 (en) | 2019-03-06 | 2023-03-28 | Samsung Electronics Co., Ltd. | Effective user modeling with time-aware based binary hashing |
| KR102295805B1 (en) | 2019-04-02 | 2021-08-31 | 주식회사 마키나락스 | Method for managing training data |
| US11354329B2 (en)* | 2019-10-28 | 2022-06-07 | Bank Of America Corporation | Systems for real-time mining of data in test and development environments |
| KR102531645B1 (en) | 2020-02-24 | 2023-05-11 | 주식회사 마키나락스 | Computer program for performance testing of models |
| US11734580B2 (en) | 2020-05-19 | 2023-08-22 | Tata Consultancy Services Limited | Building analytical platform to enable device fabrication |
| US11810284B2 (en) | 2020-08-21 | 2023-11-07 | Kla Corporation | Unsupervised learning for repeater-defect detection |
| CN112732689B (en)* | 2020-12-31 | 2022-12-09 | 贵州电网有限责任公司 | Transformer area voltage monitoring data processing method |
| US11868971B2 (en)* | 2021-08-02 | 2024-01-09 | Arch Systems Inc. | Method for manufacturing system analysis and/or maintenance |
| US11586675B1 (en)* | 2021-08-03 | 2023-02-21 | Jmp Statistical Discovery Llc | Interactive graphical user interface for specification rate settings and predictions |
| WO2024197395A1 (en)* | 2023-03-29 | 2024-10-03 | Ats Corporation | Systems and methods for maintaining a record for a workpiece processed by a computer numerically controlled (cnc) electronically synchronized manufacturing assembly line cell |
| CN116304931B (en)* | 2023-05-12 | 2023-08-04 | 山东英伟电子技术有限公司 | Electric power data mining method based on big data |
| CN117743314A (en)* | 2024-01-24 | 2024-03-22 | 鼎捷软件股份有限公司 | Data cleaning system and data cleaning method |
Family Cites Families (9)
| Publication number | Priority date | Publication date | Assignee | Title |
|---|---|---|---|---|
| US5222210A (en) | 1990-12-03 | 1993-06-22 | Motorola, Inc. | Method of displaying the state of an artificial neural network |
| US5097141A (en) | 1990-12-12 | 1992-03-17 | Motorola, Inc. | Simple distance neuron |
| US5692107A (en) | 1994-03-15 | 1997-11-25 | Lockheed Missiles & Space Company, Inc. | Method for generating predictive models in a computer system |
| US5819245A (en) | 1995-09-05 | 1998-10-06 | Motorola, Inc. | Method of organizing data into a graphically oriented format |
| US6571227B1 (en)* | 1996-11-04 | 2003-05-27 | 3-Dimensional Pharmaceuticals, Inc. | Method, system and computer program product for non-linear mapping of multi-dimensional data |
| US5897627A (en) | 1997-05-20 | 1999-04-27 | Motorola, Inc. | Method of determining statistically meaningful rules |
| US5926809A (en)* | 1997-08-29 | 1999-07-20 | Advanced Micro Devices, Inc. | Two-tier query methodology for a database |
| US6878517B1 (en)* | 1999-12-15 | 2005-04-12 | Congra Grocery Products Company | Multispecies food testing and characterization organoleptic properties |
| US6839713B1 (en)* | 2001-07-12 | 2005-01-04 | Advanced Micro Devices, Inc. | System and software for database structure in semiconductor manufacturing and method thereof |
- 2002
- 2002-07-12USUS10/194,920patent/US6965895B2/ennot_activeExpired - Lifetime
- 2002-07-29CNCNB028147685Apatent/CN100370455C/ennot_activeExpired - Fee Related
- 2002-07-29WOPCT/US2002/024114patent/WO2003012696A2/enactiveApplication Filing
- 2002-07-29KRKR10-2003-7015655Apatent/KR20040045402A/ennot_activeWithdrawn
- 2002-07-29KRKR1020097024381Apatent/KR20090133138A/ennot_activeAbandoned
Cited By (26)
| Publication number | Priority date | Publication date | Assignee | Title |
|---|---|---|---|---|
| CN103824177B (en)* | 2005-10-05 | 2018-03-20 | 邓白氏公司 | Modular web-based ASP application for multiple products |
| US8229587B2 (en) | 2008-02-22 | 2012-07-24 | Muratec Automation Co., Ltd. | Semiconductor fabrication facility visualization system with performance optimization |
| CN101978389B (en)* | 2008-02-22 | 2014-07-09 | 村田机械株式会社 | Vao productivity suite |
| CN107479509A (en)* | 2008-03-06 | 2017-12-15 | 应用材料公司 | Yield prediction feedback for control device engineering system |
| CN101965569A (en)* | 2008-03-06 | 2011-02-02 | 应用材料公司 | Yield Predictive Feedback for Control Equipment Engineering Systems |
| CN101965569B (en)* | 2008-03-06 | 2017-05-03 | 应用材料公司 | Yield Predictive Feedback for Control Equipment Engineering Systems |
| CN102541916A (en)* | 2010-12-29 | 2012-07-04 | 沈阳中科博微自动化技术有限公司 | Method for recording and managing historical data of semiconductor equipment |
| CN102073706A (en)* | 2010-12-30 | 2011-05-25 | 北京锐安科技有限公司 | Combined application method of distributed file storage system and relation database |
| CN102073706B (en)* | 2010-12-30 | 2013-02-13 | 北京锐安科技有限公司 | Combined application method of distributed file storage system and relation database |
| CN103678392A (en)* | 2012-09-20 | 2014-03-26 | 阿里巴巴集团控股有限公司 | Data increment and merging method and device for achieving method |
| CN102930045A (en)* | 2012-11-15 | 2013-02-13 | 沈阳中科博微自动化技术有限公司 | Multi-device formula management method of integrated circuit production line |
| CN108229689A (en)* | 2013-01-17 | 2018-06-29 | 应用材料公司 | In semiconductor processing equipment deviation classification is carried out using radial primary function network and hypercube |
| CN108229689B (en)* | 2013-01-17 | 2022-04-05 | 应用材料公司 | Deviation classification in semiconductor processing equipment using radial basis function networks and hypercubes |
| CN109074378A (en)* | 2016-03-30 | 2018-12-21 | 微软技术许可有限责任公司 | Modular Electronic Data Analysis Computing System |
| CN109643329A (en)* | 2016-09-29 | 2019-04-16 | 谷歌有限责任公司 | Generating charts from data in data tables |
| US11694024B2 (en) | 2016-09-29 | 2023-07-04 | Google Llc | Generating charts from data in a data table |
| CN109643329B (en)* | 2016-09-29 | 2023-09-29 | 谷歌有限责任公司 | Generating a chart from data in a data table |
| US12112123B2 (en) | 2016-09-29 | 2024-10-08 | Google Llc | Generating charts from data in a data table |
| CN106776733A (en)* | 2016-11-22 | 2017-05-31 | 北京航天自动控制研究所 | The data staging methods of sampling in data handling system |
| CN106649867B (en)* | 2016-12-30 | 2018-05-18 | 北京亚控科技发展有限公司 | A method of organizing object data |
| CN106649867A (en)* | 2016-12-30 | 2017-05-10 | 北京亚控科技发展有限公司 | A method of organizing object data |
| CN108345450A (en)* | 2017-01-24 | 2018-07-31 | 西门子公司 | The method for generating the software architecture for managing data |
| CN108804745A (en)* | 2018-04-13 | 2018-11-13 | 上海机电工程研究所 | Flight vehicle aerodynamic test data management system and method |
| CN112527387A (en)* | 2020-11-20 | 2021-03-19 | 杭州大搜车汽车服务有限公司 | Application processing method and device |
| CN112527387B (en)* | 2020-11-20 | 2024-03-01 | 杭州大搜车汽车服务有限公司 | Application processing method and device |
| CN115685918A (en)* | 2022-10-25 | 2023-02-03 | 深圳中广核工程设计有限公司 | Test method, device and system for control loop of nuclear power plant |
Also Published As
| Publication number | Publication date |
|---|---|
| CN100370455C (en) | 2008-02-20 |
| WO2003012696A2 (en) | 2003-02-13 |
| WO2003012696A9 (en) | 2003-04-10 |
| US20030061212A1 (en) | 2003-03-27 |
| KR20090133138A (en) | 2009-12-31 |
| KR20040045402A (en) | 2004-06-01 |
| WO2003012696A8 (en) | 2004-05-06 |
| WO2003012696A3 (en) | 2003-11-27 |
| US6965895B2 (en) | 2005-11-15 |
Similar Documents
| Publication | Publication Date | Title |
|---|---|---|
| CN1535435A (en) | Method and apparatus for analyzing manufacturing data | |
| US6701259B2 (en) | Defect source identifier | |
| CN1199235C (en) | Method and device for searching flaw aggregation in mfg. semiconductor device, and program thereby | |
| KR100986789B1 (en) | Apparatus and method for monitoring tool performance | |
| CN1682165A (en) | Method and apparatus for the monitoring and control of a semiconductor manufacturing process | |
| CN1392954A (en) | Defect knowledge base | |
| US20050251276A1 (en) | System and method for real-time fault detection, classification, and correction in a semiconductor manufacturing environment | |
| Chien et al. | A data mining approach for analyzing semiconductor MES and FDC data to enhance overall usage effectiveness (OUE) | |
| US20130173332A1 (en) | Architecture for root cause analysis, prediction, and modeling and methods therefor | |
| JP2008511140A (en) | Method and apparatus for detection of local outliers | |
| CN1666203A (en) | Method and apparatus for automatic sensor installation | |
| US7577486B2 (en) | Quality improvement system | |
| WO2002029392A2 (en) | Defect source identifier | |
| Pan et al. | A virtual metrology system for predicting end-of-line electrical properties using a MANCOVA model with tools clustering | |
| CN103137513A (en) | Integrated circuit manufacturing tool condition monitoring system and method | |
| CN111178688A (en) | Self-service analysis method and system for power technology supervision data, storage medium and computer equipment | |
| Weiss et al. | Continuous prediction of manufacturing performance throughout the production lifecycle | |
| CN101036092B (en) | Method and system for dynamically controlling metrology work in progress | |
| Dabbas et al. | Mining semiconductor manufacturing data for productivity improvement—an integrated relational database approach | |
| Tobin Jr et al. | Integrated applications of inspection data in the semiconductor manufacturing environment | |
| Giri et al. | Explainable machine learning approach to yield and quality improvements using deep topological data analytics | |
| JP4446231B2 (en) | Manufacturing data analysis method and apparatus | |
| TWI230349B (en) | Method and apparatus for analyzing manufacturing data | |
| CN1428696A (en) | KDD* system based on double-library synergistic mechanism | |
| US20030135295A1 (en) | Defect source identifier with static manufacturing execution system |
Legal Events
| Date | Code | Title | Description |
|---|---|---|---|
| C06 | Publication | ||
| PB01 | Publication | ||
| C10 | Entry into substantive examination | ||
| SE01 | Entry into force of request for substantive examination | ||
| C14 | Grant of patent or utility model | ||
| GR01 | Patent grant | ||
| C17 | Cessation of patent right | ||
| CF01 | Termination of patent right due to non-payment of annual fee | Granted publication date:20080220 Termination date:20100729 |