CN1172419A - Method and system of monitoring one or more solutes in biological system using optical techniques - Google Patents
Method and system of monitoring one or more solutes in biological system using optical techniquesDownload PDFInfo
- Publication number
- CN1172419A CN1172419ACN95196574ACN95196574ACN1172419ACN 1172419 ACN1172419 ACN 1172419ACN 95196574 ACN95196574 ACN 95196574ACN 95196574 ACN95196574 ACN 95196574ACN 1172419 ACN1172419 ACN 1172419A
- Authority
- CN
- China
- Prior art keywords
- light
- solute
- biological system
- path length
- portions
- Prior art date
- Legal status (The legal status is an assumption and is not a legal conclusion. Google has not performed a legal analysis and makes no representation as to the accuracy of the status listed.)
- Pending
Links
Images


Classifications
- A—HUMAN NECESSITIES
- A61—MEDICAL OR VETERINARY SCIENCE; HYGIENE
- A61B—DIAGNOSIS; SURGERY; IDENTIFICATION
- A61B5/00—Measuring for diagnostic purposes; Identification of persons
- A61B5/145—Measuring characteristics of blood in vivo, e.g. gas concentration or pH-value ; Measuring characteristics of body fluids or tissues, e.g. interstitial fluid or cerebral tissue
- A61B5/1455—Measuring characteristics of blood in vivo, e.g. gas concentration or pH-value ; Measuring characteristics of body fluids or tissues, e.g. interstitial fluid or cerebral tissue using optical sensors, e.g. spectral photometrical oximeters
- A—HUMAN NECESSITIES
- A61—MEDICAL OR VETERINARY SCIENCE; HYGIENE
- A61B—DIAGNOSIS; SURGERY; IDENTIFICATION
- A61B5/00—Measuring for diagnostic purposes; Identification of persons
- A61B5/145—Measuring characteristics of blood in vivo, e.g. gas concentration or pH-value ; Measuring characteristics of body fluids or tissues, e.g. interstitial fluid or cerebral tissue
- A61B5/14532—Measuring characteristics of blood in vivo, e.g. gas concentration or pH-value ; Measuring characteristics of body fluids or tissues, e.g. interstitial fluid or cerebral tissue for measuring glucose, e.g. by tissue impedance measurement
- A—HUMAN NECESSITIES
- A61—MEDICAL OR VETERINARY SCIENCE; HYGIENE
- A61B—DIAGNOSIS; SURGERY; IDENTIFICATION
- A61B5/00—Measuring for diagnostic purposes; Identification of persons
- A61B5/145—Measuring characteristics of blood in vivo, e.g. gas concentration or pH-value ; Measuring characteristics of body fluids or tissues, e.g. interstitial fluid or cerebral tissue
- A61B5/14546—Measuring characteristics of blood in vivo, e.g. gas concentration or pH-value ; Measuring characteristics of body fluids or tissues, e.g. interstitial fluid or cerebral tissue for measuring analytes not otherwise provided for, e.g. ions, cytochromes
- A—HUMAN NECESSITIES
- A61—MEDICAL OR VETERINARY SCIENCE; HYGIENE
- A61B—DIAGNOSIS; SURGERY; IDENTIFICATION
- A61B5/00—Measuring for diagnostic purposes; Identification of persons
- A61B5/145—Measuring characteristics of blood in vivo, e.g. gas concentration or pH-value ; Measuring characteristics of body fluids or tissues, e.g. interstitial fluid or cerebral tissue
- A61B5/1455—Measuring characteristics of blood in vivo, e.g. gas concentration or pH-value ; Measuring characteristics of body fluids or tissues, e.g. interstitial fluid or cerebral tissue using optical sensors, e.g. spectral photometrical oximeters
- A61B5/14551—Measuring characteristics of blood in vivo, e.g. gas concentration or pH-value ; Measuring characteristics of body fluids or tissues, e.g. interstitial fluid or cerebral tissue using optical sensors, e.g. spectral photometrical oximeters for measuring blood gases
- A—HUMAN NECESSITIES
- A61—MEDICAL OR VETERINARY SCIENCE; HYGIENE
- A61B—DIAGNOSIS; SURGERY; IDENTIFICATION
- A61B5/00—Measuring for diagnostic purposes; Identification of persons
- A61B5/68—Arrangements of detecting, measuring or recording means, e.g. sensors, in relation to patient
- A61B5/6801—Arrangements of detecting, measuring or recording means, e.g. sensors, in relation to patient specially adapted to be attached to or worn on the body surface
- A61B5/6813—Specially adapted to be attached to a specific body part
- A61B5/6824—Arm or wrist
- A—HUMAN NECESSITIES
- A61—MEDICAL OR VETERINARY SCIENCE; HYGIENE
- A61B—DIAGNOSIS; SURGERY; IDENTIFICATION
- A61B5/00—Measuring for diagnostic purposes; Identification of persons
- A61B5/72—Signal processing specially adapted for physiological signals or for diagnostic purposes
- A61B5/7235—Details of waveform analysis
- A61B5/7253—Details of waveform analysis characterised by using transforms
- A61B5/7257—Details of waveform analysis characterised by using transforms using Fourier transforms
Landscapes
- Health & Medical Sciences (AREA)
- Life Sciences & Earth Sciences (AREA)
- Physics & Mathematics (AREA)
- Molecular Biology (AREA)
- Animal Behavior & Ethology (AREA)
- Pathology (AREA)
- Engineering & Computer Science (AREA)
- Biomedical Technology (AREA)
- Heart & Thoracic Surgery (AREA)
- Medical Informatics (AREA)
- Optics & Photonics (AREA)
- Surgery (AREA)
- Biophysics (AREA)
- General Health & Medical Sciences (AREA)
- Public Health (AREA)
- Veterinary Medicine (AREA)
- Spectroscopy & Molecular Physics (AREA)
- Emergency Medicine (AREA)
- Measurement Of The Respiration, Hearing Ability, Form, And Blood Characteristics Of Living Organisms (AREA)
- Investigating Or Analysing Materials By Optical Means (AREA)
Abstract
Description
Translated fromChinese本发明涉及使用光学技术在一个生物系统中体内监视一种或多种溶质的方法和系统。The present invention relates to methods and systems for in vivo monitoring of one or more solutes in a biological system using optical techniques.
在一个生物系统中监视一种溶质的浓度(例如,低分子重量的碳水或聚羟化合物,象糖类(甘露醇,山梨糖醇,果糖,蔗糖或葡萄糖)、酒精(甲醇,乙醇或丙醇类)、电解质(钠,钾,镁,钙或氯化铁))在医学上有着重要应用。例如,对于亏损胰岛素的糖尿病人来说,监视他们的葡萄糖水平是十分重要的,以便在出现伤害之前使其治愈。Monitoring the concentration of a solute (e.g., low molecular weight carbohydrates or polyols like sugars (mannitol, sorbitol, fructose, sucrose or glucose), alcohols (methanol, ethanol or propanol) in a biological system class), electrolytes (sodium, potassium, magnesium, calcium or ferric chloride)) have important applications in medicine. For example, in insulin-deficient diabetics, it is important to monitor their glucose levels so that they heal before damage occurs.
近红外(NIR)辐射已经被用于在人体组织(例如人脑、手指或耳垂)中的氧化新陈代谢作无创伤研究。采用可见光、NIR和红外(IR)辐射进行医学成象带来一些长处。在肿瘤和人体组织之间,NIR或IR范围内的对比系数要比在X射线范围内的对比系数大得多。此外,IR辐射明显优于X-射线辐射之处在于它的无创伤性;因而意味着更小的副作用。但是,由于是低能量辐射,这样的可见光或红外光辐射在生物组织内被强烈地散射和吸收,而且其迁移路径不能用直线近似,使得在断层成象技术中某些方面无法应用。Near-infrared (NIR) radiation has been used to non-invasively study oxidative metabolism in human tissues such as the human brain, fingers or earlobes. Medical imaging using visible light, NIR, and infrared (IR) radiation offers several advantages. Between tumors and human tissue, the contrast coefficient in the NIR or IR range is much greater than in the X-ray range. Furthermore, IR radiation is clearly superior to X-ray radiation in that it is non-invasive; thus meaning fewer side effects. However, due to low-energy radiation, such visible or infrared radiation is strongly scattered and absorbed in biological tissue, and its migration path cannot be approximated by a straight line, making certain aspects of tomography unapplicable.
总的来说,本发明要实现一种在生物系统中监视一种(或多种)溶质的方法,包括有步骤:把光传送进入包括一种(或多种)溶质的一个生物系统中,该光具有实际上该一种(或多种)溶质所不吸收的一个范围内的一个选定波长;对于该传送的光的至少第一和第二部分进行检测,该第一部分已经沿着以第一平均路径长度为特征的一条或多条路径穿行通过该生物系统,而该第二部分已经沿着以大于该第一平均路径长度的第二平均路径长度为特征的一条或多条路径穿行通过该生物系统;以及,对于该传送的光的该第一和第二部分进行比较,以便监视在该生物系统中的该一种(或多种)溶质的浓度。In general, the present invention realizes a method of monitoring one (or more) solutes in a biological system, comprising the steps of: transmitting light into a biological system including one (or more) solutes, The light has a selected wavelength within a range that is substantially not absorbed by the solute(s); at least first and second portions of the transmitted light are detected, the first portion having been along the One or more paths characterized by a first average path length have traveled through the biological system, and the second portion has traveled along one or more paths characterized by a second average path length greater than the first average path length through the biological system; and, comparing the first and second portions of the transmitted light to monitor the concentration of the solute(s) in the biological system.
本发明的实施例可以包括下列特征的一个或多个。把所传送的光的第一和第二部分进行比较,这种比较最好包括根据与该生物系统的一个光学特性和该第一和第二平均路径长度相关的一个线性标本而获得的该生物系统的品质特征。如此获得的品质特征可以是通过将光的第一和第二部分的该线性标本的被测特性与第一和第二路径长度的距离表示相配合而确定的一条线的斜率和/或截距。获得一个品质特征可以包括获得根据被测光的第一和第二部分对于生物系统的第一和第二光的密度的测量,并将光的密度的测量与该通常的线性标本相配合。把所传送的光的第一和第二部分所作的比较可以包括根据该生物系统的品质特征对照一个预定的标度而对于该溶质的一种或多种的浓度的测量所进行的确定。Implementations of the invention may include one or more of the following features. comparing the first and second portions of the transmitted light, the comparison preferably comprising the biological System quality characteristics. The quality characteristic thus obtained may be the slope and/or intercept of a line determined by fitting the measured properties of the linear specimen of the first and second portions of light with distance representations of the first and second path lengths . Obtaining a quality characteristic may include obtaining first and second light density measurements for the biological system based on the first and second portions of the measured light, and fitting the light density measurements to the generally linear specimen. The comparison of the first and second portions of the transmitted light may include a determination of a measurement of the concentration of one or more of the solutes against a predetermined scale based on a quality characteristic of the biological system.
该监视方法可以进一步包括根据一个预定的浓度的标度对于在该生物系统中的一种或多种溶质的浓度的测量进行确定。对于所传送的光的第一和第二部分进行的检测最好包括对于分别对应着光的第一和第二部分的强度第一和第二强度(I1,I2)进行的测量。The monitoring method may further comprise determining the measurement of the concentration of one or more solutes in the biological system according to a predetermined concentration scale. The detecting of the first and second portions of the transmitted light preferably comprises measuring first and second intensities (I1 , I2 ) corresponding to the intensities of the first and second portions of light, respectively.
该监视方法可以进一步包括在时间上的相对于第一和第二基准强度(I1,ref,I2,ref)的该第一和第二强度(I1,I2)的改变。对于该第一和第二强度的相对的改变进行的确定还进一步包括分别地确定第一和第二光的密度(OD1,OD2):
该监视方法还进一步包括对于所传送的光的一个第三部分的检测,该第三部分已经沿着以大于该第一和第二平均路径的第三平均路径为特征的一条或多条路径穿行通过该生物系统。The monitoring method still further includes detecting a third portion of the transmitted light that has traveled along one or more paths characterized by a third average path greater than the first and second average paths through the biological system.
另一方面,本发明要实现一种用于在生物系统中监视一种或多种溶质的系统,它包括有:至少两个光源,具有实际上该一种或多种溶质所不吸收的一个范围内的一个选定波长;相对于至少两个检测器以不同的距离定位的一个检测器,以便对于该传送的光的至少第一和第二部分进行检测,该第一部分已经沿着以第一平均路径长度为特征的一条或多条路径穿行通过该生物系统,而该第二部分已经沿着着以大于该第一平均路径长度的第二平均路径长度为特征的一条或多条路径穿行通过该生物系统;以及一个比较器,用于对该传送的光的该第一和第二部分进行比较,以便监视在该生物系统中的一种或多种溶质的浓度。In another aspect, the present invention realizes a system for monitoring one or more solutes in a biological system, comprising: at least two light sources, with a light source substantially not absorbed by the one or more solutes a selected wavelength within a range; a detector positioned at different distances relative to at least two detectors so as to detect at least first and second portions of the transmitted light, the first portion having been along the first one or more paths characterized by an average path length traverse through the biological system, and the second portion has traveled along one or more paths characterized by a second average path length greater than the first average path length by the biological system; and a comparator for comparing the first and second portions of the transmitted light to monitor the concentration of one or more solutes in the biological system.
在本发明的一个实施例中,使用两个或多个连续光源,并以分离的输入一输出距离测量光的反射。对于以大于2.5cm间距提供的空间解析的反射的确切求解的近似,提供了在间距和相对于基准取样的吸收性变异之间的一个线性关系。这一条直线的斜率和截距是被测取样的吸收和散射系数(μa,μs′)。采用这种技术,能够实现对于在一个生物系统中的溶质的浓度的高的测量敏感性。例如,对于溶质的1毫克分子浓度的改变和每1%的脂类乳剂的改变将会获得大致千分之0.2OD的吸收性的改变。In one embodiment of the invention, two or more continuous light sources are used and the reflection of light is measured at separate input-output distances. An approximation to the exact solution for spatially resolved reflections provided at spacings greater than 2.5 cm provides a linear relationship between spacing and absorbance variation relative to reference sampling. The slope and intercept of this straight line are the absorption and scattering coefficients (μa , μs ′) of the measured sample. Using this technique, a high measurement sensitivity to the concentration of a solute in a biological system can be achieved. For example, a change in absorbance of approximately 0.2 per thousand OD for a 1 mM change in solute and per 1 % change in lipid emulsion will result.
包括在生物系统中的溶质主要是通过对于所加的光进行散射而对于迁移的近红外或红外光作出响应。这种迁移光的信号的强度受到被测光的较大范围和迁移的较长的平均路径长度的影响。这使得我们获得在生物系统的光参数和表示被测光穿过该生物系统(例如是以至少不同的两个光源检测器分布)的平均路径长度的至少两个距离之间的线性关系。Solutes involved in biological systems respond to migrating near-infrared or infrared light primarily by scattering the applied light. The strength of the signal of this shifted light is affected by the larger range of the measured light and the longer average path length of the shift. This allows us to obtain a linear relationship between an optical parameter of a biological system and at least two distances representing the average path length of measured light passing through the biological system (for example with at least two different light source detector distributions).
溶质包括低分子重量的碳水化合物,例如蔗糖、葡萄糖、甘露醇、山梨醇、肌醇、麦芽糖酶、乳糖、半乳糖、和葡萄糖醛酸;以及羟基化合物,例如酒精(甲醇、乙醇)苯酚、邻苯二酚、和黄烷酮类(例如黄烷酮、黄烷醇);以及代谢物和其原体。溶质还包括神经传导物,例如氨基酸(γ氨基丁酸、甘油、谷氨酸)胆碱、醋酸基胆碱、去甲肾上腺素、肾上腺素、多巴胺、血清素和组胺;以及电解质(钠、钾、镁、钙)和在周期表的IA、IIA和VIIB组中的其它的可溶的离子。溶质出现在存在于细胞中的间隙空间中,或是出现在血液中(例如溶解在血清中),或者是这两种情况的组合。它们可以从细胞中提取或从其释放而作为细胞内或细胞间的信使,作为代谢物(或者是其副产品),或者作为代谢物的原体或营养素。Solutes include low molecular weight carbohydrates such as sucrose, glucose, mannitol, sorbitol, inositol, maltase, lactose, galactose, and glucuronic acid; and hydroxyl compounds such as alcohols (methanol, ethanol) phenol, ortho Hydroquinones, and flavanones (eg, flavanones, flavanols); and metabolites and their precursors. Solutes also include neurotransmitters such as amino acids (gamma, glycerol, glutamate), choline, acetate choline, norepinephrine, epinephrine, dopamine, serotonin, and histamine; and electrolytes (sodium, potassium, magnesium, calcium) and other soluble ions in groups IA, IIA and VIIB of the periodic table. The solute occurs in the interstitial spaces present in the cells, or in the blood (eg dissolved in serum), or a combination of the two. They can be extracted from or released from cells as intracellular or intercellular messengers, as metabolites (or by-products thereof), or as precursors or nutrients for metabolites.
溶质可以附带放射同位素H、C、O、S或P(例如,32P)或者具有可检测的添加剂(例如对于在可见或红外范围内的选定波长敏感的反差剂);或者是其衍生物(例如脱氧葡萄糖或磷酸肌醇)。因此,溶质可以被共价连系到一种可测量的外加的反差剂。当被连系到一种可检测的反差剂时,就可以根据本发明所公开的方法,或是对该溶质或是对该反差剂进行监视。例如波长的选择可以是使得一个反差剂实际上不吸收,或者是一个溶质实际上不吸收,或者是这两者的组合。The solute may be accompanied by radioactive isotopes H, C, O, S, or P (eg,32 P) or with detectable additives (eg, contrast agents sensitive to selected wavelengths in the visible or infrared range); or derivatives thereof (such as deoxyglucose or phosphoinositides). Thus, solutes can be covalently linked to a measurable added contrast agent. When linked to a detectable contrast agent, either the solute or the contrast agent can be monitored according to the methods disclosed herein. For example the wavelength can be chosen such that a contrast agent is virtually non-absorbing, or a solute is practically non-absorbing, or a combination of both.
从下面的描述和权利要求中将显见到其它的特征和优点。Other features and advantages will be apparent from the following description and claims.
图1是附在病人的手臂上的一个监视器的侧视图,用于监视在该病人体内的一种或多种溶质的浓度。Figure 1 is a side view of a monitor attached to a patient's arm for monitoring the concentration of one or more solutes in the patient's body.
图1A是沿着图1的直线A-A得到的示意截面图。FIG. 1A is a schematic cross-sectional view taken along line A-A of FIG. 1 .
图1B是图1A中示出的监视器的侧视图。FIG. 1B is a side view of the monitor shown in FIG. 1A.
图1C是图1的监视器的框图。FIG. 1C is a block diagram of the monitor of FIG. 1 .
图1D是对应于一个定序器的一部分的一个电路图。Fig. 1D is a circuit diagram corresponding to a part of a sequencer.
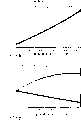
图2是作为时间的函数的强度在该时间周期(T0,T1)中的曲线图,在该期间,溶质的浓度从C0增加到C1。Figure 2 is a graph of intensity as a function of time over the time period (T0 , T1 ) during which the concentration of solute increases from C0 to C1 .
图2A和图2B是对应于图2的时间周期(T0,T1)的作为检测器-光源的间距(ρ)的函数的光的密度的曲线图。2A and 2B are graphs of the intensity of light as a function of the detector-source spacing (p) corresponding to the time period (T0 , T1 ) of FIG. 2 .
图3是作为光源-检测器的间距(ρ)的函数的吸收系数的(μa)计算的变异的曲线。Figure 3 is a plot of the calculated variation of the absorption coefficient (μa ) as a function of the source-detector spacing (p).
图3A是作为光源-检测器的间距(ρ)的函数的吸收系数的(μs′)计算的变异的曲线。Figure 3A is a plot of the calculated variation (μs ') of the absorption coefficient as a function of source-detector spacing (p).
图4是用于监视溶质的浓度的方法的流程图。4 is a flowchart of a method for monitoring the concentration of a solute.
图5和图5A分别是校准标本和用于获得一个校准标度的监视器的侧视图。Figures 5 and 5A are side views, respectively, of a calibration specimen and a monitor used to obtain a calibration scale.
图6是一个表,指示在160mM的浓度的范围内关于葡萄糖的脂类乳剂的光学效应。Figure 6 is a table indicating the optical effect of lipid emulsions on glucose over a concentration range of 160 mM.
图7是作为输入-输出的间隔(ρ)的函数的光的密度的曲线。Figure 7 is a graph of the density of light as a function of the input-output separation (p).
图7A是从作为葡萄糖的浓度函数的图7的曲线拓展而得的斜率和截距的曲线。Figure 7A is a plot of slope and intercept extended from the plot of Figure 7 as a function of concentration of glucose.
图8是添加到老鼠的肝脏的灌注液的时间过程的图示曲线。Figure 8 is a graphical graph of the time course of perfusate added to the liver of a mouse.
图8A是表示作为输入-输出间距(ρ)的函数的光的密度的曲线图,示出了灌注过的肝脏的甘露醇的效果(37℃)。Figure 8A is a graph representing the intensity of light as a function of input-output spacing (p), showing the effect of mannitol on perfused liver (37°C).
图8B是作为图8的甘露醇的浓度的函数的OD曲线的斜率的曲线。FIG. 8B is a graph of the slope of the OD curve of FIG. 8 as a function of the concentration of mannitol.
图9是指示被测量溶质的浓度的病人的一个方法的流程图。Figure 9 is a flowchart of a method of indicating to a patient the concentration of a solute being measured.
图10是将面包的酵母作为散射剂以及各种溶质的一个表格。Figure 10 is a table with baker's yeast as a scatterer and various solutes.
图11是表示各种溶质的光学效果的的一个表格。Figure 11 is a table showing the optical effects of various solutes.
图12是在一个散射体悬浮物(a)和生物组织或血液(b)之间的散射颗粒的体积部分的差别的示意图。Figure 12 is a schematic illustration of the difference in volume fraction of scattering particles between a scatterer suspension (a) and biological tissue or blood (b).
图13(a)-(b)是一个针对于一个0.5%的脂类乳剂-葡萄糖悬浮剂(a)和一个灌注的肝脏(b)的被降低的散射系数μs′。Figures 13(a)-(b) are a reduced scattering coefficientμs ' for a 0.5% lipid emulsion-dextrose suspension (a) and a perfused liver (b).
图14(a)-(c)是一个0.5%的脂类乳剂-甘露醇在830nm被测悬浮剂的时域实验的结果的示意图。Figure 14(a)-(c) is a schematic diagram of the time-domain experiment results of a 0.5% lipid emulsion-mannitol tested suspension at 830nm.
图15(a)-(b)是一个0.5%的脂类乳剂-酵母-甘露醇悬浮剂的以连续波的方法测量的实验结果的曲线。Figure 15(a)-(b) is a curve of experimental results measured by continuous wave method for a 0.5% lipid emulsion-yeast-mannitol suspension.
图16(a)-(b)是根据等式(12)而以更真实的条件针对灌注的肝脏的降低的散射吸收μs′的一个模拟。Figures 16(a)-(b) are a simulation of the reduced scatter absorptionμs ' for the perfused liver under more realistic conditions according to equation (12).
图16(a)是随着该肝脏的细胞的尺寸的下降(顶部标度)或随着在灌注液中的葡萄糖浓度(底部标度)的增加的μs′的增加。Figure 16(a) is the increase inμs ' with decreasing cell size of the liver (top scale) or with increasing glucose concentration in the perfusate (bottom scale).
图16(b)是当着分子外的折射系数和细胞体积系数都被固定时细胞的半径的曲线。Figure 16(b) is a plot of the radius of the cell when both the extramolecular refractive index and the cell volume index are fixed.
图17(a)-(b)示出的是针对于一个冷却过程(a)和加热过程(b)的一个灌注的老鼠肝脏的与温度相关的路径长度的改变的曲线。数据是通过频域的方法获得的。Figures 17(a)-(b) show graphs of temperature-dependent path length changes for a perfused mouse liver for a cooling process (a) and a heating process (b). Data are obtained by frequency domain methods.
图18(a)-(c)是在灌注的条件下,以200mM葡萄糖(a)、200mM甘露醇(b)和加热的处理(c)的一个灌注的老鼠肝脏的路径长度的改变的曲线。Figures 18(a)-(c) are plots of path length change in a perfused mouse liver treated with 200 mM glucose (a), 200 mM mannitol (b) and heat (c) under perfused conditions.
图19是一个以100mM灌注的老鼠的肝脏的吸收系数μa(a)、减低的散射系数μs′、和平均的光的路径长度(c)的实验结果的曲线。Fig. 19 is a graph of experimental results of absorption coefficient μa (a), reduced scattering coefficient μs ', and average light path length (c) of a mouse liver perfused at 100 mM.
图20是在816nm的一个PMS散射改变的轨迹。Figure 20 is a trace of a PMS scattering change at 816nm.
参考图1,通过采用新颖的光学技术,把一个监视器10附在一个生物系统12(例如一个病人的手臂)的表面,以便无创伤地在该病人体内的一种或多种溶质(例如葡萄糖)的浓度。虽然可以通过其它的可用的手段(例如可伸拉的护臂),但是,监视器10是通过一个粘附绷带14附到病人的手臂上的。监视器10也可以附到病人的其它的部位,例如头、乳房、手指或腹部,这要根据所要监视的溶质和病人感觉舒适的程度。最好是,监视器的位置被选择在其血管之外的溶质与相当快速流动的血管附近的溶质的水平相当的位置。Referring to FIG. 1, a
监视器10使用连续的光的方法并包括一个单一的检测器DC放大器系统。这种监视方案产生的结果是其能够实现由时域和频域的方法所实现的灵敏度。以连续的光观测到的这种改变的信噪比的情况是,在以具有0.2Hz带宽的850nm时,是千分之-0.01OD。
参考图1A,在示出的最佳实施例中,监视器10包括三个分离定位的关光源(L1、L2和L3;例如8V的闪光灯)和一个检测器(D1;例如一个硅光电二极管)。这些光源分别与该检测器相距不同的距离(ρ1、ρ2和ρ3)。例如在本实施例中所示,ρ1、ρ2和ρ3分别等于7cm、5cm和3cm。Referring to FIG. 1A , in the preferred embodiment shown, monitor 10 includes three separately positioned off light sources (L1 , L2 and L3 ; e.g., an 8V flashlight) and a detector (D1 ; e.g., an silicon photodiodes). The light sources are respectively at different distances (ρ1 , ρ2 and ρ3 ) from the detector. For example as shown in this example, ρ1 , ρ2 and ρ3 are equal to 7 cm, 5 cm and 3 cm, respectively.
光源将光按顺序送入到病人的手臂中,这是由时序器15所控制的,并且所送入的光沿着一条或多条分别是能够以平均路径长度16、18和20为特征的路径迁移通过病人手臂的一个区域而到达检测器。光源和检测器之间的距离(ρ1、ρ2和ρ3)分别地代表着这些平均路径长度。例如根据被监视的区域的大小和固有噪声电平的情况,灯与检测器的间距可被改变。在一个确定的最佳实施例中,灯的放置应该是足够远,以便利用空间的效应并增强测量的精度。在某些应用中,最好是把灯相距检测器至少是2cm,以便实现为了得出溶质的浓度而使用的数学的简化。The light source sequentially sends light into the patient's arm, controlled by a
如图1B和1C所示,由检测器D1、接收的光首先通过具有对应于850nm的波长的一个带宽的干扰滤波器22。在本最佳实施例中,干扰滤波器是由Omega公司制造的,而硅光电二极管是可从Hamamatsu公司得到的F1227-66BR,对于良好的信噪比来说有大的敏感区和NIR波长的敏感性。该发光二极管的敏感区是大约6mm2。硅二极管检测器被接到与一个记录器26相接的一个放大器24,以便给出轨迹28,该轨迹是表示信号从三个光源穿过病人的手臂的一个区域的时间的函数。放大器24通过调节电位计25来驱动具有零点补偿功能的该记录器。As shown in FIGS. 1B and 1C , light received by detector D1 first passes through an
这三个光源之间是被时序控制的,每一个光源20秒。光的时序器15包括三个变阻器,,它们被调节以便均衡出自三个灯的信号,从而得到相等的信噪比。时序器还包括三个LED36、38、40,以便指示哪一个灯被序控。时序器不仅将时序加到三个灯,而且还以每半秒钟将每一个光源闪烁一次,接通和关闭,以便使得一个取样-保持电路能够监视在亮暗信号之间的不同。以此方式,利用1-2秒的响应时间而获得大致是1×10⁻⁵的光密度(OD)和0.1的噪声电平。在一个实施例中,时序器15是一个用于确定灯的闪烁频率的独立的光源。灯的闪烁是以每秒1/2Hz或2Hz及更大的频率进行。在操作中,一个灯闪烁,该信号由光电检测器所提取,同时该灯的确定被测量并同时存储在图形记录器或存储在计算机的存储器中。The three light sources are controlled by timing, and each light source is 20 seconds. The
获得的所需要的时间与图形存储器比较,并利用光的关闭的条件确立零值。放大器24的输出可以交替地送到电子显示单元(例如一个LCD显示器)。来自放大器24的模拟信号可以在显示单元中数字化,并且作为一个数字数码显示。该信号还被送到一个比较器(例如一个计算机),用于对应着一个校准标度将来自不同光源-检测器位置的被测的光的强度进行比较,以便提供溶质浓度的一个测量。The obtained required time is compared with the graphics memory and a zero value is established with the light off condition. The output of
如下所述,三个变阻器的调节保证来自三个光源的被测的信号强度在一个校准模式期间是相等的。所以,在此示出的曲线的坐标轴对应于针对于散射体唯一条件(即来自所有的3个光源的相等的信号)而获得的基线。在校准模式期间获得的信号被称之为I0。例如通过因数2、5或10记录器的增益可以被增加到一个所希望的电平,以便获得所希望的敏感性的电平。被测的信号由一个因数相乘(例如200,500,1000)。由于在溶质中的浓度的改变而引起的三个信号的偏移被计算成为初始值(I0)的百分比,并由。0.00434相乘,以便转换成用于小于10%的吸收性的改变(ΔOD)的log10的计数。否则就计算log10。As described below, the adjustment of the three rheostats ensures that the measured signal strengths from the three light sources are equal during a calibration mode. Therefore, the axes of the curves shown here correspond to the baseline obtained for the scatterer-only condition (ie equal signals from all 3 light sources). The signal obtained during the calibration mode is called I0 . The gain of the recorder can be increased to a desired level, for example by a factor of 2, 5 or 10, in order to obtain the desired level of sensitivity. The measured signal is multiplied by a factor (
参考图1D,时序器15实现对于黑电流/噪声的校正,该黑电流/噪声包括背景光、运算放大器的DC偏移、光电二极管的黑电流、关于个别的元件的输出信号的温度效应以及由于改变环境出现的变异。将结合电路40解释对于黑电流/噪声的校正。监视器10以由该时序器所同步的四个步骤执行时间的获取。在在第一步骤中,灯被关闭。检测器的输出直接送到积分器42,且一个积分电容44被充电到该黑电平电压。在第二个步骤中,把灯的之一接通。对应于被测光的强度的预放大器的输出被直接送到积分器42,以其电流极性相反于步骤1的一个充电电流对于电容44充电。这一过程是通过开关S1和S2的接通/关闭的适当的组合实现的。在这一步骤的结束,电容44的电压被充电到表示全部信号减去黑电平的噪声信号的一个值。在第三步骤中,开关S1和S2都被断开,以便将正的单元增益和负的单元增益的运算放大器(46和48)都断开。随后,经过开关S3将积分器42的输出移动到也起到一个低通滤波器作用的一个保持电路50。该输出是针对背景噪声而被校正的被测信号。在第四步骤中,开关S1、S2和S3被断开而开关S4被接通,以便经过一个47K的电阻对电容156放电。在此,积分器154的电路被复位成零并准备好在第一步被加到时序中的下一个灯。Referring to FIG. 1D , the
在另一个实施例中,在此被引作参考的RUNMAN系统(见1992年5月18日提交的国际专利申请WO92/20273)可被用来检测迁移经该生物系统的光信号。在这一实施例中,RUNMAN系统是按照上述的方式构型,并被修改用于单一的波长的测量(例如850nm)。In another embodiment, the RUNMAN system incorporated herein by reference (see International Patent Application WO 92/20273, filed May 18, 1992) can be used to detect optical signals that migrate through the biological system. In this example, the RUNMAN system was configured as described above and modified for measurements at a single wavelength (eg, 850 nm).
如图2-2B所示,被测的结果作为光源的间隔(ρ1、ρ2和ρ3)的函数的光密度(OD)而制图。OD被定义成
对于每一个测量周期(T0,T1)的三个数据点的最佳的直线或计算机配合(例如通过减小最小均方差)给出了在每一种溶质的浓度(通常是1毫克分子)的OD中斜率,而且该直线对于原点的拓展给出了截距。在某些情况中,计算两点间的斜率(例如当着使用两个光源时,或者当着对应于最大的光源-检测器间距的数据点呈现严重的非线性时)。The best straight line or computer fit (e.g. by reducing the minimum mean square error) of the three data points for each measurement period (T0 , T1 ) gives the concentration at each solute (usually 1 mM ), and the extension of the line about the origin gives the intercept. In some cases, the slope between two points is calculated (eg when two sources are used, or when the data point corresponding to the largest source-detector spacing exhibits severe nonlinearity).
以溶质和散射体的浓度作出斜率和截距的变异的相似曲线,从该曲线计算出最终的测量,称之为每百分之一脂类乳剂的即每一度C的每一毫克分子的OD(象在下详述的那样)。这将给出采用在本研究中的敏感性参数。理论A similar plot of the variation in slope and intercept is plotted against the concentration of solute and scatterer, from which the final measurement is calculated, called the OD per millimolole per percent of lipid emulsion per degree C (as detailed below). This will give the sensitivity parameters employed in this study. theory
根据扩散的理论,发射经过半无限散射介质,例如生物组织,的连续光的强度取决于该生物组织的吸收和散射特性(μa、μs′)。相距光源有距离P的被测的信号I(ρ)可以由下式给出
通过以μa(cal)和μs′(cal)的已知值作为校正的标本,根据下式将一个未知的取样与之比较:
其中μa(cal)和μs′(cal)是校正的取样的吸收系数和减低的散射系数,而μa和μs′是所要监视的取样的吸收系数和降低的散射系数。通过测量OD和光源-检测器的间距的比值,而获得斜率(m)和截距(b)。利用测量的斜率和截距求解等式(7),获得μa和μs′:
等式(6)示出了OD和光源_检测器间距(ρ)之间的线性关系。该等式的斜率和截距是通过测量OD和ρ的比值而研究的。Equation (6) shows a linear relationship between OD and source-detector spacing (ρ). The slope and intercept of this equation were studied by measuring the ratio of OD and p.
图3示出了OD和光源-检测器的间距的比值的计算结果,它是被测取样的吸收性的改变的函数。在此使用的校正取样具有的μa(cal)和μs′(cal)值分别是0.1cm-1和10cm-1在图中由标准的水平行表示。Figure 3 shows the calculated results of the ratio of OD and source-detector spacing as a function of the change in absorbance of the measured sample. Calibration samples used here have values of μa (cal) and μs ′ (cal) of 0.1 cm−1 and 10 cm−1 respectively, represented in the figure by the standard horizontal rows.
对于相同的校准,取决于被测取样的散射特性的斜率和截距的曲线在图3A中示出。高于μs′=10cm-1,斜率和截距是有相同的敏感性,而低于μs′=10cm-1,截距则更为敏感。在图3A中示出,如果是μs(sample)<μs′(cal),该斜率和截距是负值,而如果μs(sample)>μa(cal),该斜率和截距是正值。因此,通过确定OD与光源-检测器的间距的比值,就能够定性吸收和散射特性,或者确定一种未知的取样相对于校准取样的改变,即与频域或时域相对照确定相对的μa和μs′。For the same calibration, the slope and intercept curves depending on the scattering properties of the samples under test are shown in Figure 3A. Above μs ′ = 10 cm-1 , the slope and intercept are equally sensitive, and below μs ′ = 10 cm-1 , the intercept is more sensitive. As shown in Fig. 3A, if μs (sample) < μ s' (cal), the slope and intercept are negative, and if μs (sample) > μa (cal), the slope and intercept are Positive value. Thus, by determining the ratio of the OD to the source-detector spacing, it is possible to characterize the absorption and scattering properties, or to determine the change of an unknown sample relative to the calibration sample, i.e. the relative μa and μs '.
参考图4,在一个生物系统,例如一个病人,中的一种或多种溶质的浓度可以通过下面的过程进行监视。针对一个病人,获得对应于固有的吸收系数和减低的散射系数的校准值μa(cal)和μs′(cal)(步骤60)。这些校准值可以使用公知的光学技术(例如TRS或PMS)获得,并且对于指定的病人只需要确定一次。由于皮肤的色素、不同的皮肤层的厚度的变化等原因,这些校准值随着病人而异。在被认为是基准条件(例如当病人的生理系统工作正常)的一些条件下,测量所谓病人的初始强度I0。(步骤62)。这一初始的强度被用作基准强度,用于决定确定的光电密度(OD;等式1)。通过利用上述的系统用至少两个不同的光源-检测器的间距(ρ)来测量被测的强度,从而监视病人体内的一种或多种溶质的浓度(步骤64)。该强度(I)可以被用于确定以至少两个(OD,ρ)的数据点的最佳的线性配合。从测量的(OD,ρ)的数据点拓展斜率(m)和截距(b)(步骤66)。将拓展的斜率(m)和截距(b)值与预定的校准值对照比较(例如象下面将要描述的那样)以便获得溶质浓度的测量(步骤68)。Referring to FIG. 4, the concentration of one or more solutes in a biological system, such as a patient, can be monitored by the following procedure. For a patient, calibration values μa (cal) and μs '(cal) corresponding to the intrinsic absorption coefficient and reduced scattering coefficient are obtained (step 60). These calibration values can be obtained using known optical techniques (eg TRS or PMS) and need only be determined once for a given patient. These calibration values vary from patient to patient due to variations in skin pigmentation, thickness of different skin layers, and the like. Under some conditions which are considered baseline conditions (for example when the patient's physiological system is functioning normally), the so-called initial intensityI0 of the patient is measured. (step 62). This initial intensity was used as the reference intensity for determining the determined optical density (OD; Equation 1). The concentration of one or more solutes in the patient is monitored by measuring the measured intensity with at least two different light source-detector spacings (p) using the system described above (step 64). The intensity (I) can be used to determine the best linear fit with at least two (OD, p) data points. The slope (m) and intercept (b) are expanded from the measured (OD, p) data points (step 66). The extended slope (m) and intercept (b) values are compared against predetermined calibration values (eg, as described below) to obtain a measure of solute concentration (step 68).
这一监视过程最好是用硬件实现(例如用ASIC)或作为一个软件程序在一个计算机或其它的处理器上运行。校准标度This monitoring process is preferably implemented in hardware (for example with an ASIC) or as a software program running on a computer or other processor. calibration scale
把使用上述的技术所监视的斜率和截距数据相关,以便获得一个或多个溶质浓度的一个校准标度可以通过从一个模拟的生理环境或实际的生物组织的测量而得出。Correlating the slope and intercept data monitored using the techniques described above to obtain a calibration scale for one or more solute concentrations can be derived from measurements in a simulated physiological environment or actual biological tissue.
根据最近由Graff等人所作的研究(见R.Graff等人在1992年10月31日出版的″应用光学″第1370-1376页),Mie的理论可以通过下式很好地近似,以便降低散射截面积,δs′,
在高倍的散射介质中,被降低的散射系数μs′是通过μs′=λδs′与δs′相关的,其中的λ是每一个单位体积中的散射离子的总数(见1978年A.Ishimaru的文章:″在随机介质中的光的传播和散射″)。数值密度λ可以由φ/νpar给出,其中的φ是相对于整个体积的粒子的体积系数,而νpar是一个单一散射的粒子的体积(见1994年B.Bwauvoit等人在生物物理学第67卷的2501-2510页上的文章)可以表示成
传送理论的扩散近似已经被广泛地用作描述光在一个给定的几何状[18](见1991由E。M。Sevick等人″在生物化学年鉴″第195卷330-351页)和[19](见由S.R.Arridge等人在1992年在″物理医学生物学″第37卷1531-1560页)的高度散射介质中的传播的理论基础。时域扩散公式的结论使得能够计算在光通过<L>=c<t>而被检测之前就计算出平均光的路径长度<L>,其中的c是光在该散射介质中以平均时间穿行的速度。在一个半无限介质反射几何结构中,<t>可由下式给出
根据实物和生物组织的类型,归咎于暴露在非均匀介质中而出现的细胞的体积的改变将遵从一定的规则。比如说,如果把肝脏细胞突然地暴露于低渗性的介质,则它们将会初始地膨胀,但是在几分钟之内就几乎重新回复到原有的体积。这种现象被称之为″规则的细胞体积的减小″,并且是由K+和Cl活动的外溢所引起。另一方面,如果该细胞被突然暴露于过度低渗性的介质,则它们将会初始地收缩,但是在几分钟之内就几乎重新回复到原有的体积。这种现象被称之为″规则的细胞体积的增加″,并且受到Na+和Cl活动的内灌所引起。但是,不论是增加还是降低,都将会完全回复到原有的体积。而且肝脏的细胞会稍有停留在膨胀和收缩的状态。此外,以细胞的等级(离子特征)和以分子等级(负责离子的流入和流出的载体)的这种细胞体积的调节机制是随着生物组织的类型的改变而异的。(见1991年Haussinger等人在″生物化学和生物物理″第1071卷的331-350页)。Depending on the object and type of biological tissue, changes in the volume of cells due to exposure to a heterogeneous medium will follow certain rules. For example, if liver cells are suddenly exposed to a hypotonic medium, they will initially swell but regain almost their original volume within minutes. This phenomenon has been termed "regular cell volume reduction" and is caused by the spillover of K+ and Cl activity. On the other hand, if the cells are suddenly exposed to an excessively hypotonic medium, they will initially shrink but regain almost their original volume within a few minutes. This phenomenon is called "regular cell volume increase" and is caused by infusion of Na+ and Cl activity. However, whether it is increased or decreased, it will completely return to its original volume. And the cells of the liver will stay in a state of expansion and contraction for a while. Furthermore, the regulation mechanism of this cell volume at the cellular level (ionic characteristics) and at the molecular level (carriers responsible for the influx and efflux of ions) varies with the type of biological tissue. (See Haussinger et al., Biochemistry and Biophysics, Vol. 1071, pp. 331-350, 1991).
在肝脏中,当着由于将碳水化合物添加到细胞外的介质中时而使得肝细胞受到高渗性的压力,根据碳水化合物的性质,将会使得出现不再从其收缩状态恢复或者只是部分地恢复。流入吸收性引入的收缩将不表现出任何规则体积的增加(见Bakker-Grunwald在1983年″生物化学和生物物理″的第731卷的239-242页的文章)。相对应,收缩的随后是初始体积的局部的恢复。这些过程已经用肝细胞的不同的渗透性作了解释,在研究中使用了三种非电解质。较高的是对于糖的细胞的渗透性,较快的是在两个对称物之间的重量克分子渗透压的均衡,而且较快的是从收缩状态的恢复。(见P.Haddad等人在1989年的生理学周刊的256期的G563-G569和G.Alpini等人在1986年的生理学周刊的251期的C872-882的文章)。实例1In the liver, when hepatocytes are subjected to hyperosmotic stress due to the addition of carbohydrates to the extracellular medium, depending on the nature of the carbohydrates, there will be no recovery from its contracted state or only partial recovery . Shrinkage introduced by inflow absorbency will not exhibit any regular increase in volume (see Bakker-Grunwald, "Biochemistry and Biophysics", Vol. 731, pp. 239-242, 1983). Correspondingly, contraction is followed by a partial restoration of the original volume. These processes have been explained by the different permeability of hepatocytes, and three non-electrolytes were used in the study. Higher is the permeability of the cell to sugars, faster is the equilibration of osmolality between the two symmetries, and faster is the recovery from the contracted state. (See articles G563-G569 of P. Haddad et al., No. 256, Physiology Weekly, 1989 and C872-882, No. 251, No. 251, Physiology Weekly, 1986, of G. Alpini et al.). Example 1
一个设计的组成在图5和5A中示出,其中将生物组织表示成为填充有1升的散射体(流入脂类乳剂)的一个直径是10cm的圆桶70。斜率和截距的计算是在25℃时每1%的散射体、每毫克分子(mM)的溶质、每cm的输入/输出的条件下进行的。The composition of one design is shown in Figures 5 and 5A, where the biological tissue is represented as a 10
为了模拟对于人体的乳房、脑或其它的部位的溶质的检测,采用的是直径是10cm和高度是10cm的一个桶状的容器,其上加有光的检测器。容器中加有其中掺入适量的浓度的散射体,例如占体积的0.1-2%的脂类乳剂的蒸溜水。填充有不包括溶质的散射体的容器可以被用作为针对μa和μs′的校准的标准。然后在将固体的或液体的溶质加入,而增加其浓度,通过迅速地搅动搅棒而达到适当的溶解和混合。散射体的稀释是通过测定法测量的,因此,起因于溶质和散射体的浓度之间的吸收性的改变的关系。In order to simulate the detection of solutes in the breast, brain or other parts of the human body, a barrel-shaped container with a diameter of 10 cm and a height of 10 cm is used, and a light detector is added on it. The container is filled with distilled water in which the scatterer is mixed in an appropriate concentration, for example 0.1-2% by volume of the lipid emulsion. Containers filled with scatterers that do not include solutes can be used as standards for calibration of μa and μs ′. The solid or liquid solute is then added to increase its concentration by rapidly agitating the paddle to achieve proper dissolution and mixing. Dilution of scatterers is measured by assay and thus results from a changing relationship of absorbance between solute and scatterer concentrations.
图7示出了一个典型的实验的结果,是以1%的脂类乳剂作为散射体,将10、50、100等克数的葡萄糖溶质加入到1升的1%的脂类乳剂中。OD的减小是作为ρ的函数,从20mM递增葡萄糖,斜率和截距都受到影响。与在此示出的千分之120的OD的标度相比,起因于仪器的噪声的误差大概是1×10⁻⁵OD。在此情况中,根据公式6和7,得到OD和的近似的线性的关系。Figure 7 shows the results of a typical experiment, using 1% lipid emulsion as a scatterer, adding 10, 50, 100 grams of glucose solute into 1 liter of 1% lipid emulsion. The decrease in OD as a function of p from 20 mM increasing glucose, both slope and intercept were affected. Compared to the OD scale of 120 thousandths shown here, the error due to instrument noise is approximately 1×10⁻⁵ OD. In this case, according to
溶质浓度斜率和截距(从图7中重新绘制)之间的关系在图7A中给出,并且该值在表1中给出;斜率和截距的值示出是每一个mM的葡萄糖的1.5×10⁻⁴OD和对于斜率的输入/输出的1cm的间距的0.9×10-4OD。The relationship between the solute concentration slope and intercept (redrawn from Figure 7) is given in Figure 7A, and the values are given in Table 1; the values for the slope and intercept are shown for each mM of glucose. 1.5×10⁻⁴ OD and 0.9×10⁻⁴ OD for a pitch of 1 cm in/out for the slope.
这些获得的斜率和间距的值被单独地使用或结合地使用,以便提供一个校准的标度,对照着这一标度,对于随后的测量作比较,以便获得溶质浓度的测量。These obtained slope and spacing values are used alone or in combination to provide a calibrated scale against which subsequent measurements are compared to obtain solute concentration measurements.
如图7和图7A所示,斜率的值是负值,并且对应于1%的脂类乳剂给出-1.65±0.037(图6)。单位是10-4OD/1mM葡萄糖/1cm的间距。斜率的误差是0.037,因此根据这些数据,以1cm的间距1mM的葡萄糖确定的信号-误差的比率是近似于50,并且在ρ=7cm出对应于小值。注意到,公式6和7的适当的系数包括浓度的方根。As shown in Figure 7 and Figure 7A, the value of the slope is negative and gives -1.65 ± 0.037 corresponding to 1% lipid emulsion (Figure 6). Units are 10−4 OD/1 mM glucose/1 cm spacing. The error in the slope is 0.037, so from these data the signal-to-error ratio determined for 1 mM glucose at 1 cm intervals is approximately 50 and corresponds to small values at p = 7 cm. Note that the appropriate coefficients for
但是敏感性随着散射体的浓度改变,因此将实验从0.1%-1.5%的脂类乳剂反复地进行,减低到1%的散射体的浓度的一个新的敏感性常数在图6中得出(表I)是1.56×10⁻⁴OD/1mM葡萄糖/1cm间距/1%脂类乳剂。从20到100mM葡萄糖都遵从公式6和公式7的方根的关系。截距的值遵从一个对数的关系,具有的值是90×10-4OD/1cm/1mM葡萄糖。随着增加脂类乳剂,截距的值增加为1.4+0.3×10-4OD/cm/每百分之一的脂类乳剂1mM葡萄糖。But the sensitivity changes with the concentration of scatterers, so a new sensitivity constant is obtained in Fig. 6 by iteratively running the experiment from 0.1%-1.5% lipid emulsion down to 1% scatterer concentration (Table I) is 1.56 x 10⁻⁴ OD/1 mM glucose/1 cm spacing/1% lipid emulsion. From 20 to 100 mM glucose, the relationship of the square root of
为了监视温度的变化,容器包括有冷却到20℃的溶质(例如葡萄糖)和散射体(例如脂类乳剂),并通过电子加热板(在快速搅拌的基础上)缓慢地提升到35℃,并记录光的效应。散射体由一个磁棒搅动,由加入器/凝热器调节温度,以便实现使用的在20至30℃之间的温度。系统的温度是由水银温度计测量的。实例2To monitor temperature changes, a vessel containing solutes (e.g. glucose) and scatterers (e.g. lipid emulsions) cooled to 20°C was slowly raised to 35°C by means of an electronic hot plate (on a rapid stirring basis), and Record light effects. The scatterer was agitated by a bar magnet and the temperature was regulated by an adder/condenser in order to achieve the temperatures used between 20 and 30°C. The temperature of the system was measured by a mercury thermometer. Example 2
使用的是雄性的重量是250-300g的SD血统的老鼠。在通过在腹膜内注射戊巴比妥(50mg/kg)对老鼠麻醉之后,取出肝脏用包含2mM葡萄糖的Krebs-Ringer缓冲剂浸泡。该缓冲剂是用95%的氧气和和5%的二氧化碳的混合气体所氧化的。肝脏放置在一个光源阵列之上,并与一个检测器相距1-3.3cm。在肝脏的灌注变得稳定之后(20-30分钟),该灌注液就变成了包括葡萄糖或甘露醇的不同浓度的其它成分。同时还测量反应过程的氧气的浓度。Rats of SD lineage with a male weight of 250-300 g were used. After the mice were anesthetized by intraperitoneal injection of pentobarbital (50 mg/kg), the liver was removed and soaked in Krebs-Ringer buffer containing 2 mM glucose. The buffer is oxidized with a mixture of 95% oxygen and 5% carbon dioxide. The liver is placed on top of an array of light sources and 1-3.3 cm away from a detector. After the perfusion of the liver became stable (20-30 minutes), the perfusate was changed to various concentrations of other components including glucose or mannitol. At the same time, the concentration of oxygen in the reaction process is also measured.
为了保证肝脏本身的光的性质的改变不引起光的失真,有必要采取防范措施。因此,浸泡过程在先而控制过程在后。老鼠的肝脏叶放置在光源和检测器的阵列上,与图1-1D所示相似,但是具有间距1、2和3cm(也可以是1.2、1.5和2.2cm)以便兼顾肝脏的高的吸收性和较小的尺寸。而且,该肝脏叶的厚度是2cm,而生物组织的边界条件不同于图5和5A的标本。从甘露醇的可以忽略的代谢反应的角度来看,选择该甘露醇作为适当的溶质进行与葡萄糖的对照。In order to ensure that the change of the light properties of the liver itself does not cause light distortion, it is necessary to take preventive measures. Therefore, the soaking process comes first and the control process follows. The liver lobe of the mouse is placed on an array of light sources and detectors similar to that shown in Figure 1-1D, but with spacing of 1, 2, and 3 cm (1.2, 1.5, and 2.2 cm are also possible) to allow for the high absorbency of the liver and smaller sizes. Also, the thickness of the liver lobe is 2 cm, and the boundary conditions of the biological tissue are different from the specimens of Figs. 5 and 5A. From the viewpoint of negligible metabolic reaction of mannitol, this mannitol was selected as an appropriate solute for comparison with glucose.
具有60mM的甘露醇灌注的典型的轨迹在图8中示出。初始阶段的吸收性的增加是归咎于该甘露醇进入到产生渗透梯度的肝脏的正弦波,在开始的5分钟内,渗透的梯度作均衡。随后,吸收性的改变被认为是由于甘露醇与肝细胞的均衡。为了保证不在肝脏中出现残留效应,没有溶质的灌注被使用;在没有添加甘露醇之处的肝脏被充满拟晶体。在这种情况中,吸收性的下降的出现是由于甘露醇从生物组织的外溢造成的。相对于两个控制等级,在早期阶段和晚期阶段测量甘露醇的效应。A typical trajectory with 60 mM mannitol perfusion is shown in FIG. 8 . The increase in absorbency in the initial phase is due to the sine wave of the mannitol entering the liver creating an osmotic gradient that equalizes during the first 5 minutes. Subsequently, changes in absorbency were thought to be due to the equilibration of mannitol with hepatocytes. In order to ensure no residual effects in the liver, no solute perfusion was used; the liver was filled with crystalloids where no mannitol was added. In this case, the decrease in absorbability occurs due to extravasation of mannitol from biological tissues. The effect of mannitol was measured in the early and late phases relative to two control levels.
如图8所示,给出了OD与ρ之比的曲线。存在有比脂类乳剂和酵母细胞标本更多的″杂质″,这可能是由于外溢和灌注的压力的结果。首先,早和晚阶段的符号是相似的。早期阶段的斜率对应于+18×10-4OD/1mM的甘露醇/输入-输出的1cm的间距。晚期阶段的斜率对应于+1.7×10-4OD/1mM的甘露醇/cm。实例3As shown in Figure 8, a plot of the ratio of OD to p is given. There was more "impurity" than the lipid emulsion and yeast cell specimens, probably as a result of the pressure of spillage and perfusion. First, the symbols for early and late stages are similar. The slope at the early stage corresponds to +18 x 10-4 OD/1 mM mannitol/1 cm spacing of input-output. The slope of the late stage corresponds to +1.7 x 10⁻⁴ OD/1 mM mannitol/cm. Example 3
在悬浮物或老鼠的肝脏中由于溶质的引入所引起的吸收系数、散射系数和光的路径长度中的改变被利用时域、频域和连续波的方法示出。这三种方法分别用于测量高度散射介质的光学特性平均路径长的改变时的过渡响应和对于光的性质和散射改变的快速响应。所使用的光的波长范围是从780到850nm 。Changes in absorption coefficient, scattering coefficient and path length of light due to solute introduction in suspension or mouse liver were shown using time domain, frequency domain and continuous wave methods. These three methods are used to measure the transient response to changes in the average path length of the optical properties of highly scattering media and the rapid response to changes in light properties and scattering, respectively. The wavelength range of the light used is from 780 to 850nm.
在脂类或细胞悬浮测量中,一个桶状的容器(17cm直径,10cm高度)填充有蒸馏水和不同的散射介质的浓度。浓度是20%的脂类乳剂(包括卡比费太卡,克莱顿,ND)被稀释到0.5-2.5%((vol/vol)。在细胞悬浮的情况中,占在pH值是7的20mM磷酸盐脂中的酵母重量的1.4%或2.8%的粘合剂被加到脂类溶液。在测量中,通过使用溶质,例如葡萄糖和甘露醇,的50mM的滴定改变其光学性质。接到象上述NIR检测系统的光源和检测器放置在悬浮表面之上或容器的侧面3cm的距离。In lipid or cell suspension measurements, a barrel-shaped container (17 cm diameter, 10 cm height) is filled with distilled water and different concentrations of scattering media. A 20% lipid emulsion (including Carbyfetaca, Clayton, ND) was diluted to 0.5-2.5% ((vol/vol). In the case of cell suspension, accounted for at
雄性的SD种类的老鼠(300-500g)被禁食24小时以便规范肝脏的生理条件。在以体重的50mg/kg的腹膜内注射戊巴比妥麻醉之后,取出该老鼠的肝脏并用克雷布斯-瑞尔缓冲剂(2mM葡萄糖,由95%的氧和5%的二氧化碳的混合气体所氧化)所灌注,直到灌注到达均匀的程度为止(20-30分钟)。这种灌注是在缓冲剂和包括不同的碳水化合物的浓度的缓冲剂溶液中切换。连接到该肝脏的主叶的光源和检测器之间的距离是1.5cm 。Male SD species mice (300-500 g) were fasted for 24 hours in order to normalize the physiological conditions of the liver. After anesthesia with 50 mg/kg of body weight intraperitoneal injection of pentobarbital, the liver of the mouse was removed and treated with Krebs-Rail buffer (2 mM glucose, a mixture of 95% oxygen and 5% carbon dioxide) Oxygenated) perfused until the perfusion reaches a uniform level (20-30 minutes). The perfusion was switched between buffer and buffer solutions including different carbohydrate concentrations. The distance between the light source and the detector connected to the main lobe of the liver was 1.5 cm.
在一个模拟实验中,公式(12)和(13)是分别地用于悬浮物和生物组织的情况,以便计算在各种条件下的在减低的散射系数中的改变。实例4In a simulation experiment, equations (12) and (13) were used for the case of suspended matter and biological tissue, respectively, in order to calculate the change in the reduced scattering coefficient under various conditions. Example 4
本实例示出了在一个活体动物标本中的脑中的钾的流失的无创伤的确定。从低含氧的老鼠的脑的钾的流失被以816nm的波长的散射测量,该波长对于血红蛋白的氧化性和脱氧性的差异相当小。图9中的示意图示出了采用装入到脑中的光源进行校准的实例,其中增加了在间隙即分子外空间的钾离子的浓度(因此增加了光的散射性。麻醉性的酮亚胺的注入引起轻微的散射的改变。当老鼠被暴露在氮气中时(呼吸),初始的散射改变是与光源的浸入的方向相同,但是这是由于来自神经元的钾离子的缺乏所致。在代谢的活动恢复之后,出现大的突增,在几分钟之后下降到基线的水平。所示出的光的散射用于表示动物的大脑的功能状态。因为光子在人的脑中的迁移已经被证实是非常易于观察,所以,这里公开的技术可以被用于具有象中风、麻木、头部的外伤、昏迷以及其它的一些在本专业中为了探明受伤的通常位置(例如中风)和其中因为氧气缺乏而引起能量缺乏的生物组织的病人。生物组织的光学特性和生物组织的折射系数之间的关系如下。a)模拟实验的结果:This example demonstrates the non-invasive determination of potassium loss in the brain in a live animal specimen. Potassium loss from the brain of hypoxic mice was measured by scattering at a wavelength of 816 nm, which differs considerably for the oxidative and deoxygenative properties of hemoglobin. The schematic diagram in Figure 9 shows an example of calibration with a light source built into the brain, which increases the concentration of potassium ions in the interstitial, i.e., extramolecular space (thus increasing light scattering. Anesthetic ketimine The injection caused a slight change in scattering. When the mouse was exposed to nitrogen (breathing), the initial change in scattering was in the same direction as the immersion of the light source, but this was due to the lack of potassium ions from the neurons. In After restoration of metabolic activity, there was a large spike that dropped to baseline levels after a few minutes. The scatter of light shown is used to represent the functional state of the animal's brain. Since the migration of photons in the human brain has been Confirmation is very easy to observe, so, the technique disclosed here can be used to have as stroke, numbness, head trauma, coma and others in order to ascertain the usual location of injury (such as stroke) in this profession and wherein because Oxygen deficiency causes the patient of the biological tissue of energy deficiency. The relation between the optical property of biological tissue and the refractive index of biological tissue is as follows. a) The result of simulation experiment:
根据公式(11),悬浮标本的减低的散射系数μs′对于散射粒子(nin)的折射系数和悬浮流体(nex)的依赖的程度可以假设散射粒子的大小和体积量都不改变的条件下来计算。According to formula (11), the dependence of the reduced scattering coefficient μs ′ of the suspended specimen on the refractive index of the scattering particles (nin ) and the suspending fluid (nex ) can be assumed that the size and volume of the scattering particles do not change Conditions are calculated.
图13(a)中示出了作添加的葡萄糖浓度的函数的0.5%的脂类乳剂-葡萄糖悬浮体的μs′和该液体悬浮物的对应的折射系数nex。该情况中使用的参数的情况是,a=0.25μm,φ=0.005,λ=800nm,nin=1.465和nex=1.325+2.37×10⁻⁵X[C];其中的[C]是在MM中的葡萄糖的浓度。(见1994年Maier等人在″光学杂志″19(24)期的2062-2064页上的文章)。另一方面,使用公式(12)模拟浸泡的老鼠的肝脏的μs′的改变作为相加的葡萄糖的浓度的一个函数;该结果示于图13(b)。计算值只是将分子外的流体的折射系数改变成nex=1.33+2.37×10⁻⁵X[C];而保持其它的参数不变(a=10.68μm,φ=0.8,λ=800nm,nin=1.465)。(见1994年Beauvoit等人在″生物物理学期刊″第67卷2501-2510页)。在0mM的葡萄糖浓度的条件下的μs′的初始值15.9cm-1是根据在1994年出版的实验数据测量得到的。老鼠的肝脏的μs′对于葡萄糖的浓度的依赖,假设该肝脏的细胞是稳定的。公式13(a)和公式13(b)都表明,如果葡萄糖/碳水化合物在悬浮标本或在生物组织中的添加,象在一个灌注的老鼠的肝脏中的添加,并不改变散射体和或生物组织的体积,对应系统的减低的散射系数μs′随着所添加的葡萄糖的浓度而降低。b)在脂类和细胞悬浮标本中的实验的结果:The μs ' of a 0.5% lipid emulsion-glucose suspension and the corresponding refractive index nex of the liquid suspension are shown in Figure 13(a) as a function of the added glucose concentration. In the case of the parameters used in this case, a=0.25 μm, φ=0.005, λ=800 nm, nin =1.465 and nex =1.325+2.37×10⁻⁵ X[C]; where [C] is Concentration of glucose in MM. (See Maier et al., Journal of Optics, 19(24), pp. 2062-2064, 1994). On the other hand, equation (12) was used to simulate the change in μs ' of the liver of soaked mice as a function of the concentration of added glucose; the results are shown in Fig. 13(b). The calculated value only changes the refractive index of the extramolecular fluid to nex =1.33+2.37×10⁻⁵ X[C]; while keeping other parameters unchanged (a=10.68μm, φ=0.8, λ=800nm, nin = 1.465). (See Beauvoit et al., Biophysical Journal, Vol. 67, pp. 2501-2510, 1994). The initial value 15.9 cm-1 of μs ' under the condition of a glucose concentration of 0 mM was measured based on experimental data published in 1994. Dependence of μs ' of the mouse liver on the concentration of glucose, assuming that the cells of the liver are stable. Both Equation 13(a) and Equation 13(b) show that if glucose/carbohydrate is added in suspension or in biological tissue, as in the liver of a perfused mouse, it does not change the scatterer and or biological The volume of the tissue, corresponding to the reduced scattering coefficient μs ' of the system, decreases with the concentration of added glucose. b) Results of experiments in lipid and cell suspension specimens:
图14给出了一套0.5%的脂类乳剂悬浮物的时域实验的结果,作为在830nm的条件下添加到悬浮物的甘露醇的函数。通过对于时间分解的分光光度计的数据的配合,能够得到平均光的路径长度,μa和μs′,如在图14(a)、14(b)和14(c)中分别所示。在图14(a)中的实线的数据部分是由将被测的反射性替代进入到公式(13)中所确定的,而空的园圈示出的虚线是由替换所调配的在公式(14)中的μa和μs′值而计算的。这两个路径长度之间的一致性证实了μa和μs′值的正确性。图14(a)和14(b)清除地示出了路径长度和减少的散射系数,μs′,都随着添加在悬浮物中的甘露醇的增加而减小。图14(b)示出了示出了与图13(a)的模拟实验的结果一个很好的一致性。图14(c)示出了在当甘露醇的浓度变得较大的同时μa中的一个小量的下降。从滴定的实验(没示出)中获得的结果是相似的。Figure 14 presents the results of a set of time domain experiments for a 0.5% lipid emulsion suspension as a function of mannitol added to the suspension at 830 nm. By fitting the data from the time-resolved spectrophotometer, the average light path lengths, μa and μs , can be obtained, as shown in Figures 14(a), 14(b) and 14(c), respectively. The data portion of the solid line in Figure 14(a) is determined by substituting the measured reflectivity into equation (13), while the dashed line shown by the empty circle is formulated by substituting (14) in the μa and μs 'value calculated. The agreement between these two path lengths confirms the correctness of the values ofμa andμs ′. Figures 14(a) and 14(b) clearly show that both the path length and the reduced scattering coefficient, μs' , decrease with increasing mannitol added to the suspension. Figure 14(b) shows a good agreement with the simulated experimental results shown in Figure 13(a). Figure 14(c) shows a small drop inμa at the same time as the concentration of mannitol becomes larger. Results obtained from titration experiments (not shown) were similar.
我们已经用连续波的方法来测量在脂类/细胞悬浮物中的光学特性的归咎于引入的溶质的改变。已经研究了多种溶质(电解质,非电解质,糖和酒精),并对于某些结果作了报告(Chance等人在1995年的″分析生物化学″的227卷的351-362页)。针对于悬浮标本使用连续波方法所获得的结果非常相似于时域的方法的结果,而且近似于理论上的计算。在图15中示出了实例,表示采用滴定的方法针对一个脂类乳剂-酵母剂所获得的一个μsμa和甘露醇浓度之比。We have used a continuous wave method to measure changes in the optical properties of lipid/cell suspensions due to the introduction of solutes. A variety of solutes (electrolytes, non-electrolytes, sugars and alcohols) have been studied and some results reported (Chance et al. 1995, Vol. 227, pp. 351-362). The results obtained using the CW method for suspended specimens are very similar to those of the time-domain method and are close to theoretical calculations. An example is shown in Figure 15, representing a ratio of μs μa and mannitol concentration obtained for a lipid emulsion-yeast using the titration method.
生物组织的光学特性和生物组织的细胞体积的相关性在下面给出。a)模拟实验的结果:The correlation of the optical properties of the biological tissue and the cell volume of the biological tissue is given below. a) The results of the simulation experiment:
由于细胞的体积系数φ对于生物组织来说通常是大于0.5的,因此,公式(12)被用于本部分。考虑模拟实验的三种情况:1)只是改变细胞的尺寸;2)改变细胞的尺寸和分子外流体的折射系数;和3)改变细胞的尺寸,细胞的体积系数和分子外流体的折射系数。把将碳水化合物灌注到老鼠的肝脏而引起细胞的收缩被认为是这样一种模拟实验。Since the volume coefficient φ of cells is usually greater than 0.5 for biological tissues, formula (12) is used in this section. Three cases of simulated experiments are considered: 1) changing only the size of the cell; 2) changing the size of the cell and the refractive index of the extramolecular fluid; and 3) changing the size of the cell, the volume coefficient of the cell, and the refractive index of the extramolecular fluid. Infusing carbohydrates into the livers of mice and causing the cells to shrink is considered one such simulation.
图16(a)中示出了被灌注的老鼠的肝脏的μs′对于细胞半径(顶部的标度)的依赖性,所具有的固定的参数是细胞体积参数(φ=0.8),分子内的折射系数(nin=1.465),和分子外的折射系数(nexo=1.33)。nin的选择值是根据基准5和基准26,而nexo的选择值是从基准14拓展而得的。计算表明,只出现在生物组织细胞尺寸中的减小导致了减小的散射系数μs′的增加,并使得路径长度增加,反之亦然。在细胞尺寸中的减小可以是由生物组织的温度的增加所引起,或者是由在生物组织中添加碳水化合物所引起。图16(a)还示出μs′对于引入到肝脏的葡萄糖浓度(底部标度)的依赖性。具有的关系是:a=a0-K[C],其中的a是细胞的半径,a0=10.678μm是在没有添加然后葡萄糖时的初始的细胞半径,K=0.002是一个常数,而[C]是葡萄糖的浓度。K值对应于将每100mM的葡萄糖添加到肝脏时能够给出5%的细胞的体积的增加的一个系数。Figure 16(a) shows the dependence of μs ' on the cell radius (top scale) of the perfused mouse liver with the fixed parameters being the cell volume parameter (φ=0.8), intramolecular The refractive index of (nin =1.465), and the refractive index of the molecule (nexo =1.33). The selected value of nin is based on
在细胞尺寸中的一个减小将能够导致在细胞体积中的减小,并因此使得细胞体积的系数φ的减小,因为:φ=V细胞/V总所以,将碳水化合物添加到生物组织将会导致φ的增加。当生物组织的细胞收缩但是整个生物组织的体积并不显著地改变时出现这种情况。但是,当着碳水化合物添加到生物组织中而导致在生物组织中的水分的丢失的时候,φ值也能够保持恒定,结果是使得生物组织的总的体积V总的减小,为了更多地模拟当着暴露于一个碳水化合物时的μs′真实的改变,将考虑在所有的下列情况中的改变:1)细胞的尺寸。2)分子外的折射系数,和3)细胞的体积系数。在图16(b)中的实线圈是利用可变的细胞半径a和可变的分子外折射系数nex和一个固定的体积系数φ(=0.8)计算的在μs′和加入的葡萄糖的浓度之间的关系。另一方面,在图16(b)中的打开的园圈对应于用于可变的a、nex和φ的μs′,所具有的关系是:
其中的V总保持不变。除去φ之外,用于这两个轨迹的参数是相同的,λ=800nm,nin=1.465,nex=1.33+2.73×10⁻⁵[C],和a=10.678-2×10⁻⁵[C]nm。这两个园圈的轨迹展示出当着碳水化合物的浓度增加时的μs′的矛盾的现象。在考虑到细胞的大小分子外的折射系数和细胞的体积系数的影响之后,从模拟实验的数据看到,在生物组织中的溶质/碳水化合物的添加中,生物组织的总体的散射系数可以根据φ的情况是否减小还是不变的情况分别地增加或减小。b)在浸泡的老鼠的肝脏中的实验的结果:where V always remains constant. Except for φ, the parameters for these two trajectories are the same, λ=800nm, nin =1.465, nex =1.33+2.73×10⁻⁵ [C], and a=10.678-2×10⁻⁵ [C] nm. The trajectories of these two circles show a paradoxical phenomenon of μs ' as the concentration of carbohydrate increases. After considering the influence of the refraction coefficient of the size of the cell and the volume coefficient of the cell, it can be seen from the data of the simulation experiment that in the addition of solute/carbohydrate in the biological tissue, the overall scattering coefficient of the biological tissue can be calculated according to Whether the case of φ decreases or the case of no change increases or decreases respectively. b) Results of experiments in soaked mouse livers:
为了区别由于碳水化合物的添加所引起的细胞尺寸和分子外的折射系数对于μs的影响,执行频域方法的(相位调制分光光度计)对于老鼠的灌注过的肝脏的温度相关的路径长度的测量。在原则上,如果生物组织的温度被减低,在生物组织的细胞内部的K+就会跑到该细胞的外面,并且分子外的水可以进入到细胞内,导致细胞的膨胀。还知道,温度对于散射性的流体的折射系数的影响是十分小的,所以,由温度所引起的在分子外的折射系数的改变可以被忽略。则总体上的μs′值或冷却的生物组织的膨胀的细胞的光学路径长度将是应该轨迹上述的图16(a)的给出的模拟实验而降低。另一方面,如果冷却的生物组织是被加热,则细胞将会收缩,且路径长度会相应地增加。在此实验中,肝脏的温度是通过改变包括在热控制的槽中灌注液的温度而进行调节的。图17(a)对应于一个肝脏从37℃开始的冷却过程,在冷却槽内测量的温度在10分钟内降到了25℃。在灌注液开始几分钟(-2.5)的冷却之后,肝脏开始对此响应,并且随着肝脏的温度的降低该路径长度保持下降,直到灌注液的温度稳定在设定的25℃的稳定为止。相反,图17(b)示出了当灌注的肝脏的灌注液从25℃加热到37℃时路径长度的增加的过程。对于冷却(图17(a))和加热(图17(b))的时间过程没有必要是相同的,即取决于冷却源(冰)和加热电源的使用。图17证实了模拟实验(图16(a))的结果,即生物组织的散射系数、并由此是对应的光的被测的路径长度将随着细胞的尺寸的减小/增加而增加/减小。In order to distinguish the influence of cell size and extramolecular refractive index onμs due to the addition of carbohydrates, a frequency-domain method (phase modulation spectrophotometer) was performed on the temperature-dependent path length of the perfused liver of the mouse Measurement. In principle, if the temperature of the biological tissue is lowered, the K+ inside the cell of the biological tissue will escape to the outside of the cell, and the extramolecular water can enter the cell, causing the cell to expand. It is also known that the effect of temperature on the refractive index of a scattering fluid is quite small, so that the temperature-induced change in the refractive index outside the molecule can be ignored. Then the overall value of μs ' or the optical path length of the expanded cells of the cooled biological tissue will be reduced by the trajectory given by the simulation given in Fig. 16(a) above. On the other hand, if the cooled biological tissue is heated, the cells will shrink and the path length will increase accordingly. In this experiment, the temperature of the liver was regulated by varying the temperature of the perfusate contained in a thermally controlled tank. Figure 17(a) corresponds to the cooling process of a liver starting from 37°C, and the temperature measured in the cooling tank dropped to 25°C within 10 minutes. After a few minutes (-2.5) of initial cooling of the perfusate, the liver begins to respond to this, and the path length keeps decreasing as the temperature of the liver decreases until the temperature of the perfusate stabilizes at the set plateau of 25°C. In contrast, Figure 17(b) shows the progression of path length increase as the perfusate of the perfused liver was heated from 25°C to 37°C. The time courses for cooling (Fig. 17(a)) and heating (Fig. 17(b)) are not necessarily the same, ie depending on the use of cooling source (ice) and heating power. Figure 17 confirms the results of the simulation experiment (Figure 16(a)) that the scattering coefficient of biological tissue, and thus the measured path length of the corresponding light, will increase/ decrease.
为了对起因于细胞的尺寸和分子外的流体的折射系数中的改变对于μs′的组合的影响,将若干的碳水化合物添加到灌注液中用于肝脏的浸泡实验。利用频域的方法在肝脏由三种碳水化合物进行浸泡期间对于路径长度的测量的一组时间决定的曲线在图18中示出。曲线(a)、(b)和(c)分别对应于包括200mM的葡萄糖200mM的甘露醇和200mM的蔗糖的灌注液。在曲线(b)中示出了对于两个单独的肝脏的两次测量,表明不同的肝脏在不同的生理条件下对于甘露醇所作的不同的响应。图18清楚地表示出,路径长度或散射性质在这三种情况中是不同的。在葡萄糖和甘露醇的浸泡之间的相似性在于,路径长度的增加是随着碳水化合物的浸泡开始的。但是在葡萄糖的浸泡中返回到其基线要比甘露醇的浸泡快得多。与这两种浸泡相对照,当蔗糖灌注到该肝脏中时,路径长度将会下降,并且直到蔗糖被缓冲剂冲洗掉之前不会返回到它的基线。为了定量μa和μs′的值,对于另一种蔗糖的浸泡采用了时域的方法,并将结果示于图19中。其中示出的μs′的值以及用100mM蔗糖浸泡的肝脏光的路径长度在其浸泡期间随着μa的小的变异而下降。这使得利用时域和频域的方法证实数据的正确性而得到的结果之间实现一致。In order to investigate the combined effect on μs' of changes in the refractive index resulting from the size of the cells and the extramolecular fluid, several carbohydrates were added to the perfusate for immersion experiments of the liver. A set of time-dependent curves for the measurement of the path length during the soaking of the liver with the three carbohydrates using the method in the frequency domain is shown in FIG. 18 . Curves (a), (b) and (c) correspond to a perfusate comprising 200 mM glucose, 200 mM mannitol and 200 mM sucrose, respectively. In curve (b) two measurements are shown for two separate livers, showing the different responses of different livers to mannitol under different physiological conditions. Figure 18 clearly shows that the path length or scattering properties are different in these three cases. The similarity between glucose and mannitol soaks is that the increase in path length begins with carbohydrate soaks. But it returned to its baseline much faster in the glucose soak than in the mannitol soak. In contrast to these two soaks, when sucrose is perfused into the liver, the path length will decrease and will not return to its baseline until the sucrose is flushed out by the buffer. To quantify the values ofμa andμs ', a time-domain approach was applied to another sucrose soak and the results are shown in Figure 19. The values of μs ′ shown therein and the path length of light in livers soaked with 100 mM sucrose decrease with small variations in μ a during its immersion. This enables consistency between the results obtained using time-domain and frequency-domain methods to verify the correctness of the data.
图13、15和19示出了可以忽略的μa的改变和由于在该悬浮物或生物组织中的一个碳水化合物的添加所引起的一个持续的在μs′和路径长度之间的增加/减小。这些结果与公式(15)有着很好的吻合。所以,可以得出这样的结论,即在生物组织中的起因于碳水化合物的添加的路径长度的被测值的增加/减小反映着总体上的散射特性的增加/减小。Figures 13, 15 and 19 show negligible changes inμa and a sustained increase betweenμs ' and path length due to the addition of a carbohydrate in the suspension or biological tissue/ decrease. These results are in good agreement with Equation (15). Therefore, it can be concluded that an increase/decrease in the measured value of the path length resulting from the addition of carbohydrates in biological tissue reflects an increase/decrease in the overall scattering properties.
模拟和实验的结果表明,生物组织降低的散射系数能够在很大的程度上受到归咎于碳水化合物对于生物组织的添加而出现的渗透张力所引起的在分子外流体和在细胞体积中的折射系数的改变的影响。但是,在脂类乳剂-酵母悬浮物的情况中(图15),似乎酵母细胞的作用并不十分明显,因为在这种情况中的结果十分类似于纯脂类的悬浮物的情况。这可以由下列的两个原因进行解释:1)细胞的体积系数相对于整个悬浮物的体积是非常小的;2)酵母的细胞具有聚糖核壁,它要比一般的生物组织的细胞膜坚硬的多。因此,酵母细胞的细胞尺寸和细胞的体积系数将不会由于碳水化合物添加到悬浮物所引起的渗透张力而明显地改变。Simulation and experimental results indicate that the reduced scattering coefficient of biological tissue can be largely attributed to the refraction coefficient in the extramolecular fluid and in the cell volume due to the osmotic tension arising from the addition of carbohydrates to the biological tissue impact of the change. However, in the case of lipid emulsion-yeast suspension (Fig. 15), it seems that the effect of yeast cells is not very pronounced, since the results in this case are quite similar to the case of pure lipid suspension. This can be explained by the following two reasons: 1) The volume coefficient of the cell is very small relative to the volume of the entire suspension; 2) Yeast cells have polysaccharide core walls, which are harder than the cell membranes of general biological tissues many. Therefore, the cell size and volume factor of the cells of the yeast cells will not change appreciably due to the osmotic tension caused by the addition of carbohydrates to the suspension.
把溶质或碳水化合物添加到生物组织能够引起细胞体积系数的下降和分子外流体的折射系数的增加。在生物组织总体的散射行为中,这两种改变是彼此矛盾的。如此的光的路径长度改变的测量能够显示出细胞的体积的改变和折射系数的改变的哪一个比另一个起到更重要的角色。在图18中的曲线(a)所表示的肝脏葡萄糖的灌注中,灌注后的肝脏的路径长度迅速地增加,并随后在2-3分钟之内返回到它的原始值。该路径长度的变异表明,在细胞尺寸和在细胞体积系数φ中的降低一定是出现在该灌注的开始,但是收缩的细胞将在一定的程度上重新回到其原有的体积。当冲洗缓冲剂被接通时,该路径长度开始减小,因为此时的细胞是在低渗压的条件下,因此它们开始膨胀。而且,当细胞恢复到它的初始的体积时,路径长度在3分钟之内返回到它的基线。在图18中的曲线(b)示出的是针对甘露醇的数据,除去对于该甘露醇的返回到基线的速率要低于葡萄糖的速率之外,其它的方面与在使用葡萄糖进行灌注的情况相似。对于这种差异的解释是,肝脏细胞对于甘露醇的渗透性要比葡萄糖小,所以甘露醇的回升的速率要比葡萄糖慢。Addition of solutes or carbohydrates to biological tissues can cause a decrease in the cell volume coefficient and an increase in the refractive index of the extramolecular fluid. These two changes are contradictory to each other in the overall scattering behavior of biological tissues. Measurement of such a change in the path length of light can reveal which of the change in the volume of the cell and the change in the refractive index plays a more important role than the other. In perfusion of the liver with glucose represented by curve (a) in Figure 18, the path length of the perfused liver increased rapidly and then returned to its original value within 2-3 minutes. The variation in the path length indicates that a decrease in cell size and in the cell volume coefficient φ must occur at the beginning of the perfusion, but the shrinking cells will regain their original volume to some extent. When the wash buffer is turned on, the path length starts to decrease because the cells are under hypotonic conditions, so they start to swell. Moreover, when the cell returned to its original volume, the path length returned to its baseline within 3 minutes. Curve (b) in Figure 18 shows the data for mannitol, except that the rate of return to baseline for mannitol is lower than that for glucose, which is otherwise the same as in the case of perfusion with glucose resemblance. The explanation for this difference is that liver cells are less permeable to mannitol than glucose, so the recovery rate of mannitol is slower than that of glucose.
在原则上,生物组织的细胞的规则的体积增加和减小都不能够重新完全获得它的初始的细胞体积。这将意味着在图18中的曲线(a)和(b)中的路径长度将不能完全回复到它原来的值。但是,在分子外的流体中的折射系数中的改变也将出现,并补偿了细胞体积的改变的效应。因此,路径长度的轨迹能够停留在基线的附近,就象在曲线(b)中的两条轨迹所示出的那样,在初始的突起响应之后,主要地依赖生物组织的类型和条件。针对蔗糖的灌注的路径长度的数据在图18中的曲线(c)中给出,它在两个方面与其它的两种情况很不相同:1)当灌注开始时,路径长度下降,和2)直到开始进行缓冲剂的冲洗之前,路径长度没有返回到其基线的趋势。已经知道的情况是:1)当老鼠的规则被灌注蔗糖时,出现细胞的收缩(见1989年Haddad等人在Physiol周刊的第256卷上G563-G569的文章),2)蔗糖的折射系数是1.34783,很类似于葡萄糖的折射系数(1.3479)(见windholz等人1983年在由Merck&Co公司出版的百科全书化学卷中的″药物,和生物″一章),3)肝脏细胞的壁膜对于蔗糖来说是不能够渗透的(见Haddad等人的1989年的文章)。前面两点指出的是,由在蔗糖和葡萄糖灌注的肝脏中的细胞的尺寸和分子外的折射系数的改变所引起的效应将是十分相似的。对于在蔗糖灌注中的相反的路径长度的特征的解释在于,在这种情况中的细胞体积系数φ保持着不变,因此表现出不同于葡萄糖灌注的情况。已经有报告说,以蔗糖灌注的肝脏容易出现大量的水分的丢失(Haddad等人在1989年的文章),因此,由于细胞的收缩性,V细胞和V总体由于生物组织中的水分的丢失都下降,从而使得φ=V细胞/V总体保持不变。肝脏细胞的核壁对于蔗糖的不可渗透性可以被解释成由于在这种情况中的非回转的特性,只是包括水分从分子内向分子外的移动,从而防止了规则的体积的增加。In principle, neither the regular volume increase nor the decrease of the cells of a biological tissue can fully regain its original cell volume. This would mean that the path length in curves (a) and (b) in Figure 18 would not fully return to its original value. However, a change in the refractive index in the extramolecular fluid will also occur and compensate for the effect of the changing cell volume. Thus, the trajectory of the path length can stay near the baseline, as shown by the two trajectories in curve (b), after the initial protrusion response, depending mainly on the type and condition of the biological tissue. The data for the path length of the infusion of sucrose is given in curve (c) in Figure 18, which is quite different from the other two cases in two respects: 1) when the infusion starts, the path length drops, and 2 ) the path length does not tend to return to its baseline until buffer flushing begins. The known situation is: 1) when the rule of rats is perfused with sucrose, cell shrinkage occurs (see the article G563-G569 of Haddad et al. in Volume 256 of Physiol Weekly in 1989), 2) the refractive index of sucrose is 1.34783, very similar to the refractive index (1.3479) of glucose (see windholz et al. 1983 " drug, and biology " chapter in the encyclopedia chemical volume published by Merck & Co), 3) the wall membrane of liver cell is to sucrose are impermeable to other systems (see Haddad et al., 1989). The preceding two points point out that the effects caused by changes in the size and extramolecular refractive index of cells in sucrose and glucose perfused livers will be quite similar. The explanation for the opposite path length characteristic in sucrose perfusion is that the cell volume coefficient φ in this case remains constant and thus behaves differently than in the case of glucose perfusion. It has been reported that sucrose-perfused livers are prone to substantial water loss (Haddad et al., 1989), and therefore, both Vcells and Vpopulations due to water loss in biological tissue are subject to contractility due to cell contractility. Decrease, so that φ = Vcells / Voverall remains unchanged. The impermeability of the nuclear wall of liver cells to sucrose can be explained due to the non-rotating nature in this case, involving only the movement of water from the inside to the outside of the molecule, thus preventing a regular volume increase.
归功于葡萄糖对于人体的被测物的注入的散射特性的改变的体内检测已有报导(见1994年Maier等人的文章)。测量是对于被测人的大腿进行的,并且是不同于在肝脏的葡萄糖的灌注的情况所获得的结果,在葡萄糖的注入之后的几分钟之内,散射系数开始减小。这种不一致可能是由于这样的是实,即在人的大腿上进行的葡萄糖的体内测量可能要包括大部分的肌肉和血液,而肝脏的灌注测量只包括纯粹的肝脏细胞。由于肌肉的细胞是进行绝对非球面的吸收且非常不同于肝脏细胞的形状和构成,所以,肌肉细胞对于葡萄糖的反应可以是相当地不同于肝脏的细胞。另一方面,如果细胞体积系数并不因为葡萄糖的引入而改变多少的话,则散射系数将主要是因为在分子外的折射系数的改变而减小。而且,当着有血液包括在测量中时,由红色血细胞和肌肉对于葡萄糖的提取过程的结合将使得在散射性质中的变化的机制变得复杂化。In vivo detection due to changes in the scattering properties of glucose for infusion of analytes in humans has been reported (see Maier et al., 1994). The measurements were carried out on the thigh of the subject and, unlike the results obtained in the case of glucose perfusion of the liver, the scattering coefficient starts to decrease within a few minutes after the glucose infusion. This inconsistency may be due to the fact that in vivo measurements of glucose in human thighs are likely to include most of the muscle and blood, whereas liver perfusion measurements include only pure liver cells. Because muscle cells undergo absolutely aspherical absorption and are very different in shape and composition from liver cells, muscle cells can respond to glucose quite differently than liver cells. On the other hand, if the cell volume coefficient does not change much due to the introduction of glucose, the scattering coefficient will decrease mainly due to the change in the refractive index outside the molecule. Furthermore, the combination of the extraction process of glucose by red blood cells and muscle will complicate the mechanism of changes in the scattering properties when blood is included in the measurement.
这些结果成功地显示出利用NIR技术进行无创伤的生理监视,例如通过检测路径长度(即散射特性)的改变来监视生物组织的膨胀。例如,如果路径长度增加,则细胞正在收缩。如果包括有溶质/碳水化合物的添加,则将会遇到起因于在细胞尺寸和在分子外折射系数的中的变化的多种效果。通过使用适当的碳水化合物,例如葡萄糖或甘露醇,在生物组织的细胞中的变化的效应就能够预见,因而仍然能够通过监视路径长度的改变来检测生物组织的膨胀。These results successfully demonstrate the use of NIR technology for noninvasive physiological monitoring, such as monitoring expansion of biological tissue by detecting changes in path length (i.e., scattering properties). For example, if the path length increases, the cell is shrinking. If the addition of solutes/carbohydrates is involved, various effects resulting from changes in cell size and in the refractive index of the molecule will be encountered. By using appropriate carbohydrates, such as glucose or mannitol, the effect of changes in the cells of the biological tissue can be predicted, so that the swelling of the biological tissue can still be detected by monitoring the change in path length.
总之,理论和实验的结果表明,在生物组织中添加溶质/碳水化合物将影响到生物组织的细胞的大小,细胞体积系敏和分子外流体的折射系数;并且因此影响到总体上生物组织的散射特性。理论的近似方案被用于计算渗透和折射系数对于生物组织的减低的散射系数的作用,并将光子的扩散理论用于把降低的散射系数和光的路径长度相结合。在实验上,所有的三种NIR技术都能够测量由于添加了溶质到生物组织中以及在经过灌注的老鼠的肝脏中的光学性质的改变。经过灌注的肝脏的温度相关的路径长度的测量证实,生物组织的散射性对于生物组织细胞的尺寸的依赖。利用三种碳水化合物灌注而获得的肝脏的结果显示出不同的散射方面,这些方面由在细胞尺寸和体积系数作出了解释。In summary, theoretical and experimental results indicate that the addition of solutes/carbohydrates to biological tissues will affect the size of the cells of the biological tissue, the cell volume sensitivity and the refractive index of the extramolecular fluid; and thus affect the scattering properties of the biological tissue in general . Theoretical approximations were used to calculate the effects of permeability and refractive index on the reduced scattering coefficient of biological tissue, and the theory of photon diffusion was used to combine the reduced scattering coefficient and the path length of light. Experimentally, all three NIR techniques were able to measure changes in optical properties due to the addition of solutes to biological tissue and in the liver of perfused mice. The measurement of the temperature-dependent path length of the perfused liver confirmed the dependence of the scattering properties of the biological tissue on the size of the biological tissue cells. The results obtained for the livers perfused with the three carbohydrates showed different scatter aspects explained by the cell size and volume factor.
图12是一个示意图,示出了在一个散射体悬浮物(a)和生物组织或血液(b)之间的散射粒子的体积系数之间的差异。在情况(a)中,散射体的体积系数φ=0.026,而在情况(b)中,体积系数是φ=0.73。Fig. 12 is a diagram showing the difference between the volume coefficients of scattered particles between a scatterer suspension (a) and biological tissue or blood (b). In case (a) the volume factor of the scatterer is φ=0.026, while in case (b) the volume factor is φ=0.73.
图13示出了针对于一个0.5%的脂类乳剂-葡萄糖悬浮物(a)和一个经过灌注的肝脏(b)的降低的散射系数μs′的模拟实验的结果。对于(a)的计算是根据公式(2),而对于(b)的计算是根据公式(3)。葡萄糖和用于在悬浮物中的散射粒子的折射系数或用于生物组织的分子外流体的散射系数时之间的关系在下面给出。在情况(b)中,肝脏的细胞被认为是刚性的,只有分子外流体的折射系数改变。Figure 13 shows the results of simulation experiments for the reduced scattering coefficientμs ' for a 0.5% lipid emulsion-dextrose suspension (a) and a perfused liver (b). The calculation for (a) is according to formula (2), while the calculation for (b) is according to formula (3). The relationship between glucose and the refractive index for scattering particles in suspension or the scattering coefficient for extramolecular fluids of biological tissues is given below. In case (b), the cells of the liver are considered rigid and only the refractive index of the extramolecular fluid changes.
图14示出了以830nm测量的0.5%脂类乳剂-甘露醇悬浮物的时域的实验结果。该图示出了平均光路径长度(a)、降低的散射系数μs′(b)和作为添加到悬浮物中的甘露醇的浓度的函数的该悬浮物的吸收系数μa(c)。Figure 14 shows experimental results in the time domain of a 0.5% lipid emulsion-mannitol suspension measured at 830 nm. The figure shows the mean optical path length (a), the reduced scattering coefficient μs ' (b) and the absorption coefficient μa (c) of the suspension as a function of the concentration of mannitol added to the suspension.
图15示出了以连续波方法测量的0.5%脂类乳剂-酵母甘露醇悬浮物的实验的结果。它示出被减低的散射系数μs′的一个降低(a)和具有在悬浮物中的甘露醇增加的悬浮物的一个相对恒定的吸收系数μa(b)。Figure 15 shows the results of an experiment with 0.5% lipid emulsion-yeast mannitol suspension measured by the continuous wave method. It shows a decrease (a) of the reduced scattering coefficient μs ' and a relatively constant absorption coefficient μa (b) of the suspension with increased mannitol in the suspension.
图16示出了以更为实际的条件,根据公式(12)针对经过灌注的肝脏的降低的散射系数μs′的模拟实验的结果。图16(a)示出了随着肝脏细胞的尺寸的减小(顶部标度)或随着灌注液中的葡萄糖的浓度(底部标度)的增加的μs′的增加。在图16(a)中,可变的只是细胞的半径;分子外的折射系数和细胞的体积系数都是固定的。在图16(b)中的实体的圆是通过改变细胞的半径和分子外的折射系数而获得的。图16(b)的空心的圆是通过改变细胞的半径、分子外的折射系数和细胞体积系数而计算的。Fig. 16 shows the results of a simulation experiment for the reduced scattering coefficient μs' of a perfused liver according to equation (12) under more realistic conditions. Figure 16(a) shows the increase inμ8 ' with decreasing size of liver cells (top scale) or increasing concentration of glucose in the perfusate (bottom scale). In Fig. 16(a), only the radius of the cell is variable; the refraction coefficient outside the molecule and the volume coefficient of the cell are both fixed. The solid circle in Fig. 16(b) is obtained by changing the radius of the cell and the refractive index outside the molecule. The hollow circles in Fig. 16(b) are calculated by varying the radius of the cell, the extramolecular refractive index, and the cell volume index.
图17示出了针对冷却处理(a)和加热处理(b)的一个被灌注的老鼠的肝脏的温度相关的路径长度的改变。Figure 17 shows the temperature-dependent path length change in the liver of a perfused mouse for cooling treatment (a) and heating treatment (b).
图18示出了用200mM的葡萄糖(a)、200mM的甘露醇(b)和200mM的蔗糖分别灌注的老鼠肝脏的路径长度的实验的结果。在情况(b)中的两条轨迹是从两只不同的老鼠肝脏获得的。Figure 18 shows the results of the path length experiment of mouse liver perfused with 200 mM glucose (a), 200 mM mannitol (b) and 200 mM sucrose, respectively. The two trajectories in case (b) were obtained from two different mouse livers.
图19是吸收系数μa(a)、降低的散射系数μs′和灌注了100mM的蔗糖光的平均路径长度(c)的实验结果。这些数据是通过实时间分解的分光光度计确定的。实体的和空心的圆分别地对应于以780nm和830nm的测量。应用Figure 19 is the experimental results of absorption coefficient μa (a), reduced scattering coefficient μs ' and average path length (c) of light perfused with 100 mM sucrose. These data were determined by a real-time time-resolved spectrophotometer. Solid and open circles correspond to measurements at 780 nm and 830 nm, respectively. application
利用本发明的监视方法,能够对各种浓度的溶质进行监视。实例IWith the monitoring method of the present invention, solutes of various concentrations can be monitored. Example I
本发明提供了一种简单、高效和便携的方案来对于病人体内的糖(甘露醇、果糖、蔗糖和葡萄糖)进行监视。已经观测到的灵敏度是在25℃时1×10⁻⁴▲OD/mmol/百分比脂类乳剂。与通常的10-5▲OD的噪声电平相比较,将预示在8-12的mM能够有满意的检测。The present invention provides a simple, efficient and portable solution for monitoring sugars (mannitol, fructose, sucrose and glucose) in patients. The observed sensitivity is 1 x 10⁻⁴▲ OD/mmol/percent lipid emulsion at 25°C. Comparison with the usual noise level of 10-5▲ OD would indicate satisfactory detection at 8-12 mM.
根据把图1-1D的监视器附到病人的乳房、腹部、手指或头来监视病人体内的葡萄糖的浓度。对于这种确定的最佳的生物组织是其腹壁葡萄糖的水平能够迅速地与血管中的水平均衡的部位。The concentration of glucose in the patient's body is monitored by attaching the monitor of FIGS. 1-1D to the patient's breast, abdomen, finger or head. The optimal biological tissue for this determination is one where the level of glucose in the abdominal wall can rapidly equilibrate with the level in the blood vessels.
参考图9,在一个葡萄糖的监视用途的一个最佳实施例中用于监视一个糖尿病人的血液的葡萄糖的浓度,其检测是利用了与图4(100)相关的描述过程。在一个实施例中,病人直接从一个计算器(例如一个计算机或其它的处理器)的输出中读到绘出的斜率和截距值,并将这些值与一个预定的校准标度相比较(如上所述)。Referring to FIG. 9 , in a preferred embodiment of a glucose monitoring application for monitoring the blood glucose concentration of a diabetic patient, the detection utilizes the process described in relation to FIG. 4 ( 100 ). In one embodiment, the patient reads the plotted slope and intercept values directly from the output of a calculator (e.g., a computer or other processor) and compares these values to a predetermined calibration scale ( as above).
在另一个实施例中,处理器接收一个被拓展的斜率和截距值,并将这些值和一个预定存储的校准标度相比较。处理器还实现下列的步骤,以便将被测的溶质的浓度指示给病人。如果测量的浓度(C溶质)小于一个第一预定的阈值浓度(Cth,1),例如1-100mmol,而且最好是50mmol(步骤2),就输出一个绿信号(104),例如通过闪亮一个绿灯,表示病人的血液中的葡萄糖是在正常的水平。如果被测的浓度是大于Cth,1,该被测的浓度就再次和一个第二阈值浓度(Cth,2)相比较,例如50-100mmol,而且最好是120mmol(步骤106)。如果C溶质小于该第二阈值的浓度,就输出一个黄信号(步骤108),指示病人的血液葡萄糖水平已经升到了正常值以上,并且应该仔细监视。如果C溶质是大于Cth,2,就输出应该红信号(步骤110),指示病人应该医治他的病情。实例IIIn another embodiment, the processor receives an extended slope and intercept value and compares these values to a predetermined stored calibration scale. The processor also implements the following steps to indicate the concentration of the measured solute to the patient. If the measured concentration (Csolute ) is less than a first predetermined threshold concentration (Cth,1 ), for example 1-100 mmol, and preferably 50 mmol (step 2), a green signal (104) is output, for example by flashing A green light indicates that the glucose in the patient's blood is at normal levels. If the measured concentration is greater than Cth,1 , the measured concentration is again compared with a second threshold concentration (Cth,2 ), eg 50-100 mmol, and preferably 120 mmol (step 106 ). If the concentration ofsolute C is less than the second threshold, a yellow signal is output (step 108), indicating that the patient's blood glucose level has risen above normal and should be carefully monitored. If Csolute is greater than Cth,2 , a red signal is output (step 110 ), indicating that the patient should be treated for his condition. Example II
采用根据本发明的方案,可以检测病人的酒精浓度。乙醇迅速地以生物组织的空间均衡并给出应该很小但是十分重要的信号。因此,一个病人(在此处的″病人″是指广义上的接受医疗问题而被诊治的人)将图1-1D的监视器附在乳房、腹部、手指或头。象例一中的一个处理器接收来自监视器的作为输入信号的光强度信号,象在参考图1-1D中描述的那样,并且实施图4和9的算法,以便提供在病人体内的酒精浓度的度量。Using the solution according to the invention, it is possible to detect the alcohol concentration of a patient. Ethanol rapidly equilibrates with the tissue space and gives what should be a small but significant signal. Thus, a patient ("patient" here refers to a person being treated for a medical problem in a broad sense) attaches the monitor of Figs. 1-1D to the breast, abdomen, fingers or head. A processor as in Example 1 receives as input the light intensity signal from the monitor, as described with reference to FIGS. 1-1D, and implements the algorithms of FIGS. 4 and 9 to provide the alcohol concentration in the patient. measure.
例如象结合例一描述的那样将校准标度分界地确定。阈值电平(Cth,1,Cth,2)被选择对应于所希望的判据(例如法定的饮酒限制)。实例IIIFor example, the calibration scale is determined demarcated as described in connection with Example 1. The threshold levels (
采用根据本发明的方案,可以检测病人体内的盐(例如NaCl,KCl和MOPS)的浓度。因此,一个病人将图1-1D的监视器附在乳房、腹部、手指或头。象例一中的一个处理器接收来自监视器的作为输入信号的光强度信号,象在参考图1-1D中描述的那样,并且实施图4和9的算法,以便提供在病人体内的酒精浓度的度量。图10的表II包括关于NaCl,KCl和MOPS的数据。这些电解质的作用相当小,但是十分重要。Using the protocol according to the invention, it is possible to detect the concentration of salts (eg NaCl, KCl and MOPS) in a patient. Thus, a patient attaches the monitor of Fig. 1-1D to the breast, abdomen, fingers or head. A processor as in Example 1 receives as input the light intensity signal from the monitor, as described with reference to FIGS. 1-1D, and implements the algorithms of FIGS. 4 and 9 to provide the alcohol concentration in the patient. measure. Table II of Figure 10 includes data for NaCl, KCl and MOPS. The role of these electrolytes is rather small, but very important.
例如象结合例一描述的那样将校准标度分界地确定。阈值电平(Cth,1,Cth,2)被选择对应于所希望的判据,例如根据病人的健康状况。例如,具有高血压的病人应该建议在低的阈值浓度。实例IIIFor example, the calibration scale is determined demarcated as described in connection with Example 1. The threshold levels (
如果除去所要测量的溶质的浓度之外的其它的因素可以被忽略,就将会有增强的效果。根据这样的实例,病人的历史是具有特征,能够假设在所监视的浓度水平中的变异是由于在所希望测量的溶质浓度中的变异所造成。If factors other than the concentration of the solute being measured can be neglected, there will be an enhanced effect. From such instances, the patient's history being characterized, it can be assumed that variations in the monitored concentration levels are due to variations in the desired measured solute concentrations.
例如,当病人还没有自身感觉到提高了其它的散射溶质的浓度时,使用图1-1D的监视器获得应该病人的一个增强的葡萄糖浓度的测量,该监视器耦合到一个处理器来实施图4的步骤。For example, a measurement of an increased glucose concentration in a patient should be obtained using the monitor of FIG. 4 steps.
从在溶质识别中的低特殊性的角度来看,尤其是象葡萄糖、乙醇、甘露醇和程度较轻的NaCl和KCl的生理重要性的角度来看,使用不经肠胃的流体的附加信息的体内研究正在进行。此外,渗透的过渡以及生物组织的确切的渗透状态都将是重要的,尤其是在病人经历了透析法处理之后。最终,也可能是最重要的一点是人体的生物组织的温度,它应该在特定的生物组织的体积的光学的研究中加以监视,尤其是通过水分的吸收进行监视。From the point of view of low specificity in solute recognition, especially the physiological importance of like glucose, ethanol, mannitol and to a lesser extent NaCl and KCl, additional information in vivo using parenteral fluids Research is ongoing. Furthermore, the osmotic transition and the exact osmotic state of the biological tissue will be important, especially after the patient has undergone dialysis treatment. Finally, and probably most important, is the temperature of the biological tissue of the human body, which should be monitored in optical studies of specific biological tissue volumes, especially by moisture absorption.
图11中(表III)示出了在表中示出的克分子数范围内的甘露醇、果糖和丙二醇的各种溶质的效应。按照上述的相同的方式对于斜率进行规一化,但是不进行脂类乳剂的百分比的划分。斜率值是在等于甘露醇和葡萄糖的实验的误差之内。酒精和丙二醇给出在稀释之后(见下述)的明显小的斜率和小的多的截距。甲醇对于作为散射体的酵母的小的影响在表IV中示出。The effect of various solutes of mannitol, fructose and propylene glycol in the molar ranges shown in the table is shown in Figure 11 (Table III). The slope was normalized in the same manner as above, but without the division of the percentage of lipid emulsion. Slope values are within experimental error equal to mannitol and glucose. Alcohol and propylene glycol gave significantly smaller slopes and much smaller intercepts after dilution (see below). The small effect of methanol on yeast as scatterers is shown in Table IV.
与此同时,可以施行对于水的吸收的适度的校正。At the same time, a modest correction for the absorption of water can be performed.
而且,由于强度的测量尤其是对于皮肤和探头及测量仪之间的接触的改变敏感,或者是对于探头和人体的生物组织敏感,使得不取决于强度的测量广受欢迎,而且这种方法之一是应该相位调制系统,对于多数的可靠的测量来说,它确实是最终的系统。但是,强度信号和相位信号之间的关系使得要求相当高的相位灵敏度的要求。可能必须要测量10-5的吸收极限,这也要求相位检测的相似的精度。其它实例Furthermore, since intensity measurements are particularly sensitive to changes in the contact between the skin and the probe and the measuring instrument, or to the probe and the biological tissue of the body, measurements independent of intensity are popular, and such methods One should be the phase modulation system, which is indeed the ultimate system for most reliable measurements. However, the relationship between the intensity signal and the phase signal makes the requirement of relatively high phase sensitivity. It may be necessary to measure the absorption limit of 10-5 , which also requires a similar accuracy of phase detection. other examples
通过获取提取确切的线性参数(斜率和截距)的更多数目的数据点,可以采用多于三个的光源来获得增强的测量。Enhanced measurements can be obtained with more than three light sources by taking a greater number of data points to extract the exact linear parameters (slope and intercept).
不是采用多个光源而是采用一个光源把光线在相距检测器的不同的位置的不同的距离加到生物系统。另外,单一的光源可以保持稳定,而且可将检测器顺序地移动,以便检测相距光源不同距离的定位的检测位置。Instead of multiple light sources, a single light source is used to impart light to the biological system at different distances from different locations of the detector. Alternatively, a single light source can be held steady and the detectors can be moved sequentially to detect detection positions located at different distances from the light source.
在此描述的监视方案对于波长加以很小的依赖性。因此,双重波长的方法可以使用来实现减小血红蛋白的交扰。在这种技术中,血红蛋白的浓度是由一个适当的相位调制的分光光度计所量化的,以便用所包括的波长提供精确的路径长度信息。因此,在850nm处的吸收性的测量和血红蛋白的不一致就可以被预测随着对于溶质的测量的适应而被克服。The monitoring scheme described here imposes little dependence on wavelength. Therefore, a dual-wavelength approach can be used to achieve reduced hemoglobin crosstalk. In this technique, the hemoglobin concentration is quantified by an appropriately phase-modulated spectrophotometer to provide accurate path length information at the wavelengths involved. Therefore, the inconsistency between the absorbance measurement at 850 nm and hemoglobin can be predicted to be overcome with the adaptation of the solute measurement.
光线进入到生物组织和到达包括硅二极管或光纤耦合器的过程中出现的变化(例如由于可变的生物组织的接触)可以通过频域的方法加以补偿,这种方法对于生物组织的接触有着显著的优点。为了进行这种确定,需要使用若干输入-输出间距的测定。不同的间距的测定取样不同深度的不同生物组织体积:短间距-浅的和长间距-深的生物组织的体积。所以,在包括异常的生物组织的情况中,以不同的输入-输出间距取样到不同的溶质的可能性将得到补偿。Variations in the passage of light into biological tissue and onto couplers involving silicon diodes or fiber optics (eg due to variable tissue exposure) can be compensated by frequency-domain methods that have a significant impact on biological tissue exposure. The advantages. To make this determination, several measurements of the input-output spacing need to be used. Determination of different spacings Different volumes of biological tissue are sampled at different depths: short spacing - shallow and long spacing - volumes of biological tissue. Therefore, in cases involving abnormal biological tissue, the possibility of sampling different solutes at different input-output spacings will be compensated.
可以交替地采用时域的方法。这些方法取样不同的生物组织的体积而计算μs′和μa(分别在先和在后)。使用从时域到频域的付立叶(Fourier)变换可以克服这些问题。在这些频域装置中,高频波是浅穿透的,而低频波是深穿透的。因此,以一对吸收被消除的波长为特征的双重测量对于计算散射因数来说是一个有用的手段。A time-domain approach can alternatively be used. These methods sample different volumes of biological tissue to calculate μs ' and μa (first and last, respectively). These problems can be overcome using a Fourier transform from the time domain to the frequency domain. In these frequency domain devices, high frequency waves are shallowly penetrating, while low frequency waves are deeply penetrating. Therefore, dual measurements featuring a pair of wavelengths at which absorption is canceled are a useful means for calculating the scattering factor.
在本发明的范围内还有其它的实施例。利用时间分解的分光光度计(TRS)或调相的分光光度计(PMS)可以对于上述的溶质进行监视和对于其浓度进行测量。适用的TRS系统在美国专利5119815或5386827中进行了描述,在此引作参考。TRS系统采用的是对于被测溶质直接或间接地敏感的可见或红外波长(即由于在吸收性或散射性中的变异)。该TRS系统在体内测量有效的散射系数(μs′)或吸收系数(μa)并且将这些值与溶质的浓度相关。There are other embodiments within the scope of the invention. The above-mentioned solutes can be monitored and their concentrations measured using a time-resolved spectrophotometer (TRS) or a phase-modulated spectrophotometer (PMS). Suitable TRS systems are described in US Pat. Nos. 5,119,815 or 5,386,827, incorporated herein by reference. TRS systems employ visible or infrared wavelengths to which the measured solute is directly or indirectly sensitive (ie, due to variations in absorbance or scattering). The TRS system measures the effective scattering coefficient (μs' ) or absorption coefficient (μa ) in vivo and relates these values to the concentration of the solute.
此外,利用PMS的测量的系统在美国专利4972331,5122974和5187672中,和国际专利申请PCT/US94/02764(在1993年3月15日提交)或PCT/US92/00463(1992年1月21日提交)中有所描述,在此都作为参考。PMS系统是采用一个或多个对于被测溶质直接或间接敏感的可见光或红外光进行测量的(即由于吸收性或散射性中的变异)。该PMS系统在体内测量有效的散射系数(μs′)或吸收系数(μa)并且将这些值与溶质的浓度相关。此外,由TRS系统和PMS系统所测量的分光光度信号的量化造Sevick等人在1991年出版的″分析生物化学″卷195中的330-351页的文章中进行了进一步的解释,在此引作参考。In addition, systems utilizing PMS measurements are described in US Patents 4,972,331, 5,122,974 and 5,187,672, and International Patent Application PCT/US94/02764 (filed March 15, 1993) or PCT/US92/00463 (January 21, 1992 Commit), which are hereby incorporated by reference. PMS systems make measurements using one or more visible or infrared light sources to which the solute being measured is directly or indirectly sensitive (ie, due to variations in absorbance or scattering). The PMS system measures the effective scattering coefficient (μs' ) or absorption coefficient (μa ) in vivo and relates these values to the concentration of the solute. In addition, the quantification of the spectrophotometric signal measured by the TRS system and the PMS system is further explained in the article of Sevick et al., pages 330-351 in "Analytical Biochemistry" volume 195, published in 1991, cited here Reference.
TRS和PMS分光光度计采用的波长对于被测的溶质是直接敏感的,这些溶质已经在上面作了定义(例如新陈代谢的媒体、新陈代谢物、电解质、糖、结合到可检测的溶剂(例如反差剂)的溶质的组合、或提供该溶质的直接测量的其它的成分)。TRS and PMS spectrophotometers employ wavelengths that are directly sensitive to the measured solutes, which have been defined above (e.g. metabolic media, metabolites, electrolytes, sugars, bound to detectable solvents (e.g. contrast agents) ), or other components that provide a direct measure of the solute).
Claims (22)
Translated fromChineseApplications Claiming Priority (2)
| Application Number | Priority Date | Filing Date | Title |
|---|---|---|---|
| US08/349,839 | 1994-12-02 | ||
| US08/349,839US5782755A (en) | 1993-11-15 | 1994-12-02 | Monitoring one or more solutes in a biological system using optical techniques |
Publications (1)
| Publication Number | Publication Date |
|---|---|
| CN1172419Atrue CN1172419A (en) | 1998-02-04 |
Family
ID=23374171
Family Applications (1)
| Application Number | Title | Priority Date | Filing Date |
|---|---|---|---|
| CN95196574APendingCN1172419A (en) | 1994-12-02 | 1995-12-04 | Method and system of monitoring one or more solutes in biological system using optical techniques |
Country Status (6)
| Country | Link |
|---|---|
| US (1) | US5782755A (en) |
| EP (1) | EP0797404A4 (en) |
| JP (1) | JPH10511568A (en) |
| CN (1) | CN1172419A (en) |
| CA (1) | CA2206580C (en) |
| WO (1) | WO1996016592A1 (en) |
Cited By (1)
| Publication number | Priority date | Publication date | Assignee | Title |
|---|---|---|---|---|
| CN100403985C (en)* | 2004-04-09 | 2008-07-23 | 清华大学 | Digital near-infrared diffuse tomography system |
Families Citing this family (96)
| Publication number | Priority date | Publication date | Assignee | Title |
|---|---|---|---|---|
| US5845639A (en)* | 1990-08-10 | 1998-12-08 | Board Of Regents Of The University Of Washington | Optical imaging methods |
| US6671540B1 (en) | 1990-08-10 | 2003-12-30 | Daryl W. Hochman | Methods and systems for detecting abnormal tissue using spectroscopic techniques |
| US6263221B1 (en)* | 1991-01-24 | 2001-07-17 | Non-Invasive Technology | Quantitative analyses of biological tissue using phase modulation spectroscopy |
| US6246892B1 (en)* | 1991-01-24 | 2001-06-12 | Non-Invasive Technology | Phase modulation spectroscopy |
| US6493565B1 (en)* | 1993-11-15 | 2002-12-10 | Non-Invasive Technology, Inc. | Examination of biological tissue by monitoring one or more solutes |
| US6957094B2 (en)* | 1994-12-02 | 2005-10-18 | Non-Invasive Technology, Inc. | Examination of scattering properties of biological tissue |
| US6240306B1 (en) | 1995-08-09 | 2001-05-29 | Rio Grande Medical Technologies, Inc. | Method and apparatus for non-invasive blood analyte measurement with fluid compartment equilibration |
| US6405069B1 (en) | 1996-01-31 | 2002-06-11 | Board Of Regents, The University Of Texas System | Time-resolved optoacoustic method and system for noninvasive monitoring of glucose |
| JP4090502B2 (en)* | 1996-04-02 | 2008-05-28 | コーニンクレッカ フィリップス エレクトロニクス エヌ ヴィ | Localization of objects in turbid media using different wavelengths of radiation |
| US6027496A (en)* | 1997-03-25 | 2000-02-22 | Abbott Laboratories | Removal of stratum corneum by means of light |
| US7890158B2 (en) | 2001-06-05 | 2011-02-15 | Lumidigm, Inc. | Apparatus and method of biometric determination using specialized optical spectroscopy systems |
| US6628809B1 (en) | 1999-10-08 | 2003-09-30 | Lumidigm, Inc. | Apparatus and method for identification of individuals by near-infrared spectrum |
| EP1054618B1 (en)* | 1998-02-11 | 2006-12-20 | Non-Invasive Technology, Inc. | Detection, imaging and characterization of breast tumors |
| EP1054619B1 (en)* | 1998-02-11 | 2007-11-21 | Non-Invasive Technology, Inc. | Imaging and characterization of brain tissue |
| US20070167704A1 (en)* | 1998-02-13 | 2007-07-19 | Britton Chance | Transabdominal examination, monitoring and imaging of tissue |
| US6662030B2 (en) | 1998-05-18 | 2003-12-09 | Abbott Laboratories | Non-invasive sensor having controllable temperature feature |
| US6662031B1 (en)* | 1998-05-18 | 2003-12-09 | Abbott Laboratoies | Method and device for the noninvasive determination of hemoglobin and hematocrit |
| US7043287B1 (en)* | 1998-05-18 | 2006-05-09 | Abbott Laboratories | Method for modulating light penetration depth in tissue and diagnostic applications using same |
| US6526298B1 (en) | 1998-05-18 | 2003-02-25 | Abbott Laboratories | Method for the non-invasive determination of analytes in a selected volume of tissue |
| US6949081B1 (en)* | 1998-08-26 | 2005-09-27 | Non-Invasive Technology, Inc. | Sensing and interactive drug delivery |
| JP2002538423A (en)* | 1999-02-23 | 2002-11-12 | テラプロウブ リミテッド | Method and apparatus for terahertz imaging |
| US7047054B2 (en) | 1999-03-12 | 2006-05-16 | Cas Medical Systems, Inc. | Laser diode optical transducer assembly for non-invasive spectrophotometric blood oxygenation monitoring |
| US6216021B1 (en)* | 1999-06-04 | 2001-04-10 | The Board Of Trustees Of The University Of Illinois | Method for measuring absolute saturation of time-varying and other hemoglobin compartments |
| US7840257B2 (en)* | 2003-01-04 | 2010-11-23 | Non Invasive Technology, Inc. | Examination of biological tissue using non-contact optical probes |
| US7904139B2 (en)* | 1999-08-26 | 2011-03-08 | Non-Invasive Technology Inc. | Optical examination of biological tissue using non-contact irradiation and detection |
| US6816605B2 (en) | 1999-10-08 | 2004-11-09 | Lumidigm, Inc. | Methods and systems for biometric identification of individuals using linear optical spectroscopy |
| US7006676B1 (en) | 2000-01-21 | 2006-02-28 | Medical Optical Imaging, Inc. | Method and apparatus for detecting an abnormality within a host medium utilizing frequency-swept modulation diffusion tomography |
| WO2001084107A2 (en) | 2000-05-02 | 2001-11-08 | Cas Medical Systems, Inc. | Method for non-invasive spectrophotometric blood oxygenation monitoring |
| US6477393B1 (en) | 2000-07-19 | 2002-11-05 | Trw Inc. | Non-invasive blood glucose measurement techniques |
| US6516209B2 (en) | 2000-08-04 | 2003-02-04 | Photonify Technologies, Inc. | Self-calibrating optical imaging system |
| US6587703B2 (en) | 2000-09-18 | 2003-07-01 | Photonify Technologies, Inc. | System and method for measuring absolute oxygen saturation |
| US6597931B1 (en) | 2000-09-18 | 2003-07-22 | Photonify Technologies, Inc. | System and method for absolute oxygen saturation |
| US6801648B2 (en) | 2000-08-04 | 2004-10-05 | Xuefeng Cheng | Optical imaging system with symmetric optical probe |
| US6549861B1 (en) | 2000-08-10 | 2003-04-15 | Euro-Celtique, S.A. | Automated system and method for spectroscopic analysis |
| US6675030B2 (en) | 2000-08-21 | 2004-01-06 | Euro-Celtique, S.A. | Near infrared blood glucose monitoring system |
| DE10110599A1 (en)* | 2001-03-06 | 2002-09-12 | Roche Diagnostics Gmbh | Method for determining a light transport parameter in a biological matrix |
| US6983176B2 (en) | 2001-04-11 | 2006-01-03 | Rio Grande Medical Technologies, Inc. | Optically similar reference samples and related methods for multivariate calibration models used in optical spectroscopy |
| US6865408B1 (en) | 2001-04-11 | 2005-03-08 | Inlight Solutions, Inc. | System for non-invasive measurement of glucose in humans |
| US6862091B2 (en) | 2001-04-11 | 2005-03-01 | Inlight Solutions, Inc. | Illumination device and method for spectroscopic analysis |
| US6574490B2 (en) | 2001-04-11 | 2003-06-03 | Rio Grande Medical Technologies, Inc. | System for non-invasive measurement of glucose in humans |
| US7126682B2 (en)* | 2001-04-11 | 2006-10-24 | Rio Grande Medical Technologies, Inc. | Encoded variable filter spectrometer |
| US7043288B2 (en) | 2002-04-04 | 2006-05-09 | Inlight Solutions, Inc. | Apparatus and method for spectroscopic analysis of tissue to detect diabetes in an individual |
| AU2002346486A1 (en)* | 2001-11-21 | 2003-06-10 | James R. Braig | Method for adjusting a blood analyte measurement |
| US7027848B2 (en) | 2002-04-04 | 2006-04-11 | Inlight Solutions, Inc. | Apparatus and method for non-invasive spectroscopic measurement of analytes in tissue using a matched reference analyte |
| US6654125B2 (en) | 2002-04-04 | 2003-11-25 | Inlight Solutions, Inc | Method and apparatus for optical spectroscopy incorporating a vertical cavity surface emitting laser (VCSEL) as an interferometer reference |
| WO2004010844A2 (en) | 2002-07-26 | 2004-02-05 | Cas Medical Systems, Inc. | Method for spectrophotometric blood oxygenation monitoring |
| US7620212B1 (en) | 2002-08-13 | 2009-11-17 | Lumidigm, Inc. | Electro-optical sensor |
| US20040064169A1 (en)* | 2002-09-30 | 2004-04-01 | Briscoe Kathleen E. | User interface for medical device |
| US7179279B2 (en) | 2002-09-30 | 2007-02-20 | Medtronic Physio Control Corp. | Rapid induction of mild hypothermia |
| US7087075B2 (en)* | 2002-09-30 | 2006-08-08 | Medtronic Emergency Response Systems, Inc. | Feedback system for rapid induction of mild hypothermia |
| US7248912B2 (en)* | 2002-10-31 | 2007-07-24 | The Regents Of The University Of California | Tissue implantable sensors for measurement of blood solutes |
| US7056282B2 (en)* | 2002-12-23 | 2006-06-06 | Medtronic Emergency Response Systems, Inc. | Coolant control for rapid induction of mild hypothermia |
| US7006856B2 (en)* | 2003-01-10 | 2006-02-28 | Nellcor Puritan Bennett Incorporated | Signal quality metrics design for qualifying data for a physiological monitor |
| US20050033127A1 (en)* | 2003-01-30 | 2005-02-10 | Euro-Celtique, S.A. | Wireless blood glucose monitoring system |
| US6836678B2 (en)* | 2003-02-13 | 2004-12-28 | Xiang Zheng Tu | Non-invasive blood glucose monitor |
| US7720525B2 (en)* | 2003-03-12 | 2010-05-18 | New Art Advanced Research Technologies Inc. | Method and apparatus for combining continuous wave and time domain optical imaging |
| US7668350B2 (en) | 2003-04-04 | 2010-02-23 | Lumidigm, Inc. | Comparative texture analysis of tissue for biometric spoof detection |
| US7539330B2 (en) | 2004-06-01 | 2009-05-26 | Lumidigm, Inc. | Multispectral liveness determination |
| US7627151B2 (en) | 2003-04-04 | 2009-12-01 | Lumidigm, Inc. | Systems and methods for improved biometric feature definition |
| US7751594B2 (en) | 2003-04-04 | 2010-07-06 | Lumidigm, Inc. | White-light spectral biometric sensors |
| CA2521304A1 (en) | 2003-04-04 | 2004-10-21 | Lumidigm, Inc. | Multispectral biometric sensor |
| US7347365B2 (en) | 2003-04-04 | 2008-03-25 | Lumidigm, Inc. | Combined total-internal-reflectance and tissue imaging systems and methods |
| US7545963B2 (en) | 2003-04-04 | 2009-06-09 | Lumidigm, Inc. | Texture-biometrics sensor |
| US7394919B2 (en) | 2004-06-01 | 2008-07-01 | Lumidigm, Inc. | Multispectral biometric imaging |
| US7460696B2 (en) | 2004-06-01 | 2008-12-02 | Lumidigm, Inc. | Multispectral imaging biometrics |
| US20050027173A1 (en)* | 2003-07-31 | 2005-02-03 | Briscoe Kathleen E. | Brain injury protocols |
| US20050073690A1 (en)* | 2003-10-03 | 2005-04-07 | Abbink Russell E. | Optical spectroscopy incorporating a vertical cavity surface emitting laser (VCSEL) |
| US7263213B2 (en) | 2003-12-11 | 2007-08-28 | Lumidigm, Inc. | Methods and systems for estimation of personal characteristics from biometric measurements |
| US8229185B2 (en) | 2004-06-01 | 2012-07-24 | Lumidigm, Inc. | Hygienic biometric sensors |
| US7508965B2 (en) | 2004-06-01 | 2009-03-24 | Lumidigm, Inc. | System and method for robust fingerprint acquisition |
| US7623988B2 (en)* | 2004-06-23 | 2009-11-24 | Cybiocare Inc. | Method and apparatus for the monitoring of clinical states |
| US8787630B2 (en) | 2004-08-11 | 2014-07-22 | Lumidigm, Inc. | Multispectral barcode imaging |
| US7801338B2 (en) | 2005-04-27 | 2010-09-21 | Lumidigm, Inc. | Multispectral biometric sensors |
| WO2007100677A2 (en) | 2006-02-22 | 2007-09-07 | Vivum Nexus Llc | Method and device for analyte measurement |
| JP4559995B2 (en)* | 2006-03-30 | 2010-10-13 | 株式会社東芝 | Tumor testing device |
| CN103336941A (en) | 2006-07-19 | 2013-10-02 | 光谱辨识公司 | Multibiometric multispectral imager |
| US8175346B2 (en) | 2006-07-19 | 2012-05-08 | Lumidigm, Inc. | Whole-hand multispectral biometric imaging |
| US8355545B2 (en) | 2007-04-10 | 2013-01-15 | Lumidigm, Inc. | Biometric detection using spatial, temporal, and/or spectral techniques |
| US7995808B2 (en) | 2006-07-19 | 2011-08-09 | Lumidigm, Inc. | Contactless multispectral biometric capture |
| US7804984B2 (en) | 2006-07-31 | 2010-09-28 | Lumidigm, Inc. | Spatial-spectral fingerprint spoof detection |
| US7801339B2 (en) | 2006-07-31 | 2010-09-21 | Lumidigm, Inc. | Biometrics with spatiospectral spoof detection |
| WO2008052070A2 (en)* | 2006-10-25 | 2008-05-02 | University Of Denver | Brain imaging system and methods for direct prosthesis control |
| US8285010B2 (en) | 2007-03-21 | 2012-10-09 | Lumidigm, Inc. | Biometrics based on locally consistent features |
| GB0803272D0 (en)* | 2008-02-22 | 2008-04-02 | Smith & Nephew | Ultrasound and tissue repair |
| US8583565B2 (en)* | 2009-08-03 | 2013-11-12 | Colorado Seminary, Which Owns And Operates The University Of Denver | Brain imaging system and methods for direct prosthesis control |
| US8872908B2 (en) | 2009-08-26 | 2014-10-28 | Lumidigm, Inc | Dual-imager biometric sensor |
| US8369932B2 (en)* | 2010-01-29 | 2013-02-05 | Medtronic Ablation Frontiers Llc | Optical methods of identifying the location of a medical device within a patient's body in order to locate the fossa ovalis for trans-septal procedures |
| US8570149B2 (en) | 2010-03-16 | 2013-10-29 | Lumidigm, Inc. | Biometric imaging using an optical adaptive interface |
| US7884933B1 (en)* | 2010-05-05 | 2011-02-08 | Revolutionary Business Concepts, Inc. | Apparatus and method for determining analyte concentrations |
| KR20140082642A (en) | 2011-07-26 | 2014-07-02 | 글리젠스 인코포레이티드 | Tissue implantable sensor with hermetically sealed housing |
| US10561353B2 (en) | 2016-06-01 | 2020-02-18 | Glysens Incorporated | Biocompatible implantable sensor apparatus and methods |
| US10660550B2 (en) | 2015-12-29 | 2020-05-26 | Glysens Incorporated | Implantable sensor apparatus and methods |
| US10638962B2 (en) | 2016-06-29 | 2020-05-05 | Glysens Incorporated | Bio-adaptable implantable sensor apparatus and methods |
| US10638979B2 (en) | 2017-07-10 | 2020-05-05 | Glysens Incorporated | Analyte sensor data evaluation and error reduction apparatus and methods |
| US11278668B2 (en) | 2017-12-22 | 2022-03-22 | Glysens Incorporated | Analyte sensor and medicant delivery data evaluation and error reduction apparatus and methods |
| US11255839B2 (en) | 2018-01-04 | 2022-02-22 | Glysens Incorporated | Apparatus and methods for analyte sensor mismatch correction |
Family Cites Families (31)
| Publication number | Priority date | Publication date | Assignee | Title |
|---|---|---|---|---|
| US4014321A (en)* | 1974-11-25 | 1977-03-29 | March Wayne F | Non-invasive glucose sensor system |
| US3958560A (en)* | 1974-11-25 | 1976-05-25 | Wayne Front March | Non-invasive automatic glucose sensor system |
| US4029085A (en)* | 1976-03-26 | 1977-06-14 | Purdue Research Foundation | Method for determining bilirubin concentration from skin reflectance |
| US4281645A (en)* | 1977-06-28 | 1981-08-04 | Duke University, Inc. | Method and apparatus for monitoring metabolism in body organs |
| US4576173A (en)* | 1982-06-28 | 1986-03-18 | The Johns Hopkins University | Electro-optical device and method for monitoring instanteous singlet oxygen concentration produced during photoradiation using a CW excitation source |
| EP0102816A3 (en)* | 1982-09-02 | 1985-08-28 | Nellcor Incorporated | Pulse oximeter |
| US4700708A (en)* | 1982-09-02 | 1987-10-20 | Nellcor Incorporated | Calibrated optical oximeter probe |
| US4714341A (en)* | 1984-02-23 | 1987-12-22 | Minolta Camera Kabushiki Kaisha | Multi-wavelength oximeter having a means for disregarding a poor signal |
| US4655225A (en)* | 1985-04-18 | 1987-04-07 | Kurabo Industries Ltd. | Spectrophotometric method and apparatus for the non-invasive |
| JPS6323645A (en)* | 1986-05-27 | 1988-01-30 | 住友電気工業株式会社 | Reflection heating type oxymeter |
| US4800495A (en)* | 1986-08-18 | 1989-01-24 | Physio-Control Corporation | Method and apparatus for processing signals used in oximetry |
| US4880304A (en)* | 1987-04-01 | 1989-11-14 | Nippon Colin Co., Ltd. | Optical sensor for pulse oximeter |
| US4773422A (en)* | 1987-04-30 | 1988-09-27 | Nonin Medical, Inc. | Single channel pulse oximeter |
| JPS63277039A (en)* | 1987-05-08 | 1988-11-15 | Hamamatsu Photonics Kk | Diagnostic apparatus |
| US4836207A (en)* | 1987-09-09 | 1989-06-06 | The Beth Israel Hospital Association | Method and apparatus to monitor cholesterol levels with photon correlation spectroscopy |
| US4800885A (en)* | 1987-12-02 | 1989-01-31 | The Boc Group, Inc. | Blood constituent monitoring apparatus and methods with frequency division multiplexing |
| US4846183A (en)* | 1987-12-02 | 1989-07-11 | The Boc Group, Inc. | Blood parameter monitoring apparatus and methods |
| US4869254A (en)* | 1988-03-30 | 1989-09-26 | Nellcor Incorporated | Method and apparatus for calculating arterial oxygen saturation |
| US4972331A (en)* | 1989-02-06 | 1990-11-20 | Nim, Inc. | Phase modulated spectrophotometry |
| JPH06103257B2 (en)* | 1988-12-19 | 1994-12-14 | 大塚電子株式会社 | Method and apparatus for measuring absorption coefficient of substance using light scattering |
| US5119815A (en)* | 1988-12-21 | 1992-06-09 | Nim, Incorporated | Apparatus for determining the concentration of a tissue pigment of known absorbance, in vivo, using the decay characteristics of scintered electromagnetic radiation |
| US5178142A (en)* | 1989-05-23 | 1993-01-12 | Vivascan Corporation | Electromagnetic method and apparatus to measure constituents of human or animal tissue |
| US5183042A (en)* | 1989-05-23 | 1993-02-02 | Vivascan Corporation | Electromagnetic method and apparatus to measure constituents of human or animal tissue |
| US4975581A (en)* | 1989-06-21 | 1990-12-04 | University Of New Mexico | Method of and apparatus for determining the similarity of a biological analyte from a model constructed from known biological fluids |
| DE69229554T2 (en)* | 1991-05-16 | 2000-02-10 | Non-Invasive Technology, Inc. | HEMOGLOBIN MEASUREMENT FOR DETERMINING THE METABOLISM SIZE OF A PERSON |
| US5277181A (en)* | 1991-12-12 | 1994-01-11 | Vivascan Corporation | Noninvasive measurement of hematocrit and hemoglobin content by differential optical analysis |
| IL107396A (en)* | 1992-11-09 | 1997-02-18 | Boehringer Mannheim Gmbh | Method and apparatus for analytical determination of glucose in a biological matrix |
| DE4337570A1 (en)* | 1993-11-04 | 1995-05-11 | Boehringer Mannheim Gmbh | Method for the analysis of glucose in a biological matrix |
| US5497769A (en)* | 1993-12-16 | 1996-03-12 | I.S.S. (Usa) Inc. | Photosensor with multiple light sources |
| US5492118A (en)* | 1993-12-16 | 1996-02-20 | Board Of Trustees Of The University Of Illinois | Determining material concentrations in tissues |
| DE4417639A1 (en)* | 1994-05-19 | 1995-11-23 | Boehringer Mannheim Gmbh | Analysis of concns. of substances in a biological sample |
- 1994
- 1994-12-02USUS08/349,839patent/US5782755A/ennot_activeExpired - Lifetime
- 1995
- 1995-12-04CNCN95196574Apatent/CN1172419A/enactivePending
- 1995-12-04EPEP95942531Apatent/EP0797404A4/ennot_activeWithdrawn
- 1995-12-04JPJP8519107Apatent/JPH10511568A/enactivePending
- 1995-12-04CACA2206580Apatent/CA2206580C/ennot_activeExpired - Fee Related
- 1995-12-04WOPCT/US1995/015666patent/WO1996016592A1/ennot_activeApplication Discontinuation
Cited By (1)
| Publication number | Priority date | Publication date | Assignee | Title |
|---|---|---|---|---|
| CN100403985C (en)* | 2004-04-09 | 2008-07-23 | 清华大学 | Digital near-infrared diffuse tomography system |
Also Published As
| Publication number | Publication date |
|---|---|
| CA2206580A1 (en) | 1996-06-06 |
| US5782755A (en) | 1998-07-21 |
| CA2206580C (en) | 2011-02-22 |
| WO1996016592A1 (en) | 1996-06-06 |
| JPH10511568A (en) | 1998-11-10 |
| EP0797404A1 (en) | 1997-10-01 |
| EP0797404A4 (en) | 1998-07-15 |
Similar Documents
| Publication | Publication Date | Title |
|---|---|---|
| CN1172419A (en) | Method and system of monitoring one or more solutes in biological system using optical techniques | |
| US6957094B2 (en) | Examination of scattering properties of biological tissue | |
| US6662030B2 (en) | Non-invasive sensor having controllable temperature feature | |
| Larin et al. | Specificity of noninvasive blood glucose sensing using optical coherence tomography technique: a pilot study | |
| US6725073B1 (en) | Methods for noninvasive analyte sensing | |
| US6353226B1 (en) | Non-invasive sensor capable of determining optical parameters in a sample having multiple layers | |
| JP4638055B2 (en) | Non-invasive measurement of analyte concentration in biological samples | |
| JP4688402B2 (en) | Noninvasive determination of analyte concentration by compensation of tissue hydration effects. | |
| Ciudin et al. | Non-invasive methods of glucose measurement: current status and future perspectives | |
| Vo-Dinh | Biomedical Photonics | |
| JP4559995B2 (en) | Tumor testing device | |
| US9259486B2 (en) | Method and system for calculating a quantification indicator for quantifying a dermal reaction on the skin of a living being | |
| CN1313051C (en) | Method and apparatus for noninvasively measuring a concentration of a blood component | |
| WO2009059433A1 (en) | Quantification of an absorber through a scattering medium | |
| Poddar et al. | Non-invasive glucose monitoring techniques: A review and current trends | |
| Pleitez et al. | Infrared reflectometry of skin: Analysis of backscattered light from different skin layers | |
| US20090117606A1 (en) | Measuring Nanoparticle Concentrations in Tissue Using Diffuse Optical Spectroscopy | |
| JP2010172200A (en) | Rough skin model using dry skin, and method for evaluating medicine for enhancing horny cell layer transparency with the same | |
| JP2006087913A (en) | Method of preparing calibration curve for quantitatively analyzing in-vivo component and quantitative analyzer using calibration curve | |
| Kashyap | Development of a broadband multi-channel NIRS system for quantifying absolute concentrations of hemoglobin derivatives and reduced scattering coefficients | |
| Kanawade et al. | Monitoring of epithelial capillary density | |
| Maffeis et al. | Addressing the need for non-invasive lung assessment with time-resolved diffuse optics | |
| KURORTOLOGII et al. | COMPARATIVE STUDY OF OPTICAL PROPERTIES OF BIOLOGICAL TISSUES EXPOSED TO HELIUM-NEON AND HELIUM-CADMIUM LASERS | |
| Yang et al. | Effect of skin and fat layers on the spatial sensitivity profile of continuous wave diffuse reflectance near-infrared spectra | |
| Larin et al. | Specificity of noninvasive blood glucose monitoring with optical coherence tomography |
Legal Events
| Date | Code | Title | Description |
|---|---|---|---|
| C06 | Publication | ||
| PB01 | Publication | ||
| C10 | Entry into substantive examination | ||
| SE01 | Entry into force of request for substantive examination | ||
| C12 | Rejection of a patent application after its publication | ||
| RJ01 | Rejection of invention patent application after publication | Application publication date:19980204 |