CN116244774A - Visual design method of smart city energy management system based on digital twinning - Google Patents
Visual design method of smart city energy management system based on digital twinningDownload PDFInfo
- Publication number
- CN116244774A CN116244774ACN202211619445.9ACN202211619445ACN116244774ACN 116244774 ACN116244774 ACN 116244774ACN 202211619445 ACN202211619445 ACN 202211619445ACN 116244774 ACN116244774 ACN 116244774A
- Authority
- CN
- China
- Prior art keywords
- management system
- energy
- visual design
- energy management
- water
- Prior art date
- Legal status (The legal status is an assumption and is not a legal conclusion. Google has not performed a legal analysis and makes no representation as to the accuracy of the status listed.)
- Pending
Links
Images


Classifications
- G—PHYSICS
- G06—COMPUTING OR CALCULATING; COUNTING
- G06F—ELECTRIC DIGITAL DATA PROCESSING
- G06F30/00—Computer-aided design [CAD]
- G06F30/10—Geometric CAD
- G06F30/12—Geometric CAD characterised by design entry means specially adapted for CAD, e.g. graphical user interfaces [GUI] specially adapted for CAD
- G—PHYSICS
- G06—COMPUTING OR CALCULATING; COUNTING
- G06Q—INFORMATION AND COMMUNICATION TECHNOLOGY [ICT] SPECIALLY ADAPTED FOR ADMINISTRATIVE, COMMERCIAL, FINANCIAL, MANAGERIAL OR SUPERVISORY PURPOSES; SYSTEMS OR METHODS SPECIALLY ADAPTED FOR ADMINISTRATIVE, COMMERCIAL, FINANCIAL, MANAGERIAL OR SUPERVISORY PURPOSES, NOT OTHERWISE PROVIDED FOR
- G06Q50/00—Information and communication technology [ICT] specially adapted for implementation of business processes of specific business sectors, e.g. utilities or tourism
- G06Q50/06—Energy or water supply
- G—PHYSICS
- G06—COMPUTING OR CALCULATING; COUNTING
- G06F—ELECTRIC DIGITAL DATA PROCESSING
- G06F2111/00—Details relating to CAD techniques
- G06F2111/08—Probabilistic or stochastic CAD
- G—PHYSICS
- G06—COMPUTING OR CALCULATING; COUNTING
- G06F—ELECTRIC DIGITAL DATA PROCESSING
- G06F2113/00—Details relating to the application field
- G06F2113/04—Power grid distribution networks
- G—PHYSICS
- G06—COMPUTING OR CALCULATING; COUNTING
- G06F—ELECTRIC DIGITAL DATA PROCESSING
- G06F2119/00—Details relating to the type or aim of the analysis or the optimisation
- G06F2119/06—Power analysis or power optimisation
- G—PHYSICS
- G06—COMPUTING OR CALCULATING; COUNTING
- G06F—ELECTRIC DIGITAL DATA PROCESSING
- G06F2119/00—Details relating to the type or aim of the analysis or the optimisation
- G06F2119/14—Force analysis or force optimisation, e.g. static or dynamic forces
Landscapes
- Engineering & Computer Science (AREA)
- Physics & Mathematics (AREA)
- Geometry (AREA)
- Business, Economics & Management (AREA)
- General Physics & Mathematics (AREA)
- Theoretical Computer Science (AREA)
- Economics (AREA)
- Health & Medical Sciences (AREA)
- General Engineering & Computer Science (AREA)
- Public Health (AREA)
- Computer Hardware Design (AREA)
- Evolutionary Computation (AREA)
- Mathematical Optimization (AREA)
- Mathematical Analysis (AREA)
- Computational Mathematics (AREA)
- Human Computer Interaction (AREA)
- Architecture (AREA)
- Pure & Applied Mathematics (AREA)
- Water Supply & Treatment (AREA)
- General Health & Medical Sciences (AREA)
- Human Resources & Organizations (AREA)
- Marketing (AREA)
- Primary Health Care (AREA)
- Strategic Management (AREA)
- Tourism & Hospitality (AREA)
- General Business, Economics & Management (AREA)
- Management, Administration, Business Operations System, And Electronic Commerce (AREA)
Abstract
Description
Translated fromChinese技术领域technical field
本发明属于物联网、数字孪生、大数据时代、智慧城市等技术领域,特别涉及一种基于数字孪生的智慧城市能源管理系统可视化设计方法。The invention belongs to the technical fields of the Internet of Things, digital twins, the era of big data, smart cities, etc., and in particular relates to a visual design method of a smart city energy management system based on digital twins.
背景技术Background technique
现阶段,随着数字经济的快速发展、数字孪生智慧城市的建设、能源消费总量不断上升,资源需求持续增加,城市建筑能耗大,特别是城市大型公共建筑物的能耗在城市总能耗中占了较大比例,因此如何有效监控和分析建筑能耗,并对大型建筑进行智能化、节能化管理,减少日常运转的能源消耗,已成为各大城市主要关注点。At this stage, with the rapid development of the digital economy, the construction of digital twin smart cities, the total energy consumption continues to increase, and the demand for resources continues to increase. The energy consumption of urban buildings is large, especially the energy consumption of large public buildings in cities. Therefore, how to effectively monitor and analyze building energy consumption, and carry out intelligent and energy-saving management of large buildings to reduce energy consumption in daily operation has become the main focus of major cities.
目前,传统城市管理中的各个部件的运行还是依托于人力,通过各行各业的各司其职,以实现城市的能源平稳安全运行。即使个别行业以依托现代化信息技术,能够提高了能源的管理效率,但是仍存在能源管理方面效率低下的问题。At present, the operation of various components in traditional urban management still relies on manpower, and various industries perform their duties to achieve the smooth and safe operation of urban energy. Even though individual industries rely on modern information technology to improve energy management efficiency, there are still problems of low efficiency in energy management.
发明内容Contents of the invention
为了克服上述现有技术的不足,本发明的目的在于提供一种基于数字孪生的智慧城市能源管理系统可视化设计方法,本方法利用Hightopo软件通过智能化、可视化手段,进一步发挥能源优势,构建绿色制造体系,推动传统产业质量变革、效率变革、动力变革,为能源发展全局和绿色构造做出贡献。In order to overcome the deficiencies of the above-mentioned prior art, the purpose of the present invention is to provide a digital twin-based smart city energy management system visualization design method, this method utilizes Hightopo software to further exert energy advantages through intelligent and visualization means, and build green manufacturing system, promote the quality change, efficiency change, and power change of traditional industries, and contribute to the overall energy development and green structure.
为了实现上述目的,本发明采用的技术方案是:一种基于数字孪生的智慧城市能源管理系统可视化设计方法,包括以下步骤:In order to achieve the above object, the technical solution adopted by the present invention is: a digital twin-based visual design method for smart city energy management system, comprising the following steps:
步骤1:能源管理系统主界面可视化设计;Step 1: Visual design of the main interface of the energy management system;
步骤2:能源管理系统环境数据可视化设计;Step 2: Visual design of energy management system environmental data;
步骤3:能源管理系统能耗信息可视化设计;Step 3: Visual design of energy consumption information of energy management system;
步骤4:能源管理系统供水设备可视化设计;Step 4: Visual design of energy management system water supply equipment;
步骤5:能源管理系统供电设备可视化设计;Step 5: Visual design of energy management system power supply equipment;
步骤6:能源管理系统光伏储能系统及信息可视化设计;Step 6: Energy management system photovoltaic energy storage system and information visualization design;
步骤7:能源管理系统光伏发电流程可视化设计;Step 7: Visual design of energy management system photovoltaic power generation process;
步骤8:能源管理系统配电室可视化设计;Step 8: Visual design of power distribution room of energy management system;
步骤9:能源管理系统供水系统及泵房可视化设计;Step 9: Visual design of energy management system water supply system and pump room;
步骤10:本发明通过Hightopo应用软件可视化,利用二维、三维等可视化手段对城市用能情况进行及时跟踪和有效管理,实现了对能源的集中监控、管理以及分散控制。Step 10: The present invention uses hightopo application software visualization, and uses two-dimensional, three-dimensional and other visualization means to track and effectively manage urban energy consumption, and realizes centralized monitoring, management and decentralized control of energy.
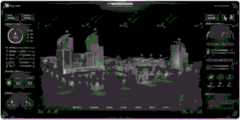
所述步骤1中能源管理系统主界面可视化设计包括:能源介质以两种方式向用户展示当前介质消耗情况,一种以系统方式划分,一种以空间方式划分,用户再次点击,则分别展示各子系统用能或各设备用能情况。The visual design of the main interface of the energy management system in
所述步骤2中能源管理系统环境数据可视化设计主要利用无线传感器收集环境变量,包括室内外温度、湿度、CO2 浓度、VOC 浓度、PM2.5 浓度等,并根据天气分类,实现在不同环境中的自我更新,得出光伏发电、风能发电等储能优化设计方案。The environmental data visualization design of the energy management system in step 2 mainly uses wireless sensors to collect environmental variables, including indoor and outdoor temperature, humidity, CO2 concentration, VOC concentration, PM2.5 concentration, etc. Self-renewal, and obtain optimal design schemes for energy storage such as photovoltaic power generation and wind power generation.
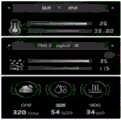
所述步骤3中能源管理系统能耗信息可视化设计包括:左侧 2D 可视化面板展示关键指标,通过对空调、照明以及特殊渠道的用电统计,对接后台数据实时更新,监测建筑能耗,同时展示对节能减排做出的贡献统计,并基于数据库,给出各类分析报告,为节能优化改造提供可靠依据。The visualization design of the energy consumption information of the energy management system in step 3 includes: displaying key indicators on the left 2D visualization panel, and real-time updating of background data through statistics on air conditioning, lighting, and special channels, monitoring building energy consumption, and displaying at the same time Contribution statistics to energy conservation and emission reduction, and based on the database, various analysis reports are given to provide a reliable basis for energy conservation optimization and transformation.
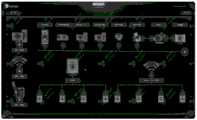
所述步骤4中能源管理系统供水设备可视化设计包括:核心系统通过后台数据接口,实现自动上下架设备,对供、排水系统中所有管线、设备与构筑物进行智能控制管理,并结合 2D 视图进行关键信息查看,全面掌握水务系统设备的运行情况,包括各楼层无线水表、LORA 开关、能效管理平台,保证供水系统安全高效运行。The visual design of water supply equipment of the energy management system in step 4 includes: the core system realizes automatic loading and unloading of equipment through the background data interface, intelligent control and management of all pipelines, equipment and structures in the water supply and drainage system, and combined with 2D view to carry out key View information to fully grasp the operation of water system equipment, including wireless water meters on each floor, LORA switches, and energy efficiency management platforms to ensure safe and efficient operation of the water supply system.
所述步骤5中能源管理系统供电设备可视化设计包括:通过二三维可视化引擎,对楼宇供电系统进行智能化改造,形成一个自我管理的体系,做到每一处细节均可实时交互与反馈,包含传感器、智能物联网 GPRS/4G/NB-LOT、大数据系统平台设备信息,实现甚至手机端都可随时随地查看的 2D 组态效果。通过搜集相关国家省、市用电限额标准,对全面数据进行汇总,对于超限电状态设备进行实时预警。The visualization design of the power supply equipment of the energy management system in step 5 includes: through the 2D and 3D visualization engine, intelligently transform the power supply system of the building to form a self-management system, so that every detail can be interacted and fed back in real time, including Sensors, intelligent Internet of Things GPRS/4G/NB-LOT, and big data system platform equipment information realize the 2D configuration effect that can be viewed anytime and anywhere even on the mobile phone. By collecting relevant national provincial and municipal electricity quota standards, the comprehensive data is summarized, and real-time warnings are given for devices in the state of exceeding the power limit.
所述步骤6中能源管理系统光伏储能系统及信息可视化设计包括:光伏储能在实际运行过程中容易受到天气、温度、湿度等多重因素的影响,导致光伏功率的间歇性和电网功率的随机波动。Hightopo 通过卫星影像图、无人机遥感影像图、现场取景的方式,进行场景搭建,数字孪生多环境场景下的光伏储能系统,融合储能设备,与环境数据、TN-S 供电系统数据对接,从而给负荷提供持续稳定的功率补给,提高系统工作效率与供电可靠性;储能信息可视化场景以科幻线框设计风格展示,突出储能设备模型,监测各楼层运行的储能设备以及实时功率,结合后台数据的实时更新,形成知识库,需要时释放储存能量。The photovoltaic energy storage system and information visualization design of the energy management system in step 6 includes: photovoltaic energy storage is easily affected by multiple factors such as weather, temperature, and humidity during actual operation, resulting in intermittent photovoltaic power and random grid power. fluctuation. Hightopo uses satellite imagery, UAV remote sensing imagery, and on-site viewfinding to build scenes, digital twin photovoltaic energy storage systems in multi-environmental scenarios, integrate energy storage devices, and connect with environmental data and TN-S power supply system data , so as to provide continuous and stable power supply to the load, improve system work efficiency and power supply reliability; the energy storage information visualization scene is displayed in a sci-fi wireframe design style, highlighting the energy storage equipment model, and monitoring the energy storage equipment operating on each floor and real-time power , Combined with the real-time update of background data, a knowledge base is formed, and the stored energy is released when needed.
所述步骤7中能源管理系统光伏发电流程可视化设计包括:利用HT支持2D轻量化模型搭建的光伏储能监测场景,结合光伏发电原理与储能模型,对太阳电池板(组件)、控制器和逆变器三大部分以逻辑图形式呈现,帮助管理人员理清光伏发电运作脉络,从而对输出能量平衡调节,全面分析,保障光伏供电可靠性,提升阴雨天停电事故的应急效率。The visual design of the photovoltaic power generation process of the energy management system in step 7 includes: using HT to support the photovoltaic energy storage monitoring scene built by the 2D lightweight model, combining the principle of photovoltaic power generation and the energy storage model, and analyzing the solar panels (components), controllers and The three parts of the inverter are presented in the form of logic diagrams, which help managers to clarify the operation context of photovoltaic power generation, so as to adjust and comprehensively analyze the output energy balance, ensure the reliability of photovoltaic power supply, and improve the emergency efficiency of power outages in rainy days.
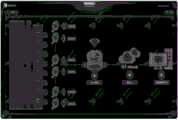
所述步骤8中能源管理系统配电室可视化设计包括:配电室是指带有低压负荷的室内配电场所,主要为低压用户配送电能,设有中压进线、配电变压器和低压配电装置,根据楼宇现场的鸟瞰图、CAD 图、设备三维视图等资料对地下配电室外观进行高度还原建模,通过 HT 实现可交互的三维场景,配电室各设备可以响应交互事件,当有跳闸、短路、漏电等情况发生时,可及时发出报警信号,监管人员可实时发现,实时检修,预防火灾等安全事故发生,保障系统功能的正常运行与系统安全。The visual design of the power distribution room of the energy management system in step 8 includes: the power distribution room refers to an indoor power distribution place with low-voltage loads, which mainly distributes power for low-voltage users, and is equipped with medium-voltage incoming lines, distribution transformers and low-voltage distribution According to the bird's-eye view, CAD drawing, equipment three-dimensional view and other data of the building site, the appearance of the underground power distribution room is highly restored and modeled, and the interactive three-dimensional scene is realized through HT. The equipment in the power distribution room can respond to interactive events. When tripping, short circuit, leakage, etc. occur, an alarm signal can be sent out in time, and supervisors can discover and repair in real time, prevent fire and other safety accidents, and ensure the normal operation and safety of the system function.
所述步骤9中能源管理系统供水系统及泵房可视化设计包括:供水系统是指按一定质量要求供给不同的用水部门所需的蓄水库、水泵、管道和其它工程的综合体,系统采用模块化思想,并具有统一的、全面的地址空间模型和信息模型;供水泵房可视化为可将CAD图纸导入HT系统,快速搭建三维场景,等比例还原二次供水泵房,实现对供水流量、水泵频率、进出口压力以及水质的浊度、pH 值、余氯等统一管理,满足了用户对水质、水量和水压的需求,解决供水系统在实际运行中由于需水量变化、事故停泵等问题,保证各个用户的正常用水。The visual design of the water supply system of the energy management system and the pump room in the step 9 includes: the water supply system refers to a complex of reservoirs, water pumps, pipelines and other projects that are required by different water departments according to certain quality requirements, and the system uses modules It has a unified and comprehensive address space model and information model; the water supply pump room can be visualized to import CAD drawings into the HT system, quickly build a 3D scene, and restore the secondary water supply pump room in equal proportions to realize the control of water supply flow and water pumps. Unified management of frequency, inlet and outlet pressure, water quality turbidity, pH value, residual chlorine, etc., meets the user's needs for water quality, water volume and water pressure, and solves problems such as changes in water demand and accidental shutdown of the water supply system during actual operation , to ensure the normal water use of each user.
所述步骤10本发明通过Hightopo应用软件可视化,利用二维、三维等可视化手段对城市用能情况进行及时跟踪和有效管理,实现了对能源的集中监控、管理以及分散控制。The
与传统技术相比,本发明具备以下有益效果:Compared with the traditional technology, the present invention has the following beneficial effects:
本发明基于Hightopo软件通过智能化、可视化手段,搭建了轻量化的建筑全集成能源可视化管理系统,通过二维、三维等可视化的手段对城市建筑用能情况进行及时跟踪和有效管理,提升节能工作的管理水平,达到节约能源、供需互动的多种能源耦合目的,实现了对能源的集中监控、管理以及分散控制;本方法能够进一步发挥能源优势,构建绿色制造体系,推动传统产业质量变革、效率变革、动力变革,为能源发展全局和绿色构造做出贡献。Based on Hightopo software, the present invention builds a lightweight building fully integrated energy visualization management system through intelligent and visual means, and tracks and effectively manages the energy consumption of urban buildings through two-dimensional, three-dimensional and other visual means to improve energy conservation. The management level achieves energy saving, supply and demand interaction of various energy coupling purposes, and realizes centralized monitoring, management and decentralized control of energy; this method can further exert energy advantages, build a green manufacturing system, and promote traditional industry quality change and efficiency. Changes, power changes, and contribute to the overall development of energy and green structures.
附图说明Description of drawings
图1是本发明实施例提供的流程图。Fig. 1 is a flowchart provided by an embodiment of the present invention.
图2是本发明的主界面可视化设计图。Fig. 2 is a visual design diagram of the main interface of the present invention.
图3是本发明的环境数据可视化设计图。Fig. 3 is a visual design diagram of environmental data of the present invention.
图4是本发明的能耗信息可视化设计图。Fig. 4 is a visual design diagram of energy consumption information of the present invention.
图5是本发明的供水设备可视化设计图。Fig. 5 is a visual design diagram of the water supply equipment of the present invention.
图6是本发明的供电设备可视化设计图。Fig. 6 is a visual design diagram of the power supply equipment of the present invention.
图7是本发明的储能信息可视化设计图。Fig. 7 is a visual design diagram of the energy storage information of the present invention.
图8是本发明的光伏发电流程可视化设计图。Fig. 8 is a visual design diagram of the photovoltaic power generation process of the present invention.
图9是本发明的配电室可视化设计图。Fig. 9 is a visual design diagram of the power distribution room of the present invention.
图10是本发明的供水泵房可视化设计图。Fig. 10 is a visual design diagram of the water supply pump room of the present invention.
具体实施方式Detailed ways
为了使本发明的目的、技术方案及优点更加清楚明白,以下通过实施案例,并结合附图,对本发明的一种基于数字孪生的智慧城市能源管理系统可视化设计方法进行进一步详细说明。In order to make the purpose, technical solution and advantages of the present invention clearer, a digital twin-based visual design method for a smart city energy management system of the present invention will be further described in detail through an implementation case and in conjunction with the accompanying drawings.
图1是一种基于数字孪生的智慧城市能源管理系统可视化设计方法流程图,主要包括以下步骤:Figure 1 is a flow chart of a visual design method for smart city energy management systems based on digital twins, which mainly includes the following steps:
1)步骤1:能源管理系统主界面可视化设计;1) Step 1: Visual design of the main interface of the energy management system;
2)步骤2:能源管理系统环境数据可视化设计;2) Step 2: Visual design of energy management system environmental data;
3)步骤3:能源管理系统能耗信息可视化设计;3) Step 3: Visual design of energy consumption information of the energy management system;
4)步骤4:能源管理系统供水设备可视化设计;4) Step 4: Visual design of energy management system water supply equipment;
5)步骤5:能源管理系统供电设备可视化设计;5) Step 5: Visual design of energy management system power supply equipment;
6)步骤6:能源管理系统光伏储能系统及信息可视化设计;6) Step 6: Energy management system photovoltaic energy storage system and information visualization design;
7)步骤7:能源管理系统光伏发电流程可视化设计;7) Step 7: Visual design of energy management system photovoltaic power generation process;
8)步骤8:能源管理系统配电室可视化设计;8) Step 8: Visual design of power distribution room of energy management system;
9)步骤9:能源管理系统供水系统及泵房可视化设计;9) Step 9: Visual design of energy management system water supply system and pump room;
10)步骤10:本发明通过Hightopo应用软件可视化,利用二维、三维等可视化手段对城市用能情况进行及时跟踪和有效管理,实现了对能源的集中监控、管理以及分散控制。10) Step 10: The present invention uses hightopo application software to visualize and use two-dimensional, three-dimensional and other visualization means to track and effectively manage urban energy consumption, and realize centralized monitoring, management and decentralized control of energy.
对步骤1-10做进一步阐述:Further elaboration on steps 1-10:
进一步所述步骤1中能源管理系统主界面可视化设计包括:能源介质以两种方式向用户展示当前介质消耗情况,一种以系统方式划分,一种以空间方式划分,用户再次点击,则分别展示各子系统用能或各设备用能主界面可视化设计(如图2所示)。Further, the visual design of the main interface of the energy management system in
进一步所述步骤2中能源管理系统环境数据可视化设计主要利用无线传感器收集环境变量,包括室内外温度、湿度、CO2 浓度、VOC 浓度、PM2.5 浓度等,并根据天气分类,实现在不同环境中的自我更新,得出光伏发电、风能发电等环境数据可视化设计(如图3所示)。Further, the environmental data visualization design of the energy management system in step 2 mainly uses wireless sensors to collect environmental variables, including indoor and outdoor temperature, humidity, CO2 concentration, VOC concentration, PM2.5 concentration, etc., and classifies them according to the weather to realize in different environments The self-renewal of photovoltaic power generation, wind power generation and other environmental data visualization design is obtained (as shown in Figure 3).
进一步所述步骤3中能源管理系统能耗信息可视化设计包括:左侧 2D 可视化面板展示关键指标,通过对空调、照明以及特殊渠道的用电统计,对接后台数据实时更新,监测建筑能耗,同时展示对节能减排做出的贡献统计,并基于数据库,给出各类分析报告,为节能优化改造提供可靠依据,最终得到如图4所示的能耗信息可视化设计展示面板。Further, the visual design of energy consumption information of the energy management system in step 3 includes: displaying key indicators on the left 2D visualization panel, and monitoring building energy consumption through real-time update of background data through statistics on air-conditioning, lighting and special channels, and monitoring building energy consumption. Display the statistics of contributions to energy conservation and emission reduction, and based on the database, give various analysis reports to provide a reliable basis for energy conservation optimization and transformation, and finally obtain the energy consumption information visualization design display panel shown in Figure 4.
进一步所述步骤4中能源管理系统供水设备可视化设计包括:核心系统通过后台数据接口,实现自动上下架设备,对供、排水系统中所有管线、设备与构筑物进行智能控制管理,并结合 2D 视图进行关键信息查看,全面掌握水务系统设备的运行情况,包括各楼层无线水表、LORA 开关、能效管理平台,保证供水系统安全高效运行,最终得到如图5所示供水设备可视化设计展示平台。Further, the visual design of the water supply equipment of the energy management system in step 4 includes: the core system realizes automatic loading and unloading of equipment through the background data interface, intelligently controls and manages all pipelines, equipment and structures in the water supply and drainage system, and combines 2D views to carry out View key information to fully understand the operation of water system equipment, including wireless water meters on each floor, LORA switches, and energy efficiency management platforms to ensure the safe and efficient operation of the water supply system. Finally, a visual design and display platform for water supply equipment is obtained as shown in Figure 5.
进一步所述步骤5中能源管理系统供电设备可视化设计包括:通过二三维可视化引擎,对楼宇供电系统进行智能化改造,形成一个自我管理的体系,做到每一处细节均可实时交互与反馈,包含传感器、智能物联网 GPRS/4G/NB-LOT、大数据系统平台设备信息,实现甚至手机端都可随时随地查看的 2D 组态效果。通过搜集相关国家省、市用电限额标准,对全面数据进行汇总,对于超限电状态设备进行实时预警,最终得到如图6所示供电设备可视化设计展示平台。Further, the visual design of the power supply equipment of the energy management system in step 5 includes: through the 2D and 3D visualization engine, intelligently transform the power supply system of the building to form a self-management system, so that every detail can be interacted and fed back in real time, Including sensors, intelligent Internet of Things GPRS/4G/NB-LOT, and big data system platform equipment information, it realizes the 2D configuration effect that can be viewed anytime and anywhere even on the mobile phone. By collecting relevant national provincial and municipal power consumption quota standards, the comprehensive data is summarized, and real-time warnings are given to the equipment in the state of exceeding the power limit, and finally the visual design and display platform for power supply equipment as shown in Figure 6 is obtained.
进一步所述步骤6中能源管理系统光伏储能系统及信息可视化设计包括:光伏储能在实际运行过程中容易受到天气、温度、湿度等多重因素的影响,导致光伏功率的间歇性和电网功率的随机波动。Hightopo 通过卫星影像图、无人机遥感影像图、现场取景的方式,进行场景搭建,数字孪生多环境场景下的光伏储能系统,融合储能设备,与环境数据、TN-S供电系统数据对接,从而给负荷提供持续稳定的功率补给,提高系统工作效率与供电可靠性;储能信息可视化场景以科幻线框设计风格展示,突出储能设备模型,监测各楼层运行的储能设备以及实时功率,结合后台数据的实时更新,形成知识库,需要时释放储存能量,最终得到如图7所示光伏储能及储能信息可视化设计展示平台。Further, the photovoltaic energy storage system and information visualization design of the energy management system in step 6 includes: photovoltaic energy storage is easily affected by multiple factors such as weather, temperature, and humidity during actual operation, resulting in intermittent photovoltaic power and grid power. random fluctuations. Hightopo uses satellite imagery, UAV remote sensing imagery, and on-site viewfinding to build scenes, digital twin photovoltaic energy storage systems in multi-environmental scenarios, integrate energy storage equipment, and connect with environmental data and TN-S power supply system data. , so as to provide continuous and stable power supply to the load, improve system work efficiency and power supply reliability; the energy storage information visualization scene is displayed in a sci-fi wireframe design style, highlighting the energy storage equipment model, and monitoring the energy storage equipment operating on each floor and real-time power , combined with the real-time update of background data to form a knowledge base, release stored energy when needed, and finally obtain a visual design display platform for photovoltaic energy storage and energy storage information as shown in Figure 7.
进一步所述步骤7中能源管理系统光伏发电流程可视化设计包括:利用HT支持2D轻量化模型搭建的光伏储能监测场景,结合光伏发电原理与储能模型,对太阳电池板(组件)、控制器和逆变器三大部分以逻辑图形式呈现,帮助管理人员理清光伏发电运作脉络,从而对输出能量平衡调节,全面分析,保障光伏供电可靠性,提升阴雨天停电事故的应急效率,最终得到如图8所示光伏发电流程可视化设计展示平台。Further, the visual design of the photovoltaic power generation process of the energy management system in step 7 includes: using the HT to support the 2D lightweight model to build the photovoltaic energy storage monitoring scene, combining the principle of photovoltaic power generation and the energy storage model, the solar panels (components), controllers And the three parts of the inverter are presented in the form of logic diagrams to help managers clarify the operation context of photovoltaic power generation, so as to balance and adjust the output energy, conduct a comprehensive analysis, ensure the reliability of photovoltaic power supply, and improve the emergency efficiency of power outages in rainy days. As shown in Figure 8, the visual design and display platform of photovoltaic power generation process.
进一步所述步骤8中能源管理系统配电室可视化设计包括:配电室是指带有低压负荷的室内配电场所,主要为低压用户配送电能,设有中压进线、配电变压器和低压配电装置,根据楼宇现场的鸟瞰图、CAD 图、设备三维视图等资料对地下配电室外观进行高度还原建模,通过 HT 实现可交互的三维场景,配电室各设备可以响应交互事件,当有跳闸、短路、漏电等情况发生时,可及时发出报警信号,监管人员可实时发现,实时检修,预防火灾等安全事故发生,保障系统功能的正常运行与系统安全,最终得到如图9所示配电可视化设计系统展示平台。Further, the visual design of the power distribution room of the energy management system in step 8 includes: the power distribution room refers to an indoor power distribution place with low-voltage loads, which mainly distributes power for low-voltage users, and is equipped with medium-voltage incoming lines, distribution transformers and low-voltage loads. Power distribution device, according to the bird's-eye view, CAD drawing, equipment three-dimensional view and other data of the building site, the appearance of the underground power distribution room is highly restored and modeled, and the interactive three-dimensional scene is realized through HT. The equipment in the power distribution room can respond to interactive events. When tripping, short circuit, leakage, etc. occur, an alarm signal can be sent in time, and supervisors can find out in real time, conduct real-time maintenance, prevent fire and other safety accidents, and ensure the normal operation and safety of the system function. Display platform for power distribution visualization design system.
进一步所述步骤9中能源管理系统供水系统及泵房可视化设计包括:供水系统是指按一定质量要求供给不同的用水部门所需的蓄水库、水泵、管道和其它工程的综合体,系统采用模块化思想,并具有统一的、全面的地址空间模型和信息模型;供水泵房可视化为可将CAD图纸导入HT系统,快速搭建三维场景,等比例还原二次供水泵房,实现对供水流量、水泵频率、进出口压力以及水质的浊度、pH 值、余氯等统一管理,满足了用户对水质、水量和水压的需求,解决供水系统在实际运行中由于需水量变化、事故停泵等问题,保证各个用户的正常用水,最终得到如图10所示供水系统及供水泵房可视化设计系统展示平台。Further, the visual design of the water supply system and pump room of the energy management system in step 9 includes: the water supply system refers to the complex of reservoirs, water pumps, pipelines and other projects required by different water departments according to certain quality requirements, and the system adopts Modular thinking, and has a unified and comprehensive address space model and information model; the water supply pump room can be visualized to import CAD drawings into the HT system, quickly build a 3D scene, restore the secondary water supply pump room in equal proportions, and realize the control of water supply flow, The unified management of water pump frequency, inlet and outlet pressure, water quality turbidity, pH value, residual chlorine, etc., meets the user's needs for water quality, water volume and water pressure, and solves the problem of water demand changes, accidental pump shutdown, etc. in the actual operation of the water supply system. The problem is to ensure the normal water consumption of each user, and finally obtain the visual design system display platform of the water supply system and water supply pump room as shown in Figure 10.
进一步所述步骤10中本发明通过Hightopo应用软件可视化,利用二维、三维等可视化手段对城市用能情况进行及时跟踪和有效管理,实现了对能源的集中监控、管理以及分散控制。Further, in
综上所述本发明基于Hightopo软件通过智能化、可视化手段,搭建了轻量化的建筑全集成能源可视化管理系统,通过二维、三维等可视化的手段对城市建筑用能情况进行及时跟踪和有效管理,提升节能工作的管理水平,达到节约能源、供需互动的多种能源耦合目的,实现了对能源的集中监控、管理以及分散控制;本方法能够进一步发挥能源优势,构建绿色制造体系,推动传统产业质量变革、效率变革、动力变革,为能源发展全局和绿色构造做出贡献。In summary, the present invention builds a lightweight building fully integrated energy visualization management system based on Hightopo software through intelligent and visual means, and tracks and effectively manages the energy consumption of urban buildings through two-dimensional, three-dimensional and other visual means. , improve the management level of energy saving work, achieve energy saving, supply and demand interaction of multiple energy coupling purposes, and realize centralized monitoring, management and decentralized control of energy; this method can further exert energy advantages, build a green manufacturing system, and promote traditional industries. Changes in quality, efficiency, and power will contribute to the overall development of energy and green structures.
对于本领域技术人员而言,显然本发明不限于上述示范性实施例的细节,而且在不背离本发明的精神或基本特征的情况下,能够以其他的具体形式实现本发明。因此,无论从什么角度来看,均应将实施例看作是示范性的,而且是非限制性的,本发明的范围由所附权利要求而不是上述说明限定,因此旨在将落在权利要求的等同要件的含义和范围内的所有变化囊括在本发明内。It will be apparent to those skilled in the art that the invention is not limited to the details of the above-described exemplary embodiments, but that the invention can be embodied in other specific forms without departing from the spirit or essential characteristics of the invention. Accordingly, the embodiments should be regarded in all respects as exemplary and not restrictive, the scope of the invention being defined by the appended claims rather than the foregoing description, and it is therefore intended that the scope of the invention be defined by the appended claims rather than by the foregoing description. All changes within the meaning and range of equivalents of the elements are embraced in the present invention.
Claims (10)
Priority Applications (1)
| Application Number | Priority Date | Filing Date | Title |
|---|---|---|---|
| CN202211619445.9ACN116244774A (en) | 2022-12-16 | 2022-12-16 | Visual design method of smart city energy management system based on digital twinning |
Applications Claiming Priority (1)
| Application Number | Priority Date | Filing Date | Title |
|---|---|---|---|
| CN202211619445.9ACN116244774A (en) | 2022-12-16 | 2022-12-16 | Visual design method of smart city energy management system based on digital twinning |
Publications (1)
| Publication Number | Publication Date |
|---|---|
| CN116244774Atrue CN116244774A (en) | 2023-06-09 |
Family
ID=86635479
Family Applications (1)
| Application Number | Title | Priority Date | Filing Date |
|---|---|---|---|
| CN202211619445.9APendingCN116244774A (en) | 2022-12-16 | 2022-12-16 | Visual design method of smart city energy management system based on digital twinning |
Country Status (1)
| Country | Link |
|---|---|
| CN (1) | CN116244774A (en) |
Citations (7)
| Publication number | Priority date | Publication date | Assignee | Title |
|---|---|---|---|---|
| CN112134355A (en)* | 2020-09-03 | 2020-12-25 | 珠海许继芝电网自动化有限公司 | Intelligent power distribution room visual display method and system |
| CN112532181A (en)* | 2020-12-29 | 2021-03-19 | 四川蜀旺新能源股份有限公司 | Photovoltaic power generation comprehensive management system and method based on Internet of things |
| CN112583012A (en)* | 2020-12-24 | 2021-03-30 | 山西奥博能源电力有限公司 | Intelligent control method and system for park comprehensive energy |
| KR102359512B1 (en)* | 2020-09-08 | 2022-02-09 | 한국전력공사 | Apparatus for providing integrated information on energy facilities of smart city and method thereof |
| CN114139264A (en)* | 2021-12-02 | 2022-03-04 | 中国建筑设计研究院有限公司 | Building water system information-based intelligent operation and maintenance system based on BIM + GIS technology |
| KR102448724B1 (en)* | 2022-05-11 | 2022-09-29 | 주식회사 대건소프트 | Supply resource ai controling system of smart-city based digital twin |
| CN115392742A (en)* | 2022-08-30 | 2022-11-25 | 广东鉴面智能科技有限公司 | Energy consumption integrated management system |
- 2022
- 2022-12-16CNCN202211619445.9Apatent/CN116244774A/enactivePending
Patent Citations (7)
| Publication number | Priority date | Publication date | Assignee | Title |
|---|---|---|---|---|
| CN112134355A (en)* | 2020-09-03 | 2020-12-25 | 珠海许继芝电网自动化有限公司 | Intelligent power distribution room visual display method and system |
| KR102359512B1 (en)* | 2020-09-08 | 2022-02-09 | 한국전력공사 | Apparatus for providing integrated information on energy facilities of smart city and method thereof |
| CN112583012A (en)* | 2020-12-24 | 2021-03-30 | 山西奥博能源电力有限公司 | Intelligent control method and system for park comprehensive energy |
| CN112532181A (en)* | 2020-12-29 | 2021-03-19 | 四川蜀旺新能源股份有限公司 | Photovoltaic power generation comprehensive management system and method based on Internet of things |
| CN114139264A (en)* | 2021-12-02 | 2022-03-04 | 中国建筑设计研究院有限公司 | Building water system information-based intelligent operation and maintenance system based on BIM + GIS technology |
| KR102448724B1 (en)* | 2022-05-11 | 2022-09-29 | 주식회사 대건소프트 | Supply resource ai controling system of smart-city based digital twin |
| CN115392742A (en)* | 2022-08-30 | 2022-11-25 | 广东鉴面智能科技有限公司 | Energy consumption integrated management system |
Similar Documents
| Publication | Publication Date | Title |
|---|---|---|
| CN113902605B (en) | A smart park operation and maintenance management system based on CⅠM architecture | |
| CN103257619B (en) | A kind of intelligent building energy Internet of Things and integrated approach thereof | |
| CN112346351B (en) | Thing networking device integration intelligence centralized control system based on BIM | |
| CN110187665A (en) | An intelligent management and control system for underground comprehensive utility corridor | |
| CN111783265B (en) | Optimization method for topology generation of power grid tidal current diagram | |
| CN109460834A (en) | Build operation management system and its management method | |
| CN110956401A (en) | Comprehensive energy management and control system and visual display platform | |
| CN115409652A (en) | A BIM-based integrated data center management system | |
| CN112213953A (en) | Intelligent building equipment control method, platform, equipment and computer storage medium | |
| CN110232089A (en) | A kind of three-dimensional city electric service command centre data visualization method | |
| CN104105265A (en) | City internet-of-things street lamp system | |
| CN107069826A (en) | Build multi-energy complementation comprehensive utilization device | |
| CN114326875A (en) | Intelligent energy management system | |
| CN116027687A (en) | Intelligent energy consumption building energy consumption monitoring system and energy saving effect monitoring method | |
| CN111723144A (en) | WebGL and GIS system-based intelligent building comprehensive management and control platform | |
| CN110134750A (en) | A kind of information system of underground pipeline | |
| CN205405608U (en) | Be used for intelligent platform in wisdom city | |
| CN118644256A (en) | A system and method for monitoring and displaying building energy consumption and carbon emissions throughout the entire life cycle | |
| CN116826970A (en) | Source network charge storage type intelligent park integrated management system based on BIM, GIS and IOT technologies | |
| CN111090241A (en) | Energy system visualization method | |
| Zhang et al. | The development and technological research of intelligent electrical building | |
| CN114995276B (en) | A distributed intelligent sponge monitoring system | |
| CN114492997A (en) | Carbon flow situation perception and low-carbon operation method for multi-station integrated energy station | |
| CN116244774A (en) | Visual design method of smart city energy management system based on digital twinning | |
| CN116934265A (en) | Intelligent lighting digital twin platform |
Legal Events
| Date | Code | Title | Description |
|---|---|---|---|
| PB01 | Publication | ||
| PB01 | Publication | ||
| SE01 | Entry into force of request for substantive examination | ||
| SE01 | Entry into force of request for substantive examination |