CN116151490B - Land change prediction method, apparatus, electronic device and storage medium - Google Patents
Land change prediction method, apparatus, electronic device and storage mediumDownload PDFInfo
- Publication number
- CN116151490B CN116151490BCN202310419057.4ACN202310419057ACN116151490BCN 116151490 BCN116151490 BCN 116151490BCN 202310419057 ACN202310419057 ACN 202310419057ACN 116151490 BCN116151490 BCN 116151490B
- Authority
- CN
- China
- Prior art keywords
- data
- city
- land
- grid
- predicted
- Prior art date
- Legal status (The legal status is an assumption and is not a legal conclusion. Google has not performed a legal analysis and makes no representation as to the accuracy of the status listed.)
- Active
Links
Images


Classifications
- G—PHYSICS
- G06—COMPUTING OR CALCULATING; COUNTING
- G06Q—INFORMATION AND COMMUNICATION TECHNOLOGY [ICT] SPECIALLY ADAPTED FOR ADMINISTRATIVE, COMMERCIAL, FINANCIAL, MANAGERIAL OR SUPERVISORY PURPOSES; SYSTEMS OR METHODS SPECIALLY ADAPTED FOR ADMINISTRATIVE, COMMERCIAL, FINANCIAL, MANAGERIAL OR SUPERVISORY PURPOSES, NOT OTHERWISE PROVIDED FOR
- G06Q10/00—Administration; Management
- G06Q10/04—Forecasting or optimisation specially adapted for administrative or management purposes, e.g. linear programming or "cutting stock problem"
- G—PHYSICS
- G06—COMPUTING OR CALCULATING; COUNTING
- G06Q—INFORMATION AND COMMUNICATION TECHNOLOGY [ICT] SPECIALLY ADAPTED FOR ADMINISTRATIVE, COMMERCIAL, FINANCIAL, MANAGERIAL OR SUPERVISORY PURPOSES; SYSTEMS OR METHODS SPECIALLY ADAPTED FOR ADMINISTRATIVE, COMMERCIAL, FINANCIAL, MANAGERIAL OR SUPERVISORY PURPOSES, NOT OTHERWISE PROVIDED FOR
- G06Q50/00—Information and communication technology [ICT] specially adapted for implementation of business processes of specific business sectors, e.g. utilities or tourism
- G06Q50/10—Services
- G06Q50/26—Government or public services
- Y—GENERAL TAGGING OF NEW TECHNOLOGICAL DEVELOPMENTS; GENERAL TAGGING OF CROSS-SECTIONAL TECHNOLOGIES SPANNING OVER SEVERAL SECTIONS OF THE IPC; TECHNICAL SUBJECTS COVERED BY FORMER USPC CROSS-REFERENCE ART COLLECTIONS [XRACs] AND DIGESTS
- Y02—TECHNOLOGIES OR APPLICATIONS FOR MITIGATION OR ADAPTATION AGAINST CLIMATE CHANGE
- Y02A—TECHNOLOGIES FOR ADAPTATION TO CLIMATE CHANGE
- Y02A30/00—Adapting or protecting infrastructure or their operation
- Y02A30/60—Planning or developing urban green infrastructure
Landscapes
- Business, Economics & Management (AREA)
- Engineering & Computer Science (AREA)
- Strategic Management (AREA)
- Economics (AREA)
- Tourism & Hospitality (AREA)
- Human Resources & Organizations (AREA)
- Theoretical Computer Science (AREA)
- Physics & Mathematics (AREA)
- Marketing (AREA)
- Development Economics (AREA)
- General Physics & Mathematics (AREA)
- General Business, Economics & Management (AREA)
- Quality & Reliability (AREA)
- Game Theory and Decision Science (AREA)
- Entrepreneurship & Innovation (AREA)
- Operations Research (AREA)
- Educational Administration (AREA)
- Health & Medical Sciences (AREA)
- General Health & Medical Sciences (AREA)
- Primary Health Care (AREA)
- Management, Administration, Business Operations System, And Electronic Commerce (AREA)
Abstract
Translated fromChinese
Description
Translated fromChinese技术领域technical field
本发明涉及土地变化预测技术领域,尤其涉及一种土地变化预测方法、装置、电子设备和存储介质。The present invention relates to the technical field of land change prediction, in particular to a land change prediction method, device, electronic equipment and storage medium.
背景技术Background technique
土地利用变化是人类活动的直观体现,深刻影响着生态环境质量。对土地资源的不合理利用会导致生态环境持续恶化,因此,如何合理利用土地资源已经成为了城市可持续发展中的重要问题。Land use change is an intuitive manifestation of human activities and profoundly affects the quality of the ecological environment. Unreasonable use of land resources will lead to continuous deterioration of the ecological environment. Therefore, how to rationally use land resources has become an important issue in the sustainable development of cities.
土地变化模拟技术可以预测未来不同情景下的土地利用变化,并得出空间显示的预测结果,能够为人们更合理的使用土地资源提供一定的参考建议。土地变化模拟的有效工具是土地变化模型。大多数土地变化模型的核心是通过达到土地系统服务的供需平衡来预测土地类型变化。土地系统服务是指某种土地类型的面积或者是土地提供的商品或服务(例如,粮食产量)。The land change simulation technology can predict the land use change under different scenarios in the future, and obtain the prediction results of the spatial display, which can provide certain reference suggestions for people to use land resources more rationally. An effective tool for land change simulation is a land change model. At the core of most land change models is the prediction of land type change by achieving a supply and demand balance for land system services. Land system services refer to the area of a certain land type or the goods or services that land provides (for example, food production).
依据一种土地类型能够提供的土地系统服务的数量,目前的土地变化模型可以分为两种,一种是,一种土地类型仅能够提供一种土地系统服务的土地变化模型,这种土地变化模型的应用范围较小。另一种是,一种土地类型能够提供多种土地系统服务的土地变化模型,这种土地变化模型在预测城市群未来的土地变化时,未考虑城市之间的相互作用,导致土地变化预测精度较低。According to the number of land system services that a land type can provide, the current land change models can be divided into two types. One is that a land type can only provide one land system service. This land change model The scope of application of the model is small. The other is a land change model that can provide a variety of land system services for a land type. This land change model does not consider the interaction between cities when predicting the future land change of urban agglomerations, resulting in the accuracy of land change prediction. lower.
发明内容Contents of the invention
本发明旨在至少在一定程度上解决相关技术中的技术问题之一。为此,本发明提供一种土地变化预测方法、装置、电子设备和存储介质,以提升土地变化预测的精度。The present invention aims to solve one of the technical problems in the related art at least to a certain extent. To this end, the present invention provides a land change prediction method, device, electronic equipment and storage medium to improve the accuracy of land change prediction.
本发明提供一种土地变化预测方法,包括:The invention provides a land change prediction method, comprising:
获取待预测区域中各个城市的土地数据、自然经济数据以及综合实力指标数据;Obtain the land data, natural economic data and comprehensive strength index data of each city in the area to be predicted;
针对所述待预测区域中的任一城市,根据所述城市的综合实力指标数据确定所述城市的综合实力指数;For any city in the area to be predicted, determine the comprehensive strength index of the city according to the comprehensive strength index data of the city;
将每个所述城市的综合实力指数和预制的时间成本栅格数据输入至预先构建的城市综合引力模型中,得到所述待预测区域的城市吸引力栅格数据,所述城市吸引力栅格数据包括每个栅格单元受到的各个所述城市的吸引力之和,所述城市综合引力模型用于根据所述预制的时间成本栅格数据以及待检测区域中每个所述城市的综合实力指数生成所述城市吸引力栅格数据;Input the comprehensive strength index and prefabricated time cost grid data of each city into the pre-built urban comprehensive gravity model to obtain the urban attractive grid data of the area to be predicted, and the urban attractive grid The data includes the sum of the attractiveness of each city received by each grid unit, and the city comprehensive gravity model is used based on the prefabricated time cost grid data and the comprehensive strength of each city in the area to be detected The index generates the city attraction raster data;
根据每个所述城市的自然经济数据和所述城市吸引力栅格数据得到所述待预测区域的位置适宜性栅格数据;Obtaining the location suitability grid data of the area to be predicted according to the natural economic data of each city and the urban attractiveness grid data;
将所述土地数据和所述位置适宜性栅格数据输入至土地变化模型中,得到所述待预测区域的土地变化预测结果,所述土地变化模型用于根据所述土地数据和所述位置适宜性栅格数据生成所述待预测区域的土地变化预测结果。Inputting the land data and the location suitability grid data into a land change model to obtain the land change prediction result of the area to be predicted, and the land change model is used to The land change prediction results of the region to be predicted are generated using the characteristic raster data.
在一些可实现的方式中,所述城市的综合实力指标数据包括多个子成分指标,所述子成分指标用于评价城市在单个方面所体现的实力,所述针对所述待预测区域中的任一城市,根据所述城市的综合实力指标数据确定所述城市的综合实力指数,包括:将所述城市的所有所述子成分指标输入至SPSS软件中,得到所述城市的多个主成分指标和每个所述主成分指标的贡献度;根据所述城市的所有所述主成分指标的贡献度确定所述城市的综合实力指数。In some practicable manners, the comprehensive strength index data of the city includes a plurality of sub-component indexes, and the sub-component indexes are used to evaluate the strength of the city in a single aspect. A city, determining the comprehensive strength index of the city according to the comprehensive strength index data of the city, comprising: inputting all the sub-component indicators of the city into SPSS software to obtain multiple principal component indicators of the city and the contribution degree of each principal component index; determine the comprehensive strength index of the city according to the contribution degree of all the principal component indexes of the city.
在一些可实现的方式中,所述时间成本栅格数据的生成步骤包括:获取所述待预测区域范围内的道路数据,所述道路数据包括所述栅格单元中的道路长度和相应道路的标准行驶速度;针对所述待预测区域中的任一栅格单元,根据所述任一栅格单元的道路长度和标准行驶速度确定所述任一栅格单元的时间成本;根据每个所述栅格单元的时间成本生成所述时间成本栅格数据。In some practicable manners, the step of generating the time cost grid data includes: acquiring road data within the area to be predicted, the road data including the length of the road in the grid unit and the corresponding road length standard driving speed; for any grid unit in the region to be predicted, determine the time cost of any grid unit according to the road length and standard driving speed of any grid unit; according to each grid unit The time cost of a raster unit generates the time cost raster data.
在一些可实现的方式中,所述预先构建的城市综合引力模型公式为:In some practicable manners, the formula of the pre-built urban comprehensive gravity model is:

其中,Fx为所述栅格单元x受到的各个所述城市的吸引力之和,c=1表示所述待预测区域中的第一个城市,n为所述待预测区域中城市的总数目,Mc为第c个城市的综合实力指数,m为所述栅格单元x的质量,m=1,D(x,Center(c))为所述栅格单元x到第c个城市中心的时间成本距离值,G为预设系数,G=1。Wherein, Fx is the sum of the attractiveness of each city that the grid unit x is subjected to, c=1 represents the first city in the area to be predicted, and n is the total number of cities in the area to be predicted Mc is the comprehensive strength index of the cth city, m is the quality of the grid unit x, m=1, D(x, Center (c)) is the grid unit x to the cth city The time cost distance value of the center, G is the preset coefficient, G=1.
在一些可实现的方式中,在根据每个所述城市的自然经济数据和所述城市吸引力栅格数据得到所述待预测区域的位置适宜性栅格数据之前,所述方法还包括:利用预设公式对所述城市吸引力栅格数据进行均衡化处理;所述根据每个所述城市的自然经济数据和所述城市吸引力栅格数据得到所述待预测区域的位置适宜性栅格数据,包括:根据每个所述城市的自然经济数据和均衡化后的城市吸引力栅格数据得到所述位置适宜性栅格数据。In some practicable manners, before obtaining the location suitability grid data of the area to be predicted according to the natural economic data of each city and the urban attraction grid data, the method further includes: using A preset formula performs equalization processing on the urban attraction grid data; the location suitability grid of the area to be predicted is obtained according to the natural economic data of each city and the urban attractive grid data The data includes: obtaining the location suitability grid data according to the natural economic data of each city and the balanced urban attractiveness grid data.
在一些可实现的方式中,所述预设公式为:In some practicable manners, the preset formula is:

其中,D(i)为均衡化后第i个所述栅格单元受到的各个所述城市的吸引力之和,d(i)为第i个所述栅格单元受到的各个所述城市的吸引力之和的占比,max(D)为均衡化后所述栅格单元受到的各个所述城市的吸引力之和的最大值。Among them, D(i) is the sum of the attractiveness of each city received by the i-th grid unit after equalization, and d(i) is the attraction force of each city received by the i-th grid unit The proportion of the sum of attractiveness, max(D) is the maximum value of the sum of the attractiveness of each city received by the grid unit after equalization.
在一些可实现的方式中,所述土地数据包括土地系统类型、土地转换阻力值和土地转移矩阵。In some practicable manners, the land data includes land system type, land conversion resistance value and land transfer matrix.
本发明还提供一种土地变化预测装置,包括:获取模块,用于获取待预测区域中各个城市的土地数据、自然经济数据以及综合实力指标数据;第一确定模块,用于针对所述待预测区域中的任一城市,根据所述城市的综合实力指标数据确定所述城市的综合实力指数;城市综合引力计算模块,用于将每个所述城市的综合实力指数和预制的时间成本栅格数据输入至预先构建的城市综合引力模型中,得到所述待预测区域的城市吸引力栅格数据,所述城市吸引力栅格数据包括每个栅格单元受到的各个所述城市的吸引力之和,所述城市综合引力模型用于根据所述预制的时间成本栅格数据以及待检测区域中每个所述城市的综合实力指数生成所述城市吸引力栅格数据;第二确定模块,用于根据每个所述城市的自然经济数据和所述城市吸引力栅格数据得到所述待预测区域的位置适宜性栅格数据;预测模块,用于将所述土地数据和所述位置适宜性栅格数据输入至土地变化模型中,得到所述待预测区域的土地变化预测结果,所述土地变化模型用于根据所述土地数据和所述位置适宜性栅格数据生成所述待预测区域的土地变化预测结果。The present invention also provides a land change prediction device, including: an acquisition module, used to acquire land data, natural economic data, and comprehensive strength index data of each city in the area to be predicted; a first determination module, used to target the For any city in the region, determine the comprehensive strength index of the city according to the comprehensive strength index data of the city; the urban comprehensive gravity calculation module is used to combine the comprehensive strength index of each city with the prefabricated time cost grid The data is input into the pre-built urban comprehensive gravity model to obtain the urban attractiveness grid data of the area to be predicted, and the urban attractiveness grid data includes the attractiveness of each city that each grid unit is subjected to. And, the city comprehensive gravity model is used to generate the city attraction grid data according to the prefabricated time cost grid data and the comprehensive strength index of each city in the area to be detected; the second determination module uses Obtaining the location suitability grid data of the region to be predicted according to the natural economic data of each city and the city attraction grid data; the prediction module is used to combine the land data and the location suitability The grid data is input into the land change model to obtain the land change prediction result of the region to be predicted, and the land change model is used to generate the prediction result of the region to be predicted according to the land data and the location suitability grid data Land Change Prediction Results.
本发明还提供一种电子设备,包括存储器、处理器及存储在存储器上并可在处理器上运行的计算机程序,所述处理器执行所述程序时实现如上述任一种所述土地变化预测方法。The present invention also provides an electronic device, including a memory, a processor, and a computer program stored on the memory and operable on the processor. When the processor executes the program, it realizes the land change prediction as described above. method.
本发明还提供一种非暂态计算机可读存储介质,其上存储有计算机程序,该计算机程序被处理器执行时实现如上述任一种所述土地变化预测方法。The present invention also provides a non-transitory computer-readable storage medium, on which a computer program is stored, and when the computer program is executed by a processor, the land change prediction method described in any one of the above-mentioned methods is realized.
本发明还提供一种计算机程序产品,包括计算机程序,所述计算机程序被处理器执行时实现如上述任一种所述土地变化预测方法。The present invention also provides a computer program product, including a computer program. When the computer program is executed by a processor, any one of the land change prediction methods described above can be realized.
本发明提供的土地变化预测方法、装置、电子设备和存储介质,通过将每个城市的综合实力指数和预制的时间成本栅格数据输入至预先构建的城市综合引力模型中,得到待预测区域的城市吸引力栅格数据,通过城市吸引力栅格数据来量化城市之间的相互作用;再通过城市吸引力栅格数据和每个城市的自然经济数据得到待预测区域的位置适宜性栅格数据;最后通过土地数据和位置适宜性栅格数据确定最终的土地变化预测结果,考虑了城市之间的相互影响,有效的提升了土地变化预测的精度。The land change prediction method, device, electronic equipment and storage medium provided by the present invention obtain the area to be predicted by inputting the comprehensive strength index of each city and the prefabricated time cost grid data into the pre-built urban comprehensive gravity model Raster data of urban attractiveness, quantify the interaction between cities through urban attractive raster data; then obtain the location suitability raster data of the area to be predicted through the urban attractive raster data and the natural economic data of each city ; Finally, the final land change prediction result is determined by land data and location suitability raster data, and the interaction between cities is considered, which effectively improves the accuracy of land change prediction.
附图说明Description of drawings
为了更清楚地说明本发明或现有技术中的技术方案,下面将对实施例或现有技术描述中所需要使用的附图作简单地介绍,显而易见地,下面描述中的附图是本发明的一些实施例,对于本领域普通技术人员来讲,在不付出创造性劳动的前提下,还可以根据这些附图获得其他的附图。In order to more clearly illustrate the present invention or the technical solutions in the prior art, the accompanying drawings that need to be used in the description of the embodiments or the prior art will be briefly introduced below. Obviously, the accompanying drawings in the following description are the For some embodiments of the present invention, those of ordinary skill in the art can also obtain other drawings based on these drawings on the premise of not paying creative efforts.
图1是本发明实施例的土地变化预测方法的流程图之一;Fig. 1 is one of flow charts of the land change prediction method of the embodiment of the present invention;
图2是本发明实施例的时间成本栅格的示意图;FIG. 2 is a schematic diagram of a time cost grid according to an embodiment of the present invention;
图3是本发明实施例的土地变化预测方法的流程图之二;Fig. 3 is the second flow chart of the land change prediction method of the embodiment of the present invention;
图4是本发明实施例的土地变化预测方法的流程图之三;Fig. 4 is the third flowchart of the land change prediction method according to the embodiment of the present invention;
图5是本发明实施例的时间成本栅格和路径的示意图;FIG. 5 is a schematic diagram of a time cost grid and a path in an embodiment of the present invention;
图6是本发明一个具体实施例的土地变化预测方法的流程图;Fig. 6 is the flowchart of the land change prediction method of a specific embodiment of the present invention;
图7是本发明实施例的土地变化预测装置的方框图;Fig. 7 is the block diagram of the land change prediction device of the embodiment of the present invention;
图8是本发明提供的电子设备的结构示意图。Fig. 8 is a schematic structural diagram of an electronic device provided by the present invention.
具体实施方式Detailed ways
为使本发明的目的、技术方案和优点更加清楚,下面将结合本发明中的附图,对本发明中的技术方案进行清楚、完整地描述,显然,所描述的实施例是本发明一部分实施例,而不是全部的实施例。基于本发明中的实施例,本领域普通技术人员在没有做出创造性劳动前提下所获得的所有其他实施例,都属于本发明保护的范围。In order to make the purpose, technical solutions and advantages of the present invention clearer, the technical solutions in the present invention will be clearly and completely described below in conjunction with the accompanying drawings in the present invention. Obviously, the described embodiments are part of the embodiments of the present invention , but not all examples. Based on the embodiments of the present invention, all other embodiments obtained by persons of ordinary skill in the art without making creative efforts belong to the protection scope of the present invention.
图1是本发明实施例的土地变化预测方法的流程图之一。如图1所示,该土地变化预测方法可以包括以下步骤:Fig. 1 is one of the flowcharts of the land change prediction method according to the embodiment of the present invention. As shown in Figure 1, the land change prediction method may include the following steps:
步骤110:获取待预测区域中各个城市的土地数据、自然经济数据以及综合实力指标数据。Step 110: Obtain the land data, natural economic data and comprehensive strength index data of each city in the region to be predicted.
具体地,可以先选择所要预测的城市群,可以将城市群所在区域作为待预测区域。确定待预测区域后,获取待预测区域中各个城市的土地数据、自然经济数据以及综合实力指标数据。Specifically, the city group to be predicted can be selected first, and the area where the city group is located can be used as the area to be predicted. After the area to be predicted is determined, the land data, natural economic data, and comprehensive strength index data of each city in the area to be predicted are obtained.
这里,需要说明的是,综合实力指标数据可以选择统计年鉴的数据,统计年鉴的时间可以选择与预测起始年份接近的年份。示例地,若要预测2010年待预测区域的土地利用变化,则可以将2000年作为预测起始年份,统计年鉴则可以选择1999年,即可以使用1999年统计的综合实力指标数据来对2010年待预测区域的土地利用变化进行预测。Here, it should be noted that the data of the comprehensive strength index can be selected from the statistical yearbook, and the time of the statistical yearbook can be selected from a year close to the forecast start year. For example, if you want to predict the land use change in the area to be predicted in 2010, you can use 2000 as the starting year of prediction, and you can choose 1999 in the statistical yearbook, that is, you can use the comprehensive strength index data in 1999 to calculate the 2010 The land use change in the area to be predicted is predicted.
在本实施例中,各个城市的土地数据和自然经济数据均可以为栅格数据。可以理解的是,栅格数据是将空间分割成有规律的网格,每一个网格称为一个单元,并在各单元上赋予相应的属性值来表示实体的一种数据形式。因此,可以将待预测区域的空间分割成有规律的网格,每个网格即为一个栅格单元。另外,本实施例中的土地数据和自然经济数据可以为TIF格式的栅格数据,其分辨率为100米,坐标系可以选择WGS_1984_UTM_Zone_49N坐标系。需要说明的是,本发明实施例中所涉及到的所有栅格数据均可以使用相同的分辨率和坐标系。In this embodiment, the land data and natural economic data of each city can be raster data. It can be understood that raster data is a data form in which space is divided into regular grids, each grid is called a unit, and corresponding attribute values are assigned to each unit to represent entities. Therefore, the space of the region to be predicted can be divided into regular grids, and each grid is a grid unit. In addition, the land data and natural economic data in this embodiment can be raster data in TIF format with a resolution of 100 meters, and the coordinate system can be WGS_1984_UTM_Zone_49N coordinate system. It should be noted that all grid data involved in the embodiments of the present invention may use the same resolution and coordinate system.
在一些实施方式中,土地数据包括土地系统类型、土地转换阻力值和土地转移矩阵。需要说明的是,这里所说的土地系统类型是指,在预测起始年份时,栅格单元所代表地区的土地系统类型。In some embodiments, the land data includes land system types, land conversion resistance values, and land transfer matrices. It should be noted that the land system type mentioned here refers to the land system type of the area represented by the grid unit at the time of the forecast start year.
在本实施例中,土地系统类型可以包括(但不限于):水域系统、建设用地系统和非建设用地系统。土地系统类型的获取方式可以为:先获取待预测区域中各个城市的土地覆被数据,采用的土地覆被数据可以为Globeland30数据。得到土地覆被数据后,可以将土地覆被数据进行升尺度操作,并在升尺度的过程中,利用滑动窗口统计土地覆被数据统计窗口内占比最多的像元类型,并根据该像元类型确定土地系统类型。In this embodiment, land system types may include (but not limited to): water system, construction land system, and non-construction land system. The land system type can be obtained in the following way: first obtain the land cover data of each city in the area to be predicted, and the land cover data used can be Globeland30 data. After the land cover data is obtained, the land cover data can be upscaled, and in the process of upscaling, the sliding window is used to count the pixel types that account for the most in the land cover data statistics window, and according to the pixel type Type determines the land system type.
另外,需要说明的是,获得的土地覆被数据同样为栅格数据形式,根据土地覆被数据得到的土地系统类型也为栅格数据形式。In addition, it should be noted that the obtained land cover data is also in the form of raster data, and the land system type obtained from the land cover data is also in the form of raster data.
作为一个示例,可以通过升尺度的方式将土地覆被数据制作成90米分辨率的土地系统数据;再对该土地系统数据重采样至100米分辨率,从而来调整土地系统数据的分辨率。在升尺度时,可以使用3×3的滑动窗口统计窗口内占比最多的像元类型,若占比最多的像元类型为水域,则升尺度后的土地系统类型为水域系统。若占比最多的像元类型为建设用地,则升尺度后的土地系统类型为建设用地系统。若占比最多的像元类型为其他剩余类型,则升尺度后的土地系统类型为非建设用地系统。As an example, the land cover data can be made into land system data with a resolution of 90 meters by upscaling; then the land system data can be resampled to a resolution of 100 meters to adjust the resolution of the land system data. When upscaling, a 3×3 sliding window can be used to count the pixel type that accounts for the most in the window. If the pixel type that accounts for the most is water, the land system type after upscaling is water system. If the pixel type with the largest proportion is construction land, the upscaled land system type is construction land system. If the pixel type with the largest proportion is other remaining types, the upscaled land system type is non-construction land system.
土地转换阻力值用于表示某种土地系统类型转换为其他土地系统类型的难易程度,土地转换阻力值可以通过历史年份的土地系统数据来计算得到。示例地,可以根据2000年至2010年的历史土地系统数据,计算得到非建设用地系统转换为其他用地系统的概率大小为75%。The land conversion resistance value is used to indicate the difficulty of converting a certain land system type to another land system type, and the land conversion resistance value can be calculated from the land system data of historical years. For example, based on the historical land system data from 2000 to 2010, it can be calculated that the probability of conversion of the non-construction land system to other land use systems is 75%.
土地转移矩阵用于表示任意两种土地系统类型之间是否允许转换,同样地,土地转移矩阵也可以通历史年份的土地系统数据来确定。示例地,可以统计2009年和2010年的土地系统数据,并将这些数据进行叠加分析,如果某两种土地系统类型在这两年发生过转换,则可以认为这两种土地系统类型能够发生转换,并得到土地转移矩阵。The land transfer matrix is used to indicate whether conversion is allowed between any two land system types. Similarly, the land transfer matrix can also be determined through the land system data of historical years. For example, the land system data in 2009 and 2010 can be counted, and these data can be superimposed and analyzed. If two land system types have been converted in these two years, it can be considered that the two land system types can be converted , and get the land transfer matrix.
在本实施例中,自然经济数据可以包括(但不限于):地形数据、可达性数据和兴趣点密度数据,这三个方面。In this embodiment, natural economic data may include (but not limited to): terrain data, accessibility data, and interest point density data, these three aspects.
其中,地形数据可以包括:DEM(Digital Elevation Model,数字高程模型)、坡度、坡向等。DEM的数据来源可以为ASTER V2,坡度数据可以由DEM进行计算得到,坡向数据也可以由DEM进行计算得到。DEM、坡度数据和坡向数据均可以为栅格数据形式。Wherein, the terrain data may include: DEM (Digital Elevation Model, digital elevation model), slope, slope aspect, and the like. The data source of DEM can be ASTER V2, the slope data can be calculated by DEM, and the aspect data can also be calculated by DEM. DEM, slope data and aspect data can all be in the form of raster data.
可达性数据可以包括:到城市中心、河流、道路、铁路的最近距离。到城市中的最近距离可以从资源环境科学与数据中心的数据库中获得,到河流、道路、铁路的最近距离可以从Open Street Map中获得。可达性数据的数据形式可以为矢量数据。Accessibility data can include: closest distance to city centers, rivers, roads, railways. The shortest distance to the city can be obtained from the database of the Resource Environment Science and Data Center, and the shortest distance to rivers, roads, and railways can be obtained from Open Street Map. The data form of the accessibility data may be vector data.
兴趣点密度数据可以包括:餐饮设施、购物消费设施、医疗设施、旅游景点、交通设施等密度数据。这些兴趣点密度数据均可以从开源地图数据库中获取得到。The density data of points of interest may include: density data of catering facilities, shopping and consumption facilities, medical facilities, tourist attractions, transportation facilities, etc. These interest point density data can be obtained from open source map databases.
在本实施例中,城市的综合实力指标数据可以包括(但不限于)能够反映城市经济发展、社会发展、科学和教育、基础设置、环境条件这五个方面的指标数据。In this embodiment, the city's comprehensive strength index data may include (but not limited to) index data that can reflect the five aspects of urban economic development, social development, science and education, infrastructure, and environmental conditions.
作为一个示例,能够反映经济发展的指标数据可以包括:全市地区生产总值、社会消费品零售总额、公共财务收入、在岗职工平均工资、固定资产投资(不含农户)等。能够反映社会发展的指标数据可以包括:全市年平均人口、人均地区生产总值、公共图书馆图书总藏量、医院和卫生院个数、医生数等。能够反映科学和教育的指标数据可以包括:科学研究指标、技术服务指标、地质勘查业指标、普通高等学校数量、在校学生数-普通高等学校等。能够反映基础设置的指标数据可以包括:建成区面积、年末邮政局、公路货运量、全社会用电量等。能够反映环境条件的指标数据可以包括:建成区绿化覆盖率、城市污水处理率、城市人均公园绿地面积等。As an example, indicator data that can reflect economic development may include: the city’s GDP, total retail sales of social consumer goods, public financial revenue, average wages of on-the-job employees, investment in fixed assets (excluding rural households), etc. Indicator data that can reflect social development can include: the city's annual average population, per capita GDP, total collection of books in public libraries, number of hospitals and health centers, number of doctors, etc. Indicator data that can reflect science and education may include: scientific research indicators, technical service indicators, geological survey industry indicators, number of ordinary colleges and universities, number of students in school - ordinary colleges and universities, etc. The index data that can reflect the basic setting can include: the area of built-up area, the post office at the end of the year, the volume of road freight, and the electricity consumption of the whole society. Indicator data that can reflect environmental conditions can include: green coverage rate of built-up areas, urban sewage treatment rate, urban per capita park green area, etc.
步骤120:针对待预测区域中的任一城市,根据城市的综合实力指标数据确定城市的综合实力指数。Step 120: For any city in the area to be predicted, determine the city's comprehensive strength index according to the city's comprehensive strength index data.
在得到待预测区域中各个城市的综合实力指标数据后,可以通过一个城市的综合实力指标数据确定该城市的综合实力指数。可以理解的是,每个城市可以对应有一个综合实力指数。After obtaining the comprehensive strength index data of each city in the area to be predicted, the comprehensive strength index of a city can be determined through the comprehensive strength index data of the city. It is understandable that each city can have a corresponding comprehensive strength index.
由于用于反映城市综合实力的指标数据多种多样,因此,可以通过将这些指标数据进行融合,得到一个综合实力指数,所得到的综合实力指数能够更清楚、准确的评价该城市的综合实力。另外,还可以考虑每个综合实力指标的重要程度,根据每个综合实力指标的重要程度来计算得到综合实力指数。Since there are various index data used to reflect the comprehensive strength of a city, a comprehensive strength index can be obtained by fusing these index data, which can more clearly and accurately evaluate the comprehensive strength of the city. In addition, the importance of each comprehensive strength index can also be considered, and the comprehensive strength index can be calculated according to the importance of each comprehensive strength index.
步骤130:将每个城市的综合实力指数和预制的时间成本栅格数据输入至预先构建的城市综合引力模型中,得到待预测区域的城市吸引力栅格数据。Step 130: Input the comprehensive strength index of each city and the prefabricated time cost grid data into the pre-built urban comprehensive gravity model to obtain the urban attractiveness grid data of the region to be predicted.
其中,城市吸引力栅格数据包括每个栅格单元受到的各个城市的吸引力之和。Among them, the city attractiveness raster data includes the sum of the attractiveness of each city received by each grid cell.
需要说明的是,可以将待预测区域的空间分割为多个有规律的栅格单元,可以预先计算得到行驶通过每个栅格单元所代表的地区需要花费的时间成本,所有栅格单元和对应的时间成本可以组成一个时间成本栅格数据。It should be noted that the space of the area to be predicted can be divided into multiple regular grid units, and the time cost of driving through the area represented by each grid unit can be calculated in advance. All grid units and corresponding The time cost of can form a time cost raster data.
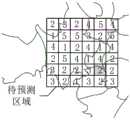
图2是本发明实施例的时间成本栅格的示意图。如图2所述,作为一个示例,每个栅格单元中的数据表示行驶通过该栅格单元所代表的地区需要花费的时间成本,时间成本数据单位为小时。例如,图2中的阴影栅格中的数据为2,则可以确定行驶通过阴影栅格单元所代表的地区需要花费的时间成本为2个小时。Fig. 2 is a schematic diagram of a time cost grid according to an embodiment of the present invention. As shown in FIG. 2 , as an example, the data in each grid cell represents the time cost required to travel through the region represented by the grid cell, and the time cost data unit is hour. For example, if the data in the shaded grid in Figure 2 is 2, it can be determined that the time cost of driving through the area represented by the shaded grid unit is 2 hours.
在得到每个城市的综合实力指数和时间成本栅格数据后,可以将每个城市的综合实力指数和时间成本栅格数据输入至预先构建的城市综合引力模型中,可以得到待预测区域的城市吸引力栅格数据。同样地,可以将待预测区域的空间分割为多个有规律的栅格单元,城市综合引力模型用于计算每个栅格单元受到各个城市的吸引力之和,从而确定各个城市对于每个栅格单元所代表的地区的影响。After obtaining the comprehensive strength index and time cost grid data of each city, the comprehensive strength index and time cost grid data of each city can be input into the pre-built urban comprehensive gravity model, and the cities in the area to be predicted can be obtained Attraction raster data. Similarly, the space of the area to be predicted can be divided into multiple regular grid units, and the urban comprehensive gravity model is used to calculate the sum of the attraction of each grid unit to each city, so as to determine the impact of each city on each grid unit. The effect of the region represented by the cell.
具体地,城市综合引力模型会根据时间成本栅格数据确定任一栅格单元所代表地区到某一个城市中心的时间成本距离,再通过该时间成本距离和该城市的综合实力指数计算的到该城市对栅格单元所代表地区的吸引力;以此类推,可以计算得到每个城市对栅格单元所代表地区的吸引力;进而能够得到每个城市对栅格单元所代表地区的吸引力之和。最终,能够得到城市吸引力栅格数据。Specifically, the urban comprehensive gravity model will determine the time cost distance from the area represented by any grid unit to a certain city center based on the time cost grid data, and then calculate the time cost distance to the city center based on the time cost distance and the city's comprehensive strength index. The attractiveness of the city to the area represented by the grid unit; by analogy, the attractiveness of each city to the area represented by the grid unit can be calculated; and then the attractiveness of each city to the area represented by the grid unit can be obtained. and. Finally, the urban attractiveness raster data can be obtained.
步骤140:根据每个城市的自然经济数据和城市吸引力栅格数据得到待预测区域的位置适宜性栅格数据。Step 140: Obtain the location suitability grid data of the area to be predicted according to the natural economic data of each city and the urban attraction grid data.
位置适宜性栅格数据能够反映栅格单元所代表地区在受到自然、经济、社会等因素的驱动下,成为某种土地系统类型的可能性。因此,位置适宜性栅格数据可以包括每个栅格单元所代表地区的土地系统类型能够成为水域系统的概率值、成为建设用地系统的概率值以及成为非建设用地系统的概率值。The location suitability raster data can reflect the possibility that the area represented by the grid unit will become a certain type of land system driven by natural, economic, social and other factors. Therefore, the location suitability raster data can include the probability value of the land system type in the area represented by each grid cell that can become a water system, the probability value of a construction land system, and the probability value of a non-construction land system.
在本实施例中,不仅利用每个城市的自然经济数据来计算位置适宜性栅格数据,还考虑了各个城市吸引力对位置适宜性的影响,从而能够提高待预测区域位置适宜性栅格数据的全面性和准确性。计算位置适宜性栅格数据的方式可以为:利用Logistic回归算法来计算位置适宜性栅格数据。具体可以通过下式计算一个栅格单元的位置适宜性数据:In this embodiment, not only the natural economic data of each city is used to calculate the location suitability grid data, but also the influence of the attractiveness of each city on the location suitability is considered, so that the location suitability grid data of the area to be predicted can be improved. comprehensiveness and accuracy. The manner of calculating the location suitability grid data may be: using the Logistic regression algorithm to calculate the location suitability grid data. Specifically, the location suitability data of a grid cell can be calculated by the following formula:

其中,Pi为土地系统类型i成为某一种土地系统类型的概率,Xn,i是影响土地系统类型i变化的第n个影响因子的数据,β0为常数,βn为Xn,i的系数。这里,需要说明的是,影响因子包括自然经济和城市吸引力,影响因子的数据包括自然经济数据和城市吸引力栅格数据中该栅格单元的城市吸引力数据。Among them, Pi is the probability that land system type i becomes a certain land system type, Xn,i is the data of the nth influencing factor that affects the change of land system type i, β0 is a constant, βn is Xn, coefficient ofi . Here, it should be noted that the impact factors include natural economy and urban attractiveness, and the data of the impact factors include natural economic data and urban attractiveness data of the grid unit in the urban attractiveness raster data.
采用同样的方式可以计算得到每个栅格单元的位置适宜性数据,每个栅格单元的位置适宜性数据可以组成最终的位置适宜性栅格数据。The location suitability data of each grid unit can be calculated in the same way, and the location suitability data of each grid unit can form the final location suitability raster data.
步骤150:将土地数据和位置适宜性栅格数据输入至土地变化模型中,得到待预测区域的土地变化预测结果。Step 150: Input the land data and location suitability grid data into the land change model to obtain the land change prediction result of the area to be predicted.
需要说明的是,本发明实施例可以使用目前已有的土地变化模型来得到土地变化预测结果。It should be noted that the embodiment of the present invention can use the currently existing land change model to obtain the land change prediction result.
具体地,在得到土地系统类型、土地转换阻力值、土地转移矩阵以及位置适宜性栅格数据后,将土地系统类型、土地转换阻力值、土地转移矩阵以及位置适宜性栅格数据输入至土地变化模型中,土地变化模型则会输出待预测区域的土地变化预测结果。Specifically, after obtaining the land system type, land conversion resistance value, land transfer matrix and location suitability raster data, input the land system type, land conversion resistance value, land transfer matrix and location suitability raster data into the land change In the model, the land change model will output the land change prediction results of the area to be predicted.
图3是本发明实施例的土地变化预测方法的流程图之二。如图3所示,在一些实施方式中,城市的综合实力指标数据可以包括多个子成分指标,子成分指标用于评价城市在单个方面所体现的实力,在步骤120中,可以通过以下步骤确定城市的综合实力指数:Fig. 3 is the second flowchart of the land change prediction method according to the embodiment of the present invention. As shown in Figure 3, in some implementations, the city's comprehensive strength index data may include multiple sub-component indexes, and the sub-component indexes are used to evaluate the strength of a city in a single aspect. In
步骤310:将城市的所有子成分指标输入至SPSS软件中,得到城市的多个主成分指标和每个主成分指标的贡献度。Step 310: Input all sub-component indexes of the city into SPSS software to obtain multiple principal component indexes of the city and the contribution of each principal component index.
步骤320:根据城市的所有主成分指标的贡献度确定城市的综合实力指数。Step 320: Determine the comprehensive strength index of the city according to the contribution of all the principal component indicators of the city.
需要说明的是,子成分指标可以为前述能够反映城市经济发展、社会发展、科学和教育、基础设置、环境条件的指标。示例地,子成分指标可以为:全市地区生产总值、社会消费品零售总额、公共财务收入、在岗职工平均工资、全市年平均人口、人均地区生产总值、公共图书馆图书总藏量、普通高等学校数量、建成区面积、建成区绿化覆盖率、城市污水处理率、城市人均公园绿地面积等。It should be noted that the sub-component indicators can be the aforementioned indicators that can reflect urban economic development, social development, science and education, infrastructure, and environmental conditions. For example, the sub-component indicators can be: the city's GDP, total retail sales of social consumer goods, public financial income, average wages of employees, the city's annual average population, per capita GDP, total book collections in public libraries, ordinary high school, etc. The number of schools, the area of built-up areas, the green coverage rate of built-up areas, the rate of urban sewage treatment, the area of green parks per capita in cities, etc.
具体地,在获得上述多个子成分指标后,可以将子成分指标输入至SPSS(Statistical Package for the Social Sciences,社会科学统计软件包)软件的因子分析模块,得到多个主成分指标和每个主成分指标的贡献度。Specifically, after obtaining the above-mentioned multiple subcomponent indicators, the subcomponent indicators can be input into the factor analysis module of SPSS (Statistical Package for the Social Sciences, social science statistical software package) software to obtain multiple principal component indicators and each principal component index. The contribution of the composition index.
可以理解的是,不同指标之间是有一定相关性的,所以实际观测到的数据包含的信息有一部分可能是重复的。SPSS软件的因子分析模块就是利用降维的思想,在尽可能不损失信息或者少损失信息的情况下,将多个变量减少为少数几个潜在的因子,这几个因子可以高度概括大量数据中的信息,这样既减少了变量个数,又能够再现变量之间的内在联系。It is understandable that there is a certain correlation between different indicators, so some of the information contained in the actually observed data may be repeated. The factor analysis module of SPSS software is to use the idea of dimensionality reduction to reduce multiple variables into a few potential factors without losing information or losing as little information as possible. These factors can highly summarize a large amount of data. information, which not only reduces the number of variables, but also reproduces the internal relationship between variables.
在本实施例中,将多个子成分指标输入至SPSS软件的因子分析模块,因子分析模块可以通过线性计算,将几种相关的子成分指标融合得到一个主成分指标。因子分析模块根据多个子成分指标得到多个主成分指标后,再计算各个主成分指标的载荷,并对各主成分指标的载荷进行凯撒正态化最大方差旋转。可以理解的是,凯撒正态化最大方差旋转是对各主成分指标的载荷进行了正交变换,使得各主成分指标的载荷方差之和最大,从而可以减少载荷中的负值,以避免主成分指标的计算结果中出现负值。In this embodiment, multiple sub-component indexes are input into the factor analysis module of SPSS software, and the factor analysis module can fuse several related sub-component indexes to obtain a principal component index through linear calculation. After the factor analysis module obtains multiple principal component indicators based on multiple subcomponent indicators, it calculates the load of each principal component indicator, and performs Caesar normalization maximum variance rotation on the load of each principal component indicator. It can be understood that the maximum variance rotation of Caesar normalization is an orthogonal transformation of the loads of each principal component index, so that the sum of the variances of the loads of each principal component index is the largest, so that the negative value in the load can be reduced to avoid the main component. A negative value appears in the calculation result of the composition index.
在步骤320中,得到每个主成分指标的贡献度后,可以选择累计贡献度达到预设阈值的主成分指标来计算最终的综合实力指数。需要说明的是,累计贡献度是指将主成分指标的贡献度依次累计相加,作为一个示例,若主成分指标包括Xa、Xb以及Xc,Xa、Xb和Xc的贡献度分别为:Sa、Sb和Sc,则Xa的累计贡献度为Sa,Xb的累计贡献度为Sa+Sb,Xc的累计贡献度为Sa+Sb+Sc。In
另外,预设阈值可以由工作人员根据实际情况进行设置。作为一个示例,预设阈值可以设置为85%,在本实施例中,认为主成分指标的累计贡献度达到85%,则可以概括原有指标中的信息。因此,利用贡献度达到预设阈值的主成分指标来计算最终的综合实力指数,能够有效的减少数据的冗余。In addition, the preset threshold can be set by the staff according to the actual situation. As an example, the preset threshold can be set to 85%. In this embodiment, it is considered that the cumulative contribution of the principal component index reaches 85%, and the information in the original index can be summarized. Therefore, using the principal component indicators whose contribution reaches the preset threshold to calculate the final comprehensive strength index can effectively reduce data redundancy.
作为一个示例,若获得的子成分指标包括X1、X2、X3、X4、X5、X6、X7、X8、X9、X10、X11、X12以及X13,预设阈值为85%。将这些子成分指标输入至SPSS软件的因子分析模块后,因子分析模块输出的主成分指标有Xa、Xb、Xc、Xd以及Xe(这几个主成分的贡献度依次减弱)。其中,Xa的累计贡献度为65%,Xb的累计贡献度为78%,Xc的累计贡献度为86%,Xd的累计贡献度为90%,Xe的累计贡献度为100%,可见,主成分指标Xa、Xb和Xc的累计贡献度已经达到了预设阈值85%,因此,可以选择主成分指标Xa、主成分指标Xb和主成分指标Xc来计算最终的综合实力指数。As an example, ifthe obtained subcomponent indexes include X1 , X2 , X3 , X4 , X5 , X6 , X 7, X8 , X 9 , X10 , X11 , X12 and X13 , The preset threshold is 85%. After inputting these subcomponent indexes into the factor analysis module of SPSS software, the principal component indexes output by the factor analysis module include Xa, Xb, Xc, Xd and Xe (the contribution of these principal components is weakened in turn). Among them, the cumulative contribution of Xa is 65%, the cumulative contribution of Xb is 78%, the cumulative contribution of Xc is 86%, the cumulative contribution of Xd is 90%, and the cumulative contribution of Xe is 100%. It can be seen that the main The cumulative contribution of component indicators Xa, Xb, and Xc has reached the preset threshold of 85%. Therefore, the principal component index Xa, principal component index Xb, and principal component index Xc can be selected to calculate the final comprehensive strength index.
在一些实施方式中,根据任一城市的所有主成分指标的贡献度确定任一城市的综合实力指数的方式可以为:根据各个主成分指标的贡献确定各个主成分指标所占的权重大小,再根据各个主成分指标和对应的权重对各个主成分指标进行加权平均计算,加权平均后的结果即为该城市的综合实力指数。In some implementations, the method of determining the comprehensive strength index of any city according to the contribution of all principal component indexes of any city may be: according to the contribution of each principal component index, determine the weight of each principal component index, and then According to each principal component index and the corresponding weight, the weighted average calculation of each principal component index is carried out, and the result after weighted average is the comprehensive strength index of the city.
作为一个示例,主成分指标Xa的贡献度为65%,主成分指标Xb的贡献度为13%,主成分指标Xc的贡献度为8%。则主成分指标Xb所占权重的计算方式可以为:As an example, the contribution degree of the principal component index Xa is 65%, the contribution degree of the principal component index Xb is 13%, and the contribution degree of the principal component index Xc is 8%. Then the calculation method of the weight of the principal component index Xb can be:

可以得到主成分指标Xb的权重Wb为15%。采用同样地方式,可以得到主成分指标Xa的权重Wa为76%,主成分指标Xc的权重Wc为9%。It can be obtained that the weight Wb of the principal component index Xb is 15%. Using the same method, it can be obtained that the weight Wa of the principal component index Xa is 76%, and the weight Wc of the principal component index Xc is 9%.
图4是本发明实施例的土地变化预测方法的流程图之三。如图4所示,在一些实施方式中,可以通过以下步骤生成时间成本栅格数据:Fig. 4 is the third flowchart of the land change prediction method according to the embodiment of the present invention. As shown in Figure 4, in some implementations, the time cost raster data can be generated through the following steps:
步骤410:获取待预测区域范围内的道路数据,道路数据包括栅格单元中的道路长度和相应道路的标准行驶速度。Step 410: Obtain road data within the area to be predicted. The road data includes the length of the road in the grid unit and the standard driving speed of the corresponding road.
步骤420:针对待预测区域中的任一栅格单元,根据栅格单元的道路长度和标准行驶速度确定栅格单元的时间成本。Step 420: For any grid unit in the area to be predicted, determine the time cost of the grid unit according to the road length and standard driving speed of the grid unit.
步骤430:根据每个栅格单元的时间成本制作时间成本栅格数据。Step 430: Create time cost raster data according to the time cost of each grid unit.
具体地,道路长度可以从Open Street Map中获得。众所周知,道路分为不同的等级,不同等级的道路规定有不同的道路形式速度,在本实施例中,可以参考《公路工程技术标准》得到不同等级道路对应的标准行驶速度。Specifically, the road length can be obtained from Open Street Map. As we all know, roads are divided into different grades, and different grades of roads have different road form speeds. In this embodiment, the standard driving speeds corresponding to different grades of roads can be obtained by referring to the "Technical Standards for Highway Engineering".
得到每个栅格单元所代表地区的道路长度和标准行驶速度后,根据道路长度和标准行驶速度,来计算通过栅格单元所代表地区需要的最小时间成本。可以通过下述公式来计算时间成本:After obtaining the road length and standard driving speed of the area represented by each grid unit, the minimum time cost required to pass through the area represented by the grid unit is calculated according to the road length and standard driving speed. The time cost can be calculated by the following formula:

其中,T为通过栅格单元所代表地区需要的最小时间成本,T的单位为秒;S为通过栅格单元所代表地区的最短道路长度,S的单位为千米;V为道路的标准行驶速度,V的单位为千米/小时。Among them, T is the minimum time cost required to pass through the area represented by the grid unit, and the unit of T is seconds; S is the shortest road length passing through the area represented by the grid unit, and the unit of S is kilometers; V is the standard driving of the road The unit of V is km/h.
采用同样地计算方式,可以得到待预测区域每个栅格单元的最小时间成本。所有栅格单元的最小时间成本数据可以组成一个时间成本栅格数据,时间成本栅格数据的空间分辨率为1KM。Using the same calculation method, the minimum time cost of each grid unit in the area to be predicted can be obtained. The minimum time cost data of all grid units can form a time cost raster data, and the spatial resolution of the time cost raster data is 1KM.
在一些实施方式中,预先构建的城市综合引力模型公式为:In some embodiments, the formula of the pre-built urban comprehensive gravity model is:

其中,Fx为栅格单元x受到的各个城市的吸引力之和,c=1表示待预测区域中的第一个城市,n为待预测区域中城市的总数目,Mc为第c个城市的综合实力指数,m为栅格单元x的质量,m=1,D(x,Center(c))为栅格单元x到第c个城市中心的时间成本距离值,G为预设系数,G=1。Among them, Fx is the sum of the attractiveness of each city on the grid unit x, c=1 means the first city in the area to be predicted, n is the total number of cities in the area to be predicted, and Mc is the cth city The comprehensive strength index of the city, m is the quality of the grid unit x, m=1, D(x,Center(c)) is the time cost distance value from the grid unit x to the c-th city center, and G is the preset coefficient , G=1.
需要说明的是,D(x,Center(c))值的确定方式可以为:先确定栅格单元x到第c个城市中心的最短路径,再确定该路径经过的栅格单元,最后将该路径经过的栅格单元的时间成本相加,即可得到栅格单元x到第c个城市中心的时间成本距离值。It should be noted that the method of determining the value of D(x,Center(c)) can be as follows: first determine the shortest path from the grid unit x to the c-th city center, then determine the grid unit that the path passes through, and finally set the Add the time cost of the grid units that the path passes through to get the time cost distance value from the grid unit x to the c-th city center.
图5是本发明实施例的时间成本栅格和路径的示意图。Fig. 5 is a schematic diagram of a time cost grid and a path according to an embodiment of the present invention.
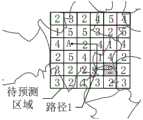
作为一个示例,参考图5,确定阴影栅格单元x到城市A的城市中心的时间成本距离值的方式可以为:先确定阴影栅格单元x到城市A的城市中心的最短路径,即路径1;再将路径1经过的栅格单元的时间成本进行加和,可以得到阴影栅格单元x到城市A的城市中心的时间成本距离值为12小时。As an example, referring to Figure 5, the way to determine the time cost distance value of the shaded grid unit x to the city center of city A can be: first determine the shortest path from the shaded grid unit x to the city center of city A, that is, path 1 ;Then add up the time cost of the grid cells passed by route 1, and the time cost distance value of the shadow grid unit x to the city center of city A can be obtained as 12 hours.
为了在不改变城市综合引力模型计算结果相对大小的前提下,使得到的城市吸引力栅格数据的数据分布更均匀,提高城市吸引力栅格数据的数据精度。在一些实施方式中,在根据每个城市的自然经济数据和城市吸引力栅格数据得到待预测区域的位置适宜性栅格数据之前,该土地变化预测方法还包括:利用预设公式对城市吸引力栅格数据进行均衡化处理。In order to make the data distribution of the urban attractiveness raster data more uniform and improve the data accuracy of the urban attractiveness raster data without changing the relative size of the calculation results of the urban comprehensive gravity model. In some implementations, before obtaining the location suitability grid data of the area to be predicted according to the natural economic data and urban attraction grid data of each city, the land change prediction method further includes: The force raster data is equalized.
在一些实施方式中,预设公式为:In some embodiments, the preset formula is:

其中,D(i)为均衡化后第i个栅格单元受到的各个城市的吸引力之和,d(i)为第i个栅格单元受到的各个城市的吸引力之和的占比,max(D)为均衡化后栅格单元受到的各个城市的吸引力之和的最大值。Among them, D(i) is the sum of the attractiveness of each city received by the i-th grid unit after equalization, and d(i) is the proportion of the sum of the attractiveness of each city received by the i-th grid unit, max(D) is the maximum value of the sum of the attractiveness of each city received by the grid unit after equalization.
具体地,在得到每个栅格单元受到的各个城市的吸引力之和后,利用预设公式,计算均衡化后的栅格单元受到的各个城市的吸引力之和。所有均衡化后的栅格单元受到的各个城市的吸引力之和组成最终的均衡化后的城市吸引力栅格数据。Specifically, after the sum of the attractiveness of each city received by each grid unit is obtained, a preset formula is used to calculate the sum of the attractiveness of each city received by the equalized grid unit. The sum of the attractiveness of each city received by all the equalized grid cells constitutes the final equalized urban attractiveness grid data.
在一些实施方式中,根据每个城市的自然经济数据和城市吸引力栅格数据得到待预测区域的位置适宜性栅格数据,包括:根据每个城市的自然经济数据和均衡化后的城市吸引力栅格数据得到位置适宜性栅格数据。In some implementations, the location suitability grid data of the area to be predicted is obtained according to the natural economic data of each city and the urban attractive grid data, including: according to the natural economic data of each city and the balanced city attractive Force grid data to get location suitability grid data.
具体地,在得到均衡化后的城市吸引力栅格数据时,根据均衡化后的城市吸引力栅格数据和每个城市的自然经济数据,来计算得到待预测区域的位置适宜性栅格数据。Specifically, when obtaining the balanced urban attractiveness grid data, calculate the location suitability grid data of the area to be predicted according to the balanced urban attractiveness grid data and the natural economic data of each city .
为了方便理解,下面通过一个具体实施例来介绍本发明实施例的土地变化预测方法。For the convenience of understanding, the land change prediction method of the embodiment of the present invention will be introduced below through a specific embodiment.
图6是本发明一个具体实施例的土地变化预测方法的流程图。如图6所示,该方法还可以包括以下步骤:Fig. 6 is a flowchart of a land change prediction method according to a specific embodiment of the present invention. As shown in Figure 6, the method may also include the following steps:
步骤610:确定待预测区域,并获取待预测区域中各个城市的土地覆被数据、自然经济数据、综合实力指标数据以及土地转换阻力值、土地转移矩阵。Step 610: Determine the area to be predicted, and obtain the land cover data, natural economic data, comprehensive strength index data, land conversion resistance value, and land transfer matrix of each city in the area to be predicted.
步骤620:针对待预测区域中的任一城市,根据城市的土地覆被数据确定城市的土地系统类型,根据城市的综合实力指标数据确定城市的综合实力指数。Step 620: For any city in the area to be predicted, determine the city's land system type according to the city's land cover data, and determine the city's comprehensive strength index according to the city's comprehensive strength index data.
步骤630:获取待预测区域范围内的道路数据,根据每个栅格单元的道路数据制作时间成本栅格数据。Step 630: Obtain road data within the area to be predicted, and create time-cost grid data according to the road data of each grid unit.
步骤640:将每个城市的综合实力指数和时间成本栅格数据输入至城市综合引力模型中,得到待预测区域的城市吸引力栅格数据。Step 640: Input the comprehensive strength index and time cost raster data of each city into the city comprehensive gravity model to obtain the urban attractiveness raster data of the region to be predicted.
步骤650:将城市吸引力栅格数据进行均衡化处理,得到均衡化后的城市吸引力栅格数据。Step 650: Perform equalization processing on the urban attractiveness grid data to obtain the equalized urban attractiveness grid data.
步骤660:根据均衡化后的城市吸引力栅格数据和每个城市的自然经济数据确定待预测区域的位置适宜性栅格数据。Step 660: Determine the location suitability grid data of the area to be predicted according to the equalized urban attraction grid data and the natural economic data of each city.
步骤670:将土地系统类型、土地转换阻力值、土地转移矩阵、位置适宜性栅格数据输入至土地变化模型中,得到待预测区域的土地变化预测结果。Step 670: Input the land system type, land conversion resistance value, land transfer matrix, and location suitability grid data into the land change model to obtain the land change prediction result of the area to be predicted.
图7是本发明实施例的土地变化预测装置的方框图。Fig. 7 is a block diagram of a land change prediction device according to an embodiment of the present invention.
如图7所示,该土地变化预测装置700包括:用于获取待预测区域中各个城市的土地数据、自然经济数据以及综合实力指标数据的获取模块710、用于针对待预测区域中的任一城市,根据城市的综合实力指标数据确定城市的综合实力指数的第一确定模块720、用于将每个城市的综合实力指数和预制的时间成本栅格数据输入至预先构建的城市综合引力模型中,得到待预测区域的城市吸引力栅格数据的城市综合引力计算模块730、用于根据每个城市的自然经济数据和城市吸引力栅格数据得到待预测区域的位置适宜性栅格数据的第二确定模块740、用于将土地数据和位置适宜性栅格数据输入至土地变化模型中,得到待预测区域的土地变化预测结果的预测模块750。As shown in Figure 7, the land
由此,通过城市综合引力计算模块730将每个城市的综合实力指数和预制的时间成本栅格数据输入至预先构建的城市综合引力模型中,得到待预测区域的城市吸引力栅格数据,通过城市吸引力栅格数据来量化城市之间的相互作用。再通过第二确定模块740根据城市吸引力栅格数据和每个城市的自然经济数据得到待预测区域的位置适宜性栅格数据。最后通过预测模块750根据土地数据和位置适宜性栅格数据确定最终的土地变化预测结果,考虑了城市之间的相互影响,有效的提升了土地变化预测的精度。Thus, through the urban comprehensive gravity calculation module 730, the comprehensive strength index of each city and the prefabricated time cost grid data are input into the pre-built urban comprehensive gravity model to obtain the urban attractiveness grid data of the area to be predicted. Urban attractiveness raster data to quantify the interaction between cities. Then, the location suitability grid data of the area to be predicted is obtained through the second determining module 740 according to the urban attraction grid data and the natural economic data of each city. Finally, the final land change prediction result is determined by the prediction module 750 according to the land data and location suitability grid data, taking into account the interaction between cities, and effectively improving the accuracy of land change prediction.
需要说明的是,本实施例的土地变化预测装置中未披露的细节,请参照本说明书实施例中土地变化预测方法的实施例中所披露的细节,此处不再赘述。It should be noted that, for details not disclosed in the land change prediction device of this embodiment, please refer to the details disclosed in the embodiment of the land change prediction method in the embodiment of this specification, and will not be repeated here.
图8示例了一种电子设备的实体结构示意图,如图8所示,该电子设备可以包括:处理器(processor)810、通信接口(Communications Interface)820、存储器(memory)830和通信总线840,其中,处理器810,通信接口820,存储器830通过通信总线840完成相互间的通信。处理器810可以调用存储器830中的逻辑指令,以执行土地变化预测方法,该方法包括:获取待预测区域中各个城市的土地数据、自然经济数据以及综合实力指标数据;针对待预测区域中的任一城市,根据任一城市的综合实力指标数据确定任一城市的综合实力指数;将每个城市的综合实力指数和预制的时间成本栅格数据输入至预先构建的城市综合引力模型中,得到待预测区域的城市吸引力栅格数据,城市吸引力栅格数据包括每个栅格单元受到的各个城市的吸引力之和;根据每个城市的自然经济数据和城市吸引力栅格数据得到待预测区域的位置适宜性栅格数据;将土地数据和位置适宜性栅格数据输入至土地变化模型中,得到待预测区域的土地变化预测结果。FIG. 8 illustrates a schematic diagram of the physical structure of an electronic device. As shown in FIG. 8, the electronic device may include: a processor (processor) 810, a communication interface (Communications Interface) 820, a memory (memory) 830, and a
此外,上述的存储器830中的逻辑指令可以通过软件功能单元的形式实现并作为独立的产品销售或使用时,可以存储在一个计算机可读取存储介质中。基于这样的理解,本发明的技术方案本质上或者说对现有技术做出贡献的部分或者该技术方案的部分可以以软件产品的形式体现出来,该计算机软件产品存储在一个存储介质中,包括若干指令用以使得一台计算机设备(可以是个人计算机,服务器,或者网络设备等)执行本发明各个实施例方法的全部或部分步骤。而前述的存储介质包括:U盘、移动硬盘、只读存储器(ROM,Read-Only Memory)、随机存取存储器(RAM,Random Access Memory)、磁碟或者光盘等各种可以存储程序代码的介质。In addition, the above logic instructions in the
另一方面,本发明还提供一种计算机程序产品,计算机程序产品包括计算机程序,计算机程序可存储在非暂态计算机可读存储介质上,计算机程序被处理器执行时,计算机能够执行上述各方法所提供的土地变化预测方法,该方法包括:获取待预测区域中各个城市的土地数据、自然经济数据以及综合实力指标数据;针对待预测区域中的任一城市,根据城市的综合实力指标数据确定城市的综合实力指数;将每个城市的综合实力指数和预制的时间成本栅格数据输入至预先构建的城市综合引力模型中,得到待预测区域的城市吸引力栅格数据,城市吸引力栅格数据包括每个栅格单元受到的各个城市的吸引力之和;根据每个城市的自然经济数据和城市吸引力栅格数据得到待预测区域的位置适宜性栅格数据;将土地数据和位置适宜性栅格数据输入至土地变化模型中,得到待预测区域的土地变化预测结果。On the other hand, the present invention also provides a computer program product. The computer program product includes a computer program. The computer program can be stored on a non-transitory computer-readable storage medium. When the computer program is executed by a processor, the computer can perform the above methods. The land change prediction method provided, the method includes: obtaining the land data, natural economic data and comprehensive strength index data of each city in the area to be predicted; for any city in the area to be predicted, according to the comprehensive strength index data of the city The comprehensive strength index of the city; the comprehensive strength index of each city and the prefabricated time cost grid data are input into the pre-built urban comprehensive gravity model to obtain the urban attractiveness grid data of the area to be predicted, and the urban attractiveness grid The data includes the sum of the attractiveness of each city received by each grid unit; the location suitability grid data of the area to be predicted is obtained according to the natural economic data of each city and the urban attractiveness grid data; the land data and the location suitability Input the characteristic raster data into the land change model to obtain the land change prediction results of the area to be predicted.
又一方面,本发明还提供一种非暂态计算机可读存储介质,其上存储有计算机程序,该计算机程序被处理器执行时实现以执行上述各方法提供的土地变化预测方法,该方法包括:获取待预测区域中各个城市的土地数据、自然经济数据以及综合实力指标数据;针对待预测区域中的任一城市,根据城市的综合实力指标数据确定城市的综合实力指数;将每个城市的综合实力指数和预制的时间成本栅格数据输入至预先构建的城市综合引力模型中,得到待预测区域的城市吸引力栅格数据,城市吸引力栅格数据包括每个栅格单元受到的各个城市的吸引力之和;根据每个城市的自然经济数据和城市吸引力栅格数据得到待预测区域的位置适宜性栅格数据;将土地数据和位置适宜性栅格数据输入至土地变化模型中,得到待预测区域的土地变化预测结果。In yet another aspect, the present invention also provides a non-transitory computer-readable storage medium, on which a computer program is stored, and when the computer program is executed by a processor, it is implemented to perform the land change prediction method provided by the above methods, the method includes : Obtain the land data, natural economic data and comprehensive strength index data of each city in the area to be predicted; for any city in the area to be predicted, determine the comprehensive strength index of the city according to the comprehensive strength index data of the city; The comprehensive strength index and the prefabricated time cost grid data are input into the pre-built urban comprehensive gravity model to obtain the urban attractive grid data of the area to be predicted. The urban attractive grid data includes the urban attractiveness of each grid unit. The sum of attractiveness; according to the natural economic data and urban attractiveness grid data of each city, the location suitability grid data of the area to be predicted is obtained; the land data and location suitability grid data are input into the land change model, Obtain the land change prediction results of the area to be predicted.
以上所描述的装置实施例仅仅是示意性的,其中作为分离部件说明的单元可以是或者也可以不是物理上分开的,作为单元显示的部件可以是或者也可以不是物理单元,即可以位于一个地方,或者也可以分布到多个网络单元上。可以根据实际的需要选择其中的部分或者全部模块来实现本实施例方案的目的。本领域普通技术人员在不付出创造性的劳动的情况下,即可以理解并实施。The device embodiments described above are only illustrative, and the units described as separate components may or may not be physically separated, and the components shown as units may or may not be physical units, that is, they may be located in one place , or can also be distributed to multiple network elements. Part or all of the modules can be selected according to actual needs to achieve the purpose of the solution of this embodiment. It can be understood and implemented by those skilled in the art without any creative efforts.
通过以上的实施方式的描述,本领域的技术人员可以清楚地了解到各实施方式可借助软件加必需的通用硬件平台的方式来实现,当然也可以通过硬件。基于这样的理解,上述技术方案本质上或者说对现有技术做出贡献的部分可以以软件产品的形式体现出来,该计算机软件产品可以存储在计算机可读存储介质中,如ROM/RAM、磁碟、光盘等,包括若干指令用以使得一台计算机设备(可以是个人计算机,服务器,或者网络设备等)执行各个实施例或者实施例的某些部分的方法。Through the above description of the implementations, those skilled in the art can clearly understand that each implementation can be implemented by means of software plus a necessary general-purpose hardware platform, and of course also by hardware. Based on this understanding, the essence of the above technical solution or the part that contributes to the prior art can be embodied in the form of software products, and the computer software products can be stored in computer-readable storage media, such as ROM/RAM, magnetic discs, optical discs, etc., including several instructions to make a computer device (which may be a personal computer, server, or network device, etc.) execute the methods of various embodiments or some parts of the embodiments.
最后应说明的是:以上实施例仅用以说明本发明的技术方案,而非对其限制;尽管参照前述实施例对本发明进行了详细的说明,本领域的普通技术人员应当理解:其依然可以对前述各实施例所记载的技术方案进行修改,或者对其中部分技术特征进行等同替换;而这些修改或者替换,并不使相应技术方案的本质脱离本发明各实施例技术方案的精神和范围。具体地,在得到每个栅格单元受到的各个城市的吸引力之和后,利用预设公式,计算均衡化后的栅格单元受到的各个城市的吸引力之和。所有均衡化后的栅格单元受到的各个城市的吸引力之和组成最终的均衡化后的城市吸引力栅格数据。Finally, it should be noted that: the above embodiments are only used to illustrate the technical solutions of the present invention, rather than to limit them; although the present invention has been described in detail with reference to the foregoing embodiments, those of ordinary skill in the art should understand that: it can still be Modifications are made to the technical solutions described in the foregoing embodiments, or equivalent replacements are made to some of the technical features; and these modifications or replacements do not make the essence of the corresponding technical solutions deviate from the spirit and scope of the technical solutions of the various embodiments of the present invention. Specifically, after the sum of the attractiveness of each city received by each grid unit is obtained, a preset formula is used to calculate the sum of the attractiveness of each city received by the equalized grid unit. The sum of the attractiveness of each city received by all the equalized grid cells constitutes the final equalized urban attractiveness grid data.
Claims (8)
Translated fromChinese


Priority Applications (1)
| Application Number | Priority Date | Filing Date | Title |
|---|---|---|---|
| CN202310419057.4ACN116151490B (en) | 2023-04-19 | 2023-04-19 | Land change prediction method, apparatus, electronic device and storage medium |
Applications Claiming Priority (1)
| Application Number | Priority Date | Filing Date | Title |
|---|---|---|---|
| CN202310419057.4ACN116151490B (en) | 2023-04-19 | 2023-04-19 | Land change prediction method, apparatus, electronic device and storage medium |
Publications (2)
| Publication Number | Publication Date |
|---|---|
| CN116151490A CN116151490A (en) | 2023-05-23 |
| CN116151490Btrue CN116151490B (en) | 2023-06-27 |
Family
ID=86352852
Family Applications (1)
| Application Number | Title | Priority Date | Filing Date |
|---|---|---|---|
| CN202310419057.4AActiveCN116151490B (en) | 2023-04-19 | 2023-04-19 | Land change prediction method, apparatus, electronic device and storage medium |
Country Status (1)
| Country | Link |
|---|---|
| CN (1) | CN116151490B (en) |
Family Cites Families (4)
| Publication number | Priority date | Publication date | Assignee | Title |
|---|---|---|---|---|
| CN110472882B (en)* | 2019-08-21 | 2023-07-28 | 河南大学 | Urban development land suitability evaluation method based on principal component analysis |
| WO2021152593A1 (en)* | 2020-01-29 | 2021-08-05 | Urban Dashboard Ltd | Computerized-system and computerized-method to calculate an economic feasibility analysis for an urban planning model |
| CN111340285A (en)* | 2020-02-24 | 2020-06-26 | 河南大学 | Quantification method for urban construction land distribution in homeland space planning |
| CN115859765B (en)* | 2022-09-29 | 2023-12-08 | 中山大学 | Prediction methods, devices, equipment and storage media for urban expansion |
- 2023
- 2023-04-19CNCN202310419057.4Apatent/CN116151490B/enactiveActive
Also Published As
| Publication number | Publication date |
|---|---|
| CN116151490A (en) | 2023-05-23 |
Similar Documents
| Publication | Publication Date | Title |
|---|---|---|
| Liang et al. | The effects of locational factors on the housing prices of residential communities: The case of Ningbo, China | |
| CN110472882A (en) | City development land suitability evaluation method based on principal component analysis | |
| He et al. | Simultaneously simulate vertical and horizontal expansions of a future urban landscape: A case study in Wuhan, Central China | |
| CN112069573A (en) | City group space simulation method, system and equipment based on cellular automaton | |
| Rui et al. | Network-constrained and category-based point pattern analysis for Suguo retail stores in Nanjing, China | |
| CN102750427A (en) | Urban traffic planning simulation method and system based on multi-agent activity model | |
| Zhong et al. | Distinguishing the land use effects of road pricing based on the urban form attributes | |
| Zhuang et al. | Effects of land and building usage on population, land price and passengers in station areas: A case study in Fukuoka, Japan | |
| CN114548811B (en) | Airport reachability detection method and device, electronic equipment and storage medium | |
| Yu et al. | Discovering spatiotemporal patterns and urban facilities determinants of cycling activities in Beijing | |
| CN107506872A (en) | A kind of residential block part throttle characteristics and the Categorical research method of model prediction | |
| Fu et al. | Exploration of the spatiotemporal heterogeneity of metro ridership prompted by built environment: A multi‐source fusion perspective | |
| Yao et al. | Forecasting passenger flow distribution on holidays for urban rail transit based on destination choice behavior analysis | |
| Zhou et al. | Pedestrian evacuation time model for urban metro hubs based on multiple video sequences data | |
| Fan et al. | How does upzoning impact land use and transport: a case study of Seattle | |
| CN108717642A (en) | A kind of Supermarket Location method based on GIS | |
| Liu et al. | Exploring the spatial relationship between urban built environment and green travel: An improved semi-parametric GWR approach | |
| CN116151490B (en) | Land change prediction method, apparatus, electronic device and storage medium | |
| Zhang et al. | Examining Built Environment Effects on Metro Ridership at Station‐to‐Station Level considering Circle Heterogeneity: A Case Study from Xi’an, China | |
| Zhang et al. | Influence of POI accessibility on temporal–spatial differentiation of housing prices: A case study of Hangzhou, China | |
| On-Ouen et al. | Optimized selection of motorcycle battery swapping stations under flexible demand by using distance function and gis technique | |
| CN117648431A (en) | Urban street life quality assessment method and device, electronic equipment and storage medium | |
| Wang et al. | Towards intercity mobility system–insights into the spatial interaction gravity model and determination approach | |
| Lee et al. | Capturing the distance decay effect of amenities on housing price using explainable artificial intelligence | |
| Tong et al. | Detecting anomalous commuting patterns: Mismatch between urban land attractiveness and commuting activities |
Legal Events
| Date | Code | Title | Description |
|---|---|---|---|
| PB01 | Publication | ||
| PB01 | Publication | ||
| SE01 | Entry into force of request for substantive examination | ||
| SE01 | Entry into force of request for substantive examination | ||
| GR01 | Patent grant | ||
| GR01 | Patent grant |