CN115328796A - Software vulnerability auxiliary positioning method and system for ARM architecture - Google Patents
Software vulnerability auxiliary positioning method and system for ARM architectureDownload PDFInfo
- Publication number
- CN115328796A CN115328796ACN202211013175.7ACN202211013175ACN115328796ACN 115328796 ACN115328796 ACN 115328796ACN 202211013175 ACN202211013175 ACN 202211013175ACN 115328796 ACN115328796 ACN 115328796A
- Authority
- CN
- China
- Prior art keywords
- node
- instruction
- crash
- variable
- information
- Prior art date
- Legal status (The legal status is an assumption and is not a legal conclusion. Google has not performed a legal analysis and makes no representation as to the accuracy of the status listed.)
- Granted
Links
Images


Classifications
- G—PHYSICS
- G06—COMPUTING OR CALCULATING; COUNTING
- G06F—ELECTRIC DIGITAL DATA PROCESSING
- G06F11/00—Error detection; Error correction; Monitoring
- G06F11/36—Prevention of errors by analysis, debugging or testing of software
- G06F11/362—Debugging of software
- G06F11/3644—Debugging of software by instrumenting at runtime
- G—PHYSICS
- G06—COMPUTING OR CALCULATING; COUNTING
- G06F—ELECTRIC DIGITAL DATA PROCESSING
- G06F11/00—Error detection; Error correction; Monitoring
- G06F11/36—Prevention of errors by analysis, debugging or testing of software
- G06F11/362—Debugging of software
- G06F11/366—Debugging of software using diagnostics
Landscapes
- Engineering & Computer Science (AREA)
- Theoretical Computer Science (AREA)
- Computer Hardware Design (AREA)
- Quality & Reliability (AREA)
- Physics & Mathematics (AREA)
- General Engineering & Computer Science (AREA)
- General Physics & Mathematics (AREA)
- Debugging And Monitoring (AREA)
Abstract
Translated fromChinese
Description
Translated fromChinese技术领域technical field
本发明属于信息技术领域,更具体地,涉及一种用于ARM架构的软件漏洞辅助定位方法和系统。The present invention belongs to the field of information technology, and more specifically relates to a method and system for assisted positioning of software vulnerabilities for ARM architecture.
背景技术Background technique
随着技术的发展,软件的规模和复杂程度都在不断增加,其中不可避免地存在各种各样的安全漏洞,导致程序的异常终止、崩溃。为了确认软件崩溃的根本原因,软件开发人员和安全分析师需要识别与崩溃相关的程序语句,分析这些语句,并最终找出软件漏洞的源头。目前的软件崩溃分析采用的方法主要是记录与重放技术和核心转储文件分析。With the development of technology, the scale and complexity of software are constantly increasing, and there are inevitably various security holes in it, which lead to abnormal termination and crash of the program. To confirm the root cause of a software crash, software developers and security analysts need to identify the program statements related to the crash, analyze these statements, and finally find the source of the software vulnerability. The methods used in the current software crash analysis are mainly record and replay technology and core dump file analysis.
1.记录与重放技术技术人员经常依靠记录与重放技术来辅助追踪程序崩溃原因。记录与重放技术会实时记录程序运行时内存值与线程上下文内容的改变,程序崩溃后就可以利用之前记录得到的日志信息重放程序的崩溃过程,进而辅助技术人员分析诊断程序的漏洞。Castor是一个有硬件支持的商用级的记录与重放工具,因为有硬件插桩机制,它的记录与重放过程的开销较低。Ochiai和Tarantula这两个工具通过重放记录正常的控制流和会导致线程崩溃的执行流来定位导致崩溃的关键指令。1. Record and replay technology Technicians often rely on record and replay technology to help track down the cause of program crashes. The record and replay technology will record the changes of the memory value and thread context when the program is running in real time. After the program crashes, the previously recorded log information can be used to replay the crash process of the program, and then assist technicians in analyzing and diagnosing program vulnerabilities. Castor is a commercial-grade recording and playback tool with hardware support. Because of the hardware instrumentation mechanism, its recording and playback process has low overhead. Two tools, Ochiai and Tarantula, locate the critical instruction that causes the crash by replaying the recorded normal control flow and the execution flow that causes the thread to crash.
2.核心转储文件分析核心转储文件是线程在接收到某些致命信号(DeadlySignal)而终止运行时,由操作系统产生的记录此时线程地址空间的内容以及有关线程状态的其他信息的文件。一般而言,操作系统产生的核心转储文件可以用来分析程序等崩溃点与崩溃原因,进而为漏洞溯源与修复提供帮助。Linux平台常用gdb代码调试工具来分析核心转出文件,Windows平台的工具有Windbg等。由于核心转储文件保存了程序崩溃前的上下文信息(包括寄存器值以及线程地址空间的状态),它对与定位程序崩溃原因也起到了至关重要的作用。例如RETracer与!analyze,其是完全基于核心转储文件的软件漏洞分析工具。一方面由于核心转储文件所携带信息的局限性,这两种工具也仅仅只有帮助分类软件崩溃报告的功能,另一方面正是因为它们完全基于核心转储文件做漏洞分析,使得这两种工具无法分析遇到类似缓冲区溢出攻击导致内存区域损坏严重的程序崩溃,因为遭到恶意篡改的内存区域会使得内存信息大量丢失,即核心转储文件本身的完整性会受到破坏。2. Analysis of the core dump file The core dump file is a file generated by the operating system to record the contents of the thread address space and other information about the thread state when the thread terminates after receiving some deadly signal (DeadlySignal). . Generally speaking, the core dump file generated by the operating system can be used to analyze the crash point and cause of the program, etc., and then provide help for vulnerability tracing and repair. The gdb code debugging tool is often used on the Linux platform to analyze the core transfer file, and the tools on the Windows platform include Windbg and so on. Since the core dump file saves the context information (including register values and the state of the thread address space) before the program crashes, it also plays a vital role in locating the cause of the program crash. For example RETracer with ! analyze, which is a software vulnerability analysis tool based entirely on core dump files. On the one hand, due to the limitations of the information carried by core dump files, these two tools only have the function of helping to classify software crash reports; The tool cannot analyze the crash of a program that encounters a buffer overflow attack that causes serious damage to the memory area, because the maliciously tampered memory area will cause a large amount of memory information to be lost, that is, the integrity of the core dump file itself will be destroyed.
综上所述,现有的崩溃后程序分析存在以下不足:对于记录重放技术,其会造成较大的时间开销,影响程序执行;对于基于核心转储的分析,其可与硬件追踪技术一同用于分析过程,但仍存在分析过程繁琐、耗时长等问题。目前,ARM64架构上的现有技术无法对软件崩溃进行大规模的自动化漏洞诊断。To sum up, the existing post-crash program analysis has the following deficiencies: For the recording and playback technology, it will cause a large time overhead and affect the program execution; for the core dump-based analysis, it can be used together with the hardware tracing technology. It is used in the analysis process, but there are still problems such as cumbersome analysis process and long time consumption. Currently, existing technologies on the ARM64 architecture are unable to perform large-scale automated vulnerability diagnosis for software crashes.
发明内容Contents of the invention
针对现有技术的缺陷,本发明的目的在于提供一种用于ARM架构的软件漏洞辅助定位方法和系统,旨在解决现有技术无法对ARM64架构上软件崩溃进行大规模的自动化漏洞诊断的问题。Aiming at the defects of the prior art, the purpose of the present invention is to provide a method and system for assisted positioning of software vulnerabilities for the ARM architecture, aiming to solve the problem that the prior art cannot perform large-scale automated vulnerability diagnosis on software crashes on the ARM64 architecture .
为实现上述目的,第一方面,本发明提供了一种用于ARM架构的软件漏洞辅助定位方法,该方法包括:In order to achieve the above object, in the first aspect, the present invention provides a method for assisted positioning of software vulnerabilities for ARM architecture, the method comprising:
S1.运行待分析软件并触发漏洞使其崩溃,提取核心转储文件和崩溃前执行的指令序列,所述核心转储文件保存线程崩溃时的内存布局信息和寄存器信息;S1. Run the software to be analyzed and trigger the vulnerability to make it crash, extract the core dump file and the instruction sequence executed before the crash, and the core dump file saves the memory layout information and register information when the thread crashes;
S2.扫描核心转储文件,结合崩溃前执行的指令序列进行逆向执行,恢复出崩溃前每条指令内存地址信息和寄存器信息;S2. Scan the core dump file, perform reverse execution combined with the instruction sequence executed before the crash, and restore the memory address information and register information of each instruction before the crash;
S3.从崩溃点出发,结合恢复出的信息,逆向追踪与崩溃点的数据有数据依赖关系的指令,得到直接或间接导致线程崩溃的指令序列。S3. Starting from the crash point, combined with the recovered information, reversely trace the instructions that have a data dependency relationship with the data at the crash point, and obtain the instruction sequence that directly or indirectly causes the thread to crash.
优选地,步骤S1包括以下子步骤:Preferably, step S1 includes the following sub-steps:
S11.通过ETM设备采集待分析软件执行过程中的硬件追踪信息;S11. Collect hardware tracking information during the execution of the software to be analyzed through the ETM device;
S12.通过操作系统层级的修改,在运行待分析软件时生成的核心转储文件中加入硬件追踪信息;S12. By modifying the operating system level, adding hardware tracking information to the core dump file generated when running the software to be analyzed;
S13.对修改后的核心转储文件进行解析和提取,得到崩溃前执行的指令序列。S13. Analyzing and extracting the modified core dump file to obtain the sequence of instructions executed before the crash.
优选地,步骤S12具体如下:将提取到硬件最终信息转化为ELF文件的LOAD段,添加至核心转储文件最后一个LOAD段的后面。Preferably, step S12 is specifically as follows: convert the extracted final hardware information into the LOAD segment of the ELF file, and add it to the back of the last LOAD segment of the core dump file.
优选地,步骤S2具体如下:Preferably, step S2 is specifically as follows:
S21.针对AARCH64架构,为每条指令构造Use节点与Define节点,分别代表该指令对一个寄存器或者内存对象的读与写操作;S21. For the AARCH64 architecture, construct a Use node and a Define node for each instruction, respectively representing the read and write operations of the instruction to a register or memory object;
S22.将各个节点按控制流顺序以及对相同寄存器或内存对象的读写顺序相连,从而构造出一条Use-Define链;S22. Connect each node according to the order of control flow and the order of reading and writing to the same register or memory object, thereby constructing a Use-Define chain;
S23.逆向遍历控制流的Use-Define链,补全每个节点中寄存器或内存对象的值及其内存地址。S23. Reversely traverse the Use-Define chain of the control flow, and complete the value of the register or memory object and its memory address in each node.
优选地,步骤S23中,对于Use节点,变量的值为读取该变量时,该变量的值;对于Define节点,变量的值为被修改变量在修改后的值。Preferably, in step S23, for the Use node, the value of the variable is the value of the variable when the variable is read; for the Define node, the value of the variable is the modified value of the variable to be modified.
优选地,各个节点代表对象的值的推断遵循以下五条规则:Preferably, the inference of the value of each node representing an object follows the following five rules:
(1)该节点到Use-Define链尾之间的所有节点的变量都不是该节点的干预变量,从核心转储文件中读取该节点上的变量对应的值;(1) The variables of all nodes between the node and the end of the Use-Define chain are not intervention variables of the node, and the values corresponding to the variables on the node are read from the core dump file;
(2)该节点顺着指令流往前的第一个与该节点操作变量相同的Use节点的变量值已知,认为该节点的变量值与此Use节点的变量值一致;(2) The variable value of the first Use node that is the same as the operating variable of the node along the instruction flow of the node is known, and the variable value of the node is considered to be consistent with the variable value of the Use node;
(3)若该节点为Define节点且其变量值已推断得知,则顺着指令流往前的第一个与其操作变量相同的Use节点的变量值与其变量值一致;(3) If the node is a Define node and its variable value has been inferred, then the variable value of the first Use node that is the same as its operation variable along the instruction flow is consistent with its variable value;
(4)该节点为Define节点且其变量值可通过指令语义推断出来;(4) The node is a Define node and its variable value can be inferred through instruction semantics;
(5)若该节点所在的指令为可逆指令,则通过所述可逆指令语义恢复得到该指令其他节点的变量值;(5) If the instruction where the node is located is a reversible instruction, the variable values of other nodes of the instruction are obtained by restoring the semantics of the reversible instruction;
(6)该节点为Define节点且其修改前的值已知,则逆着指令流往后的第一个与其操作变量相同的Use节点的变量值与其变量值一致。(6) The node is a Define node and its value before modification is known, then the variable value of the first Use node that is the same as its operation variable after going against the instruction flow is consistent with its variable value.
优选地,步骤S3具体为:逆Use-Define链追踪与崩溃点的数据有数据依赖关系的指令,标记这些指令为污点指令,追踪遵循以下规则:Preferably, step S3 is specifically: reverse the Use-Define chain to trace instructions that have a data dependency relationship with the data of the crash point, mark these instructions as tainted instructions, and follow the following rules for tracing:
1)若被污染的节点是Define节点,则将污点传播给该Define节点对应指令的其它Use节点的对象;1) If the polluted node is a Define node, spread the stain to objects of other Use nodes corresponding to the instructions of the Define node;
2)若被污染的节点是Use节点,在没有干预变量干扰的情况下,将污点沿着控制流逆向传播给最近的操作变量相同的Define节点;2) If the tainted node is a Use node, in the absence of intervention variable interference, the taint is propagated backwards along the control flow to the nearest Define node with the same operational variable;
3)根据相应指令语义,将污点传播给相应节点的对象;3) Propagate the taint to the object of the corresponding node according to the semantics of the corresponding instruction;
4)若被污染的节点是内存访问节点,则将污点传播给参与地址运算的寄存器的Use节点。4) If the polluted node is a memory access node, spread the stain to the Use node of the register involved in the address operation.
为实现上述目的,第二方面,本发明提供了一种用于ARM架构的软件漏洞辅助定位系统,包括:包括处理器和存储器;In order to achieve the above object, in the second aspect, the present invention provides a software vulnerability assisted location system for ARM architecture, including: including a processor and a memory;
所述处理器用于存储计算机执行指令;the processor is configured to store computer-executable instructions;
所述处理器用于执行所述计算机执行指令,使得第一方面所述的方法被执行。The processor is configured to execute the computer-implemented instructions, so that the method described in the first aspect is performed.
总体而言,通过本发明所构思的以上技术方案与现有技术相比,具有以下有益效果:Generally speaking, compared with the prior art, the above technical solution conceived by the present invention has the following beneficial effects:
本发明提出一种用于ARM架构的软件漏洞辅助定位方法和系统,通过逆向执行和逆向污点分析,帮助广大软件开发者和安全分析人员快速定位导致线程崩溃程序的程序缺陷;通过将ETM硬件记录的控制流数据置于核心转储文件内,有效地降低了用于崩溃程序分析的源数据的复杂度,简化了用户分析的流程;通过硬件辅助的追踪技术,减少软件缺陷调试中机器带来的额外开销,保证轻量化的同时准确诊断漏洞。The present invention proposes a method and system for assisted positioning of software vulnerabilities for ARM architecture, through reverse execution and reverse taint analysis, to help software developers and security analysts quickly locate program defects that cause thread crash programs; by recording ETM hardware The control flow data of the program is placed in the core dump file, which effectively reduces the complexity of the source data used for crash program analysis and simplifies the user analysis process; through hardware-assisted tracking technology, it reduces the number of errors caused by the machine during software defect debugging. The additional overhead ensures lightweight and accurate diagnosis of vulnerabilities.
附图说明Description of drawings
图1为本发明提供的一种用于ARM架构的软件漏洞辅助定位方法。FIG. 1 is a software vulnerability assisted location method for ARM architecture provided by the present invention.
图2为本发明实施例提供的Coresight系统数据流动图。Fig. 2 is a data flow diagram of the Coresight system provided by the embodiment of the present invention.
图3是本发明实施例提供的Coresight追踪数据要素图。Fig. 3 is an element diagram of Coresight tracking data provided by an embodiment of the present invention.
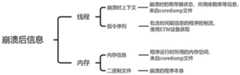
图4是本发明实施例提供的崩溃后信息组成示意图。Fig. 4 is a schematic diagram of post-crash information composition provided by an embodiment of the present invention.
具体实施方式Detailed ways
为了使本发明的目的、技术方案及优点更加清楚明白,以下结合附图及实施例,对本发明进行进一步详细说明。应当理解,此处所描述的具体实施例仅用以解释本发明,并不用于限定本发明。In order to make the object, technical solution and advantages of the present invention clearer, the present invention will be further described in detail below in conjunction with the accompanying drawings and embodiments. It should be understood that the specific embodiments described here are only used to explain the present invention, not to limit the present invention.
图1为本发明提供的一种用于ARM架构的软件漏洞辅助定位方法。如图1所示,该方法包括:FIG. 1 is a software vulnerability assisted location method for ARM architecture provided by the present invention. As shown in Figure 1, the method includes:
步骤S1.运行待分析软件并触发漏洞使其崩溃,提取核心转储文件和崩溃前执行的指令序列,所述核心转储文件保存线程崩溃时的内存布局信息和寄存器信息。Step S1. Run the software to be analyzed and trigger the vulnerability to cause it to crash, and extract the core dump file and the instruction sequence executed before the crash. The core dump file saves the memory layout information and register information when the thread crashes.
优选地,步骤S1包括以下子步骤:Preferably, step S1 includes the following sub-steps:
S11.通过ETM设备采集待分析软件执行过程中的硬件追踪信息。S11. Collect hardware tracking information during the execution of the software to be analyzed through the ETM device.
图2为本发明实施例提供的Coresight系统数据流动图。如图2所示,oresight系统,主要有三个组件:Fig. 2 is a data flow diagram of the Coresight system provided by the embodiment of the present invention. As shown in Figure 2, the oresight system mainly has three components:
(1)追踪源(Trace Sources):负责追踪的Coresight组件,这些主要由依附在Cortex Core上的ETM(Embedded Trace Macrocells)设备构成,追踪在对应芯片上运行的程序的执行情况。每个Cortex核心都有自己的ETM。(1) Trace Sources: Coresight components responsible for tracking, which are mainly composed of ETM (Embedded Trace Macrocells) devices attached to the Cortex Core, and track the execution of programs running on the corresponding chips. Each Cortex core has its own ETM.
(2)追踪基础架构(Trace Infrastructure):追踪到的信息在传递过程中所需要的中间Coresight组件,引导和复用源到汇之间的追踪信息。漏斗(funnel)负责将接收到多个ETM设备上的追踪信息汇总到一起。此外该部分组件还可以控制追踪事件的启停。(2) Trace Infrastructure (Trace Infrastructure): The intermediate Coresight components required in the transmission process of the traced information guide and reuse the trace information between the source and the sink. The funnel is responsible for aggregating trace information received from multiple ETM devices. In addition, this part of the component can also control the start and stop of tracking events.
(3)追踪汇(Trace Sinks):最终接收追踪到的信息的组件,将追踪数据与追踪ID联系起来,并将接收到的数据格式化为Coresight框架的格式。它可以是芯片上的缓冲区(ETB),也可以是系统分配的缓冲区(ETR)用来存储追踪到的数据。此外,还有一个TPIU组件(未在图中显示),负责将追踪数据发送给外界。(3) Trace sinks (Trace Sinks): The component that finally receives the traced information, associates the trace data with the trace ID, and formats the received data into the format of the Coresight framework. It can be an on-chip buffer (ETB) or a system-allocated buffer (ETR) to store tracked data. Additionally, there is a TPIU component (not shown in the diagram) responsible for sending trace data to the outside world.
采用Coresight架构组件,可以通过硬件的方式获取程序的执行指令流。从系统架构图可以看出,追踪信息首先在依附在每个核心对应的ETM设备上产生,经过基础架构的引导、复制,最终可以在ETB/ETR中获取指定追踪事件的追踪信息。Using Coresight architecture components, the execution instruction flow of the program can be obtained through hardware. It can be seen from the system architecture diagram that the tracking information is first generated on the ETM device attached to each core, and after the guidance and replication of the infrastructure, the tracking information of the specified tracking event can finally be obtained in the ETB/ETR.
本发明的应用场景为具备ETM硬件芯片的运行在ARM架构下的以Linux各发行版为操作系统的计算机。在ETM芯片上工作的是由ARM公司提出并研发的Coresight架构。本发明首先通过操作系统提供的线程id,根据Coresight系统提供的接口,从芯片的缓冲区中,获得被追踪的线程在计算机上所执行的指令的控制流,包括程序执行过程中所有分支指令的源地址和目的地址。Coresight系统提供的控制流信息中除了最基本的指令的二进制编码,指令在内存中的地址,还包括追踪时每条指令的时间戳信息以及额外一些控制信息等。图3是本发明实施例提供的Coresight追踪数据要素图。如图3所示,Coresight设备中追踪数据的数据元素组成。其中包括追踪的地址及其值,时间戳等信息。在提取控制流的过程中,本发明只取所需要的时间戳信息和指令地址,指令二进制编码和线程id。The application scenario of the present invention is a computer equipped with ETM hardware chips running under the ARM framework and using various distribution versions of Linux as the operating system. What works on the ETM chip is the Coresight architecture proposed and developed by ARM. The present invention first obtains the control flow of the instructions executed by the tracked thread on the computer from the buffer of the chip according to the interface provided by the Coresight system through the thread id provided by the operating system, including all branch instructions in the program execution process. source and destination addresses. In addition to the binary code of the most basic instruction and the address of the instruction in memory, the control flow information provided by the Coresight system also includes the timestamp information of each instruction during tracking and some additional control information. Fig. 3 is an element diagram of Coresight tracking data provided by an embodiment of the present invention. As shown in Figure 3, the data elements of the tracking data in the Coresight device. This includes tracked addresses and their values, timestamps, and more. In the process of extracting the control flow, the present invention only takes the required time stamp information, instruction address, instruction binary code and thread id.
S12.通过操作系统层级的修改,在运行待分析软件时生成的核心转储文件中加入硬件追踪信息。S12. By modifying the operating system level, adding hardware tracking information to the core dump file generated when running the software to be analyzed.
获得崩溃线程在崩溃前的指令控制流后,本发明将其整合进linux内核产生的有关该线程的核心转储文件中。图4是本发明实施例提供的崩溃后信息组成示意图。本发明根据这些如图4所示的崩溃后信息进行漏洞定位分析。After obtaining the instruction control flow of the crashed thread before the crash, the present invention integrates it into the core dump file related to the thread generated by the linux kernel. Fig. 4 is a schematic diagram of post-crash information composition provided by an embodiment of the present invention. The present invention performs vulnerability location analysis according to the post-crash information shown in FIG. 4 .
核心转储文件通常包括:程序崩溃时时的内存、寄存器状态、堆栈指针、内存映射信息、函数调用堆栈信息等内容,这些内容均为线程崩溃时Linux内核所能保存的上下文信息。A core dump file usually includes: memory, register status, stack pointer, memory mapping information, function call stack information, etc. when the program crashes, all of which are context information that the Linux kernel can save when the thread crashes.
核心转储文件本身是一个ELF文件,包含:ELF程序与文件头。其中,ELF程序部分包括:ELF程序头与程序内容。ELF文件头包含:该文件的文件类型、文件格式等基础信息。ELF程序中,程序头存有ELF程序中各个段的入口地址信息,其中,包括NOTE段与LOAD段的入口。ELF程序的NOTE段存储有各类程序运行所需的状态信息,如:线程状态、CPU使用、线程ID、各寄存器值等。其中,LOAD段包含程序运行时的所用的内存信息。The core dump file itself is an ELF file, including: ELF program and file header. Wherein, the ELF program part includes: ELF program header and program content. The ELF file header includes basic information such as the file type and file format of the file. In the ELF program, the program header stores the entry address information of each segment in the ELF program, including the entries of the NOTE segment and the LOAD segment. The NOTE section of the ELF program stores state information required for the operation of various programs, such as: thread state, CPU usage, thread ID, and register values. Among them, the LOAD section contains the memory information used when the program is running.
优选地,步骤S12具体如下:将提取到硬件最终信息转化为ELF文件的LOAD段,添加至核心转储文件最后一个LOAD段的后面。Preferably, step S12 is specifically as follows: convert the extracted final hardware information into the LOAD segment of the ELF file, and add it to the back of the last LOAD segment of the core dump file.
S13.对修改后的核心转储文件进行解析和提取,得到崩溃前执行的指令序列。S13. Analyzing and extracting the modified core dump file to obtain the sequence of instructions executed before the crash.
步骤S2.扫描核心转储文件,结合崩溃前执行的指令序列进行逆向执行,恢复出崩溃前每条指令内存地址信息和寄存器信息。Step S2. Scan the core dump file, perform reverse execution combined with the sequence of instructions executed before the crash, and restore the memory address information and register information of each instruction before the crash.
由ETM设备采集的控制流序列包含在程序运行过程中执行过的所有跳转指令,由于ARM平台指令集定长,可借助跳转指令,根据崩溃时的内存状态,恢复出线程的完整控制流序列。另外ETM设备能够采集CPU多个核心的控制流信息,并对每控制流信息做了时间戳和线程ID的记录,这使得本发明能够更好地处理有对同一内存区域进行访存的多线程程序的数据恢复工作。The control flow sequence collected by the ETM device includes all the jump instructions executed during the running of the program. Since the instruction set of the ARM platform is fixed in length, the complete control flow of the thread can be restored according to the memory state at the time of the crash by means of the jump instruction. sequence. In addition, the ETM device can collect control flow information of multiple cores of the CPU, and record time stamp and thread ID for each control flow information, which enables the present invention to better handle multi-threads that have access to the same memory area Program for data recovery work.
优选地,步骤S2具体如下:Preferably, step S2 is specifically as follows:
S21.针对AARCH64架构,为每条指令构造Use节点与Define节点,分别代表该指令对一个寄存器或者内存对象的读与写操作。S21. For the AARCH64 architecture, construct a Use node and a Define node for each instruction, which respectively represent the read and write operations of the instruction on a register or memory object.
节点可以视为一个结构体,包含这个节点的类型(Use或者Define),节点代表的对象(寄存器或是一块内存,若是内存,则为内存地址),对象所存的值。若是Define节点还有一个指针数组,数组的各成员指向写操作中等号右边的各个对象。A node can be regarded as a structure, including the type of the node (Use or Define), the object represented by the node (a register or a piece of memory, if it is memory, it is the memory address), and the value stored in the object. If the Define node also has a pointer array, each member of the array points to each object on the right side of the equal sign in the write operation.
S22.将各个节点按控制流顺序以及对相同寄存器或内存对象的读写顺序相连,从而构造出一条Use-Define链。S22. Connect each node according to the sequence of control flow and the sequence of reading and writing to the same register or memory object, so as to construct a Use-Define chain.
S23.逆向遍历控制流的Use-Define链,补全每个节点中寄存器或内存对象的值及其内存地址。S23. Reversely traverse the Use-Define chain of the control flow, and complete the value of the register or memory object and its memory address in each node.
优选地,步骤S23中,对于Use节点,变量的值为读取该变量时,该变量的值;对于Define节点,变量的值为被修改变量在修改后的值。Preferably, in step S23, for the Use node, the value of the variable is the value of the variable when the variable is read; for the Define node, the value of the variable is the modified value of the variable to be modified.
优选地,各个节点代表对象的值的推断遵循以下五条规则:Preferably, the inference of the value of each node representing an object follows the following five rules:
(1)该节点到Use-Define链尾之间的所有节点的变量都不是该节点的干预变量,从核心转储文件中读取该节点上的变量对应的值;(1) The variables of all nodes between the node and the end of the Use-Define chain are not intervention variables of the node, and the values corresponding to the variables on the node are read from the core dump file;
(2)该节点顺着指令流往前的第一个与该节点操作变量相同的Use节点的变量值已知,认为该节点的变量值与此Use节点的变量值一致;(2) The variable value of the first Use node that is the same as the operating variable of the node along the instruction flow of the node is known, and the variable value of the node is considered to be consistent with the variable value of the Use node;
(3)若该节点为Define节点且其变量值已推断得知,则顺着指令流往前的第一个与其操作变量相同的Use节点的变量值与其变量值一致;(3) If the node is a Define node and its variable value has been inferred, then the variable value of the first Use node that is the same as its operation variable along the instruction flow is consistent with its variable value;
(4)该节点为Define节点且其变量值可通过指令语义推断出来;(4) The node is a Define node and its variable value can be inferred through instruction semantics;
(5)若该节点所在的指令为可逆指令,则通过所述可逆指令语义恢复得到该指令其他节点的变量值;(5) If the instruction where the node is located is a reversible instruction, the variable values of other nodes of the instruction are obtained by restoring the semantics of the reversible instruction;
(6)该节点为Define节点且其修改前的值已知,则逆着指令流往后的第一个与其操作变量相同的Use节点的变量值与其变量值一致。(6) The node is a Define node and its value before modification is known, then the variable value of the first Use node that is the same as its operation variable after going against the instruction flow is consistent with its variable value.
另外,本发明使用假设性原则来解决逆向执行构造Use-Define链过程中可能遇到的内存别名问题。In addition, the present invention uses hypothetical principles to solve the problem of memory aliases that may be encountered in the process of reverse execution and construction of Use-Define chains.
内存别名是这样一个场景,由于一些不可逆指令的存在,Use-Define链在构造过程中不可避免地存在一些节点所代表的对象值不能得到恢复,这也导致一些取内存操作的内存地址值无法通过逆向执行过程得到。当涉及到需要对两个内存区域进行比较的场景时,如果其中存在未知的内存操作地址,其相对关系的判断将影响恢复的结果。而由于程序的执行状态已经确定,因此仅存在一种正确情况,如果从错误的相对关系判断出发则会导致后续的恢复产生冲突。Memory aliasing is such a scenario. Due to the existence of some irreversible instructions, it is inevitable that some object values represented by nodes cannot be restored during the construction of the Use-Define chain, which also causes some memory address values of fetching memory operations to fail. Obtained by reverse execution process. When it comes to the scene where two memory areas need to be compared, if there is an unknown memory operation address in it, the judgment of its relative relationship will affect the recovery result. However, since the execution state of the program has been determined, there is only one correct situation. If the judgment is based on the wrong relative relationship, subsequent recovery will cause conflicts.
本发明采用假设性原则,即分别假设两个内存区域一致以及两个内存区域不一致的情况继续逆向执行,若在某种假设下,逆向执行过程中产生了约束冲突,如恢复出来的值与核心转储文件所存的不一致,假设性原则方案就可以否定掉它的假设,而采取另一个假设来恢复数据流。然而如果两种假设都不会产生约束冲突,这就说明了现在数据流并不能为恢复当前指令的数据提供足够的信息。在这种情况下,将保留当前所采取的假设以恢复数据流,因为在接下来的数据恢复工作中,新的假设将提供产生更多的数据流信息,从而验证之前尚存疑的假设。The present invention adopts the hypothetical principle, that is, it is assumed that the two memory areas are consistent and the two memory areas are inconsistent and the reverse execution is continued. If under a certain assumption, a constraint conflict occurs during the reverse execution process, such as the restored value and the Inconsistencies stored in the dump file, the hypothetical principle solution can negate its assumptions, and adopt another assumption to restore the data flow. However, if neither assumption produces constraint violations, it means that the current data flow does not provide enough information to recover the data for the current instruction. In this case, the current hypothesis taken to restore the data flow will be retained, because in the subsequent data recovery work, the new hypothesis will provide more data flow information to verify the previous doubtful hypothesis.
步骤S3.从崩溃点出发,结合恢复出的信息,逆向追踪与崩溃点的数据有数据依赖关系的指令,得到直接或间接导致线程崩溃的指令序列。Step S3. Starting from the crash point, combined with the recovered information, reversely trace the instructions that have a data dependency relationship with the data at the crash point, and obtain the instruction sequence that directly or indirectly causes the thread to crash.
优选地,步骤S3具体为:逆Use-Define链追踪与崩溃点的数据有数据依赖关系的指令,标记这些指令为污点指令,追踪遵循以下规则:Preferably, step S3 is specifically: reverse the Use-Define chain to trace instructions that have a data dependency relationship with the data of the crash point, mark these instructions as tainted instructions, and follow the following rules for tracing:
1)若被污染的节点是Define节点,则将污点传播给该Define节点对应指令的其它Use节点的对象;1) If the polluted node is a Define node, spread the stain to objects of other Use nodes corresponding to the instructions of the Define node;
2)若被污染的节点是Use节点,在没有干预变量干扰的情况下,将污点沿着控制流逆向传播给最近的操作变量相同的Define节点;2) If the tainted node is a Use node, in the absence of intervention variable interference, the taint is propagated backwards along the control flow to the nearest Define node with the same operational variable;
3)根据相应指令语义,将污点传播给相应节点的对象;3) Propagate the taint to the object of the corresponding node according to the semantics of the corresponding instruction;
4)若被污染的节点是内存访问节点,则将污点传播给参与地址运算的寄存器的Use节点。4) If the polluted node is a memory access node, spread the stain to the Use node of the register involved in the address operation.
得到直接或间接导致线程崩溃的指令集合后,用户可以对照源代码,标记出可能导致线程崩溃的语句及数据来源,更为轻松地定位出代码中的漏洞。After obtaining the instruction set that directly or indirectly causes the thread to crash, the user can compare the source code to mark the statement and data source that may cause the thread to crash, and locate the loophole in the code more easily.
实施例Example
为了评估本发明对软件漏洞的自动化分析能力以及分析的执行效率,在Dragonboard410c开发板上进行了更多的软件漏洞自动化分析测试实验。实验的步骤如下:In order to evaluate the automatic analysis capability of the present invention for software loopholes and the execution efficiency of the analysis, more automated analysis and test experiments for software loopholes were carried out on the Dragonboard410c development board. The steps of the experiment are as follows:
(1)通过NVD数据库中的信息在实验环境中复现该漏洞;(1) Reproduce the vulnerability in the experimental environment through the information in the NVD database;
(2)人工分析确定崩溃的根本原因,找出导致崩溃的指令位置;(2) Manual analysis determines the root cause of the crash, and finds out the location of the instruction that caused the crash;
(3)运行漏洞POC,触发软件崩溃,获取带控制流信息的核心转储文件;(3) Run the vulnerability POC, trigger a software crash, and obtain a core dump file with control flow information;
(4)使用本发明的发明分析该核心转储文件,根据(2)中比较后向污点分析是否能够定位到软件漏洞。(4) Use the invention of the present invention to analyze the core dump file, and analyze whether the software loophole can be located according to the backward stain analysis in (2).
实验中,将分析程序的逆向执行指令最大数量设置为1000条。成功分析出崩溃原因的软件以及分析工具的运行时间如表1所示:In the experiment, the maximum number of reverse execution instructions of the analysis program is set to 1000. The running time of the software that successfully analyzed the cause of the crash and the analysis tool is shown in Table 1:
表1分析成功的软件列表Table 1 The list of software with successful analysis
在性能方面,虽然ARM平台的运行速度较慢,执行污点分析时可能需要一定的时间,但是在得到崩溃现场等相关信息之后,本发明可以在高性能的x86_64机器上运行,具有一定的跨平台性,能够为开发人员节约时间。In terms of performance, although the running speed of the ARM platform is relatively slow, it may take a certain amount of time to perform taint analysis, but after obtaining relevant information such as the crash site, the present invention can run on a high-performance x86_64 machine, and has certain cross-platform performance, saving developers time.
同时本发明还具有以下特色:Simultaneously the present invention also has the following characteristics:
(1)首个基于ARM平台硬件特性的自动化软件漏洞诊断工具:由于x86-64架构在个人主机与服务器平台的普及化,现存的大部分自动化软件漏洞诊断工具都是基于AMD64架构的,而无法迁移到ARM架构使用。而本发明首发于ARM平台,给面向于移动端设备和嵌入式设备、物联网设备的软件开发者带来了极大的便利。(1) The first automated software vulnerability diagnosis tool based on the hardware characteristics of the ARM platform: due to the popularization of the x86-64 architecture on personal hosts and server platforms, most of the existing automated software vulnerability diagnosis tools are based on the AMD64 architecture, and cannot Migrated to ARM architecture for use. However, the present invention is first published on the ARM platform, which brings great convenience to software developers oriented to mobile terminal equipment, embedded equipment, and Internet of Things equipment.
(2)用户接口透明,适用于各种用户态程序场合:接口透明化,使软件崩溃分析工具的用户不必假设某一次运行软件会产生崩溃,本发明可以自动跟踪运行的程序,在其意外发生崩溃后收集崩溃后现场。并且本发明可以自动地跟踪随系统启动的后台守护线程的执行情况。本发明实现了将ETM硬件记录的控制流数据置于核心转储文件内的方案,有效降低了用于崩溃程序分析的源数据的复杂度,简化了用户分析的流程。(2) The user interface is transparent, which is suitable for various user state program occasions: the interface is transparent, so that the user of the software crash analysis tool does not have to assume that a certain running software will cause a crash. After the crash collects the post-crash scene. And the present invention can automatically track the execution situation of the background daemon thread started with the system. The invention realizes the scheme of placing the control flow data recorded by the ETM hardware in the core dump file, effectively reduces the complexity of the source data used for crash program analysis, and simplifies the flow of user analysis.
(3)支持大多数常用AARCH64结构指令的逆向解析,分析大多数用户态程序:逆向分析工作的一个环节就是解析指令,本发明完成了AARCH64架构绝大多数常用指令,也即兼容了ARM平台下绝大多数指令,使得本发明能用于分析诊断绝大多数用户态程序。(3) Support the reverse analysis of most commonly used AARCH64 structure instructions, and analyze most user-mode programs: a part of the reverse analysis work is to analyze instructions, and the present invention has completed most of the commonly used instructions of the AARCH64 architecture, which is compatible with the ARM platform Most of the instructions enable the present invention to be used for analyzing and diagnosing most user state programs.
(4)支持多线程程序的分析:市面上为了提升用户体验而采取多线程技术提高软件性能的软件不在少数,大部分常用商业软件也都是多线程程序。本发明完成了对多线程程序的漏洞检测工作,使得本发明能够为市面上的大部分基于ARM平台的软件提供漏洞诊断服务。(4) Analysis of multi-threaded programs: There are not a few softwares on the market that adopt multi-threaded technology to improve software performance in order to improve user experience, and most commonly used commercial software are also multi-threaded programs. The invention completes the leak detection work of the multi-thread program, so that the invention can provide the leak diagnosis service for most of the software based on the ARM platform on the market.
本领域的技术人员容易理解,以上所述仅为本发明的较佳实施例而已,并不用以限制本发明,凡在本发明的精神和原则之内所作的任何修改、等同替换和改进等,均应包含在本发明的保护范围之内。It is easy for those skilled in the art to understand that the above descriptions are only preferred embodiments of the present invention, and are not intended to limit the present invention. Any modifications, equivalent replacements and improvements made within the spirit and principles of the present invention, All should be included within the protection scope of the present invention.
Claims (8)
Priority Applications (1)
| Application Number | Priority Date | Filing Date | Title |
|---|---|---|---|
| CN202211013175.7ACN115328796B (en) | 2022-08-23 | 2022-08-23 | Software vulnerability auxiliary positioning method and system for ARM architecture |
Applications Claiming Priority (1)
| Application Number | Priority Date | Filing Date | Title |
|---|---|---|---|
| CN202211013175.7ACN115328796B (en) | 2022-08-23 | 2022-08-23 | Software vulnerability auxiliary positioning method and system for ARM architecture |
Publications (2)
| Publication Number | Publication Date |
|---|---|
| CN115328796Atrue CN115328796A (en) | 2022-11-11 |
| CN115328796B CN115328796B (en) | 2025-07-22 |
Family
ID=83926902
Family Applications (1)
| Application Number | Title | Priority Date | Filing Date |
|---|---|---|---|
| CN202211013175.7AActiveCN115328796B (en) | 2022-08-23 | 2022-08-23 | Software vulnerability auxiliary positioning method and system for ARM architecture |
Country Status (1)
| Country | Link |
|---|---|
| CN (1) | CN115328796B (en) |
Cited By (2)
| Publication number | Priority date | Publication date | Assignee | Title |
|---|---|---|---|---|
| CN116775501A (en)* | 2023-08-25 | 2023-09-19 | 荣耀终端有限公司 | A software testing method, server, readable storage medium and chip system |
| CN117135345A (en)* | 2023-10-19 | 2023-11-28 | 芯动微电子科技(武汉)有限公司 | Simulation verification method and device for image signal processing |
Citations (4)
| Publication number | Priority date | Publication date | Assignee | Title |
|---|---|---|---|---|
| CN110222512A (en)* | 2019-05-21 | 2019-09-10 | 华中科技大学 | A kind of software vulnerability intelligent measurement based on intermediate language and localization method and system |
| US20200193031A1 (en)* | 2018-12-17 | 2020-06-18 | ZecOps | System and Method for an Automated Analysis of Operating System Samples, Crashes and Vulnerability Reproduction |
| CN111859388A (en)* | 2020-06-30 | 2020-10-30 | 广州大学 | A Multi-level Hybrid Vulnerability Automatic Mining Method |
| CN113268427A (en)* | 2021-06-15 | 2021-08-17 | 中国电子科技网络信息安全有限公司 | Crash analysis method and system for binary program |
- 2022
- 2022-08-23CNCN202211013175.7Apatent/CN115328796B/enactiveActive
Patent Citations (4)
| Publication number | Priority date | Publication date | Assignee | Title |
|---|---|---|---|---|
| US20200193031A1 (en)* | 2018-12-17 | 2020-06-18 | ZecOps | System and Method for an Automated Analysis of Operating System Samples, Crashes and Vulnerability Reproduction |
| CN110222512A (en)* | 2019-05-21 | 2019-09-10 | 华中科技大学 | A kind of software vulnerability intelligent measurement based on intermediate language and localization method and system |
| CN111859388A (en)* | 2020-06-30 | 2020-10-30 | 广州大学 | A Multi-level Hybrid Vulnerability Automatic Mining Method |
| CN113268427A (en)* | 2021-06-15 | 2021-08-17 | 中国电子科技网络信息安全有限公司 | Crash analysis method and system for binary program |
Non-Patent Citations (1)
| Title |
|---|
| 袁子牧;肖扬;吴炜;霍玮;邹维;: "知识、探索与状态平面组织的软件漏洞分析架构研究", 信息安全学报, no. 06, 15 November 2019 (2019-11-15)* |
Cited By (4)
| Publication number | Priority date | Publication date | Assignee | Title |
|---|---|---|---|---|
| CN116775501A (en)* | 2023-08-25 | 2023-09-19 | 荣耀终端有限公司 | A software testing method, server, readable storage medium and chip system |
| CN116775501B (en)* | 2023-08-25 | 2023-12-12 | 荣耀终端有限公司 | Software testing method, server, readable storage medium and chip system |
| CN117135345A (en)* | 2023-10-19 | 2023-11-28 | 芯动微电子科技(武汉)有限公司 | Simulation verification method and device for image signal processing |
| CN117135345B (en)* | 2023-10-19 | 2024-01-02 | 芯动微电子科技(武汉)有限公司 | Simulation verification method and device for image signal processing |
Also Published As
| Publication number | Publication date |
|---|---|
| CN115328796B (en) | 2025-07-22 |
Similar Documents
| Publication | Publication Date | Title |
|---|---|---|
| US7849450B1 (en) | Devices, methods and computer program products for reverse execution of a simulation | |
| JP5430570B2 (en) | Method for test suite reduction by system call coverage criteria | |
| US8423965B2 (en) | Tracing of data flow | |
| JP6867066B1 (en) | Memory analysis methods and equipment based on dynamic stain analysis | |
| CN111756575A (en) | Performance analysis method and device for storage server, and electronic equipment | |
| US20130132933A1 (en) | Automated compliance testing during application development | |
| CN113268427B (en) | A crash analysis method and system for binary programs | |
| CN115328796B (en) | Software vulnerability auxiliary positioning method and system for ARM architecture | |
| CN112181833A (en) | Intelligent fuzzy test method, device and system | |
| CN101354675B (en) | A method for dynamic memory detection of embedded software | |
| CN1306639A (en) | Real time debugger interface for embedded systems | |
| CN110597704B (en) | Pressure test method, device, server and medium for application program | |
| US8065565B2 (en) | Statistical debugging using paths and adaptive profiling | |
| Shibanai et al. | Actoverse: a reversible debugger for actors | |
| US6598181B1 (en) | Method and system for debugging multiple function calls | |
| CN116720192A (en) | A vulnerability detection method based on hybrid analysis technology for MIPS architecture | |
| US20080010536A1 (en) | Breakpoints with Separate Conditions | |
| CN113632067A (en) | Emulate non-tracking code with recorded execution of tracked code | |
| US11314624B2 (en) | Reducing trace recording overheads with targeted recording via partial snapshots | |
| CN116340081B (en) | RISCV memory access violation detection method and device based on hardware virtualization | |
| CN114741700A (en) | Method and device for vulnerability exploitability analysis of public component library based on symbolic taint analysis | |
| CN118860851A (en) | Embedded database compatibility testing method and device | |
| Li et al. | AnomalyGen: An Automated Semantic Log Sequence Generation Framework with LLM for Anomaly Detection | |
| CN113268248B (en) | A method for locating software non-repeatable compilation faults and automatically generating patches | |
| CN110851332B (en) | Log file processing method, device, equipment and medium |
Legal Events
| Date | Code | Title | Description |
|---|---|---|---|
| PB01 | Publication | ||
| PB01 | Publication | ||
| SE01 | Entry into force of request for substantive examination | ||
| SE01 | Entry into force of request for substantive examination | ||
| GR01 | Patent grant | ||
| GR01 | Patent grant |