CN115293406A - Photovoltaic power generation power prediction method based on Catboost and Radam-LSTM - Google Patents
Photovoltaic power generation power prediction method based on Catboost and Radam-LSTMDownload PDFInfo
- Publication number
- CN115293406A CN115293406ACN202210794793.3ACN202210794793ACN115293406ACN 115293406 ACN115293406 ACN 115293406ACN 202210794793 ACN202210794793 ACN 202210794793ACN 115293406 ACN115293406 ACN 115293406A
- Authority
- CN
- China
- Prior art keywords
- feature
- prediction
- model
- catboost
- radam
- Prior art date
- Legal status (The legal status is an assumption and is not a legal conclusion. Google has not performed a legal analysis and makes no representation as to the accuracy of the status listed.)
- Pending
Links
Images


Classifications
- G—PHYSICS
- G06—COMPUTING OR CALCULATING; COUNTING
- G06Q—INFORMATION AND COMMUNICATION TECHNOLOGY [ICT] SPECIALLY ADAPTED FOR ADMINISTRATIVE, COMMERCIAL, FINANCIAL, MANAGERIAL OR SUPERVISORY PURPOSES; SYSTEMS OR METHODS SPECIALLY ADAPTED FOR ADMINISTRATIVE, COMMERCIAL, FINANCIAL, MANAGERIAL OR SUPERVISORY PURPOSES, NOT OTHERWISE PROVIDED FOR
- G06Q10/00—Administration; Management
- G06Q10/04—Forecasting or optimisation specially adapted for administrative or management purposes, e.g. linear programming or "cutting stock problem"
- G—PHYSICS
- G06—COMPUTING OR CALCULATING; COUNTING
- G06N—COMPUTING ARRANGEMENTS BASED ON SPECIFIC COMPUTATIONAL MODELS
- G06N3/00—Computing arrangements based on biological models
- G06N3/02—Neural networks
- G06N3/04—Architecture, e.g. interconnection topology
- G06N3/049—Temporal neural networks, e.g. delay elements, oscillating neurons or pulsed inputs
- G—PHYSICS
- G06—COMPUTING OR CALCULATING; COUNTING
- G06N—COMPUTING ARRANGEMENTS BASED ON SPECIFIC COMPUTATIONAL MODELS
- G06N3/00—Computing arrangements based on biological models
- G06N3/02—Neural networks
- G06N3/08—Learning methods
- G06N3/084—Backpropagation, e.g. using gradient descent
- G—PHYSICS
- G06—COMPUTING OR CALCULATING; COUNTING
- G06Q—INFORMATION AND COMMUNICATION TECHNOLOGY [ICT] SPECIALLY ADAPTED FOR ADMINISTRATIVE, COMMERCIAL, FINANCIAL, MANAGERIAL OR SUPERVISORY PURPOSES; SYSTEMS OR METHODS SPECIALLY ADAPTED FOR ADMINISTRATIVE, COMMERCIAL, FINANCIAL, MANAGERIAL OR SUPERVISORY PURPOSES, NOT OTHERWISE PROVIDED FOR
- G06Q50/00—Information and communication technology [ICT] specially adapted for implementation of business processes of specific business sectors, e.g. utilities or tourism
- G06Q50/06—Energy or water supply
- Y—GENERAL TAGGING OF NEW TECHNOLOGICAL DEVELOPMENTS; GENERAL TAGGING OF CROSS-SECTIONAL TECHNOLOGIES SPANNING OVER SEVERAL SECTIONS OF THE IPC; TECHNICAL SUBJECTS COVERED BY FORMER USPC CROSS-REFERENCE ART COLLECTIONS [XRACs] AND DIGESTS
- Y04—INFORMATION OR COMMUNICATION TECHNOLOGIES HAVING AN IMPACT ON OTHER TECHNOLOGY AREAS
- Y04S—SYSTEMS INTEGRATING TECHNOLOGIES RELATED TO POWER NETWORK OPERATION, COMMUNICATION OR INFORMATION TECHNOLOGIES FOR IMPROVING THE ELECTRICAL POWER GENERATION, TRANSMISSION, DISTRIBUTION, MANAGEMENT OR USAGE, i.e. SMART GRIDS
- Y04S10/00—Systems supporting electrical power generation, transmission or distribution
- Y04S10/50—Systems or methods supporting the power network operation or management, involving a certain degree of interaction with the load-side end user applications
Landscapes
- Engineering & Computer Science (AREA)
- Physics & Mathematics (AREA)
- Theoretical Computer Science (AREA)
- Business, Economics & Management (AREA)
- Economics (AREA)
- Health & Medical Sciences (AREA)
- General Physics & Mathematics (AREA)
- General Health & Medical Sciences (AREA)
- Human Resources & Organizations (AREA)
- Strategic Management (AREA)
- Marketing (AREA)
- Data Mining & Analysis (AREA)
- Software Systems (AREA)
- General Business, Economics & Management (AREA)
- Mathematical Physics (AREA)
- General Engineering & Computer Science (AREA)
- Computing Systems (AREA)
- Molecular Biology (AREA)
- Evolutionary Computation (AREA)
- Tourism & Hospitality (AREA)
- Computational Linguistics (AREA)
- Life Sciences & Earth Sciences (AREA)
- Artificial Intelligence (AREA)
- Biomedical Technology (AREA)
- Biophysics (AREA)
- Primary Health Care (AREA)
- Development Economics (AREA)
- Water Supply & Treatment (AREA)
- Public Health (AREA)
- Game Theory and Decision Science (AREA)
- Entrepreneurship & Innovation (AREA)
- Operations Research (AREA)
- Quality & Reliability (AREA)
- Management, Administration, Business Operations System, And Electronic Commerce (AREA)
Abstract
Description
Translated fromChinese技术领域technical field
本发明属于光伏发电功率预测领域,具体涉及一种基于CatBoost和Radam-LSTM的光伏发电功率预测方法。The invention belongs to the field of prediction of photovoltaic power generation, in particular to a method for prediction of photovoltaic power generation based on CatBoost and Radam-LSTM.
背景技术Background technique
与传统电力系统相比,以新能源为主体的电力系统的源、荷两端具有较强的不确定性,不仅需要源端的发电部门能够实时跟踪荷端的负荷变化,还需要荷端的用户可以积极响应电力系统的运行情况。电力系统的调度难度上升,系统安全经济运行也受到极大挑战。合理高效地预测光伏发电功率,一方面有利于提高光伏电站的运维水平,增加市场竞争力;另一方面可以有效降低上述不确定性带来的影响,有利于制定合理的调度计划,供调度人员合理设计规划调度资源以满足负荷需求响应。Compared with the traditional power system, the power system with new energy as the main body has strong uncertainties at both the source and load ends. Not only does the power generation department at the source end need to be able to track the load changes at the load end in real time, but users at the load end must also be able to actively Respond to the operating conditions of the power system. The dispatching difficulty of the power system has increased, and the safe and economical operation of the system has also been greatly challenged. Reasonably and efficiently predicting the power of photovoltaic power generation, on the one hand, is conducive to improving the operation and maintenance level of photovoltaic power plants and increasing market competitiveness; Personnel rationally design, plan and dispatch resources to meet load demand response.
光伏发电功率受到多种因素的影响,除电站本身数据外,还和气象因素以及调度计划息息相关,如天气预报数据、实时气象数据、运行状态、检修计划等。统计电流、风速、功率、湿度、气温、全球水平辐照度以及降雨等数据特征后,对分析各个数据特征之间的相互依赖关系,确定出每个特征与目标特征之间的相关性强弱,进一步地筛选出关键特征用于模型的训练,有利于提高模型的训练速度以及光伏发电功率预测的准确性。The power of photovoltaic power generation is affected by many factors. In addition to the data of the power station itself, it is also closely related to meteorological factors and scheduling plans, such as weather forecast data, real-time meteorological data, operating status, and maintenance plans. After counting data characteristics such as current, wind speed, power, humidity, temperature, global horizontal irradiance, and rainfall, analyze the interdependence between each data feature, and determine the correlation between each feature and the target feature. , and further screen out the key features for model training, which is conducive to improving the training speed of the model and the accuracy of photovoltaic power prediction.
选择合理的预测模型不仅能够提高预测性能,还能够大大降低预测成本节省计算机资源。CatBoost模型能够高效合理地处理类别型特征,处理梯度偏差以及预测偏移问题,同时提高算法的准确性和泛化能力,长短期记忆网络(Long Short-Term Memory,LSTM)是一种特定形式的循环神经网络(Recurrent Neural Network,RNN),LSTM能更好地处理时间序列的问题,对极具时间序列特性的光伏发电功率预测十分友好,同时LSTM解决了RNN长期依赖问题,并且缓解了RNN在训练时反向传播带来的“梯度消失”问题,是一种性能极佳的神经网络模型。Choosing a reasonable prediction model can not only improve the prediction performance, but also greatly reduce the prediction cost and save computer resources. The CatBoost model can efficiently and reasonably handle category-type features, handle gradient deviation and predict offset problems, and at the same time improve the accuracy and generalization ability of the algorithm. Long Short-Term Memory (LSTM) is a specific form of Recurrent Neural Network (RNN), LSTM can better deal with time series problems, and is very friendly to the prediction of photovoltaic power generation with time series characteristics. The "gradient disappearance" problem caused by backpropagation during training is a neural network model with excellent performance.
发明内容Contents of the invention
本发明的技术问题是为充分挖掘时间序列中隐含的新特征、增强时间序列特征在光伏发电功率预测技术中的表达能力以及提升光伏发电功率预测的性能。The technical problem of the present invention is to fully tap new features hidden in time series, enhance the expressive ability of time series features in photovoltaic power prediction technology, and improve the performance of photovoltaic power prediction.
本发明的目的是针对上述问题,提供一种基于CatBoost和Radam-LSTM的光伏发电功率预测方法,采用Stacking框架和瀑布融合法,将CatBoost和Radam-LSTM分别作为前级、后级模型进行集成、融合,得到功率预测模型,提高功率预测模型的稳定性、准确性和泛化能力,避免预测模型过拟合。The purpose of the present invention is to address the above problems, providing a photovoltaic power prediction method based on CatBoost and Radam-LSTM, using the Stacking framework and the waterfall fusion method, and integrating CatBoost and Radam-LSTM as the front-end and back-end models respectively, Fusion to obtain a power prediction model, improve the stability, accuracy and generalization ability of the power prediction model, and avoid over-fitting of the prediction model.
本发明的技术方案是基于CatBoost和Radam-LSTM的光伏发电功率预测方法,包括以下步骤:The technical scheme of the present invention is based on the photovoltaic power generation prediction method of CatBoost and Radam-LSTM, comprises the following steps:
步骤1:获取用于光伏发电功率预测的特征数据,对特征数据进行预处理;Step 1: Obtain the characteristic data for photovoltaic power generation prediction, and preprocess the characteristic data;
步骤2:利用改进灰色关联度分析方法计算各个气象特征以及电气特征与目标特征之间的灰色关联度大小,剔除关联度小的特征;Step 2: Use the improved gray correlation degree analysis method to calculate the gray correlation degree between each meteorological feature and electrical feature and the target feature, and eliminate the features with small correlation degree;
步骤3:利用变量特征衍生方法从已有特征数据时间序列中衍生出新的特征,对特征数据时间序列进行扩展,以增加特征数据时间序列在光伏发电功率预测中的表达能力,形成特征数据集;Step 3: Use the variable feature derivation method to derive new features from the existing feature data time series, expand the feature data time series to increase the expressive ability of the feature data time series in photovoltaic power prediction, and form a feature data set ;
步骤4:将CatBoost作为前级模型,Radam-LSTM作为后级模型,利用瀑布融合法构建功率预测模型,对功率预测模型训练并测试;Step 4: Use CatBoost as the front-level model, Radam-LSTM as the back-level model, use the waterfall fusion method to build a power prediction model, train and test the power prediction model;
步骤4.1:将CatBoost作为前级模型,采用k折交叉验证方法划分特征数据集,并输入CatBoost进行预测;Step 4.1: Use CatBoost as the front-level model, use the k-fold cross-validation method to divide the feature data set, and input CatBoost for prediction;
步骤4.2:将CatBoost的输出结果作为新特征,结合步骤3得到的特征集,共同作为Radam-LSTM的输入,利用Radam-LSTM得到光伏发电功率的预测数据;Step 4.2: Use the output of CatBoost as a new feature, combined with the feature set obtained in step 3, as the input of Radam-LSTM, and use Radam-LSTM to obtain the forecast data of photovoltaic power generation;
步骤4.3:调节超参数,对功率预测模型重复进行训练并测试,直至满足精度要求;Step 4.3: Adjust the hyperparameters, and repeatedly train and test the power prediction model until the accuracy requirements are met;
步骤5:将利用训练好的功率预测模型用于光伏发电功率短期预测。Step 5: Use the trained power prediction model for short-term prediction of photovoltaic power generation.
步骤1中,所述对特征数据进行预处理,包括对特征数据中的异常值、非数NaN进行处理以及对特征数据进行归一化。In
采用最大最小标准化将特征数据的原始值映射到区间[0,1]之间,计算式如下:Using the maximum and minimum standardization to map the original value of the feature data to the interval [0,1], the calculation formula is as follows:

式中x表示原始数据,xmin、xmax对应该特征数据的最小值以及最大值,x′为归一化后的数据。In the formula, x represents the original data, xmin and xmax correspond to the minimum and maximum values of the feature data, and x' is the normalized data.
步骤2包括以下子步骤:
1)数据标准化,标准化之后的特征数据时间序列为Xi′=(xi′(1),xi′(2),…,xi′(m)),其中xi′(m)表示第i个特征、第m个元素标准化的结果;1) Data standardization, the time series of feature data after normalization is Xi ′=(xi ′(1),xi ′(2),…,xi ′(m)), wherexi ′( m) represents The results of standardization of the i feature and the m element;
2)求所有特征数据时间序列与目标特征时间序列的差值,计算式如下:2) Find the difference between all feature data time series and the target feature time series, the calculation formula is as follows:
Δi(k)=|xobj′(k)-xi′(k)|Δi (k)=|xobj ′(k)-xi ′(k)|
式中xobj′(k)表示目标特征第k个元素标准化后的结果,xi′(k)表示其它特征第k个元素标准化后的结果,Δi(k)表示第i个特征的第k个元素标准化之后的差值,i=2,3,…,n,k=1,2,…,m;In the formula, xobj ′(k) represents the normalized result of the kth element of the target feature, xi ′(k) represents the normalized result of the kth element of other features, Δi (k) represents the i-th feature’s The difference after normalization of k elements, i=2,3,...,n, k=1,2,...,m;
3)计算关联系数,3) Calculate the correlation coefficient,

式中ci(k)为第i个特征第k个元素的关联系数,M表示双重最大值,即

4)计算改进灰色关联度,计算式如下:4) Calculating the improved gray correlation degree, the calculation formula is as follows:

式中

5)根据计算得到的改进灰色关联度,将改进灰色关联度不小于0.7的特征确定为关联性大的特征。5) According to the calculated improved gray relational degree, the feature whose improved gray relational degree is not less than 0.7 is determined as the feature with high correlation.
步骤4中,所述k折交叉验证方法划分特征数据,具体过程包括:In
1)将全部数据样本划分成k个大小相等的样本子集;1) Divide all data samples into k sample subsets of equal size;
2)依次遍历这k个子集,每次把当前子集作为验证集,其余所有样本作为训练集,进行预测模型的训练和评估;2) Traverse the k subsets in turn, each time the current subset is used as a verification set, and all other samples are used as a training set to train and evaluate the prediction model;
3)最后把k次评估指标的平均值作为预测模型最终的评估指标。3) Finally, the average value of k evaluation indicators is used as the final evaluation indicator of the prediction model.
优选地,步骤5中,所述对功率预测模型进行训练并测试,采用Radam优化器。Preferably, in step 5, the power prediction model is trained and tested using a Radam optimizer.
相比现有技术,本发明的有益效果包括:Compared with the prior art, the beneficial effects of the present invention include:
1)本发明采用Stacking框架和瀑布融合法,将CatBoost和Radam-LSTM集成、融合,显著提高了功率预测模型的预测性能,得到的功率预测模型稳定性、准确性更好,泛化能力更强,能有效防止预测模型过拟合。1) The present invention adopts the Stacking framework and the waterfall fusion method to integrate and fuse CatBoost and Radam-LSTM, which significantly improves the prediction performance of the power prediction model, and the obtained power prediction model has better stability, accuracy, and stronger generalization ability , which can effectively prevent the prediction model from overfitting.
2)本发明针对传统灰色关联度分析法改进,改进的灰色关联度分析法能区分特征的重要程度,从原始特征集中筛选出与目标特征关联性大的特征用于光伏发电功率的预测,减小原始特征数据采集量,降低处理原始数据的计算量,省时省力。2) The present invention improves the traditional gray relational degree analysis method, the improved gray relational degree analysis method can distinguish the importance of features, and screen out the features with high correlation with the target features from the original feature set for the prediction of photovoltaic power generation, reducing The amount of original feature data collection is small, reducing the calculation amount of processing original data, saving time and effort.
3)本发明基于变量特征衍生方法衍生出与时间特征相关的新特征,增加了特征时间序列在光伏预测中的表达能力,进一步提高了模型预测性能。3) The present invention derives new features related to time features based on the variable feature derivation method, which increases the expressive ability of feature time series in photovoltaic prediction, and further improves the model prediction performance.
4)本发明在预测模型的训练、测试过程中采用Radam优化器反向更新模型参数,加快了预测模型的学习效率,提高了预测模型的稳定性以及预测的准确性。4) The present invention uses the Radam optimizer to reversely update the model parameters in the training and testing process of the prediction model, which accelerates the learning efficiency of the prediction model, improves the stability of the prediction model and the accuracy of prediction.
附图说明Description of drawings
下面结合附图和实施例对本发明作进一步说明。The present invention will be further described below in conjunction with drawings and embodiments.
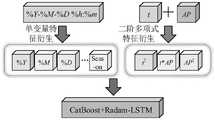
图1为本发明实施例利用变量特征衍生方法产生新特征的示意图。FIG. 1 is a schematic diagram of generating new features using variable feature derivation methods according to an embodiment of the present invention.
图2为本发明实施例的5折交叉验证划分数据集的原理图。FIG. 2 is a schematic diagram of a 5-fold cross-validation division data set according to an embodiment of the present invention.
图3a为RNN单元的结构示意图。Figure 3a is a schematic diagram of the structure of an RNN unit.
图3b为LSTM单元的结构示意图。Figure 3b is a schematic diagram of the structure of the LSTM unit.
图4为本发明实施例的光伏发电功率预测方法的流程示意图。Fig. 4 is a schematic flowchart of a photovoltaic power prediction method according to an embodiment of the present invention.
图5为本发明实施例计算得到的各个特征的改进灰色关联度的示意图。FIG. 5 is a schematic diagram of the improved gray correlation degree of each feature calculated and obtained in the embodiment of the present invention.
图6为光伏发电功率随时间季节变化的示意图。Fig. 6 is a schematic diagram of photovoltaic power generation variation with time and season.
图7a为采用Adam优化算法更新参数得到的LSTM预测模型的预测效果示意图。Fig. 7a is a schematic diagram of the prediction effect of the LSTM prediction model obtained by using the Adam optimization algorithm to update the parameters.
图7b为采用SGD优化算法更新参数得到的LSTM预测模型的预测效果示意图。Fig. 7b is a schematic diagram of the prediction effect of the LSTM prediction model obtained by using the SGD optimization algorithm to update the parameters.
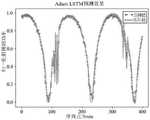
图7c为采用Radam优化算法更新参数得到的LSTM预测模型的预测效果示意图。Fig. 7c is a schematic diagram of the prediction effect of the LSTM prediction model obtained by using the Radam optimization algorithm to update the parameters.
图8为本发明实施例的CatBoost和Radam-LSTM集成模型的预测效果示意图。Fig. 8 is a schematic diagram of the prediction effect of the integrated model of CatBoost and Radam-LSTM according to the embodiment of the present invention.
图9为单个CatBoost预测模型的预测效果示意图。Figure 9 is a schematic diagram of the prediction effect of a single CatBoost prediction model.
具体实施方式Detailed ways
如图4所示,基于CatBoost和Radam-LSTM的光伏发电功率预测方法,包括以下步骤:As shown in Figure 4, the photovoltaic power prediction method based on CatBoost and Radam-LSTM includes the following steps:
步骤1:获取用于光伏发电功率预测的特征数据,对特征数据进行预处理;Step 1: Obtain the characteristic data for photovoltaic power generation prediction, and preprocess the characteristic data;
根据数据源的基本特性,特征数据预处理包括对异常值、非数(Not a Number,NaN)的处理,对数据进行归一化操作。将异常值删除,将NaN赋0,然后对数据进行归一化处理,以消除特征数据之间的量纲影响,进而提高预测的准确性,本发明采用最大最小标准化将原始值映射到区间[0,1]之间,计算公式为:According to the basic characteristics of the data source, the feature data preprocessing includes the processing of outliers, Not a Number (NaN), and normalization of the data. Delete outliers, assign NaN to 0, and then normalize the data to eliminate the dimensional influence between feature data, thereby improving the accuracy of prediction. The present invention uses maximum and minimum standardization to map the original value to the interval [ 0, 1], the calculation formula is:

式中x表示原始数据,xmin、xmax对应该特征数据的最小值以及最大值,x′为归一化后的数据。In the formula, x represents the original data, xmin and xmax correspond to the minimum and maximum values of the feature data, and x' is the normalized data.
实施例采用DKA太阳能中心(The Desert Knowledge Australia Solar Centre,DKA)的数据,对数据进行预处理,包括对缺失值、异常值的处理以及对数据进行归一化。使用python语言.dropna()函数将缺失和异常的数据删除,使用.dropna()函数将非数NaN删除,随后采用式(1)进行数据归一化。The embodiment adopts the data of the DKA Solar Center (The Desert Knowledge Australia Solar Centre, DKA), and preprocesses the data, including processing missing values and outliers and normalizing the data. Use the python language .dropna() function to delete missing and abnormal data, use the .dropna() function to delete non-number NaN, and then use formula (1) for data normalization.
步骤2:利用改进灰色关联度分析计算各个气象特征以及电气特征与目标特征之间的灰色关联度大小,剔除关联度小的特征;Step 2: Use the improved gray correlation degree analysis to calculate the gray correlation degree between each meteorological feature, electrical feature and target feature, and eliminate the features with small correlation degree;
分析光伏电站提供的气象数据对发电功率的影响程度,进一步筛选出关键特征。Analyze the impact of weather data provided by photovoltaic power plants on power generation, and further screen out key features.
传统灰色关联度分析是将所有特征重要性平等看待,无法很好地区分特征之间的影响程度。因此,本发明采用改进灰色关联度分析计算各个气象特征数据与发电功率数据之间相似程度以衡量特征间的影响程度,进而筛选出主要的特征进行模型的训练。The traditional gray relational degree analysis treats the importance of all features equally, and cannot distinguish the degree of influence between features well. Therefore, the present invention adopts the improved gray correlation degree analysis to calculate the similarity between each meteorological feature data and the power generation data to measure the degree of influence between the features, and then screen out the main features for model training.
对于一个m×n维的数据集,n为特征的数量,m表示特征的元素的数量,以Xobj表示目标特征序列,Xi表示第i个特征的特征数据序列,i=2,3,…,n,传统灰色关联分析的计算过程如下:For an m×n-dimensional data set, n is the number of features, m represents the number of feature elements, Xobj represents the target feature sequence, Xii represents the feature data sequence of the i-th feature, i=2, 3, ..., n, the calculation process of traditional gray relational analysis is as follows:
1)数据标准化。根据式(1),标准化之后的特征序列为Xi′=(xi′(1),xi′(2),…,xi′(m)),其中xi′(m)表示第i个特征的第m个元素标准化的结果。1) Data standardization. According to formula (1), the feature sequence after normalization is Xi ′=(xi ′(1),xi ′(2),…,xi ′(m)), wherexi ′(m) represents the The result of normalizing the mth element of the i feature.
2)求特征序列经过标准化之后的差值,计算式如下:2) To find the difference of the feature sequence after standardization, the calculation formula is as follows:
Δi(k)=|xobj′(k)-xi′(k)| (2)Δi (k)=|xobj ′(k)-xi ′(k)| (2)
式中xobj′(k)表示目标特征第k个元素标准化后的结果,xi′(k)表示第i个特征第k个元素标准化后的结果,Δi(k)表示第i个特征的第k个标准化之后的差值,i=2,3,…,n,k=1,2,…,m。In the formula, xobj ′(k) represents the normalized result of the k-th element of the target feature, xi ′(k) represents the normalized result of the k-th element of the i-th feature, and Δi (k) represents the i-th feature The k-th difference after normalization, i=2, 3,...,n, k=1, 2,...,m.
3)计算关联系数,计算式如下:3) Calculate the correlation coefficient, the calculation formula is as follows:

式中ci(k)表示第i个特征的第k个元素的关联系数,M表示双重最大值,即

4)计算灰色关联度,计算式如下:4) Calculate the gray correlation degree, the formula is as follows:

式中ri为第i个特征的灰色关联度大小,i=1,2,3,…,n。In the formula, ri is the gray correlation degree of the i-th feature, i=1,2,3,...,n.
式(4)无法反映各个特征数据的重要程度,因此基于距离分析法对各特征进行加权处理进而对灰色关联度分析做出改进,改进后的公式为:Equation (4) cannot reflect the importance of each feature data. Therefore, based on the distance analysis method, each feature is weighted to improve the gray relational degree analysis. The improved formula is:

式中

计算改进后的灰色关联度,当其他特征与目标特征的关联度大小在区间[0.7,1.0]时为强关联,在区间[0.4,0.7)时为弱相关,在[0,0.4)时为极弱相关或无关联。Calculate the improved gray correlation degree. When the correlation degree between other features and the target feature is in the interval [0.7, 1.0], it is a strong correlation, in the interval [0.4, 0.7), it is a weak correlation, and in [0, 0.4) it is Very weak or no correlation.
实施例的数据集的特征如表1所示。The characteristics of the data set of the embodiment are shown in Table 1.
表1 特征信息表Table 1 Feature Information Table

利用改进灰色关联度分析对上述特征进行关联度的计算,关联度计算结果如图5所示,根据图中灰色关联度大小,平均电流AC、总倾角辐射RGT、总水平辐射GHR、水平扩散辐射DHR、倾角扩散辐射RDT、降雨量Rain以及风速WS的改进灰色关联度大于0.7,都是与输出特征关联度强的特征。为保证气象信息的完整性,同时减少冗余信息对预测模型产生的负面影响,选取上述这6个特征作为预测模型的输入特征,以光伏发电功率作为预测模型输出的目标特征。Using the improved gray correlation degree analysis to calculate the correlation degree of the above features, the correlation degree calculation results are shown in Figure 5. According to the size of the gray correlation degree in the figure, the average current AC, the total dip angle radiation RGT, the total horizontal radiation GHR, and the horizontal diffuse radiation The improved gray correlation degree of DHR, dip angle diffuse radiation RDT, rainfall Rain and wind speed WS is greater than 0.7, which are all features with strong correlation with output features. In order to ensure the integrity of meteorological information and reduce the negative impact of redundant information on the prediction model, the above six features are selected as the input features of the prediction model, and the photovoltaic power generation is used as the target feature of the prediction model output.
步骤3:从已有特征数据时间序列中衍生出新的特征,对特征数据时间序列进行扩展,以增加特征数据时间序列在光伏发电功率预测中的表达能力,形成特征数据集;Step 3: Deriving new features from the existing feature data time series, expanding the feature data time series to increase the expressive ability of the feature data time series in photovoltaic power prediction, forming a feature data set;
每个特征都可视为一个随时间序列变化的变量,为了从时间序列中挖掘出有用的新特征,采用单变量特征衍生方法从时间序列特征中提取新特征信息,即利用已有的时间序列特征%Y-%M-%D %h:%m,从中提取出%Y、%M、%D、%h、%m等新特征,其中%Y为年份特征信息,%M为月份特征信息,%D为日期特征信息,%h为时辰特征信息,%m为分钟特征信息。在此基础上,根据月份%M,按照当地季节划分情况,可衍生出春、夏、秋、冬四个新特征;采用多变量特征衍生方法是从两个及两个以上的特征变量中衍生出新特征,即使用二阶多项式的形式构造对应的组合特征,如两个特征变量a和b,利用二阶多项式(a+b)2=a2+2ab+b2,可衍生出a2、ab、b2三个新的特征,通过多个变量特征之间不同组合,以增强有用特征的维度,充分为预测模型提供有价值的特征信息,特征衍生过程如图1所示,图中t表示时间序列,AP表示光伏发电功率特征数据。Each feature can be regarded as a variable that changes with the time series. In order to mine useful new features from the time series, the univariate feature derivation method is used to extract new feature information from the time series features, that is, to use the existing time series Feature %Y-%M-%D %h:%m, from which new features such as %Y, %M, %D, %h, %m are extracted, where %Y is the year feature information, and %M is the month feature information , %D is date feature information, %h is hour feature information, and %m is minute feature information. On this basis, according to the month %M, according to the division of local seasons, four new features of spring, summer, autumn and winter can be derived; the multivariate feature derivation method is derived from two or more feature variables New features, that is, use the form of second-order polynomials to construct corresponding combination features, such as two feature variables a and b, using second-order polynomials (a+b)2 =a2 +2ab+b2 , can derive a2 , ab, b2 three new features, through different combinations of multiple variable features, to enhance the dimension of useful features, fully provide valuable feature information for the prediction model, the feature derivation process is shown in Figure 1, in the figure t represents the time series, and AP represents the characteristic data of photovoltaic power generation.
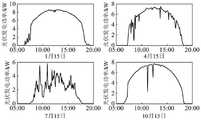
光伏夜间出力为0,故从数据集中选取时间段为5:00~20:00的数据,画出光伏发电功率随时间变化的曲线,如图6所示,图6反映了光伏发电功率具有的时间周期变化规律,澳洲的春、夏、秋、冬四个季节分别为9-11月、12-2月、3-5月以及6-8月。从图6中不难看出,光伏发电功率具有季节特性,随着季节的不同,发电起始时间以及跨度各不相同。The output of photovoltaic power at night is 0, so the data from the data set is selected from the time period of 5:00 to 20:00, and the curve of photovoltaic power generation changes with time is drawn, as shown in Figure 6, which reflects the characteristics of photovoltaic power generation. The time cycle changes. The four seasons of spring, summer, autumn and winter in Australia are September-November, December-February, March-May and June-August. It is not difficult to see from Figure 6 that photovoltaic power generation has seasonal characteristics, and the start time and span of power generation vary with the seasons.
考虑到不同季节下不同时间段光伏发电的功率输出情况,采用单变量特征衍生方法从时间序列中衍生出与时间相关的新特征,进而代入预测模型训练以提高预测模型的预测效果。表2给出了特征衍生结果,表2中年、月、日、小时以及分钟以数值形式表示,季节性特征采用独热编码(One-Hot)的形式进行表示。Considering the power output of photovoltaic power generation in different time periods in different seasons, new time-related features are derived from the time series by using the univariate feature derivation method, and then substituted into the forecasting model training to improve the forecasting effect of the forecasting model. Table 2 shows the results of feature derivation. In Table 2, the year, month, day, hour, and minute are expressed in numerical form, and the seasonal features are expressed in the form of one-hot encoding (One-Hot).
将改进灰色关联度分析方法选择出的6个特征和变量特征衍生出的6个特征一起作为预测模型的输入特征用作预测模型的训练。The 6 features selected by the improved gray relational degree analysis method and the 6 features derived from the variable features are used as the input features of the prediction model for the training of the prediction model.
表2 衍生的新特征信息表Table 2 Derived new feature information table

步骤4:将CatBoost作为前级模型,Radam-LSTM作为后级模型,利用瀑布融合法构建功率预测模型,对功率预测模型训练并测试;Step 4: Use CatBoost as the front-level model, Radam-LSTM as the back-level model, use the waterfall fusion method to build a power prediction model, train and test the power prediction model;
步骤4.1:将CatBoost作为前级模型,采用k折交叉验证方法划分特征数据集,并输入CatBoost进行预测;Step 4.1: Use CatBoost as the front-level model, use the k-fold cross-validation method to divide the feature data set, and input CatBoost for prediction;
步骤4.2:将CatBoost的输出结果作为新特征,结合步骤3得到的特征集,共同作为Radam-LSTM的输入,利用Radam-LSTM得到光伏发电功率的预测数据;Step 4.2: Use the output of CatBoost as a new feature, combined with the feature set obtained in step 3, as the input of Radam-LSTM, and use Radam-LSTM to obtain the forecast data of photovoltaic power generation;
步骤4.3:调节超参数,对功率预测模型重复进行训练并测试,直至满足精度要求;Step 4.3: Adjust the hyperparameters, and repeatedly train and test the power prediction model until the accuracy requirements are met;
在神经网络模型的训练过程中,模型输出值和真实标签值间的差异用损失函数Loss来衡量,优化器获取学习参数的梯度并采用一定的策略更新参数,降低损失Loss,优化学习率,从而减小模型输出值和真实标签值间的差值。In the training process of the neural network model, the difference between the model output value and the real label value is measured by the loss function Loss. The optimizer obtains the gradient of the learning parameters and adopts a certain strategy to update the parameters to reduce the loss Loss and optimize the learning rate. Reduce the difference between the model output value and the true label value.
神经网络模型参数优化方法的基础是随机梯度下降法(Stochastic GradientDescent,SGD),随后延伸出了Adam优化算法以及Radam优化算法,本发明采用Radam优化神经网络参数,Radam优化器是经典Adam优化器的新变种,Adam优化算法的核心是用指数滑动平均去估计梯度每个分量的一阶矩和二阶矩,二阶矩即为自适应学习率,并用二阶矩去标准化一阶矩,得到每一步的更新量:The basis of the neural network model parameter optimization method is the stochastic gradient descent method (Stochastic GradientDescent, SGD), and then the Adam optimization algorithm and the Radam optimization algorithm are extended. The present invention uses Radam to optimize the neural network parameters, and the Radam optimizer is a classic Adam optimizer. The new variant, the core of the Adam optimization algorithm is to use the exponential moving average to estimate the first-order moment and the second-order moment of each component of the gradient. The second-order moment is the adaptive learning rate, and the second-order moment is used to standardize the first-order moment to obtain each Amount of update in one step:
mt=β1mt-1+(1-β1)gt (7)mt =β1 mt-1 +(1-β1 )gt (7)


式中mt-1、mt分别表示t-1、t时刻的一阶矩,即动量;υt-1、υt分别表示t-1、t时刻的二阶矩,即自适应学习率,η是学习率,ct是偏差修正项,ε是控制更新量的最大步长,Δθ是参数更新量;β1和β2是指数滑动平均的超参数,越小说明越倾向于局部平均。In the formula, mt-1 and mt represent the first-order moment at time t-1 and t respectively, that is, momentum; υt-1 and υt represent the second-order moment at time t-1 and t respectively, that is, the adaptive learning rate , η is the learning rate, ct is the deviation correction item, ε is the maximum step size of the control update amount, Δθ is the parameter update amount; β1 and β2 are the hyperparameters of the exponential moving average, and the smaller it is, the more inclined it is to the local average .
Radam优化算法实则是采用Adam优化算法的神经网络模型在训练初期将更新方法强制回退到带有动量的SGD算法,这样做的目的在于可避免训练初期vt的方差趋于无穷大带来的Adam优化算法更新参数失效的问题;另一方面,Radam优化器在Adam优化器的基础上做了一个学习率预热的改进,即它在训练开始的时候先选择使用一个较小的学习率,事先优化一些训练参数后,再修改为预先设置的学习来进行训练,这样做的目的在于避免选择一个较大的学习率可能带来的模型不稳定,而从小的学习率着手可以使得模型慢慢趋于稳定,等模型相对稳定后再选择预先设置的学习率进行训练,使得模型收敛速度变得更快,模型效果更佳。TheRadam optimization algorithm is actually a neural network model that uses the Adam optimization algorithm to force the update method to fall back to the SGD algorithm with momentum at the early stage of training. The optimization algorithm update parameter failure problem; on the other hand, the Radam optimizer has made a learning rate warm-up improvement on the basis of the Adam optimizer, that is, it chooses to use a smaller learning rate at the beginning of the training. After optimizing some training parameters, modify it to the preset learning for training. The purpose of this is to avoid the instability of the model that may be caused by choosing a larger learning rate, and starting with a small learning rate can make the model gradually tend to When the model is relatively stable, select the preset learning rate for training, so that the model convergence speed becomes faster and the model effect is better.
本发明采用Radam优化算法反向更新神经网络的权重以及偏置参数,相比于SGD优化算法、Adam优化算法,Radam优化算法优化的LSTM神经网络稳定性高,既能保证收敛速度快,也能很好地规避陷入局部最优解的问题。The present invention uses the Radam optimization algorithm to reversely update the weights and bias parameters of the neural network. Compared with the SGD optimization algorithm and the Adam optimization algorithm, the LSTM neural network optimized by the Radam optimization algorithm has high stability, which can not only ensure fast convergence speed, but also It can well avoid the problem of falling into a local optimal solution.
实施例的CatBoost模型参照2017年在期刊《eprint arXiv》刊登的Prokhorenkova等人的论文“CatBoost:unbiased boosting with categorical features”公开的CatBoost模型,它是一种基于梯度提升决策树(Gradient Boosting Decision Tree,GBDT)的机器学习框架,该模型对梯度估计方式进行改进,以解决梯度偏差及预测偏移的问题,从而减少过拟合的发生,提高模型预测的准确性和泛化能力。The CatBoost model of the embodiment refers to the CatBoost model disclosed in the paper "CatBoost: unbiased boosting with categorical features" published by Prokhorenkova et al. in the journal "eprint arXiv" in 2017. It is a Gradient Boosting Decision Tree based on Gradient Boosting Decision Tree, GBDT) machine learning framework, the model improves the gradient estimation method to solve the problem of gradient deviation and prediction offset, thereby reducing the occurrence of over-fitting and improving the accuracy and generalization ability of model prediction.
在GBDT的每一轮迭代训练过程中,损失函数使用相同的数据集求解每个样本的负梯度作为残差的近似值,从而求解下一轮的决策树,这将导致估计梯度在特征空间的任何域中的分布相对于该域中梯度的真实分布产生偏移,从而导致过拟合,为了解决上述问题,CatBoost采用排序提升的方式来减小梯度偏差,即用一个不包含第i个样本的数据集来求解第i个样本所对应的负梯度。During each round of iterative training of GBDT, the loss function uses the same data set to solve the negative gradient of each sample as an approximation of the residual, thereby solving the decision tree of the next round, which will lead to the estimated gradient at any point in the feature space The distribution in the domain deviates from the real distribution of the gradient in the domain, which leads to overfitting. In order to solve the above problems, CatBoost adopts a ranking promotion method to reduce the gradient deviation, that is, using a method that does not contain the i-th sample Data set to solve the negative gradient corresponding to the i-th sample.
对训练集
ri=yi-Mσ(i)-1(xi) (11)ri =yi -Mσ(i)-1 (xi ) (11)
式中ri表示第i个样本的无偏梯度估计;Mσ(i)-1(xi)表示基于排序σ(i)-1对样本xi的预测结果;In the formula, ri represents the unbiased gradient estimate of the i-th sample; Mσ(i)-1 (xi ) represents the prediction result of sample xi based on ranking σ(i)-1 ;
对每一个样本xi,使用该样本在序列i之前的训练集(xj,rj),σ(j)≤i训练下一个决策树ΔM,模型更新公式为:Mi+1=Mi+ΔM,迭代完成后输出模型Mn作为最终的模型。For each sample xi , use the training set (xj , rj ) of the sample before sequence i, σ(j)≤i to train the next decision tree ΔM, the model update formula is: Mi+1 = Mi +ΔM, output the model Mn as the final model after the iteration is completed.
CatBoost模型训练过程采用k折交叉验证,其具体的处理步骤为:The CatBoost model training process uses k-fold cross-validation, and its specific processing steps are:
1)首先,将全部样本划分成k个大小相等的样本子集;1) First, divide all samples into k sample subsets of equal size;
2)依次遍历这k个子集,每次把当前子集作为验证集,其余所有样本作为训练集,进行模型的训练和评估;2) Traversing the k subsets in turn, each time the current subset is used as a verification set, and all other samples are used as a training set to train and evaluate the model;
3)最后把k次评估指标的平均值作为最终的评估指标。3) Finally, the average value of k evaluation indicators is taken as the final evaluation indicator.
k折交叉验证避免为了追求高准确率而在训练集上产生过拟合,从而使得模型在样本外的数据上具有较高的预测准确率,本发明采用5折交叉验证,如图2所示。K-fold cross-validation avoids overfitting on the training set in pursuit of high accuracy, so that the model has a higher prediction accuracy on out-of-sample data. The present invention uses 5-fold cross-validation, as shown in Figure 2 .
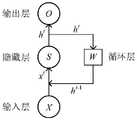
LSTM是一种特殊形式的RNN网络,RNN网络通过使用自反馈的神经元,能处理任意长度的时序数据。简单RNN网络单元如图3a所示,RNN网络使用三个权重矩阵U、V、W,其中U、V、W分别表示输入层到隐藏层、隐藏层到输出层、前一时刻隐藏层对当前隐藏层贡献的权重值。LSTM is a special form of RNN network that can process sequential data of any length by using self-feedback neurons. The simple RNN network unit is shown in Figure 3a. The RNN network uses three weight matrices U, V, and W, where U, V, and W represent the input layer to the hidden layer, the hidden layer to the output layer, and the hidden layer to the current layer at the previous moment. The weight value contributed by the hidden layer.
记RNN网络在t时刻输入层的值是xt,隐藏层的输出值是ht,输出层的值是ot,根据网络结构原理,ht的值同时取决于xt和ht-1,数学表达式如下:Note that the value of the input layer of the RNN network at time t is xt , the output value of the hidden layer is ht , and the value of the output layer is ot . According to the principle of network structure, the value of ht depends on both xt and ht-1 , the mathematical expression is as follows:
ot=g(V·ht) (12)ot =g(V·ht ) (12)
ht=f[U·(xt+W·ht)]=f(U·xt+ht-1) (13)ht =f[U·(xt +W·ht )]=f(U·xt +ht-1 ) (13)
式中g表示输出层的激活函数,f表示隐藏层的激活函数。where g represents the activation function of the output layer, and f represents the activation function of the hidden layer.
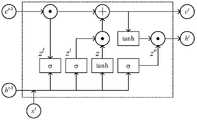
由式(12)和式(13)可知,输出结果会受到每一级的影响,随着网络级数的增加,可能产生梯度爆炸或者梯度消失使得网络模型无法从训练数据中获得更新而使得最终的网络模型预测效果差。为了降低梯度问题的影响,提出了LSTM模型,图3b所示为其循环单元结构。相比RNN,LSTM引入了一个新的内部状态ct专门进行线性的循环信息传递,同时非线性地输出信息给隐藏层的外部状态,图3b所示的LSTM循环单元的数学模型如下:It can be seen from equations (12) and (13) that the output results will be affected by each level. As the number of network stages increases, gradient explosion or gradient disappearance may occur so that the network model cannot be updated from the training data, making the final The prediction effect of the network model is poor. In order to reduce the impact of the gradient problem, the LSTM model is proposed, and its recurrent unit structure is shown in Figure 3b. Compared with RNN, LSTM introduces a new internal state ct for linear cyclic information transmission, and at the same time outputs information nonlinearly to the external state of the hidden layer. The mathematical model of the LSTM cyclic unit shown in Figure 3b is as follows:
z=tanh[W(xt ht-1)T] (14)z=tanh[W(xt ht-1 )T ] (14)
zf=σ[Wf(xt ht-1)T] (15)zf =σ[Wf (xt ht-1 )T ] (15)
zi=σ[Wi(xt ht-1)T] (16)zi =σ[Wi (xt ht-1 )T ] (16)
zo=σ[Wo(xt ht-1)T] (17)zo =σ[Wo (xt ht-1 )T ] (17)
式中z为候选状态,是经tanh激活函数转换成-1到1的数值。其中zf表示遗忘门的门控状态,用于控制上一个时刻的内部状态ct-1需要遗忘多少信息;zi表示输入门的门控状态,用于控制当前时刻的候选状态z有多少信息需要保存;zo表示输出门的门控状态,用于控制当前时刻的内部状态从ct有多少信息需要输出给外部状ht。In the formula, z is the candidate state, which is converted into a value from -1 to 1 by the tanh activation function. Among them, zf represents the gating state of the forget gate, which is used to control how much information needs to be forgotten in the internal state ct-1 at the previous moment; zi represents the gating state of the input gate, which is used to control how many candidate states z are at the current moment The information needs to be saved; zo represents the gating state of the output gate, which is used to control how much information needs to be output from the internal state ct to the external state ht at the current moment.
内部状态ct以及外部状态ht的计算式为:The calculation formula of internal state ct and external state ht is:
ct=zf⊙ct-1+zi⊙z (18)ct = zf ⊙ ct-1 + zi ⊙ z (18)
ht=zo⊙tanh(ct) (19)ht =zo ⊙tanh(ct ) (19)
式中⊙表示向量元素乘积,通过LSTM循环单元,整个网络可以建立较长距离的时序依赖关系。In the formula, ⊙ represents the product of vector elements. Through the LSTM cycle unit, the entire network can establish a long-distance timing dependency.
Stacking是一种分层模型集成框架。以两层为例,第一层由多个基学习器组成,其输入为原始训练集,第二层的模型则是以第一层基学习器的输出作为特征加入训练集进行再训练,从而得到完整的stacking模型。Stacking is a hierarchical model integration framework. Taking two layers as an example, the first layer is composed of multiple base learners whose input is the original training set, and the model of the second layer uses the output of the first base learner as a feature to join the training set for retraining, so that Get the complete stacking model.
瀑布融合方法采用了将多个模型串联的方式,通过将不同模型前后衔接的方法来进行组合。The waterfall fusion method adopts the method of connecting multiple models in series, and combines them by connecting different models back and forth.
本发明采用Stacking框架和瀑布融合方法,将CatBoost作为第一层模型,将Radam-LSTM作为第二层模型,将CatBoost输出的新特征结合原来的特征一起作为Radam-LSTM的输入特征对其进行训练,得到CatBoost与Radam-LSTM集成的光伏发电功率预测模型。The present invention adopts the Stacking framework and the waterfall fusion method, uses CatBoost as the first layer model, uses Radam-LSTM as the second layer model, and uses the new features output by CatBoost combined with the original features as the input features of Radam-LSTM to train it , to obtain a photovoltaic power prediction model integrated with CatBoost and Radam-LSTM.
步骤5:将利用训练好的功率预测模型用于光伏发电功率短期预测。Step 5: Use the trained power prediction model for short-term prediction of photovoltaic power generation.
实施例中对SGD、Adam、Radam优化算法分别用于LSTM网络的训练得到的预测模型的预测效果进行对比。In the embodiment, the prediction effects of the prediction models obtained by using the SGD, Adam, and Radam optimization algorithms respectively for the training of the LSTM network are compared.
取400个序列点进行预测,每个点间隔5分钟,分别利用SGD、Adam以及Radam三种优化器优化LSTM模型,预测效果分别如图7a、7b和7c所示,利用评价指标均方误差MSE、决定系数R2以及平均绝对值误差MAE来评估预测模型的效果,Take 400 sequence points for prediction, and the interval between each point is 5 minutes, respectively use SGD, Adam and Radam three optimizers to optimize the LSTM model, the prediction results are shown in Figure 7a, 7b and 7c respectively, and use the evaluation index mean square error MSE , the coefficient of determination R2 and the mean absolute value error MAE to evaluate the effect of the prediction model,


式中y(t)、Y(t)和
表3 SGD、Adam以及Radam优化器分别优化的LSTM模型的预测效果对比表Table 3 Comparison table of prediction effect of LSTM model optimized by SGD, Adam and Radam optimizers respectively

由表3可见,Radam优化器优化的LSTM模型即Radam-LSTM模型的各项指标都明显优于其他两种模型。It can be seen from Table 3 that the indicators of the LSTM model optimized by the Radam optimizer, that is, the Radam-LSTM model, are significantly better than the other two models.
实施例采用如图2所示的5折交叉验证方法将数据集划分为5份,其中4份作为训练集,另外1份作为测试集,经过5轮训练与测试后,将每次CatBoost模型输出的预测值拼接在一起作为一个新的特征,并与步骤3得到的12个特征组合成13个特征,作为Radam-LSTM模型的输入特征,对其进行训练,CatBoost与Radam-LSTM的集成模型的预测结果如图8所示。The embodiment uses the 5-fold cross-validation method shown in Figure 2 to divide the data set into 5 parts, 4 of which are used as training sets, and the other 1 is used as a test set. After 5 rounds of training and testing, each CatBoost model is output The predicted value is spliced together as a new feature, and combined with the 12 features obtained in step 3 to form 13 features, which are used as the input features of the Radam-LSTM model for training, and the integrated model of CatBoost and Radam-LSTM The predicted results are shown in Figure 8.
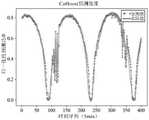
为验证本发明提出的CatBoost与Radam-LSTM集成模型的合理性和有效性,将该集成模型与单个Radam-LSTM模型以及CatBoost模型预测效果进行对比,并利用MSE、RMSE、R2等评价指标进行对比,结果表明本发明所提方法可有效提高预测精度,单个的Catboost模型的预测效果如图9所示,评价指标如表4所示。In order to verify the rationality and effectiveness of the CatBoost and Radam-LSTM integrated model proposed by the present invention, the integrated model is compared with a single Radam-LSTM model and the prediction effect of the CatBoost model, and compared using evaluation indicators such as MSE, RMSE, and R2 , the results show that the method proposed in the present invention can effectively improve the prediction accuracy, the prediction effect of a single Catboost model is shown in Figure 9, and the evaluation indicators are shown in Table 4.
表4 不同的预测模型的测效果对比表Table 4 Comparison table of measurement results of different prediction models

由表4以及图7a、7b、7c和图8、图9可见,本发明的CatBoost与Radam-LSTM集成模型的各项评价指标以及预测效果都明显占优;另外,本发明通过新增的特征,进一步提高了预测精度以及时间序列特征在光伏发电功率预测中的表达能力。It can be seen from Table 4 and Fig. 7a, 7b, 7c and Fig. 8 and Fig. 9 that the various evaluation indicators and prediction effects of the CatBoost and Radam-LSTM integrated model of the present invention are obviously superior; in addition, the present invention adopts newly added features , which further improves the prediction accuracy and the expression ability of time series features in photovoltaic power prediction.
本发明利用CatBoost模型不易过拟合以及通用性强的特点,采用Stacking和瀑布融合思想将两种模型进行集成,即利用CatBoost通过k折交叉验证产生的新特征作为Radam-LSTM模型的输入特征进行最终的训练预测。实施结果表明,两者的集成模型增加了整个模型不易过拟合以及稳定性强的优势,进一步提高了预测的性能。The present invention utilizes the characteristics of the CatBoost model that it is not easy to overfit and has strong versatility, and uses the idea of Stacking and waterfall fusion to integrate the two models, that is, use the new features generated by CatBoost through k-fold cross-validation as the input features of the Radam-LSTM model. Final training predictions. The implementation results show that the integrated model of the two increases the advantages of the entire model being less prone to overfitting and strong stability, and further improves the prediction performance.
Claims (6)


Priority Applications (1)
| Application Number | Priority Date | Filing Date | Title |
|---|---|---|---|
| CN202210794793.3ACN115293406A (en) | 2022-07-07 | 2022-07-07 | Photovoltaic power generation power prediction method based on Catboost and Radam-LSTM |
Applications Claiming Priority (1)
| Application Number | Priority Date | Filing Date | Title |
|---|---|---|---|
| CN202210794793.3ACN115293406A (en) | 2022-07-07 | 2022-07-07 | Photovoltaic power generation power prediction method based on Catboost and Radam-LSTM |
Publications (1)
| Publication Number | Publication Date |
|---|---|
| CN115293406Atrue CN115293406A (en) | 2022-11-04 |
Family
ID=83822312
Family Applications (1)
| Application Number | Title | Priority Date | Filing Date |
|---|---|---|---|
| CN202210794793.3APendingCN115293406A (en) | 2022-07-07 | 2022-07-07 | Photovoltaic power generation power prediction method based on Catboost and Radam-LSTM |
Country Status (1)
| Country | Link |
|---|---|
| CN (1) | CN115293406A (en) |
Cited By (2)
| Publication number | Priority date | Publication date | Assignee | Title |
|---|---|---|---|---|
| CN115795619A (en)* | 2022-12-08 | 2023-03-14 | 深圳大学 | Intelligent splicing system and method for shield tunnel segments |
| CN117494888A (en)* | 2023-11-03 | 2024-02-02 | 济南大学 | Distributed photovoltaic power prediction method and system based on optimized cascade |
- 2022
- 2022-07-07CNCN202210794793.3Apatent/CN115293406A/enactivePending
Cited By (3)
| Publication number | Priority date | Publication date | Assignee | Title |
|---|---|---|---|---|
| CN115795619A (en)* | 2022-12-08 | 2023-03-14 | 深圳大学 | Intelligent splicing system and method for shield tunnel segments |
| CN115795619B (en)* | 2022-12-08 | 2023-09-12 | 深圳大学 | Intelligent assembly system and method for shield tunnel segments |
| CN117494888A (en)* | 2023-11-03 | 2024-02-02 | 济南大学 | Distributed photovoltaic power prediction method and system based on optimized cascade |
Similar Documents
| Publication | Publication Date | Title |
|---|---|---|
| CN108280551B (en) | Photovoltaic power generation power prediction method utilizing long-term and short-term memory network | |
| CN109754113B (en) | Load prediction method based on dynamic time warping and long-and-short time memory | |
| CN109063911B (en) | Load aggregation grouping prediction method based on gated cycle unit network | |
| CN109829587A (en) | Zonule grade ultra-short term and method for visualizing based on depth LSTM network | |
| CN112232575B (en) | Comprehensive energy system regulation and control method and device based on multi-element load prediction | |
| CN115130741A (en) | Multi-model fusion based multi-factor power demand medium and short term prediction method | |
| CN109948845A (en) | A Long-Short-Term Memory Neural Network Prediction Method for Distribution Network Load | |
| CN105631558A (en) | BP neural network photovoltaic power generation system power prediction method based on similar day | |
| CN110414788A (en) | A Power Quality Prediction Method Based on Similar Days and Improved LSTM | |
| CN112330050B (en) | A power system load forecasting method based on double-layer XGBoost considering multiple features | |
| CN111985719B (en) | Power load prediction method based on improved long-term and short-term memory network | |
| CN112163689A (en) | Short-term load quantile probability prediction method based on deep Attention-LSTM | |
| CN110837888A (en) | Traffic missing data completion method based on bidirectional cyclic neural network | |
| CN107609671A (en) | A kind of Short-Term Load Forecasting Method based on composite factor evaluation model | |
| CN116703644A (en) | A short-term power load forecasting method based on Attention-RNN | |
| CN116345555A (en) | A Short-Term Photovoltaic Power Forecasting Method Based on CNN-ISCA-LSTM Model | |
| CN115293406A (en) | Photovoltaic power generation power prediction method based on Catboost and Radam-LSTM | |
| CN114626594A (en) | Medium-and-long-term electric quantity prediction method based on cluster analysis and deep learning | |
| CN117578441A (en) | Method for improving power grid load prediction precision based on neural network | |
| CN116681159A (en) | Short-term power load prediction method based on whale optimization algorithm and DRESN | |
| CN113344279A (en) | Resident load prediction method based on LSTM-SAM model and pooling | |
| CN115879590A (en) | Load prediction method based on wavelet feature extraction and integrated learning model | |
| Yang et al. | A novel short-term load forecasting approach for data-poor areas based on K-MIFS-XGBoost and transfer-learning | |
| CN119761849A (en) | Method for identifying and forecasting strong convection based on deep learning | |
| CN119651568A (en) | Wind power prediction method and system based on meteorological characteristics and deep learning model |
Legal Events
| Date | Code | Title | Description |
|---|---|---|---|
| PB01 | Publication | ||
| PB01 | Publication | ||
| SE01 | Entry into force of request for substantive examination | ||
| SE01 | Entry into force of request for substantive examination |