CN115185937A - SA-GAN architecture-based time sequence anomaly detection method - Google Patents
SA-GAN architecture-based time sequence anomaly detection methodDownload PDFInfo
- Publication number
- CN115185937A CN115185937ACN202210819480.9ACN202210819480ACN115185937ACN 115185937 ACN115185937 ACN 115185937ACN 202210819480 ACN202210819480 ACN 202210819480ACN 115185937 ACN115185937 ACN 115185937A
- Authority
- CN
- China
- Prior art keywords
- data
- abnormal
- gan
- input
- threshold
- Prior art date
- Legal status (The legal status is an assumption and is not a legal conclusion. Google has not performed a legal analysis and makes no representation as to the accuracy of the status listed.)
- Pending
Links
Images


Classifications
- G—PHYSICS
- G06—COMPUTING OR CALCULATING; COUNTING
- G06F—ELECTRIC DIGITAL DATA PROCESSING
- G06F16/00—Information retrieval; Database structures therefor; File system structures therefor
- G06F16/20—Information retrieval; Database structures therefor; File system structures therefor of structured data, e.g. relational data
- G06F16/21—Design, administration or maintenance of databases
- G06F16/215—Improving data quality; Data cleansing, e.g. de-duplication, removing invalid entries or correcting typographical errors
- G—PHYSICS
- G06—COMPUTING OR CALCULATING; COUNTING
- G06F—ELECTRIC DIGITAL DATA PROCESSING
- G06F16/00—Information retrieval; Database structures therefor; File system structures therefor
- G06F16/20—Information retrieval; Database structures therefor; File system structures therefor of structured data, e.g. relational data
- G06F16/24—Querying
- G06F16/245—Query processing
- G06F16/2458—Special types of queries, e.g. statistical queries, fuzzy queries or distributed queries
- G06F16/2474—Sequence data queries, e.g. querying versioned data
- G—PHYSICS
- G06—COMPUTING OR CALCULATING; COUNTING
- G06N—COMPUTING ARRANGEMENTS BASED ON SPECIFIC COMPUTATIONAL MODELS
- G06N3/00—Computing arrangements based on biological models
- G06N3/02—Neural networks
- G06N3/04—Architecture, e.g. interconnection topology
- G—PHYSICS
- G06—COMPUTING OR CALCULATING; COUNTING
- G06N—COMPUTING ARRANGEMENTS BASED ON SPECIFIC COMPUTATIONAL MODELS
- G06N3/00—Computing arrangements based on biological models
- G06N3/02—Neural networks
- G06N3/08—Learning methods
Landscapes
- Engineering & Computer Science (AREA)
- Theoretical Computer Science (AREA)
- Physics & Mathematics (AREA)
- Data Mining & Analysis (AREA)
- General Engineering & Computer Science (AREA)
- General Physics & Mathematics (AREA)
- Software Systems (AREA)
- Databases & Information Systems (AREA)
- Mathematical Physics (AREA)
- Computational Linguistics (AREA)
- Artificial Intelligence (AREA)
- Biomedical Technology (AREA)
- Biophysics (AREA)
- Life Sciences & Earth Sciences (AREA)
- Evolutionary Computation (AREA)
- General Health & Medical Sciences (AREA)
- Molecular Biology (AREA)
- Computing Systems (AREA)
- Health & Medical Sciences (AREA)
- Quality & Reliability (AREA)
- Fuzzy Systems (AREA)
- Probability & Statistics with Applications (AREA)
- Management, Administration, Business Operations System, And Electronic Commerce (AREA)
Abstract
Translated fromChinese
Description
Translated fromChinese技术领域technical field
本发明属于数据分析技术领域,具体涉及一种基于SA-GAN架构的时间序列异常检测方法。The invention belongs to the technical field of data analysis, and in particular relates to a time series anomaly detection method based on SA-GAN architecture.
背景技术Background technique
随着科学技术和制造工艺的迅猛发展,网络信息系统、工业生产系统越来越呈现出规模大型化、功能智能化和控制复杂化的特点。然而,复杂系统中任何环节出现故障都会影响整个系统的安全和稳定,如不及时发现处理,可能会引发严重后果甚至灾难。如何能在故障萌芽之初就及时检测出系统的异常,发现系统的早期微小故障,是保障系统正常运行的关键问题。然而,面对状态随机、故障偶发的复杂系统以及多源异构、海量高维、缺少标签的非平衡状态数据,传统的异常检测技术不仅无法充分提取数据中隐含的逻辑关系和异常特征,甚至连精确的数学模型和完备的专家知识库都难以构建。With the rapid development of science and technology and manufacturing technology, network information systems and industrial production systems are increasingly showing the characteristics of large scale, intelligent functions and complex control. However, the failure of any link in a complex system will affect the security and stability of the entire system. If it is not detected and handled in time, it may lead to serious consequences or even disasters. How to detect the abnormality of the system in time at the beginning of the fault germination and find the early micro-fault of the system is the key issue to ensure the normal operation of the system. However, in the face of complex systems with random states and occasional faults, as well as multi-source heterogeneous, massive high-dimensional, and unlabeled unbalanced state data, traditional anomaly detection techniques cannot fully extract the logical relationships and anomalous features implicit in the data. Even precise mathematical models and complete expert knowledge bases are difficult to construct.
深度学习具有优异的表征能力,能够从原始数据中自动学习提取特征,摆脱了人工设计特征的困境,最早应用在图像识别和自然语言处理领域并取得显著成绩,在时间序列异常检测领域虽然起步较晚,但随着深度学习技术的不断发展,越来越多的研究人员在各自领域提出利用神经网络模型对设备状态数据表现的特征进行研究和分析,从而实现系统健康监测和异常识别。但这种粗粒度的会话级检测方法,不能实现对异常状态的先期发现,实际的设备状态数据中异常样本稀少,给异常样本特征的提取工作带来很大的挑战。另外,由于进行异常判定的门限通常是人工设计,不科学的阈值会导致较高的误报率和漏检率,因此对工程人员的专业水准和操作经验要求较高。但对于复杂多维时间序列,尤其是对于有多个关键绩效指标(KPI,key performance indicator)的多维状态数据,很难由人工进行统一的阈值设定。Deep learning has excellent representation ability, can automatically learn to extract features from raw data, and get rid of the dilemma of artificial design features. It was first applied in the field of image recognition and natural language processing and achieved remarkable results. Although it started relatively early in the field of time series anomaly detection. Late, but with the continuous development of deep learning technology, more and more researchers in their respective fields propose to use neural network models to study and analyze the characteristics of equipment status data, so as to achieve system health monitoring and abnormal identification. However, this coarse-grained session-level detection method cannot realize the early detection of abnormal status, and the abnormal samples in the actual equipment status data are scarce, which brings great challenges to the extraction of abnormal sample features. In addition, because the threshold for abnormal determination is usually designed manually, unscientific thresholds will lead to higher false alarm rate and missed detection rate, so the professional level and operation experience of engineers are required to be higher. However, for complex multidimensional time series, especially for multidimensional state data with multiple key performance indicators (KPIs, key performance indicators), it is difficult to set uniform thresholds manually.
发明内容SUMMARY OF THE INVENTION
本发明的目的在于克服现有技术的不足,提供一种基于SA-GAN架构的时间序列异常检测方法。The purpose of the present invention is to overcome the deficiencies of the prior art and provide a time series anomaly detection method based on the SA-GAN architecture.
为实现上述目的,本发明采用的技术方案是:For achieving the above object, the technical scheme adopted in the present invention is:
一种基于SA-GAN架构的时间序列异常检测方法,包括以下步骤:A time series anomaly detection method based on SA-GAN architecture, including the following steps:
S1、建立SA-GAN模型;S1. Establish an SA-GAN model;
S2、对输入数据进行处理,得到处理后的数据;S2. Process the input data to obtain processed data;
S3、利用步骤S2中得到的处理后的数据对步骤S1得到的SA-GAN模型进行训练,训练完成后,得到训练好的SA-GAN模型;S3, using the processed data obtained in step S2 to train the SA-GAN model obtained in step S1, and after the training is completed, a trained SA-GAN model is obtained;
S4、将待测数据输入到步骤S3中得到的训练好的SA-GAN中,利用重构误差和判别误差计算综合异常得分,设定阈值,并与阈值做比较,大于阈值的即可初步断定为是异常流量,然后对异常流量进行异常裁剪,最终得到异常数据。S4. Input the data to be tested into the trained SA-GAN obtained in step S3, use the reconstruction error and the discrimination error to calculate the comprehensive abnormal score, set a threshold, and compare it with the threshold. If it is greater than the threshold, it can be preliminarily concluded. In order to be abnormal traffic, then abnormal traffic is abnormally clipped, and finally abnormal data is obtained.
优选的,步骤S1中,所述SA-GAN模型由两组生成对抗网络构成,SA-GAN模型的具体建立步骤为:Preferably, in step S1, the SA-GAN model is composed of two groups of generative adversarial networks, and the specific steps for establishing the SA-GAN model are:
S11、将注意力机制嵌入到其中一个判别器C1中,真实时间序列x输入判别器C1中,判别器C1将具有辨别力的特征区域生成注意力图谱Aθ(x);S11. Embed the attention mechanism into one of the discriminators C1 , the real time series x is input into the discriminator C1 , and the discriminator C1 generates the attention map Aθ (x) from the feature regions with discriminative ability;
S12、在生成器G1完成Z→X的映射时,将判别器C1生成的注意力图谱Aθ(x)迁移到生成器G1;S12. When the generator G1 completes the mapping of Z→X, transfer the attention map Aθ (x) generated by the discriminator C1 to the generator G1 ;
S13、真实时间序列x输入普通判别器C2中,在生成器G2完成X→Z的映射时,普通判别器C2将输入的时间序列x迁移到生成器G2;S13. The real time series x is input into the common discriminator C2 , when the generator G2 completes the mapping of X→Z, the common discriminator C2 migrates the input time series x to the generator G2 ;
S14、利用最小化原始流量样本和重构流量样本之间差异的L2范数,对生成器G1和G2实现同步训练,结合所有训练目标,得到SA-GAN模型,表达式为:S14. Use the L2 norm that minimizes the difference between the original flow sample and the reconstructed flow sample to implement synchronous training for the generators G1 and G2 , and combine all the training objectives to obtain the SA-GAN model, the expression is:

其中,λ、γ、μ为各损失函数的权值,λ+γ+μ=1。Among them, λ, γ, μ are the weights of each loss function, λ+γ+μ=1.
优选的,步骤S2中,所述输入数据处理包含以下步骤:Preferably, in step S2, the input data processing includes the following steps:
S21、利用数据清洗技术,对输入数据进行清洗,得到清洗后的数据;S21, using data cleaning technology to clean the input data to obtain cleaned data;
S22、将清洗后的数据进行文本数值化,得到数值化数据;S22, digitizing the cleaned data into text to obtain numerical data;
S23、将数值化数据进行归一化处理,得到归一化数据;S23, performing normalization processing on the numerical data to obtain normalized data;
S24、将归一化数据利用滑动窗口技术进行子序列划分,得到处理后的数据。S24 , dividing the normalized data into subsequences by using a sliding window technique to obtain processed data.
优选的,步骤S3中,所述SA-GAN模型的训练方法如下:Preferably, in step S3, the training method of the SA-GAN model is as follows:
S31、利用z~PZ中的样本作为输入,对判别器C2进行训练,同时利用x~PX中的样本作为输入,对判别器C1进行训练训练,判别器C1生成注意力图谱;S31. Use the samples in z to PZ as input to train the discriminator C2 , and use the samples in x to PX as the input to train the discriminator C1 , and the discriminator C1 generates an attention map ;
S32、对生成器G1和G2同时进行训练;S32, train the generators G1 and G2 at the same time;
S32、在训练过程中,采取循环嵌套的方法,对判别器C1和C2以及G1和G2进行训练,并引入梯度惩罚项,判别器C1和C2利用生成数据和真实数据交替采样来计算梯度惩罚项,对生成器G1和C2进行训练;S32. In the training process, adopt the method of loop nesting to train the discriminators C1 and C2 and G1 and G2 , and introduce a gradient penalty term, and the discriminators C1 and C2 use the generated data and real data. Alternate sampling to calculate the gradient penalty term to train generatorsG1 and C2;
S33、当判别器C1和C2无法分辨出输入的样本来自于真实环境还是生成器G1和G2,则SA-GAN模型训练完成。S33. When the discriminators C1 and C2 cannot distinguish whether the input samples come from the real environment or the generators G1 and G2 , the SA-GAN model training is completed.
优选的,步骤S4具体包含以下步骤:Preferably, step S4 specifically includes the following steps:
S41、将待测数据子序列xi输入到步骤S3中得到的训练好的SA-GAN中,生成对应重构序列

S42、将判别器C2输出的xi与
S43、将重构误差异常得分和判别误差异常得分利用Z-Score标准化方法做标准化处理,将处理结果进行凸组合,得到综合异常得分;S43, using the Z-Score standardization method to standardize the abnormal score of reconstruction error and the abnormal score of discrimination error, and perform convex combination of the processing results to obtain a comprehensive abnormal score;
S44、采用滑动窗口自适应阈值技术设定阈值;S44, adopting the sliding window adaptive threshold technology to set the threshold;
S45、将滑动窗口内的综合异常得分与阈值做比较,综合异常得分大于阈值的判定为异常流量子序列,连续的异常流量子序列组成异常流量序列;S45 , comparing the comprehensive abnormality score in the sliding window with the threshold value, and determining that the comprehensive abnormality score is greater than the threshold value is an abnormal flow subsequence, and the continuous abnormal flow subsequence constitutes an abnormal flow sequence;
S46、根据自适应异常修剪方法对异常流量进行异常裁剪,最终得到异常数据。S46. Perform abnormal pruning on abnormal traffic according to the adaptive abnormal pruning method, and finally obtain abnormal data.
优选的,步骤S46具体包含以下步骤:Preferably, step S46 specifically includes the following steps:
(1)提取各异常序列中子序列异常得分最大的值

(2)将验证集数据输入训练好的SA-GAN模型中,利用超参数搜索方法使验证集异常检测性能指标F1值达到最大时的裁剪速率阈值p;(2) Input the validation set data into the trained SA-GAN model, and use the hyperparameter search method to make the cropping rate threshold p when the F1 value of the validation set anomaly detection performance index reaches the maximum;
(3)将pi与设定的裁剪速率阈值p进行比较,当第一个没有超过阈值p的pi出现时,将它及其后续的最大异常得分
本发明与现有技术相比,其有益效果在于:Compared with the prior art, the present invention has the following beneficial effects:
(1)本发明将注意力机制融合到判别器中,并将计算的结果迁移到生成器,使生成器对状态数据中的关键特征区域给予更高的权重,使状态数据中的特征尽可能多的得以保留,有利于生成更加逼真的状态数据;(1) The present invention integrates the attention mechanism into the discriminator, and transfers the calculated results to the generator, so that the generator can give higher weights to the key feature areas in the state data, so that the features in the state data can be as much as possible More are retained, which is conducive to the generation of more realistic status data;
(2)本发明为保证重构样本与原始样本的一致性,通过使用改进的cycleconsistency loss,作为生成器的重构约束,使生成数据尽量拟合原始数据的特征;(2) In order to ensure the consistency of the reconstructed sample and the original sample, the present invention uses the improved cycleconsistency loss as the reconstruction constraint of the generator, so that the generated data can fit the characteristics of the original data as much as possible;
(3)不同于早期注意力机制会增加额外的计算开支,本发明提供的TA-GAN是一种轻量级的模型,不需要提供单独的注意力网络或监督信息,可以有效地平衡了特征取舍与计算消耗的矛盾,此外由注意力指导的生成器,具有更强的生成能力,有利于增强模型的鲁棒性。(3) Unlike the early attention mechanism, which will increase additional computational expenses, the TA-GAN provided by the present invention is a lightweight model that does not need to provide a separate attention network or supervision information, which can effectively balance the features The contradiction between trade-off and computational consumption, in addition, the generator guided by attention has stronger generation ability, which is beneficial to enhance the robustness of the model.
(4)本发明采用自适应的门限设置技术,无需要人工设定阈值,可更好地适应多KPI状态数据的检测需求;(4) The present invention adopts the self-adaptive threshold setting technology, which does not need to manually set the threshold, and can better adapt to the detection requirements of multi-KPI state data;
(5)本发明利用时间窗口划分出状态数据的子序列,提升模型训练与检测的时效性,实现异常的发期发现;自适应的异常判定及裁剪方法,可以提升模型对时间序列异常检测的效果。(5) The present invention uses the time window to divide the sub-sequences of the state data, improves the timeliness of model training and detection, and realizes the discovery of abnormal occurrence period; the adaptive abnormal judgment and cutting method can improve the model's ability to detect time series abnormality. Effect.
附图说明Description of drawings
图1为本发明实施例中的SA-GAN模型的基本结构图;Fig. 1 is the basic structure diagram of the SA-GAN model in the embodiment of the present invention;
图2为本发明实施例提供的时间序列异常检测方法的流程框图;FIG. 2 is a flowchart of a time series anomaly detection method provided by an embodiment of the present invention;
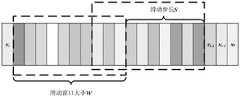
图3为本发明实施例中的滑动窗口划分时间子序列的示意图;3 is a schematic diagram of dividing a time subsequence by a sliding window in an embodiment of the present invention;
图4为本发明实施例中利用滑动窗口计算阈值的示意图;4 is a schematic diagram of calculating a threshold using a sliding window in an embodiment of the present invention;
图5为本发明实施例中利用自适应阈值法初步筛检出的异常数据图;5 is a diagram of abnormal data initially screened and detected by an adaptive threshold method in an embodiment of the present invention;
图6为本发明实施例中各序列中最大异常得分降序排列以及最大异常得分下降速率排列图;6 is a diagram showing the descending order of the maximum abnormal score and the maximum abnormal score decline rate in each sequence in the embodiment of the present invention;
图中,图6(a)为最大异常得分降序排列图,图6(b)为最大异常得分下降速率图;In the figure, Figure 6(a) is a descending order of the maximum abnormal score, and Figure 6(b) is a graph of the maximum abnormal score decline rate;
图7为各模型异常检测的F1值对比图。Figure 7 is a comparison chart of the F1 value of abnormal detection of each model.
具体实施方式Detailed ways
下面将参照附图更详细地描述本公开的示例性实施例。虽然附图中显示了本公开的示例性实施例,然而应当理解,可以以各种形式实现本公开而不应被这里阐述的实施例所限制。相反,提供这些实施例是为了能够更透彻地理解本公开,并且能够将本公开的范围完整的传达给本领域的技术人员。Exemplary embodiments of the present disclosure will be described in more detail below with reference to the accompanying drawings. While exemplary embodiments of the present disclosure are shown in the drawings, it should be understood that the present disclosure may be embodied in various forms and should not be limited by the embodiments set forth herein. Rather, these embodiments are provided so that the present disclosure will be more thoroughly understood, and will fully convey the scope of the present disclosure to those skilled in the art.
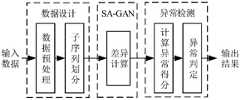
如图2所示,本发明实施例提供了一种基于SA-GAN架构的时间序列异常检测方法,具体包括以下步骤:As shown in FIG. 2 , an embodiment of the present invention provides a time series anomaly detection method based on the SA-GAN architecture, which specifically includes the following steps:
S1、建立SA-GAN模型,如图1所示,所述SA-GAN模型由两组生成对抗网络构成,SA-GAN模型的具体建立步骤为:S1. Establish an SA-GAN model. As shown in Figure 1, the SA-GAN model is composed of two groups of generative adversarial networks. The specific steps for establishing the SA-GAN model are:
S11、将注意力机制嵌入到其中一个判别器C1中,真实时间序列x输入判别器C1中,判别器C1将具有辨别力的特征区域生成注意力图谱Aθ(x),具体为:S11. Embed the attention mechanism into one of the discriminators C1 , the real time series x is input into the discriminator C1 , and the discriminator C1 generates the attention map Aθ (x) from the feature area with discriminative ability, specifically as :
对于给定的输入流量X,将其线性投影到三个不同的空间分别得到查询向量Q,键向量K,值向量V,如下式:For a given input traffic X, linearly project it into three different spaces to obtain the query vector Q, the key vector K, and the value vector V, as follows:

其中,Wq、Wk、Wv是模型训练过程中学习到的参数,初始时给它们随机赋予相同的值,训练时可以随着反向传播而调整;Among them, Wq , Wk , and Wv are the parameters learned in the model training process. Initially, they are randomly assigned the same value, and can be adjusted with backpropagation during training;
利用Q、K、V找到每个特征与其他特征之间的相关性系数,即每个特征计算出一个权重,根据权重加权的结果来说明每个特征与哪一个特征之间关联最大,通过学习这些关注值来表示状态数据特征的深层相互关系,并形成注意力图谱,如下式:Use Q, K, and V to find the correlation coefficient between each feature and other features, that is, each feature calculates a weight, and according to the weighted result, it shows which feature has the greatest correlation with each feature. These attention values represent the deep interrelationship of state data features and form an attention map, as follows:

其中,
Aθ(X)=O(Q,K,V)Aθ (X)=O(Q, K, V)
融合了自注意力机制的判别器C1,除了完成真假辨别之外,还可根据输入数据特征对分类贡献的大小,分别赋予不同的注意力值,即当真实时间序列x输入到判别器C1,C1就可以将一些具较高辨别力的特征区域生成注意力图谱Aθ(x)。将生成的注意力图谱迁移到生成器G1,以帮助其将输入数据z映射到新生成样本z′时,聚焦于最具辨别力的部分,而对于非重要特征则进行抑制,这种方法可以减少运算开支,并获得更加逼真的样本。The discriminator C1 that integrates the self-attention mechanism, in addition to completing the true and false discrimination, can also assign different attention values according to the contribution of the input data features to the classification, that is, when the real time series x is input to the discriminator C1 , C1 can generate the attention map Aθ (x) from some feature regions with higher discriminative ability. Transfer the generated attention map to the generator G1 to help it map the input data z to the newly generated samples z′, focusing on the most discriminative parts, while suppressing the non-important features, this method Computational overhead can be reduced and more realistic samples can be obtained.
z′=G1(zα)=G1(Aθ(x)⊙z)z′=G1 (zα )=G1 (Aθ (x)⊙z)
其中,zα是加入注意力的输入样本;Among them, zα is the input sample for adding attention;
S12、在生成器G1完成Z→X的映射时,将判别器C1生成的注意力图谱Aθ(x)迁移到生成器G1,促使生成器对贡献大的关键特征给予更多关注,它们的Wasserstein目标公式可表示为S12. When the generator G1 completes the mapping of Z→X, transfer the attention map Aθ (x) generated by the discriminator C1 to the generator G1 , so as to prompt the generator to pay more attention to the key features with large contributions , their Wasserstein objective formulations can be expressed as

其中,

S13、真实时间序列x输入普通判别器C2中,在生成器G2完成X→Z的映射时,普通判别器C2将输入的时间序列x迁移到生成器G2,则Wasserstein目标公式可表示为S13. The real time series x is input into the ordinary discriminator C2 , when the generator G2 completes the mapping of X→Z, the ordinary discriminator C2 migrates the input time series x to the generator G2 , then the Wasserstein objective formula can be Expressed as

其中,
S14、本发明构建SA-GAN的目的是为了重构输入的时间序列,但是仅仅使用对抗损失,不能保证将单个输入映射到期望的输出,因此我们又引入了Cycle Consistency Loss,表达式为:S14. The purpose of constructing SA-GAN in the present invention is to reconstruct the input time series, but only using adversarial loss cannot guarantee that a single input is mapped to the desired output, so we introduce Cycle Consistency Loss, the expression is:

通过利用最小化原始流量样本和重构流量样本之间差异的L2范数,对生成器G1和G2实现同步训练,结合所有训练目标,得到SA-GAN模型,表达式为:By using the L2 norm that minimizes the difference between the original flow samples and the reconstructed flow samples, the generators G1 and G2 are trained synchronously. Combined with all training objectives, the SA-GAN model is obtained, and the expression is:

其中,λ、γ、μ为各损失函数的权值,λ+γ+μ=1,关于λ、γ、μ的取值,可采用控制变量法固定其他参数,对比λ、γ、μ不同取值时的实验结果,模型在验证集上的检测效果取得最佳时确定。Among them, λ, γ, and μ are the weights of each loss function, λ+γ+μ=1. Regarding the values of λ, γ, and μ, other parameters can be fixed by the control variable method. It is determined when the model achieves the best detection effect on the validation set.
S2、现实环境中产生的状态数据是不完整、不一致的,为确保SA-GAN异常检测模型的训练及异检测结果的客观性和准确性,需要对原始输入数据进行处理,主要由数据预处理和子序列划分2个处理过程,数据预处理是为保证数据的可读性和统一性而进行的状态数据清洗、文本数值化、数据切分、数值归一化等操作,对于较大的状态数据即使被分为训练集、验证集和测试集,这些数据序列仍然非常长,直接输入SA-GAN模块进行运算会导致训练时间增加、参数更新缓慢、计算开支过度消耗等问题,因此,本发明对各状态数据序列集再利用滑动窗口技术进行子序列划分,以保证训练与检测的准确率和时效性,然后得到处理后的数据,所述输入数据处理包含以下步骤:S2. The state data generated in the real environment is incomplete and inconsistent. In order to ensure the training of the SA-GAN anomaly detection model and the objectivity and accuracy of the anomaly detection results, the original input data needs to be processed, mainly by data preprocessing and sub-sequences are divided into two processing processes. Data preprocessing is the operations of state data cleaning, text digitization, data segmentation, and numerical normalization to ensure the readability and uniformity of the data. For larger state data Even if it is divided into training set, validation set and test set, these data sequences are still very long, and directly inputting the SA-GAN module for operation will lead to problems such as increased training time, slow parameter update, and excessive computational cost. Each state data sequence set is then divided into subsequences by sliding window technology to ensure the accuracy and timeliness of training and detection, and then processed data is obtained. The input data processing includes the following steps:
S21、传感器从真实环境中获取的状态数据或日志数据中可能会存在重复或残缺的无效数据,需要利用数据清洗技术,对这些冗余和缺失的输入数据进行清洗,得到清洗后的数据;S21. There may be duplicate or incomplete invalid data in the status data or log data obtained by the sensor from the real environment. It is necessary to use data cleaning technology to clean these redundant and missing input data to obtain cleaned data;
S22、原始状态数据的属性特征值并不完全是数字,还有部分是文本信息,因此需要将清洗后的数据进行文本数值化,即将这些文本转换成相应的离散数值以便参与运算得到数值化数据;S22. The attribute eigenvalues of the original state data are not entirely numbers, and some are text information. Therefore, the cleaned data needs to be textualized, that is, the texts are converted into corresponding discrete values so as to participate in the operation to obtain numerical data. ;
S23、不同属性数据的量纲不同,特征向量的取值范围也不尽相同,差异较大时会影响检测结果,需要对数值化数据进行归一化处理,使数据分布在设定的区间内,得到归一化数据;S23. The dimension of different attribute data is different, and the value range of the feature vector is also different. If the difference is large, the detection result will be affected. It is necessary to normalize the numerical data so that the data is distributed within the set interval. , get normalized data;
S24、将归一化数据利用滑动窗口技术进行子序列划分,得到处理后的数据;S24, dividing the normalized data into subsequences by using a sliding window technique to obtain processed data;
滑动窗口划分时间子序列如图3所示,利用窗口大小为w、步长为s的滑动窗口对长度为T的M维特征时间序列进行子序列划分,可得到,其中为子序列的个数。滑动窗口的大小与步长应根据被划分数据集规格及运算设备的性能来综合考虑。过大过密的子序列会对设备内存带来很大压力,而读取过小过密的子序列需要频繁进行内部通信;另外过于稀疏的子序列会影响模型对数据相关性的挖掘,关于滑动窗口及滑动步长的设定应根据实验结果调整优化确定;The sliding window divides the time subsequence as shown in Figure 3. Using a sliding window with a window size of w and a step size of s to divide the M-dimensional feature time series of length T into subsequences, it can be obtained, where is the number of subsequences . The size and step size of the sliding window should be comprehensively considered according to the size of the divided dataset and the performance of the computing device. A subsequence that is too large and dense will put a lot of pressure on the device memory, and reading a subsequence that is too small and dense requires frequent internal communication; in addition, a subsequence that is too sparse will affect the model's mining of data correlations. The setting of sliding window and sliding step should be adjusted and optimized according to the experimental results;
S3、利用步骤S2中得到的处理后的数据对步骤S1得到的SA-GAN模型进行训练,训练完成后,得到训练好的SA-GAN模型,所述SA-GAN模型的训练方法如下:S3. Use the processed data obtained in step S2 to train the SA-GAN model obtained in step S1. After the training is completed, a trained SA-GAN model is obtained. The training method of the SA-GAN model is as follows:
S31、由于GAN结构的网络需要进行异步训练,因此SA-GAN模型的对应了2个异步的训练过程,它们都有各自的损失函数及优化器。由于GAN的判别器在训练阶段,只涉及到自身,因此可以直接利用z~PZ中的样本作为输入,对判别器C2进行训练,同时利用x~PX中的样本作为输入,对判别器C1进行训练,此时判别器C1生成注意力图谱;S31. Since the GAN-structured network needs to be trained asynchronously, the SA-GAN model corresponds to two asynchronous training processes, each of which has its own loss function and optimizer. Since the discriminator of GAN only involves itself in the training stage, it can directly use the samples in z ~ PZ as input to train the discriminator C2 , and use the samples in x ~ PX as input at the same time. The discriminatorC1 is trained, and the discriminatorC1 generates an attention map at this time;
S32、而生成器G1需要用到生成器G2的输出结果作为输入,因此需要对生成器G1和G2同时进行训练;S32, and the generator G1 needs to use the output result of the generator G2 as an input, so it is necessary to train the generators G1 and G2 at the same time;
S32、在训练过程中,为确保判别器产生有效的注意力图谱,采取循环嵌套的方法,生成器每训练一次,判别器先训练几次,对判别器C1和C2以及G1和G2进行训练,为满足利普希茨连续条件,WGAN引入梯度惩罚项来限制梯度变化范围,判别器C1和C2利用生成数据和真实数据交替采样来计算梯度惩罚项,对生成器G1和G2进行训练,这种训练方法可以使判别器更加″温和″地训练生成器,实现过程如下表1所示;S32. In the training process, in order to ensure that the discriminator generates an effective attention map, the method of loop nesting is adopted. Every time the generator is trained once, the discriminator is trained several times first, and the discriminators C1 and C2 and G1 and G2 is trained. In order to satisfy the Lipschitz continuity condition, WGAN introduces a gradient penalty term to limit the range of gradient variation. The discriminators C1 and C2 use the generated data and real data to alternately sample to calculate the gradient penalty term.1 and G2 for training, this training method can make the discriminator train the generator more "gently", and the implementation process is shown in Table 1 below;


S33、当判别器C1和C2无法分辨出输入的样本来自于真实环境还是生成器G1和G2,则SA-GAN模型训练完成;S33. When the discriminators C1 and C2 cannot distinguish whether the input samples come from the real environment or the generators G1 and G2 , the SA-GAN model training is completed;
S4、将待测数据输入到步骤S3中得到的训练好的SA-GAN中,因为SA-GAN完全学习到正常数据的真实分布,能够很好地完成正常状态数据的重构,因此当测试数据中存在异常数据时,生成器不能进行能效重构,此时将会产生较大的生成误差和判别误差,利用重构误差和判别误差计算综合异常得分,设定阈值,并与阈值做比较,大于阈值的即可初步断定为是异常流量,然后对异常流量进行异常裁剪,最终得到异常数据,步骤S4具体包含以下步骤:S4. Input the data to be tested into the trained SA-GAN obtained in step S3, because SA-GAN completely learns the true distribution of normal data and can well complete the reconstruction of normal state data, so when the test data When there is abnormal data in the generator, the generator cannot perform energy efficiency reconstruction, and a large generation error and discriminant error will occur at this time. Use the reconstruction error and discriminant error to calculate the comprehensive abnormal score, set a threshold, and compare it with the threshold. If it is greater than the threshold, it can be preliminarily determined to be abnormal traffic, and then abnormal traffic is abnormally clipped to finally obtain abnormal data. Step S4 specifically includes the following steps:
S41、将待测数据子序列


点差异是等间隔情况下的输入子序列与重构子序列中各样本在对应维度特征值差异的总和,计算方法为The point difference is the sum of the difference of the eigenvalues in the corresponding dimension of each sample in the input subsequence and the reconstructed subsequence under the condition of equal interval. The calculation method is:

面差异是非等间隔条件下的输入子序列与重构子序列中各样本维度特征在时间邻域[-l,l]上面积差值的总和,计算方法为The area difference is the sum of the area differences of the input subsequence and the reconstructed subsequence in the temporal neighborhood [-l, l] of the input subsequence and the reconstructed subsequence. The calculation method is as follows:

相对于点差异,面差异更适合发现较长时间段中存在微小差别的区域。点差异也可以认为是特殊的面差异,因此本发明使用面差异作为计算重构误差异常得分的方法。Compared to point differences, polygon differences are better for finding areas with small differences over longer time periods. The point difference can also be considered as a special area difference, so the present invention uses the area difference as a method for calculating the reconstruction error anomaly score.
S42、将判别器C2输出的xi与

S43、将重构误差异常得分

Score(xi)=αZRe(xi)+(1-α)ZDd(xi)Score(xi )=αZRe (xi )+(1-α)ZDd (xi )
当异常得分超过阈值时,即可判定输入数据中存在异常其中,α∈(0,1)为控制两项的相对重要性的参数,α的取值可根据验证集在训练好的模型上的检测结果达到最优时来确定。When the anomaly score exceeds the threshold, it can be determined that there is an anomaly in the input data. Among them, α∈(0,1) is a parameter that controls the relative importance of the two items, and the value of α can be determined according to the validation set on the trained model. It is determined when the detection result reaches the optimum.
根据子序列的异常得分Score(xi),使用阈值法即可判断该子序列是否存在异常。传统的阈值法由人工设定阈值,对人员技术经验的依赖性较高,且容易出现较高的误报率,因此本发明采用滑动窗口自适应技术来确定阈值。According to the abnormal score Score(xi ) of the subsequence, the threshold method can be used to judge whether the subsequence is abnormal. The traditional threshold method sets the threshold manually, which is highly dependent on the technical experience of personnel and prone to a high false alarm rate. Therefore, the present invention adopts the sliding window adaptive technology to determine the threshold.
S44、采用滑动窗口自适应阈值技术设定阈值,滑动窗口自适应阈值技术是把每个流量子序列的异常得分排列成一维序列


S45、将滑动窗口内的综合异常得分与阈值做比较,综合异常得分大于阈值的判定为异常流量子序列,连续的异常流量子序列组成异常流量序列;S45 , comparing the comprehensive abnormality score in the sliding window with the threshold value, and determining that the comprehensive abnormality score is greater than the threshold value is an abnormal flow subsequence, and the continuous abnormal flow subsequence constitutes an abnormal flow sequence;
如图5所示,初步异常筛检后,共检测出6个异常得分超过阈值的子流量序列A、B、C、D、E、F,这6个子序流量列共组成5个异常流量序列,其中,A、B、E、F子流量序列分别成为一个异常流量序列,C、D这2个连续子序列组成一个异常流量序列。由此可见,每个异常流量序列的大小不定,可能只有1个子流量序列构成,也可能由多个连续的子流量序列组成。As shown in Figure 5, after the initial anomaly screening, a total of 6 sub-flow sequences A, B, C, D, E, and F with anomaly scores exceeding the threshold were detected. These 6 sub-sequence traffic sequences constitute 5 abnormal traffic sequences. , where the sub-traffic sequences A, B, E, and F respectively become an abnormal traffic sequence, and the two consecutive sub-sequences C and D form an abnormal traffic sequence. It can be seen that the size of each abnormal traffic sequence is indeterminate, and it may be composed of only one sub-traffic sequence, or it may be composed of multiple consecutive sub-traffic sequences.
S46、利用滑动窗口划分时序子流量序列进行异常检测的方法,可使每条流量样本出现在多个子流量序列中并被多次检测,这有助于发现细微异常。但对于一些由噪声引起的偏差经过多次叠加放大,也可能被判别为异常,因此滑动窗口划分流量的方法虽然可以提高异常流量的召回率,但也可能带来较高的误报率,因此需要对初步筛检到的异常结果进行取舍,根据自适应异常修剪方法对异常流量进行异常裁剪减少误报,最终得到异常数据;S46. The method of using a sliding window to divide time series sub-traffic sequences for abnormality detection enables each traffic sample to appear in multiple sub-traffic sequences and be detected multiple times, which is helpful for finding subtle abnormalities. However, some deviations caused by noise may be judged to be abnormal after repeated superposition and amplification. Therefore, although the method of dividing traffic by sliding window can improve the recall rate of abnormal traffic, it may also bring a higher false alarm rate. Therefore, It is necessary to choose and choose the abnormal results detected initially. According to the adaptive abnormal pruning method, abnormal traffic is pruned to reduce false positives, and finally abnormal data is obtained;
步骤S46具体包含以下步骤:Step S46 specifically includes the following steps:
(1)提取各异常序列中子序列异常得分最大的值


(2)将验证集数据输入训练好的SA-GAN模型中,利用超参数搜索方法使验证集异常检测性能指标F1值达到最大时的裁剪速率阈值p;(2) Input the validation set data into the trained SA-GAN model, and use the hyperparameter search method to make the cropping rate threshold p when the F1 value of the validation set anomaly detection performance index reaches the maximum;
(3)将pi与设定的裁剪速率阈值p进行比较,当第一个没有超过阈值p的pi出现时,将它及其后续的最大异常得分
图6(a)为各序列中最大异常得分降序排列后的情况,图6(b)为最大异常得分下降速率的情况。从图6(b)中可以看出,速率超过裁剪阈值的有A和C共2个序列,但是由于B序列的异常得分下降速率已经降到阈值以下,因此B以及其后的所有序列(包括C序列)均重新划归为正常。这种方法可直观地理解为异常值大且变化剧烈的序列是真正异常的可能性较大;而对于异常值较大但变化平缓的,可能是由于存在新的未被学习过的正常数据,导致模型不能很好地拟合,从而给出较大的异常得分,对于这种情况在异常裁剪时可以被重新划归为正常。Fig. 6(a) shows the descending order of the maximum anomaly scores in each sequence, and Fig. 6(b) shows the decreasing rate of the maximum anomaly scores. As can be seen from Figure 6(b), there are 2 sequences A and C whose rate exceeds the clipping threshold, but since the rate of drop in abnormal score of sequence B has dropped below the threshold, B and all subsequent sequences (including C sequence) were reclassified as normal. This method can be intuitively understood that the sequence with large outliers and drastic changes is more likely to be truly abnormal; for large outliers but gentle changes, it may be due to the existence of new normal data that has not been learned. As a result, the model does not fit well, giving a large anomaly score, which can be reclassified as normal when the anomaly is clipped.
下面进行实验与结果分析The following experiments and results analysis
(1)数据集设计(1) Data set design
为了评判SA-GAN的性能,本发明在多个时间序列数据集上进行了评估测试,本发明使用了包括网络流量数据集NSL-KDD,UNSW-NB15以及CICIDS-2017在内的4个公开网络异常流量检测数据集;NASA提供的航天器遥测信号数据,包括火星科学实验室(MSL)和土壤水分湿度监测数据集(SMAP);还有Numenta异常检测基准(NAB)中的3个数据集TRAF、TWEETS和AWS,如下表2所示。In order to judge the performance of SA-GAN, the present invention conducts evaluation tests on multiple time series datasets. The present invention uses 4 public networks including network traffic datasets NSL-KDD, UNSW-NB15 and CICIDS-2017 Anomaly flow detection dataset; spacecraft telemetry signal data provided by NASA, including Mars Science Laboratory (MSL) and Soil Moisture Monitoring dataset (SMAP); and 3 datasets TRAF in the Numenta Anomaly Detection Benchmark (NAB) , TWEETS, and AWS, as shown in Table 2 below.
表2时间序列数据集Table 2 Time series dataset


表2汇总了每个数据集的基本信息,包括样本总体数量和异常样本数量,流量中的特征数及引起异常攻击的种类数,由于每个数据集都各有特点,使我们的异常检测工作更具挑战性,同时也帮助我们确认模型的有效性和局限性。Table 2 summarizes the basic information of each data set, including the overall number of samples and the number of abnormal samples, the number of features in the traffic and the number of types of abnormal attacks. Since each data set has its own characteristics, our anomaly detection work more challenging, while also helping us confirm the validity and limitations of the model.
(2)实验设置(2) Experimental setup
1、数据准备1. Data preparation
对于每个时间序列数据集,首先按照本发明数据设计的方法进行规范化处理。随机抽取正常状态数据的60%作为训练集,剩余的正常数据以及异常数据各随机抽取一半,分别作为验证集和测试集,设置滑动窗口大小=256,步长=2对各数据集进行划分,以获得TA-GAN的输入流量样本。For each time series data set, normalization is first performed according to the data design method of the present invention. 60% of the normal state data is randomly selected as the training set, and half of the remaining normal data and abnormal data are randomly selected as the validation set and test set, respectively. to obtain input flow samples for TA-GAN.
2、网络结构2. Network structure
本发明实验中,输入到SA-GAN模型的时间序列长度为256,生成器G1和G2采用LSTM结构,输入层神经元个数为256,G1隐藏单元为128,G2的隐藏单元为64,判别器C1和C2也采用LSTM结构,并在最后添加了全连接的分类层,Batch_size为256,Max epoch为2000,学习率rate为0.0001。In the experiment of the present invention, the length of the time series input to the SA-GAN model is 256, the generators G1 and G2 adopt the LSTM structure, the number of neurons in the input layer is 256, the hidden units of G1 are 128, and the hidden units of G2 are 64. Devices C1 and C2 also adopt the LSTM structure, and add a fully connected classification layer at the end, the Batch_size is 256, the Max epoch is 2000, and the learning rate is 0.0001.
3、评估指标3. Evaluation indicators
在实际网络场景中,单纯的点异常是很少出现且对网络性能的影响基本可以忽略,由攻击引起的异常是连续,因此本文主要针对连续的异常序列进行判断,并提出以下3个窗口规则:In actual network scenarios, simple point anomalies rarely occur and the impact on network performance can be ignored. Anomalies caused by attacks are continuous. Therefore, this paper mainly judges continuous anomaly sequences, and proposes the following three window rules. :
1)如果已知的异常窗口与任何预测窗口重叠,则记为TP。1) If the known anomaly window overlaps with any prediction window, it is recorded as TP.
2)如果已知的异常窗口不与任何预测窗口重叠,则记为FN。2) If the known anomaly window does not overlap with any prediction window, it is denoted as FN.
3)如果预测窗口不与任何已知的异常区域重叠,则记为FP。3) If the prediction window does not overlap any known anomalous region, it is recorded as FP.
本发明使用Precision、Recall和F1值等指标来衡量检测方法的性能,其数学表达式如下式所示:The present invention uses indicators such as Precision, Recall and F1 value to measure the performance of the detection method, and its mathematical expression is shown in the following formula:

其中,Precision为检测的精确率,表示计算检测到异常序列中有多少是真正的异常,Recall为召回率,表示在原始实际序列的异常有多少样本被正确的识别出来,F1值为精确率和召回率的调和平均数,兼顾模型的精确率和召回率。Among them, Precision is the precision rate of detection, which means how many of the detected abnormal sequences are real anomalies, and Recall is the recall rate, which means how many samples of anomalies in the original actual sequence are correctly identified, and F1 is the precision rate and The harmonic mean of recall, taking into account the precision and recall of the model.
4、对比模型4. Comparing models
为验证SA-GAN模型检测的有效性,选取MAD-GAN算法和DAGMM算法2种典型的基于重构的异常检测方法作为对比。MAD-GAN利用普通的GAN结构在潜在空间中以最优的搜索策略来支持多元时间序列重建,利用重构误差和判别误差作为目标函数进行训练和检测。DAGMM利用深度自编码压缩网络得到输入的低维表示,并将这个低维表示,与输入和重构输出的重构误差拼接作为估计网络的输入,该算法将降维过程和密度估计过程进行联合训练,最终在高斯混合模型(GMM)的框架中预测它们的似然。In order to verify the validity of SA-GAN model detection, two typical reconstruction-based anomaly detection methods, MAD-GAN algorithm and DAGMM algorithm, are selected as comparisons. MAD-GAN utilizes common GAN structure to support multivariate time series reconstruction with an optimal search strategy in latent space, and uses reconstruction error and discriminant error as objective functions for training and detection. DAGMM uses a deep self-encoding compression network to obtain a low-dimensional representation of the input, and concatenates this low-dimensional representation with the reconstruction error of the input and reconstructed output as the input of the estimation network. The algorithm combines the dimensionality reduction process and the density estimation process. train and finally predict their likelihoods in the framework of Gaussian Mixture Models (GMM).
(3)异常检测结果(3) Abnormal detection results
对比MAD-GAN、DAGMM和SA-GAN模型在公开数据集上的检测性能,其中DAGMM利用带有类注意力机制自编码网络,将输入样本的关键信息映射到一个低维空间,再将降维过程和密度估计过程结合在一起训练,并利重构误差判断原输入样本中是否存在异常。MAD-GAN是两样是利用循环神经网络作为生成器,捕获数据中的时间相关性,并利用生成误差和判别误差作为评判异常的依据,不同于SA-GAN的是MAD-GAN没有注意力机制,只是利用的循环神经网络来发发掘数据中的特征相关性,各模型在测试数据集的表现结果如下表3所示。Comparing the detection performance of MAD-GAN, DAGMM and SA-GAN models on public datasets, DAGMM uses an auto-encoding network with a class attention mechanism to map the key information of the input samples to a low-dimensional space, and then reduces the dimensionality. The process and the density estimation process are trained together, and the reconstruction error is used to judge whether there is an abnormality in the original input sample. MAD-GAN is the same as using a recurrent neural network as a generator to capture the temporal correlation in the data, and use the generation error and discrimination error as the basis for judging anomalies. Unlike SA-GAN, MAD-GAN has no attention mechanism. Only the recurrent neural network is used to discover the feature correlation in the data. The performance results of each model in the test data set are shown in Table 3 below.
表3各异常检测模型性能比较Table 3 Performance comparison of each anomaly detection model


图7为三个模型在各数据集上的F1得分,通过图7可以看出,SA-GAN在7个数据集的检测性能均表现良好,且在KDD99、SMAP、MSL这3个数据集上的精确率、召回率及F1值均为最高,并且在6个数据集上的总评性能最好。MAD-GAN在4个数据集上的F1值总评最低,可能是由于MAD-GAN本来是为时间序列设计的异常检测模型,不太适合捕捉的时间序列异常特征,并且MAD-GAN单生成对抗网络结构,相比具有双生成对抗网络结构的SA-GAN模型,异常检测性能更差;DAGMM在总体性能优于MAD-GAN但弱于本发明的SA-GAN检测方法,说明SA-GAN不仅具有出色的检测性能,尤其是在SMAP和MSL上的异常检测准确率接近90%,能为设备运维和诊断工作提供非常有益的信息支持。SA-GAN整体的优异表现也说明,它对于未知异构的状态序列数据也具有较强的适用性和泛化能力。Figure 7 shows the F1 scores of the three models on each data set. From Figure 7, it can be seen that SA-GAN performed well in the detection performance of the seven data sets, and on the three data sets of KDD99, SMAP, and MSL The precision rate, recall rate and F1 value are the highest, and the overall evaluation performance on the 6 datasets is the best. MAD-GAN has the lowest overall rating of F1 on the 4 datasets, probably because MAD-GAN was originally an anomaly detection model designed for time series, which is not suitable for capturing abnormal features of time series, and MAD-GAN is a single generative adversarial network. Compared with the SA-GAN model with dual generative adversarial network structure, the anomaly detection performance is worse; DAGMM is better than MAD-GAN in overall performance but weaker than the SA-GAN detection method of the present invention, indicating that SA-GAN not only has excellent performance The detection performance, especially the anomaly detection accuracy rate on SMAP and MSL is close to 90%, which can provide very useful information support for equipment operation and maintenance and diagnosis. The overall excellent performance of SA-GAN also shows that it also has strong applicability and generalization ability for unknown heterogeneous state sequence data.
综上所述,本发明实施例提供的基于SA-GAN架构的时间序列异常检测方法,在GAN中引入注意力机制,使判别器在完成正确判别同时,还可输出判别器为实现正确分类而重点关注的特征重要性图谱,该图谱可以指导生成器更高率的完成对原始流量样本的重构,这对生成网络的约束使模型更加鲁棒有利于减少过拟合。使用对抗损失和CycleConsistency Loss训练G1和G2两个生成器,有利于快速收敛。使用Wasserstein距离作为模型拟合分布与输入样本数据真实分布的差异性度量,可有效避免传统方法利用f散度训练时存在的″梯度失稳″和″模式崩溃″风险;利用滑动窗口将时间序列划分为多个子序列,有利于发现序列中上下文异常;使用滑动窗口自适应的阈值设定方法,有助于提升异常序列的召回率;使用″去缓″的裁剪技术,对异常得分变化小的时间子序列做″纠正″处理,提升了异常判定的准确率。而且通过对比SA-GAN、DAGMM和MAD-GAN这3种异常检测模型在KDD99、NSL-KDD、SMAP、MSL、TRAF、TWEETS和AWS这7个时间序列数据集上的异常检测性能可知,基于SA-GAN的时间序列异常检测模型能够提供稳定的梯度信息,有着较强的稳定性和健壮性、对各种状态序列数据有较强的泛化能力,对数据中异常检测性能较其它基于重构的检测方法有明显的提升。In summary, the time series anomaly detection method based on the SA-GAN architecture provided by the embodiment of the present invention introduces an attention mechanism into the GAN, so that the discriminator can complete the correct discrimination and can also output the discriminator to achieve correct classification. Focus on the feature importance map, which can guide the generator to complete the reconstruction of the original traffic samples at a higher rate. This constraint on the generator network makes the model more robust and helps reduce overfitting. Two generators, G1 and G2, are trained using adversarial loss and CycleConsistency Loss, which is conducive to fast convergence. Using the Wasserstein distance as a measure of the difference between the model fitting distribution and the real distribution of the input sample data can effectively avoid the risks of "gradient instability" and "mode collapse" existing in traditional methods using f-divergence training. Dividing into multiple sub-sequences is conducive to discovering contextual anomalies in the sequence; using the sliding window adaptive threshold setting method can help to improve the recall rate of abnormal sequences; using the "de-buffering" clipping technology, the abnormal score changes little The time subsequence is "corrected" to improve the accuracy of abnormal judgment. And by comparing the anomaly detection performances of SA-GAN, DAGMM and MAD-GAN on seven time series datasets KDD99, NSL-KDD, SMAP, MSL, TRAF, TWEETS and AWS, we can see that based on SA -GAN's time series anomaly detection model can provide stable gradient information, has strong stability and robustness, and has strong generalization ability for various state sequence data. The detection method has been significantly improved.
尽管已经示出和描述了本发明的实施例,本领域的普通技术人员可以理解:在不脱离本发明的原理和宗旨的情况下可以对这些实施例进行多种变化、修改、替换和变型,本发明的范围由权利要求及其等同物限定。Although embodiments of the present invention have been shown and described, it will be understood by those of ordinary skill in the art that various changes, modifications, substitutions and alterations can be made in these embodiments without departing from the principles and spirit of the invention, The scope of the invention is defined by the claims and their equivalents.
Claims (6)
Translated fromChinese


Priority Applications (1)
| Application Number | Priority Date | Filing Date | Title |
|---|---|---|---|
| CN202210819480.9ACN115185937A (en) | 2022-07-12 | 2022-07-12 | SA-GAN architecture-based time sequence anomaly detection method |
Applications Claiming Priority (1)
| Application Number | Priority Date | Filing Date | Title |
|---|---|---|---|
| CN202210819480.9ACN115185937A (en) | 2022-07-12 | 2022-07-12 | SA-GAN architecture-based time sequence anomaly detection method |
Publications (1)
| Publication Number | Publication Date |
|---|---|
| CN115185937Atrue CN115185937A (en) | 2022-10-14 |
Family
ID=83519554
Family Applications (1)
| Application Number | Title | Priority Date | Filing Date |
|---|---|---|---|
| CN202210819480.9APendingCN115185937A (en) | 2022-07-12 | 2022-07-12 | SA-GAN architecture-based time sequence anomaly detection method |
Country Status (1)
| Country | Link |
|---|---|
| CN (1) | CN115185937A (en) |
Cited By (10)
| Publication number | Priority date | Publication date | Assignee | Title |
|---|---|---|---|---|
| CN115600116A (en)* | 2022-12-15 | 2023-01-13 | 西南石油大学(Cn) | Dynamic detection method, system, storage medium and terminal for time series anomalies |
| CN115733673A (en)* | 2022-11-04 | 2023-03-03 | 中国人民解放军海军工程大学 | A Data Anomaly Detection Method Based on Multi-Scale Residual Classifier |
| CN116304884A (en)* | 2023-05-11 | 2023-06-23 | 西安衍舆航天科技有限公司 | Spacecraft telemetry data health prediction method, system, equipment and storage medium |
| CN116992380A (en)* | 2023-07-18 | 2023-11-03 | 重庆工商大学 | Satellite multi-dimensional telemetry sequence anomaly detection model construction method and device, anomaly detection method and device |
| CN117195144A (en)* | 2023-08-11 | 2023-12-08 | 浙江昕越数字科技有限公司 | Multi-mode time sequence outlier detection method and device fusing AAE and GAN |
| CN117671560A (en)* | 2023-11-29 | 2024-03-08 | 中国移动紫金(江苏)创新研究院有限公司 | Video abnormal event detection method, device, equipment and storage medium |
| CN118885790A (en)* | 2024-07-08 | 2024-11-01 | 杭州电子科技大学 | A non-invasive abnormal current detection method |
| CN119807970A (en)* | 2025-01-03 | 2025-04-11 | 湖南大学 | Anomaly detection method for water pipeline operation status based on joint reconstruction and prediction model |
| CN120579050A (en)* | 2025-08-05 | 2025-09-02 | 成都博智云创科技有限公司 | A federated double-regularization multi-error fusion time series anomaly detection method |
| CN120579050B (en)* | 2025-08-05 | 2025-10-17 | 成都博智云创科技有限公司 | Federal double regularization multi-error fusion time sequence anomaly detection method |
- 2022
- 2022-07-12CNCN202210819480.9Apatent/CN115185937A/enactivePending
Cited By (11)
| Publication number | Priority date | Publication date | Assignee | Title |
|---|---|---|---|---|
| CN115733673A (en)* | 2022-11-04 | 2023-03-03 | 中国人民解放军海军工程大学 | A Data Anomaly Detection Method Based on Multi-Scale Residual Classifier |
| CN115733673B (en)* | 2022-11-04 | 2024-04-12 | 中国人民解放军海军工程大学 | A data anomaly detection method based on multi-scale residual classifier |
| CN115600116A (en)* | 2022-12-15 | 2023-01-13 | 西南石油大学(Cn) | Dynamic detection method, system, storage medium and terminal for time series anomalies |
| CN116304884A (en)* | 2023-05-11 | 2023-06-23 | 西安衍舆航天科技有限公司 | Spacecraft telemetry data health prediction method, system, equipment and storage medium |
| CN116992380A (en)* | 2023-07-18 | 2023-11-03 | 重庆工商大学 | Satellite multi-dimensional telemetry sequence anomaly detection model construction method and device, anomaly detection method and device |
| CN117195144A (en)* | 2023-08-11 | 2023-12-08 | 浙江昕越数字科技有限公司 | Multi-mode time sequence outlier detection method and device fusing AAE and GAN |
| CN117671560A (en)* | 2023-11-29 | 2024-03-08 | 中国移动紫金(江苏)创新研究院有限公司 | Video abnormal event detection method, device, equipment and storage medium |
| CN118885790A (en)* | 2024-07-08 | 2024-11-01 | 杭州电子科技大学 | A non-invasive abnormal current detection method |
| CN119807970A (en)* | 2025-01-03 | 2025-04-11 | 湖南大学 | Anomaly detection method for water pipeline operation status based on joint reconstruction and prediction model |
| CN120579050A (en)* | 2025-08-05 | 2025-09-02 | 成都博智云创科技有限公司 | A federated double-regularization multi-error fusion time series anomaly detection method |
| CN120579050B (en)* | 2025-08-05 | 2025-10-17 | 成都博智云创科技有限公司 | Federal double regularization multi-error fusion time sequence anomaly detection method |
Similar Documents
| Publication | Publication Date | Title |
|---|---|---|
| CN115185937A (en) | SA-GAN architecture-based time sequence anomaly detection method | |
| CN117290800B (en) | Timing sequence anomaly detection method and system based on hypergraph attention network | |
| CN109000930B (en) | Turbine engine performance degradation evaluation method based on stacking denoising autoencoder | |
| CN116522265A (en) | Industrial Internet time sequence data anomaly detection method and device | |
| CN117056874B (en) | Unsupervised electricity larceny detection method based on deep twin autoregressive network | |
| CN112668775A (en) | Air quality prediction method based on time sequence convolution network algorithm | |
| CN117009900A (en) | Internet of things signal anomaly detection method and system based on graph neural network | |
| CN118152355A (en) | Log acquisition management method and system | |
| CN119089367B (en) | Intelligent temperature-controlled lead-free tin bar production method and device | |
| CN118624851A (en) | Water quality monitoring method, device, equipment and storage medium based on multi-dimensional parameters | |
| CN119179919B (en) | An online monitoring and diagnosis system for hydropower equipment | |
| CN116050621A (en) | A multi-head self-attention offshore wind power ultra-short-term power prediction method with integrated lifting mode | |
| CN118411589A (en) | A method and device for detecting anomalies in semiconductor wafer manufacturing based on spatiotemporal graph neural network | |
| CN118643467A (en) | Daily runoff prediction method based on multi-feature fusion and two-dimensional temporal convolutional network | |
| CN118171167A (en) | Early warning method and system for bearing capacity of uplift pile | |
| CN117454266A (en) | A multivariate time series anomaly detection model | |
| CN118883065A (en) | A bearing early abnormality detection method based on Transformer model | |
| CN118297414A (en) | Mine water hazard forecasting electronic equipment and computer program product | |
| Bashar et al. | Algan: Time series anomaly detection with adjusted-lstm gan | |
| CN120145009A (en) | Industrial data quality assessment method, medium and system based on microservices | |
| CN119782772A (en) | A deep learning-based avalanche monitoring and early warning method | |
| CN118798446B (en) | A method and system for predicting heat load on primary side of thermal power station | |
| CN118861950B (en) | Transformer multi-parameter fusion state evaluation method, device, equipment and medium | |
| CN119669685A (en) | Once-through steam engine generator pipe temperature prediction method and system | |
| CN119312955A (en) | A method for power load forecasting based on relational enhanced supervised learning |
Legal Events
| Date | Code | Title | Description |
|---|---|---|---|
| PB01 | Publication | ||
| PB01 | Publication | ||
| SE01 | Entry into force of request for substantive examination | ||
| SE01 | Entry into force of request for substantive examination | ||
| CB03 | Change of inventor or designer information | ||
| CB03 | Change of inventor or designer information | Inventor after:Fu Yu Inventor after:Duan Xueyuan Inventor after:Wang Kun Inventor after:Li Bin Inventor before:Fu Yu Inventor before:Wang Kun Inventor before:Duan Xueyuan Inventor before:Li Bin |