CN115105089A - An electrocardiogram analysis method, analysis device and storage medium - Google Patents
An electrocardiogram analysis method, analysis device and storage mediumDownload PDFInfo
- Publication number
- CN115105089A CN115105089ACN202110285708.6ACN202110285708ACN115105089ACN 115105089 ACN115105089 ACN 115105089ACN 202110285708 ACN202110285708 ACN 202110285708ACN 115105089 ACN115105089 ACN 115105089A
- Authority
- CN
- China
- Prior art keywords
- interval
- wave
- graph
- trend
- ratio
- Prior art date
- Legal status (The legal status is an assumption and is not a legal conclusion. Google has not performed a legal analysis and makes no representation as to the accuracy of the status listed.)
- Pending
Links
Images


Landscapes
- Measurement And Recording Of Electrical Phenomena And Electrical Characteristics Of The Living Body (AREA)
Abstract
Description
Translated fromChinese技术领域technical field
本申请涉及心电图分析技术领域,特别是一种心电图分析方法、分析装置以及存储介质。The present application relates to the technical field of electrocardiogram analysis, in particular to an electrocardiogram analysis method, an analysis device and a storage medium.
背景技术Background technique
心电图(ECG)是利用心电图机从体表记录心脏每一心动周期所产生的电活动变化图形的技术。随着对健康的追求以及科技的不断发展,动态心电图检查,作为一种在患者日常生活中连续记录24小时或更长时间的心电活动的检查,并辅助计算机进行分析处理的新技术,越来越受到欢迎。较之普通心电图,动态心电图在24小时内可连续记录多达10万次左右的心动周期,这样,可以发现常规体表心电检查不易发现的心律失常和心肌缺血等,能够提高对非持续性心律失常,尤其是对一过性心律失常及短暂的心肌缺血发作的检出率,很好地扩大了心电图临床运用的范围。An electrocardiogram (ECG) is a technique that uses an electrocardiograph to record from the surface of the body the pattern of changes in electrical activity produced by the heart during each cardiac cycle. With the pursuit of health and the continuous development of science and technology, dynamic electrocardiography, as a new technology that continuously records the cardiac electrical activity of patients for 24 hours or more in daily life, and assists the computer for analysis and processing, has become more and more increasingly popular. Compared with ordinary ECG, Holter monitor can record up to 100,000 cardiac cycles continuously in 24 hours. In this way, arrhythmia and myocardial ischemia that are not easily detected by routine surface ECG can be found, which can improve the diagnosis and treatment of non-sustained ECG. The detection rate of arrhythmia, especially transient arrhythmia and transient myocardial ischemic attack, has greatly expanded the scope of clinical application of ECG.
由于动态心电图是受试者在日常生活中采集的信号,加之动态心电图采样设备的采样率相对较低,因此采集到的信号中,p波较不明显,这导致操作者在进行动态心电图分析的时候,无法简单快速的识别出病例的节律是否紊乱、传导是否正常。Since the Holter is the signal collected by the subjects in daily life, and the sampling rate of the Holter sampling equipment is relatively low, the P wave is less obvious in the collected signal, which leads the operator to perform Holter analysis. At this time, it is impossible to easily and quickly identify whether the rhythm of the case is disordered and whether the conduction is normal.
发明内容SUMMARY OF THE INVENTION
为解决上述问题,本申请提供了一种心电图分析方法、分析装置以及存储介质,能够将P波参数图形/图表化,便于观察,提高心电图分析效率。In order to solve the above problems, the present application provides an electrocardiogram analysis method, an analysis device and a storage medium, which can graph/chartize P wave parameters, facilitate observation, and improve the efficiency of electrocardiogram analysis.
本申请采用的一个技术方案是:提供一种心电图分析方法,该方法包括:获取心电图中心动周期的P波参数;根据P波参数建立可视化图形/图表;其中,可视化图形/图表包括P波参数趋势图、P波参数散点图、P波与QRS波关系图和P波下传情况分布图中的至少一个;显示可视化图形/图表中的至少一个。A technical solution adopted in the present application is to provide an electrocardiogram analysis method, the method comprising: acquiring P wave parameters of a cardiac cycle in an electrocardiogram; establishing a visual graph/chart according to the P wave parameter; wherein, the visual graph/chart includes the P wave parameter At least one of a trend graph, a scatter plot of P wave parameters, a graph of the relationship between P wave and QRS wave, and a distribution graph of P wave downlink; display at least one of a visual graph/chart.
其中,P波参数包括P波时限、P波幅度、P波形态、PR间期、RP间期、PP间期、PP间期差、P波与QRS波关系、P波下传情况中的至少一个。Among them, P wave parameters include P wave duration, P wave amplitude, P wave shape, PR interval, RP interval, PP interval, PP interval difference, the relationship between P wave and QRS wave, and at least one of P wave down-pass conditions. One.
其中,P波参数趋势图包括PP间期趋势图、PR间期趋势图、RP间期趋势图、PP间期RR间期趋势对比图、PP间期/RR间期比值趋势图、RR间期/PP间期比值趋势图、P波时限趋势图、P波形态趋势图、P波幅度趋势图中的至少一个;PP间期趋势图表示PP间期与时间的关系;PR间期趋势图表示PR间期与时间的关系;RP间期趋势图表示RP间期与时间的关系;PP间期RR间期趋势对比图表示PP间期和RR间期分别与时间关系的对比;PP间期/RR间期比值趋势图表示PP间期/RR间期比值与时间的关系;RR间期/PP间期比值趋势图表示RR间期/PP间期比值与时间的关系;P波时限趋势图表示P波时限与时间的关系;P波形态趋势图表示P波形态与时间的关系;P波幅度趋势图表示P波幅度与时间的关系。Among them, the trend graph of P wave parameters includes PP interval trend graph, PR interval trend graph, RP interval trend graph, PP interval RR interval trend comparison graph, PP interval/RR interval ratio trend graph, RR interval graph /PP interval ratio trend graph, P wave time limit trend graph, P wave shape trend graph, P wave amplitude trend graph; PP interval trend graph represents the relationship between PP interval and time; PR interval trend graph represents The relationship between PR interval and time; RP interval trend graph shows the relationship between RP interval and time; PP interval RR interval trend comparison graph shows the comparison of PP interval and RR interval with time respectively; PP interval/ The RR interval ratio trend graph represents the relationship between the PP interval/RR interval ratio and time; the RR interval/PP interval ratio trend graph represents the relationship between the RR interval/PP interval ratio and time; the P wave time limit trend graph represents The relationship between the P wave duration and time; the P wave shape trend diagram shows the relationship between the P wave shape and time; the P wave amplitude trend diagram shows the relationship between the P wave amplitude and time.
其中,P波参数散点图包括PP间期/RR间期比值散点图、RR间期/PP间期比值散点图、PP间期散点图、PP间期差值散点图、PR间期散点图、RP间期散点图中的至少一个;PP间期/RR间期比值散点图表示相邻两个心动周期的PP间期/RR间期比值的关系;RR间期/PP间期比值散点图表示相邻两个心动周期的RR间期/PP间期比值的关系;PP间期散点图表示相邻两个心动周期的PP间期的关系;PP间期差值散点图表示目标心动周期的PP间期与前一心动周期的PP间期的差值,目标心动周期的PP间期与后一心动周期的PP间期的差值,之间的关系;PR间期散点图表示相邻两个心动周期的PR间期的关系;RP间期散点图表示相邻两个心动周期的RP间期的关系。Among them, the scatter plot of P wave parameters includes PP interval/RR interval ratio scatter plot, RR interval/PP interval ratio scatter plot, PP interval scatter plot, PP interval difference scatter plot, PR At least one of interval scattergram and RP interval scattergram; PP interval/RR interval ratio scattergram represents the relationship between the PP interval/RR interval ratio of two adjacent cardiac cycles; RR interval /PP interval ratio scatter plot represents the relationship between the RR interval/PP interval ratio of two adjacent cardiac cycles; PP interval scatter plot represents the relationship between the PP intervals of two adjacent cardiac cycles; PP interval The difference scatter plot shows the relationship between the difference between the PP interval of the target cardiac cycle and the PP interval of the previous cardiac cycle, and the difference between the PP interval of the target cardiac cycle and the PP interval of the following cardiac cycle. ; The PR interval scatter diagram represents the relationship between the PR intervals of two adjacent cardiac cycles; the RP interval scatter diagram represents the relationship between the RP intervals of the adjacent two cardiac cycles.
其中,方法还包括:在获取到基于可视化图形/图表中至少部分区域的切换指令时,显示至少部分区域中的可视化图形/图表对应的可视化图表/图形。Wherein, the method further includes: when a switching instruction based on at least part of the area in the visualized graph/chart is acquired, displaying a visualized graph/graph corresponding to the visualized graph/graph in at least part of the area.
本申请采用的一个技术方案是:提供一种心电图分析方法,该方法包括:获取心电图中心动周期的P波参数;根据P波参数建立可视化图形/图表;其中,可视化图形/图表包括两个间期的趋势对比图、两个间期的比值趋势图、两个间期的比值散点图、一个间期的趋势图和一个间期的散点图中的至少一个;显示可视化图形/图表中的至少一个。A technical solution adopted in the present application is to provide an electrocardiogram analysis method, the method comprising: acquiring P wave parameters of the cardiac cycle in the electrocardiogram; establishing a visual graph/chart according to the P wave parameter; wherein, the visual graph/chart includes two intervals At least one of a trend comparison chart over a period of time, a ratio trend chart over two intervals, a ratio scatter plot over two intervals, a trend chart over an interval, and a scatter plot over one interval; displayed in the visualization/chart at least one of.
其中,两个间期的趋势对比图包括PP间期RR间期趋势对比图;其中,PP间期RR间期趋势对比图表示PP间期和RR间期分别与时间关系的对比;或两个间期的比值趋势图包括PP间期/RR间期比值趋势图和RR间期/PP间期比值趋势图中的至少一个;其中,PP间期/RR间期比值趋势图表示PP间期/RR间期比值与时间的关系,RR间期/PP间期比值趋势图表示RR间期/PP间期比值与时间的关系;或两个间期的比值散点图包括PP间期/RR间期比值散点图和RR间期/PP间期比值散点图中的至少一个;其中,PP间期/RR间期比值散点图表示相邻两个心动周期的PP间期/RR间期比值的关系;RR间期/PP间期比值散点图表示相邻两个心动周期的RR间期/PP间期比值的关系;或一个间期的趋势图包括PR间期趋势图、RP间期趋势图和PP间期趋势图中的至少一个;PR间期趋势图表示PR间期与时间的关系,RP间期趋势图表示RP间期与时间的关系,PP间期趋势图表示PP间期与时间的关系;或一个间期的散点图包括PP间期散点图、PR间期散点图、RP间期散点图中的至少一个;其中,PP间期散点图表示相邻两个心动周期的PP间期的关系,PR间期散点图表示相邻两个心动周期的PR间期的关系,RP间期散点图表示相邻两个心动周期的RP间期的关系。Among them, the trend comparison chart of the two intervals includes the trend comparison chart of the PP interval and the RR interval; wherein, the trend comparison chart of the PP interval and the RR interval represents the comparison of the PP interval and the RR interval respectively and the time relationship; or two The ratio trend graph of the interval includes at least one of the PP interval/RR interval ratio trend graph and the RR interval/PP interval ratio trend graph; wherein, the PP interval/RR interval ratio trend graph represents the PP interval/ RR interval ratio versus time, RR interval/PP interval ratio trend graph showing RR interval/PP interval ratio versus time; or a scatter plot of the ratio of two intervals including PP interval/RR interval At least one of the interval ratio scattergram and the RR interval/PP interval ratio scattergram; wherein, the PP interval/RR interval ratio scattergram represents the PP interval/RR interval of two adjacent cardiac cycles The relationship between the ratios; the RR interval/PP interval ratio scatter plot represents the relationship between the RR interval/PP interval ratios of two adjacent cardiac cycles; or the trend graph of one interval includes the PR interval trend graph, RP interval At least one of the period trend graph and the PP interval trend graph; the PR interval trend graph represents the relationship between the PR interval and time, the RP interval trend graph represents the relationship between the RP interval and time, and the PP interval trend graph represents the relationship between the PP interval and the PP interval. The relationship between the period and time; or the scatter diagram of an interval includes at least one of the PP interval scatter diagram, the PR interval scatter diagram, and the RP interval scatter diagram; wherein, the PP interval scatter diagram represents the phase The relationship between the PP intervals of two adjacent cardiac cycles, the PR interval scatter diagram represents the relationship between the PR intervals of the adjacent two cardiac cycles, and the RP interval scatter diagram represents the relationship between the RP intervals of the adjacent two cardiac cycles. relation.
其中,PP间期RR间期趋势对比图的建立步骤包括:以时间为第一坐标、以PP间期为第二坐标,建立PP间期趋势图;以及以时间为第一坐标、以RR间期为第二坐标,建立RR间期趋势图;其中,PP间期趋势图和RR间期趋势图呈现于同一坐标系中,以形成PP间期RR间期趋势对比图。Wherein, the steps of establishing the PP interval RR interval trend comparison chart include: taking time as the first coordinate, taking the PP interval as the second coordinate, and establishing a PP interval trend graph; period is the second coordinate, and the RR interval trend graph is established; in which, the PP interval trend graph and the RR interval trend graph are presented in the same coordinate system to form the PP interval RR interval trend comparison graph.
其中,方法还包括:获取第一坐标上每一目标点对应的PP间期趋势图的第一特征值、和对应的RR间期趋势图的第二特征值;在第一特征值和第二特征值的差值大于设定阈值时,对目标点对应的区域按照预设显示方式进行显示。Wherein, the method further includes: acquiring the first eigenvalue of the PP interval trend graph corresponding to each target point on the first coordinate, and the second eigenvalue of the corresponding RR interval trend graph; When the difference of the characteristic values is greater than the set threshold, the area corresponding to the target point is displayed according to the preset display mode.
其中,方法还包括:获取对PP间期RR间期趋势对比图中任意一点选择得到的选择点;确定基于选择点且垂直于第一坐标的点选线;确定点选线对应的PP间期趋势图的第一特征值、和对应的RR间期趋势图的第二特征值,两者的差值;显示点选线对应的心动周期和差值。Wherein, the method further includes: obtaining a selection point obtained by selecting any point in the PP interval RR interval trend comparison chart; determining a selection line based on the selection point and perpendicular to the first coordinate; determining the PP interval corresponding to the selection line The first eigenvalue of the trend graph and the second eigenvalue of the corresponding RR interval trend graph, the difference between the two; the cardiac cycle and the difference corresponding to the clicked line are displayed.
其中,显示可视化图形/图表中的至少一个,包括:同屏显示可视化图形/图表中的至少两个;在获取到基于显示的至少两个图像中任意一目标图像的点击指令时,将目标图像放大并进行悬浮显示;或在获取到基于显示的至少两个图像中任意一目标图像的缩放指令时,对目标图像进行缩放;或在获取到基于显示的至少两个图像中任意一目标图像的替换指令时,将目标图像替换为未显示的图像。Wherein, displaying at least one of the visual graphs/charts includes: displaying at least two of the visual graphs/charts on the same screen; when a click instruction based on any one target image in the displayed at least two images is obtained, the target image Zoom in and display it in suspension; or when a zoom instruction based on any one of the displayed at least two images is obtained, the target image is zoomed; or when a zoom instruction based on any one of the displayed at least two images is obtained; When replacing an instruction, replace the target image with an image not displayed.
其中,方法还包括:获取对可视化图形/图表中任意一图像中任意一点拖动得到的选择区域;显示选择区域对应的多个心动周期或多个心动周期形成的叠加心动周期。Wherein, the method further includes: acquiring a selection area obtained by dragging any point in any image in the visualized graph/chart; and displaying multiple cardiac cycles or superimposed cardiac cycles formed by multiple cardiac cycles corresponding to the selected area.
其中,方法还包括:在获取到基于选择区域的标记指令时,弹出候选窗口,以在候选窗口中选择对应的标记事件,以对选择区域进行标记。Wherein, the method further includes: when a marking instruction based on the selection area is acquired, popping up a candidate window to select a corresponding marking event in the candidate window to mark the selection area.
其中,方法还包括:在获取到基于可视化图形/图表中至少部分区域的切换指令时,显示至少部分区域中的可视化图形/图表对应的可视化图表/图形。Wherein, the method further includes: when a switching instruction based on at least part of the area in the visualized graph/chart is acquired, displaying a visualized graph/graph corresponding to the visualized graph/graph in at least part of the area.
本申请采用的另一个技术方案是:提供一种心电图分析装置,该心电图分析装置包括处理器和存储器,存储器用于存储程序数据,处理器用于执行程序数据,以实现如上述的方法。Another technical solution adopted in the present application is to provide an electrocardiogram analysis device, the electrocardiogram analysis device includes a processor and a memory, the memory is used for storing program data, and the processor is used for executing the program data, so as to realize the above method.
本申请采用的另一个技术方案是:提供一种计算机可读存储介质,该计算机可读存储介质中存储有程序数据,程序数据在被处理器执行时,用以实现如上述的方法。Another technical solution adopted in the present application is to provide a computer-readable storage medium, where program data is stored in the computer-readable storage medium, and the program data is used to implement the above method when executed by a processor.
本申请提供的心电图分析方法包括:获取心电图中心动周期的P波参数;根据P波参数建立可视化图形/图表;其中,可视化图形/图表包括P波参数趋势图、P波参数散点图、P波与QRS波关系图和P波下传情况分布图中的至少一个;显示可视化图形/图表中的至少一个。通过上述方式,可以将P波参数进行图形化或图表化,以便用户可以方便的对P波参数进行观察,以进一步读取到心电图中的信息,提高了心电图的观察效率。The electrocardiogram analysis method provided by this application includes: acquiring P wave parameters of the cardiac cycle in the electrocardiogram; establishing a visual graph/chart according to the P wave parameter; wherein, the visual graph/chart includes a P wave parameter trend graph, a P wave parameter scatter plot, a P wave parameter At least one of a diagram of the relationship between the wave and QRS complex and a distribution diagram of P wave down-pass; display at least one of a visualization graph/chart. In the above manner, the P wave parameters can be graphed or charted, so that the user can conveniently observe the P wave parameters, so as to further read the information in the electrocardiogram, and improve the observation efficiency of the electrocardiogram.
附图说明Description of drawings
为了更清楚地说明本申请实施例中的技术方案,下面将对实施例描述中所需要使用的附图作简单地介绍,显而易见地,下面描述中的附图仅仅是本申请的一些实施例,对于本领域普通技术人员来讲,在不付出创造性劳动的前提下,还可以根据这些附图获得其他的附图。其中:In order to illustrate the technical solutions in the embodiments of the present application more clearly, the following briefly introduces the drawings that are used in the description of the embodiments. Obviously, the drawings in the following description are only some embodiments of the present application. For those of ordinary skill in the art, other drawings can also be obtained from these drawings without creative effort. in:
图1是本申请提供的心电图分析方法第一实施例的流程示意图;1 is a schematic flowchart of a first embodiment of an electrocardiogram analysis method provided by the present application;
图2是心电图中一个心动周期的示意图;Fig. 2 is a schematic diagram of a cardiac cycle in an electrocardiogram;
图3a是心电图显示界面的第一示意图;3a is a first schematic diagram of an electrocardiogram display interface;
图3b是心电图显示界面的第二示意图;Fig. 3b is the second schematic diagram of the electrocardiogram display interface;
图3c是心电图显示界面的第三示意图;3c is a third schematic diagram of an electrocardiogram display interface;
图4是本申请提供的心电图分析方法第二实施例的流程示意图;4 is a schematic flowchart of the second embodiment of the electrocardiogram analysis method provided by the present application;
图5a是PP间期散点图;Figure 5a is a scatter plot of the PP interval;
图5b是PR间期散点图;Figure 5b is a PR interval scatter plot;
图6是PP间期直方图;Figure 6 is a PP interval histogram;
图7是重叠心动周期示意图;7 is a schematic diagram of overlapping cardiac cycles;
图8是本申请提供的心电图分析方法第三实施例的流程示意图;8 is a schematic flowchart of a third embodiment of an electrocardiogram analysis method provided by the present application;
图9是PP间期RR间期趋势对比图;Fig. 9 is the trend comparison chart of RR interval in PP interval;
图10是PP间期/RR间期比值散点图;Figure 10 is a scatter plot of the PP interval/RR interval ratio;
图11是PR间期趋势图;Figure 11 is a PR interval trend chart;
图12是PP间期RR间期趋势对比图、PP间期/RR间期比值散点图和PR间期趋势图同屏显示示意图;Figure 12 is a schematic diagram of a PP interval RR interval trend comparison chart, a PP interval/RR interval ratio scatter plot and a PR interval trend chart displayed on the same screen;
图13是本申请提供的心电图分析装置一实施例的结构示意图;13 is a schematic structural diagram of an embodiment of an electrocardiogram analysis device provided by the present application;
图14是本申请提供的计算机可读存储介质一实施例的结构示意图。FIG. 14 is a schematic structural diagram of an embodiment of a computer-readable storage medium provided by the present application.
具体实施方式Detailed ways
下面将结合本申请实施例中的附图,对本申请实施例中的技术方案进行清楚、完整地描述。可以理解的是,此处所描述的具体实施例仅用于解释本申请,而非对本申请的限定。另外还需要说明的是,为了便于描述,附图中仅示出了与本申请相关的部分而非全部结构。基于本申请中的实施例,本领域普通技术人员在没有作出创造性劳动前提下所获得的所有其他实施例,都属于本申请保护的范围。The technical solutions in the embodiments of the present application will be clearly and completely described below with reference to the accompanying drawings in the embodiments of the present application. It should be understood that the specific embodiments described herein are only used to explain the present application, but not to limit the present application. In addition, it should be noted that, for the convenience of description, the drawings only show some but not all the structures related to the present application. Based on the embodiments in the present application, all other embodiments obtained by those of ordinary skill in the art without creative work fall within the protection scope of the present application.
本申请中的术语“第一”、“第二”等是用于区别不同对象,而不是用于描述特定顺序。此外,术语“包括”和“具有”以及它们任何变形,意图在于覆盖不排他的包含。例如包含了一系列步骤或单元的过程、方法、系统、产品或设备没有限定于已列出的步骤或单元,而是可选地还包括没有列出的步骤或单元,或可选地还包括对于这些过程、方法、产品或设备固有的其它步骤或单元。The terms "first", "second", etc. in this application are used to distinguish different objects, rather than to describe a specific order. Furthermore, the terms "comprising" and "having" and any variations thereof are intended to cover non-exclusive inclusion. For example, a process, method, system, product or device comprising a series of steps or units is not limited to the listed steps or units, but optionally also includes unlisted steps or units, or optionally also includes For other steps or units inherent to these processes, methods, products or devices.
在本文中提及“实施例”意味着,结合实施例描述的特定特征、结构或特性可以包含在本申请的至少一个实施例中。在说明书中的各个位置出现该短语并不一定均是指相同的实施例,也不是与其它实施例互斥的独立的或备选的实施例。本领域技术人员显式地和隐式地理解的是,本文所描述的实施例可以与其它实施例相结合。Reference herein to an "embodiment" means that a particular feature, structure, or characteristic described in connection with the embodiment can be included in at least one embodiment of the present application. The appearances of the phrase in various places in the specification are not necessarily all referring to the same embodiment, nor a separate or alternative embodiment that is mutually exclusive of other embodiments. It is explicitly and implicitly understood by those skilled in the art that the embodiments described herein may be combined with other embodiments.
参阅图1,图1是本申请提供的心电图分析方法第一实施例的流程示意图,该方法包括:Referring to FIG. 1, FIG. 1 is a schematic flowchart of the first embodiment of the electrocardiogram analysis method provided by the present application, and the method includes:
步骤11:获取心电图中心动周期的P波参数。Step 11: Obtain the P wave parameters of the cardiac cycle in the electrocardiogram.
如图2所示,图2是心电图中一个心动周期的示意图。其中,心电图的横坐标表示时间,心电图的纵坐标表示检测信号值(如电压值)(图2中未示出横纵坐标)。其中,心电图包括多个心动周期,每个心动周期表示一个心拍,图2示出了一个心动周期。具体地,一个心动周期主要包括PR间期和QT间期,QT间期又包括QRS间期和JT间期。As shown in FIG. 2, FIG. 2 is a schematic diagram of one cardiac cycle in an electrocardiogram. The abscissa of the electrocardiogram represents time, and the ordinate of the electrocardiogram represents a detected signal value (eg, a voltage value) (the abscissa and ordinate are not shown in FIG. 2 ). Wherein, the electrocardiogram includes a plurality of cardiac cycles, each cardiac cycle represents a cardiac beat, and FIG. 2 shows a cardiac cycle. Specifically, a cardiac cycle mainly includes the PR interval and the QT interval, and the QT interval includes the QRS interval and the JT interval.
可以理解地,心电图可以包括一段时间多个心动周期,在本实施例中,可以获取该一段时间的所有心动周期的P波参数,也可以获取该一段时间内部分心动周期的P波参数,其中,该部分心动周期应该是连续的。例如,在一实施例中,心电图包含24小时的心动周期,则可以获取其中全部24小时的心动周期的P波参数,以便后续的处理操作,也可以获取其中连续的12小时的心动周期的P波参数,以便后续的处理操作。It can be understood that the electrocardiogram may include a period of time and multiple cardiac cycles. In this embodiment, the P wave parameters of all cardiac cycles in the period of time can be acquired, and the P wave parameters of some cardiac cycles in the period of time can also be acquired, wherein , this part of the cardiac cycle should be continuous. For example, in one embodiment, the electrocardiogram includes a 24-hour cardiac cycle, and the P wave parameters of the entire 24-hour cardiac cycle may be obtained for subsequent processing operations, and the P wave parameters of the continuous 12-hour cardiac cycle may also be obtained. Wave parameters for subsequent processing operations.
P波是心房除极波,代表左右二心房的激动。由于窦房结位于右心房内膜下,所以激动首先传到右心房,较晚传到左心房。右心房的除极作用因此也比左心房略早完毕。临床上为了实用起见,P波的前部代表右心房的激动,后部代表左心房的激动。分析P波对心律失常的诊断与鉴别诊断具有重要意义。The P wave is the atrial depolarization wave, which represents the excitation of the left and right atria. Since the sinoatrial node is located under the right atrium, the excitation is first transmitted to the right atrium and later to the left atrium. The depolarization of the right atrium is therefore also completed slightly earlier than that of the left atrium. In clinical practice, the front part of the P wave represents the activation of the right atrium, and the rear part represents the activation of the left atrium. Analysis of P wave is of great significance for the diagnosis and differential diagnosis of arrhythmia.
其中,P波参数包括:P波时限、P波形态、P波幅值、P波与QRS波关系、P波下传情况中的至少一个,另外,P波参数还可以包括PR间期、RP间期、PP间期、PP间期差等。The P wave parameters include: at least one of the P wave duration, the P wave shape, the P wave amplitude, the relationship between the P wave and the QRS wave, and the P wave downlink situation. In addition, the P wave parameters may also include PR interval, RP interval, PP interval, PP interval difference, etc.
P波时限是指P波的起始时间和终止时间之间的时间段,P波幅值包括P波端的最大信号值、最小信号值或最大信号值与最小信号值的差值,P波与QRS波关系是指P波数量和QRS波数量的比例关系,P波下传情况是指P波后面是否有紧跟的QRS波。The P wave time limit refers to the time period between the start time and the end time of the P wave, and the P wave amplitude includes the maximum signal value, the minimum signal value, or the difference between the maximum signal value and the minimum signal value at the P wave end. The relationship between QRS complexes refers to the proportional relationship between the number of P waves and the number of QRS complexes, and the case of P wave downlink refers to whether there is a QRS complex following the P wave.
进一步,根据上述P波参数还可以确定P波形态,P波形态可以根据不同的分类方式进行分类,例如可以将P波分为直立P波、倒置P波、正负双向P波和负正双向P波。Further, according to the above P wave parameters, the shape of the P wave can also be determined, and the shape of the P wave can be classified according to different classification methods. P waves.
步骤12:根据P波参数,确定心动周期的P波类型。Step 12: Determine the P wave type of the cardiac cycle according to the P wave parameters.
可选地,在一实施例中,可以根据P波类型建立多个P波模板。Optionally, in an embodiment, multiple P-wave templates may be established according to P-wave types.
具体地,每一P波模板对应一个P波类型,每一P波模板根据P波参数,对相应P波类型的心动周期进行统计。Specifically, each P wave template corresponds to one P wave type, and each P wave template counts the cardiac cycle of the corresponding P wave type according to the P wave parameters.
例如,P波模板包括模板A、模板B和模板C,在对一个心动周期进行分类时,确定该心动周期的P波类型,然后归类到一个P波模板中,如与模板A的类型相同,则将该心动周期归类到模板A,模板A对该心动周期进行计数统计。For example, the P wave template includes template A, template B, and template C. When classifying a cardiac cycle, the P wave type of the cardiac cycle is determined, and then classified into a P wave template, such as the same type as template A. , the cardiac cycle is classified into template A, and template A counts the cardiac cycle.
具体地,每一个P波模板都对应至少一个参数阈值,参数阈值跟P波模板对应的P波类型相关,例如,该P波模板对应的P波类型为P波下传,那么该参数阈值主要用于检测P波后面是否有紧跟的QRS波。因此,每一P波模板判断目标心动周期的P波参数是否满足对应的参数阈值;若满足,则对目标心动周期进行统计。Specifically, each P wave template corresponds to at least one parameter threshold, and the parameter threshold is related to the P wave type corresponding to the P wave template. For example, if the P wave type corresponding to the P wave template is P wave downlink, then the parameter threshold is mainly It is used to detect whether there is a QRS wave following the P wave. Therefore, each P wave template determines whether the P wave parameters of the target cardiac cycle meet the corresponding parameter threshold; if so, the target cardiac cycle is counted.
在一实施例中,可以对P波按照一种规则进行分类。例如,可以根据P波的前后波形来进行分类,具体地,可以检测P波后是否有紧跟的QRS波进行分类。In one embodiment, P waves may be classified according to a rule. For example, the classification can be performed according to the waveforms before and after the P wave, and specifically, whether there is a QRS wave following the P wave can be detected for classification.
进一步,基于上述规则,P波类型包括PR和单R,PR表示P波带有QRS波,单R表示R波前无,PR包括下传PR和未下传PR。Further, based on the above rules, the types of P waves include PR and single R. PR indicates that the P wave has a QRS complex, and single R indicates that there is no front of the R wave. PR includes downlink PR and non-downlink PR.
在另一实施例中,可以对P波按照至少两个规则进行分类。例如,根据P波参数确定不同维度的至少第一分类规则和第二分类规则;确定心动周期在第一分类规则下的第一P波类型,以及在第二分类规则下的第二P波类型。In another embodiment, P waves can be classified according to at least two rules. For example, at least a first classification rule and a second classification rule in different dimensions are determined according to the P wave parameters; the first P wave type of the cardiac cycle under the first classification rule and the second P wave type under the second classification rule are determined .
进一步,第一分类规则基于P波是否下传进行分类,第二分类规则基于P波形态进行分类。Further, the first classification rule performs classification based on whether the P wave is down-streamed, and the second classification rule performs classification based on the P wave shape.
具体地,基于第一分类规则,P波类型包括PR和单R,PR表示P波带有QRS波,单R表示R波前无,PR包括下传PR和未下传PR;基于第二分类规则,P波类型包括直立P波、倒置P波、正负双向P波和负正双向P波。Specifically, based on the first classification rule, the types of P waves include PR and single R, PR indicates that the P wave has a QRS complex, single R indicates that there is no front of the R wave, and PR includes downlink PR and non-downlink PR; based on the second classification As a rule, the types of P waves include upright P waves, inverted P waves, positive and negative bidirectional P waves, and negative positive bidirectional P waves.
其中,正常P波在Ⅰ、Ⅱ、aVF,V4~V6导联直立,aVR导联倒置,其波顶一般是圆凸的,偶有轻度切迹或双峰。在肢体导联中,其高度不超过0.25mV;在胸导联中,直立P波高度则不超过0.2mV。正常P波的宽度不超过0.11秒。Among them, the normal P wave is upright in leads I, II, aVF, V4-V6, and inverted in lead aVR. In the limb leads, its height does not exceed 0.25 mV; in the chest leads, the upright P wave height does not exceed 0.2 mV. A normal P wave is no more than 0.11 seconds wide.
当p波在Ⅱ、Ⅲ、aVF导联倒置,而aVR直立时,则称为逆行性p波,表示激动起源于房室交界。When the p wave is inverted in leads II, III, and aVF and the aVR is upright, it is called a retrograde p wave, indicating that the excitation originates from the atrioventricular junction.
正负双向P波是指P波开始阶段直立,而结束阶段倒置;负正双向P波是指P波开始阶段倒置,而结束阶段直立。A positive and negative bidirectional P wave means that the initial phase of the P wave is upright and the end phase is inverted;
可以理解地,由于采用了多个维度的分类方式,因此,同一个心动周期在每一个分类方式中都可以确定一个类型,即不同类型的P波中可能有相同的心动周期。It is understandable that, since the classification methods of multiple dimensions are adopted, one type of cardiac cycle can be determined in each classification method, that is, different types of P waves may have the same cardiac cycle.
步骤13:根据心动周期的P波类型,将心电图的心动周期归类至对应的P波模板中。Step 13: According to the P wave type of the cardiac cycle, classify the cardiac cycle of the electrocardiogram into the corresponding P wave template.
模板是同一P波类型的心动周期的集合。可以理解地,这里的模板类似于一个文件夹,步骤13用于将所有的心动周期分类至各个对应的P波模板中。A template is a collection of cardiac cycles of the same P wave type. Understandably, the template here is similar to a folder, and step 13 is used to classify all cardiac cycles into corresponding P wave templates.
可选地,在一实施例中,上述的方法还包括:显示至少一模板标识,每一模板标识对应一个P波模板;在获取到基于目标模板标识的点击指令时,显示目标模板标识对应的心动周期。Optionally, in an embodiment, the above-mentioned method further includes: displaying at least one template identifier, each template identifier corresponding to a P-wave template; when acquiring a click instruction based on the target template identifier, displaying the corresponding target template identifier. cardiac cycle.
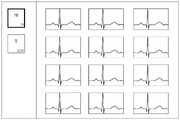
具体参阅图3a-图3c,图3a是心电图显示界面的第一示意图,图3b是心电图显示界面的第二示意图,图3c是心电图显示界面的第三示意图。3a-3c, FIG. 3a is the first schematic diagram of the ECG display interface, FIG. 3b is the second schematic diagram of the ECG display interface, and FIG. 3c is the third schematic diagram of the ECG display interface.
如图3a所示,在显示界面的左侧区域显示至少一个模板标识,每一模板标识对应一个P波模板。在本实施例中,P波模板可以包括“PR”和“R”。As shown in Fig. 3a, at least one template identification is displayed in the left area of the display interface, and each template identification corresponds to a P wave template. In this embodiment, the P wave template may include "PR" and "R".
进一步,在获取到对于某一模板标识的点击指令时,在显示界面的右侧区域显示目标模板标识对应的心动周期。在本实施例中,当点击“PR”时,“PR”标识采用预设特殊方式显示(如边框加粗显示、高亮显示、特殊颜色显示等),然后进一步在右侧区域显示“PR”P波模板中的心动周期。Further, when a click instruction for a template identifier is obtained, the cardiac cycle corresponding to the target template identifier is displayed in the right area of the display interface. In this embodiment, when "PR" is clicked, the "PR" logo is displayed in a preset special way (such as bold border display, highlighted display, special color display, etc.), and then "PR" is further displayed in the right area Cardiac cycle in P wave template.
可选地,在一实施例中,上述方法还包括:对每一P波模板中的心动周期的数量进行统计;在对应每一P波模板的模板标识上显示统计数量。如图3a所示,“PR”P波模板中统计的心动周期的数量为18,则在“PR”模板标识的右下角显示数字“18”,“R”P波模板中统计的心动周期的数量为6570,则在“R”模板标识的右下角显示数字“6570”。Optionally, in an embodiment, the above method further includes: performing statistics on the number of cardiac cycles in each P-wave template; and displaying the statistical number on a template identifier corresponding to each P-wave template. As shown in Figure 3a, the number of cardiac cycles counted in the "PR" P wave template is 18, then the number "18" is displayed in the lower right corner of the "PR" template logo, and the number of cardiac cycles counted in the "R" P wave template is 18. If the quantity is 6570, the number "6570" will be displayed in the lower right corner of the "R" template logo.
进一步,在一实施例中,还可以采用至少两种不同分类维度对心动周期进行分类。具体地,根据P波参数和预设第一分类规则,确定心动周期的母P波类型,以及根据P波参数和预设第二分类规则,确定每一母P波类型中的心动周期的子P波类型;其中,预设第一分类规则和预设第二分类规则的分类维度不同。Further, in one embodiment, at least two different classification dimensions can also be used to classify the cardiac cycle. Specifically, the parent P wave type of the cardiac cycle is determined according to the P wave parameter and the preset first classification rule, and the child of the cardiac cycle in each parent P wave type is determined according to the P wave parameter and the preset second classification rule P wave type; wherein, the classification dimensions of the preset first classification rule and the preset second classification rule are different.
其中,P波模板包括至少一母P波模板和每一母P波模板包含的至少一子P波模板。The P wave template includes at least one parent P wave template and at least one sub P wave template included in each parent P wave template.
进一步,如图3b所示,显示至少一母模板标识,每一母模板标识对应一个母P波模板;在获取到基于目标母模板标识的点击指令时,显示目标母模板标识对应的至少一子模板标识;在获取到基于目标子模板标识的点击指令时,显示目标子模板标识对应的心动周期。Further, as shown in Figure 3b, at least one parent template identification is displayed, and each parent template identification corresponds to a parent P-wave template; when the click instruction based on the target parent template identification is obtained, at least one child corresponding to the target parent template identification is displayed. Template ID; when a click instruction based on the target sub-template ID is obtained, the cardiac cycle corresponding to the target sub-template ID is displayed.
即,母P波类型、母P波模板、母模板标识,三者相对应,子P波类型、子P波模板、子模板标识,三者相对应。That is, the parent P wave type, the parent P wave template, and the parent template identifier correspond to the three, and the child P wave type, the child P wave template, and the child template identifier correspond to the three.
具体地,以图3b为例,在点击“PR”母模板标识时,出现下拉菜单,显示“直立”“倒置”“正负双向”“负正双向”子模板标识,在点击“直立”子模板标识时,在右侧区域显示对应的“PR”母P波模板中“直立”子P波模板中的心动周期。Specifically, taking Fig. 3b as an example, when clicking the "PR" parent template logo, a drop-down menu appears, displaying the "Upright", "Inverted", "Positive and Negative Bidirectional", and "Negative Positive Bidirectional" sub-template logos. When the template is identified, the cardiac cycle in the "upright" sub-P wave template in the corresponding "PR" parent P wave template is displayed in the right area.
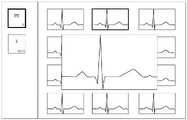
进一步如图3c所示,在一实施例中,在获取到对于某一心动周期的预设操作指令(如双击或右键下拉菜单选择)时,显示一悬浮窗口,将该心动周期进行放大并显示于该悬浮窗,还可以在设定区域显示对应该心动周期的详细参数。另外,还可以对悬浮显示的新地图片段进行缩放、拖动等操作,以缩放为例,可采用鼠标滚轮进行缩放,也可以拖动悬浮窗口的边界进行缩放。进一步,再一次获取到对悬浮窗的预设操作指令(如双击或右键下拉菜单选择)时,将该心动周期还原,悬浮窗口消失。Further as shown in FIG. 3c, in one embodiment, when a preset operation instruction for a certain cardiac cycle (such as double-click or right-click drop-down menu selection) is obtained, a floating window is displayed, and the cardiac cycle is enlarged and displayed. In the floating window, detailed parameters corresponding to the cardiac cycle can also be displayed in the setting area. In addition, operations such as zooming, dragging, etc. can also be performed on the new map segment displayed in the suspension. Taking zooming as an example, the mouse wheel can be used to zoom, or the boundary of the floating window can be dragged to zoom. Further, when a preset operation instruction for the floating window (such as double-click or right-click drop-down menu selection) is obtained again, the cardiac cycle is restored, and the floating window disappears.
在另一实施例中,还可以将多个心动周期重叠显示,具体地,将目标P波类型对应的至少部分心动周期进行叠加;显示叠加后的至少部分心动周期。其中,关心心电图叠加显示的效果可以参阅后面的实施例,这里不再详述。In another embodiment, multiple cardiac cycles may also be displayed in an overlapping manner, specifically, at least part of the cardiac cycles corresponding to the target P wave type are superimposed; and at least part of the cardiac cycles after the superimposition is displayed. The effect of the superimposed display of the concerned electrocardiogram may refer to the following embodiments, which will not be described in detail here.
可选地,除了上述的P波模板之外,还可以设置一QRS波模板。Optionally, in addition to the above-mentioned P wave template, a QRS wave template may also be set.
具体地,获取心电图中心动周期的QRS波参数,根据QRS波参数,确定心动周期的QRS波类型,根据心动周期的QRS波类型,将心电图的心动周期归类至对应的QRS波模板中。Specifically, obtain the QRS wave parameters of the cardiac cycle in the electrocardiogram, determine the QRS complex type of the cardiac cycle according to the QRS complex parameters, and classify the cardiac cycle of the ECG into the corresponding QRS complex template according to the QRS complex type of the cardiac cycle.
其中,QRS波参数可以包括QRS波时限、QRS波幅值、QRS波形态。QRS波类型可以根据上述的参数来进行划分。在一实施例中,可以将QRS波类型划分为正常QRS波和异常QRS波,对于异常QRS波,还可以进一步划分为Q波、宽大畸形波、Δ波、M波、R波等。当然,上述分类方式仅仅基于一种原则的分类的举例,在其他实施例中,也可以根据其他分类方式进行分类。The QRS wave parameters may include QRS wave duration, QRS wave amplitude, and QRS wave shape. The types of QRS waves can be classified according to the above parameters. In one embodiment, the types of QRS complexes can be divided into normal QRS complexes and abnormal QRS complexes, and the abnormal QRS complexes can be further divided into Q waves, large deformed waves, Δ waves, M waves, and R waves. Of course, the above classification method is only an example of classification based on one principle, and in other embodiments, the classification can also be performed according to other classification methods.
进一步,在一实施例中,可以同屏显示P波模板对应的P波模板标识,以及QRS波模板对应的QRS波模板标识。Further, in one embodiment, the P wave template logo corresponding to the P wave template and the QRS wave template logo corresponding to the QRS wave template may be displayed on the same screen.
区别于现有技术,本实施例提供的心电图分析方法包括获取心电图中心动周期的P波参数;根据P波参数,确定心动周期的P波类型;根据心动周期的P波类型,将心电图的心动周期归类至对应的P波模板中。通过上述方式,通过对P波参数进行分析,在P波不明显的情况完成,完成对P波的分类统计,便于对同一P波类型的心动周期进行查看,一方面提高了分析效率,另一方面有助于对P波特征的识别。Different from the prior art, the electrocardiogram analysis method provided in this embodiment includes acquiring the P wave parameters of the cardiac cycle in the electrocardiogram; determining the P wave type of the cardiac cycle according to the P wave parameters; Periods are grouped into corresponding P-wave templates. Through the above method, through the analysis of P wave parameters, when the P wave is not obvious, the classification and statistics of the P wave are completed, which is convenient for viewing the cardiac cycles of the same P wave type. On the one hand, the analysis efficiency is improved, and the other is Aspects facilitate the identification of P-wave features.
参阅图4,图4是本申请提供的心电图分析方法第二实施例的流程示意图,该方法包括:Referring to FIG. 4, FIG. 4 is a schematic flowchart of the second embodiment of the electrocardiogram analysis method provided by the present application, and the method includes:
步骤41:获取心电图中心动周期的P波参数。Step 41: Obtain the P wave parameters of the cardiac cycle in the electrocardiogram.
本步骤与上述步骤11类似,这里不再赘述。This step is similar to the above-mentioned
步骤42:根据P波参数建立统计图,以使心动周期根据对应的P波参数以一统计元素在统计图中表示。Step 42: Create a statistical map according to the P-wave parameters, so that the cardiac cycle is represented in the statistical map by a statistical element according to the corresponding P-wave parameters.
可选地,本实施例中的统计图包括散点图和直方图,统计图可以对PP间期、RR间期、PR间期和RP间期等进行统计。Optionally, the statistical chart in this embodiment includes a scatter plot and a histogram, and the statistical chart may perform statistics on the PP interval, the RR interval, the PR interval, and the RP interval.
以散点图为例:Take a scatter plot as an example:
根据P波参数确定与P波关联的目标间期;以心动周期中前一目标间期作为第一坐标、后一目标间期作为第二坐标,建立目标间期散点图。The target interval associated with the P wave is determined according to the P wave parameters; the target interval scattergram is established with the previous target interval as the first coordinate and the next target interval as the second coordinate in the cardiac cycle.
PP间期散点图:如图5a所示,图5a是PP间期散点图,以前一个PP间期P0-P为横坐标,后一个PP间期P1-P为纵坐标,绘制PP间期散点图。PP interval scatter diagram: As shown in Figure 5a, Figure 5a is a PP interval scatter diagram, the former PP interval P0-P is the abscissa, the latter PP interval P1-P is the ordinate, and the PP interval is drawn. period scatter plot.
PR间期散点图:如图5b所示,图5b是PR间期散点图,以前一个PR间期P0-R为横坐标,后一个PR间期P1-R为纵坐标,绘制PR间期散点图。PR interval scatter diagram: As shown in Figure 5b, Figure 5b is a PR interval scatter diagram, the previous PR interval P0-R is the abscissa, the next PR interval P1-R is the ordinate, and the PR interval is drawn. period scatter plot.
RP间期散点图:以前一个RP间期为横坐标,后一个RP间期为纵坐标,绘制RP间期散点图。RP interval scatter diagram: the former RP interval is the abscissa, the latter RP interval is the ordinate, and the RP interval scatter diagram is drawn.
PP间期/RR间期比值散点图:表示相邻两个心动周期的PP间期/RR间期比值的关系,具体地,以前一心动周期的PP间期/RR间期比值为横坐标,后一心动周期的PP间期/RR间期比值为纵坐标,绘制PP间期/RR间期比值散点图。Scatter diagram of PP interval/RR interval ratio: represents the relationship between the PP interval/RR interval ratio of two adjacent cardiac cycles, specifically, the PP interval/RR interval ratio of the previous cardiac cycle is the abscissa , the PP interval/RR interval ratio of the following cardiac cycle is the ordinate, and the PP interval/RR interval ratio scatter plot is drawn.
RR间期/PP间期比值散点图:表示相邻两个心动周期的RR间期/PP间期比值的关系,具体地,以前一心动周期的RR间期/PP间期比值为横坐标,后一心动周期的RR间期/PP间期比值为纵坐标,绘制RR间期/PP间期比值散点图。RR interval/PP interval ratio scatterplot: represents the relationship between the RR interval/PP interval ratio of two adjacent cardiac cycles, specifically, the RR interval/PP interval ratio of the previous cardiac cycle is the abscissa , the RR interval/PP interval ratio of the subsequent cardiac cycle is the ordinate, and the RR interval/PP interval ratio scatterplot is drawn.
PP间期差值散点图:表示目标心动周期的PP间期与前一心动周期的PP间期的差值,目标心动周期的PP间期与后一心动周期的PP间期的差值,之间的关系,具体地,以当前心动周期的PP间期与前一心动周期的PP间期的差值为横坐标,以当前心动周期的PP间期与后一心动周期的PP间期的差值为横坐标,绘制PP间期差值散点图。PP interval difference scattergram: It shows the difference between the PP interval of the target cardiac cycle and the PP interval of the previous cardiac cycle, the difference between the PP interval of the target cardiac cycle and the PP interval of the following cardiac cycle, Specifically, the difference between the PP interval of the current cardiac cycle and the PP interval of the previous cardiac cycle is used as the abscissa, and the difference between the PP interval of the current cardiac cycle and the PP interval of the next cardiac cycle is used as the abscissa. The difference is the abscissa, and a scatter plot of the PP interval difference is drawn.
可选地,由于散点图中的每一个点对应一个心动周期,因此,可以根据心动周期的不同类型,对散点图中的每一个点进行不同显示效果的表示。例如,在目标间期散点图中散点,根据其对应的心动周期中P波下传状态,显示不同的颜色。具体地,如果一个心动周期的P波下传,那么该心动周期对应的散点可以采用第一颜色表示,如果一个心动周期中的P波未下传,那么该心动周期对应的散点可以采用第二颜色表示。Optionally, since each point in the scatter diagram corresponds to one cardiac cycle, each point in the scatter diagram can be represented with different display effects according to different types of cardiac cycles. For example, in the target interval scatterplot, the scatter points are displayed in different colors according to their corresponding P-wave downgoing states in the cardiac cycle. Specifically, if the P wave of a cardiac cycle is transmitted down, the scatter point corresponding to the cardiac cycle can be represented by the first color; if the P wave in a cardiac cycle is not transmitted down, the scatter point corresponding to the cardiac cycle can be represented by the first color. The second color indicates.
以直方图为例:Take the histogram as an example:
根据P波参数确定与P波关联的目标间期;以目标间期作为第一坐标、心动周期数量作为第二坐标,建立目标间期直方图。The target interval associated with the P wave is determined according to the P wave parameters; the target interval histogram is established with the target interval as the first coordinate and the number of cardiac cycles as the second coordinate.
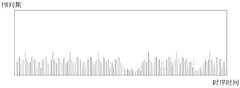
PP间期直方图:如图6所示,图6是PP间期直方图,以P-P间期为横坐标,心动周期数量为纵坐标进行绘制PP间期直方图。PP interval histogram: As shown in Figure 6, Figure 6 is the PP interval histogram, with the P-P interval as the abscissa and the number of cardiac cycles as the ordinate to draw the PP interval histogram.
可以理解地,直方图中的每个条柱表示一定时间范围的PP间期,每一个条柱的高度表示对应一种时间为的PP间期的心动周期的数量。It can be understood that each bar in the histogram represents a PP interval in a certain time range, and the height of each bar represents the number of cardiac cycles corresponding to a PP interval of time.
当然,上述的几种散点图和直方图仅仅是为了举例,在其他实施例中,还可以包括PP间期、RR间期、PR间期和RP间期分别对应的散点图和直方图,这里不再一一举例。Of course, the above-mentioned scatter plots and histograms are only for examples, and in other embodiments, scatter plots and histograms corresponding to the PP interval, RR interval, PR interval, and RP interval, respectively, may also be included. , no more examples here.
可选地,在一实施例中,上述方法还包括:在获取到基于统计图中的目标统计元素的点击指令时,显示目标统计元素对应的心动周期。Optionally, in an embodiment, the above method further includes: when a click instruction based on the target statistical element in the statistical chart is obtained, displaying the cardiac cycle corresponding to the target statistical element.
对于散点图,一个散点表示一个心动周期,因此,可以通过对散点图中的点进行选择,以显示对应的心动周期。具体地,在获取到基于目标间期散点图中一个散点或指定区域的多个散点的选择指令时,显示被选择的散点对应的心动周期。For a scatter plot, one scatter point represents one cardiac cycle, so the corresponding cardiac cycle can be displayed by selecting points in the scatter plot. Specifically, when a selection instruction based on one scatter point or multiple scatter points in a designated area in the target interval scatter point diagram is obtained, the cardiac cycle corresponding to the selected scatter point is displayed.
对于选择一个区域内的多个散点,对应的多个心动周期,可以按照时序依次显示,例如,可以将显示屏幕划分为多个区域,每个区域显示一个心动周期。进一步,可以从显示的多个心动周期中选择,然后单独显示选择的心动周期,如果选择的心动周期数量为2,可以将两个心动周期对应显示。For selecting multiple scattered points in one area, the corresponding multiple cardiac cycles can be displayed in sequence according to the time sequence. For example, the display screen can be divided into multiple areas, and each area displays one cardiac cycle. Further, it can be selected from the displayed multiple cardiac cycles, and then the selected cardiac cycles can be displayed individually. If the number of selected cardiac cycles is 2, two cardiac cycles can be displayed correspondingly.
在另一实施例中,还可以将多个心动周期重叠显示,具体地,将目标P波类型对应的至少部分心动周期进行叠加;显示叠加后的至少部分心动周期。In another embodiment, multiple cardiac cycles may also be displayed in an overlapping manner, specifically, at least part of the cardiac cycles corresponding to the target P wave type are superimposed; and at least part of the cardiac cycles after the superimposition is displayed.
对于直方图,一个条柱表示具有一定范围间期的多个心动周期,因此,可以通过对条柱进行选择,以显示对应的多个心动周期。具体地,在获取到基于目标间期直方图中至少一个条柱的选择指令时,显示被选择的条柱对应的心动周期。For the histogram, a bar represents a plurality of cardiac cycles with a certain range of intervals, so the bars can be selected to display the corresponding cardiac cycles. Specifically, when a selection instruction based on at least one bar in the target interval histogram is acquired, the cardiac cycle corresponding to the selected bar is displayed.
另外,还可以对多个条柱同时进行选择,多个条柱对应的多个心动周期也可以按照时序依次显示,例如,可以将显示屏幕划分为多个区域,每个区域显示一个心动周期。进一步,可以从显示的多个心动周期中选择,然后单独显示选择的心动周期,如果选择的心动周期数量为2,可以将两个心动周期对应显示。In addition, multiple bars can be selected at the same time, and multiple cardiac cycles corresponding to the multiple bars can also be displayed sequentially in time sequence. For example, the display screen can be divided into multiple areas, and each area displays one cardiac cycle. Further, it can be selected from the displayed multiple cardiac cycles, and then the selected cardiac cycles can be displayed individually. If the number of selected cardiac cycles is 2, two cardiac cycles can be displayed correspondingly.
在另一实施例中,还可以将多个心动周期重叠显示,具体地,将目标P波类型对应的至少部分心动周期进行叠加;显示叠加后的至少部分心动周期。In another embodiment, multiple cardiac cycles may also be displayed in an overlapping manner, specifically, at least part of the cardiac cycles corresponding to the target P wave type are superimposed; and at least part of the cardiac cycles after the superimposition is displayed.
对于重叠心动周期,如图7所示,图7是重叠心动周期示意图,在一实施例中,可以获取基于叠加心动周期中指定区域的插入指令;在指定区域插入P波;对插入P波之后的目标间期散点图或目标间期直方图进行更新。For overlapping cardiac cycles, as shown in FIG. 7 , which is a schematic diagram of overlapping cardiac cycles, in one embodiment, an insertion instruction based on a designated area in the overlapping cardiac cycle can be obtained; P waves are inserted in the designated areas; The target interval scatterplot or target interval histogram is updated.
另外,在获取到基于统计图中的至少一个目标统计元素的P波重检测指令时,根据选择的导联对至少一个目标统计元素对应的P波进行重新检测,并对统计图进行更新。以直方图为例,参阅图5,直方图支持选中区域进行右键操作,右键支持“P波重检测”功能,选中后可以弹出子菜单,支持选择某个导联作为重分析导联,点击后,系统会根据选中的分析导联重新检测选中区域心拍范围内的P波,检测完成后,会自动更新直方图。In addition, when a P wave re-detection instruction based on at least one target statistical element in the statistical chart is obtained, the P wave corresponding to the at least one target statistical element is re-detected according to the selected lead, and the statistical chart is updated. Taking the histogram as an example, see Figure 5. The histogram supports the right-click operation of the selected area. The right-click supports the "P wave re-detection" function. After selecting, a submenu will pop up, and a certain lead can be selected as the reanalysis lead. After clicking , the system will re-detect the P wave within the cardiac beat range of the selected area according to the selected analysis lead. After the detection is completed, the histogram will be automatically updated.
区别于现有技术,本实施例提供的心电图分析方法包括:获取心电图中心动周期的P波参数;根据P波参数建立统计图,以使心动周期根据对应的P波参数以一统计元素在统计图中表示。通过上述方式,通过对P波参数进行分析,在P波不明显的情况完成,完成对P波统计图显示,由于统计图显示直观,可以便捷的从统计图中获取到P波特征,避免了从心电图中不易获取特征的问题。进一步减少了分析时间,极大地提高了心电图分析效率。Different from the prior art, the electrocardiogram analysis method provided in this embodiment includes: acquiring P wave parameters of the cardiac cycle in the electrocardiogram; establishing a statistical map according to the P wave parameters, so that the cardiac cycle can be counted with a statistical element according to the corresponding P wave parameters. shown in the figure. In the above way, through the analysis of P wave parameters, when the P wave is not obvious, the display of the P wave statistical chart is completed. Since the statistical chart is intuitively displayed, the P wave characteristics can be easily obtained from the statistical chart, avoiding the need for The problem of not easily obtaining features from the ECG. The analysis time is further reduced and the efficiency of ECG analysis is greatly improved.
参阅图8,图8是本申请提供的心电图分析方法第三实施例的流程示意图,该方法包括:Referring to FIG. 8, FIG. 8 is a schematic flowchart of the third embodiment of the electrocardiogram analysis method provided by the present application, and the method includes:
步骤81:获取心电图中心动周期的P波参数。Step 81: Obtain the P wave parameters of the cardiac cycle in the electrocardiogram.
P波参数包括P波时限、P波幅度、P波形态、PR间期、RP间期、PP间期、PP间期差、P波与QRS波关系、P波下传情况中的至少一个。P wave parameters include at least one of P wave duration, P wave amplitude, P wave shape, PR interval, RP interval, PP interval, PP interval difference, relationship between P wave and QRS complex, and P wave down-pass.
P波时限是指P波的起始时间和终止时间之间的时间段;P波幅值包括P波端的最大信号值、最小信号值或最大信号值与最小信号值的差值;P波形态可以根据不同的分类方式进行分类,例如可以将P波分为直立P波、倒置P波、正负双向P波和负正双向P波;PR间期是指PR间期的时间长度,RP间期是指RP间期的时间长度,PP间期是指PP间期的时间长度,PP间期差是指两个相邻心动周期的PP间期的时间长度差;P波与QRS波关系是指P波数量和QRS波数量的比例关系,P波下传情况是指P波后面是否有紧跟的QRS波。The P wave duration refers to the time period between the start time and the end time of the P wave; the P wave amplitude includes the maximum signal value, the minimum signal value or the difference between the maximum signal value and the minimum signal value at the P wave end; the P wave shape It can be classified according to different classification methods, for example, P waves can be divided into upright P waves, inverted P waves, positive and negative bidirectional P waves, and negative positive and negative bidirectional P waves; PR interval refers to the length of the PR interval, and between RP The PP interval refers to the time length of the RP interval, the PP interval refers to the time length of the PP interval, and the PP interval difference refers to the time length difference between the PP intervals of two adjacent cardiac cycles; the relationship between the P wave and the QRS complex is Refers to the proportional relationship between the number of P waves and the number of QRS waves. The down-pass of P waves refers to whether there are QRS waves following the P waves.
步骤82:根据P波参数建立可视化图形/图表。Step 82: Create a visual graph/chart according to the P-wave parameters.
其中,可视化图形/图表包括P波参数趋势图、P波参数散点图、P波与QRS波关系图和P波下传情况分布图中的至少一个。Wherein, the visualized graph/chart includes at least one of a P wave parameter trend graph, a P wave parameter scatter graph, a relationship graph between P wave and QRS wave, and a P wave downpass distribution graph.
P波参数趋势图:P wave parameter trend chart:
P波参数趋势图包括PP间期趋势图、PR间期趋势图、RP间期趋势图、PP间期RR间期趋势对比图、PP间期/RR间期比值趋势图、RR间期/PP间期比值趋势图、P波时限趋势图、P波形态趋势图、P波幅度趋势图中的至少一个。P wave parameter trend graphs include PP interval trend graph, PR interval trend graph, RP interval trend graph, PP interval RR interval trend comparison graph, PP interval/RR interval ratio trend graph, RR interval/PP interval At least one of the interval ratio trend chart, the P wave time limit trend chart, the P wave shape trend chart, and the P wave amplitude trend chart.
其中,PP间期趋势图表示PP间期与时间的关系;例如,以心动周期的时间顺序为横坐标,以PP间期的时间长度为纵坐标,绘制PP间期趋势图。Among them, the PP interval trend graph represents the relationship between the PP interval and time; for example, the PP interval trend graph is drawn with the time sequence of the cardiac cycle as the abscissa and the time length of the PP interval as the ordinate.
其中,PR间期趋势图表示PR间期与时间的关系;例如,以心动周期的时间顺序为横坐标,以PR间期的时间长度为纵坐标,绘制PR间期趋势图。The PR interval trend graph represents the relationship between the PR interval and time; for example, the PR interval trend graph is drawn with the time sequence of the cardiac cycle as the abscissa and the time length of the PR interval as the ordinate.
其中,RP间期趋势图表示RP间期与时间的关系;例如,以心动周期的时间顺序为横坐标,以RP间期的时间长度为纵坐标,绘制RP间期趋势图。Among them, the RP interval trend graph represents the relationship between the RP interval and time; for example, the RP interval trend graph is drawn with the time sequence of the cardiac cycle as the abscissa and the time length of the RP interval as the ordinate.
其中,PP间期RR间期趋势对比图表示PP间期和RR间期分别与时间关系的对比。Among them, the PP interval RR interval trend comparison chart represents the comparison of the PP interval and the RR interval with the time relationship, respectively.
具体地,PP间期RR间期趋势对比图的建立步骤包括:Specifically, the steps for establishing the PP interval RR interval trend comparison chart include:
以时间为第一坐标、以PP间期为第二坐标,建立PP间期趋势图;以及以时间为第一坐标、以RR间期为第二坐标,建立RR间期趋势图;其中,PP间期趋势图和RR间期趋势图呈现于同一坐标系中,以形成PP间期RR间期趋势对比图。Taking time as the first coordinate and the PP interval as the second coordinate, establish a PP interval trend chart; and take time as the first coordinate, and take the RR interval as the second coordinate, establish a RR interval trend chart; wherein, PP The interval trend graph and the RR interval trend graph are presented in the same coordinate system to form a PP interval RR interval trend comparison graph.
可选地,在一实施例中,PP间期趋势图和RR间期趋势图采用不同的方式显示。例如,采用不同的线条或者不同的颜色。Optionally, in an embodiment, the PP interval trend graph and the RR interval trend graph are displayed in different ways. For example, use different lines or different colors.
如图9所示,图9是PP间期RR间期趋势对比图,其中,横坐标表示时序时间,纵坐标表示间期时间,实线表示PP间期趋势图,虚线表示RR间期趋势图。As shown in Fig. 9, Fig. 9 is a comparison chart of the PP interval RR interval trend, in which the abscissa represents the time sequence time, the ordinate represents the interval time, the solid line represents the PP interval trend graph, and the dotted line represents the RR interval trend graph .
可选地,获取第一坐标上每一目标点对应的PP间期趋势图的第一特征值、和对应的RR间期趋势图的第二特征值;在第一特征值和第二特征值的差值大于设定阈值时,对目标点对应的区域按照预设方式进行显示。其中,预设显示方式可以是特殊颜色显示、高亮、阴影等显示方式。Optionally, obtain the first eigenvalue of the PP interval trend graph corresponding to each target point on the first coordinate and the second eigenvalue of the corresponding RR interval trend graph; When the difference is greater than the set threshold, the area corresponding to the target point is displayed in a preset manner. The preset display mode may be a display mode such as special color display, highlight, shadow, and the like.
进一步,还可以在PP间期RR间期趋势对比图中进行区域选择。例如:获取对PP间期RR间期趋势对比图中任意一点选择得到的选择点;确定基于选择点且垂直于第一坐标的点选线;显示点选线对应的心动周期、以及点选线对应的PP间期趋势图的第一特征值、和对应的RR间期趋势图的第二特征值,两者的差值。Further, region selection can also be performed in the PP interval RR interval trend comparison chart. For example: obtain the selection point obtained by selecting any point in the PP interval RR interval trend comparison chart; determine the selection point based on the selection point and perpendicular to the first coordinate; display the cardiac cycle corresponding to the selection line, and the selection line The difference between the first eigenvalue of the corresponding PP interval trend graph and the second eigenvalue of the corresponding RR interval trend graph.
对于选中的区域,可以显示其中对应的多个心动周期,也可以采用叠加显示的方式。For the selected area, the corresponding multiple cardiac cycles may be displayed, or the superimposed display mode may be adopted.
其中,PP间期/RR间期比值趋势图表示PP间期/RR间期比值与时间的关系;例如,以心动周期的时间顺序为横坐标,以PP间期的时间长度与RR间期的时间长度的比值为纵坐标,绘制PP间期/RR间期比值趋势图。Among them, the PP interval/RR interval ratio trend graph represents the relationship between the PP interval/RR interval ratio and time; for example, the time sequence of the cardiac cycle is taken as the abscissa, and the time length of the PP interval and the RR interval The ratio of time length is the ordinate, and the trend graph of the ratio of PP interval/RR interval is drawn.
其中,RR间期/PP间期比值趋势图表示RR间期/PP间期比值与时间的关系;例如,以心动周期的时间顺序为横坐标,以RR间期的时间长度与PP间期的时间长度的比值为纵坐标,绘制RR间期/PP间期比值趋势图。Among them, the RR interval/PP interval ratio trend graph represents the relationship between the RR interval/PP interval ratio and time; for example, the time sequence of the cardiac cycle is taken as the abscissa, and the time length of the RR interval and the PP interval The ratio of time length is the ordinate, and the trend graph of the ratio of RR interval/PP interval is drawn.
其中,P波时限趋势图表示P波时限与时间的关系;例如,以心动周期的时间顺序为横坐标,以P波时限的时间长度为纵坐标,绘制P波时限趋势图。The P wave duration trend graph represents the relationship between the P wave duration and time; for example, the P wave duration trend graph is drawn with the time sequence of the cardiac cycle as the abscissa and the P wave duration as the ordinate.
其中,P波形态趋势图表示P波形态与时间的关系;例如,以心动周期的时间顺序为横坐标,以P波形态为纵坐标,绘制P波形态趋势图。具体地,P波形态可以划分为:直立P波、倒置P波、正负双向P波和负正双向P波等,然后给不同形态确定对应的数值作为纵坐标,例如直立P波为1,倒置P波为2,正负双向P波为3,负正双向P波为4,然后绘制对应的P波形态趋势图。Among them, the P wave shape trend diagram represents the relationship between the P wave shape and time; for example, the P wave shape trend diagram is drawn with the time sequence of the cardiac cycle as the abscissa and the P wave shape as the ordinate. Specifically, the P wave forms can be divided into: upright P waves, inverted P waves, positive and negative bidirectional P waves, and negative positive bidirectional P waves, etc., and then determine the corresponding values for different forms as the ordinate. The inverted P wave is 2, the positive and negative two-way P wave is 3, and the negative positive and two-way P wave is 4, and then the corresponding P wave shape trend chart is drawn.
其中,P波幅度趋势图表示P波幅度与时间的关系;例如,以时间为横坐标,以信号幅值为纵坐标,绘制P波幅度趋势图。The P-wave amplitude trend graph represents the relationship between the P-wave amplitude and time; for example, the P-wave amplitude trend graph is drawn with time as the abscissa and signal amplitude as the ordinate.
P波参数散点图:Scatter plot of P wave parameters:
P波参数散点图包括PP间期/RR间期比值散点图、RR间期/PP间期比值散点图、PP间期散点图、PP间期差值散点图、PR间期散点图、RP间期散点图中的至少一个。Scatter plot of P wave parameters including PP interval/RR interval ratio scatter plot, RR interval/PP interval ratio scatter plot, PP interval scatter plot, PP interval difference scatter plot, PR interval At least one of scatter plot, RP interval scatter plot.
其中,PP间期/RR间期比值散点图表示相邻两个心动周期的PP间期/RR间期比值的关系。Among them, the PP interval/RR interval ratio scatterplot represents the relationship between the PP interval/RR interval ratios of two adjacent cardiac cycles.
PP间期/RR间期比值散点图的建立步骤包括:The steps to create a PP interval/RR interval ratio scatterplot include:
以时间为第一坐标、以PP间期/RR间期比值作为第二坐标,建立PP间期/RR间期比值散点图。Taking time as the first coordinate and the PP interval/RR interval ratio as the second coordinate, a scatter plot of the PP interval/RR interval ratio was established.
如图10所示,图10是PP间期/RR间期比值散点图。可以理解地,由于纵坐标是PP间期/RR间期比值,因此,当PP间期比RR间期大时,比值大于1,当PP间期比RR间期小时,比值小于1。进一步,PP间期和RR间期越相近,波形越靠近1。因此,通过对PP间期/RR间期比值散点图的分析,可以对比分析PP间期和RR间期的差异变化。As shown in Fig. 10, Fig. 10 is a scatter plot of the PP interval/RR interval ratio. Understandably, since the ordinate is the PP interval/RR interval ratio, when the PP interval is larger than the RR interval, the ratio is greater than 1, and when the PP interval is smaller than the RR interval, the ratio is less than 1. Further, the closer the PP interval and the RR interval are, the closer the waveform is to 1. Therefore, by analyzing the scatter plot of the PP interval/RR interval ratio, the differences between the PP interval and the RR interval can be compared and analyzed.
可选地,在其他实施例中,还可以提供RR间期/PP间期比值散点图,其原理和反应出的心电图特征类似,这里不再赘述。Optionally, in other embodiments, a scatter plot of the ratio of the RR interval to the PP interval may also be provided, the principle of which is similar to the reflected electrocardiogram feature, and will not be repeated here.
另外,在比值散点图还可以增加等比例线,例如分别在2:1和3:1处提供等比例线,以便观察对比。In addition, equal scale lines can be added to the ratio scatter plot, for example, equal scale lines can be provided at 2:1 and 3:1, respectively, so as to observe the contrast.
PR间期趋势图的建立步骤包括:The steps to create a PR interval trend graph include:
以时间为第一坐标、以PR间期为第二坐标,建立PR间期趋势图。With time as the first coordinate and PR interval as the second coordinate, a PR interval trend graph is established.
如图11所示,图10是PR间期趋势图。其中横坐标上每个点表示一个心动周期,纵坐标表示每个心动周期对应的PR间期。通过PR间期趋势图,可以分析PR间期的变化趋势。As shown in FIG. 11 , FIG. 10 is a PR interval trend graph. Each point on the abscissa represents a cardiac cycle, and the ordinate represents the PR interval corresponding to each cardiac cycle. The PR interval trend graph can be used to analyze the change trend of the PR interval.
其中,RR间期/PP间期比值散点图表示相邻两个心动周期的RR间期/PP间期比值的关系;RR间期/PP间期比值散点图与上述PP间期/RR间期比值散点图类似,这里不再赘述。Among them, the RR interval/PP interval ratio scatterplot represents the relationship between the RR interval/PP interval ratios of two adjacent cardiac cycles; the RR interval/PP interval ratio scatterplot is related to the above PP interval/RR ratio The interval ratio scatter plot is similar and will not be repeated here.
其中,PP间期散点图表示相邻两个心动周期的PP间期的关系;例如,以前一心动周期的PP间期作为横坐标,以后一心动周期的PP间期作为纵坐标,绘制PP间期散点图。Among them, the PP interval scatter diagram represents the relationship between the PP intervals of two adjacent cardiac cycles; for example, the PP interval of the previous cardiac cycle is taken as the abscissa, and the PP interval of the next cardiac cycle is taken as the ordinate, and the PP interval is drawn. Interval scatter plot.
其中,PP间期差值散点图表示目标心动周期的PP间期与前一心动周期的PP间期的差值,目标心动周期的PP间期与后一心动周期的PP间期的差值,之间的关系;例如,以目标心动周期的PP间期与前一心动周期的PP间期的差值作为横坐标,以目标心动周期的PP间期与后一心动周期的PP间期的差值作为纵坐标,绘制PP间期差值散点图。Among them, the PP interval difference scattergram represents the difference between the PP interval of the target cardiac cycle and the PP interval of the previous cardiac cycle, and the difference between the PP interval of the target cardiac cycle and the PP interval of the following cardiac cycle , the relationship between; for example, take the difference between the PP interval of the target cardiac cycle and the PP interval of the previous cardiac cycle as the abscissa, and take the difference between the PP interval of the target cardiac cycle and the PP interval of the following cardiac cycle as the abscissa. The difference is used as the ordinate, and a scatter plot of the PP interval difference is drawn.
其中,PR间期散点图表示相邻两个心动周期的PR间期的关系;例如,以前一心动周期的PR间期作为横坐标,以后一心动周期的PR间期作为纵坐标,绘制PR间期散点图。Among them, the PR interval scatter diagram represents the relationship between the PR intervals of two adjacent cardiac cycles; for example, the PR interval of the previous cardiac cycle is taken as the abscissa, and the PR interval of the next cardiac cycle is taken as the ordinate, and PR is drawn. Interval scatter plot.
其中,RP间期散点图表示相邻两个心动周期的RP间期的关系。例如,以前一心动周期的RP间期作为横坐标,以后一心动周期的RP间期作为纵坐标,绘制RP间期散点图。Among them, the RP interval scatterplot represents the relationship between the RP intervals of two adjacent cardiac cycles. For example, the RP interval of the previous cardiac cycle is taken as the abscissa, and the RP interval of the next cardiac cycle is taken as the ordinate, and a RP interval scattergram is drawn.
P波与QRS波关系图:The relationship between P wave and QRS wave:
一方面,P波与QRS波关系图可以表示一个心动周期中P波与QRS波的时序前后关系。可以理解地,在一般的心动周期中,P波在QRS波之前,但是在一些特殊的情况下,也有可能P波在QRS波之后。On the one hand, the relationship between the P wave and the QRS complex can represent the time-series relationship between the P wave and the QRS complex in a cardiac cycle. Understandably, in a normal cardiac cycle, the P wave precedes the QRS complex, but in some special cases, the P wave may follow the QRS complex.
可选地,以心动周期的时间顺序为横坐标,以P波与QRS波的时序前后关系为纵坐标,绘制P波与QRS波关系图,例如,P波在QRS波之前,纵坐标为1,P波在QRS波之后,纵坐标为2。Optionally, take the time sequence of the cardiac cycle as the abscissa, and take the time sequence relationship between the P wave and the QRS complex as the ordinate, and draw a diagram of the relationship between the P wave and the QRS complex. For example, the P wave precedes the QRS complex, and the ordinate is 1. , the P wave is after the QRS wave, and the ordinate is 2.
另一方面,P波与QRS波关系图可以表示一个心动周期中P波与QRS波的数量比例关系。可以理解地,在一般的心动周期中,P波和QRS波的数量均为1,但是在一些特殊的情况下,P波的数量可能有多个,如2个、3个。On the other hand, the P wave to QRS complex graph can represent the proportional relationship between the number of P waves and QRS complexes in a cardiac cycle. It is understandable that in a general cardiac cycle, the number of P waves and QRS waves are both 1, but in some special cases, there may be multiple P waves, such as 2 or 3.
可选地,以心动周期的时间顺序为横坐标,以P波与QRS波的数量比例关系为纵坐标,绘制P波与QRS波关系图,例如,P波数量与QRS波数量的比例为1:1,纵坐标为1,P波数量与QRS波数量的比例为2:1,纵坐标为2,以此类推。Optionally, take the time sequence of the cardiac cycle as the abscissa, and take the proportional relationship between the number of P waves and QRS waves as the ordinate, draw a diagram of the relationship between P waves and QRS waves, for example, the ratio of the number of P waves to the number of QRS waves is 1. : 1, the ordinate is 1, the ratio of the number of P waves to the number of QRS waves is 2:1, the ordinate is 2, and so on.
P波下传情况分布图:Distribution map of P wave downlink situation:
P波下传情况分布图表示每一个心动周期P波下传情况;例如,以心动周期的时间顺序为横坐标,以P波下传情况为纵坐标,例如,P波下传,纵坐标为1,P波未下传,纵坐标为2。The distribution diagram of P wave down-passing situation shows the P-wave down-passing situation in each cardiac cycle; for example, taking the time sequence of cardiac cycles as the abscissa, and taking the P-wave down-passing situation as the ordinate, for example, P wave down-passing, the ordinate is 1. The P wave is not transmitted, and the ordinate is 2.
可以理解地,上述的实施例中都是以图形举例进行说明,在一些实施例中,也可以是与图形对应的图表。It can be understood that, in the above-mentioned embodiments, graphs are used as examples for description, and in some embodiments, graphs corresponding to graphs may also be used.
步骤83:显示可视化图形/图表中的至少一个。Step 83: Display at least one of the visualization graphs/charts.
可以理解地,显示界面可以获取用户的操作来进行可视化图形/图表的切换。It can be understood that the display interface can acquire the user's operation to switch the visual graph/chart.
在一实施例中,显示界面上显示P波参数趋势图、P波参数散点图、P波与QRS波关系图和P波下传情况分布图等几个大的类别的图标,在点击某一个图标时,显示该图标对应的多个图形/图表的小类别,如用户点击P波参数趋势图,然后在对应P波参数趋势图的图标下出现下拉菜单,显示PP间期趋势图、PR间期趋势图、RP间期趋势图、PP间期RR间期趋势对比图、PP间期/RR间期比值趋势图、RR间期/PP间期比值趋势图、P波时限趋势图、P波形态趋势图、P波幅度趋势图等多个小类别,然后再获取到对小类别的操作指令时,显示对应的图形/图表。In one embodiment, the display interface displays several major categories of icons, such as a P wave parameter trend diagram, a P wave parameter scatter diagram, a P wave and QRS wave relationship diagram, and a P wave downlink situation distribution diagram. When there is an icon, it displays the small categories of multiple graphs/charts corresponding to the icon. For example, if the user clicks on the P-wave parameter trend graph, a drop-down menu will appear under the icon corresponding to the P-wave parameter trend graph, displaying the PP interval trend graph, PR Interval trend graph, RP interval trend graph, PP interval RR interval trend comparison graph, PP interval/RR interval ratio trend graph, RR interval/PP interval ratio trend graph, P wave duration trend graph, P Wave shape trend chart, P wave amplitude trend chart and many other sub-categories, and then obtain the operation instructions for the sub-category, display the corresponding graph/chart.
在另一实施例中,在获取到基于可视化图形/图表中至少部分区域的切换指令时,显示至少部分区域中的可视化图形/图表对应的可视化图表/图形。In another embodiment, when a switching instruction based on at least part of the area in the visualized graph/chart is acquired, a visualized graph/graph corresponding to the visualized graph/graph in at least part of the area is displayed.
具体地,用户可以操作显示界面的图形中确定一个区域(如趋势图中的一个心动周期,或者散点图中的一个点),然后就可以悬浮窗的形式显示对应区域的图表。Specifically, the user can determine a region (such as a cardiac cycle in a trend graph, or a point in a scatter diagram) in the graph of the display interface, and then the graph of the corresponding region can be displayed in the form of a floating window.
另外,也可以自动对心电数据进行处理识别,在识别到异常数据时,自动显示异常数据对应的图表。In addition, it is also possible to automatically process and identify the ECG data, and when abnormal data is identified, a graph corresponding to the abnormal data is automatically displayed.
在另一实施例中,还可以同屏显示至少两个可视化图形/图表。In another embodiment, at least two visual graphs/charts may also be displayed on the same screen.
在显示至少两个可视化图形/图表时,可以将两个图形/图表中的数据进行对比,图形/图表的拖动、放大、缩小,层叠图形/图表中某一图形/图表的上层显示,显示图形/图表和未显示图形/图表的切换等。When displaying at least two visual graphs/charts, you can compare the data in the two graphs/charts, drag, zoom, and zoom out of the graphs/charts, display the upper layer of a graph/chart in the stacked graphs/charts, display Switching of graphs/graphs and graphs/graphs not displayed, etc.
在其他实施例中,步骤82中的可视化图形/图表包括两个间期的趋势对比图、两个间期的比值趋势图、两个间期的比值散点图、一个间期的趋势图和一个间期的散点图中的至少一个。In other embodiments, the visual graph/chart in
同屏呈现RR间期与PP间期对比趋势图及PR趋势图。该方法同屏呈现RR间期与PP间期对比趋势图及PR趋势图,操作者可简单明了的,操作者可直观的看出哪个时间段内病例的传导出现异常或心律不规整,有效的减少了分析时间,降低了医生的工作负担和精神压力,极大地提高了医生的工作效率。On the same screen, the RR interval and PP interval comparison trend graph and PR trend graph are presented. This method presents the RR interval and PP interval comparison trend graph and PR trend graph on the same screen, which is simple and clear for the operator. The analysis time is reduced, the workload and mental pressure of the doctor are reduced, and the work efficiency of the doctor is greatly improved.
另外,除了对于心动周期的查看,在其他实施例中还可以进行如下操作。In addition, in addition to viewing the cardiac cycle, the following operations may also be performed in other embodiments.
获取对PP间期RR间期趋势对比图、PP间期/RR间期比值散点图或PR间期趋势图中任意一点拖动得到的选择区域;显示选择区域对应的多个心动周期或多个心动周期形成的叠加心动周期。Obtain the selected area dragged from any point in the PP interval RR interval trend comparison chart, PP interval/RR interval ratio scatter plot or PR interval trend chart; display the multiple cardiac cycles or multiple cardiac cycles corresponding to the selected area. A superimposed cardiac cycle formed by a single cardiac cycle.
结合图9,图9中点选线的拖动方式同样适用于图10和图11的实施例中,对于选择的多个心动周期,可以进行叠加。Referring to FIG. 9 , the dragging method of the selected line in FIG. 9 is also applicable to the embodiments of FIG. 10 and FIG. 11 , and multiple selected cardiac cycles can be superimposed.
另外,在获取到基于选择区域的标记指令时,弹出候选窗口,以在候选窗口中选择对应的标记事件,以对选择区域进行标记。具体地,选中区域支持右键操作,右键包括:房早未下传,房室传导阻滞:I度、II度、III度,房室分离可选。选中后该区域增加事件标识,同时事件功能列表中增加相应的事件。In addition, when a marking instruction based on the selection area is acquired, a candidate window is popped up, and a corresponding marking event is selected in the candidate window to mark the selection area. Specifically, the selected area supports right-click operations, including: atrial premature failure, atrioventricular block: degree I, degree II, degree III, and AV separation is optional. When selected, an event ID will be added to this area, and a corresponding event will be added to the event function list at the same time.
可选地,在一实施例中,可以同屏显示PP间期RR间期趋势对比图、PP间期/RR间期比值散点图和PR间期趋势图三者。Optionally, in an embodiment, a PP interval RR interval trend comparison graph, a PP interval/RR interval ratio scatter plot, and a PR interval trend graph may be displayed on the same screen.
其中,PP间期RR间期趋势对比图、PP间期/RR间期比值散点图和PR间期趋势图按照设定的顺序和排版方式在同一个显示界面进行显示,在一实施例中,用于可以自定义每一图像的显示区域和显示大小,例如,用户认为PR间期趋势图更为重要,可以调大PR间期趋势图显示区域的大小。Among them, the PP interval RR interval trend comparison chart, the PP interval/RR interval ratio scatter plot, and the PR interval trend chart are displayed on the same display interface according to the set order and layout method. In one embodiment , which is used to customize the display area and display size of each image. For example, if the user thinks the PR interval trend graph is more important, you can increase the size of the PR interval trend graph display area.
进一步,如图12所示,图12是PP间期RR间期趋势对比图、PP间期/RR间期比值散点图和PR间期趋势图同屏显示示意图。Further, as shown in FIG. 12 , FIG. 12 is a schematic diagram of the PP interval RR interval trend comparison chart, the PP interval/RR interval ratio scatter plot, and the PR interval trend chart displayed on the same screen.
在一实施例中,在获取到基于PP间期RR间期趋势对比图、PP间期/RR间期比值散点图和PR间期趋势图中任意一目标图像的点击指令时,将所述目标图像放大并进行悬浮显示。In one embodiment, when a click instruction based on any target image in the PP interval RR interval trend comparison chart, the PP interval/RR interval ratio scatter plot, and the PR interval trend chart is obtained, the The target image is zoomed in and displayed floating.
其中,该点击指令可以是双击、长按等。进一步,在悬浮显示时,再次获取到该点击指令时,可以将悬浮显示的图像还原,三个图像同屏显示。另外,在悬浮显示时,还可以通过在显示屏上滑动(如左右滑动)选择悬浮显示的图像,如图12所示,当前悬浮显示的图像为“PP间期/RR间期比值散点图”,在当前图示情况下向左滑动后,悬浮显示“PR间期趋势图”,或在当前图示情况下向右滑动后,悬浮显示“PP间期RR间期趋势对比图”。The click instruction may be a double-click, a long-press, or the like. Further, during the suspension display, when the click instruction is obtained again, the image displayed in the suspension can be restored, and the three images are displayed on the same screen. In addition, during the floating display, you can also select the floating displayed image by sliding on the display screen (such as sliding left and right). As shown in Figure 12, the current floating displayed image is the "PP interval/RR interval ratio scatter plot" ", swipe to the left in the current picture, the "PR interval trend graph" will be displayed in suspension, or if you swipe to the right in the current picture, the "PP interval RR interval trend comparison graph" will be displayed in the suspension.
在另一实施例中,在获取到基于PP间期RR间期趋势对比图、PP间期/RR间期比值散点图和PR间期趋势图中任意一目标图像的缩放指令时,对所述目标图像进行缩放。In another embodiment, when a zoom instruction based on any target image in the PP interval RR interval trend comparison chart, the PP interval/RR interval ratio scatter plot, and the PR interval trend chart is obtained, the The target image is scaled.
其中,该缩放指令可以是对目标图像双击、长按、拖动边框、滚动鼠标滚轮等方式。Wherein, the zoom instruction may be a method of double-clicking, long-pressing, dragging a frame, scrolling a mouse wheel, or the like on the target image.
例如,以鼠标操作为例,当鼠标移动至目标图像的边框时,鼠标指针形状切换为图像缩放标识,然后可以通过拖动鼠标实现图像的缩放。或以触摸屏为例,用户手指触摸目标图像边框,边框被选中后手指进行拖动,实现对图像的缩放。For example, taking the mouse operation as an example, when the mouse moves to the frame of the target image, the shape of the mouse pointer is switched to the image zoom mark, and then the image can be zoomed by dragging the mouse. Or take a touch screen as an example, the user's finger touches the frame of the target image, and after the frame is selected, the finger is dragged to realize the zooming of the image.
区别于现有技术,本实施例提供的心电图分析方法包括:获取心电图中心动周期的P波参数;根据P波参数建立可视化图形/图表;其中,可视化图形/图表包括P波参数趋势图、P波参数散点图、P波与QRS波关系图和P波下传情况分布图中的至少一个;显示可视化图形/图表中的至少一个。通过上述方式,可以将P波参数进行图形化或图表化,以便用户可以方便的对P波参数进行观察,以进一步读取到心电图中的信息,提高了心电图的观察效率Different from the prior art, the electrocardiogram analysis method provided in this embodiment includes: acquiring P wave parameters of the cardiac cycle in the electrocardiogram; establishing a visual graph/chart according to the P wave parameter; wherein, the visual graph/chart includes a P wave parameter trend graph, a P wave parameter At least one of a scatter plot of wave parameters, a graph of the relationship between P waves and QRS waves, and a distribution graph of P wave down-pass; display at least one of a visual graph/chart. Through the above method, the P wave parameters can be graphically or graphically displayed, so that the user can conveniently observe the P wave parameters, so as to further read the information in the electrocardiogram and improve the observation efficiency of the electrocardiogram
参阅图13,图13是本申请提供的心电图分析装置一实施例的结构示意图,该心电图分析装置130包括处理器131和存储器132,存储器132用于存储程序数据,处理器131用于执行程序数据,以实现如下的方法:Referring to FIG. 13, FIG. 13 is a schematic structural diagram of an embodiment of an electrocardiogram analysis apparatus provided by the present application. The electrocardiogram analysis apparatus 130 includes a processor 131 and a memory 132, the memory 132 is used for storing program data, and the processor 131 is used for executing the program data. , to implement the following methods:
获取心电图中心动周期的P波参数;根据P波参数,确定心动周期的P波类型;根据心动周期的P波类型,将心电图的心动周期归类至对应的P波模板中。或Obtain the P wave parameters of the cardiac cycle in the ECG; determine the P wave type of the cardiac cycle according to the P wave parameters; classify the cardiac cycle of the ECG into the corresponding P wave template according to the P wave type of the cardiac cycle. or
获取心电图中心动周期的P波参数;根据P波参数建立统计图,以使心动周期根据对应的P波参数以一统计元素在统计图中表示。或Obtain the P wave parameters of the cardiac cycle in the electrocardiogram; establish a statistical map according to the P wave parameters, so that the cardiac cycle is represented in the statistical map by a statistical element according to the corresponding P wave parameters. or
获取心电图中心动周期的P波参数;根据P波参数建立PP间期RR间期趋势对比图、PP间期/RR间期比值散点图和PR间期趋势图中的至少一个;显示PP间期RR间期趋势对比图、PP间期/RR间期比值散点图和PR间期趋势图中的至少一个。Obtain the P wave parameters of the cardiac cycle in the electrocardiogram; establish at least one of the PP interval RR interval trend comparison chart, the PP interval/RR interval ratio scatter plot and the PR interval trend chart according to the P wave parameters; display the PP interval At least one of a RR interval trend comparison graph, a PP interval/RR interval ratio scatter plot, and a PR interval trend graph.
另外,可以理解地,该心电图分析装置130还包括采集器接口,采集器接口连接外部心电采集器,心电采集器进一步通过多个导联连接电极,以在将电极贴敷于人体时,进行心电数据采集。In addition, it can be understood that the ECG analysis device 130 further includes a collector interface, the collector interface is connected to an external ECG collector, and the ECG collector is further connected to electrodes through a plurality of leads, so that when the electrodes are applied to the human body, Perform ECG data collection.
另外,该心电图分析装置130还包括显示屏,显示屏用于显示心电图以及对应的分析数据。进一步,该显示屏为触摸显示屏,用于获取用户的触摸指令对心电图及其分析过程进行操作。In addition, the electrocardiogram analysis device 130 further includes a display screen, and the display screen is used to display the electrocardiogram and corresponding analysis data. Further, the display screen is a touch display screen, which is used to obtain the user's touch instructions to operate the electrocardiogram and its analysis process.
在一实施例中,心电图分析装置130为移动心电图机,移动心电图机用于动态心电图检查,作为一种在患者日常生活中连续记录24小时或更长时间的心电活动的检查,并辅助计算机进行分析处理的新技术,越来越受到欢迎。较之普通心电图,动态心电图在24小时内可连续记录多达10万次左右的心动周期,这样,可以发现常规体表心电检查不易发现的心律失常和心肌缺血等,能够提高对非持续性心律失常,尤其是对一过性心律失常及短暂的心肌缺血发作的检出率,很好地扩大了心电图临床运用的范围。In one embodiment, the electrocardiogram analysis device 130 is a mobile electrocardiograph, and the mobile electrocardiograph is used for ambulatory electrocardiography examination, as an examination that continuously records the electrocardiographic activity of the patient for 24 hours or more in daily life, and assists the computer. New technologies for analytical processing are becoming more and more popular. Compared with ordinary ECG, Holter monitor can record up to 100,000 cardiac cycles continuously in 24 hours. In this way, arrhythmia and myocardial ischemia that are not easily detected by routine surface ECG can be found, which can improve the diagnosis and treatment of non-sustained ECG. The detection rate of arrhythmia, especially transient arrhythmia and transient myocardial ischemic attack, has greatly expanded the scope of clinical application of ECG.
参阅图14,图14是本申请提供的计算机可读存储介质一实施例的结构示意图,该计算机可读存储介质140中存储有程序数据141,该程序数据141在被处理器执行时,用以实现如下的方法:Referring to FIG. 14, FIG. 14 is a schematic structural diagram of an embodiment of a computer-readable storage medium provided by the present application. Program data 141 is stored in the computer-readable storage medium 140, and when the program data 141 is executed by a processor, the Implement the following method:
获取心电图中心动周期的P波参数;根据P波参数,确定心动周期的P波类型;根据心动周期的P波类型,将心电图的心动周期归类至对应的P波模板中。或Obtain the P wave parameters of the cardiac cycle in the ECG; determine the P wave type of the cardiac cycle according to the P wave parameters; classify the cardiac cycle of the ECG into the corresponding P wave template according to the P wave type of the cardiac cycle. or
获取心电图中心动周期的P波参数;根据P波参数建立统计图,以使心动周期根据对应的P波参数以一统计元素在统计图中表示。或Obtain the P wave parameters of the cardiac cycle in the electrocardiogram; establish a statistical map according to the P wave parameters, so that the cardiac cycle is represented in the statistical map by a statistical element according to the corresponding P wave parameters. or
获取心电图中心动周期的P波参数;根据P波参数建立可视化图形/图表;其中,可视化图形/图表包括P波参数趋势图、P波参数散点图、P波与QRS波关系图和P波下传情况分布图中的至少一个;显示可视化图形/图表中的至少一个。Obtain the P wave parameters of the cardiac cycle in the electrocardiogram; establish a visual graph/chart according to the P wave parameter; wherein, the visual graph/chart includes the P wave parameter trend graph, the P wave parameter scattergram, the relationship between the P wave and the QRS complex, and the P wave Download at least one of the situation distribution graphs; display at least one of the visualization graphs/charts.
获取心电图中心动周期的P波参数;根据P波参数建立可视化图形/图表;其中,可视化图形/图表包括两个间期的趋势对比图、两个间期的比值趋势图、两个间期的比值散点图、一个间期的趋势图和一个间期的散点图中的至少一个;显示可视化图形/图表中的至少一个。Obtain the P wave parameters of the cardiac cycle in the electrocardiogram; establish a visual graph/chart according to the P wave parameter; wherein, the visual graph/chart includes a trend comparison graph of two intervals, a ratio trend graph of two intervals, and a graph of two intervals. at least one of a ratio scatter plot, an interval trend plot, and an interval scatter plot; displaying at least one of a visualization graph/chart.
在本申请所提供的几个实施方式中,应该理解到,所揭露的方法以及设备,可以通过其它的方式实现。例如,以上所描述的设备实施方式仅仅是示意性的,例如,所述模块或单元的划分,仅仅为一种逻辑功能划分,实际实现时可以有另外的划分方式,例如多个单元或组件可以结合或者可以集成到另一个系统,或一些特征可以忽略,或不执行。In the several embodiments provided in this application, it should be understood that the disclosed method and device may be implemented in other manners. For example, the device implementations described above are only illustrative. For example, the division of the modules or units is only a logical function division. In actual implementation, there may be other divisions. For example, multiple units or components may be Incorporation may either be integrated into another system, or some features may be omitted, or not implemented.
所述作为分离部件说明的单元可以是或者也可以不是物理上分开的,作为单元显示的部件可以是或者也可以不是物理单元,即可以位于一个地方,或者也可以分布到多个网络单元上。可以根据实际的需要选择其中的部分或者全部单元来实现本实施方式方案的目的。The units described as separate components may or may not be physically separated, and components displayed as units may or may not be physical units, that is, may be located in one place, or may be distributed to multiple network units. Some or all of the units may be selected according to actual needs to achieve the purpose of the solution in this implementation manner.
另外,在本申请各个实施方式中的各功能单元可以集成在一个处理单元中,也可以是各个单元单独物理存在,也可以两个或两个以上单元集成在一个单元中。上述集成的单元既可以采用硬件的形式实现,也可以采用软件功能单元的形式实现。In addition, each functional unit in each embodiment of the present application may be integrated into one processing unit, or each unit may exist physically alone, or two or more units may be integrated into one unit. The above-mentioned integrated units may be implemented in the form of hardware, or may be implemented in the form of software functional units.
以上所述仅为本申请的实施方式,并非因此限制本申请的专利范围,凡是根据本申请说明书及附图内容所作的等效结构或等效流程变换,或直接或间接运用在其他相关的技术领域,均同理包括在本申请的专利保护范围内。The above description is only an embodiment of the present application, and is not intended to limit the scope of the patent of the present application. Any equivalent structure or equivalent process transformation made according to the contents of the description and drawings of the present application, or directly or indirectly applied to other related technologies Fields are similarly included within the scope of patent protection of this application.
Claims (16)
Priority Applications (1)
| Application Number | Priority Date | Filing Date | Title |
|---|---|---|---|
| CN202110285708.6ACN115105089A (en) | 2021-03-17 | 2021-03-17 | An electrocardiogram analysis method, analysis device and storage medium |
Applications Claiming Priority (1)
| Application Number | Priority Date | Filing Date | Title |
|---|---|---|---|
| CN202110285708.6ACN115105089A (en) | 2021-03-17 | 2021-03-17 | An electrocardiogram analysis method, analysis device and storage medium |
Publications (1)
| Publication Number | Publication Date |
|---|---|
| CN115105089Atrue CN115105089A (en) | 2022-09-27 |
Family
ID=83323373
Family Applications (1)
| Application Number | Title | Priority Date | Filing Date |
|---|---|---|---|
| CN202110285708.6APendingCN115105089A (en) | 2021-03-17 | 2021-03-17 | An electrocardiogram analysis method, analysis device and storage medium |
Country Status (1)
| Country | Link |
|---|---|
| CN (1) | CN115105089A (en) |
Cited By (1)
| Publication number | Priority date | Publication date | Assignee | Title |
|---|---|---|---|---|
| CN117379062A (en)* | 2023-12-12 | 2024-01-12 | 浙江好络维医疗技术有限公司 | Single-lead dry electrode electrocardiogram P wave identification method, device, equipment and medium |
Citations (5)
| Publication number | Priority date | Publication date | Assignee | Title |
|---|---|---|---|---|
| CN1393204A (en)* | 2001-06-26 | 2003-01-29 | 陈士良 | Cardioelectric spectrometer |
| US20130190637A1 (en)* | 2012-01-25 | 2013-07-25 | Siemens Medical Solutions Usa, Inc. | System for Monitoring and Diagnosis of Cardiac Electrogram Signals Using Multi-Dimensional Analysis |
| CN104398257A (en)* | 2014-12-08 | 2015-03-11 | 蚌埠医学院 | Electrocardio waveform periodicity statistic analysis method |
| CN108209904A (en)* | 2017-12-26 | 2018-06-29 | 山东农业大学 | A kind of method for obtaining the Chinese rural area dog electrocardiographic criteria parameter area of adult |
| CN112043274A (en)* | 2018-12-11 | 2020-12-08 | 深圳市科曼医疗设备有限公司 | Catheter tip positioning system |
- 2021
- 2021-03-17CNCN202110285708.6Apatent/CN115105089A/enactivePending
Patent Citations (5)
| Publication number | Priority date | Publication date | Assignee | Title |
|---|---|---|---|---|
| CN1393204A (en)* | 2001-06-26 | 2003-01-29 | 陈士良 | Cardioelectric spectrometer |
| US20130190637A1 (en)* | 2012-01-25 | 2013-07-25 | Siemens Medical Solutions Usa, Inc. | System for Monitoring and Diagnosis of Cardiac Electrogram Signals Using Multi-Dimensional Analysis |
| CN104398257A (en)* | 2014-12-08 | 2015-03-11 | 蚌埠医学院 | Electrocardio waveform periodicity statistic analysis method |
| CN108209904A (en)* | 2017-12-26 | 2018-06-29 | 山东农业大学 | A kind of method for obtaining the Chinese rural area dog electrocardiographic criteria parameter area of adult |
| CN112043274A (en)* | 2018-12-11 | 2020-12-08 | 深圳市科曼医疗设备有限公司 | Catheter tip positioning system |
Cited By (2)
| Publication number | Priority date | Publication date | Assignee | Title |
|---|---|---|---|---|
| CN117379062A (en)* | 2023-12-12 | 2024-01-12 | 浙江好络维医疗技术有限公司 | Single-lead dry electrode electrocardiogram P wave identification method, device, equipment and medium |
| CN117379062B (en)* | 2023-12-12 | 2024-04-05 | 浙江好络维医疗技术有限公司 | Single-lead dry electrode electrocardiogram P wave identification method, device, equipment and medium |
Similar Documents
| Publication | Publication Date | Title |
|---|---|---|
| US11147500B2 (en) | Electrocardiogram processing system for delineation and classification | |
| CN111433860B (en) | User interface for analyzing an electrocardiogram | |
| JP6650514B2 (en) | Quantitative heart test | |
| US11647941B2 (en) | System and method for facilitating a cardiac rhythm disorder diagnosis with the aid of a digital computer | |
| JP5088985B2 (en) | Method for analyzing physiological data and system for analyzing physiological data | |
| US20180177419A1 (en) | Method and device for presenting st event in electrocardiogram | |
| CN105962926B (en) | The heart based on electrocardiogram claps characteristic analysis method and equipment | |
| US20230200709A1 (en) | Systems and Methods of Analyzing and Displaying Ambulatory ECG Data | |
| CN115105089A (en) | An electrocardiogram analysis method, analysis device and storage medium | |
| CN115105091A (en) | Electrocardiogram analysis method, electrocardiogram analysis device and storage medium | |
| CN112438735A (en) | Electrocardiogram P wave detection method, analysis device and storage medium | |
| CN108478214A (en) | A kind of antialiasing stacking method and device for electrocardiogram (ECG) data analysis | |
| US11672464B2 (en) | Electrocardiogram processing system for delineation and classification | |
| CN115105090A (en) | Electrocardiogram analysis method, electrocardiogram analysis device and storage medium | |
| CN109328029B (en) | Vital Signs Statistics System and Monitor | |
| KR102585080B1 (en) | Apparatus for Providing Annotation Tool for Classifying ECG Wave | |
| CN111134656A (en) | Method and device for detecting electrocardiogram data and computer readable storage medium | |
| JP2023068217A (en) | Electrocardiogram analyzer and its control method | |
| CN119097319A (en) | Method for displaying electrocardiogram signal, electrocardiograph and storage medium | |
| CN114469130A (en) | Electrocardiogram display method, electrocardiogram display device, electronic equipment and computer-readable storage medium | |
| CN116685268A (en) | Monitoring system, method for comprehensive management of atrial fibrillation and method for displaying monitored data | |
| CN117224136A (en) | Electrocardiogram blood pressure linkage output method and device and readable storage medium | |
| CN118845030A (en) | Method for displaying electrocardiogram signal, electronic device and storage medium | |
| CA3146940A1 (en) | Facilitating a cardiac rhythm disorder diagnosis with the aid of a digital computer | |
| CN119257606A (en) | Method for displaying electrocardiogram data, electrocardiograph and storage medium |
Legal Events
| Date | Code | Title | Description |
|---|---|---|---|
| PB01 | Publication | ||
| PB01 | Publication | ||
| SE01 | Entry into force of request for substantive examination | ||
| SE01 | Entry into force of request for substantive examination |